Embed Size (px)
Citation preview
1
ADDIS ABABA UNIVERSITY SCHOOL OF GRADUATE STUDIES
ECO�OMIC A�ALYSIS OF FARMERS’ PREFERE�CES
FOR CROP VARIETY TRAITS USI�G A CHOICE
EXPERIME�T APPROACH:
LESSO�S FOR O�-FARM CO�SERVATIO� A�D
TECH�OLOGY ADOPTIO� I� ETHIOPIA
BY SINAFIKEH ASRAT FACULTY OF BUSINESS AND ECONOMICS
A THESIS SUBMITTED TO THE SCHOOL OF GRADUATE STUDIES OF ADDIS ABABA UNIVERSITY IN PARTIAL FULFILLMENT OF
THE REQUIREMENTS FOR THE DEGREE OF MASTER OF SCIENCE IN ECONOMICS UNDER NATURAL RESOURCE AND
ENVIRONMENTAL ECONOMICS STREAM
JANUARY, 2008 ADDIS ABABA

2
ACK�OWLEDGEME�TS
First and foremost I would like to honor the Almighty God for giving me the strength to
persevere through the long and often challenging process of writing a thesis.
My heart-felt appreciation goes to my principal supervisor, Dr. Mahmud Yesuf. His
invaluable comments on the survey instrument and the thesis manuscript have been
helpful to improve the quality of the thesis. I would also like to gratefully thank my
second supervisor, Dr. Edilegnaw Wale of Bioversity International, for sharing his
experience and knowledge with me during the thesis write-up. Identifying the topic and
developing it would not have been possible had it not been for his tireless inputs.
Above all, the research reported here was supported by the men and women farmers who
generously shared their knowledge and perceptions in personal interviews. I would also
like to thank the enumerators for their professional integrity, and my cousin Fitsum for
accompanying me to Wollo. I wish to thank my good friends Chalachew Temesgen,
Solomon G/Selassie, and Solomon Terfasa from Economics department.
My special thanks go to Dr. Ekin Birol of IFPRI for her invaluable guidance during the
data analysis. Despite her very busy schedule, she was also willing to spare her time and
energy to read through my empirical chapter and offer her invaluable comments. I also
wish to gratefully thank Dr. David Spielman of IFPRI, who provided valuable comments
on the proposal and who have also sent me some important reads. I thank Dr. Melinda
Smale of IFPRI/IPGRI for sending me the book she edited and from which I enormously
benefited.
I gratefully acknowledge the financial support from the African Economic Research
Consortium (AERC), and the Center for Development Research (ZEF-B), University of
Bonn, Germany. Moreover, GRPI project has cooperated in supplying the necessary data.
My parents Asrat Gemessa and Fantaye Ararso deserve special thanks. My two sisters
(Abeba and Hiwot), and my aunts were always there to support me. Thank you so much!
3
ACRO�YMS
CBD Convention on Biological Diversity (1992)
CE Choice Experiment
CGIAR Consultative Group on International Agricultural Research
CSA Central Statistical Agency, Ethiopia
EIAR Ethiopian Institute of Agricultural Research
EPA Environmental Protection Authority, Ethiopia
FDRE The Federal Democratic Republic of Ethiopia
GRPI Genetic Resources Policy Initiative
IBC Institute of Biodiversity Conservation
IFPRI International Food Policy Research Institute
IPGRI International Plant Genetic Resource Institute
MoARD Ministry of Agriculture and Rural Development, Ethiopia
NBSAP National Biodiversity Strategy and Action Plan (2005)
NGOs Non-governmental organizations
PAs Peasant Associations
UNDP United Nations Development Program
WTA Willingness to Accept
WTP Willingness to Pay
4
TABLE OF CO�TE�TS
Page
CHAPTER O�E: I�TRODUCTIO�……………………………………………....1 1.1 General background………………………………………………………….……1 1.2 National and global stakeholders in sustainable utilization of crop genetic
resources…………………………………………………………………………..4 1.3 Sorghum and teff in Ethiopian agriculture and their diversity……………...…….7 1.4 Overview of research objectives and methodology ………………………………9
1.4.1. Research objectives ………………………………………………….……9 1.4.2. Research methodology …………..………………………………………12
1.5 Scope and limitations of the study ………………………………………………16 1.6 Organization of the thesis ……………………………………………………….18 CHAPTER TWO: LITERATURE REVIEW ……….……………….......………20
2.1 Introduction……………………………………………………..……………..…20 2.2 Valuing crop variety attributes through revealed preferences…………………...21 2.3 Valuing crop variety attributes through stated preferences …………………..…22 2.4 Valuing agro-diversity through both revealed and stated preferences ……….....30 2.5 Stated preferences as a priori information for Ethiopian rural development
goals……………………………………………………………………………...35 2.6 Concluding remarks ……………………………………………………………..38 CHAPTER THREE: DATA COLLECTIO� METHODOLOGY A�D DATA
DESCRIPTIO�.……………………………………………...………………….….39
3.1 The data generation process: survey design and implementation………………..39 3.2 Study site description...……….…………...……………………...………...……44 3.3 Farm household characteristics in North Wollo….…………………………...…47 CHAPTER FOUR: CO�CEPTUAL FRAMEWORK A�D DESIG� OF THE
CHOICE EXPERIME�T……………………………………………………….…57
4.1 Farmers’ concerns and variety attribute preferences ……………………………57 4.2 Theoretical underpinnings and the basic model …………………………………61 4.3 Choice experiment design and administration ……………………………...…...67
4.3.1 Setting the scene: attributes and levels for the choice experiment .……….67 4.3.2 Choice experiment design …………………………………………………72 4.3.3 Administration of the choice experiment ………………………………….76
4.4 Recapping the core elements of the choice experiment approach ………...……..77
CHAPTER FIVE: MODEL SPECIFICATIO� A�D DISCUSSIO� OF
ECO�OMETRIC RESULTS…...............................................................................78
5.1 Data organization …………………………………..……………………………78 5.2 Conditional logit model estimates for sorghum and teff attribute
preferences……………………………………………………………………….79 5.3 Willingness to Accept (WTA) values for each variety attribute by crop ……….83 5.4 Accounting for preference heterogeneity ……………………………………….90
5
5.5 Random parameter logit model …………………………………………………91 5.6 Conditional logit model accounting for preference heterogeneity …………...…98 5.7 WTA values for selected farm household profiles for each crop …………..….112 5.8 Brief summary and concluding remarks …………………………………….....116 CHAPTER SIX: CO�CLUSIO�S A�D POLICY IMPLICATIO�S..…....….118
6.1. Conclusions ………………………………………………...………………….118 6.2. Implications for Policy ……………………….…………..………………...….120 6.3. Important issues for future research ………………………………………...…123 APPE�DICES………...………….………………...…………….…….………….125
REFERE�CES……………………...……………………………………………..133
6
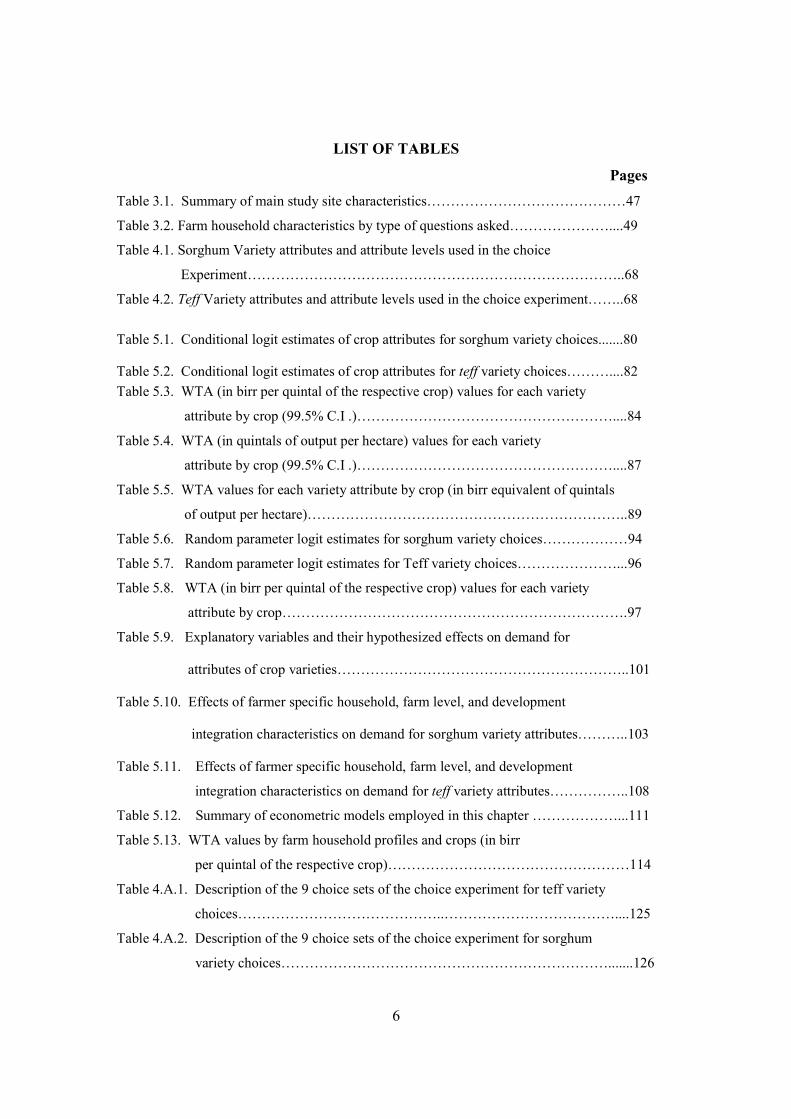
LIST OF TABLES
Pages
Table 3.1. Summary of main study site characteristics……………………………………47
Table 3.2. Farm household characteristics by type of questions asked…………………....49
Table 4.1. Sorghum Variety attributes and attribute levels used in the choice
Experiment……………………………………………………………………..68
Table 4.2. Teff Variety attributes and attribute levels used in the choice experiment……..68
Table 5.1. Conditional logit estimates of crop attributes for sorghum variety choices.......80
Table 5.2. Conditional logit estimates of crop attributes for teff variety choices………....82 Table 5.3. WTA (in birr per quintal of the respective crop) values for each variety
attribute by crop (99.5% C.I .)………………………………………………....84
Table 5.4. WTA (in quintals of output per hectare) values for each variety
attribute by crop (99.5% C.I .)………………………………………………....87
Table 5.5. WTA values for each variety attribute by crop (in birr equivalent of quintals
of output per hectare)…………………………………………………………..89
Table 5.6. Random parameter logit estimates for sorghum variety choices………………94
Table 5.7. Random parameter logit estimates for Teff variety choices…………………...96
Table 5.8. WTA (in birr per quintal of the respective crop) values for each variety
attribute by crop……………………………………………………………….97
Table 5.9. Explanatory variables and their hypothesized effects on demand for
attributes of crop varieties……………………………………………………..101
Table 5.10. Effects of farmer specific household, farm level, and development
integration characteristics on demand for sorghum variety attributes………..103
Table 5.11. Effects of farmer specific household, farm level, and development
integration characteristics on demand for teff variety attributes……………..108
Table 5.12. Summary of econometric models employed in this chapter ………………...111
Table 5.13. WTA values by farm household profiles and crops (in birr
per quintal of the respective crop)……………………………………………114
Table 4.A.1. Description of the 9 choice sets of the choice experiment for teff variety
choices……………………………………..………………………………....125
Table 4.A.2. Description of the 9 choice sets of the choice experiment for sorghum
variety choices…………………………………………………………….......126
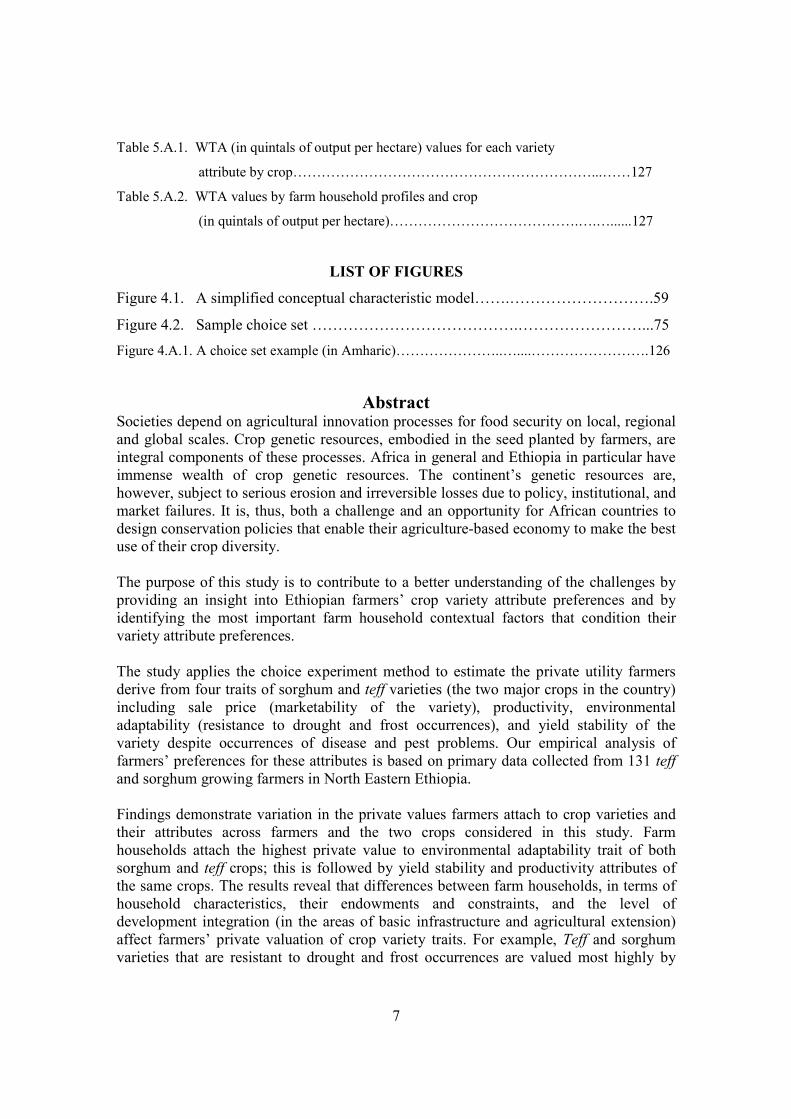
7
Table 5.A.1. WTA (in quintals of output per hectare) values for each variety
attribute by crop………………………………………………………...……127
Table 5.A.2. WTA values by farm household profiles and crop
(in quintals of output per hectare)………………………………….….…......127
LIST OF FIGURES
Figure 4.1. A simplified conceptual characteristic model…….……………………….59
Figure 4.2. Sample choice set ………………………………….……………………...75
Figure 4.A.1. A choice set example (in Amharic)…………………..…....…………………….126
Abstract Societies depend on agricultural innovation processes for food security on local, regional and global scales. Crop genetic resources, embodied in the seed planted by farmers, are integral components of these processes. Africa in general and Ethiopia in particular have immense wealth of crop genetic resources. The continent’s genetic resources are, however, subject to serious erosion and irreversible losses due to policy, institutional, and market failures. It is, thus, both a challenge and an opportunity for African countries to design conservation policies that enable their agriculture-based economy to make the best use of their crop diversity. The purpose of this study is to contribute to a better understanding of the challenges by providing an insight into Ethiopian farmers’ crop variety attribute preferences and by identifying the most important farm household contextual factors that condition their variety attribute preferences. The study applies the choice experiment method to estimate the private utility farmers derive from four traits of sorghum and teff varieties (the two major crops in the country) including sale price (marketability of the variety), productivity, environmental adaptability (resistance to drought and frost occurrences), and yield stability of the variety despite occurrences of disease and pest problems. Our empirical analysis of farmers’ preferences for these attributes is based on primary data collected from 131 teff
and sorghum growing farmers in North Eastern Ethiopia. Findings demonstrate variation in the private values farmers attach to crop varieties and their attributes across farmers and the two crops considered in this study. Farm households attach the highest private value to environmental adaptability trait of both sorghum and teff crops; this is followed by yield stability and productivity attributes of the same crops. The results reveal that differences between farm households, in terms of household characteristics, their endowments and constraints, and the level of development integration (in the areas of basic infrastructure and agricultural extension) affect farmers’ private valuation of crop variety traits. For example, Teff and sorghum varieties that are resistant to drought and frost occurrences are valued most highly by
8
larger and poorer farm households residing far away from basic infrastructures and less so by medium sized, and moderately experienced farm households. Empirical results such as the above have implications not only for on-farm conservation but also for improved variety adoption and breeding priority setting in Ethiopia and other Sub-Saharan countries with similar setup. To target and address variety demand for income shock vulnerable and segmented farmers, the priority variety attributes are environmental adaptability, yield stability, and to a lesser extent the productivity traits of teff and sorghum varieties. Breeding should also target to satisfy demands of different farm household types classified by their resource endowments, preferences and constraints. The research priority setting should, therefore, also ask ‘breeding for whom?’ not just only ‘breeding for which environment?’, as it is mostly the case.
9
CHAPTER O�E
I�TRODUCTIO�
1.1. General Background
Societies depend on agricultural innovation processes for food security on local, regional
and global scales. Crop genetic resources, embodied in the seed planted by farmers, are
important components of these processes. Farmers, plant breeders, gene bank managers
and other crop scientists draw on diverse crop genetic resources to innovate, support, and
benefit society at large (Smale, 2006).
Sustainable management of crop genetic resources means assuring their diversity, both in
trust collections and on farms. In agricultural systems, crop biodiversity is essential to
combat the risks farmers face from plant pests, diseases and climatic shocks. Crop
biodiversity also underpins the range of dietary needs and services that consumers
demand as economies change (Edilegnaw, 2004; Smale, 2006).
Crop genetic resources are natural assets that are renewable but vulnerable to losses from
either natural or human-made interventions, including the disruptions caused by droughts,
floods or wars, as well as the gradual process of social and economic change.
Technological changes in agricultural production over the past century, spurred by crop
genetic improvement combined with the use of other farm inputs, have transformed rural
societies in many parts of the world (Smale, 2006). Not all of these changes have been
positive. For example, there is a growing concern about potential loss of crop biodiversity

10
associated with social and economic change. The common challenge now is to develop
strategies that enable crop genetic resources to be managed in ways that satisfy the needs
of farmers and consumers at present and in the future.
Some countries with a high amount of unique crop diversity belong to the group of
poorest countries in the world (Von Braun and Virchow, 1996). Ethiopia is among those
countries that are economically poor but still rich in biological diversity. It is a center of
origin and as well as a center of diversity for many crops including sorghum, teff
(Eragrostis abyssinica), coffee (arabica), and ensete (ensete Ventricosum). As a result, the
country is mostly described as a land of crop diversity (Harlan, 1969).
The benefits that Ethiopia may derive from its crop diversity endowments depend on how
this ‘rich but poor’ nation is able to address the challenges of poverty without further
degrading its natural resources. It is, thus, both a challenge and an opportunity for
Ethiopia to design conservation policies that enable its agriculture-based economy to
make the best use of its crop diversity (Edilegnaw, 2004).
The purpose of this study is to contribute to a better understanding of the challenges by
obtaining an insight into Ethiopian farmers’ crop variety attribute preferences and
identify the most important farm household contextual factors that condition their variety
attribute preferences. Be it for undertaking on-farm conservation ventures1 or for
1 On-farm conservation refers to the sustainable management of genetic diversity of locally developed indigenous crop varieties, with associated wild and weedy species or forms, by farmers within traditional agricultural systems (Maxted et al., 1997). The dynamic nature of the conservation, its participatory nature,
11
successful rural interventions like contextual crop variety development and diffusion,
policy has to be informed on among other things ‘who prefers what kind of variety
attributes most?’ and ‘how much are farmers willing to trade-off one variety attribute for
another?’ In this study, we try to give answer to these and related questions by analyzing
farmers’ adoption behaviors towards the two major crops in the country – sorghum and
teff. Informing policy on these factors contextually will enable decision-markers to
understand mechanisms of influencing farmers’ variety management behavior and
harmonize on-farm conservation with modern technology adoption.
Why and how are farmers’ preferences for crop variety traits relevant for on-farm
conservation and modern technology adoption? According to the characteristic model
developed by Lancaster (1966), consumers derive utility not from goods themselves but
from the attributes they provide. Accordingly, this implies that farmers are maximizing
their household utility by consuming their preferred variety attributes not by directly
consuming the varieties embedding those preferred attributes. Hence, what farmers are
looking for at the end of the day is variety attribute, and the demand for varieties can be
considered as a derived demand revealed from farmers’ preferences for variety attributes.
For on-farm conservation, therefore, understanding farmers’ variety attribute preferences
will be useful to predict the likelihood of survival of varieties embedding those attributes.
This enables policy makers to identify varieties for which policy incentives are required
and the chance it gives to link crop diversity conservation with its utilization are all the desirable features of on-farm conservation ventures (Emerton, 2000).
12
and those that can be maintained de facto2. In agricultural research priority setting too,
understanding farmers’ variety attribute preferences will serve as an input for developing
varietal technologies with more chance to be adopted and be successful (Edilegnaw,
2004).
The subsequent part of this introductory chapter is structured as follows. In the next
section, national and global stakeholders involved in sustainable utilization of crop
genetic resources are briefly discussed. Section 1.3 briefly presents the contributions of
sorghum and teff crops in Ethiopian agriculture. Section 1.4 outlines the objectives of the
thesis and the research methodology implemented to address the objectives.
Subsequently, the scope of the thesis and its organization are presented in Section 1.5 and
Section 1.6 respectively.
1.2. �ational and global stakeholders in sustainable utilization of crop genetic
resources
According to a study by Worede et al., (2000), Ethiopia’s genetic resources are subject to
serious erosion and irreversible losses. Natural resources i.e. land, water, forests and
other forms of biodiversity have now deteriorated in the country (FDRE, 1997; 1998).
Despite the resource degradation that has been occurring over the course of time, the
country has still a diverse wealth of plant genetic resources (FDRE, 1996). It has also
well established crop improvement program to make use of its crop diversity (Edilegnaw,
2004).
2 De facto conservation is the decision of farmers to continue cultivating local varieties (Meng, 1997). It is the inadvertent result of farmers’ derived demand for crop diversity while trying to achieve their livelihood objectives (Edilegnaw, 2004).
13
Various government organizations are, therefore, involved in the conservation and
sustainable utilization of crop genetic resources in Ethiopia including IBC (Institute of
Biodiversity Conservation), EPA (Environmental Protection Authority), EIAR (Ethiopian
Institute of Agricultural Research), and MoARD (Ministry of Agriculture and Rural
Development). In addition, many NGOs (for instance, Ethio-Organic Seed Action –
EOSA3) and grass-root organizations dealing with the local community are working in
the areas of resource conservation and rural development.
On the global scale, 155 parties at the Earth Summit held in Rio de Janeiro signed the
United Nations’ Convention on Biological Diversity (CBD) in 1992. This signaled the
intention of the world community at large to forming a global alliance to protect habitats,
species, and genes, shift to sustainable modes of resource use, and make the necessary
policy, economic and managerial adjustments to guarantee that the benefits to be gained
from the use of components of biological diversity is equitably shared across local,
regional, and global societies. Ethiopia signed the CBD in 1993 and ratified it in May
1994, which then appeared in Proc. 98/1994 (FDRE, 1995). The number of parties that
have ratified the convention had reached 187 in the year 2005 (FDRE, 2005)4.
3 This NGO can be considered as a pioneer in linking crop diversity conservation on-farm with improving rural livelihoods (Edilegnaw, 2004). 4 Among international research institutions contributing to the sustainable utilization of crop genetic resources include the member organizations of the Consultative Group on International Agricultural Research (CGIAR) including the International Food Policy Research Institute (IFPRI) and the International Plant Genetic Resources Institute (IPGRI) that are committed to identifying and informing policies (both national and international), on strategies that will lead to the sound management of the natural resource base that supports agriculture (Smale, 2006).
14
Article 6 of CBD demands the preparation of National Biodiversity Strategy and Action
Plan (NBSAP) by each signatory country. As a party to the Convention and in fulfillment
of its obligation, Ethiopia has prepared its NBSAP in 2005.
The NBSAP report of Ethiopia recognizes that agricultural intensification is potentially
the major cause of loss of agricultural biodiversity worldwide in general and Ethiopia in
particular (FDRE, 2005). The report argues that through the replacement of traditional
crop varieties with high-yielding varieties that are dependent on high levels of
agricultural inputs, it results in genetic erosion of resilient native varieties.
In view of this, the conservation of the rich agro-biodiversity of Ethiopia through a mix
of in situ and ex situ programs5 is carved as one of the four strategic priorities of
Ethiopia’s Biodiversity Strategy and Action Plan.
Despite these commitments and progresses towards the sustainable utilization of crop
genetic resources in the world, the dwindling stock of crop biodiversity worldwide in
general and Ethiopia in particular shows that a lot still needs to be done and more
commitments need to turn into actions in a timely manner. It is, thus, both a challenge
and an opportunity for Ethiopia and the world at large to design conservation policies that
enable agricultural innovations to make the best use of their crop diversity.
5 In situ conservation involves conserving crop diversity using traditional agriculture and nature as a media (Haywood, 1995). On-farm conservation is the domain of in situ conservation of crop diversity (UNEP, 1992). Ex situ is a conservation strategy that involves keeping components of crop diversity alive outside their natural habitats or natural environment, for instance, by using zoos, botanical gardens, and gene banks (Heywood, 1995).
15
1.3. Sorghum and teff in Ethiopian agriculture and their diversity
Farmers’ variety attribute preferences towards sorghum and teff crops were selected for
detailed analysis in this thesis, due to the crops’ importance to food security, to the
conservation of crop genetic diversity, and to contextual variety development (through
technology) and diffusion in Ethiopia. Apart from understanding farmers' preferences for
these crops’ variety traits6, one also has to understand the potentials (attributes) of these
crops (for example, their adaptability to different agro-ecologies), and the current
diversity status of the crops in order to harmonize on-farm conservation with modern
technology adoption. In this sub-section, these latter points are briefly discussed in
context to Ethiopia.
Sorghum was named because of its height from the Latin word ‘surgo’ which means
‘arise’ (Karper and Quinby, 1947). The crop, first domesticated in Africa, is the major
cereal that has a wide range of utilization not only in Ethiopia but also in many other
African nations (Gebrekidan, 1979; Gebrekidan and Kebede, 1979).
In Ethiopia, sorghum is the major crop next to teff grown all over the country across high,
intermediate and low altitude areas. The crop occupies 0.7 to 1.1 million hectares with 1
to 1.6 million tons of production annually. It contributes about 15-20% of total cereals
production in the country (Edilegnaw, 2004). According to figures from the Central
Statistical Agency (CSA), the crop covers 20.07% of all cultivable land in North Wello
zone where our research sites are found. Sorghum is used for many purposes including,
food, cash, animal feed, fuel, house construction and fence. 6 This makes up the main theme of the study and hence also the latter chapters of this thesis.
16
Sorghum consists of over 20 different species of which some come from the East
African and some from the West, Central and Southern African region. The primary
center of origin and diversity of sorghum is assumed to be the Sudan and Ethiopia
(Doggett, 1991) and breeders have found useful attributes from the Ethiopian germplasm
stock (Kebede, 1991). Four of the five major races of sorghum in Africa are found in
Ethiopia (Edilegnaw, 2004). Ethiopia holds ex situ 4% of the world’s sorghum genetic
stock (FAO, 1998 and Hawkes et al., 2000). The crop exists in tremendous variability
throughout the areas of sorghum production in Ethiopia (Gebrekidan, 1979; de Wet and
Harlan, 1971).
The threat of genetic erosion in sorghum in Africa as a result of expansion of new
uniform cultivars and hybrids has not been as great as in other major cereals such as
maize. Cyclical drought and crop failures have probably been the major causes of
sorghum diversity loss in Africa (Gebrekidan, 1979).
The second crop under investigation in this study is teff (Eragrostis abyssinica).
According to figures from MoARD, in Ethiopia, cereals, pulses, oil crops, vegetables,
and root crops are grown annually on about 10 million hectares of land; of these, 7.6
million (76%) is allocated for cereals, and teff is the single dominant cereal crop in
Ethiopia occupying 2,212,501 hectares (22.15% of all cultivable land) and the production
is about 22,887,828 quintals annually. According to figures from the national agricultural
sample enumeration conducted in 2001/2002, teff covers 24.29% of all cultivable land in
17
North Wello zone making the crop the most dominant cereal crop where we conducted
our research.
Ethiopia is not only the origin of teff, but it is also the center of diversity where the crop
is the most adaptable cereal in the diverse agro-ecologies of the country. As a source of
staple food for many parts of the country, teff is primarily grown to prepare injera
(Ethiopian bread), porridge and some native alcoholic drinks. The straw is mainly used
for animal feed.
1.4. Overview of research objectives and methodology
1.4.1. Research objectives
On-farm conservation does not mean using traditional crop varieties7 on all farmers’
fields throughout the country. Given the vulnerability of millions of people to food
insecurity, Ethiopia can not afford to cover all fields with traditional varieties for the sake
of conserving these resources8. In situ conservation is not a sector-wide strategy for a
nation’s agriculture but one targeted to a few locations (Brush, 2000). It, therefore,
requires targeting farmers who can maintain selected varieties for on-farm conservation
(Edilegnaw, 2004). The issue at stake is, therefore, to find a way of balancing on-farm
conservation with agricultural productivity objectives of the government.
7 Traditional varieties, or land races or local varieties, are variants, varieties, or populations of crops, with plants that are often highly variable in appearance, whose genetic structure is shaped by farmers’ seed selection practices and management, as well as natural selection processes, over generations of cultivation (Smale et al., 2001). 8 This is because while traditional varieties are generally adaptable to different agro-ecological environments and marginal lands, they are less productive compared with modern varieties in the absence of environmental stress (Seyfu, 1997).
18
Despite a lot of disclosure in favor of on-farm genetic resource conservation, there is no
adequate contextual research done as to how it can be harmonized with agricultural
productivity objectives and made feasible complement to ex situ (Edilegnaw, 2004). To
the best of our knowledge, no previous study attempted to link stated preference
methods9 with farmers’ preferences for crop variety traits in Ethiopia except the work by
Edilegnaw (2004) in which case farmers were asked to choose their most preferred
variety from a bundle of coffee varieties each described to respondents by only a single
attribute (for example, a variety that is high yielding vs. a variety that has more stable
yield)10. Such research gaps in Ethiopia have, among others, motivated this thesis. The
overall objective of the thesis is, therefore, to estimate the private economic values
farmers attach to crop variety traits and identify the most important farm household
contextual factors that condition their variety attribute preferences.
Specifically, the thesis addresses the following objectives:
• Examine the farm household related contextual factors affecting farmers’ variety
attribute preferences;
• Estimate the crop specific economic value that farmers attach to each variety
attribute;
9 This method is explained with examples in the next sub-section. 10 Apart from the fact that coffee is a perennial cash crop as opposed to the seasonal food crops – teff and sorghum – under investigation in this study, the current study uses four attributes (with specific values) to describe a sorghum (or teff ) variety to respondents. Thus, due to this latter approach, the current study provides a more complete picture regarding the relative importance of the different variety attributes and a fuller extent of opportunity costs forgone (the trade-offs or marginal rate of substitution between attributes) during a change in variety use, when compared with the previous work by Edilegnaw (2004). Further comparisons and hence, the current study’s contributions in relation to the work by Edilegnaw (2004) are further discussed in Section 2.3 of chapter two.

19
• Investigate whether the above economic values that represent preferences vary
between sorghum and teff crops.
While the first objective is meant to address the research question: ‘who prefers what
kind of variety attributes most?’ the second objective is about: ‘how much are farmers
willing to trade-off one variety attribute for another?’
The third specific objective addresses the research question: ‘which attribute of which
crop should receive priority in breeding priority setting programs?’ Answering this
question is important to prescribe cost-effective and crop specific breeding priority
setting strategies that are most likely to be welcomed by farmers. To elaborate on this, as
mentioned above, sorghum and teff crops fulfill different purposes in the household – a
result of their different phenotypic characteristics11 – and farmers’ preferences towards
components (attributes) of the two crops are likely to be different. This difference may be
manifested by farmers’ varying preferences towards the same attribute in different crops.
Thus, in such a setup, a unit increase in an attribute like productivity of a certain crop (for
example, sorghum) may not generate the same private economic value to a farmer as a
unit increase in the productivity of another crop (for example, teff), creating a taste
difference. For example, in our empirical analysis, we found that farmers are slightly
more risk averse towards a non-adaptable variety of teff than towards a sorghum variety
with a similar trait. Thus, if there is a limited budget to improve the environmental
adaptability (resistance to drought and pest occurrences) trait of only one of the two crops
11 Phenotype is defined as the morphological, physiological, biochemical, behavioral, and other properties of an organism that develop through the interaction of genes and the environment (World Resources Institute, 1992).

20
in this study, farmers in Wollo would be better off if this budget is geared towards the
improvement of the attribute in teff varieties than towards the same attempt in sorghum
varieties. This study, therefore, compares farmers’ willingness to accept (WTA)12 values
for each attribute across the two crops and the result is expected to inform plant breeders
and researchers engaged in developing improved varieties, in a more actionable way, to
prioritize the improvement of a certain crop’s attribute (for example, the adaptability trait
in teff) over the same attempt in another crop (for example, the adaptability trait in
sorghum). This is, however, relevant if for practical reasons, breeding can not address
this improvement in both crops simultaneously.
1.4.2. Research methodology
To address the objectives of the thesis mentioned above, a choice experiment survey was
conducted on 131 farmers who were randomly selected from two Peasant associations
(PAs) in North Wollo zone13. A choice experiment is a highly ‘structured method of data
generation’ (Hanley et al., 1998), relying on carefully designed tasks or “experiments” to
reveal the factors that influence choice. In a choice experiment, individuals are given a
hypothetical setting and asked to choose their preferred alternative among several
alternatives in a choice set, and they are usually asked to perform a sequence of such
choices. Each alternative is described by a number of attributes or characteristics. A
monetary value is included as one of the attributes, along with other attributes of
importance, when describing the profile of the alternative presented. This enables one,
12 WTA values measure farmers’ private economic values that they attach to each variety attribute. 13 The farm household and choice survey data were collected in two phases where the first phase (collection of data on farm household characteristics) was conducted 6 months prior to the choice experiment survey, which was the second phase.
21
among other things, to do non-market valuation: value attributes for which it is
practically hard to attach monetary figures. Experimental design theory is used to
construct profiles of the two crops under study in this thesis in terms of their attributes
and levels each attribute takes. Profiles of the crop varieties are then assembled in choice
sets, which are in turn presented to the respondents, who are asked to state their
preferences (Louviere et al., 2000). Lancaster’s attribute theory of consumer choice is the
theoretical basis in this study (Lancaster, 1966), and the random utility model is the
empirical/econometric basis of the study (Luce, 1959; McFadden, 1974).
After conducting a preliminary research to identify the attributes to be valued14, we
selected four attributes including marketability, productivity, environmental adaptability,
and yield stability traits of both crops intended to describe and differentiate one crop
variety from another based on the levels each of these attributes take. The profile of a
crop variety, therefore, utilizes all four attributes in unison to describe a certain crop
variety on offer in a choice set. Apart from their importance to farmers, these attributes
are also policy relevant for designing an incentive mechanism to undertake on-farm
conservation ventures at least cost or for successful rural interventions like contextual
crop variety development and diffusion. The levels for producers’ price (marketability)
are set based on what has been observed in the past (maximum, minimum, and the most
frequent levels observed) in North Wollo zone. The productivity levels are set based on
farmers’ working conditions under extension and non-extension services. The binary
14 The preliminary research involved identifying the most important crop variety attributes and their levels by consulting with experts in this area (crop breeders and researchers who have previous experience and knowledge on the subject), by reviewing previous studies and historical data from CSA and EIAR, and by identifying the most important seed selection criteria put forward by the surveyed households during the first phase of the data collection process.
22
levels for environmental adaptability and yield stability traits represent the existence or
absence of the traits in sorghum or teff varieties.
The sample population in each Kebele was randomly divided into two, each sub-sample
receiving one of the two versions of the choice experiment: sorghum or teff variety
choice sets. Farmers were then presented with 9 choice sets each containing three profiles
of either teff or sorghum varieties to choose from, thus, a total of 9 choices were elicited
from each respondent.
We selected the choice experiment method, among other stated preference environmental
valuation methods like contingent valuation method (CVM)15, to address our research
objectives due to a number of reasons, the most important being:
• The choice experiment method allows for estimation not only of the value of the
environmental good as a whole, but also of the implicit values of its attributes;
• The strategic bias, that is stating an extremely high/low value to get a point
across, is minimised in choice experiment method since the prices of the goods
are already defined in the choice sets;
• Willingness to accept (WTA) questions can be asked in choice experiments
without the risk of facing huge discrepancies between WTA and willingness to
accept (WTP) values as they are reasonable and predetermined (Kahneman,
Knetsch and Thaler, 1990). It has been found that in CVM studies individuals
15 CVM is the most commonly employed environmental valuation method where it involves asking respondents about their willingness to pay (WTP) or willingness to accept (WTA) to a proposed change in the level of provision of an environmental good (Perman et al., 2003).
23
seem to attach much more value to losses than they do to gains hence WTA
values exceed WTP values considerably (Georgiou et al., 1997).
However, choice experiment, like CVM, is a stated preference method and is seen by
many economists as suffering from the problem that it asks hypothetical questions,
whereas indirect methods like travel cost and hedonic pricing methods exploit data on
observed, actual, behavior. On the other hand, choice experiment has two advantages
over indirect methods16. First, it can deal with both direct and indirect use values,
whereas the indirect methods cover mainly the former, and involve weak
complementarity assumptions (Perman et al., 2003). Indirect use values of crop genetic
resources include resistance to biotic and abiotic stress (represented partly by the two
attributes in our choice experiment study namely, environmental adaptability and yield
stability traits, see Table 4.1. and Table 4.2. in chapter 4 for the definition of these
attributes), which can only be valued by stated preference methods. The impure
private/public good17 nature of the crops vis-à-vis their attributes and functions are also
contributing factors for market failure in poorly developed rural markets like in Ethiopia,
where it is even more necessary to employ hypothetical markets like in stated preference
methods to value the public good nature of the crops18. Secondly, in principle, and unlike
the indirect methods, choice experiment answers to WTP or WTA questions go directly
to the theoretically correct monetary measures of utility changes (Perman et al., 2003).
16 These advantages also hold for other stated preference methods. 17 The in-between points along the pure private and pure public goods continuum are occupied by the so-called impure public goods. Their benefits are partly rival and/or partly excludable (Varian, 1992). 18 The public good nature of crop genetic resources includes reduced probability of disease outbreak, increases in productivity that benefits consumers, and ecological resilience, which are all non-excludable (Edilegnaw, 2004). Crops are also produced as private consumption goods the benefit of which is excludable.

24
Thus, due to these reasons, one has to apply stated preference methods like choice
experiment to get a more complete picture of the relative importance of the different crop
variety attributes and measure the trade-offs farmers are prepared to face as far as variety
attributes are concerned.
Furthermore, most studies dealing with the impact of rural development programs and
agricultural technology adoption by farmers in developing countries are based on ex-post
analysis of intervention programs (Wegayehu, 2006) relying on revealed preference data
on observed, actual, behavior. Farmers are rarely consulted on their preference for type of
intervention before the intervention is implemented. This study however, could also serve
as key a priori information for variety improvement endeavors – a type of development
intervention – by systematically eliciting farmers’ crop variety attribute preferences and
setting the focus on attributes most relevant to farmers. More specifically, the seeds of the
crop varieties presented to farmers in our choice experiment study are currently not
necessarily in the production lines for subsequent improved variety diffusion, but are
hypothetical in nature meant to inform rural development polices on a priori basis
towards the adoption behaviour of farmers if extension packages, in the form of improved
seeds, provide these varieties or their close substitutes.
1.5. Scope and limitations of the study
In this thesis, no genetic information, as recognized by geneticists, is used to differentiate
one crop variety from another during the survey or in the thesis manuscript. The survey
data used, therefore, do not involve real measurements but mainly reflect farmers’ variety
25
choice criteria based on their preferences, constraints and endowments. To address the
primary research questions, using farmers’ variety choice criteria is found to serve the
purpose envisaged.
The fact that our analysis is based on farmers’ preferences for only four traits
(marketability, productivity, environmental adaptability, and yield stability) of sorghum
and teff crops should not be translated into saying that these are the only attributes in
farmers’ variety choice criteria. In almost all choice experiment studies, the researcher
has to make a trade-off between being comprehensive (inclusion of all relevant attributes)
and the complexity of the choice experiment (Alpizar et al., 2001). That is, as one tries to
include too many attributes in a choice experiment, the associated cognitive demand from
respondents in making choices would be too much and respondents may simply answer
carelessly or employ some strategic behaviour, which is not a true reflection of their
attribute preferences. Thus, the four attributes under study in this thesis reflect the
balance between including the most important attributes in our choice experiment with
the complexity of the task involved in making choices19. Therefore, our stated preference
analysis of farmers’ preferences for crop variety traits covers only the four attributes
mentioned above.
Moreover, the small size of our sample has prevented us from testing for regional
differences in preferences i.e. between the surveyed farm households in the two PAs.
19 The number of attributes in a choice experiment is studied by Mazotta and Opaluch (1995) and they find that including more than 4 to 5 attributes in a choice set may lead to a severe detriment to the quality of the data collected (e.g. respondents may simply answer carelessly or employ some strategic behaviour) due to the complexity of the task.
26
This is because our sample population of size 131 farmers drawn from two PAs is already
divided into two sub-samples for our analysis each receiving one of the two versions of
the choice experiment: sorghum or teff variety choice sets20, and testing for regional
differences in preferences would, therefore, have required us to further divide our sub-
samples into two making the average size of each about 32 households, which would
have been a small sample size to draw any important conclusions from. However, it
should be noted that the analysis done in this thesis and all the conclusions and policy
implications drawn afterwards do not suffer from this small sample size problem.
1.6. Organization of the thesis
The following chapter presents the literature review where a range of revealed and stated
preference studies are discussed in relation to agro-diversity. Studies that merge revealed
and stated preference methods along with studies that inform Ethiopia’s rural
development policy on a priori basis are also discussed.
Chapter 3 describes the farm household survey data employed in the empirical chapter of
the thesis. The sampling design implemented along with the description of the research
sites is also included in this chapter.
20 Therefore, the current analysis is based on the pooled data from the two PAs receiving either version of the choice experiment questions. The analysis is then done separately for each version of the choice experiment.
27
Chapter 4 deals with the conceptual framework where the relationship between farm
household characteristics and farmers’ crop variety choice decisions is outlined. This
chapter also presents the design and administration of the choice experiment survey.
Chapter 5 empirically looks at contextual farm household characteristics and their role in
determining farmers’ variety attribute preferences. The estimated crop specific economic
value that farmers attach to each variety attribute are reported and discussed in this
chapter.
Drawing on the previous empirical chapter, chapter 6 presents the conclusions and policy
implications along with some future research directions.
28
CHAPTER TWO
LITERATURE REVIEW
2.1. Introduction
In this chapter, we present an array of revealed and stated preference studies mostly
committed to valuing attributes of crop varieties, and hence share similar features to this
study. The value of crop variety attributes can be measured with stated or revealed
preference approaches. The former approach involves asking farmers (assuming the unit
of analysis is the farmer) to make a hypothetical choice between different crop varieties
offered in a choice set and differentiated by their attributes. Revealed preference
approach involves utilizing data on farmers’ actual and observed behaviour, which
reflects their observed seed selection criteria. However, in terms of methodology, both
stated and revealed preference methods have advantages and drawbacks. Stated
preference methods are criticized because of their hypothetical nature and the fact that
actual behavior is not observed; revealed preference methods suffer from collinearity
among attributes and other modelling shortcomings (Smale, 2006). Therefore, combining
the two is expected to increase the statistical efficiency of results and lend greater validity
by taking advantage of the relative strengths of the two types of data. Consequently,
studies that try to merge stated and revealed preference approaches – due to their
attractive external validity feature21 – have also been reviewed in subsequent sections.
21 See section 2.3 for a discussion of external validity with examples.

29
One of the advantages of stated preference methods is their ability to serve as a priori
information for any proposed change in environmental goods. Studies that can potentially
serve as a priori information for Ethiopian rural development goals have also been
briefly included in section 2.5 under the premise that the current study contributes to the
existing literature dealing with informing and prescribing agricultural policies that are
most likely to be welcomed by farmers. Section 2.6 concludes the literature review
chapter.
2.2. Valuing crop variety attributes through revealed preferences
Revealed preference methods like the work by Edmeades (2007) applied the hedonic
price method to estimate the supply functions of variety attributes of a subsistence crop in
a developing economy. The hedonic price was derived within the framework of utility
maximizing agricultural households who make consumption and production decisions
simultaneously. This was reflected in the specification of the hedonic function to account
for both consumption and production attributes jointly. By using spatially segmented
information from three regions in Uganda, the author identified and estimated supply
functions for three attributes: quality (taste, softness, and color), bunch size, and fruit
size. The supply functions for these attributes were estimated as a second stage where the
first stage involved the estimation of hedonic price function for each region in which the
unit of observation was the farm-gate price22 of the household-variety of banana. The
marginal implicit prices of both consumption and production attributes were drawn from
the first stage and included as independent variables in the supply functions and a two-
22 Farm-gate prices trace the behavior of sellers and buyers at the first link in the market chain and provide an indication of attribute trade-offs made by farmers at the farm-gate (Edmeades, 2007).

30
stage least squares estimation (2SLS) approach was used to correct for potential bias in
the estimation of the functions brought about by the endogeneity of the marginal implicit
prices, and study the attribute trade-offs involved. A number of substitutability and
complementarity cases were found between attributes. For example, an attribute like
quality of banana associated with its taste, softness and color (consumption attribute)
appeared to be a complement to its bunch size (production attribute) at the farm gate. On
the other hand, the results for banana fruit size (production attribute) suggested
substitutability with both bunch size and quality. Therefore, the paper concluded that if
variety improvement endeavors are to succeed, they should not focus only on agronomic
traits, but also on consumption attributes embodied in varieties.
However, as argued in chapter 1, revealed preference methods are confined to value
attributes of crop varieties that cover mainly direct use values (e.g., the consumption and
production attributes mentioned in the above study), and one has to employ stated
preference methods like choice experiment to estimate the demand for attributes, which
have indirect use values (e.g., the environmental adaptability and yield stability traits in
this study).
The following section reviews works that employ stated preference methods to value
components of crop varieties. This method was necessary due to the public good nature
of the attributes studied and hence no formal market exists for trading these attributes.
2.3. Valuing crop variety attributes through stated preferences
31
A Stated preference method, in particular choice experiment (CE) approach was applied
by Birol et al. (2006a) to study farmers’ demand for agricultural biodiversity in the home
gardens of Hungary’s transition economy. Hungary was described as a country in
economic transition after joining the EU in May 2004, and the purpose of the study was
to test the effects of economic development and transition on farmer demand for
agricultural biodiversity in home gardens and food self-sufficiency in the country. In their
study, each farmer was presented with five or six choice sets according to the blocking
method used, and each choice set contained three alternatives- two of which were
described by five relevant attributes and an opt-out option was included as a third
alternative for farmers not interested in home garden cultivation. In the model estimation,
social and economic characteristics entered the utility function as interaction terms with
the choice attributes since they were constant across choice occasions for any given
farmer, hence, the presence of alternative-varying regressors make conditional logit
model a valid method of analysis. However, including all interactions of the settlement
level characteristics with five home garden attributes in the conditional logit estimation
resulted in multicollinearity problems. To overcome this constraint, the authors
constructed four indices from 14 settlement level characteristics comprised of variables
such as number of primary and secondary schools, number of food markets, population,
and number of shops and enterprises to name a few. The four indices include, settlement
development index (SDI), urbanization index (UI), food market index (FMI), population
density index (PDI), all constructed using factor analysis except SDI. Factor analysis
collapses the number of variables, classifying them according to their correlations and
structure. The SDI, which is similar to the human development index (HDI) of the United

32
Nations (UNDP, 2003) was constructed by assigning each settlement a score for each
characteristic in the first stage. That is, the settlement with the highest value or the
characteristic was awarded a score of 100 and others were ranked proportionately in
descending order. In the second and final stage, the SDI was calculated for each
settlement by averaging over the characteristics indices. These four indices are then
interacted with farmers’ demand for home garden attributes and included in the
conditional logit model that is now free from multicollinearity.
The authors found that as the settlement in which farmers reside develop and the physical
infrastructure of their markets becomes denser, they rely less on their home-produced
goods for food and the agricultural biodiversity they seek to maintain on their farms
diminishes. On the other hand, farmers residing in the most isolated and economically
marginalized settlements value the agricultural biodiversity and food produced in their
home gardens most. As long as this is the case, the opportunity costs of these farmers of
sustaining current levels of agricultural biodiversity are nil. However, as major changes
in markets and incomes are expected to occur in Hungary as a consequence of economic
transition and EU membership, the opportunity cost may not always remain nil.
Therefore, the study recommends that economic growth should go hand-in-hand with
public programs that identify farming communities for least cost options and apply any
incentive mechanism aimed at sustaining current levels of agricultural biodiversity in
Hungary.
33
Another similar investigation was made by Birol et al., (forthcoming) on Mexican
farmers’ valuation of milpa23
diversity and genetically modified (GM) maize using
choice experiment. Data were collected across three states of Mexico, and analyzed using
random parameter logit (RPL) model with interactions, which can detect for unobserved,
as well as observed sources of heterogeneity in the sample. Besides accounting for
unobserved unconditional heterogeneity, RPL is superior to other multinomial models
like conditional logit (CL) since it does not require the independence of irrelevant
alternatives (IIA) property to be satisfied but the violation of which renders CL and
Multinomial Logit (ML) models inappropriate. Accordingly, the authors tested for the
IIA property and were able to find that the data doesn’t violate the IIA property, which
makes the CL an appropriate model for estimation. However, CL assumes homogenous
preferences across farmers within each site and the authors tested the assumption by
estimating an RPL model and comparing the parameters with a CL model using Swait-
Louviere log likelihood ratio tests. They found that they were able to reject the null
hypothesis that the regression parameters for the CL and RPL are equal at 0.5%
significance level for two of their three sites. Hence improvement in the model fit can be
achieved with the use of the RPL model instead of CL for these two sites but CL is
appropriate for the third site. The results reveal that there is considerable heterogeneity in
farmers’ preferences for milpa diversity and GM maize across and within the three states.
For instance, the inter crop diversity attribute (i.e., crop species diversity in the milpa,
which consists of intercropping of maize, beans and squash) is valued most highly by the
farm households that are located in the most economically and geographically
23 A milpa is a traditional intercropping system of maize, bean, and squash cultivated by Mexican farmers and considered as repositories of agrobiodiversity in Mexico (Birol et al., forthcoming).

34
marginalized region, whereas, intra crop diversity (i.e., maize variety diversity) attribute
is valued most highly by farmers who also value maize genetic diversity embodied in
maize landraces24, regardless of the market integration level of the households.
The locations and characteristics of those farm households who value the option to
cultivate GM maize the most are also identified to be fully integrated into output and
labor markets. Therefore, the major policy implication drawn in the study based on these
findings is that farmers that derive the highest private economic values from the
agrobiodiversity components of the milpas would constitute the least-cost targets for in
situ conservation on-farm programmes. The findings could also aid in assessing the
potential diffusion and impact of liberation of GM maize to the environment, as well as to
farmers’ welfare.
A choice experiment was implemented on another study to understand household
preference for consumption characteristics of millet varieties (Ndjeunga and Nelson,
2005). This case study, undertaken in western Niger, is different from the above choice
experiment studies in that it tries to identify variety preferences solely from the
consumers’ side instead of at least also from the producers’ side (farmers involved in
both producing and consuming their output) as in the literatures reviewed above. This, of
course, can partly explain why farmers (suppliers of the variety attributes to consumers;
they being members of both) keep the varieties that attract markets. The study
systematically evaluates preferences of consumers for tuwo25
and couscous26 cooking
24 See sub-section 1.4.1 in the introductory chapter for a definition of landraces. 25 Tuwo in the study is described as a stiff porridge made from sorghum, pearl millet, maize, rice, or finger millet flour; it’s usually eaten with fingers accompanied by some types of sauce made from many ingredients. It is also known in different countries by different names.

35
quality characteristics. Interestingly enough, the survey instrument was developed in such
a way that after the most important cooking quality characteristics were identified from
focus group discussions, respondents were asked to eat and evaluate (using the identified
attributes) five fermented and nonfermented tuwo, the overnight keeping quality of the
tuwo27, and five couscous products, all made from the same five pearl millet varieties and
by the same cook. Respondents were asked to taste these couscous and tuwo products and
rank them by assigning the highest value (5) for the most liked product and the lowest
value (1) for the least liked product. In doing so, the authors used an appropriately
specified ordered probit model and a relatively new method of analysis called tree-based
partitioning to measure the value of the cooking characteristics. Findings from this study
indicate that taste, chewiness, color, and cohesiveness are the most important attributes
preferred by couscous consumers, whereas, color, cohesiveness, taste, and consistency
were the most important traits for nonfermented tuwo consumers. Finally, stickiness,
taste, chewiness, consistency, and mouth feel were found to be the most important
fermented tuwo traits. These taste preferences have important implications in providing
some direction for millet breeding programs and food processing of millet, which is also
partly the aim of this thesis though the setting is different.
Perhaps the most relevant works to this thesis, which also contributed to its inception,
dealt with the analysis of farmers’ preferences for coffee variety traits (Edilegnaw, 2004;
Edilegnaw and Mburu, undated)28. To elucidate their variety attribute preference
26 Couscous in the study is described as a steamed granulated product made from sorghum, pearl millet, maize, fonio, or wheat. 27 Respondents were asked to evaluate the overnight keeping quality of the tuwo the next day. 28 Both studies draw from the same data collected in 2001/2002.
36
structure, 266 randomly selected coffee growing farmers in South Western Ethiopia were
asked to reflect their preferences among coffee variety attributes: yield, yield stability,
environmental adaptability, marketability and disease resistance. The most preferred
attribute for each farm household was selected and subsequently used as a response
variable in both studies. Information on farmers’ endowments, constraints and concerns
were on the other hand employed as explanatory variables. One interesting such variable
was used as a proxy for risk faced by each farm household, which drew from the
integration of Roy’s safety first model with the utility-based derivation of farmers’
preference for variety attributes. The studies describe farmers’ safety first strategy as
making a lexicographic optimizer i.e. a farm household who aims at meeting the target
minimum survival level (with a subsistent level of income obtained from the sum of the
value of livestock, non-farm, off-farm and unearned income sources) as first priority
objective and maximizes expected returns as second priority. This variable was found to
have a highly significant and intuitive explanatory power in elucidating farmers’
preference for the above coffee variety attributes.
A Multinomial Logit Model was fitted to the dataset and was found to be highly
significant in explain farmers’ variety attribute preference. The findings indicate that
factors inducing higher demand for yield (marketability) are different from those factors
leading to higher demand for yield stability (environmental adaptability). The results
suggest that farmers in more accessible areas and those who are less concerned with
satisfying subsistence income (risk proxy) prefer yield and marketability attributes of the
coffee varieties. On the contrary, farmers in less accessible areas and those more
37
concerned with potential future income shocks (or survival) have more propensities for
adaptability and yield stability.
Moreover, farmers who are less concerned with natural problems (disease, drought, and
pests) have been found to have higher demand for yield. Farmers who expect good
prospect for availability of rural development services (input supply, farm implements,
markets and extension services) have higher demand for yield and marketability, which
are all in line with the a priori expected sign. These results, complemented by the results
of this thesis, have implications not only for on-farm conservation but also for improved
variety adoption and breeding priority setting. The policy recommendations in the paper
suggest that the above results contribute to the optimization of on-farm conservation costs
by identifying varieties that are most likely to be conserved de facto and those that need
external incentives; basing the decision on the types of varieties preferred by different
farm household types as described in the result. The other important policy implication is
in breeding priority setting, where breeding should target to satisfy demands of different
farm household types classified by their resource endowments, preferences and
constraints not just their environment.
The above studies have both striking similarities and differences to this thesis. For
instance, the attributes considered most important by respondents to both studies are quite
similar. This similarity may be because both groups of respondents come from the same
country and face similar concerns. The other major similarity arises in the fact that both
studies employ stated preference methods, where hypothetical varieties of crops were
38
presented in a choice set, to elicit farmers’ variety attribute preferences. Their policy
implications are also similar.
However, coffee is a perennial cash crop as opposed to the seasonal food crops – teff and
sorghum – under investigation in this study. Thus, one of the major implications of this is
that different interpretations of the attributes between the two sets of respondents for the
current and previous studies can be warranted. Moreover, though both types of
questionnaires employ stated preference methods, a coffee variety in the previous study
was explained to respondents by only a single attribute (for example, a variety that is high
yielding; or a variety that has more stable yield) as opposed to a sorghum (or teff) variety
illustrated by four attributes (with specific values) in the current study29. By doing so, the
latter tries to estimate the economic value (monetary value) of the non-traded attributes to
farmers, which would not have been possible for the previous study, and hence the
current study provides a more complete picture regarding the relative importance of the
different variety attributes and a fuller extent of opportunity costs forgone (the trade-offs
or marginal rate of substitution between attributes) during a change in variety use.
2.4. Valuing agro-diversity through both revealed and stated preferences
In the above studies, we see how important CE is in estimating the values of attributes of
an environmental good (s), especially when the attributes in question are not traded in the
market. But, how well does a hypothetical and non-market valuation method like CE
perform when compared to a more conventional method of analysis (e.g. hedonic
29 See an example of a choice set in Figure 4.2 of chapter 4 where the description of three sorghum varieties with the levels of four attributes is included.
39
approach) where money has actually changed hands? Answering this question was one of
the aims of a study by Scarpa et al. (2003a), where revealed and stated preference value
estimates were compared in attempting to value indigenous cattle breeds in Kenya. In
their study, the authors selected those cattle characteristics that are relevant in market
transactions for the CE implementation and compared their marginal values with their
counter-part (results from the linearly specified hedonic analysis) by simply identifying
the determinants of market price in real transactions; both sets of data were collected
from the same population of traders, in particular from seven cattle markets in Kenya.
This allowed the study to conduct an external test of preference consistency between
actual and hypothetical choices. The authors found that value estimates for cattle traits
like slaughter weight (kgs), sex and body condition30 from the hedonic function compare
well in magnitude with those implied by the different multinomial models used to
analyze the CE data. Only one attribute namely, Maasai Zebu breed31, was found to be
not significantly different from zero in the revealed preference analysis, but it is
significantly negative in the stated preference approach. One possible explanation offered
by the authors for this discrepancy was that during the data collection, respondents were
dealing with severe drought conditions and a majority of the recorded sales would be
desperate attempts to sell animals for slaughter before they died of starvation and the
particular breed of animal would not play a major role in either buyer or seller
preferences. Despite this discrepancy however, the authors contend that CE estimates
30 Body condition of the cattle took ordinal values like poor, good and excellent illustrated to respondents by laminated photographs or by pointing to an animal within view that corresponds to a particular body condition (Scarpa et al., 2003a). 31 The traditional cattle herds kept by the pastoralist Maasai of East Africa belong to a broad sub-group of cattle referred to as ‘Maasai Zebu’. These animals have a high degree of tolerance to drought and endemic disease not present in exotic breeds but produce less meat and milk per animal than the latter if both are subject to high level of management and nutrition (Scarpa et al., 2003a).
40
pass the external test and appear to be adequately precise in estimating values for cattle
traits that are relevant in market transactions for Maasai traders. These findings,
therefore, suggest that CEs may be a promising tool for valuing phenotypic traits32 (e.g.
higher resilience) and complement other research results, including the results from this
thesis, that tackle such issues more directly.
Drawing on the above conclusions, a subset of the authors who wrote the above paper
(along with different authors) did a related work in attempting to value breed traits of
local33 pig breeds in peasant economies of Yucatan, Mexico (Scrapa et al., 2003b). The
genetic purity of these local pig breeds (they are referred in the study as ‘creole’ pigs) is
reported to be under serious threat by the indiscriminate adoption of exotic pig breeds.
The study reports that the latter breeds are claimed to be superior in terms of highly
digestible feed-meat conversion but, for this potential to be fully delivered the
traditionally extensive management systems must be intensified, which is often beyond
the scope of existing human and capital resources available to a typical peasant economy.
On the other hand, some genetically determined traits of the creole pig, such as higher
tolerance to environmental extremes and parasite resistance, seem to ensure a higher rate
of survival in the traditional management system, which relies on very low input and
technology. However, the recent trend of importation and promotion of pigs of
‘improved’ breeds in Mexico is reported in the study to contribute to: a drastic reduction
in the number of creole pigs (breed substitution), and the loss of the creole pig
characteristics through cross-breeding (genetic erosion). Therefore, the authors used
32 See section 1.4.1 of chapter 1 for a definition of phenotype. 33 The term ‘local’ refers to livestock that have become adapted to the specific environments of low external input rearing systems (Scrapa et al., 2003b).
41
choice modelling to estimate producers’ preferences for genetically determined pig
attributes in the backyard economy of Yucatan. Attributes selected for the CE were
distinct between exotic and local pig breeds; these included, piglet costs, weight of the
pig at 6 months, bathing frequency for heat relief, and disease resistance. The random
utility parameter estimates conditional on respondents’ characteristics suggest that
attributes of indigenous piglets34 are relatively more valuable for the predominantly
younger, less educated, and lower income households in the sample. The estimated
magnitudes for these breed traits of considerable relevance for the household production
function were also found to be comparable with shadow cost computations obtained
through historical accounts, agricultural censuses and scientific articles, providing the CE
results with external validity. Therefore, such information is valuable for conservation
programmes thereby identifying those households that most value the local creole breed
and for designing cost-effective policies that counter the trend towards marginalization of
the indigenous breed. Furthermore, breeding programmes meant to address producers’
preferences/concerns, for which pigs often provide a means for saving, smooth
consumption patterns, and used as cyclical buffering, can also benefit in terms of priority
setting that takes into account the above attributes without negatively affecting the
conservation programmes. Local varieties of crops, which are of interest for this thesis,
share similar traits with creole pigs regarding disease resistance and productivity when
compared with improved/exotic varieties/breeds and face similar threats as creole pigs.
This is despite the fact that their biological make-up is totally different. Therefore, stated
preference researches, as in the above study, need to inform policy on the conservation of
34 Indigenous piglets do not require feed purchase, show high disease resistance and need only one bath a week.
42
indigenous flora and fauna in relation to agriculture and this thesis contributes to the
former. This thesis also shares similar features to the above study in that the current study
contributes to understanding farmers’ crop variety attribute preferences, which can later
be used by crop breeding programs to develop improved varieties that address the
concerns of farmers in Ethiopia.
Another external validity investigation was also made in a developed country context.
This investigation was conducted on undergraduate students from two universities in
Sweden, by eliciting their willingness to pay (WTP) for donations to environmental
projects (Carlsson and Martinsson, 2001). The authors’ test of external validity was a test
based on marginal WTP, where respondents were presented with hypothetical and actual
experiments each choice set containing two alternatives with two different environmental
projects and donations per person needed for each project. The result indicated that the
authors were unable to reject the hypothesis that the preferences are the same in the two
experiments. This is therefore, a further indication that choice experiments seem to be an
alternative method of eliciting individuals’ preferences for public goods. Applying choice
modeling to impure public goods like the crops considered in this thesis35, is also an
interesting area that should receive a certain degree of validity from the previous
conclusion.
After calculating willingness to accept (WTA) values for each variety attribute of the
crops studied in this thesis, we attempted to compare farmers’ valuation of the
35 For a discussion on the impure public good nature of the crops under study in this thesis, see sub-section 1.4.2 in the previous chapter.
43
productivity attribute in our hypothetical stated preference data with Producers’ price
(farmers’ sale price) data from Central Statistical Agency (CSA) for this attribute, where
actual behavior is revealed, and we found them to be similar (See section 5.3. in chapter 5
for a detailed discussion of this finding). Thus, this important finding provides our study
with external validity, like the works reviewed under this section, by minimizing the
disadvantages associated with the hypothetical nature of our stated preference study.
2.5. Stated preferences as a priori information for Ethiopian rural development
goals
Wegayehu (2006) investigated farmers’ perception of the relevance of different
development intervention programs in the eastern Ethiopian highlands and found that
farmers’ specific socio-economic circumstances and subjective ranking of agricultural
problems play a major role in their preference ranking of interventions in the areas of
market, irrigation, resettlement, and soil and water conservation. The study underscores
the importance of a priori information if development efforts are to bring about the
desired outcome, which the author argues is lacking and is partly responsible for the
failure of rural development programs in most developing countries. The results of the
study also suggest that the menu for intervention programs needs to take into
consideration socio-economic differences that might exist within the same agro-
ecological settings for micro level implementation of development programs. Thus, the
paper concludes that if a well-stated and best-articulated national or regional policy
and/or strategy is to succeed, one also has to pay due attention at the grassroots level
execution of the policies and strategies.
44
As stated in the introduction chapter of this thesis, the results from the current study
could also serve as a key a priori information for variety improvement endeavors – a type
of development intervention – by systematically eliciting farmers’ crop variety attribute
preferences and setting the focus on attributes most relevant to farmers.
On the Ethiopian rural development programs menu, agricultural extension packages are
currently on top of the list, assuming that the list is populated in order of prevalence.
However, the dichotomy between extension driven adoption of modern inputs, on the one
hand, and community driven local public goods, on the other hand, is particularly evident
in the highlands of Ethiopia (Carlsson et al., 2005). In spite of these trade-offs, the study
by Carlsson et al. (2005) argues that the target populations of these policies seldom have
the possibility to express their preference between the two. Therefore, the authors
employed a stated preference survey in particular, choice experiment, to investigate
Ethiopian farmers’ preferences between an agricultural extension package and a local
public good – health care or protected spring. As described in the study, the current
extension approach in Ethiopia includes predominantly the provision of improved seeds
of food and commercial crops, and artificial fertilizers, and is currently provided to
farmers with credit under local government collateral arrangements. The repayment
requirements of these short-term credits hold even under occurrence of crop loss
sustained by peasant borrowers.
45
A standard random effects binary Probit model was fitted for the analysis, where the
dependent variable is equal to one if the respondent opted for the extension package and
zero otherwise. The study found that a majority of people prefers the public good.
However, when the extension package is combined with insurance in terms of no
payback of the credit in case of crop loss, then the authors found a significant increase in
the choice of the extension package. The study thus sheds light on why Ethiopia’s major
development strategy has had limited success and gives evidence of how stated
preference methodologies can be utilized for development policy design. The latter can
be achieved by informing policy, on a priori basis, about the preferences of the targeted
population towards the proposed policies.
In this thesis, we try to relate crops’ responses to the major underlying environmental
pressures leading to the crop loss mentioned in the above study (e.g. drought and
disease), with farmers’ preferences to these crops. This is in contrast to the approach
employed in the above study – through the inclusion of an insurance component in the
extension package that directly reduces the risk from adoption36. Furthermore, the seeds
of the crop varieties presented to farmers for this study are currently not necessarily in the
production lines for subsequent improved variety diffusion, but are hypothetical in nature
meant to inform rural development polices towards the adoption behaviour of farmers if
extension packages, in the form of improved seeds, include these varieties or their close
substitutes. Therefore, if agricultural technologies are conceived without considering
farmers’ contextual conditions on a priori basis, they carry the twin risks of being
36 For a detailed discussion of this approach see Carlsson et al. (2005).
46
released without farmers taking them or being rejected while farmers would have found
them valuable (Edilegnaw and Asmare, 2007).
2.6. Concluding remarks
This chapter presents how this thesis contributes to the existing literature dealing with the
application of stated preference methods in general, and stated choice methods in
particular, in a developing country setup. At the household level, the study also
contributes to a promising research direction, in terms of methodology, that would
involve merging of stated and revealed preference approaches, where the latter approach
lends external validity to the former. Finally, as the studies reviewed above, the current
study can potentially serve as a priori information for one of Ethiopia’s rural
development interventions: contextual crop variety development and dissemination.
47
CHAPTER THREE
DATA COLLECTIO� METHODOLOGY A�D DATA
DESCRIPTIO�
3.1. The data generation process: survey design and implementation
This research was dependent on both primary and secondary data with the field work
undertaken in the North Eastern part of the country (North Wollo zone of Amhara
Regional State). Two phases of data collection procedures were implemented for this
study within the framework of IPGRI’s (International Plant Genetic Resources Institute)
Genetic Resources Policy Initiative (GRPI) - Ethiopia project, with an aim to support the
development of policy options for sustainable conservation and utilization of crop genetic
resources in Ethiopia. The first phase of data collection, which was administered from
October 2006 till January 2007, was mainly concerned with collection of data on farm
household characteristics and asset ownerships, and factors related to their seed choice
decisions, agricultural extension and markets, shocks, and their risk coping strategies. All
the socio-economic variables employed in chapter 5 to explain farmers’ variety attribute
preferences are drawn from this phase i.e. data from the first and second phases were
merged in our empirical analysis. The second phase of data collection, which was
conducted during June and July of 2007, was by and large, the choice experiment survey.
A detailed discussion of the design and administration of this second phase or the choice
experiment survey is included in the next chapter. In this section, however, we will
discuss the sampling and data collection procedures followed during the first phase. This
was necessary because the second phase, which made up the main theme of the study, has
48
built upon the sampling structure already constructed during the first phase i.e.
respondents who were sampled and interviewed for the first phase (the farm household
survey) were also re-interviewed for the second phase (the choice experiment survey).
During the first phase, a base-line survey was undertaken to identify sources of
heterogeneity of farm households before the stratified multi-stage sampling was adopted
to identify Zones, Districts, Peasant Associations (PAs), villages, and farm households.
Moreover, a total of 24 key informants (12 per PA per session) were interviewed (during
the 2006/2007 cropping season) to undertake wealth ranking, understand farmers’
decision behaviour related to variety use, and identify the most important crop varieties in
use in the PAs surveyed in both phases.
The First phase of the data collection procedures has considered two Zones (South
Gondar and North Wollo) in Amhara Regional State. In each zone, two districts were
considered based on agro-ecological representation. In each district, two peasant
associations (PAs) were selected based on the same criterion. However, due to logistical
and time constraints, the choice experiment survey (phase 2) was conducted on farm
households residing only in North Wollo zone. Consequently, in terms of distribution,
131 farm households (33.4 % of all farm households surveyed for the first phase) were
interviewed for both the first and second phases of data collection. Our econometric
analysis in chapter 5 is based on these farm families who have been interviewed for both
phases. These farm households were also drawn from two PAs namely Woinye, and Ala
Weha from Guba Lafto district of North Wollo zone.
49
Finding the most important sources of heterogeneity of peasant households was the most
important step after selection of the PAs. By and large, poverty status / wealth indicators
were the most important variables found to be the sources of heterogeneity among farm
households. Using the variable as a stratification mechanism, households were sampled
to ensure proportionality. Accordingly, in terms of distribution of the sampled
households, 68 and 63 farm households have been sampled and interviewed (for both
phases) from Ala Weha and Woinye PAs respectively.
In consultation with Agricultural Bureaus and development agents working with farmers,
the survey sample was structured to cover a representative sample of villages and farmers
with respect to a wide range of agro-ecological and economic variables. The variables
included in the selection process include prevalence of drought, distance from markets,
distance from extension and input supply services, relative importance of different
income sources, and prevalence of poverty. In consultation with the respective
development agents working in the PAs sampled, the most important sources of
heterogeneity among households which were identified for selecting farm households
proportionately include land size, poverty status, sex of the household head, and income
source outside agriculture.
Households were stratified by groups according to rosters kept in each PA, and individual
farm households were sampled in proportion to stratum representation. The data for both
phases were collected through personal interviews with a structured questionnaire. Two
versions of the choice experiment survey were designed each containing either of the
50
hypothetical sorghum or teff variety choice sets. The sample population in each PA was
then randomly divided into two, each sub-sample receiving one of the two versions of the
choice experiment (see chapter 4).
In sampling farmers, sites close to markets (input, output and credit) and those far away
from markets and other public services were considered i.e. an effort was also made to
get representative sample in terms of access to market and public services. In consultation
with the zonal agricultural bureaus, the survey sample was structured to cover a
representative sample of villages in the study area. Thus, the villages were chosen to
incorporate a wide range of agro-ecological, market, road and cultural diversity. This
way, 10 villages (4 from Woinye PA and 6 from Ala Weha PA) were sampled before
selecting peasant households for interview.
In total, 11 enumerators from North Wollo zone who knew the local language and culture
were hired and trained for effective collection of data during the first phase. All of these
enumerators, who were also employees of MoARD as development agents, were diploma
holders. Six of the eleven enumerators were rehired and trained for the choice experiment
survey (phase 2). In addition, these enumerators were also involved in the questionnaire
pre-test and interview with the close supervision of the principal investigators for each of
the two respective phases of data collection procedures37.
37 The principal investigator of the farm household survey (phase 1) is Dr. Edilegnaw Wale; whereas, the principal investigator for the choice experiment survey (phase 2) is the author of this thesis.
51
The draft questionnaire employed in the first phase had modules on demography and
farm household contextual characteristics, household asset ownership and poverty,
farmers’ land use decisions, farmers’ variety attribute preferences, seed sources and seed
turn-over, farmers’ ranking of the different types of shocks they frequently face, farmers’
survival and coping strategies during shocks, and farmers’ access to services (markets,
extension, irrigation etc.). This draft questionnaire was then pre-tested to examine its
feasibility in line with farmers’ expectations, responses, outcomes, and level of
understanding. About 18 farmers were involved during the pre-test. Following the pre-
test, the test results were incorporated in revising the questionnaire in line with farmers’
response to the previous version. The survey data collected this way is later employed in
our empirical analysis in chapter 5 to explain farmers’ preferences for crop variety traits
conditional on the farm household contextual characteristics and other factors mentioned
above.
Following sampling of farmers, training of enumerators, questionnaire pre-test, and
revision of the questionnaire, 131 farmers drawn from two PAs in North Wollo zone
were interviewed. All of these farmers were interviewed twice where each interview was
conducted for either phase of the data collection procedure mentioned above. Each
enumerator did an average of three interviews a day accompanied by the respective
principal investigator for each phase. The principal investigators were also involved in
interviewing some farm household heads to better understand their decision making
behaviour regarding variety selection and management.
52
The next section discusses the characteristics of the two PAs covered by this study. The
relevant information provided by key informants along with secondary data collected
from the agricultural bureaus in each PA is reorganized and presented in the next section.
3.2. Study site description
The villages surveyed in Woinye PA include Shall, Mamuarecha, Kokeba, and
Kolegenda. The PA has a human population of 11,210 and size of 3,215 hectares.
Woinye PA is located 23 kms West of Woldeya town, the capital of North Wollo zone.
Agro-ecologically, the PA is ‘Woina dega’ – 83%, ‘Dega’ – 10%, and ‘Kola’ – 7%.
There are more than 15 types of crops under cultivation in the PA. The most important
crops38 (along with their land cover) include teff – 205 hectares (ha), sorghum – 156 ha,
‘dagusa’ – 196 ha, maize – 146 ha, wheat – 125 ha, and barley – 105 ha. The most
important local varieties of sorghum in the PA include degabit, jamiye, zengada,
tehulederie, and maritu. Among the most important local varieties of teff are nech teff,
key teff, and sergegna. According to key informants, the productivity of the local varieties
of sorghum and teff crops under farmers’ conditions in the PA are 19 quintals/ha, and 9
quintals/ha respectively. Yeju mashila is the most common improved variety of sorghum
that stays productive (at around 20 quintals/ha) for 3 years.
Concerning the cropping seasons in Woinye PA, about 25 percent of the farmers produce
during ‘meher’ and ‘belg’ seasons. The rest are engaged in crop farming primarily during
the main raining season, which is in winter (‘kiremt’). Moreover, farmers who have
38 Crops’ importance, in this study, reflects the crops’ (or their varieties’) contribution to food security and economic benefits (e.g., income generated from crop sale) in the farm household.
53
access to irrigation in this PA can produce 2 – 3 times per year from the irrigable crops
like onions, potatoes, pepper, cabbage, and sugar cane. About 30 % of the cultivated land
(1052 ha) is irrigable with a total land size of 314 ha. About half of the farm households
in the PA use irrigation for growing their crops. The most important agricultural
problems in the PA in relation to crop production include shortage of rain fall, soil
degradation, soil erosion, and shortage of land (land fragmentation and landlessness).
These problems are also common in many parts of the country with varying levels of
intensity. Pest problems are also reported to be among the most common problems
affecting sorghum and teff crops in both PAs studied in this thesis.
Concerning farmers’ livestock assets in Woinye PA39, on average, a farm household
owns one ox, a cow, two calves, three sheep, and three goats. From among all
households, 40% of them own donkey (s), and 3% own mule (s). Livestock diseases are
the most critical problems in the PAs covered in our survey.
The second PA surveyed for this choice experiment study is Ala Weha PA. The villages
surveyed in Ala Weha PA include, Doro Gibir, Hayqote, Ambalat, Gwasate, Kulu Bayne,
and Weyneba. The PA is located 10 kms North of Woldeya town. Agro-ecologically, Ala
Weha PA is ‘Woina dega’ – 5%, and Kola – 95%. The most important food crops in the
PA are teff, sorghum, maize, and cow beans that cover respectively 360, 380, 170, and 35
hectares of the area under the PA. The most important local varieties of sorghum in the
PA include degalet, jemiye, and zengada. The average productivity of these varieties
39 Livestock assets are usually employed in agricultural journals (especially those that focus on developing countries), as a proxy for the total value of wealth in a farm household; this is also true in this study.
54
under farmers’ conditions is reported to be 12 quintals/ha. The most important local
varieties of teff in the PA are Bunign and Ayiro with an average yield of 10 quintals per
hectare on farmers’ fields. Yeju, which yields 16quintals/ha and DZ196, which yields 15
quintals/ha, are the most important improved varieties of sorghum and teff crops
respectively in the PA. The proportion of land allocated to improved varieties of sorghum
grew from 2 to 10 percent in the PA during the period between 2003 and 2005. However,
the high price of improved seeds (and fertilizers), the associated high moisture
requirement, and the overall mistrust associated with improved varieties40 are described
as the reasons why farmers in the PA keep improved and local varieties of crops side by
side on their fields. In this case, farmers’ preferences towards local varieties are a
reflection of their risk-averse behaviours. According to key informants pests and
diseases, shortage of pesticide, backward system of planting crop seeds, growing poor
crop varieties (in terms of their productivity), and the prevalence of dangerous weed on
farmers’ fields are the most important problems of agriculture in the PA in relation to
crop production.
Based on our survey data, on average, a farm household in the PA owns two oxen, two
cows, two calves, and four goats41. From among all households, 50% of them own
donkey(s).
40 For example, according to key informants, farmers in the PA do not trust the improved varieties to stay productive year after year. 41 The descriptive statistics reported here are rounded to the nearest whole numbers.
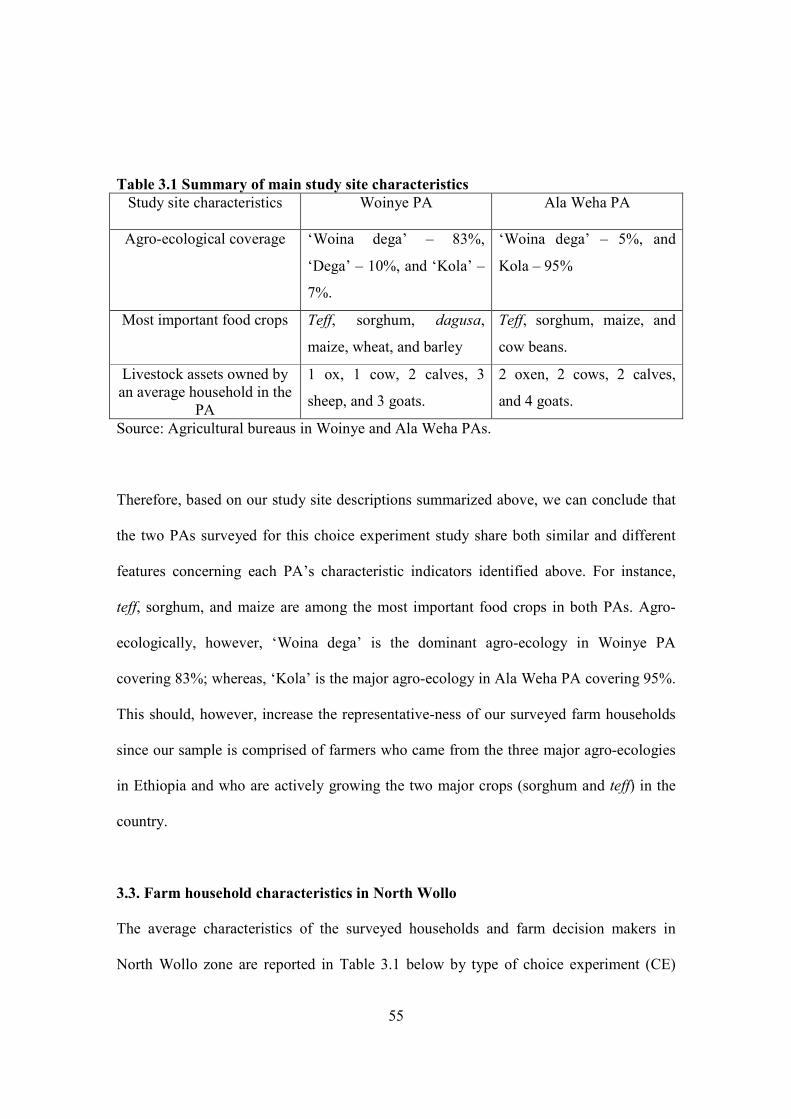
55
Table 3.1 Summary of main study site characteristics
Study site characteristics Woinye PA Ala Weha PA
Agro-ecological coverage ‘Woina dega’ – 83%,
‘Dega’ – 10%, and ‘Kola’ –
7%.
‘Woina dega’ – 5%, and
Kola – 95%
Most important food crops Teff, sorghum, dagusa,
maize, wheat, and barley
Teff, sorghum, maize, and
cow beans.
Livestock assets owned by an average household in the
PA
1 ox, 1 cow, 2 calves, 3
sheep, and 3 goats.
2 oxen, 2 cows, 2 calves,
and 4 goats.
Source: Agricultural bureaus in Woinye and Ala Weha PAs.
Therefore, based on our study site descriptions summarized above, we can conclude that
the two PAs surveyed for this choice experiment study share both similar and different
features concerning each PA’s characteristic indicators identified above. For instance,
teff, sorghum, and maize are among the most important food crops in both PAs. Agro-
ecologically, however, ‘Woina dega’ is the dominant agro-ecology in Woinye PA
covering 83%; whereas, ‘Kola’ is the major agro-ecology in Ala Weha PA covering 95%.
This should, however, increase the representative-ness of our surveyed farm households
since our sample is comprised of farmers who came from the three major agro-ecologies
in Ethiopia and who are actively growing the two major crops (sorghum and teff) in the
country.
3.3. Farm household characteristics in �orth Wollo
The average characteristics of the surveyed households and farm decision makers in
North Wollo zone are reported in Table 3.1 below by type of choice experiment (CE)
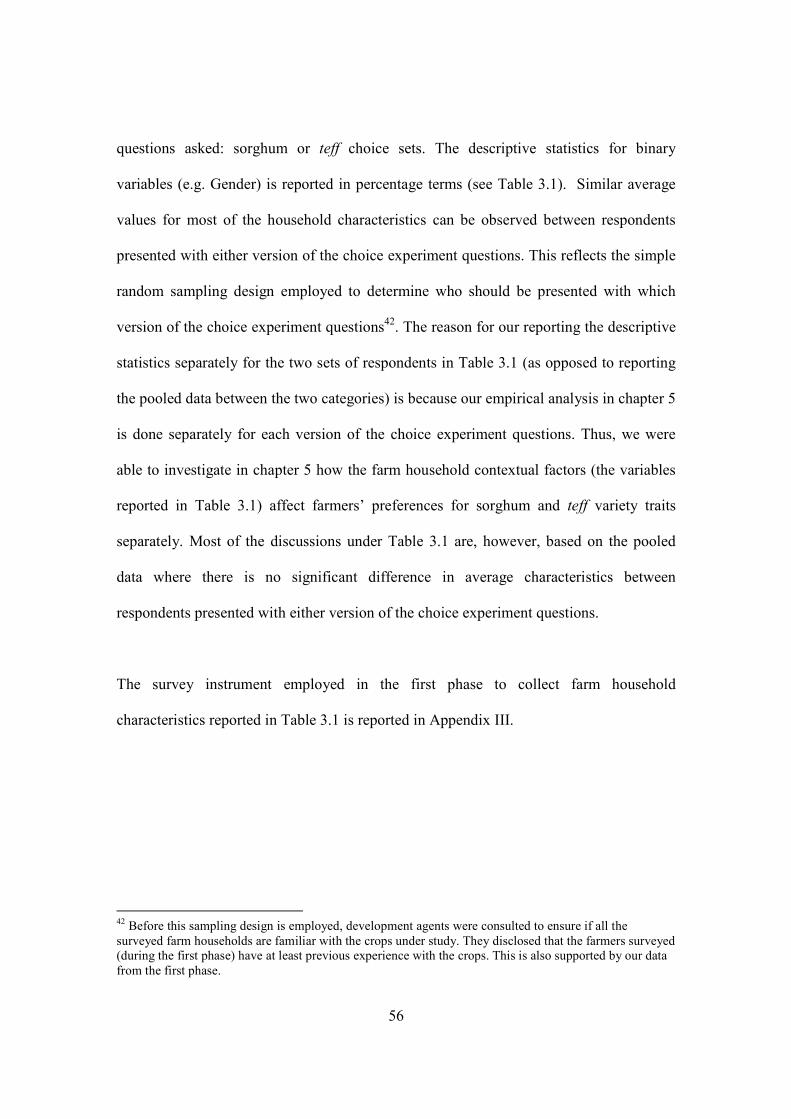
56
questions asked: sorghum or teff choice sets. The descriptive statistics for binary
variables (e.g. Gender) is reported in percentage terms (see Table 3.1). Similar average
values for most of the household characteristics can be observed between respondents
presented with either version of the choice experiment questions. This reflects the simple
random sampling design employed to determine who should be presented with which
version of the choice experiment questions42. The reason for our reporting the descriptive
statistics separately for the two sets of respondents in Table 3.1 (as opposed to reporting
the pooled data between the two categories) is because our empirical analysis in chapter 5
is done separately for each version of the choice experiment questions. Thus, we were
able to investigate in chapter 5 how the farm household contextual factors (the variables
reported in Table 3.1) affect farmers’ preferences for sorghum and teff variety traits
separately. Most of the discussions under Table 3.1 are, however, based on the pooled
data where there is no significant difference in average characteristics between
respondents presented with either version of the choice experiment questions.
The survey instrument employed in the first phase to collect farm household
characteristics reported in Table 3.1 is reported in Appendix III.
42 Before this sampling design is employed, development agents were consulted to ensure if all the surveyed farm households are familiar with the crops under study. They disclosed that the farmers surveyed (during the first phase) have at least previous experience with the crops. This is also supported by our data from the first phase.
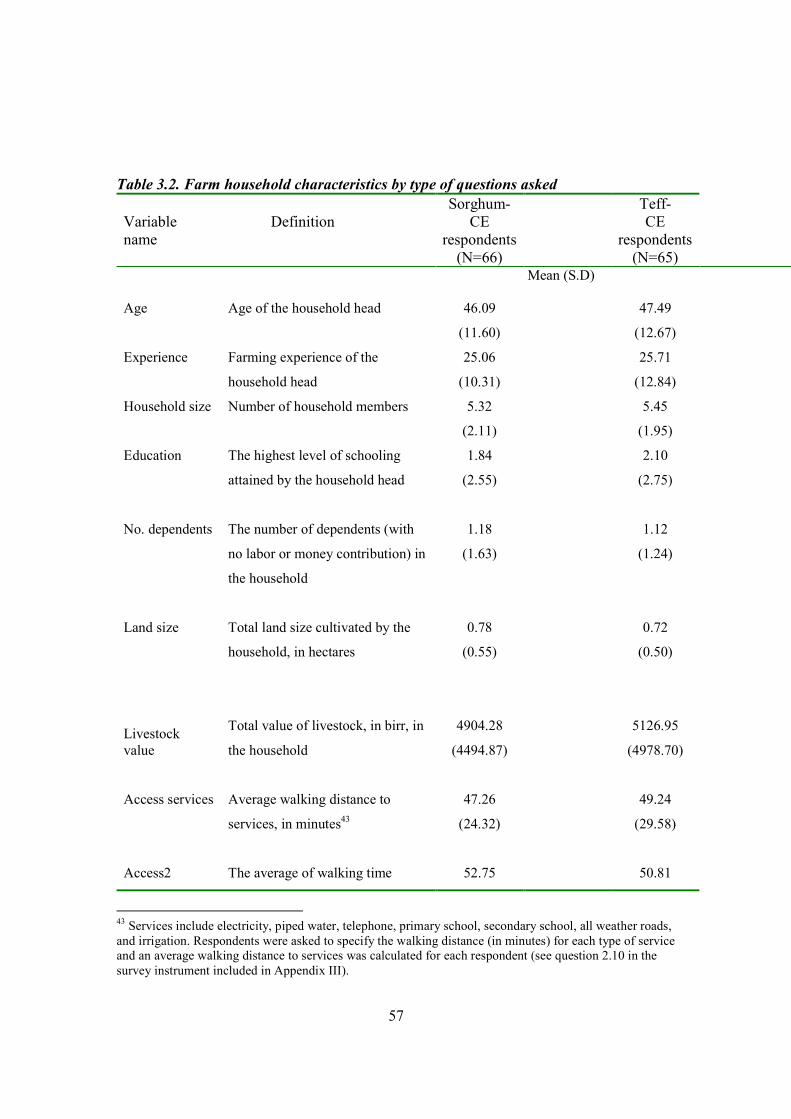
57
Table 3.2. Farm household characteristics by type of questions asked
Variable name
Definition
Sorghum-CE
respondents (N=66)
Teff- CE
respondents (N=65)
Mean (S.D)
Age Age of the household head 46.09
(11.60)
47.49
(12.67)
Experience Farming experience of the
household head
25.06
(10.31)
25.71
(12.84)
Household size Number of household members 5.32
(2.11)
5.45
(1.95)
Education The highest level of schooling
attained by the household head
1.84
(2.55)
2.10
(2.75)
No. dependents
The number of dependents (with
no labor or money contribution) in
the household
1.18
(1.63)
1.12
(1.24)
Land size
Total land size cultivated by the
household, in hectares
0.78
(0.55)
0.72
(0.50)
Livestock value
Total value of livestock, in birr, in
the household
4904.28
(4494.87)
5126.95
(4978.70)
Access services
Average walking distance to
services, in minutes43
47.26
(24.32)
49.24
(29.58)
Access2
The average of walking time
52.75
50.81
43 Services include electricity, piped water, telephone, primary school, secondary school, all weather roads, and irrigation. Respondents were asked to specify the walking distance (in minutes) for each type of service and an average walking distance to services was calculated for each respondent (see question 2.10 in the survey instrument included in Appendix III).
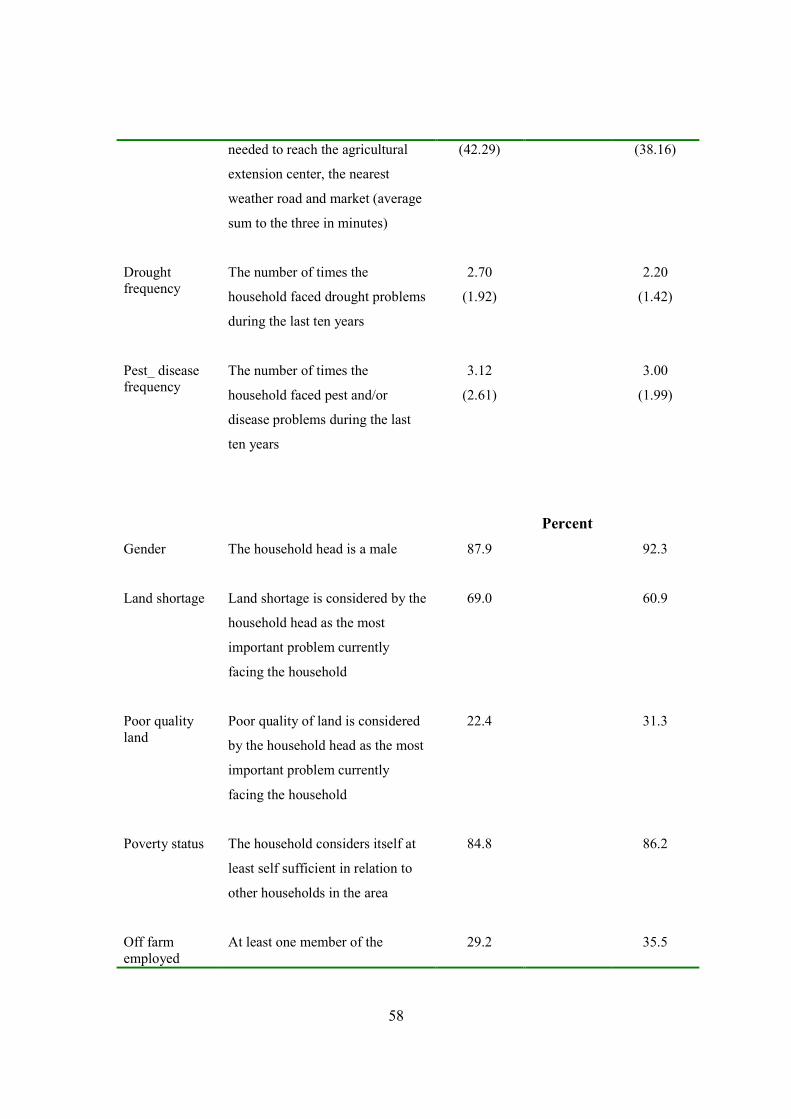
58
needed to reach the agricultural
extension center, the nearest
weather road and market (average
sum to the three in minutes)
(42.29) (38.16)
Drought frequency
The number of times the
household faced drought problems
during the last ten years
2.70
(1.92)
2.20
(1.42)
Pest_ disease frequency
The number of times the
household faced pest and/or
disease problems during the last
ten years
3.12
(2.61)
3.00
(1.99)
Percent
Gender The household head is a male 87.9 92.3
Land shortage
Land shortage is considered by the
household head as the most
important problem currently
facing the household
69.0
60.9
Poor quality land
Poor quality of land is considered
by the household head as the most
important problem currently
facing the household
22.4
31.3
Poverty status
The household considers itself at
least self sufficient in relation to
other households in the area
84.8
86.2
Off farm employed
At least one member of the
29.2
35.5
59
household works off farm
Agri ext participation
The household has been
participating in the agricultural
extension program
75.8 64.6
Source: Genetic Resources Policy Initiative (GRPI) - Ethiopia project, 2006/2007.
The average age of the surveyed household heads in Guba Lafto Woreda is about 47
years, out of which, 54 % (25.4 years) is spent on developing farming experience along
with other responsibilities. The average size of a household in our sample is 5.39; and
there are on average 1.15 number of dependents (with no labor or money contribution)
living in each household. The average highest level of schooling attained by a household
head in our sample is grade 2; however, 45% of our surveyed household heads are
illiterate.
The average values of wealth indicators in farm households like total land size (in
hectares) and total livestock value (in birr) managed by our surveyed households are also
reported in Table 3.1. Farm household heads were asked to state the total land operated
by the household in local units (e.g. Timad) and their responses were converted to
hectares before organizing our data for analysis (see question 3.0 in the survey instrument
included in Appendix III). The average total land size operated by a household in our
sample is, therefore, 0.72 hectares. Farm households in our sample also manage lands
that are of size as small as 0.13 hectares and as big as 3 hectares of land. However, 65%
of the surveyed households consider land shortage as the most important problem
60
currently facing their respective households44. This figure shows that the majority of
farmers are more likely to find even the average land size (0.72 hectares), to be an
insufficient source of input for agricultural productions that satisfy the household food
consumption needs of farm families. Poor quality of land is also the most important
problem for about 27% of the surveyed households.
Household heads were asked to state how much, in birr, they value each of their livestock
and their responses were recorded by type of livestock (see question 2.7 in the survey
instrument included in Appendix III). Accordingly, the average aggregated value of
livestock owned by a farm household in our sample is worth about 5,000 birr. This
average value, however, suffers from outliers since the percentage of farmers whose
livestock value is worth less than or equal to 700 birr and those who own livestock worth
more than 15,000 birr are, 8.1% and 5.7% of the surveyed households, respectively45.
This significant disparity that exists between livestock owners in terms of the values of
their livestock is also a reflection of the significant wealth gap that exists between farm
families residing in the PAs surveyed. In order to circumvent the problem associated with
the inclusion of outliers in our calculation of average livestock value46, we have
recalculated the average after dropping the above outliers from our sample. Accordingly,
the average total livestock value was found to be 4,477 birr, which is less than the
44 There is, however, a slight discrepancy concerning this variable between households presented with sorghum and teff variety choice sets where respondents in the former category reported higher rate of land shortage problems ( by 9 percentage point difference) than households presented with teff variety choice sets (see Table 3.1). Similar discrepancies are observed in Poor quality land and Agri ext participation variables between the two sets of respondents as reported in Table 3.1. 45 The extreme minimum and maximum total values of livestock in our sample are 80 birr and 23,900 birr respectively. 46 This is because average values tend to be biased towards extreme values and hence may not be representative of the samples they were derived from.
61
previous average by 523 birr. Similarly, the average total livestock values (without the
outliers) for respondents presented with sorghum and teff variety choice sets are 4,578
birr and 4,367 birr respectively.
Other farm household characteristics that can potentially explain farmers’ variety
attribute preferences are off-farm employment and poverty status of farm households (see
Table 3.1 above). If a member(s) of a household works either on someone else’s land or
in some other employment position (against payment in cash or in kind), then, the
household is considered in this study to have income generated from off-farm
employment opportunities (see question 2.2 in the survey instrument included in
Appendix III). Accordingly, about 32.4% of the surveyed households have reported that
they have at least one member of their household working off-farm.
Another important variable in explaining farmers’ crop variety attribute preferences is the
poverty status of our sample households. Each farm household head was asked to judge
the poverty status (the level of well-being) of his/her household in relation to other
households in the area and in doing so, each household head was asked to place his/her
household in one of the five response categories: very poor, poor, self-sufficient, rich, or
very rich (see question 2.1 in the survey instrument included in Appendix III). To test the
reliability of this variable before including it in our model i.e., to test whether or not
farmers are biased to classify themselves in categories that they do not belong, we cross-
checked farmers’ responses to this question by calculating the average total livestock
value (as a proxy for well-being) for respondents in each response category mentioned
62
above. Accordingly, we found significant differences in the average total livestock values
between these five response categories, which confirmed our a priori expectations if
farmers were not biased in their judgement of the poverty status of their households.
Therefore, we can conclude that even though all farmers may not employ the same
standard to judge the poverty status of their farm households, their judgement is closely
comparable. Before including this variable in our model estimation, however, farm
households who consider themselves self-sufficient, rich or very rich in relation to other
households were merged into one category (known by at least self-sufficient farmers) and
were coded as 1 and those who consider themselves either poor or very poor were set to 0
in our poverty status variable, which is essentially reduced to a dummy variable (See the
descriptive statistics for this variable in Table 3.1 above). This data transformation was
necessary to make our interpretation of the variable in the econometric models simple
and tractable. Consequently, farmers who consider themselves at least self-sufficient in
relation to other households in the area cover 85.5% of the surveyed households.
Variables that measure a farm household’s level of integration into different rural
development infrastructures, local markets, and agricultural extension programs are
Access services, Access2, and Agri ext participation variables as defined in Table 3.1
above. These variables are chosen to investigate how the rural development endeavours
of governmental and non-governmental organizations are affecting farmers’ crop variety
attribute preferences. Accordingly, the average walking distance (in minutes) to
infrastructures like electricity, piped water, telephone, primary school, secondary school,
all weather roads, and irrigation in the PAs surveyed is about 48.25 minutes. Similarly,
63
the average of walking time (in minutes) needed to reach the agricultural extension
center, the nearest weather road and market in these PAs is 51.8 minutes. This variable
(Access2 in Table 3.1) was, however, dropped from our econometric models reported in
chapter 5 due to the multicollinearity problem that arose with its inclusion47. Farm
households currently participating in the agricultural extension program also cover about
70% of the surveyed households.
The last two variables included in Table 3.1 but not discussed so far are Drought
frequency, and Pest_ disease frequency variables (see Table 3.1 for the definition of these
variables). The descriptive statistics for these two variables shade light on why farmers
attach the highest private value, as revealed in chapter 5, to environmental adaptability
and yield stability traits of both sorghum and teff crops. More than 92% of the surveyed
households stated that they have faced drought problems at least once during the last ten
years with a mean frequency occurrence of 2.45 times per household since the last ten
years48. The variation in drought frequency problems from one household to another may
be explained by the varying agro-ecologies represented by the PAs studied.
Drought frequency figures are similar to the frequency of occurrence of pest and disease
problems (causes of yield instability in our attribute definition). About 90% of our
respondents reported that they have faced pest and disease problems at least once during
47 Variables named Access services and Access2 in Table 3.1 were found to be highly correlated. 48 Often each drought encounter by a farm household results in a crop failure that has devastating consequences on farmers’ livelihood. Thus, it is not unexpected that in our analysis in chapter 5, we found the majority of farmers attaching the highest private value to environmentally adaptable teff and sorghum varieties, which are, according to our attribute definition, better resistant to drought and frost encounters.
64
the last ten years and the mean frequency of occurrence is about 3.06 times per farm
household since the last ten years.
In this chapter, an explanation of the survey design implemented, an account of the study
site descriptions, and a discussion of the descriptive statistics on the farm household
characteristics in North Wollo zone have been made. Overall, the procedures undertaken
during the first phase of the data collection suggest that the surveyed farm households
(and the PAs they came from) are highly representative of the most important sources of
heterogeneity among farm households and peasant associations in the North Eastern part
of Ethiopia. For instance, our descriptive analysis of the total value of livestock assets in
the surveyed farm households suggests that both relatively rich and poor households have
been represented in our sample. The PAs surveyed also represent, among other things, the
three major agro-ecologies in Ethiopia. Ultimately, the representative-ness of our
sampled farm households and PAs should increase the scope of the policy implications
drawn in this thesis beyond, for example, just the one district covered in our survey.
65
CHAPTER FOUR
CO�CEPTUAL FRAMEWORK A�D DESIG� OF THE CHOICE
EXPERIME�T
4.1. Farmers’ concerns and variety attribute preferences
Undertaking on-farm conservation ventures requires understanding farmers’ variety
choice and variety attribute preferences. Such an understanding will also help in the areas
of research priority setting and targeted adoption of crop varieties. Variety attribute
preferences and the varieties that embed these attributes are, in turn, shaped by farmers’
economic (resource constraints, markets and risk) and non-economic (religion, culture
and norms) concerns. For example, when local variety attributes satisfy farmers’
concerns, their de facto conservation is the outcome of the harmony of variety attributes
and farmers’ concerns. In essence, farm household characteristics translate to variety
attribute preferences and land allocation decisions (Edilegnaw, 2004).
Farmers’ variety attribute preferences are, therefore, the reflections of their concerns and
hence studying variety attribute preferences implies studying their concerns indirectly.
Figure 4-1 below sketches the relationships among farmers concerns, their contextual
characteristics, environmental characteristics, and crop diversity. As presented in the
scheme, farmers’ concerns are the outcomes of their socio-economic, the policy
environment, and environmental characteristics in which they are operating. Farm
household characteristics account for preference heterogeneity across individuals by
identifying segments of farmers that are characterized by common demographic traits
66
while living under the same policy and environmental characteristics. Addressing those
concerns therefore, requires matching variety attributes with farmers’ concerns. The
farmers’ variety choice and management decisions will then determine the outcome
variable: crop diversity. Crop diversity is, therefore, the outcome of farmers’ multiple
concerns and the fact that no single variety satisfies all their concerns (Brush, 2000).
Having this constraint, most farmers are managing diverse set of crops to get as many
desirable attributes as possible (Edilegnaw, 2004), and hence indirectly contribute to the
crop diversity in their region.
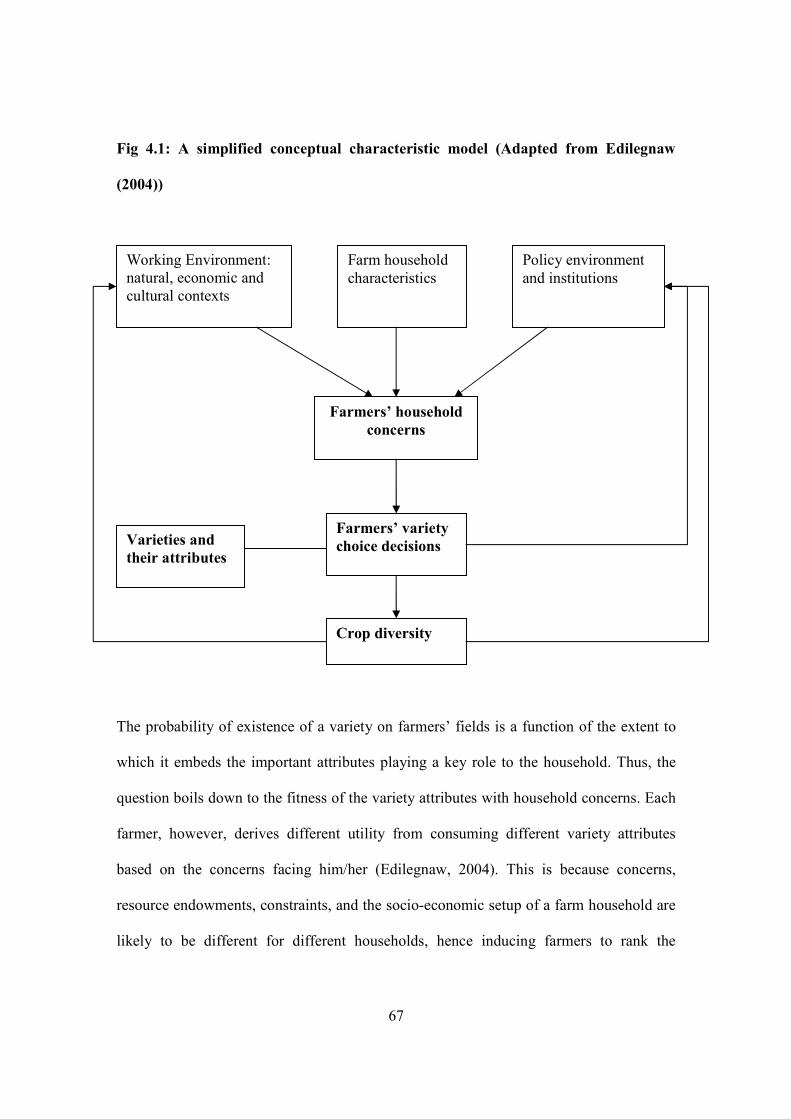
67
Fig 4.1: A simplified conceptual characteristic model (Adapted from Edilegnaw
(2004))
The probability of existence of a variety on farmers’ fields is a function of the extent to
which it embeds the important attributes playing a key role to the household. Thus, the
question boils down to the fitness of the variety attributes with household concerns. Each
farmer, however, derives different utility from consuming different variety attributes
based on the concerns facing him/her (Edilegnaw, 2004). This is because concerns,
resource endowments, constraints, and the socio-economic setup of a farm household are
likely to be different for different households, hence inducing farmers to rank the
Working Environment: natural, economic and cultural contexts
Farm household characteristics
Policy environment and institutions
Farmers’ household
concerns
Farmers’ variety
choice decisions
Crop diversity
Varieties and
their attributes
68
importance of variety attributes differently. The survival of a variety on-farm or the
successful adoption of newly introduced improved variety is, therefore, dependent on its
capacity to supply the variety attributes that receive more weight by the farm household.
We may also think in terms of a loop where farmers’ variety choice decisions and the
crop diversity in their region, in turn, shape farmers’ working (natural, economic and
cultural contexts) and policy environment (see Figure 4-1). In order for an agricultural
policy to succeed in the designing of variety development that matches farmers’ concerns
with the attributes of improved varieties, it has to be informed on farmers’ variety use
decisions, which is, in turn, a reflection of their variety attribute preferences and
concerns. Local variety conservation interventions, which are part of the agricultural
policy environment, can also learn from the information gathered on farmers’ variety
attribute preferences and predict the likelihood of survival of local varieties embedding
those attributes. This enables policy makers to identify varieties for which policy
incentives are required and those that can be maintained de facto.
Farmers can be grouped by the concern profiles they share. Categorizing farmers into
different segments according to their farm household characteristics where each segment
is comprised of farmers that share similar characteristics and then identifying the most
important variety attributes to each segment is, therefore, advantageous for identifying
and targeting farmers for on-farm conservation of local varieties or for developing
improved varieties that take the concerns of each segment of farm households into
account. In section 5.7 of chapter 5, we selected three profiles of farmers that are meant
69
to represent stereotype farm families in rural Wollo and we have calculated how much
each of our selected variety attributes is valued by each of these profiles so that the
results serve as an input for developing varietal technologies as well as for on-farm
conservation ventures with more chance to be successful in Wollo.
4.2. Theoretical underpinnings and the basic model
Birol (2004) states that among the environmental valuation methods49, the choice
experiment method is considered to be the most appropriate one for valuing the multiple
benefits of, in our case, food crops to producers. The author further argues by citing
Hanley et al., (1998a) and Bateman et al., (2003) that this is because the choice
experiment method allows for estimation not only of the value of the environmental good
as a whole, but also of the implicit values of its attributes. This approach has a theoretical
grounding in Lancaster’s attribute theory of consumer choice (Lancaster, 1966), and an
econometric basis in models of random utility (Luce, 1959; McFadden, 1974).
49 Among stated preference methods, the most commonly employed environmental valuation method is the Contingent Valuation Method (CVM). Apart from its ability to measure the value of an environmental good and its attributes, the choice experiment method has several other advantages over CVM. These include i) The respondents are more familiar with the choice approach compared to the payment approach used in CVM. ii) Choice experiment method can solve for a few of the biases that are present in the CVM. These include a) The strategic bias, that is stating an extremely high/low value to get a point across, is minimised in choice experiment method since the prices of the goods are already defined in the choice sets. b)Yea-saying bias is eliminated as in a choice experiment respondents have to choose between sets; hence, they can not state that they value a good even if they do not. c) Insensitivity to scope is eliminated, since the choice sets that are offered to the respondents are complete and carefully designed respondents might not mistake the scale of the good or its attributes for something else that it could be embedded in (Perman et al., 2003). iii) Willingness to accept (WTA) questions can be asked in choice experiments without the risk of facing huge discrepancies between WTA and willingness to pay (WTP) values as they are reasonable and predetermined (Kahneman, Knetsch and Thaler, 1990). It has been found that in CVM studies individuals seem to attach much more value to losses than they do to gains hence WTA values exceed WTP values considerably (Georgiou et al., 1997).
70
Due to the complexity of farmers’ variety use decisions, the micro-economic model
should be utility-based since a profit maximization framework is unable to explain
farmers’ variety attribute preferences and their land allocation decisions (Edilegnaw,
2004). Lancaster developed the characteristic theory of consumer behaviour asserting
that consumers derive utility not from goods themselves but from the attributes they
provide. For illustration of the basic model behind choice experiment, consider a farm
household’s choice of a crop variety, and assume that utility depends on choices made
from a set C, which includes all the possible options of different crop varieties. This list
of all options that are available to the farm household is referred to as the choice set. The
farm household is assumed to have a utility function of the form
),( iijij SZUU = (4.1)
Where for any farm household i, a given level of utility will be associated with any
alternative crop variety j. Utility derived from any of the crop variety alternatives
depends on the attributes of the crop variety, ijZ , and the social and economic
characteristics of the farm household, iS , since different households may receive
different levels of utility from these attributes. Thus, their ordering as well as their choice
of specific set of variety attributes will be conditional on the fitness of their contextual
household characteristics with the nature of the crop variety embedding those attributes.
The random utility model is the theoretical basis for integrating choice behaviour with
economic valuation in the choice experiment method. In this model, the utility of a
71
choice is comprised of a systematic (explainable or deterministic) component, ijV , and an
error (unexplainable or random) component, ije , which is independent of the
deterministic part and follows a predetermined distribution.
ijijij eVU += (4.2)
The systematic component can be explained as a function of characteristics of the crop
variety and of the social and economic characteristics of the farm household as explained
above, in (4.1). That is
iiijij eSZVU += ),( (4.3)
Given that there is an error part in the utility function, predictions cannot be made with
certainty and analysis becomes probabilistic choice. Consequently, choices made
between alternative crop varieties will be a function of the probability that the utility
associated with a particular crop variety option (j) is higher than that for other alternative
crop varieties. That is to say, the probability that farm household i will choose crop
variety j over all other combinations h is given by
},;{Pr ChjheVeVobP ihihijijij ∈∀≠∀+>+= (4.4)
72
The parameters for the relationship can be introduced by assuming that the relationship
between utility and attributes and characteristics follows a linear path in the parameters
and variables function, and by assuming that the error terms are identically and
independently distributed with a Weibull distribution (Greene, 2000). These assumptions
ensure that the probability of any particular alternative j being chosen can be expressed in
terms of logistic distribution. This specification is known as the conditional logit model
(McFadden, 1974; Greene, 2000), and it takes the general form
∑∈
=
Ch
V
V
ijih
ij
e
eP
(4.5)
The conditional indirect utility function generally is given by:
kmbannij SSSZZZV βββββββ ++++++++= ...... 212211 (4.6)
Where β is the alternative specific constant (ASC), that captures the effects in utility from
any attributes not included in choice specific attributes. This constant term, referred to as
ASC in the literature, is however dropped from our model estimations in chapter 5
because our choice sets do not include a status quo or an opt-out option (Bateman et al.,
2003 pp 7.5)50. That is, ASCs are primarily included to reflect the differences in utilities
for each alternative relative to the base (status quo) when all attributes are equal. The
number of crop variety attributes considered is n and the number of social and economic
50 The reason for the exclusion of status quo in our choice sets is explained in subsection 4.3.2.
73
characteristics of the farm household employed to explain the choice of the crop variety
is k. The vectors of coefficients 1β to nβ and aβ to mβ are attached to the vector of
attributes (Z) and to vector of interaction terms (S) that influence utility, respectively.
Since, at a point in time, social and economic characteristics are constant across choice
occasions for any given farm household, they can only enter as interaction terms with the
crop variety attributes.
The choice experiment method is consistent with utility maximization and demand theory
(Bateman et al., 2003). When parameter estimates are obtained, welfare measures can be
estimated from the conditional logit model using the following formula:
α
∑∑ −= i
i
i
i VV
CS
)exp(ln)exp(ln 01
(4.7)
Where CS is the compensating surplus welfare measure, α is the marginal utility of
income (generally represented by the coefficient of the monetary attribute in the choice
experiment) and 0iV and 1iV represent indirect utility functions before and after the
change under consideration. For the linear utility index the marginal value of change in a
single attribute can be represented as a ratio of coefficients, reducing equation (4.7) to
−=
iablemonetary
attributeWvar
1ββ
(4.8)

74
This part-worth (or implicit price) formula represents the marginal rate of substitution
between income and the attribute in question, or the marginal welfare measure
(willingness to pay or willingness to accept) for a change in any of the attributes.
The assumptions about the distributions of error terms implicit in the use of the
conditional logit model impose a particular condition known as the independence of
irrelevant alternatives (IIA) property. This property states that the relative probabilities
of two options being chosen are unaffected by introduction or removal of other
alternatives. In other words, the probability of a particular alternative being chosen is
independent of other alternatives. Whether or not IIA property holds can be tested by
dropping an alternative from the choice set and comparing parameter vectors for
significant differences (Louviere et al., 2000). If it is found that the IIA property is
violated then conditional logit results would be biased hence a discrete choice model that
does not require IIA property, such as random parameter logit model, should be used.
After estimating the conditional logit models in chapter 5, we tested whether or not IIA
holds for each of these models following the Hausman procedure51 contained within
LIMPDEP 8.0 NLOGIT 3.0 software, and all of our tests provided inconclusive results
i.e. the models do not fully conform to the underlying IIA conditions. Therefore, we have
also estimated the random parameter logit (RPL) models to account for these
inconclusive results and the results for our RPL models are reported in chapter 5.
Furthermore, inclusion of social and economic characteristics is also beneficial in
avoiding IIA violations, since social and economic characteristics relevant to preferences
of the respondents can increase the systematic component of utility while decreasing the 51 This procedure is explained in chapter 5.
75
random one (Bateman et al., 2003). Accordingly, we have also estimated conditional
logit models with interactions (socio-economic variables interacted with variety
attributes) and the inclusion of the interaction terms significantly increased the systematic
component, and hence, the model fit, in our conditional logit model estimates as reported
in section 5.6 of chapter 5.
4.3. Choice experiment design and administration
4.3.1. Setting the scene: attributes and levels for the choice experiment
The choice experiment technique was initially developed by Louviere and Hensher
(1982) and Louviere and Woodworth (1983). A choice experiment is a highly ‘structured
method of data generation’ (Hanley et al., 1998a), relying on carefully designed tasks or
“experiments” to reveal the factors that influence choice. Experimental design theory is
used to construct profiles of the environmental good in terms of its attributes and levels
of these attributes. Profiles are assembled in choice sets, which are in turn presented to
the respondents, who are asked to state their preferences (Louviere et al., 2000).
The first step in choice experiment design is to define the good to be valued in terms of
its attributes and the level each attribute takes. In the choice experiment study reported in
this thesis, the most important crop variety attributes and their levels were identified in
consultation with experts in this area (crop breeders and researchers who have previous
experience and knowledge on the subject), by reviewing previous studies and historical
data from CSA, and by identifying the most important seed selection criteria put forward
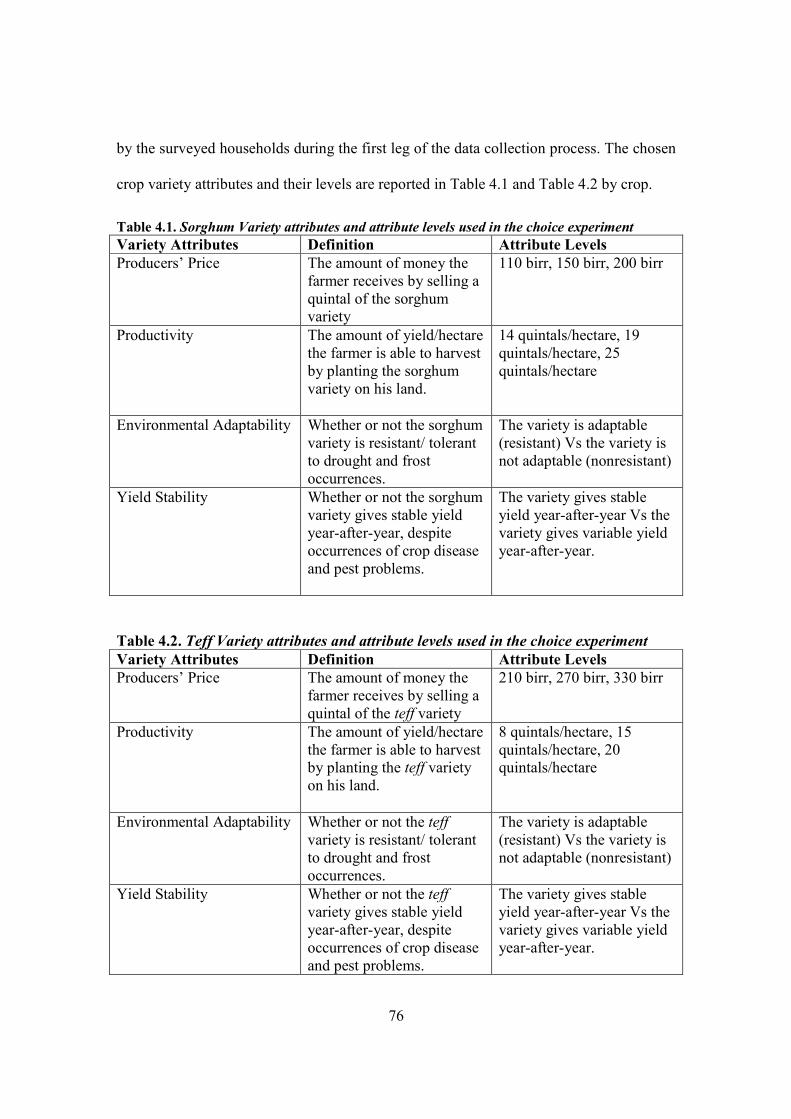
76
by the surveyed households during the first leg of the data collection process. The chosen
crop variety attributes and their levels are reported in Table 4.1 and Table 4.2 by crop.
Table 4.1. Sorghum Variety attributes and attribute levels used in the choice experiment
Variety Attributes Definition Attribute Levels
Producers’ Price The amount of money the farmer receives by selling a quintal of the sorghum variety
110 birr, 150 birr, 200 birr
Productivity The amount of yield/hectare the farmer is able to harvest by planting the sorghum variety on his land.
14 quintals/hectare, 19 quintals/hectare, 25 quintals/hectare
Environmental Adaptability Whether or not the sorghum variety is resistant/ tolerant to drought and frost occurrences.
The variety is adaptable (resistant) Vs the variety is not adaptable (nonresistant)
Yield Stability Whether or not the sorghum variety gives stable yield year-after-year, despite occurrences of crop disease and pest problems.
The variety gives stable yield year-after-year Vs the variety gives variable yield year-after-year.
Table 4.2. Teff Variety attributes and attribute levels used in the choice experiment
Variety Attributes Definition Attribute Levels
Producers’ Price The amount of money the farmer receives by selling a quintal of the teff variety
210 birr, 270 birr, 330 birr
Productivity The amount of yield/hectare the farmer is able to harvest by planting the teff variety on his land.
8 quintals/hectare, 15 quintals/hectare, 20 quintals/hectare
Environmental Adaptability Whether or not the teff variety is resistant/ tolerant to drought and frost occurrences.
The variety is adaptable (resistant) Vs the variety is not adaptable (nonresistant)
Yield Stability Whether or not the teff variety gives stable yield year-after-year, despite occurrences of crop disease and pest problems.
The variety gives stable yield year-after-year Vs the variety gives variable yield year-after-year.
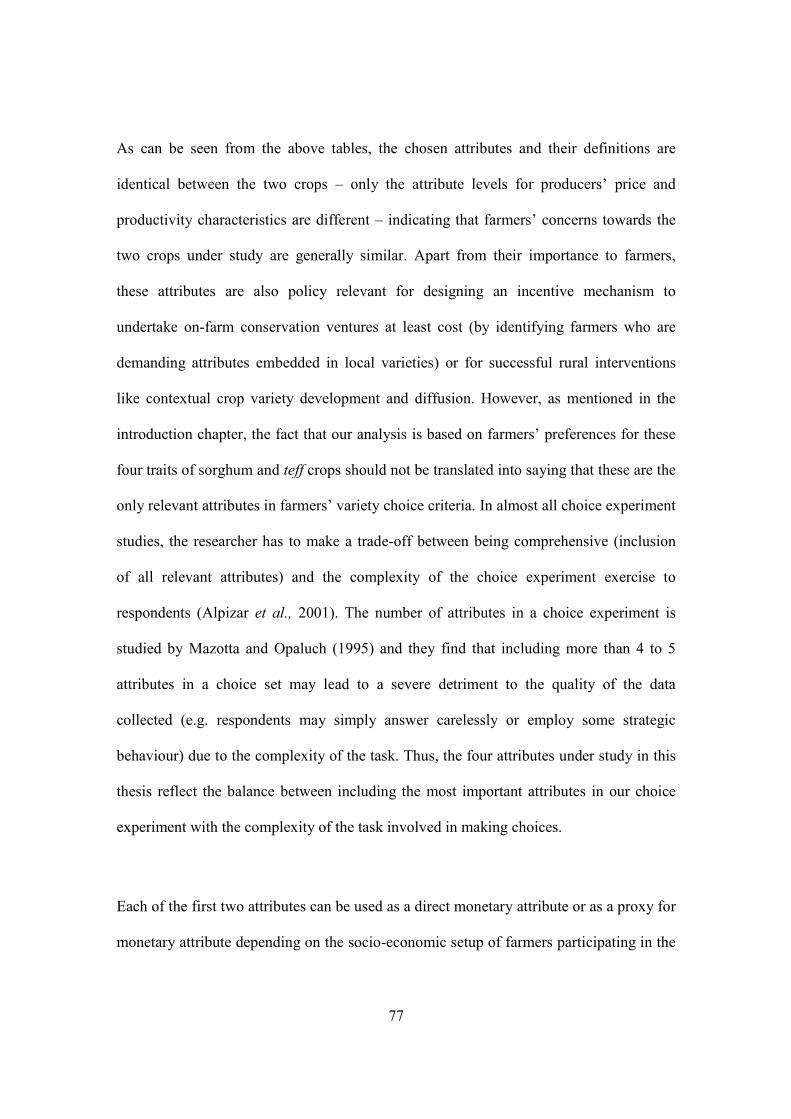
77
As can be seen from the above tables, the chosen attributes and their definitions are
identical between the two crops – only the attribute levels for producers’ price and
productivity characteristics are different – indicating that farmers’ concerns towards the
two crops under study are generally similar. Apart from their importance to farmers,
these attributes are also policy relevant for designing an incentive mechanism to
undertake on-farm conservation ventures at least cost (by identifying farmers who are
demanding attributes embedded in local varieties) or for successful rural interventions
like contextual crop variety development and diffusion. However, as mentioned in the
introduction chapter, the fact that our analysis is based on farmers’ preferences for these
four traits of sorghum and teff crops should not be translated into saying that these are the
only relevant attributes in farmers’ variety choice criteria. In almost all choice experiment
studies, the researcher has to make a trade-off between being comprehensive (inclusion
of all relevant attributes) and the complexity of the choice experiment exercise to
respondents (Alpizar et al., 2001). The number of attributes in a choice experiment is
studied by Mazotta and Opaluch (1995) and they find that including more than 4 to 5
attributes in a choice set may lead to a severe detriment to the quality of the data
collected (e.g. respondents may simply answer carelessly or employ some strategic
behaviour) due to the complexity of the task. Thus, the four attributes under study in this
thesis reflect the balance between including the most important attributes in our choice
experiment with the complexity of the task involved in making choices.
Each of the first two attributes can be used as a direct monetary attribute or as a proxy for
monetary attribute depending on the socio-economic setup of farmers participating in the
78
choice experiment survey52. That is, it would be more appropriate to use producers’ price
as direct monetary attribute for farmers actively participating in the local markets by
supplying their teff and/or sorghum produce, and productivity trait tends to be more
fitting to those farmers whose output is less than or just enough to satisfy the household
food consumption needs; hence, prohibiting them to supply part of their output to local
markets. In chapter 5 we have attempted to calculate the willingness to accept (WTA)
values for environmental adaptability and yield stability traits of both crops based on
each of the two monetary attributes (see section 5.3 and section 5.7 in chapter 5)53.
With more than 92% of the surveyed households reporting that they have faced drought
problems at least once during the last ten years, the choice of environmental adaptability
trait of both crops for our choice modelling exercise is appropriate. The same can be said
about yield stability attribute of both crops – about 90% of the surveyed households
stated that they have faced disease or pest problems (causes of yield instability in our
attribute definition) at least once during the last ten years. These attributes have two
levels representing the existence or absence of the traits in each crop (see Table 4.1 and
Table 4.2).
52 Inclusion of monetary attribute in choice surveys is necessary in order to estimate welfare changes associated with a change in non-monetary attribute (s). It also enables us to do non-market valuation: value attributes for which it is practically hard to attach monetary figures. 53 The monetary attributes represent willingness to accept (WTA) compensation, i.e. benefit rather than a cost measured by willingness to pay (WTP), since the property rights of the crops and of their outputs and functions reside with the farmers (Freeman, 2002).
79
The levels for producers’ price attribute of both crops used in our choice experiment (CE)
try to mimic the reality by representing the Zone’s minimum54, average, and maximum
prices of a quintal of sorghum or teff output during the last ten years (see Table 4.1 and
Table 4.2). These levels, whose ingredients were collected from CSA, were calculated by
first averaging prices over varieties within each crop for each year since the last ten years,
and then by computing the average, and identifying the minimum and maximum of these
values since the last ten years on a crop specific basis, which make the final results non-
specific in terms of varieties or time but specific in terms of crops considered – sorghum
or teff. Note that we had to go through these calculations because the price information at
CSA is available only in variety and time specific format for all major crops including the
crops under study.
The attribute levels for productivity attribute of both crops are selected to reflect the
Zone’s yield potential under agricultural extension and non-extension services (see Table
4.1 and Table 4.2). More than 70% of the surveyed households participate in the
agricultural extension service and both participants and non participants are likely to find
these levels realistic. In order to arrive at the actual values for these levels, we have
reviewed the Zone’s productivity register for the two crops at CSA and Ethiopian
Institute of Agricultural Research (EIAR) under extension and non-extension services.
54 For example, about 22% of the surveyed households complained of large (unacceptable) decrease in output prices at least once during the last ten years.
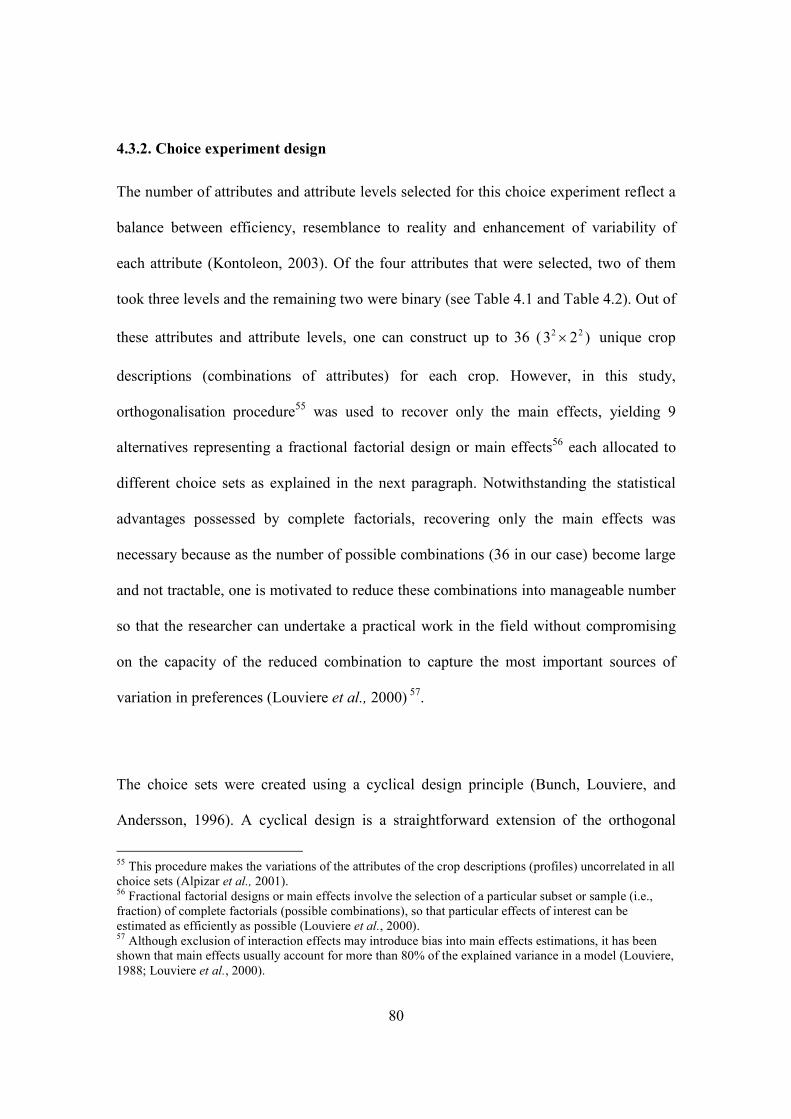
80
4.3.2. Choice experiment design
The number of attributes and attribute levels selected for this choice experiment reflect a
balance between efficiency, resemblance to reality and enhancement of variability of
each attribute (Kontoleon, 2003). Of the four attributes that were selected, two of them
took three levels and the remaining two were binary (see Table 4.1 and Table 4.2). Out of
these attributes and attribute levels, one can construct up to 36 ( )23 22 × unique crop
descriptions (combinations of attributes) for each crop. However, in this study,
orthogonalisation procedure55 was used to recover only the main effects, yielding 9
alternatives representing a fractional factorial design or main effects56 each allocated to
different choice sets as explained in the next paragraph. Notwithstanding the statistical
advantages possessed by complete factorials, recovering only the main effects was
necessary because as the number of possible combinations (36 in our case) become large
and not tractable, one is motivated to reduce these combinations into manageable number
so that the researcher can undertake a practical work in the field without compromising
on the capacity of the reduced combination to capture the most important sources of
variation in preferences (Louviere et al., 2000) 57.
The choice sets were created using a cyclical design principle (Bunch, Louviere, and
Andersson, 1996). A cyclical design is a straightforward extension of the orthogonal
55 This procedure makes the variations of the attributes of the crop descriptions (profiles) uncorrelated in all choice sets (Alpizar et al., 2001). 56 Fractional factorial designs or main effects involve the selection of a particular subset or sample (i.e., fraction) of complete factorials (possible combinations), so that particular effects of interest can be estimated as efficiently as possible (Louviere et al., 2000). 57 Although exclusion of interaction effects may introduce bias into main effects estimations, it has been shown that main effects usually account for more than 80% of the explained variance in a model (Louviere, 1988; Louviere et al., 2000).
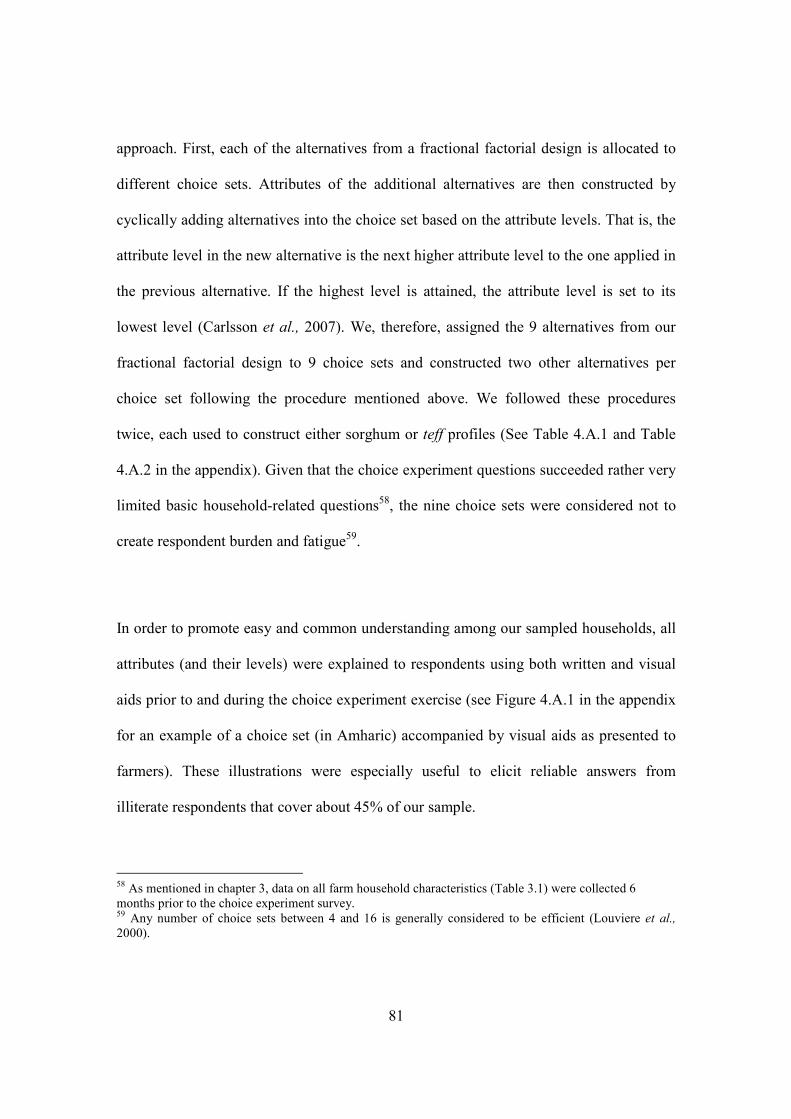
81
approach. First, each of the alternatives from a fractional factorial design is allocated to
different choice sets. Attributes of the additional alternatives are then constructed by
cyclically adding alternatives into the choice set based on the attribute levels. That is, the
attribute level in the new alternative is the next higher attribute level to the one applied in
the previous alternative. If the highest level is attained, the attribute level is set to its
lowest level (Carlsson et al., 2007). We, therefore, assigned the 9 alternatives from our
fractional factorial design to 9 choice sets and constructed two other alternatives per
choice set following the procedure mentioned above. We followed these procedures
twice, each used to construct either sorghum or teff profiles (See Table 4.A.1 and Table
4.A.2 in the appendix). Given that the choice experiment questions succeeded rather very
limited basic household-related questions58, the nine choice sets were considered not to
create respondent burden and fatigue59.
In order to promote easy and common understanding among our sampled households, all
attributes (and their levels) were explained to respondents using both written and visual
aids prior to and during the choice experiment exercise (see Figure 4.A.1 in the appendix
for an example of a choice set (in Amharic) accompanied by visual aids as presented to
farmers). These illustrations were especially useful to elicit reliable answers from
illiterate respondents that cover about 45% of our sample.
58 As mentioned in chapter 3, data on all farm household characteristics (Table 3.1) were collected 6 months prior to the choice experiment survey. 59 Any number of choice sets between 4 and 16 is generally considered to be efficient (Louviere et al., 2000).

82
The survey instrument was carefully translated to Amharic and pre-tests of the choice
experiment were conducted on 16 randomly selected farmers, eight from each of the two
research sites (PAs), who have not been selected and interviewed for the first phase of the
farm household survey. The survey approach and design of the choice experiment were
further modified following the pre-tests. An example of a choice set is presented in
Figure 4.2 below and all of the 9 choice sets per crop used in the choice experiment are
reported in Table 4.A.1 and Table 4.A.2 in the appendix.
As can be seen from the Tables in the appendix and the sample choice set in Figure 4.2, a
status quo or an opt-out option has not been included in our choice experiment design.
This is due to the several potential disadvantages to incorporating an opt-out option into
our experimental design. For example, respondents may select the opt-out option not
because it provides the highest utility among the alternatives but to avoid making difficult
decision (Huber and Pinnell, 1994) or may be used as a simple choice heuristic (Carlsson
et al., 2007). Additionally, allowing respondents to select an opt-out option provides less
information on respondents’ relative preferences for the attributes in the hypothetical
alternatives. Also, opt-out options can create econometric challenges when researchers do
not know what attribute levels are associated with the opt-out option (Bennett and
Blamey, 2001)60.
60 It is, however, noteworthy that there are also important advantages to including an opt-out option, the most important being that an opt-out option prevents a forced choice in the experiment (Bennett and Blamey, 2001). Opt-out options become even more valuable in cases when participation levels are in themselves of policy interest (see for example Birol et al., 2006b). However, in our study, almost all of the surveyed farm households (and the population they represent) have been and are likely to continue growing at least one of the two crops under study and therefore participation levels are expected to be very high.

83
Figure 4.2. Sample choice set
In order to test the effects of including or not including an opt-out on the marginal trade-
off between attribute levels, Carlsson et al. (2007) using cyclical design principle – the
same design employed in this study – created two survey versions with and without an
opt out and found that there are no differences in marginal WTPs among the specific
attributes in the study between the two versions. This recent study shows that the effects
of including (or excluding) an opt-out option in choice experiment designs can be
Assuming that the following sorghum varieties were the O:LY choices you have, which one would you
prefer to plant?
Sorghum Variety Characteristics
Sorghum
Variety 1
Sorghum
Variety 2
Sorghum
Variety 3
Producers’ price
150
200
110
Productivity
14
19
25
Environmentally Adaptable
Yes
No
Yes
Stable-in-yield
No
Yes
No
I prefer to plant Sorghum variety 1….. Sorghum variety 2…. Sorghum variety 3 ……
(Please check (√) one option)

84
empirically tested and therefore future researches in crop variety attribute preferences
may contribute to that effect.
4.3.3. Administration of the choice experiment
As mentioned in chapter 3, the choice experiment survey was conducted during June and
July of 2007, with face-to-face interviews following the farm household survey,
conducted from October 2006 to January 2007 and whose descriptive statistics are
presented in chapter 3 (Table 3.1). The sample population in each peasant association
(PA) was randomly divided into two, each sub-sample receiving one of the two versions
of the choice experiment: sorghum or teff variety choice sets.
Even though all the respondents have grown the crops under study at least in the past and
hence are all familiar with the goods that are being valued in the choice experiment, it
was crucial that respondents had a uniform understanding of each of the attributes, as
defined above. Consequently, in an introductory section, the context in which choices
were to be made was explained to all respondents, and each attribute was explained using
illustrations like in Figure 4.A.1 in the appendix. Furthermore, it was also explained to
the respondents that the key attributes of the crops had been selected as a result of prior
research and combined artificially in the choice sets. Respondents were informed that
completion of the exercise would help agricultural policy makers in the design of variety
development and local variety conservation interventions. They were told the purpose of
the exercise and the anonymity of the information to be generated so that they feel free in
their choice and responses. And finally, the respondents were reminded that there were
no right or wrong answers and that we were only interested in their opinions.
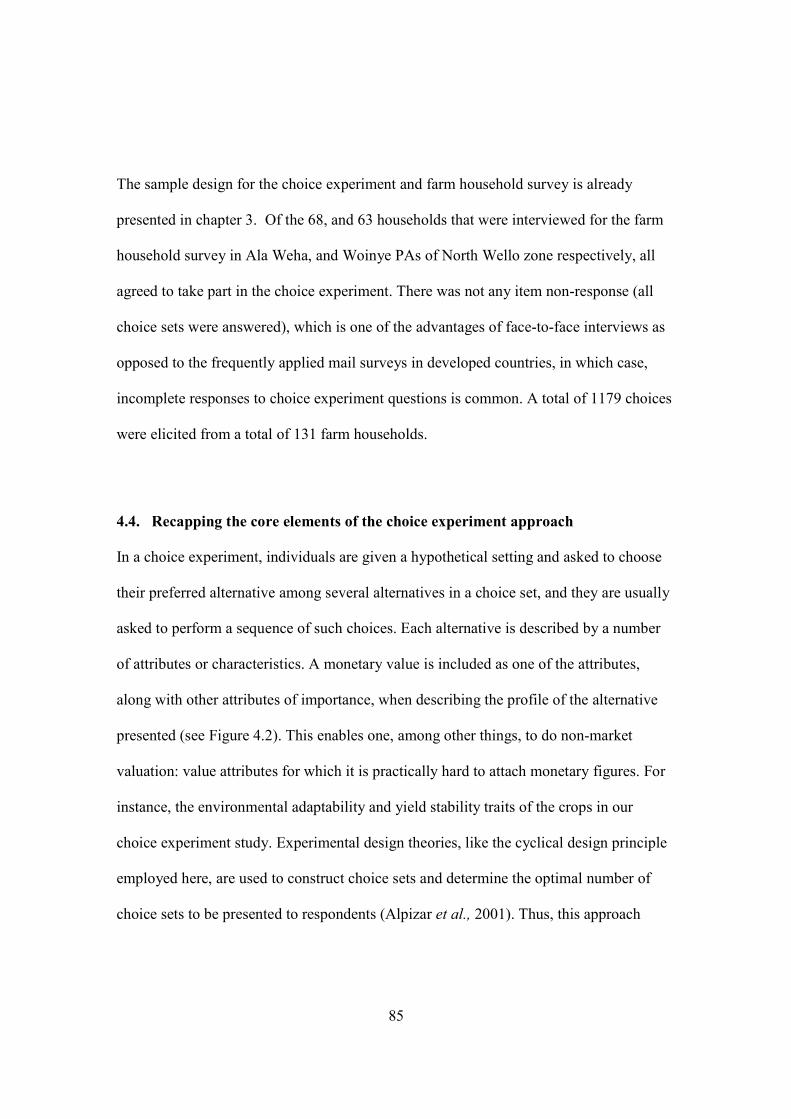
85
The sample design for the choice experiment and farm household survey is already
presented in chapter 3. Of the 68, and 63 households that were interviewed for the farm
household survey in Ala Weha, and Woinye PAs of North Wello zone respectively, all
agreed to take part in the choice experiment. There was not any item non-response (all
choice sets were answered), which is one of the advantages of face-to-face interviews as
opposed to the frequently applied mail surveys in developed countries, in which case,
incomplete responses to choice experiment questions is common. A total of 1179 choices
were elicited from a total of 131 farm households.
4.4. Recapping the core elements of the choice experiment approach
In a choice experiment, individuals are given a hypothetical setting and asked to choose
their preferred alternative among several alternatives in a choice set, and they are usually
asked to perform a sequence of such choices. Each alternative is described by a number
of attributes or characteristics. A monetary value is included as one of the attributes,
along with other attributes of importance, when describing the profile of the alternative
presented (see Figure 4.2). This enables one, among other things, to do non-market
valuation: value attributes for which it is practically hard to attach monetary figures. For
instance, the environmental adaptability and yield stability traits of the crops in our
choice experiment study. Experimental design theories, like the cyclical design principle
employed here, are used to construct choice sets and determine the optimal number of
choice sets to be presented to respondents (Alpizar et al., 2001). Thus, this approach
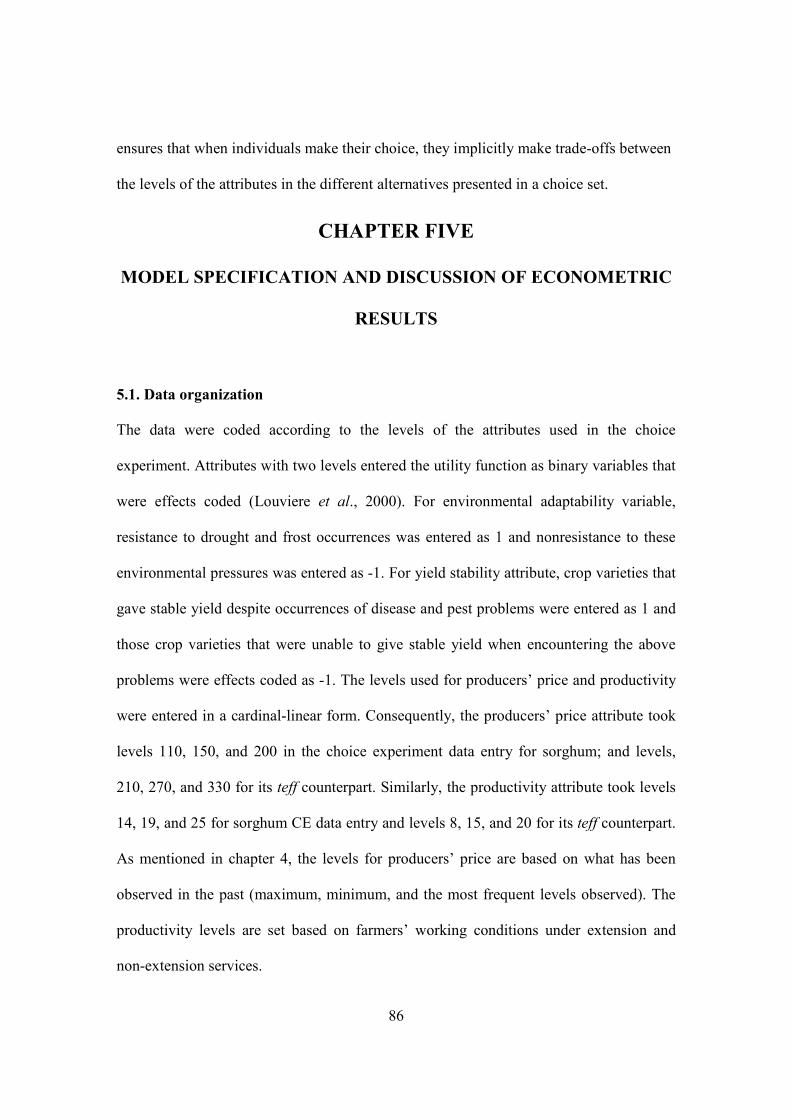
86
ensures that when individuals make their choice, they implicitly make trade-offs between
the levels of the attributes in the different alternatives presented in a choice set.
CHAPTER FIVE
MODEL SPECIFICATIO� A�D DISCUSSIO� OF ECO�OMETRIC
RESULTS
5.1. Data organization
The data were coded according to the levels of the attributes used in the choice
experiment. Attributes with two levels entered the utility function as binary variables that
were effects coded (Louviere et al., 2000). For environmental adaptability variable,
resistance to drought and frost occurrences was entered as 1 and nonresistance to these
environmental pressures was entered as -1. For yield stability attribute, crop varieties that
gave stable yield despite occurrences of disease and pest problems were entered as 1 and
those crop varieties that were unable to give stable yield when encountering the above
problems were effects coded as -1. The levels used for producers’ price and productivity
were entered in a cardinal-linear form. Consequently, the producers’ price attribute took
levels 110, 150, and 200 in the choice experiment data entry for sorghum; and levels,
210, 270, and 330 for its teff counterpart. Similarly, the productivity attribute took levels
14, 19, and 25 for sorghum CE data entry and levels 8, 15, and 20 for its teff counterpart.
As mentioned in chapter 4, the levels for producers’ price are based on what has been
observed in the past (maximum, minimum, and the most frequent levels observed). The
productivity levels are set based on farmers’ working conditions under extension and
non-extension services.
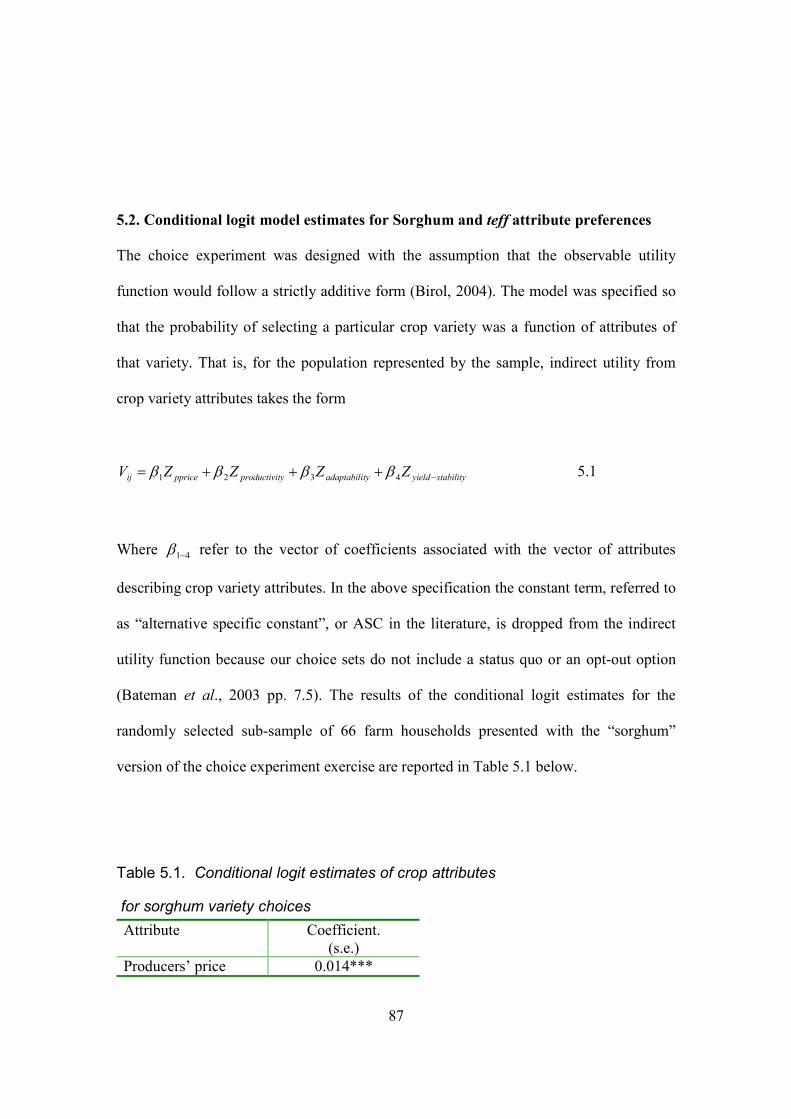
87
5.2. Conditional logit model estimates for Sorghum and teff attribute preferences
The choice experiment was designed with the assumption that the observable utility
function would follow a strictly additive form (Birol, 2004). The model was specified so
that the probability of selecting a particular crop variety was a function of attributes of
that variety. That is, for the population represented by the sample, indirect utility from
crop variety attributes takes the form
stabilityyieldtyadaptabilityproductivippriceij ZZZZV −+++= 4321 ββββ 5.1
Where 41−β refer to the vector of coefficients associated with the vector of attributes
describing crop variety attributes. In the above specification the constant term, referred to
as “alternative specific constant”, or ASC in the literature, is dropped from the indirect
utility function because our choice sets do not include a status quo or an opt-out option
(Bateman et al., 2003 pp. 7.5). The results of the conditional logit estimates for the
randomly selected sub-sample of 66 farm households presented with the “sorghum”
version of the choice experiment exercise are reported in Table 5.1 below.
Table 5.1. Conditional logit estimates of crop attributes
for sorghum variety choices
Attribute Coefficient. (s.e.)
Producers’ price 0.014***

88
Source: Own survey in collaboration with Genetic Resources Policy Initiative (GRPI) - Ethiopia project, 2006/2007. *** 1% significance level, ** 5% significance level and *10% significance level with two-tailed tests.
All of the sorghum variety attributes are highly statistically significant factors in the
choice of sorghum varieties, and have the expected signs in that any single attribute
increases the probability that a sorghum variety is selected, other attributes remaining
equal. When the producers’ price attribute is used as the normalizing variable, the most
important sorghum variety attribute for farm households is environmental adaptability
(resistance to drought and frost occurrences). This is followed by yield stability (resulting
from resistance to disease and pest problems) and productivity variables, the magnitude
of the former about four and half times more than the latter61. The overall fit of the model
as measured by McFadden’s 2ρ is very high. According to Hensher et al. (2005, pp. 338),
values of 2ρ between 0.2 and 0.4 are considered to be extremely good fits. Furthermore,
61 Note that the coefficients and standard errors for producers’ price and productivity appear lower than the other coefficients and their standard errors because actual values (110 birr, 150 birr, 200 birr) and (14Q/ha, 19 Q/ha, 25Q/ha) were used respectively. For a similar result see Birol (2004).
(0.160 210−× ) Productivity
0.169*** (0.014)
Environmental adaptability
1.064*** (0.102)
Yield stability
0.779*** (0.042)
Sample size 594
2ρ 0.414 Log likelihood -376.23
89
the high 2ρ and significance of each regressor suggest that the attributes selected for the
choice experiment survey are, by and large, what farmers considered to be among the
most important factors in sorghum variety selection.
The IIA property of this model is tested using a procedure suggested by Hausman and
McFadden (1984). This test involves constructing a likelihood ratio test around different
versions of the model where choice alternatives are excluded. If IIA holds then the model
estimated on all choices (the full choice set) should be the same as that estimated for a
sub-set of alternatives (Bateman et al., 2003). Whether or not the property of IIA is
violated in this model is tested by following the Hausman procedure available in
LIMPDEP, Version 8.0, NLOGIT 3.0 statistical analysis software. The Hausman test for
violation of the IIA assumption provided inconclusive results by failing to find a positive
definite difference matrix for any two alternatives; and this was the case for all three tests
conducted by dropping a different alternative each time. Therefore, the IIA tests
performed indicate that the model does not fully conform to the underlying IIA
conditions. Hence the model needs to be augmented either by including social and
economic characteristics as interaction terms, or by employing other models that relax the
IIA assumptions, such as random parameter logit model or both (Morey and Rossmann,
2003). Consequently, in this chapter, we separately estimated random parameter model
and conditional logit model with interaction terms, and the results are reported in Section
5.5 and 5.6, respectively.
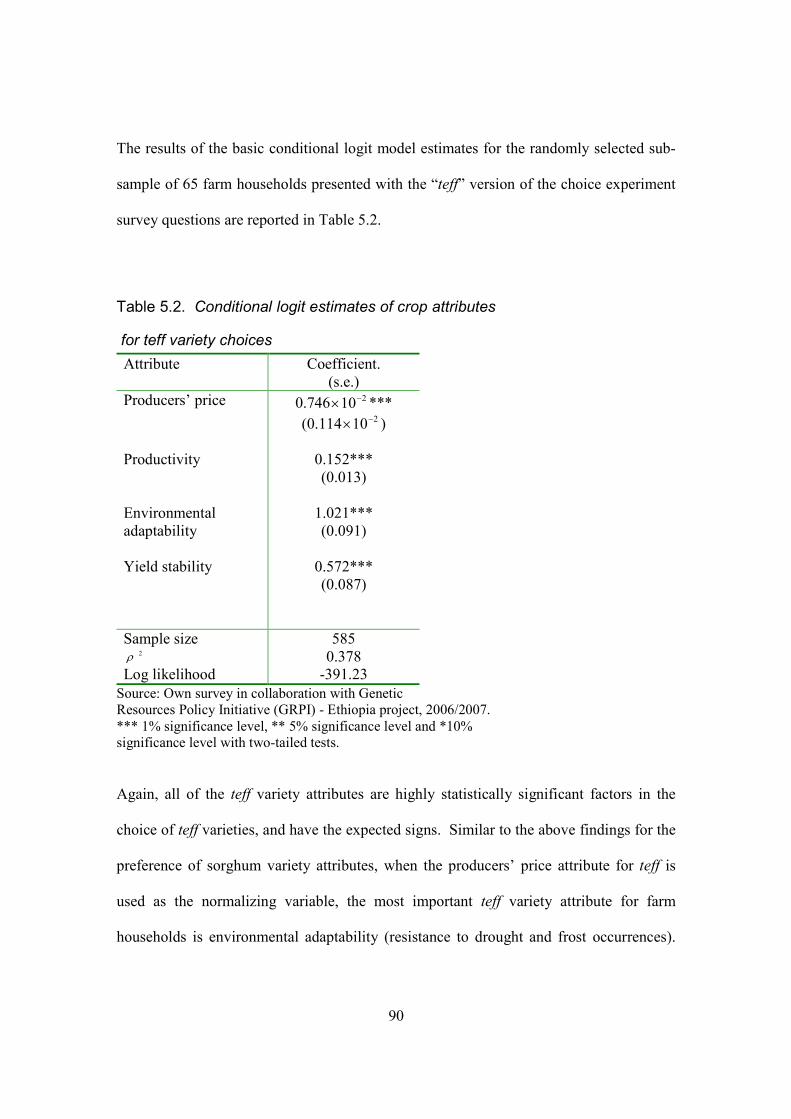
90
The results of the basic conditional logit model estimates for the randomly selected sub-
sample of 65 farm households presented with the “teff” version of the choice experiment
survey questions are reported in Table 5.2.
Table 5.2. Conditional logit estimates of crop attributes
for teff variety choices
Attribute Coefficient. (s.e.)
Producers’ price 0.746 210−× *** (0.114 210−× )
Productivity
0.152*** (0.013)
Environmental adaptability
1.021*** (0.091)
Yield stability
0.572*** (0.087)
Sample size 585
2ρ 0.378 Log likelihood -391.23
Source: Own survey in collaboration with Genetic Resources Policy Initiative (GRPI) - Ethiopia project, 2006/2007. *** 1% significance level, ** 5% significance level and *10% significance level with two-tailed tests. Again, all of the teff variety attributes are highly statistically significant factors in the
choice of teff varieties, and have the expected signs. Similar to the above findings for the
preference of sorghum variety attributes, when the producers’ price attribute for teff is
used as the normalizing variable, the most important teff variety attribute for farm
households is environmental adaptability (resistance to drought and frost occurrences).
91
This is followed by yield stability (resulting from resistance to diseases and pest
problems) and productivity variables, the magnitude of the former about four and half
times more than the latter62. The overall fit of the model as measured by McFadden’s
2ρ is 0.378, which lies between 0.2 and 0.4 suggesting that this model also qualifies for
Hensher and his coworkers’ characterization of an extremely good fit.
The Hausman and McFadden test conducted for violation of the IIA assumptions (using
LIMPDEP 8.0 NLOGIT 3.0) provided the same inconclusive results by failing to find a
positive definite difference matrix for any two alternatives. This was the case for all three
tests conducted by dropping a different alternative each time. Therefore, the IIA tests
performed indicate that neither model fully conforms to the underlying IIA conditions.
Hence, both of these models need to be augmented either by including social and
economic characteristics as interaction terms, or by employing other models like random
parameter logit model or both, as explained above.
5.3. Willingness to Accept (WTA) values for each variety attribute by crop
Comparison of attribute preferences across the two crops using the standard Swait-
Louviere log likelihood ratio test on estimates reported in Table 5.1 and Table 5.2 can not
be made because this test requires that the two sub-samples are presented with choice
experiment survey questions drawn from the same orthogonal design63. Therefore, the
62 The same explanation applies for the appearance of lower coefficients of producers’ price and productivity for teff as for their sorghum counterparts (see the previous footnote). 63 The test statistic for Swait-Louviere log likelihood ratio test is much like the usual log likelihood ratio
test distributed as 2x and is expressed as )(2 212 LLLLx −−= ,where xLL refers to the log likelihood
statistics of different conditional logit models. It’s usually computed to test whether the sum of the log-likelihoods for two different data sets differs significantly from the log-likelihood for a model estimated
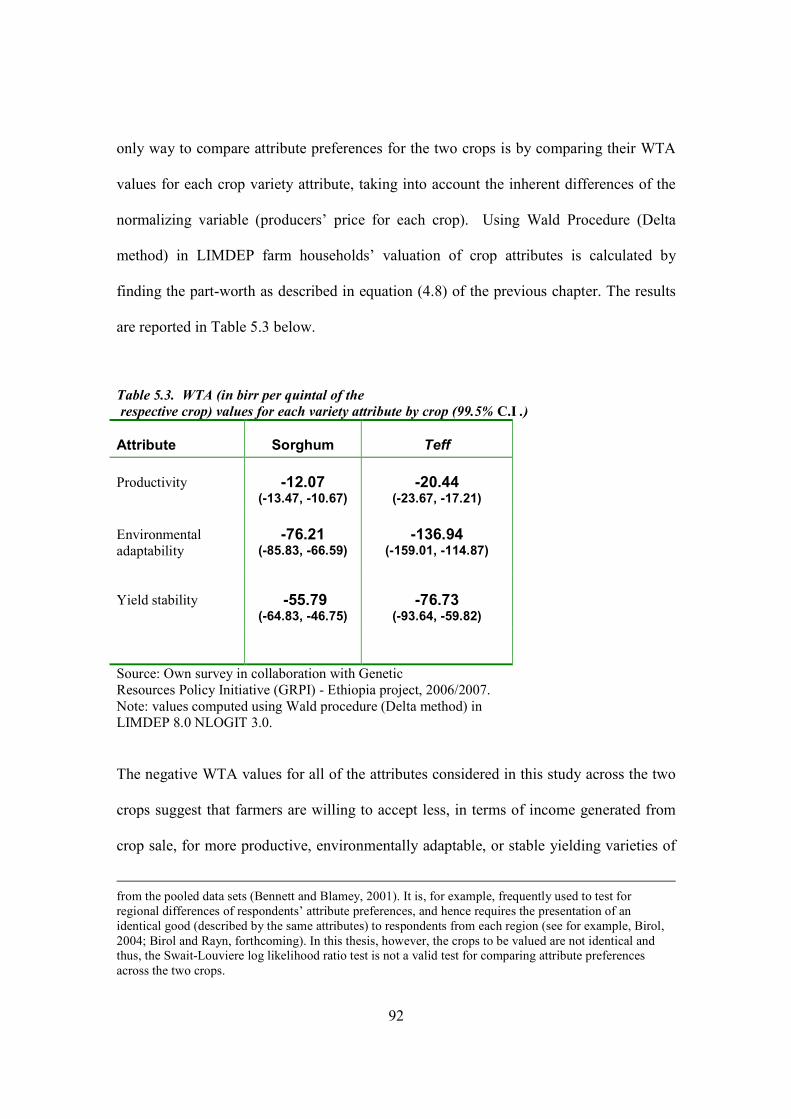
92
only way to compare attribute preferences for the two crops is by comparing their WTA
values for each crop variety attribute, taking into account the inherent differences of the
normalizing variable (producers’ price for each crop). Using Wald Procedure (Delta
method) in LIMDEP farm households’ valuation of crop attributes is calculated by
finding the part-worth as described in equation (4.8) of the previous chapter. The results
are reported in Table 5.3 below.
Table 5.3. WTA (in birr per quintal of the
respective crop) values for each variety attribute by crop (99.5% C.I .)
Attribute Sorghum Teff
Productivity -12.07
(-13.47, -10.67) -20.44
(-23.67, -17.21)
Environmental adaptability
-76.21 (-85.83, -66.59)
-136.94 (-159.01, -114.87)
Yield stability -55.79
(-64.83, -46.75) -76.73
(-93.64, -59.82)
Source: Own survey in collaboration with Genetic Resources Policy Initiative (GRPI) - Ethiopia project, 2006/2007. Note: values computed using Wald procedure (Delta method) in LIMDEP 8.0 NLOGIT 3.0. The negative WTA values for all of the attributes considered in this study across the two
crops suggest that farmers are willing to accept less, in terms of income generated from
crop sale, for more productive, environmentally adaptable, or stable yielding varieties of
from the pooled data sets (Bennett and Blamey, 2001). It is, for example, frequently used to test for regional differences of respondents’ attribute preferences, and hence requires the presentation of an identical good (described by the same attributes) to respondents from each region (see for example, Birol, 2004; Birol and Rayn, forthcoming). In this thesis, however, the crops to be valued are not identical and thus, the Swait-Louviere log likelihood ratio test is not a valid test for comparing attribute preferences across the two crops.
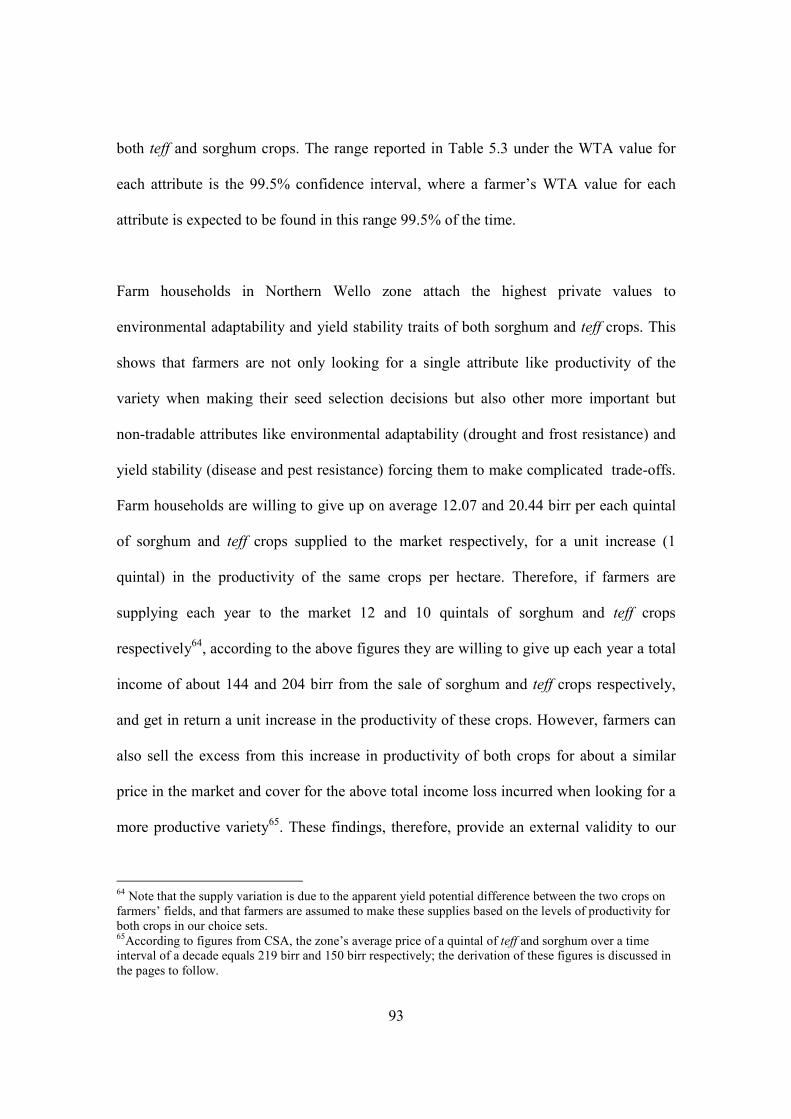
93
both teff and sorghum crops. The range reported in Table 5.3 under the WTA value for
each attribute is the 99.5% confidence interval, where a farmer’s WTA value for each
attribute is expected to be found in this range 99.5% of the time.
Farm households in Northern Wello zone attach the highest private values to
environmental adaptability and yield stability traits of both sorghum and teff crops. This
shows that farmers are not only looking for a single attribute like productivity of the
variety when making their seed selection decisions but also other more important but
non-tradable attributes like environmental adaptability (drought and frost resistance) and
yield stability (disease and pest resistance) forcing them to make complicated trade-offs.
Farm households are willing to give up on average 12.07 and 20.44 birr per each quintal
of sorghum and teff crops supplied to the market respectively, for a unit increase (1
quintal) in the productivity of the same crops per hectare. Therefore, if farmers are
supplying each year to the market 12 and 10 quintals of sorghum and teff crops
respectively64, according to the above figures they are willing to give up each year a total
income of about 144 and 204 birr from the sale of sorghum and teff crops respectively,
and get in return a unit increase in the productivity of these crops. However, farmers can
also sell the excess from this increase in productivity of both crops for about a similar
price in the market and cover for the above total income loss incurred when looking for a
more productive variety65. These findings, therefore, provide an external validity to our
64 Note that the supply variation is due to the apparent yield potential difference between the two crops on farmers’ fields, and that farmers are assumed to make these supplies based on the levels of productivity for both crops in our choice sets. 65According to figures from CSA, the zone’s average price of a quintal of teff and sorghum over a time interval of a decade equals 219 birr and 150 birr respectively; the derivation of these figures is discussed in the pages to follow.
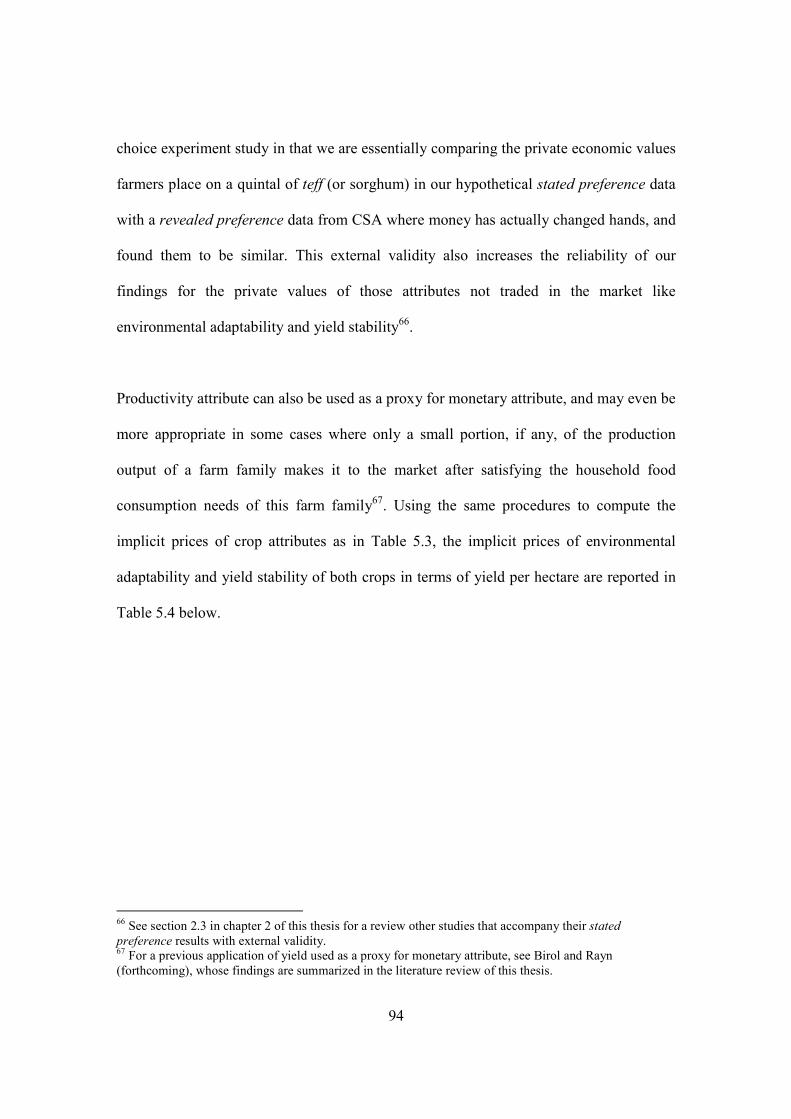
94
choice experiment study in that we are essentially comparing the private economic values
farmers place on a quintal of teff (or sorghum) in our hypothetical stated preference data
with a revealed preference data from CSA where money has actually changed hands, and
found them to be similar. This external validity also increases the reliability of our
findings for the private values of those attributes not traded in the market like
environmental adaptability and yield stability66.
Productivity attribute can also be used as a proxy for monetary attribute, and may even be
more appropriate in some cases where only a small portion, if any, of the production
output of a farm family makes it to the market after satisfying the household food
consumption needs of this farm family67. Using the same procedures to compute the
implicit prices of crop attributes as in Table 5.3, the implicit prices of environmental
adaptability and yield stability of both crops in terms of yield per hectare are reported in
Table 5.4 below.
66 See section 2.3 in chapter 2 of this thesis for a review other studies that accompany their stated
preference results with external validity. 67 For a previous application of yield used as a proxy for monetary attribute, see Birol and Rayn (forthcoming), whose findings are summarized in the literature review of this thesis.
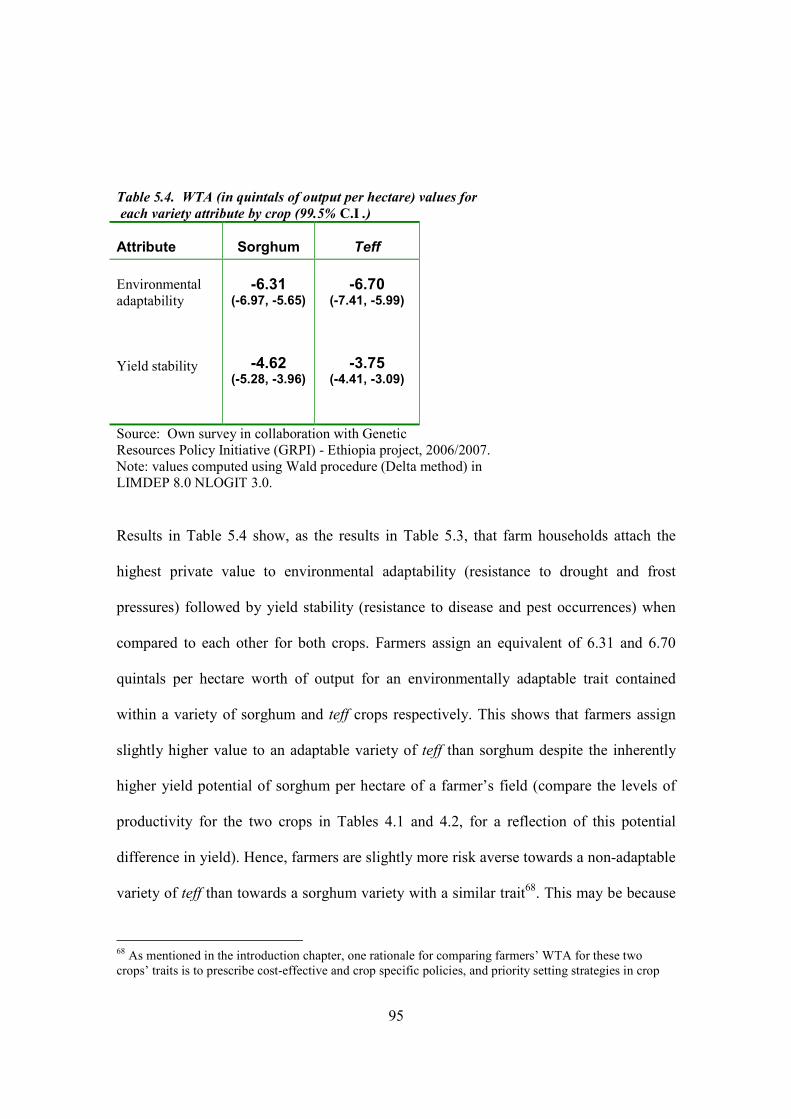
95
Table 5.4. WTA (in quintals of output per hectare) values for
each variety attribute by crop (99.5% C.I .)
Attribute Sorghum Teff
Environmental adaptability Yield stability
-6.31 (-6.97, -5.65)
-4.62 (-5.28, -3.96)
-6.70 (-7.41, -5.99)
-3.75 (-4.41, -3.09)
Source: Own survey in collaboration with Genetic Resources Policy Initiative (GRPI) - Ethiopia project, 2006/2007. Note: values computed using Wald procedure (Delta method) in LIMDEP 8.0 NLOGIT 3.0.
Results in Table 5.4 show, as the results in Table 5.3, that farm households attach the
highest private value to environmental adaptability (resistance to drought and frost
pressures) followed by yield stability (resistance to disease and pest occurrences) when
compared to each other for both crops. Farmers assign an equivalent of 6.31 and 6.70
quintals per hectare worth of output for an environmentally adaptable trait contained
within a variety of sorghum and teff crops respectively. This shows that farmers assign
slightly higher value to an adaptable variety of teff than sorghum despite the inherently
higher yield potential of sorghum per hectare of a farmer’s field (compare the levels of
productivity for the two crops in Tables 4.1 and 4.2, for a reflection of this potential
difference in yield). Hence, farmers are slightly more risk averse towards a non-adaptable
variety of teff than towards a sorghum variety with a similar trait68. This may be because
68 As mentioned in the introduction chapter, one rationale for comparing farmers’ WTA for these two crops’ traits is to prescribe cost-effective and crop specific policies, and priority setting strategies in crop
96
teff is the most important crop - among the bundle of crops being cultivated - for about
61% of the farm households surveyed. The opposite is true for yield stability though this
may be offset by higher yield potential associated with sorghum allowing farmers to pay
more (or accept less) in terms of yield per hectare for a stable yielding sorghum variety
than teff with a similar trait.
The trade-offs between productivity and adaptability, and between productivity and yield
stability i.e. the values in Table 5.4, can also be converted into monetary values by
multiplying each trade-off value with the Zone’s respective average price for a quintal of
sorghum or teff crop since the last ten years. Accordingly, in North Wello Zone, the
average price of a quintal of teff and sorghum over a time interval of a decade equals 219
birr and 150 birr respectively69. Multiplying these values with the corresponding figures
in Table 5.4, the results are reported in Table 5.5 below.
breeding programs intended to bring the most optimal results. For example, based on our results, it can be argued that if there is a limited budget to improve the environmental adaptability trait of only one of the two crops in this study, farmers in Wollo would be better off if this budget is geared towards the improvement of the attribute in teff varieties than towards the same attempt in sorghum varieties. 69 These zonal average prices, whose ingredients were collected from CSA, were calculated by first averaging prices over varieties within each crop for each year since the last ten years, and then by computing the average of these values since the last ten years on a crop specific basis, essentially making the final results non-specific in terms of varieties or time but specific in terms of crops considered - sorghum and teff. Note that we had to go through these calculations because the price information at CSA is available only in variety and time specific format for all major crops including sorghum and teff. The same procedures were also followed to set the levels for producers’ price attribute of sorghum and teff crops (for a further discussion of this levels see chapter 4).
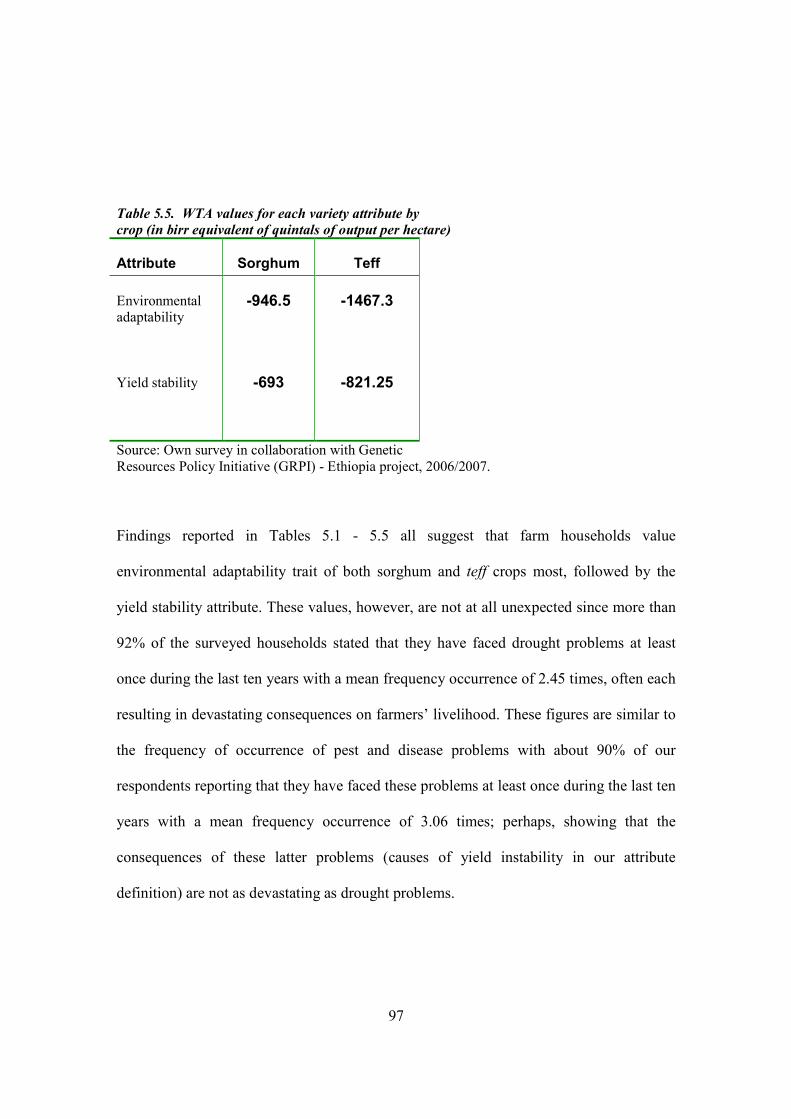
97
Table 5.5. WTA values for each variety attribute by
crop (in birr equivalent of quintals of output per hectare)
Attribute Sorghum Teff
Environmental adaptability Yield stability
-946.5
-693
-1467.3
-821.25
Source: Own survey in collaboration with Genetic Resources Policy Initiative (GRPI) - Ethiopia project, 2006/2007.
Findings reported in Tables 5.1 - 5.5 all suggest that farm households value
environmental adaptability trait of both sorghum and teff crops most, followed by the
yield stability attribute. These values, however, are not at all unexpected since more than
92% of the surveyed households stated that they have faced drought problems at least
once during the last ten years with a mean frequency occurrence of 2.45 times, often each
resulting in devastating consequences on farmers’ livelihood. These figures are similar to
the frequency of occurrence of pest and disease problems with about 90% of our
respondents reporting that they have faced these problems at least once during the last ten
years with a mean frequency occurrence of 3.06 times; perhaps, showing that the
consequences of these latter problems (causes of yield instability in our attribute
definition) are not as devastating as drought problems.
98
Overall, our regression and descriptive analysis results suggest that farmers in the two
Kebeles are extremely risk averse by opting for more environmentally adaptable and
stable yielding varieties at a significant cost to yield and/or income generated from crop
sale. These findings are similar to the results from Carlsson et al. (2005), where the study
found that Ethiopian farmers exhibit an extremely risk averse behaviour in their farm
technology adoption decisions by seeking for insurance against crop failure in their credit
repayment requirements. The current study’s findings are also closely associated with
results from Edilegnaw (2004), where coffee farmers’ survival first strategy plays a major
role in their coffee variety attribute selection criteria70.
5.4. Accounting for preference heterogeneity
Basic conditional logit model assumes homogeneous preferences across farm
households presented with each version of the choice experiment questions (Birol,
2004). However, preferences across households are in fact heterogeneous and
accounting for this heterogeneity enables estimation of unbiased estimates of
individual preferences and enhances the accuracy and reliability of estimates of
demand, participation, marginal and total welfare (Greene, 2000). Furthermore,
accounting for heterogeneity enables prescription of policies that take equity
concerns into account. An understanding of who will be affected by a policy change
in addition to understanding the aggregate economic value associated with such
changes is necessary (Adamowicz and Boxall, 2001). Determination of individual
heterogeneity is also of particular relevance when knowledge of population segments
70 For a more detailed overview of the two cited studies in this paragraph, one can refer to the literature review chapter of this thesis.
99
is crucial for assessment of existence and nature of niche consumers or producers
(Kontoleon, 2003).
One way of accounting for preference heterogeneity is by separating the
respondents into various groups (segments) and by estimating the demand function
for each group separately (Kontoleon, 2003). A second way of accounting for
preference heterogeneity is by using household and decision-maker level contextual
characteristics directly as interaction terms (Birol, 2004). Interaction of individual-
specific social and economic characteristics with choice specific attributes or with
ASC (alternative specific constant) of the indirect utility function is a common
solution to dealing with the heterogeneity problem as well as with violations of the
IIA (see for example Rolfe et al., 2000; Birol, 2004; Birol and Rayn, forthcoming).
The main problem with this method is multicollinearity, which occurs when too
many interactions are included in the estimation; hence, the model needs to be
tested down, using the higher log-likelihood criteria (Breffle and Morey, 2000).
An alternative method to accounting for preference heterogeneity is the use of
random parameter logit model. �ext section explains this model in greater detail
and reports the random parameter logit estimates for each version of the choice
experiment questions. Section 5.6 investigates the effects of household and decision-
maker level characteristics on farm households’ demand for variety attributes for
each crop.
100
5.5. Random parameter logit model
Even though segment analysis and use of social and economic characteristics help to
recognise conditional heterogeneity, these methods do not detect for unobserved
heterogeneity. It has been demonstrated that heterogeneity can be present in
significant residual form even when conditional heterogeneity is accounted for
(Garrod et al., 2002). Unobserved heterogeneity in preferences across respondents
can be accounted for by using the random parameter logit model, which, unlike
conditional logit is not based on the IIA assumption.
The random utility function in the random parameter logit model is given by
ijijijijij eZVU ++≡+= )( ηβε (5.2)
where respondent i receives utility U from choosing alternative j from choice set C.
Like the case of conditional logit model, utility is decomposed into a non-random
component (V) and a stochastic term (e). Indirect utility is assumed to be a function
of the choice attributes Z (as well as of social and economic characteristics S, if
included in the model) with parameters β , which due to preference heterogeneity
may vary across respondents by a random component iη . By specifying the
distribution of the error terms e and η , the probability of choosing j in each of the
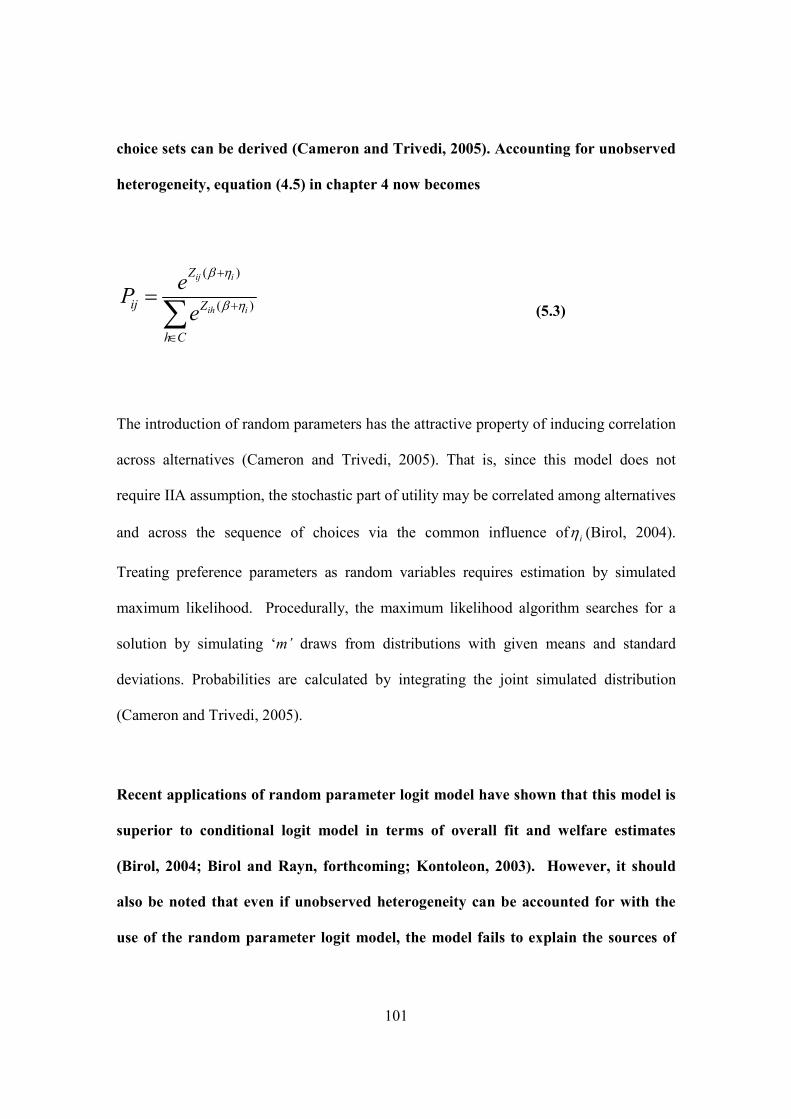
101
choice sets can be derived (Cameron and Trivedi, 2005). Accounting for unobserved
heterogeneity, equation (4.5) in chapter 4 now becomes
∑∈
+
+
=
Ch
Z
Z
ijiih
iij
e
eP )(
)(
ηβ
ηβ
(5.3)
The introduction of random parameters has the attractive property of inducing correlation
across alternatives (Cameron and Trivedi, 2005). That is, since this model does not
require IIA assumption, the stochastic part of utility may be correlated among alternatives
and across the sequence of choices via the common influence of iη (Birol, 2004).
Treating preference parameters as random variables requires estimation by simulated
maximum likelihood. Procedurally, the maximum likelihood algorithm searches for a
solution by simulating ‘m’ draws from distributions with given means and standard
deviations. Probabilities are calculated by integrating the joint simulated distribution
(Cameron and Trivedi, 2005).
Recent applications of random parameter logit model have shown that this model is
superior to conditional logit model in terms of overall fit and welfare estimates
(Birol, 2004; Birol and Rayn, forthcoming; Kontoleon, 2003). However, it should
also be noted that even if unobserved heterogeneity can be accounted for with the
use of the random parameter logit model, the model fails to explain the sources of
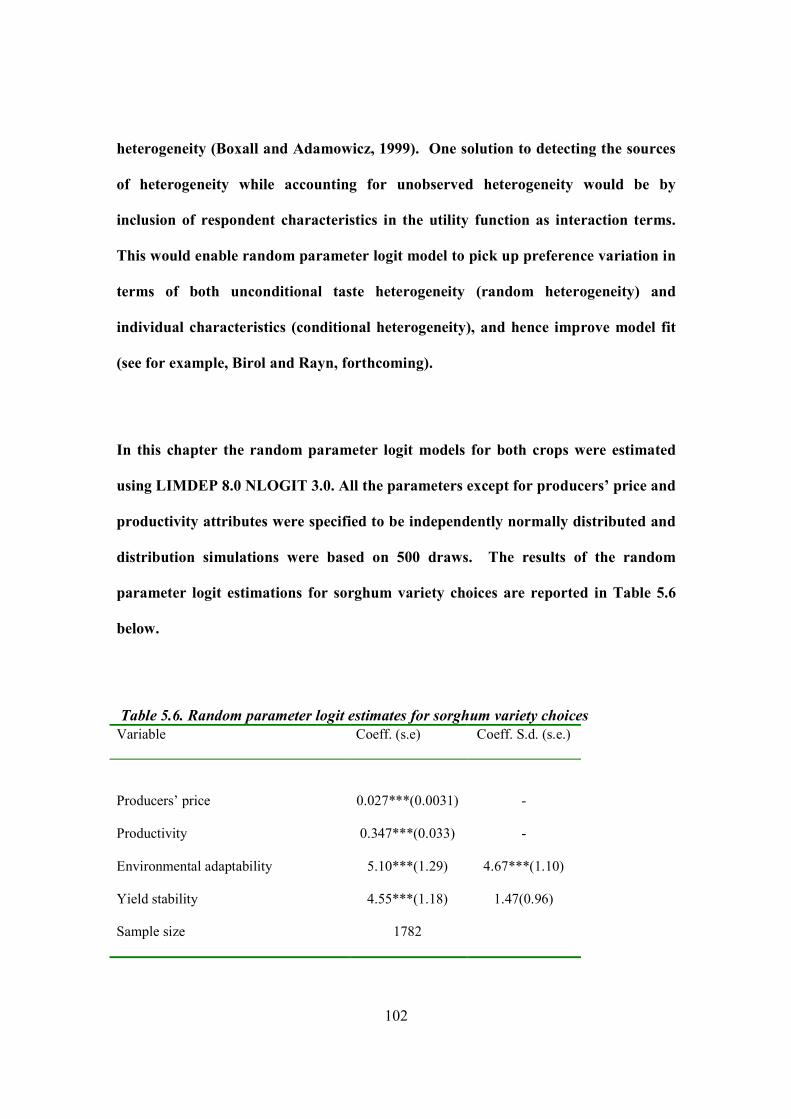
102
heterogeneity (Boxall and Adamowicz, 1999). One solution to detecting the sources
of heterogeneity while accounting for unobserved heterogeneity would be by
inclusion of respondent characteristics in the utility function as interaction terms.
This would enable random parameter logit model to pick up preference variation in
terms of both unconditional taste heterogeneity (random heterogeneity) and
individual characteristics (conditional heterogeneity), and hence improve model fit
(see for example, Birol and Rayn, forthcoming).
In this chapter the random parameter logit models for both crops were estimated
using LIMDEP 8.0 �LOGIT 3.0. All the parameters except for producers’ price and
productivity attributes were specified to be independently normally distributed and
distribution simulations were based on 500 draws. The results of the random
parameter logit estimations for sorghum variety choices are reported in Table 5.6
below.
Table 5.6. Random parameter logit estimates for sorghum variety choices
Variable Coeff. (s.e) Coeff. S.d. (s.e.)
Producers’ price 0.027***(0.0031) -
Productivity 0.347***(0.033) -
Environmental adaptability 5.10***(1.29) 4.67***(1.10)
Yield stability 4.55***(1.18) 1.47(0.96)
Sample size 1782
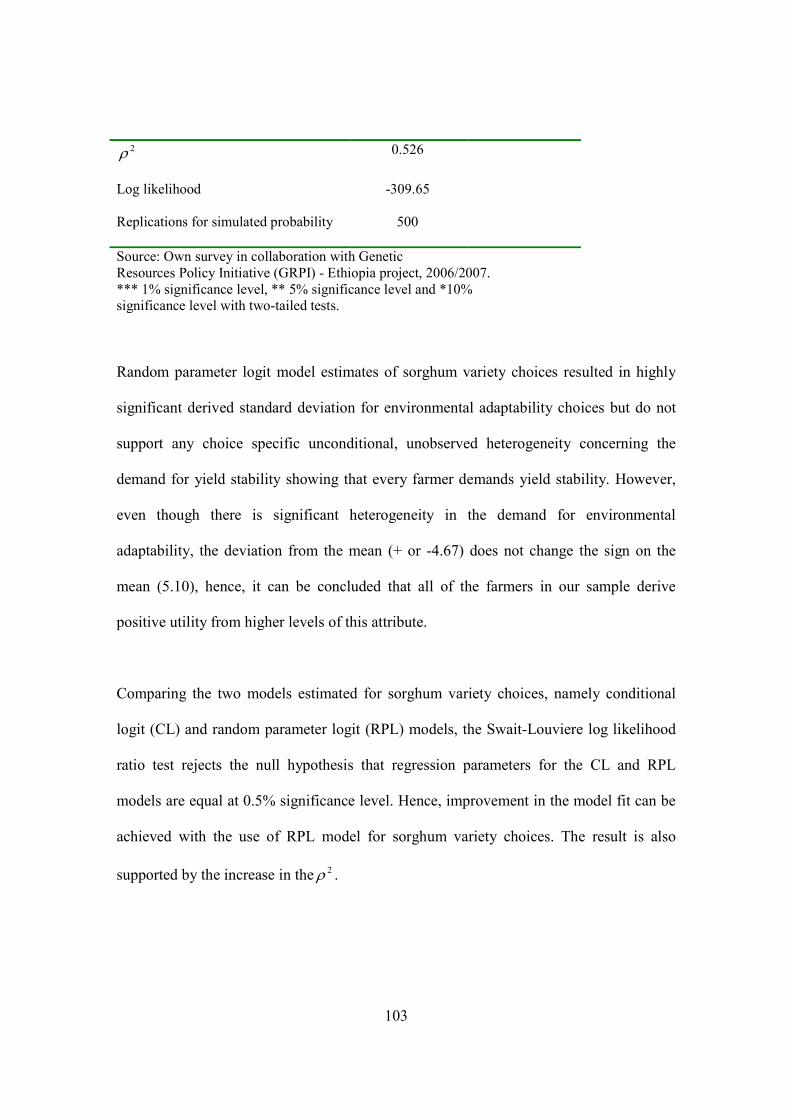
103
2ρ 0.526
Log likelihood
Replications for simulated probability
-309.65
500
Source: Own survey in collaboration with Genetic Resources Policy Initiative (GRPI) - Ethiopia project, 2006/2007. *** 1% significance level, ** 5% significance level and *10% significance level with two-tailed tests. Random parameter logit model estimates of sorghum variety choices resulted in highly
significant derived standard deviation for environmental adaptability choices but do not
support any choice specific unconditional, unobserved heterogeneity concerning the
demand for yield stability showing that every farmer demands yield stability. However,
even though there is significant heterogeneity in the demand for environmental
adaptability, the deviation from the mean (+ or -4.67) does not change the sign on the
mean (5.10), hence, it can be concluded that all of the farmers in our sample derive
positive utility from higher levels of this attribute.
Comparing the two models estimated for sorghum variety choices, namely conditional
logit (CL) and random parameter logit (RPL) models, the Swait-Louviere log likelihood
ratio test rejects the null hypothesis that regression parameters for the CL and RPL
models are equal at 0.5% significance level. Hence, improvement in the model fit can be
achieved with the use of RPL model for sorghum variety choices. The result is also
supported by the increase in the 2ρ .
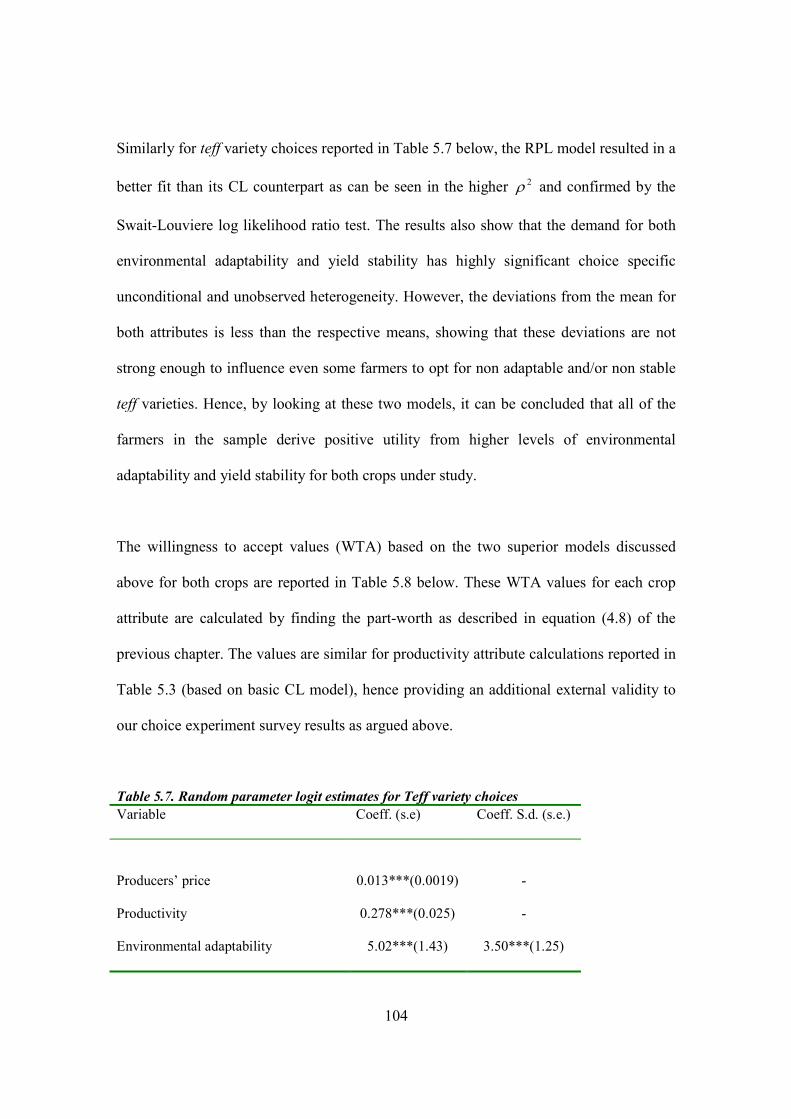
104
Similarly for teff variety choices reported in Table 5.7 below, the RPL model resulted in a
better fit than its CL counterpart as can be seen in the higher 2ρ and confirmed by the
Swait-Louviere log likelihood ratio test. The results also show that the demand for both
environmental adaptability and yield stability has highly significant choice specific
unconditional and unobserved heterogeneity. However, the deviations from the mean for
both attributes is less than the respective means, showing that these deviations are not
strong enough to influence even some farmers to opt for non adaptable and/or non stable
teff varieties. Hence, by looking at these two models, it can be concluded that all of the
farmers in the sample derive positive utility from higher levels of environmental
adaptability and yield stability for both crops under study.
The willingness to accept values (WTA) based on the two superior models discussed
above for both crops are reported in Table 5.8 below. These WTA values for each crop
attribute are calculated by finding the part-worth as described in equation (4.8) of the
previous chapter. The values are similar for productivity attribute calculations reported in
Table 5.3 (based on basic CL model), hence providing an additional external validity to
our choice experiment survey results as argued above.
Table 5.7. Random parameter logit estimates for Teff variety choices
Variable Coeff. (s.e) Coeff. S.d. (s.e.)
Producers’ price 0.013***(0.0019) -
Productivity 0.278***(0.025) -
Environmental adaptability 5.02***(1.43) 3.50***(1.25)
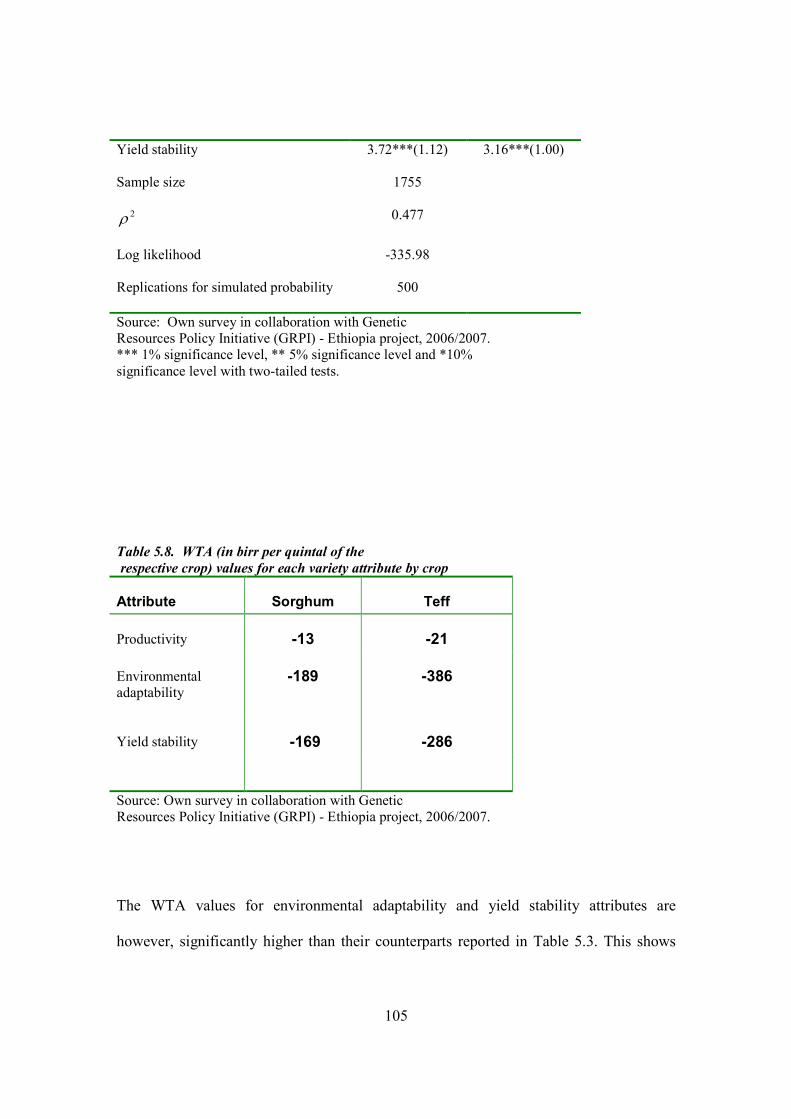
105
Yield stability 3.72***(1.12) 3.16***(1.00)
Sample size 1755
2ρ 0.477
Log likelihood
Replications for simulated probability
-335.98
500
Source: Own survey in collaboration with Genetic Resources Policy Initiative (GRPI) - Ethiopia project, 2006/2007. *** 1% significance level, ** 5% significance level and *10% significance level with two-tailed tests.
Table 5.8. WTA (in birr per quintal of the
respective crop) values for each variety attribute by crop
Attribute Sorghum Teff
Productivity -13 -21
Environmental adaptability
-189 -386
Yield stability -169 -286
Source: Own survey in collaboration with Genetic Resources Policy Initiative (GRPI) - Ethiopia project, 2006/2007.
The WTA values for environmental adaptability and yield stability attributes are
however, significantly higher than their counterparts reported in Table 5.3. This shows

106
that farm households in North Wello zone are extremely risk averse by opting for more
adaptable and/or stable varieties of crops at a much greater cost to income generated from
sorghum and teff sale. Notwithstanding the differences in these results, farm households
still prefer environmental adaptability (resistance to drought and frost pressures) trait
over both yield stability (resistance to disease and pest occurrences) and productivity
traits for both crops. Therefore, if crop varieties were to have only one attribute
(environmental adaptability), the probability that farmers will select these varieties is
greater than the probability of them selecting either stable yielding or more productive
varieties of either sorghum or teff.
The WTA values based on the above two superior models for both crops and with
productivity attribute taken as a proxy for monetary attribute is reported in Table 5.A.1 of
the appendix. These results also show that farmers are more risk averse towards a non-
adaptable variety of teff than towards a sorghum variety with a similar trait supporting
our results in Table 5.4. The results are also similar for yield stability trait of both crops,
where farmers are willing to accept almost equal values, in terms of quintals of output per
hectare, sacrificed to get stable- in-yield varieties of both crops.
5.6. Conditional logit model accounting for preference heterogeneity
To account for heterogeneity of preferences across farm households the effects of farm
household, household head, farm level, and development integration characteristics on
farm households’ demand for crop varieties and crop variety attributes must be
investigated. As already mentioned in chapter 4 (equation 4.6), in random utility models
107
the effects of social and economic characteristics on choice cannot be examined in
isolation but as interaction terms with choice attributes. Due to possible multicollinearity
problems, it is not possible to include all the interactions between the explanatory
variables collected in our survey (See Table 3.1 in chapter 3) and the four crop variety
attributes when estimating the conditional logit models (Breffle and Morey, 2000).
To address this limitation, independent variables were eliminated based on Variance
Inflation Factors (VIF), which were calculated by running “artificial” ordinary least
squares regressions between each independent variable (i.e. farm household, household
head, farm level, and development integration characteristics) as the “dependent” variable
and the remaining independent variables71. Those independent variables for which VIFj
>5 indicate clear evidence that the estimation of the characteristic is being affected by
multicollinearity (Maddala, 2000). Our VIF values suggest that our data is not suffering
from multicollinearity problems for all potential explanatory variables reported in chapter
3 except age, and Access2 (the average of walking time needed (in minutes) to reach the
agricultural extension center, the nearest dry weather road and market) variables, which
were subsequently removed from our model estimations.
The next step we took before reporting our CL with interactions results in Table 5.10 and
Table 5.11 was to “test down” our interaction terms by eliminating those interactions that
71 Variance Inflation Factors (VIFj) for each such regression are calculated as:
21
1
j
jR
VIF−
= , where Rj2
is the R2 of the artificial regression with the jth independent variable as a “dependent” variable.

108
are insignificant starting from the most insignificant one (as revealed by the P-values)
and then removing them one by one until we are left with significant interactions only72.
Eleven independent variables remained:
1) gender of the household head (denoted as Sex, where a value of 1 is for male)
2) the number of household members who share the same food stock (denoted as
Household size)
3) experience of the household head in years (denoted as Experience)
4) whether or not any member of the farm household works off-farm (denoted as
Off-farm work)
5) whether or not the farm household has been participating in the agricultural
extension package program (denoted as Agri. Ext Participation)
6) average of walking distance (in minutes) the household head takes to reach
electricity, piped water, telephone, primary school, secondary school, all weather
roads, and irrigation infrastructures (denoted as Access services)73
7) whether or not the household head considers land shortage as the primary problem
the household faces (denoted as Land shortage)
8) total land size operated by the household in hectares (denoted as Total land size)
9) total value of livestock, in birr, that is currently owned by the household (denoted
as Livestock value)
72 Note that the CL model was re-estimated each time an interaction term was eliminated and that only those interactions that are significant at 10% level or less are reported in Table 5.10 and 5.11. 73 Respondents were asked to specify the walking distance (in minutes) for each type of infrastructure and then an average walking distance (in minutes) was calculated for each household.
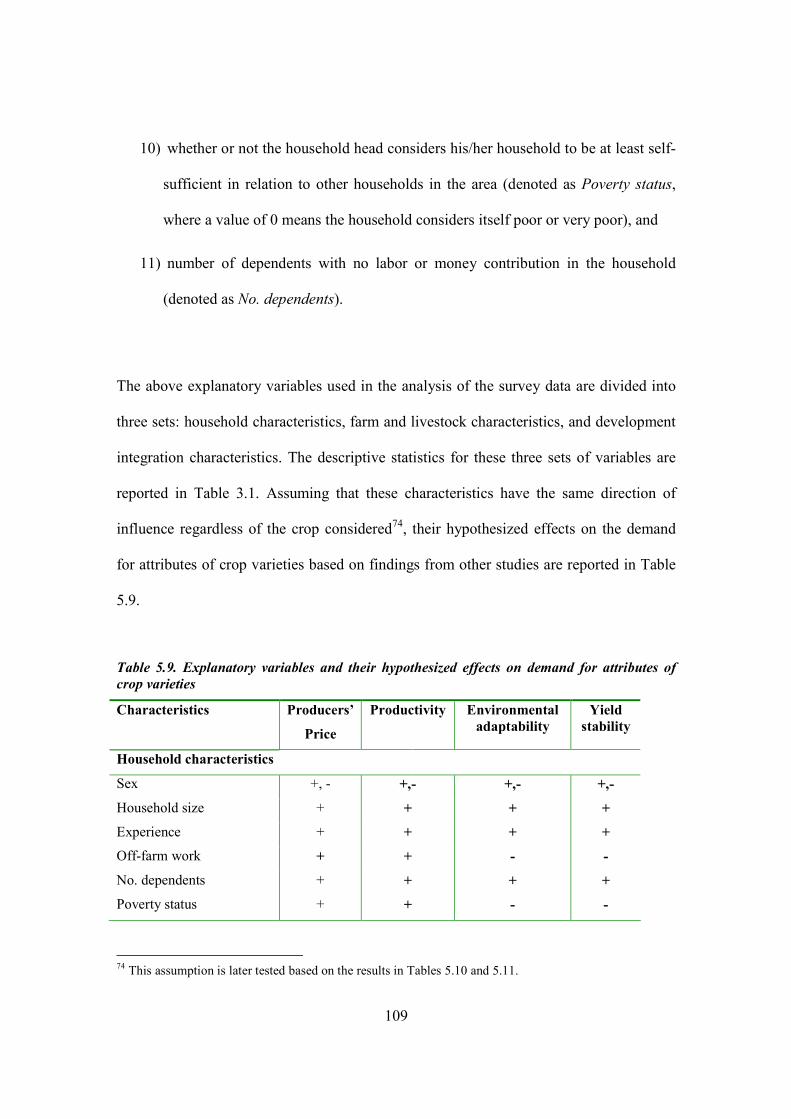
109
10) whether or not the household head considers his/her household to be at least self-
sufficient in relation to other households in the area (denoted as Poverty status,
where a value of 0 means the household considers itself poor or very poor), and
11) number of dependents with no labor or money contribution in the household
(denoted as :o. dependents).
The above explanatory variables used in the analysis of the survey data are divided into
three sets: household characteristics, farm and livestock characteristics, and development
integration characteristics. The descriptive statistics for these three sets of variables are
reported in Table 3.1. Assuming that these characteristics have the same direction of
influence regardless of the crop considered74, their hypothesized effects on the demand
for attributes of crop varieties based on findings from other studies are reported in Table
5.9.
Table 5.9. Explanatory variables and their hypothesized effects on demand for attributes of
crop varieties
Characteristics Producers’
Price
Productivity Environmental
adaptability
Yield
stability
Household characteristics
Sex +, - +,- +,- +,-
Household size + + + +
Experience + + + +
Off-farm work + + - -
No. dependents
Poverty status
+
+
+
+
+
-
+
-
74 This assumption is later tested based on the results in Tables 5.10 and 5.11.
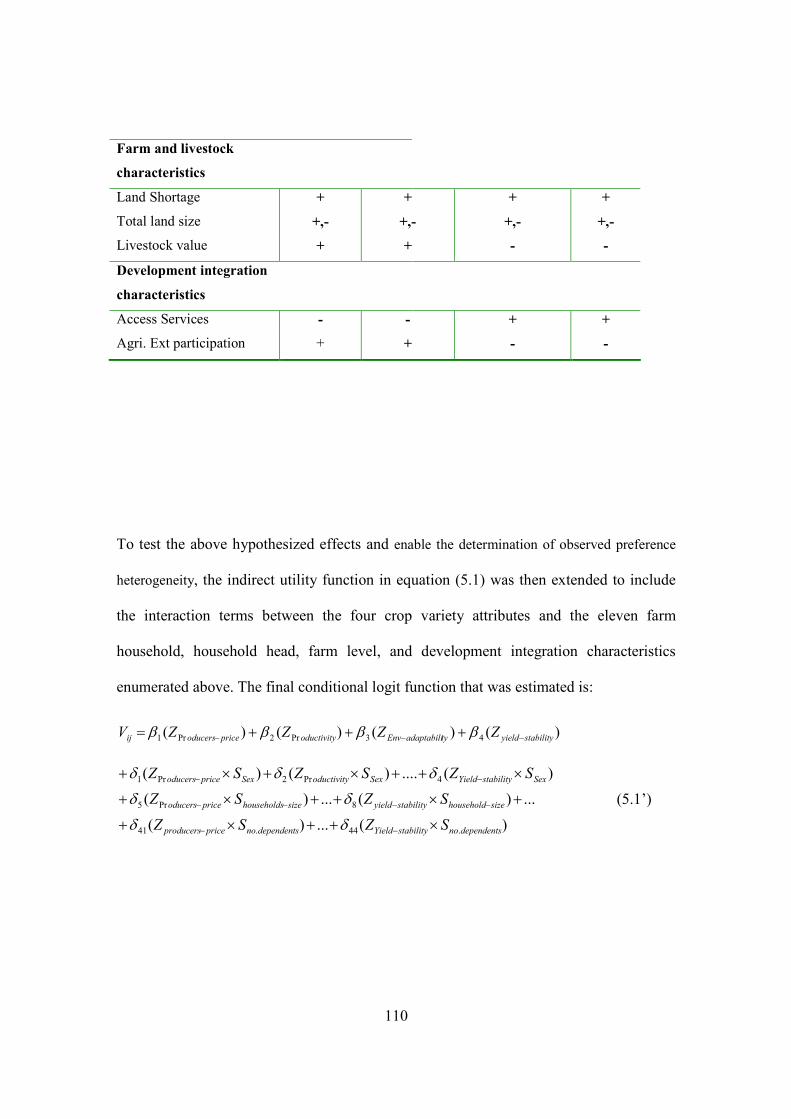
110
Farm and livestock
characteristics
Land Shortage + + + +
Total land size +,- +,- +,- +,-
Livestock value + + - -
Development integration
characteristics
Access Services - - + +
Agri. Ext participation + + - -
To test the above hypothesized effects and enable the determination of observed preference
heterogeneity, the indirect utility function in equation (5.1) was then extended to include
the interaction terms between the four crop variety attributes and the eleven farm
household, household head, farm level, and development integration characteristics
enumerated above. The final conditional logit function that was estimated is:
)()()()( 43Pr2Pr1 stabilityyieldtyadaptabiliEnvoductivitypriceoducersij ZZZZV −−− +++= ββββ
)(...)(
...)(...)(
)(....)()(
.44.41
8Pr5
4Pr2Pr1
dependentsnostabilityYielddependentsnopriceproducers
sizehouseholdstabilityyieldsizehouseholdspriceoducers
SexstabilityYieldSexoductivitySexpriceoducers
SZSZ
SZSZ
SZSZSZ
×++×+
+×++×+
×++×+×+
−−
−−−−
−−
δδ
δδ
δδδ
(5.1’)
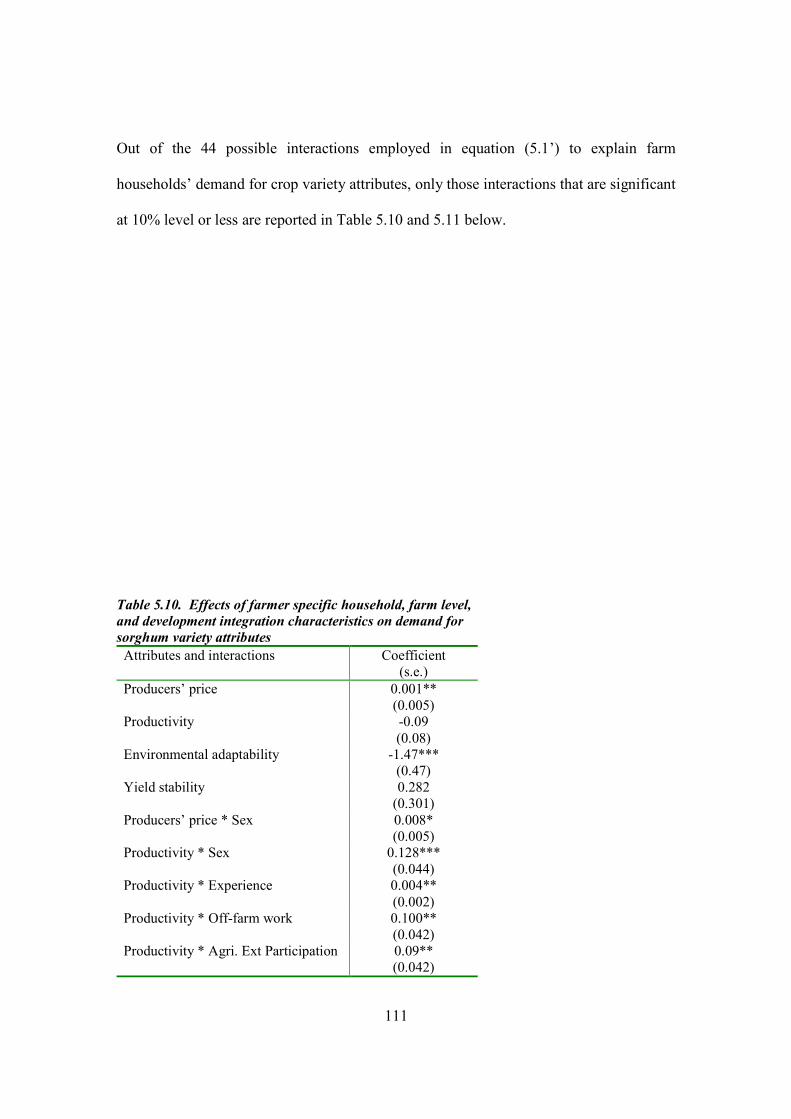
111
Out of the 44 possible interactions employed in equation (5.1’) to explain farm
households’ demand for crop variety attributes, only those interactions that are significant
at 10% level or less are reported in Table 5.10 and 5.11 below.
Table 5.10. Effects of farmer specific household, farm level,
and development integration characteristics on demand for
sorghum variety attributes
Attributes and interactions Coefficient (s.e.)
Producers’ price 0.001** (0.005)
Productivity -0.09 (0.08)
Environmental adaptability -1.47*** (0.47)
Yield stability 0.282 (0.301)
Producers’ price * Sex 0.008* (0.005)
Productivity * Sex 0.128*** (0.044)
Productivity * Experience 0.004** (0.002)
Productivity * Off-farm work 0.100** (0.042)
Productivity * Agri. Ext Participation 0.09** (0.042)
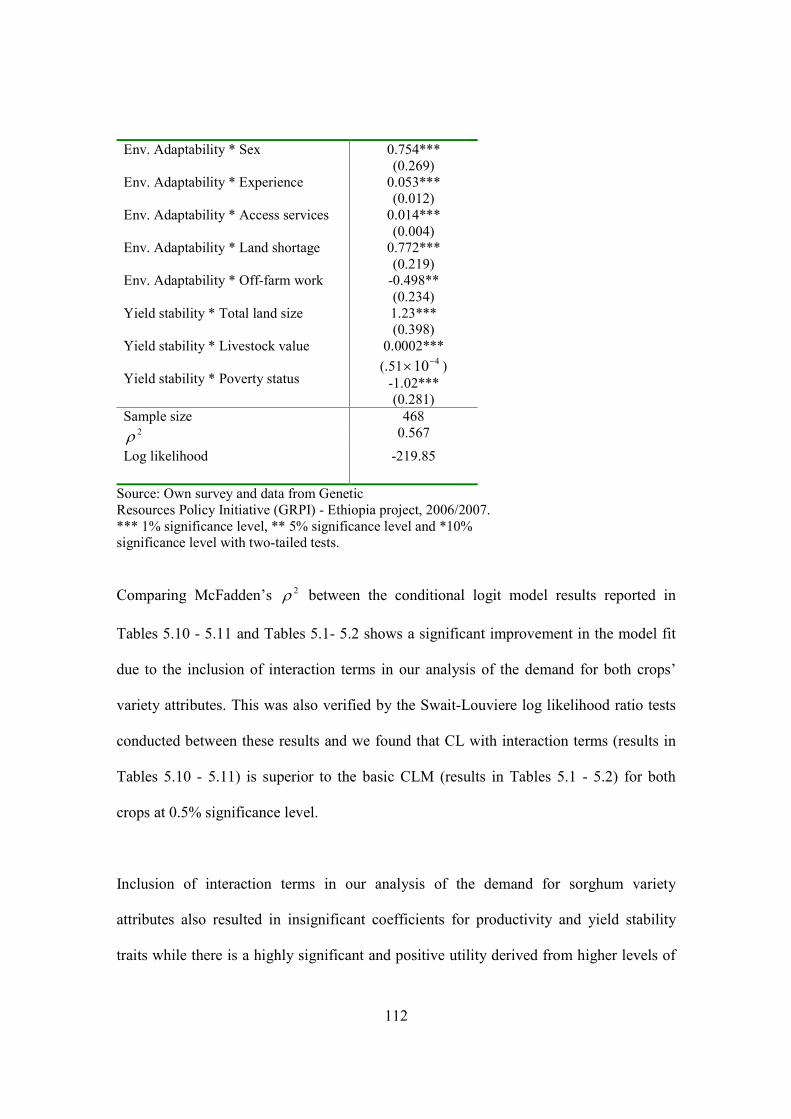
112
Env. Adaptability * Sex Env. Adaptability * Experience Env. Adaptability * Access services Env. Adaptability * Land shortage Env. Adaptability * Off-farm work Yield stability * Total land size Yield stability * Livestock value Yield stability * Poverty status
0.754*** (0.269)
0.053*** (0.012)
0.014*** (0.004)
0.772*** (0.219)
-0.498** (0.234) 1.23*** (0.398)
0.0002***
(.51 410−× ) -1.02*** (0.281)
Sample size 468 2ρ 0.567
Log likelihood -219.85
Source: Own survey and data from Genetic Resources Policy Initiative (GRPI) - Ethiopia project, 2006/2007. *** 1% significance level, ** 5% significance level and *10% significance level with two-tailed tests. Comparing McFadden’s 2ρ between the conditional logit model results reported in
Tables 5.10 - 5.11 and Tables 5.1- 5.2 shows a significant improvement in the model fit
due to the inclusion of interaction terms in our analysis of the demand for both crops’
variety attributes. This was also verified by the Swait-Louviere log likelihood ratio tests
conducted between these results and we found that CL with interaction terms (results in
Tables 5.10 - 5.11) is superior to the basic CLM (results in Tables 5.1 - 5.2) for both
crops at 0.5% significance level.
Inclusion of interaction terms in our analysis of the demand for sorghum variety
attributes also resulted in insignificant coefficients for productivity and yield stability
traits while there is a highly significant and positive utility derived from higher levels of
113
producers’ price and a negative disutility derived from environmental adaptability traits
of sorghum crop varieties (Table 5.10). This shows that most of the positive utility
derived from environmental adaptability, productivity, and yield stability traits of
sorghum varieties, as we have reported in previous results, is explained by the interaction
terms between these attributes and the socio-economic characteristics (see Table 5.10
above)75.
The interaction between the demand for higher levels of producers’ price (or
productivity) and sex of the household head is positive. This shows that male headed
households demand higher prices for their output and more productive sorghum varieties
than female headed households. This may be because male headed households are more
integrated into the market than their female counterparts and hence demanding more
marketable varieties with good output potentials. More experienced farm households also
demand more productive and environmentally adaptable sorghum varieties. As farm
household heads get more experienced in farming, they are likely to have larger family
sizes that they have to support from their produce either through direct household food
consumption or through the income generated from selling their produce, both prompting
higher demand for productivity. More experience also forces many farmers to go through
recurrent drought encounters in the past, which are common in the area and often result in
acute food shortages to those farm households located in the area, inducing more
75 In order to prove this, we have estimated the model without, for example, the five interaction terms between environmental adaptability and the socio-economic variables reported in Table 5.10, and found that the coefficient for environmental adaptability trait regained its positive and highly significant value. The same was also true of the demand for productivity and yield stability attributes.
114
experienced farmers to look for varieties that are better resistant to such environmental
pressures.
Farm households with at least one member working off-farm tend to gamble with nature
by demanding more productive varieties even if this sorghum variety is not
environmentally adaptable. This is because farm families with off farm income have a
better potential to insure themselves against crop failure that might arise as a result of
drought and frost problems by supplementing their output with items purchased at the
local markets in the two Kebeles. Hence, this allows them to look for more productive
sorghum varieties than those farm households without off farm income and thus more
concerned with the environmental adaptability trait of the varieties on offer. Participation
in the agricultural extension package program may also be motivated by the demand
farmers have for more productive varieties as can be seen by the positive and significant
coefficient for the interaction term included in Table 5.10.
Farmers residing far away from basic infrastructures like irrigation and piped water
among other things, look for more environmentally adaptable sorghum varieties. The fact
that environmentally adaptable varieties require relatively less moisture to grow is
appealing to such farmers who do not have easy access to irrigation and piped water and
hence mainly depend on the weather condition to keep their crops grow.
Farm household heads who stated that land shortage is the primary problem the
household faces also have a high demand for environmentally adaptable sorghum
115
varieties. Land shortage problems can be translated into small total output for these farm
households, and farmers are particularly risk averse towards non-adaptable varieties
planted in these small plots of land since otherwise, they risk the much needed output that
these plots provide to the vagaries of nature. Demand for yield stability also increases
with total land size and the value of livestock owned by the farm household. As the total
land size operated by the farm household increases, farmers will have a better potential to
participate in the market and sell their produce and hence require yield stability to keep
the supply steady. More stable yield also means more stable supply of fodder for the
livestock the household rears, which induces the household head to demand sorghum
varieties that are stable in yield.
Farm households who consider themselves poor or very poor in relation to other
households in the area have a higher demand for yield stability than farmers who consider
themselves at least self-sufficient. This finding implies that poorer households demand
sorghum varieties that can secure the food safety of the household while evening out the
risk element associated with disease and pest occurrences.
The results of the conditional logit model with significant interaction terms estimated to
study the demand for teff variety attributes is reported in Table 5.11 below. The
coefficients for producers’ price, productivity and yield stability attributes when not
interacted with the socio-economic variables resulted in positive and significant demand
for these attributes, similar to our findings in Table 5.2. However, similar to our findings
in Table 5.10 for sorghum variety attributes, the demand for environmental adaptability
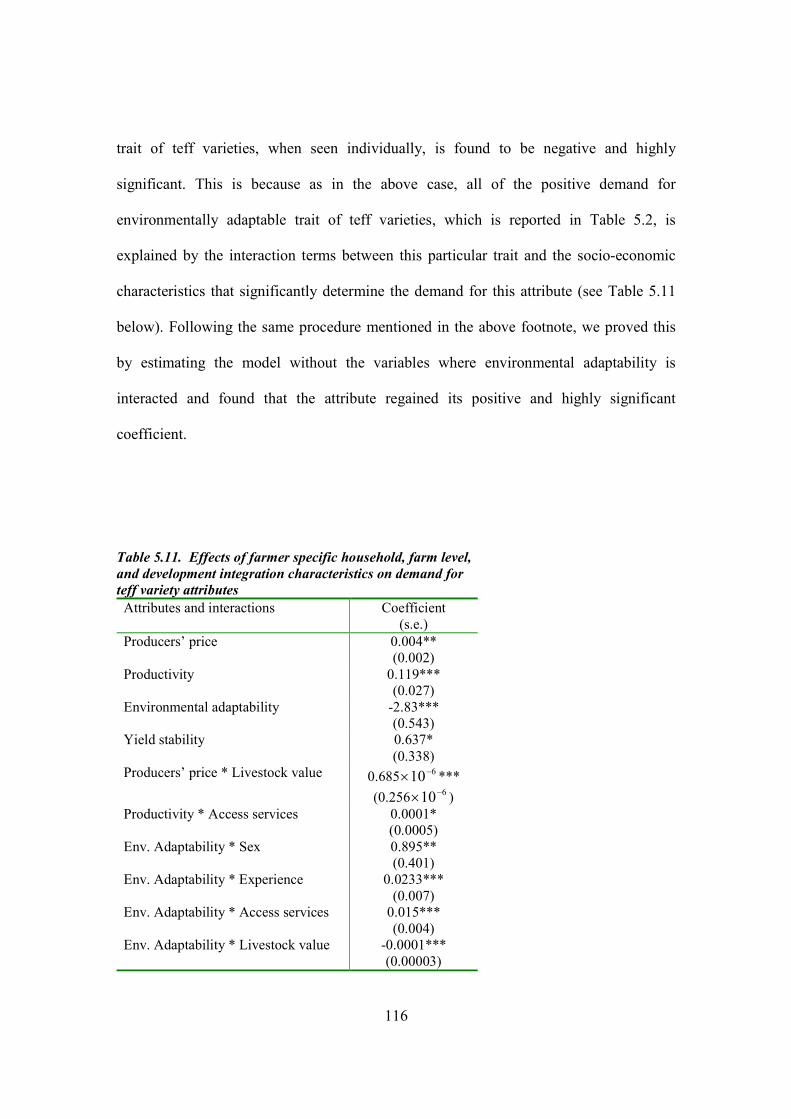
116
trait of teff varieties, when seen individually, is found to be negative and highly
significant. This is because as in the above case, all of the positive demand for
environmentally adaptable trait of teff varieties, which is reported in Table 5.2, is
explained by the interaction terms between this particular trait and the socio-economic
characteristics that significantly determine the demand for this attribute (see Table 5.11
below). Following the same procedure mentioned in the above footnote, we proved this
by estimating the model without the variables where environmental adaptability is
interacted and found that the attribute regained its positive and highly significant
coefficient.
Table 5.11. Effects of farmer specific household, farm level,
and development integration characteristics on demand for
teff variety attributes
Attributes and interactions Coefficient (s.e.)
Producers’ price 0.004** (0.002)
Productivity 0.119*** (0.027)
Environmental adaptability -2.83*** (0.543)
Yield stability 0.637* (0.338)
Producers’ price * Livestock value 0.685 610−× ***
(0.256 610−× ) Productivity * Access services Env. Adaptability * Sex Env. Adaptability * Experience Env. Adaptability * Access services Env. Adaptability * Livestock value
0.0001* (0.0005) 0.895** (0.401)
0.0233*** (0.007)
0.015*** (0.004)
-0.0001*** (0.00003)

117
Env. Adaptability * Poverty status Env. Adaptability * Household size Yield stability * Livestock value Yield stability * Land shortage Yield stability * No. dependents Yield stability * Household size
1.60*** (0.326) 0.262** (0.107)
-0.0001*** (0.00003) -0.372** (0.171) 0.178** (0.073) 0.203* (0.108)
Sample size 549
2ρ 0.469
Log likelihood -314.59
Source: Own survey and data from Genetic Resources Policy Initiative (GRPI) - Ethiopia project, 2006/2007. *** 1% significance level, ** 5% significance level and *10% significance level with two-tailed tests. . Results in Table 5.11 also show that farmers with accumulated wealth in the form of
higher total livestock value tend to gamble with nature by looking for more marketable
teff varieties even though such varieties do not provide stable yield or are not
environmentally adaptable. This is because wealthy farmers can insure themselves
against crop failure that might arise as a result of drought, frost, disease, or pest problems
by supplementing their output with livestock that is either directly consumed or sold to
buy food items from the local markets.
Farmers residing far away from basic infrastructures and services also require more
productive and environmentally adaptable teff varieties than farmers living closer to these
services. As already explained for sorghum variety choices above, environmentally
adaptable teff varieties also require relatively less moisture in the soil to grow, which
118
makes them more likely to be adopted by farmers living far away from irrigation and
piped water infrastructures among others. The fact that farmers living in remote areas
also demand higher productivity from their teff variety options is perhaps an indication
that the government can incorporate such farmers in the agricultural extension program
and provide them with more productive improved varieties.
The interaction between the demand for environmentally adaptable teff varieties and the
poverty status of the household is positive. This is unexpected because it implies that
richer households demand more environmentally adaptable teff varieties than poorer
households. One possible explanation for this is that farmers who consider themselves
poor or very poor may already be receiving food assistance from relief organizations for
many years and is likely to continue, if not increase, during drought and frost seasons,
which are then left to affect most noticeably those farm households who have managed to
stay at least self-sufficient and hence prompting them to demand for environmentally
adaptable teff varieties since they have much to lose than poorer households. Another
unexpected finding is that the demand for yield stability trait of teff varieties decreases
with the household head mentioning land shortage as the primary problem for the
household. This may be because some farmers who are primarily concerned with land
shortage problems have interpreted a stable-in-yield variety as a type that provides
constant yield year after year, and this may not be a desirable attribute since these farmers
may like to see an upward trend in the quantity of output for their small land.
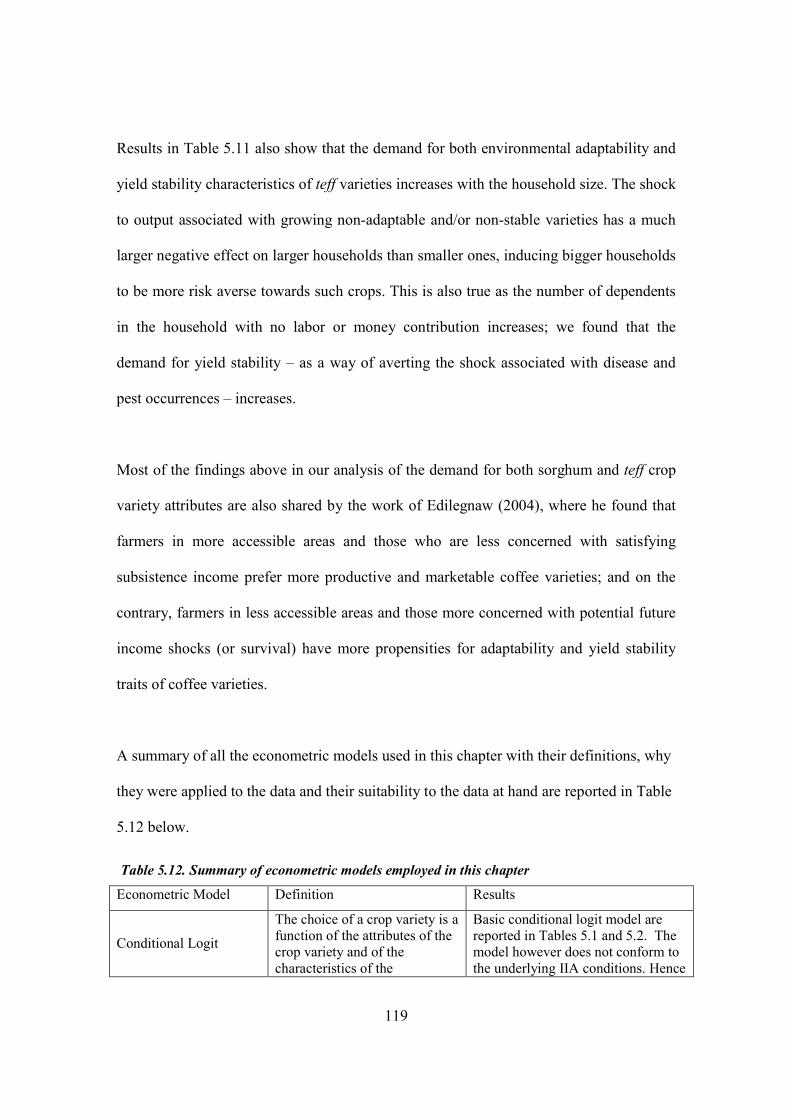
119
Results in Table 5.11 also show that the demand for both environmental adaptability and
yield stability characteristics of teff varieties increases with the household size. The shock
to output associated with growing non-adaptable and/or non-stable varieties has a much
larger negative effect on larger households than smaller ones, inducing bigger households
to be more risk averse towards such crops. This is also true as the number of dependents
in the household with no labor or money contribution increases; we found that the
demand for yield stability – as a way of averting the shock associated with disease and
pest occurrences – increases.
Most of the findings above in our analysis of the demand for both sorghum and teff crop
variety attributes are also shared by the work of Edilegnaw (2004), where he found that
farmers in more accessible areas and those who are less concerned with satisfying
subsistence income prefer more productive and marketable coffee varieties; and on the
contrary, farmers in less accessible areas and those more concerned with potential future
income shocks (or survival) have more propensities for adaptability and yield stability
traits of coffee varieties.
A summary of all the econometric models used in this chapter with their definitions, why
they were applied to the data and their suitability to the data at hand are reported in Table
5.12 below.
Table 5.12. Summary of econometric models employed in this chapter
Econometric Model Definition Results
Conditional Logit
The choice of a crop variety is a function of the attributes of the crop variety and of the characteristics of the
Basic conditional logit model are reported in Tables 5.1 and 5.2. The model however does not conform to the underlying IIA conditions. Hence
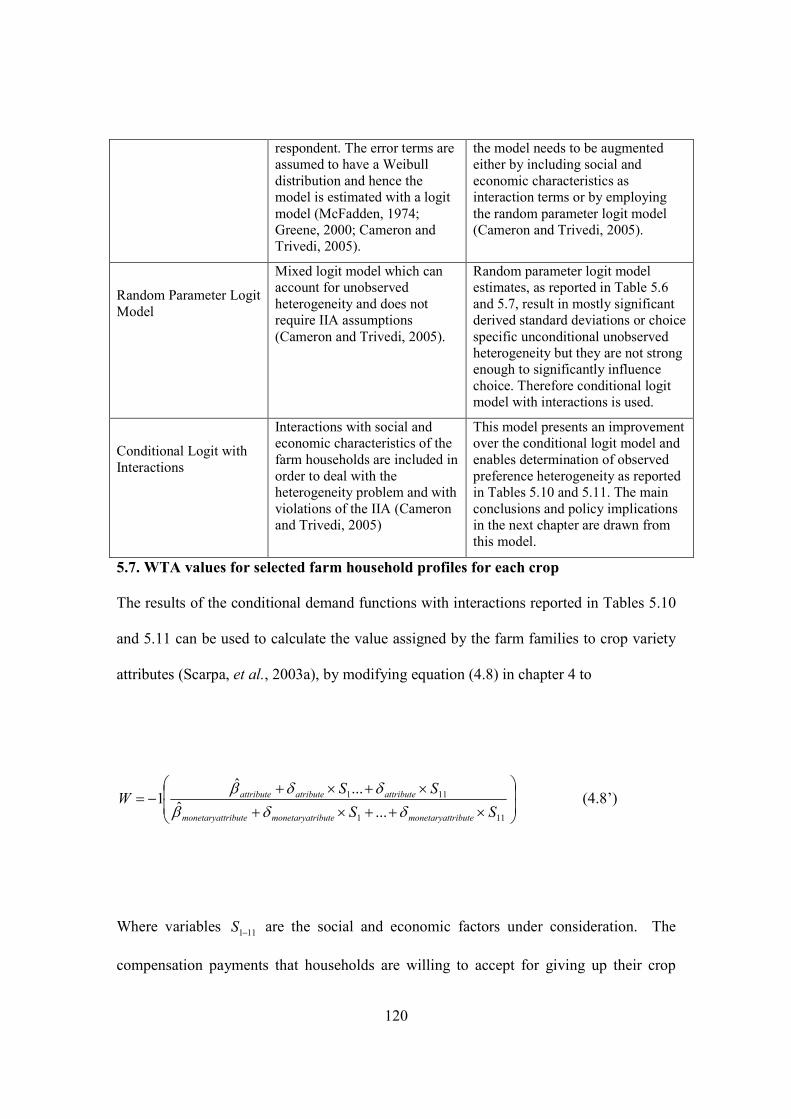
120
respondent. The error terms are assumed to have a Weibull distribution and hence the model is estimated with a logit model (McFadden, 1974; Greene, 2000; Cameron and Trivedi, 2005).
the model needs to be augmented either by including social and economic characteristics as interaction terms or by employing the random parameter logit model (Cameron and Trivedi, 2005).
Random Parameter Logit Model
Mixed logit model which can account for unobserved heterogeneity and does not require IIA assumptions (Cameron and Trivedi, 2005).
Random parameter logit model estimates, as reported in Table 5.6 and 5.7, result in mostly significant derived standard deviations or choice specific unconditional unobserved heterogeneity but they are not strong enough to significantly influence choice. Therefore conditional logit model with interactions is used.
Conditional Logit with Interactions
Interactions with social and economic characteristics of the farm households are included in order to deal with the heterogeneity problem and with violations of the IIA (Cameron and Trivedi, 2005)
This model presents an improvement over the conditional logit model and enables determination of observed preference heterogeneity as reported in Tables 5.10 and 5.11. The main conclusions and policy implications in the next chapter are drawn from this model.
5.7. WTA values for selected farm household profiles for each crop
The results of the conditional demand functions with interactions reported in Tables 5.10
and 5.11 can be used to calculate the value assigned by the farm families to crop variety
attributes (Scarpa, et al., 2003a), by modifying equation (4.8) in chapter 4 to
×++×+
×+×+−=
111
111
...ˆ...ˆ
1SS
SSW
tributemonetaryatributemonetaryattributemonetaryat
attributeatributeattribute
δδβ
δδβ (4.8’)
Where variables 111−S are the social and economic factors under consideration. The
compensation payments that households are willing to accept for giving up their crop

121
variety attributes are shown in Table 5.13, according to three social and economic
“profiles”, which are chosen to represent stereotype farm households in rural Wello.
Profile 1 represents an elderly male headed relatively large household with 11 members,
6 of which are dependents and the experience of the primary decision maker is 50 years.
The household has no member working off-farm, resides in less accessible area with an
average of 120 minutes walking distance away from basic infrastructures, and is not
participating in the agricultural extension program. The total land size operated by this
household is only 1 Timad (0.25 ha) and hence considers scarcity of land as a primary
problem. This farm family has only 800 birr worth of livestock and judges itself to be
poor or very poor in relation to other households in the area.
Profile 2 pertains to a male headed medium sized farm household with 6 members, 3 of
which are economically dependent and the experience of the primary decision maker is
25 years. The household has no member working off-farm, resides in relatively more
accessible area with an average of 50 minutes walking distance away from basic
infrastructures, and participates in the agricultural extension program. The total land size
operated by this household is 3 Timads (0.75 ha) and considers scarcity of land as a
primary problem. This farm family has 5,000 birr worth of livestock and judges itself to
be at least self-sufficient in relation to other households in the area.
Profile 3 describes a female headed and small sized farm household with only 3
members, and only 1 member is economically dependent and the experience of the
primary decision maker is 10 years. The household has at least one member working off-

122
farm, resides in more readily accessible area with an average of only 10 minutes walking
distance away from basic infrastructures, and participates in the agricultural extension
program. The total land size operated by this household reaches 11 Timads (2.75 ha) and
hence does not consider land shortage as a primary problem. The farm family has as
much as 15,000 birr worth of livestock and judges itself to be at least self-sufficient in
relation to other households in the area.
The results of the derivation of WTA estimates conditional on the social and economic
variables of these farm household profiles are reported in Table 5.13 below.
Table 5.13. WTA values by farm household profiles and crops (in birr per quintal of
the respective crop) Crop and Attribute Profile 1 Profile 2 Profile 3 Sorghum
Productivity -14 -13 -15 Environmental Adaptability -242 -115 +136 Yield Stability -43 -71 -617
Teff Productivity -51 -22 --* Environmental Adaptability -818 -268 -- Yield Stability -750 -195 --
Source: Own survey and data from Genetic Resources Policy Initiative (GRPI) - Ethiopia project, 2006/2007. *-- indicates that the demand for the attribute is insignificant at 10% significance level. Note: values computed using Wald procedure (Delta method) in LIMDEP 8.0 NLOGIT 3.0. WTA value estimates for the three household profiles and the two crops under study in
this thesis disclose three main results. First, productivity of both crops has a positive use
value for all the three household profiles except probably for those richer households
(profile 3) presented with hypothetical teff varieties, in which case productivity attribute
123
is found to be insignificant. They, however, derive the highest positive utility from more
productive sorghum varieties. Larger and poorer households (profile 1) also derive higher
positive utility from productive sorghum and teff varieties than medium sized and
relatively richer households (profile 2).
Second, the environmental adaptability attribute of both crops is valued most highly by
large, relatively secluded and poorer households followed by medium sized, more readily
accessible, and at least self-sufficient households (profile 2). The results in Table 5.13
also show that environmental adaptability attribute of sorghum varieties has actually
negative use value for smaller and richer households with a female head and the demand
for this attribute in teff varieties is insignificant for the same farm household. This result
shows that farm families with the likes of the descriptors in profile 3 are rather willing to
pay (WTP) to get this attribute than to derive it themselves from crop varieties already
found on their plots.
Third, the demand for yield stability attribute is mixed between the two crops. Our results
demonstrate that the demand for yield stability trait in sorghum varieties is most
noticeable in richer households living in easily accessible areas, whereas larger and
poorer households derive the highest positive utility from stable-in-yield teff varieties
followed by medium sized, and moderately experienced farm households. The demand
for yield stability in teff varieties is insignificant for relatively inexperienced but richer
farm households headed by a female.
124
WTA value estimates for our binary attributes with productivity as a proxy for monetary
attribute is reported in Table 5.A.2 of the appendix. The results confirm all the above
findings except that in this case, there is a significant positive utility associated with
environmental adaptability trait of teff varieties for those small farm households who are
inexperienced but are rich and have income source from off-farm job opportunity.
5.8. Brief summary and concluding remarks
The results of this chapter show that farmers in North Wollo zone attach the highest
private values to environmental adaptability (resistance to drought and frost occurrences)
followed by yield stability (resistance to disease and pest occurrences) and productivity
attributes of both sorghum and teff crops.
Because of their effect on farmers’ utility, farm household characteristics, farm and
livestock ownership, and farmers’ integration into rural development interventions in the
areas of infrastructure development and agricultural extension have been found to
influence farmers’ variety attribute preferences. For instance, the environmental
adaptability trait in sorghum and teff crops is valued most highly by large, relatively
secluded and poorer households than medium sized, more readily accessible, and at least
self-sufficient households. This has implication on on-farm conservation of varieties
125
embedding this attribute. For example, as rural development interventions (improved
access to extension and infrastructures such as irrigation and piped water) are put in place
and contribute to the improvement of the livelihoods of the poor farm households by
making them at least self-sufficient, these farmers will be less concerned with attributes
like drought and frost resistance. Hence, those varieties having these attributes will likely
be replaced by new ones. Policy incentives are, therefore, required to maintain
environmentally adaptable teff and sorghum varieties on-farm by harmonizing rural
development with conservation efforts. Besides identifying varieties that need policy
incentives for conservation, policy makers can also utilize the findings from our
empirical analysis for targeted adoption of varieties. For instance, they can target the
more vulnerable farmers for on-farm conservation of stable yielding teff varieties and the
relatively income-shock tolerant farmers for stable yielding sorghum varieties due to their
pro-stability decision behaviour. The details of the conclusions and policy implications of
the empirical results are contained in Chapter 6.

126
CHAPTER SIX
CO�CLUSIO�S A�D POLICY IMPLICATIO�S
6.1. Conclusions
The aim of this study was to estimate the private values that farmers attach to crop variety
traits and to identify the most important farm household contextual factors that condition
their variety attribute preferences. Data was collected in personal interviews from
sorghum and teff growing farmers in two peasant associations (PAs) of North Wollo
zone. The choice experiment method was applied to investigate farm households’
demand for crop varieties and their attributes conditional on the characteristics of the
households and the main decision-makers.
To the extent that the findings are representative of other PAs in the country, the results
of the choice experiment study demonstrate that farmers in Ethiopia make significant
trade-offs between crop variety attributes before making their seed selection decisions.
Farmers, in general, derive positive utility from more productive, environmentally
adaptable, marketable, or stable yielding varieties of both teff and sorghum crops.
Farmers attach the highest private values to environmental adaptability (resistance to
drought and frost occurrences) followed by yield stability (resulting from resistance to
disease and pest problems) and productivity attributes of both crops. Farmers’ trade-offs
between productivity and adaptability traits of the two crops under study have also shed
127
light on the relative importance of the environmental adaptability trait in sorghum and teff
crops. The results of the empirical analysis demonstrate that farmers are slightly more
risk averse towards a non-adaptable variety of teff than towards a sorghum variety with a
similar trait. This has implication on breeding priority setting as mentioned in the next
section. Thus, based on these results, it can be argued that if there is a limited budget to
improve the environmental adaptability trait of only one of the two crops in this study,
farmers in Wollo would be better off if this budget is geared towards the improvement of
the attribute in teff varieties than towards the same attempt in sorghum varieties.
To investigate if the multiple private values that are generated by crop varieties are
shared across farm households, we examined the farm household contextual factors that
influence farmers’ preferences for crop variety traits. The results reveal that differences
between farm households, in terms of household characteristics, their endowments and
constraints, and the level of development integration (in the areas of basic infrastructure
and agricultural extension) affect farmers’ private valuation of crop variety traits. Our
results indicate that teff and sorghum varieties that are resistant to drought and frost
occurrences i.e., environmentally adaptable varieties are valued most highly by larger and
poorer farm households residing far away from basic infrastructures and less so by
medium sized, and moderately experienced farm households. The demand for yield
stability varies by the crop considered. Our results show that the demand for yield
stability trait in sorghum varieties is most noticeable in richer households living in easily
accessible areas, whereas larger and poorer households derive the highest positive utility
from stable yielding teff varieties followed by medium sized, and moderately experienced
128
farm households. Richer farm households who have been participating in the agricultural
extension package and who have at least one member working off-farm derive the
highest positive utility from more productive sorghum varieties. On the other hand,
poorer farm households who do not participate in the extension package and reside in less
accessible areas derive the highest positive utility from more productive teff varieties.
Marketable sorghum varieties i.e., those that fetch the highest price for the farm family,
are valued most highly by male headed farm households. Farm households with
accumulated wealth in the form of higher total livestock value derive the highest private
utility from marketable teff varieties.
The choice experiment study reveals the most important farm household characteristics
and crop variety traits that are worth considering in designing conservation policies in
Ethiopia. The study can also serve as an input for contextual variety development,
breeding priority setting, and targeted diffusion of improved varieties with more chance
to be adopted and be successful in Ethiopia. Economic theory predicts that those farm
households who now attach the highest values to attributes already embedded in varieties
that the households keep on their farms i.e., those conserving de facto, would need the
least additional public funds as incentives to continue their management (Meng, 1997).
These “least cost” farmers should, therefore, be ranked the highest as candidate farmers
for conservation (Brown, 1990).
6.2. Implications for policy
129
The results of this study have implications not only for on-farm conservation but also for
improved variety development and adoption. Since conservation of crop diversity is not
an end in itself, this section will pinpoint the relevance of the results to both of these
policy concerns. There are four major policy directions that are emphasized in this
section.
The first policy implication is in the area of identifying the varieties conserved de facto
and those that need external incentives. Once policy is informed on the types of varieties
preferred by different farm household types, on-farm conservation costs can be
optimized. For instance, de facto conservation of high yielding sorghum varieties by
more accessible and income-shock tolerant farmers implies that there is no need to design
external incentives for these varieties to deal with their maintainers. On the contrary, in
an area where the demand for a certain variety trait (say, environmental adaptability) is
low, the variety (ies) embedding that trait should be targeted for conservation. For
instance, for farming systems operated by relatively rich farm households, and for those
found in easily accessible areas, conservation should be target to environmentally
adaptable varieties of both teff and sorghum crops.
The second policy implication is in the area of opportunity cost compensation. One of the
issues to be dealt with in on-farm conservation is the opportunity cost that farmers are
facing when the policy is in place (Edilegnaw, 2004). To this end, understanding farmers’
variety trait preferences will enable policy makers to identify the variety attributes that
have to be compensated. For instance, larger and poorer farm households who fail to
130
satisfy their current consumption requirement are most affected when they have to
abandon teff and/or sorghum varieties (for the purpose of on-farm conservation) with
better yield stability and environmental adaptability.
The third policy implication is in the area of variety adoption. For the success of
agricultural technologies, their attributes should address farmers’ concerns. Thus,
understanding farmers’ variety trait preferences is an input to this end. For instance,
according to our empirical results, to target and address variety demand for income shock
vulnerable and segmented farmers, the priority variety attributes are environmental
adaptability, yield stability, and to a lesser extent the productivity traits of teff and
sorghum varieties.
The fourth policy implication is in the area of breeding priority setting. Given that
farmers’ variety attribute preferences are determining both their propensity to use
improved varieties and the chance of using them successfully, breeding should target to
satisfy demands of different farm household types classified by their resource
endowments, preferences and constraints. To this end, analyzing farmers’ variety
attribute preferences will help to inculcate farmers’ demands in the making of the
technology. For instance, we found that farmers attach the highest private value to
environmental adaptability (resistance to drought and frost occurrences) trait followed by
yield stability (resulting from resistance to disease and pest occurrences) attribute of both
sorghum and teff crops. Breeding should, therefore, primarily target the improvement of
these two attributes in both sorghum and teff varieties, where environmental adaptability
should come first. Moreover, as breeding attempts to improve the cross-cutting attribute
131
(environmental adaptability) in the crops under study, we found that farmers in Wollo
would be better off if this improvement comes first in teff varieties than in sorghum
varieties. This is because as mentioned above and in the previous chapter, farmers are
slightly more risk averse towards a non-adaptable variety of teff than towards a sorghum
variety with a similar trait (see section 5.3 in chapter 5). Therefore, if, for practical
reasons, breeding can not address the improvement of the most important attribute in both
crops simultaneously, then priority should be given to the improvement of the
environmental adaptability trait in teff varieties.
Breeding should also target to satisfy demands of different farm household types
classified by their resource endowments, preferences and constraints. The research
priority setting should, therefore, also ask ‘breeding for whom?’ not just only ‘breeding
for which environment?’, as it is mostly the case (Edilegnaw, 2004). This way, targeted
technology development and dissemination would support efforts to deal with the
complicated problems of slow technology adoption, lack of agricultural transformation, and
perpetuation of poor agricultural productivity (and poverty) in the country.
6.3. Important issues for future research
Choice Experiment (CE) is an emerging methodology which has not been applied very
much in crop diversity studies. While applying CE in this study answers many questions
regarding farmers’ preferences for crop variety traits, there are still important questions
about farmers’ variety choice behaviour, which are left unanswered. For example, as
already mentioned in chapter 4, the fact that our analysis is based on farmers’ preferences
for marketability, productivity, yield stability and environmental adaptability traits of
132
sorghum and teff crops should not be translated into saying that these are the only
relevant attributes in farmers’ variety choice criteria. Among attributes of sorghum and
teff crops that are not covered in this study but nevertheless important to farmers are the
amount of fertilizer requirement, food quality (taste, color, milling quality etc.), early
maturity, and the quantity of remains for animal feed. Studying farmers’ preferences
towards these and other attributes is, therefore, an interesting area for future research as it
provides a more complete picture regarding the relative importance of the different
variety attributes.
In multi-cropping agricultural systems like Ethiopia, one can also relatively easily (since
many farmers are familiar with many crops) apply CE and study farmers’ preferences for
variety attributes embedded in cereals like barley, wheat, maize, beans, and other cereals
and cash crops that contribute to the food security of farmers in Ethiopia. The results
from such research activities will inform agricultural policy makers in the designing of
variety development and local variety conservation interventions targeted towards each of
these crops.
Testing whether or not the private values that farm households attach to crop variety
attributes differ according to the region in which the farm households are located is also
an interesting area for future research. These regions should represent a combination of
factors related to market infrastructure, farming system, soils and landscape, agro-
ecologies, and cultural references among others. Studies that allow for this test are
important to design breeding and on-farm conservation programs that account for

133
differences both in farm household characteristics and physical environments that
influence attribute preferences.
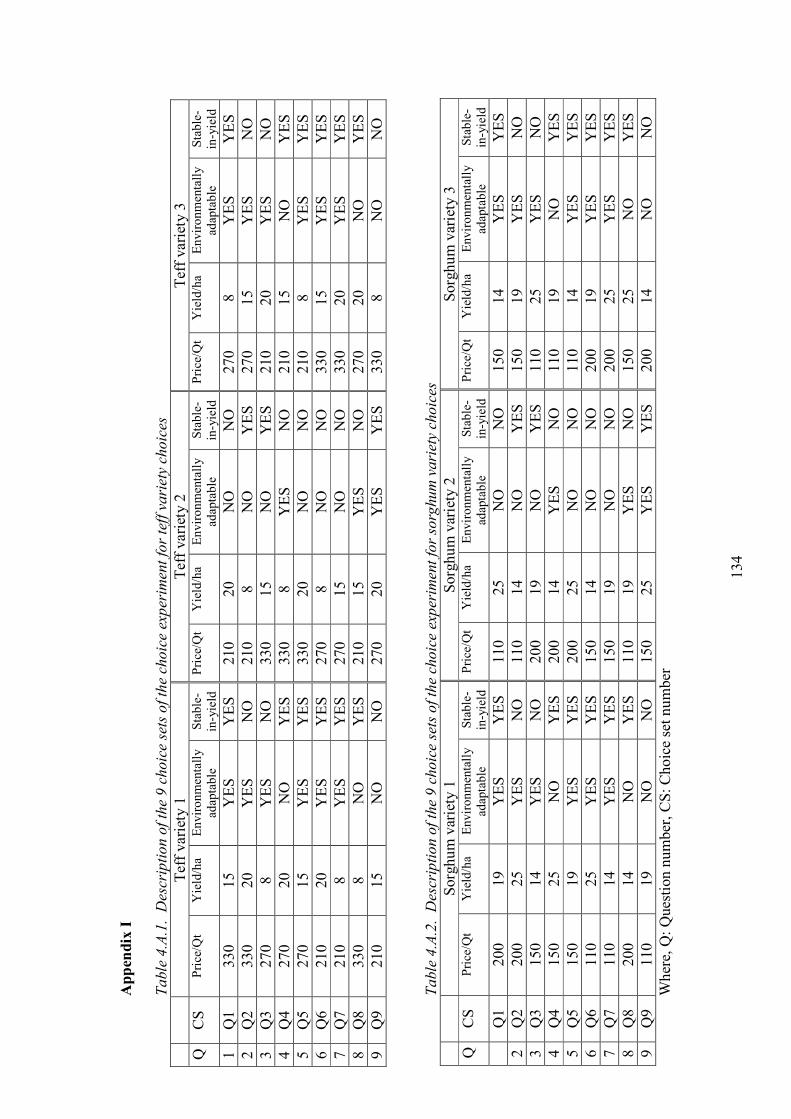
13
4
Ap
pen
dix
I
Ta
ble
4.A
.1.
Des
crip
tio
n o
f th
e 9
ch
oic
e se
ts o
f th
e ch
oic
e ex
per
imen
t fo
r te
ff v
ari
ety
choic
es
Tef
f va
riet
y 1
Tef
f va
riet
y 2
Tef
f va
riet
y 3
Q
CS
Pri
ce/Q
t Y
ield
/ha
Env
iron
men
tall
y ad
apta
ble
Stab
le-
in-y
ield
P
rice
/Qt
Yie
ld/h
a E
nvir
onm
enta
lly
adap
tabl
e St
able
- in
-yie
ld
Pri
ce/Q
t Y
ield
/ha
Env
iron
men
tall
y ad
apta
ble
Stab
le-
in-y
ield
1
Q1
330
15
YE
S Y
ES
210
20
NO
N
O
270
8 Y
ES
YE
S 2
Q2
330
20
YE
S N
O
210
8 N
O
YE
S 27
0 15
Y
ES
NO
3
Q3
270
8 Y
ES
NO
33
0 15
N
O
YE
S 21
0 20
Y
ES
NO
4
Q4
270
20
NO
Y
ES
330
8 Y
ES
NO
21
0 15
N
O
YE
S 5
Q5
270
15
YE
S Y
ES
330
20
NO
N
O
210
8 Y
ES
YE
S 6
Q6
210
20
YE
S Y
ES
270
8 N
O
NO
33
0 15
Y
ES
YE
S 7
Q7
210
8 Y
ES
YE
S 27
0 15
N
O
NO
33
0 20
Y
ES
YE
S 8
Q8
330
8 N
O
YE
S 21
0 15
Y
ES
NO
27
0 20
N
O
YE
S 9
Q9
210
15
NO
N
O
270
20
YE
S Y
ES
330
8 N
O
NO
T
able
4.A
.2.
Des
crip
tio
n o
f th
e 9
ch
oic
e se
ts o
f th
e ch
oic
e ex
per
imen
t fo
r so
rghu
m v
ari
ety
choic
es
Sorg
hum
var
iety
1
Sorg
hum
var
iety
2
Sorg
hum
var
iety
3
Q
CS
Pri
ce/Q
t Y
ield
/ha
Env
iron
men
tall
y ad
apta
ble
Stab
le-
in-y
ield
P
rice
/Qt
Yie
ld/h
a E
nvir
onm
enta
lly
adap
tabl
e St
able
- in
-yie
ld
Pri
ce/Q
t Y
ield
/ha
Env
iron
men
tall
y ad
apta
ble
Stab
le-
in-y
ield
Q1
200
19
YE
S Y
ES
110
25
NO
N
O
150
14
YE
S Y
ES
2 Q
2 20
0 25
Y
ES
NO
11
0 14
N
O
YE
S 15
0 19
Y
ES
NO
3
Q3
150
14
YE
S N
O
200
19
NO
Y
ES
110
25
YE
S N
O
4 Q
4 15
0 25
N
O
YE
S 20
0 14
Y
ES
NO
11
0 19
N
O
YE
S 5
Q5
150
19
YE
S Y
ES
200
25
NO
N
O
110
14
YE
S Y
ES
6 Q
6 11
0 25
Y
ES
YE
S 15
0 14
N
O
NO
20
0 19
Y
ES
YE
S 7
Q7
110
14
YE
S Y
ES
150
19
NO
N
O
200
25
YE
S Y
ES
8 Q
8 20
0 14
N
O
YE
S 11
0 19
Y
ES
NO
15
0 25
N
O
YE
S 9
Q9
110
19
NO
N
O
150
25
YE
S Y
ES
200
14
NO
N
O
Whe
re, Q
: Que
stio
n nu
mbe
r, C
S: C
hoic
e se
t num
ber
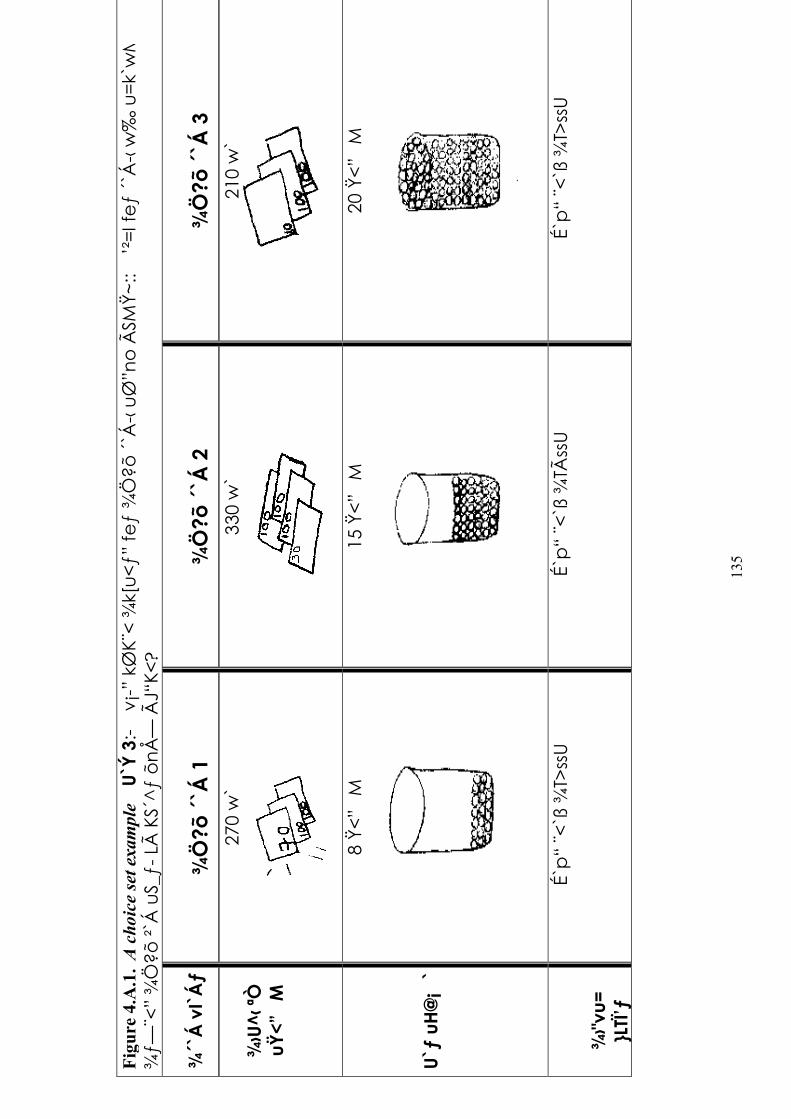
13
5
Fig
ure
4.A
.1.
A choice set example
U
`Ý 3
:-
v¡-”
kØ
K¨< ¾
k[u<ƒ”
feƒ
¾Ö
?õ ´`Á
-‹ uØ
”no Ã
SMŸ~
::
’²=I
feƒ
´`Á
-‹ w
‰ u
=k`
wM
- ¾
ƒ—¨<
” ¾
Ö?õ
²`Á
uS_
ƒ- L
à K
S´^ƒ
õnÅ
— Ã
J“K<?
¾´`
Á v
I`Á
ƒ
¾Ö
?õ ´
`Á 1
¾Ö
?õ ´
`Á 2
¾Ö
?õ ´
`Á 3
¾
›U^‹ ª
Ò
uŸ<”
M
270
w`
330
w`
210
w`
U`ƒ
uH
@¡
`
8 Ÿ<”
M
15 Ÿ
<”
M
20 Ÿ
<”
M
¾
›"vu=
}LTÏ
’ƒ
É`p
“ ¨<
`ß ¾
T>ss
U
É`p
“ ¨<
`ß ¾
TÃss
U
É`p
“ ¨<
`ß ¾
T>ss
U
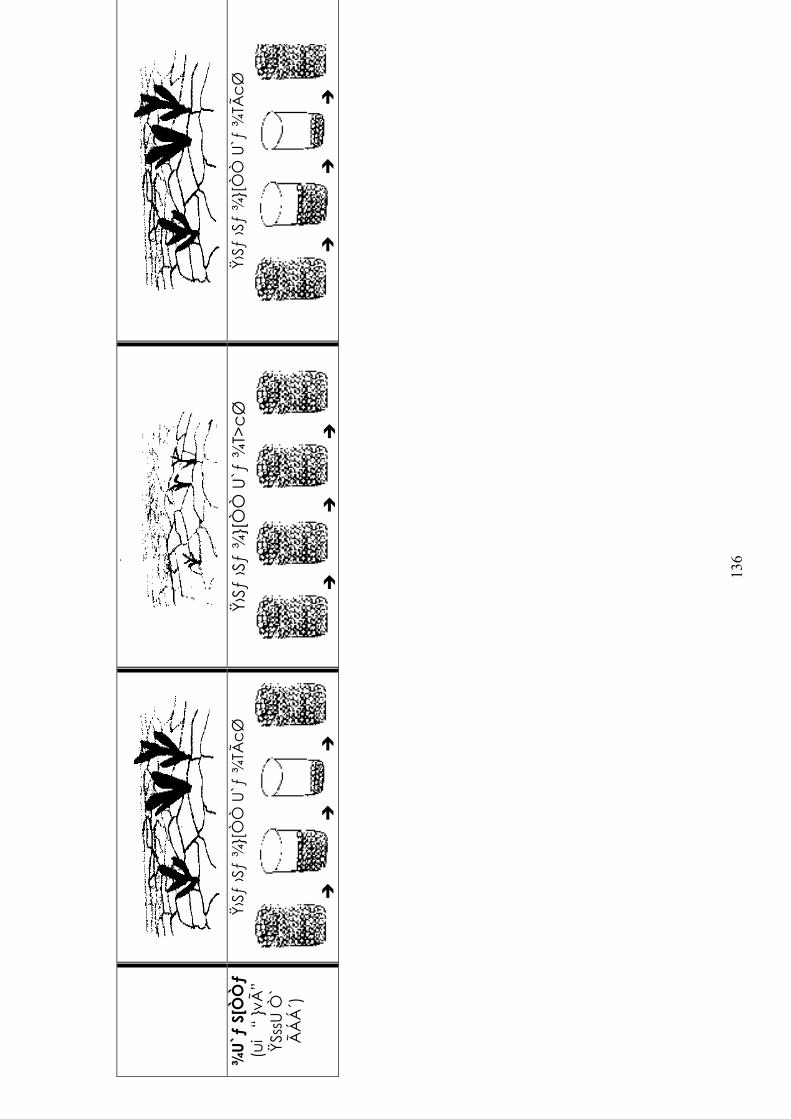
13
6
¾
U`ƒ
S[Ò
Òƒ
(ui
“ }v
Ô
ŸSs
sU Ò
` Ã
ÁÁ
´)
Ÿ›S
ƒ ›S
ƒ ¾
}[Ò
Ò U
`ƒ ¾
TÃcØ
�
��
Ÿ›Sƒ
›Sƒ
¾}[Ò
Ò U
`ƒ ¾
T>cØ
� �
�
Ÿ›S
ƒ ›S
ƒ ¾
}[Ò
Ò U
`ƒ ¾
TÃcØ
�
��

13
7
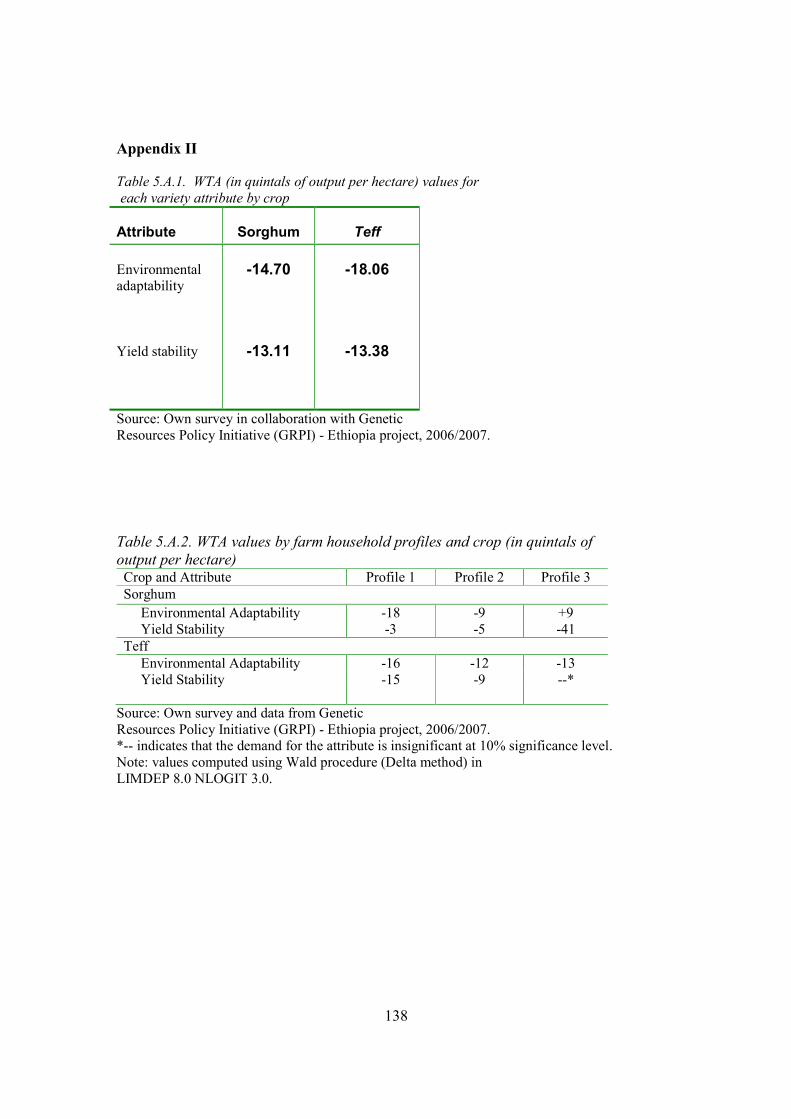
138
Appendix II
Table 5.A.1. WTA (in quintals of output per hectare) values for
each variety attribute by crop
Attribute Sorghum Teff
Environmental adaptability Yield stability
-14.70
-13.11
-18.06
-13.38
Source: Own survey in collaboration with Genetic Resources Policy Initiative (GRPI) - Ethiopia project, 2006/2007.
Table 5.A.2. WTA values by farm household profiles and crop (in quintals of
output per hectare) Crop and Attribute Profile 1 Profile 2 Profile 3 Sorghum
Environmental Adaptability -18 -9 +9 Yield Stability -3 -5 -41
Teff Environmental Adaptability -16 -12 -13 Yield Stability -15 -9 --*
Source: Own survey and data from Genetic Resources Policy Initiative (GRPI) - Ethiopia project, 2006/2007. *-- indicates that the demand for the attribute is insignificant at 10% significance level. Note: values computed using Wald procedure (Delta method) in LIMDEP 8.0 NLOGIT 3.0.
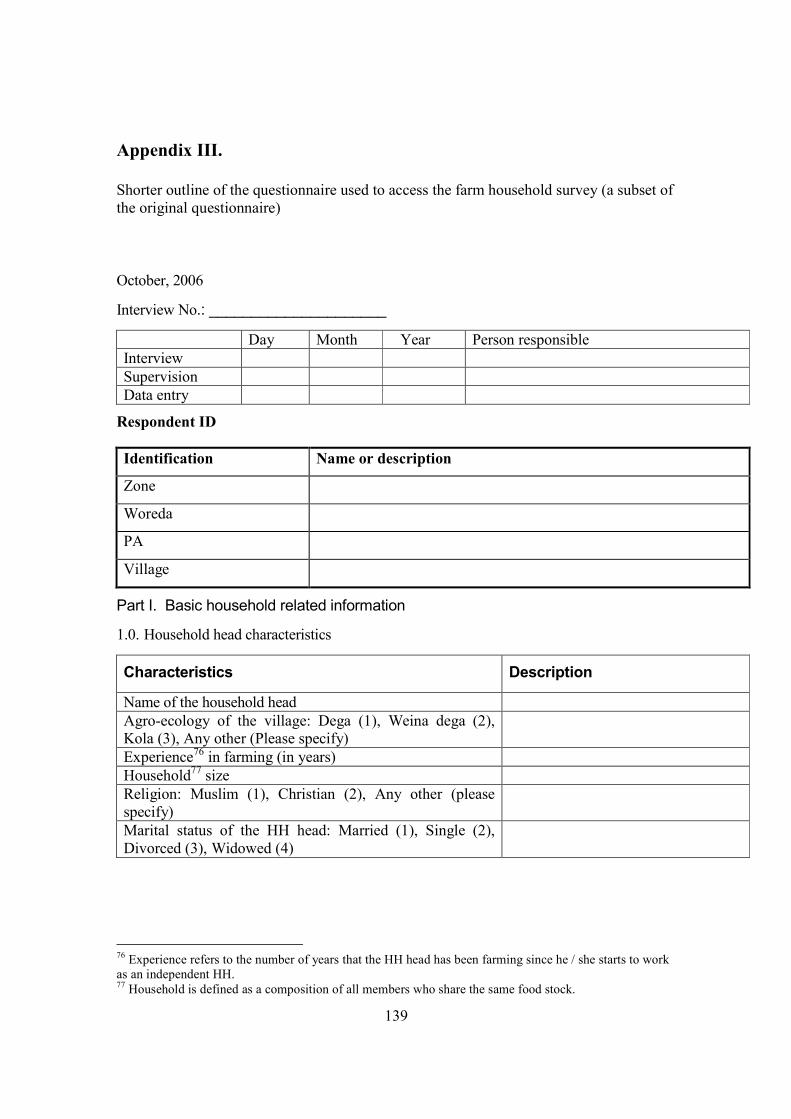
139
Appendix III.
Shorter outline of the questionnaire used to access the farm household survey (a subset of the original questionnaire)
October, 2006
Interview No.: _____________________
Day Month Year Person responsible Interview Supervision Data entry
Respondent ID
Identification �ame or description
Zone
Woreda
PA
Village
Part I. Basic household related information
1.0. Household head characteristics
Characteristics Description
Name of the household head
Agro-ecology of the village: Dega (1), Weina dega (2), Kola (3), Any other (Please specify)
Experience76 in farming (in years)
Household77 size
Religion: Muslim (1), Christian (2), Any other (please specify)
Marital status of the HH head: Married (1), Single (2), Divorced (3), Widowed (4)
76 Experience refers to the number of years that the HH head has been farming since he / she starts to work as an independent HH. 77 Household is defined as a composition of all members who share the same food stock.

140
1.1. Was the HH head born in this village? 1. Yes ______ 2. No ______
1.2. If No, How or Why did the HH head come to this village?
_________________________________
1.3. HH member characteristics
No HH member’s name (start with the HH head and continue starting with the oldest HH member)
R/nship to the HH head1
Sex 1. M 2. F
Age (0 for all infants < 1 year old)
The highest level of schooling completed2
The most important activity for members > 6 years old
1.
2.
3.
4.
5.
6.
7.
8.
9.
10.
11.
12.
14.
15.
1Codes: Head (1), Wife (2), Son/Daughter (3), Son/Daughter in law (4), Father/Mother (5),
Father/Mother in law (6), Grand child (7), Other relative (8), Non-family / Non-relative (9) 20 if illiterate and 1 for reading / writing due to formal or informal education
II. Household poverty status and asset ownership
2.0. How many dependents (household members with no labor or money contribution to the household due to age or permanent sickness) are there in the household?
1. Adult male ______ 2. Adult female ______ 3. Children ______
2.1. Suppose one would like to place all the HHs in this PA based on their level of well-being. How do you judge the poverty status of your HH in relation to other HHs in the area?
1. Very poor ___ 2. Poor ____ 3. Self-sufficient ______ 4. Rich _____ 5. Very rich ______
2.2. Do you or any other members of the HH usually work either on someone else's land or in some other employment, against payment in cash or in kind? 1. Yes _____ 2. No _____

141
2.3. Could you please rank the income sources of your household?
1. Agriculture - crop production _________ 2. Agriculture - animal production ______
2.6. In most of the years, do you buy more agricultural products than you sell or the vise verse?
1. The value of what is bought is more than the value of what is sold ___________
2. The value of what is sold is more than the value of what is bought ___________
3. No opinion _________
2.7. Current livestock ownership by the household:
Livestock Quantity (in number) Total value in Birr
Plowing oxen Calves (less than 2 years) Steers Cows and heifers Donkeys Sheep Goat Horses Mule (s) Modern bee hives Traditional bee hives Poultry Any other livestock (please specify)
2.10. Access to services
Item Yes = 1; �o = 0 Walking distance (in minutes)
1 Electricity
2 Piped water
3 Telephone
4 Primary school
5. Secondary school
6. All weather road
7. Irrigation
8 Any other (Please specify)
Part III. Farmers’ land use decisions and land ownership
3.0. What is the total land size operated by the household (in any unit)? ______________________

142
3.1. Local area unit conversion in terms of hectares (if area unit is different from hectares)78
_____________________________________________________________________________
3.2. What are the most important problems the household faces in relation to land?
a. Shortage ______ b. Poor quality _______ c. Property rights _______
d. Any other (Please specify) __________________________________________________
Part IV. Farmers’ preferences for crop varieties and their seed choice decisions
4.23. What are the most important factors (criteria) you take into account in your seed selection
/ choice decision for the three most important crops to the household?
Crop Seed selection criteria
Part V. Agricultural extension and markets
5.0. Have you been participating in the agricultural extension package program?
1. Yes_____ 2. No_____
5.1. If Yes, are you still participating? 1. Yes______ 2. No______
5.9. How much time do you need to travel on foot to reach the nearest dry weather road (in minutes)? ________________________________________________________________
5.10. How much time do you need to travel on foot to reach the nearest market (in minutes)? _________________________________________________________________________
5.11. How much time do you need to travel on foot to reach the nearest grinding mill (in minutes)? _________________________________________________________________
VI. Shocks, food security, risk and coping strategies
6.0. Would you please rank the following problems in terms of their importance
(frequency) to the household?
78 Please present the conversion factor whenever the unit of the land is outside hectares.

143
1. Production related problems______ 2. Price or market related problems ________
3. Finance related problems ________ 4. Human or personal problems __________
5. Any other (Please specify) __________
6.1. Please encircle the shocks that you have faced during the last ten years and put the number of times the household has faced the problem, 1. �atural shocks 2. Market shocks 3. Policy shocks 4. Social shocks
1. Drought 1. Lack of access to inputs
1. Land redistribution in the PA
1. Destruction or theft of assets, crops, livestock
2. Too much rain or flood
2. Large (unacceptable) increase in input prices
2. Resettlement / villagization
2. Crime resulting in death or disablement of HH members
3. Frosts or hailstorm
3. Large (unacceptable) decrease in output prices
3. Forced contributions or arbitrary taxation
3. Land or other asset Disputes
4. Pests or diseases for crops and livestock diseases5. Any other (Please specify)
4. Any other (Please specify)
4. Any other (Please specify)
4. Any other (Please specify)
VII. Optional
7.0. Any other information; please give us any other information not included above that you are interested to talk about in relation to your daily farming activities:
________________________________________________________________________________________________________________________________________________________________________________________________________________________________________________________________________________________________________________________________________________________________________________________________________________________________________________________________________________________________
Thank you very much for sharing your practical experiences with us!
133
References
Adamowicz, V., Boxall, P. 2001. Future Directions of Stated Choice Methods for Environment Valuation. Paper prepared for the workshop on Choice Experiments: A New Approach to Environmental Valuation, April 10, 2001 London, England.
Alpizar, F., Carlsson, F., Martinsson, P. 2001. Using Choice Experiments for Non-
Market Valuation. Economic Issues 8 (1): 83-109. Bateman, I.J., Carson, R.T., Day, B., Hanemann, W.M., Hanley, N., Hett, T., Jones-Lee,
M., Loomes, G., Mourato, S., Ozdemiroglu, E., Pearce, D.W., Sugden, R. and Swanson, S. 2003. Guidelines for the Use of Stated Preference Techniques for the
Valuation of Preferences for :on-market Goods. Edward Elgar, Cheltenham. Bennett, J.J. and Blamey, R.K (Eds.). 2001. The Choice Modelling Approach to
Environmental Valuation. Cheltenham, UK: Edward Elgar Publishing Limited. Birol, E. 2004. Valuing agricultural biodiversity on home gardens in Hungary: an
application of stated and revealed preference methods. Ph.D. dissertation, London, England: University College London, University of London.
Birol, E., A. Kontoleon and M. Smale. 2006a. Farmer Demand for Agricultural Biodiversity in Hungary’s Transition Economy: A Choice Experiment Approach. In M. Smale (Ed.) Valuing Crop Biodiversity on-Farm Genetic Resources and Economic
Change. Wallingford, UK: CAB International.
Birol, E., M. Smale and Á. Gyovai. 2006b. Using a Choice Experiment to Estimate Farmers’ Valuation of Agrobiodiversity on Hungarian Small Farms. Environmental
and Resource Economics 34 (4): 439–469.
Birol, E., Rayn, E.V. Forthcoming. Estimating Mexican Farmers’ Valuation of Milpa Diversity and Genetically Modified Maize: A Choice Experiment Approach.
Boxall, P.C. and W.L. Adamowicz. 1999. Understanding Heterogeneous Preferences in Random Utility Models: The Use of Latent Class Analysis. Staff Paper 99-02, Department of Rural Economy, University of Alberta, Canada.
von Braun, J. and D. Virchow. 1996. Economic Evaluation of Biotechnology and Biodiversity in Developing Countries. Agriculture and Rural Development 3, 1.
Breffle, W.S. and E.R. Morey. 2000. Investigating Preference Heterogeneity in a
Repeated Discrete-Choice Recreation Demand Model of Atlantic Salmon Fishing. Marine Resource Economics 15: 1-20.
Brown, G.M. 1990. Valuation of Genetic Resources. In Orians, G.H., G.M. Brown, W.E
Kunin C:\Documents and Settings\exec\obidos\search-handle-url\index=books&field-author=Kunin, William E\103-3195514-8380662and J.E. Swierzbinski (Eds). The
134
Preservation and Valuation of Biological Resources. Seattle, USA: University of Washington Press.
Brush, S.B. 2000. The issues of in situ conservation of CGRs. In Genes in the field:
on-farm conservation of crop diversity. In Brush, S.B. (Ed.): 3-26. Ann Arbor, USA: Lewis Publishers. Bunch, D., Louviere J.J., and Andersson, D. 1996. A Comparison of Experimental
Design Strategies for Choice-Based Conjoint Analysis with Generic-Attribute Multinomial Logit Models. Working paper, Graduate School of Management, Davis, California, USA: University of California, Davis.
Cameron, A.C and P.K. Trivedi. 2005. Microeconometrics. Cambridge, UK: Cambridge University Press. Carlsson, F., Martinsson, P. 2001. Do Hypothetical and Actual Marginal Willingness to
Pay Differ in Choice Experiments? Application to the Valuation of the Environment. Journal of Environmental Economics and Management 41: 179-192.
Carlsson, F., Kohlin, G., Alemu, M., Mahmud, Y. 2005. Are Agricultural Extension
Packages What Ethiopian Farmers Want? A Stated preference Analysis. Working Papers in Economics no. 172. Department of Economics, Goteborg University: Sweden.
Carlsson, F., Fraykblom, P., Lagerkvist, C.J. 2007. Consumer Benefits of Labels and Bans on GM Foods-Choice Experiments with Swedish Consumers. American Journal
of Agricultural Economics 89(1): 152-161. CSA. Statistical Bulletins, various issues. Addis Ababa, Ethiopia: Central Statistical
Agency. Doggett, H. 1991. Sorghum history in relation to Ethiopia. In Plant Genetic Resources of
Ethiopia. Engles, J. M. M., J. G. Hawkes, and M. Worede (Eds.): 140-159. Cambridge, UK: Cambridge University Press.
Edilegnaw, W. 2004. The economics of on-farm conservation of crop diversity in
Ethiopia: incentives attribute preferences and opportunity costs of maintaining
local varieties of crops. Ph.D. dissertation, Bonn, Germany: University of Bonn. Edilegnaw, W., Asmare, Y. 2007. Farmers’ variety attribute preferences: Implications for
Breeding Priority Setting and Agricultural Extension Policy in Ethiopia. African Development Bank 2007.
Edilegnaw, W., Mburu, J. Undated. Economic analysis of farmers’ preferences for coffee
variety traits: lessons for on-farm conservation and technology adoption in Ethiopia. ZEF-Bonn.

135
Edmeades, S. 2007. A Hedonic Approach to Estimating the Supply of Variety Attributes of a Subsistence Crop. Agricultural Economics 37: 19-28.
Emerton, L. 2000. Using incentives or biodiversity conservation. The World Conservation Union. FAO. 1998. The state of the world’s genetic resources for food and agriculture. Rome,
Italy: FAO. FDRE. 2005. :ational Biodiversity Strategy and Action Plan. Addis Ababa, Ethiopia:
Institute of Biodiversity Conservation. FDRE. 1998. :ational Policy on Biodiversity Conservation and Research. Addis Ababa, Ethiopia: Environmental Protection Authority. FDRE. 1997. Environmental Policy. Addis Ababa, Ethiopia: Environmental Protection Authority in collaboration with Ministry of Finance and Economic Development. FDRE. 1996. Country report to the International Technical Conference on Plant Genetic Resources, 17-23 June 1996, Leipzig, Germany. FDRE. 1995. The Constitution of the Federal Democratic Republic of Ethiopia. Freeman, A.M. 2002. The Measurement of Environmental and Resource Values: Theory
and Methods, Resources for the Future, Washington D.C, USA. Garrod, G. D., R. Scarpa and K. G. Willis. 2002. Estimating the Benefits of Traffic
Calming on Through Routes: A Choice Experiment Approach. Journal of Transport
Economics and Policy 36 (2): 211-231.
Gebrekidan, B. 1979. Sorghum genetic resources in Africa. Ethiopian Journal of
Agricultural Sciences 1 (2): 108-125.
Gebrekidan, B. and Y. Kebede. 1979. The traditional culture and yield potentials of the Ethiopian high lysine sorghums. Ethiopian Journal of Agricultural Sciences 1 (1): 29-40.
Georgiou, S., D. Whittington, D.W. Pearce and D. Moran. 1997. Economic Values
and the Environment in the Developing World. Cheltenham, UK: Edward Elgar Publishing Limited.
Greene, W. 2000. Econometric Analysis. Fourth Edition. New Jersey, USA: Prince-Hall.
Hanley, N., R.E. Wright, W.L. Adamowicz. 1998. Using Choice Experiments to Value the Environment. Environmental and Resource Economics 11(3-4): 413-428.
Harlan, J.R. 1969. Ethiopia: a center of diversity. Economic Botany 23 (4): 309-314.
136
Hausman, J.A., McFadden, D. 1984. Specification Tests for the Multinomial Logit Model. Econometrica 52: 1219-1240.
Hawkes, J. G., N. Maxted and B. V. Ford-Lloyd. 2000. The ex situ conservation of plant
genetic resources. New York, USA: Kluwer Academic Publishers.
Heywood, V.H. (Ed.). 1995. Global biodiversity assessment. Cambridge, USA: Cambridge University Press.
Huber, J., Pinnell, J. 1994. The Impact of Set Quality and Choice Difficulty on the Decision to Defer Purchase. Working paper, the Fuqua School of Business, Duke University.
Kahneman, D., J. Knetsch and R. Thaler. 1990. Experimental tests of the endowment
effect and the Coase theorem. Journal of Political Economy 98 (6): 1325-
1348.
Karper, R. E. and J. R. Quinby. 1947. Sorghum – its production, utilization, and breeding. Economic Botany 1: 355-371.
Kebede, Y. 1991. The role of Ethiopian sorghum germplasm resources in the national breeding programme. In Plant genetic resources of Ethiopia. Engels, K.M.M., J.G. Hawkes and W. Melaku (Eds.): 315-322. Cambridge, UK: Cambridge University Press.
Kontoleon, A. 2003. Essays on non-market valuation of environmental resources: policy
and technical explorations. Ph.D. dissertation, London, England: University College London, University of London.
Lancaster, K. 1966. A new approach to consumer theory. Journal of Political Economy 74: 132-157.
Louviere, J.J. and D.A. Hensher. 1982. On the Design and Analysis of Simulated Choice or Allocation Experiments in Travel Choice Modelling. Transportation Research
Record 890: 11-17.
Louviere, J.J. and G. Woodworth. 1983. Design and Analysis of Stimulated Consumer Choice Experiments or Allocation Experiments: An Approach Based on Aggregate Data. Journal of Marketing Research 20: 350-367.
Louviere, J.J. 1988. Analyzing Decision Making: Metric Conjoint Analysis. Newbury Park, California, USA: Sage Publications, Inc.
Louviere, J. J., D.A. Hensher, J.D. Swait and W.L. Adamowicz. 2000. Stated Choice
Methods: Analysis and Applications. Cambridge, UK: Cambridge University Press.
137
Luce, D. 1959. Individual Choice Behaviour. New York, USA: John Wiley Publishing Limited.
Maddala, G.S. 2000. Introduction to Econometrics. Third edition. Upper Saddle River, New Jersey, USA: Prentice-Hall, Inc.
Maxted, N., J.G. Hawkes, B.V. Ford-Lloyd and J.T. Williams. 1997. A practical model for in situ genetic conservation. In plant genetic conservation: the in situ approach. N. Maxted, B.V. Ford-Lloyd and J.G. Hawkes (Eds.): 339-367. London, UK: Chapman and Hall. Mazotta, M. and J. Opaluch. 1995. Decision making when choices are complex: A test of
Heiners hypothesis. Land Economics 71: 500-515. McFadden, D.L. 1974. The measurement of urban travel demand. Journal of Public
Economics 3: 303-328. Meng, E.C.H. 1997. Land allocation and in situ conservation of crop genetic resources: the case of wheat landraces in Turkey. Ph.D. dissertation, Davis, USA: University of California. Morey, E.R., and K.G. Rossmann. 2003. Using Stated-Preference Questions to
Investigate Variations in Willingness to Pay for Preserving Marble Monuments: Classic Heterogeneity, Random Parameters, and Mixture Models. Journal of Cultural
Economics 27 (4):-229. Ndjeunga, J. and C. H. Nelson. 2005. Toward understanding household preference for
consumption characteristics of millet varieties: a case study from western Niger. Agricultural Economics 32(2): 151-165.
Perman, R., Yue Ma, McGilvray, J., Common, M. 2003. :atural Resource and
Environmental Economics. Third Edition. Edinburgh Gate, Harlow, USA: Pearson Education Limited.
Rolfe, J., J.J. Bennett and J.J. Louviere. 2000. Choice Modelling and Its Potential Application to Tropical Rainforest Preservation. Ecological Economics 35(2): 289-302.
Scarpa, R., A. Drucker, S. Anderson, N. Ferraes-Ehuan, V. Gomez, C. R. Risopatron and O. Rubio-Leonel. 2003a. Valuing Animal Genetic Resources in Peasant Economies: The Case of the Box Keken Creole Pig in Yucatan. Ecological Economics 45(3): 427-443.
Scarpa R., E.S.K. Ruto, P. Kristjanson, M. Radeny, A.G. Drucker and J.E.O. Rege. 2003b. Valuing indigenous cattle breeds in Kenya: An empirical comparison of stated and revealed preference value estimates. Ecological Economics 45(3): 409-426.
138
Seyfu, K. 1997. Teff. Booklet 12. International Plant Genetic Resources Institute (IPGRI), Newsletter.
Smale, M., R.M. Bellon and J.A. Aguirre Gomez. 2001. Maize Diversity, Variety Attributes, and Farmers’ Choices in Southeastern Guanajuato, México. Economic
Development and Cultural Change 50 (1): 201-225.
Smale, M. (Ed.). 2006. Valuing Crop Biodiversity on- Farm Genetic Resources and
Economic Change. Wallingford, UK: CAB International.
UNDP. 2003. Millennium Development Goals: A Pact Among Nations to End Human Poverty. Human Development Report 2003. Available at: http://hdr.undp.org/reports/global/2003/
UNEP. 1992. Agendy 21: Environment and Development Agenda. United Nations Conference on Environment and Development, Rio de Janeiro, 3-14 June.
Varian H. R. 1992. Microeconomic Analysis. Third Edition. New York, USA: Norton & Company, Inc.
de Wet, J. M. J. and J. R. Harlan. 1971. The origin and domestication of sorghum bicolor. Economic Botany 25: 128-135.
Wegayehu, B. 2006. Analysis of Farmers’ Preferences for Development Intervention Programs: A Case Study of Subsistence Farmers from East Ethiopian Highlands. African Development Bank 2006.
Worede, M., T. Tesemma, and R. Feyissa. 2000. Keeping diversity alive: an Ethiopian perspective. In Genes in the field: on-farm conservation of crop diversity. Brush, S.B. (Ed.): 143-161. Ann Arbor, USA: Lewis Publishers.
World Resources Institute. 1992. Global Biodiversity Strategy: Guidelines for Action to Save, Study and Use Earth's Biotic Wealth Sustainably and Equitably.

139