Embed Size (px)
Citation preview

The content of this publication is the sole responsibility of the author and can in no way be taken to reflect the views of the European Union.
Adding Value to the Arc Project: a baseline household
livelihood survey
By Emmanuel Lyimo
March, 2014

i
Table of Contents Table of Contents ..................................................................................................................... i
List of table ............................................................................................................................. iii
List of figure ............................................................................................................................ iii
List of map .............................................................................................................................. iv
List of abbreviations ................................................................................................................. v
Acknowledgements ................................................................................................................ vi
1.0 INTRODUCTION ............................................................................................................. 1
1.1 About the project Adding Value to the Arc .................................................................... 1
1.2 Objective of the survey ................................................................................................ 1
1.3 Structure of the report ....................................................................................................... 1
2.0 METHODOLOGY ............................................................................................................ 1
2.1 Description of the study site ......................................................................................... 1
2.2 Sampling procedure ..................................................................................................... 2
2.3 Data collection methods ............................................................................................... 3
2.4 Data management and analysis ................................................................................... 4
2.5 Limitation of the survey ................................................................................................ 4
3.0 SURVEY FINDINGS AND DISCUSSIONS ...................................................................... 4
3.1 Respondents characteristics ........................................................................................ 4
3.2 Social economic ........................................................................................................... 7
3.2.1 Household ownership asset ......................................................................................... 7
3.2.2 Household building material ......................................................................................... 8
3.2.3 Drinking water and sanitation ....................................................................................... 8
3.2.4 Access to basic socio economic facilities ....................................................................11
3.2.5 Access to energy sources ...........................................................................................11
3.2.5.1 Cooking fuel .........................................................................................................11
3.2.5.2 Lighting ................................................................................................................12
3.3 Land Issues ................................................................................................................12
3.3.1 Land ownership ..........................................................................................................12
3.3.2 Land use plan ...............................................................................................................13
3.4. Conservation Agriculture (CA) ....................................................................................13
3.4.1 Awareness of conservation agriculture .........................................................................13
3.4.2 Training on conservation agriculture (CA) .....................................................................13
3.4.3 Adoption of conservation agriculture .............................................................................14
3.4.3 Farming preparation methods .......................................................................................14
3.4.4 Incentives for farmers ...................................................................................................14

ii
3.4.5 Suggestions from farmers on CA ..................................................................................14
3.4.6 Crops growing in the landscape ....................................................................................14
3.5. Crop yield ...................................................................................................................15
3.5.1 Crop production constraints ..........................................................................................15
3.6 Livestock production ........................................................................................................16
3.6.1 Livestock ownership .....................................................................................................16
3.6.2. Water sources for livestock and system of grazing ......................................................16
3.7. Beekeeping ....................................................................................................................16
3.7.1 Beekeeping practices ...................................................................................................16
3.7.2 Institution supporting beekeeping .................................................................................17
3.7.2 Beekeeping production .................................................................................................17
3.7.3 Accessibility of market for honey...................................................................................17
3.7.4 Constraints of beekeeping ............................................................................................17
3.8 Village Saving and Loan association (VSLA) ...................................................................17
3.8.1 Household involvement in VSLA ...................................................................................17
3.8.2 Training provided to VSLA ............................................................................................18
3.9 Uses of forest product .................................................................................................18
3.9.1 Timber harvesting .........................................................................................................18
3.9.2 Charcoal Production .....................................................................................................18
3.9.3 Follow village Bylaws and regulation during the harvesting ...........................................19
3.10Tree planting ..................................................................................................................19
3.10.1 Supporting or training on tree planting ........................................................................19
3.11 Household income ......................................................................................................19
3.11.1 Household income from farming .................................................................................19
3.11.2 Household income from livestock ...............................................................................20
3.11.3 Other income ..............................................................................................................20
3.12 Perception of household to the wellbeing in the past two years .....................................21
4 CONCLUSION AND RECOMMENDATION .......................................................................22
6 REFERENCE .........................................................................................................................24
ANNEX 1. HOUSEHOLD SURVEY FOR BASELINE INFORMATION ......................................25
ANNEX 2: KEY INFORMANT ...................................................................................................41
ANNEX 3 DATA SCORE ..........................................................................................................42
Annex 4: Crop yield per acre per village in season one (long rain season) ................................47

iii
List of table Table 1: Village surveyed and number of households surveyed per village ................................ 3
Table 2: Survey dates ................................................................................................................ 3
Table 3 Gender of the head of the household per village ........................................................... 4
Table 4 Number of Household members per age group per village ............................................ 5
Table 5: Distribution of tribes per village..................................................................................... 6
Table 6: Percentage of respondents engaged in various economic activities ............................. 7
Table 7: Distribution of ownership assets per village .................................................................. 7
Table 8: Type of houses per village ............................................................................................ 8
Table 9: Distribution of households by source of water in the project area ................................. 8
Table 10: Percentage of households by source of water for domestic use during the normal
season per village ...................................................................................................................... 9
Table 11: Average walk time to the water sources ....................................................................10
Table 12: Percentage distribution of households to access of toilet ...........................................10
Table 13: Percentage distribution of households to access of toilet per village..........................10
Table 14: Percentage distribution of social services in the project area .....................................11
Table 15: Average size of land uses by households ..................................................................12
Table 16: Distribution of meaning of CA by household ..............................................................13
Table 17: Percentage distribution of adoption of ca techniques by households .........................14
Table 18 Crops growing in the landscape per village ................................................................14
Table 19: Crop yield sacks per acre / per season in the survey area .........................................15
Table 20: Percentage of respondents mentioning different crop-raiding animals .......................15
Table 21: Number of people practising beekeeping per village .................................................16
Table 22: Income of the household per crop .............................................................................20
Table 23: Other Source of income .............................................................................................20
Table 24 Questionnaire .............................................................................................................25
Table 25: Data score .................................................................................................................42
Table 26 Crop yield per acre per village in season one (long rain season) ................................47
List of figure Figure 1: Distribution of tribes in the landscape .......................................................................... 6
Figure 2: Percentage distribution of type of tree planted by household in the project villages....19
List of plate Plate 1: Piped and closed well at Difinga Village ........................................................................ 9
Plate 2: A woman (Mama) in Difinga Village cooking by using three stone ................................11

iv
Plate 3 Illegal timber harvesting at Mkingu Nature reserve ........................................................18
List of map Map 1: Location of the surveyed villages .................................................................................... 2

v
List of abbreviations AVA Adding Values to the Arc CA Conservation Agriculture CBT Community Based Trainers (CBT) CBFM Community Based Forest Management EU European Union ER Expected Result JFM Joint Forest Management JUVIHIMTU Jumuiya ya Vikundi vya Hisa Mvomero na Turiani MJUMITA Mtandao wa Jamii wa Usimamizi Misitu Tanzania MVDC Mvomero District Council NGO Non Government Organization TFCG Tanzania Forest Conservation Group TFS Tanzania Forest Service Agency VSLA Village Saving and Loan Association

vi
Acknowledgements First and foremost, I would like to thank EU for financing this study through its funding to TFCG’s project in South Nguru. I would like to express my sincere thanks to the Adding Values to the Arc (AVA) project staff for their valuable technical inputs and efficient logistical support. I am grateful to AVA project manager Mr. Hassan Chikira for his useful contribution. I acknowledge the assistance of the TFCG Senior Technical Advisor Nike Doggart for her critical technical inputs provided at different stages of this survey. I would like to convey my appreciation to the enumerators (Boniface Laitoni, Joseph Edward, Amina Sango and Sara Joseph). Also without forget to mention field assistance Benson Ernest for their input during the data collection and field preparation.
I am also indebted to the village administrations of Difinga, Kanga, Bwage, Mndela, Masimba, Msolokelo, Maskati, Ndole and Kinda for availing themselves for interviews and organizing farmers during data collection.
Lastly but not the least, I would like to thank all farmers in the surveyed villages for sacrificing their time during the peak agricultural season to participate in the survey.
Suggested citation: Lyimo, E. 2014. Adding Value to the Arc project: a baseline household livelihood survey. TFCG. 1 - 54

1
1.0 INTRODUCTION
1.1 About the project Adding Value to the Arc The Tanzania Forest Conservation Group (TFCG) in partnership with the Community Forestry Network of Tanzania commonly known by its Swahili acronym MJUMITA (Mtandao wa Jamii wa Usimamizi Misitu Tanzania), Mvomero District Council (MVDC) and the Tanzania Forest Services Agency (TFS) has been awarded a grant from the European Union (EU) to implement a project known as “Adding Value to the Arc: Forests and Livelihoods in the South Nguru Mountains” (AVA). The primary objective of the project is to alleviate poverty and improve economic resilience among marginalized rural, natural resource dependent communities living in Mvomero District in Tanzania. The project aims to achieve its goal by supporting more sustainable, forest management through Community Based Forest Management (CBFM) and Joint Forest Management (JFM). 1.2 Objective of the survey The main purpose of this baseline survey was to provide baseline information of livelihood activities. The specific objectives of the baseline survey were as follows:-
(i) Documenting the demographic status, livelihoods status and asset ownership. (ii) Documenting the type of land tenure practices in the landscape. (iii) Assessing accessibility to basic economic facilities for households. (iv) Assessing agricultural practices and production (v) Assessing the household incomes.
1.3 Structure of the report The report is divided into three parts; the first part provides an introduction to the Adding Value to the Arc project and describes the objectives of the survey and the structure of report. The second part describes the survey methods and the last part presents findings, conclusion and recommendations.
2.0 METHODOLOGY
2.1 Description of the study site The survey was carried out in the South Nguru Mountains in Mvomero District, Morogoro Region. The South Nguru Mountains are part of the Eastern Arc Mountains which range from the Taita Hills in Southern Kenya to the Udzungwa Mountains in Southern Tanzania. Nationally the South Nguru Mountains are important as water catchment areas supplying water to the Wami River basin. Downstream users include residents of Turiani Township, Mvomero Township, Chalinze, Bagamoyo and many other small settlements. Internationally, the South Ngurus are part of the Eastern Afromontane biodiversity hotspot known for its high levels of species endemism. The forests also provide valuable products and services to the surrounding communities. Mkingu Nature Reserve is the largest reserve within the South Nguru Mountains landscape. The other large area of forest is contained within Kanga Forest Reserve .The project is operating in 34 villages around Mkingu Nature Reserve and Kanga Forest Reserve in Mvomero and Turiani divisions of Mvomero District, Morogoro region. The villages are Bwage, Dibago, Difinga, Digalama, Digoma, Dihinda, Dihombo, Gonja, Hembeti, Kanga, Kigugu, Kinda, Kisimagulu, Komtonga, Kwadoli, Kwelikwiji, Masimba, Mafuta, Makate, Maskati, Mbogo,

2
Mhonda, Mkindo, Mlaguzi, Mndela, Msolokelo, Msufini, Mziha, Pemba, Semwali, Mvomero, Makuyu and Ubiri. The survey involved 9 of these villages as indicated on Map 1 below. Map 1: Location of the surveyed villages
2.2 Sampling procedure From the 34 villages in the project area, 9 villages, equivalent to 30 % of the project villages, are including in this survey. Villagers were included in the survey based on stratified random sampling. Stratification was based on the proposed participatory forest management regime to be established by the project. In this selection the names of all of the project villages implementing CBFM and JFM were written in different pieces of paper and placed on the container. Villages implementing JFM-only were also written on small pieces of paper and placed in a separate container as were villages implementing CBFM only. The containers were shaken and the enumerator selected three villages implementing JFM only, four villages implementing both CBFM and JFM and two villages implementing CBFM only. The names of the villages on the selected slips of paper were included in the survey. At each selected village 5% of the households were randomly selected to conduct interviews. Thus a total of 200 households were selected for interviews (Table 1) from 42 sub-villages. Households for inclusion in the survey were selected randomly. The survey team collected the village registers from village leaders. All names of the household heads from each village register were recorded in a piece of paper and placed in a container. The container was shaken and the enumerator then picked out slips of paper indicating the households to be included in the survey, until the specified sample at each village was selected (Table 1). Purposive sampling was used to select Key informants for interviews including the Village chair and Village Executive Officers.

3
Table 1: Village surveyed and number of households surveyed per village
S/N Village Number of HH surveyed
Type of PFM Nearby forest
1 Bwage 20 CBFM and JFM Kanga FR
2 Difinga 30 CBFM and JFM Kanga FR
3 Kanga 28 CBFM and JFM Kanga FR
4 Kinda 15 JFM Mkingu NR
5 Masimba 28 CBFM Not bordered with forest
6 Maskati 22 JFM Mkingu NR
7 Mndela 10 JFM Mkingu NR
8 Msolokelo 21 CBFM and JFM Mkingu NR
9 Ndole 26 CBFM Not bordered with forest
Total 200
Source: Field survey, 2013. With a total of 21,681 households overall in the project villages, this gives a sampling intensity of 0.92%. This reflects the small population of the villages that were selected relative to some of the larger villages that were not included in the survey. 2.3 Data collection methods Structured interviews with heads of households The study employed a mixture of qualitative and quantitative methods for data collection. A structured questionnaire comprised of open and closed questions was used to collect both quantitative and qualitative data from the selected households (See annex 1). The heads of households were the targeted population for interviews. Key informant interviews The Key Informant Interviews (KIIs) were conducted after the household interviews. This method aimed to collect qualitative data to capture the insights that the people have about the local issues. The interviews under this method were guided by a checklist (See annex 2). Survey dates and team Data collection in the field was carried out for four weeks from 3rd November to 7th December 2013 (Table 2). A total of 7 field staff were involved, comprised of 4 enumerators, 1 field assistant, 1 supervisor (Monitoring and Evaluation officer) and 1 Driver. Prior to data collection, experienced enumerators were recruited and trained for one day on data collection particularly on how to administer the field instruments. Testing of questionnaire was also done at Dihinda village by interviewing 10 respondents. This was very important as it helped to improve the questionnaire. Table 2: Survey dates
S/N Village name Date of data collection
1 Bwage 3-5/11/2013
2 Difinga 6-9/11/2013
3 Kanga 10-13/11/2013
4 Kinda 14-17/11/2013
5 Masimba 18-21/11/2013

4
S/N Village name Date of data collection
6 Maskati 22-25/11/2013
7 Mndela 26-30/11/2013
8 Msolokelo 1-3/12/2013
9 Ndole 4-7/12/2013
Source: Field survey, 2013 2.4 Data management and analysis The data collected were processed into a manageable format before they were subjected to analysis. The process involved coding, cleaning, entry and filling. A coding structure was provided prior to the survey to guide the presentation of the data and make it easy for entry and analysis. During the data collection if the new item raised which was not included in the questionnaire was recorded and later was given a code. Errors identified after field work were corrected before and during the data entry. The data was analysed using quantitative and qualitative approaches. Quantitative data was analysed using Microsoft Excel 2007, to generate descriptive statistics such as frequency distributions, percentages and averages. Qualitative data was analysed using content analysis method. In this case, notes taken during discussions were grouped into themes and capture key messages. 2.5 Limitation of the survey In carrying out this survey, the team faced some challenges. Firstly, the team failed to obtain all the required information from the household such as amount of harvesting of some crops, amount of crop consumed per month or per day. This is because the villagers did not keep records. To overcome this we asked the villagers to estimate of what they harvest per crop in one acre per season. Secondly, some of the selected household during sampling were not in their original premises as they were shifted to other sub villages. In these situations, the enumerator chose the nearest households to be interviewed. Thirdly, the selected households were very scattered in the studied villages as such it was very difficult to move from one household to the other and in some cases it was difficult to find the household (four household were not found and the team decided to choose another household). In this case the enumerators moved for long distances until they found the household and for those households which were not found we selected the households which were within the area. 3.0 SURVEY FINDINGS AND DISCUSSIONS 3.1 Respondents characteristics Gender of the head of the household In this survey, 85 % of the households were male-headed households and 15% were female headed (Table 3). The key informant revealed that some household’s men were taken as the head of household even if the house was controlled by woman. Women sometimes fear on saying that they are the head of family in presence of men. Moreover, it was revealed that for those few houses headed by women their husbands have either passed away or they were not married. This pattern is common in Tanzania and other studies have reported similar trends (Kasamila and Marusuli, 2004; Nonga, 2010). Table 3 Gender of the head of the household per village
Village Percentage of HH headed by men (%)
Percentage of HH headed by women (%)
Bwage 70 30

5
Village Percentage of HH headed by men (%)
Percentage of HH headed by women (%)
Difinga 87 13
Kanga 86 14
Kinda 87 13
Masimba 82 16
Maskati 82 16
Mndela 100 0
Msolokelo 95 5
Ndole 81 19
Source: Field survey 2013 Age of household members and household size With regards to age of the household members, 0-5 years (20%), 6-10 years (20%), 11-17 years (20%), 18-49 years (23%), 50-60 (13%) and over >60 (4%). It was also realized that non-working group (those younger than 18 years or older than 60 years) were 44% of the respondents while the working age group (those 18 years and above up to 60) were 56% of the respondents(Table 4) . These findings show that the working group is slightly higher than the non working group. This increases burden to the working group as they may spend much time taking care of the non working group Although it is likely that many children under 18 contribute to agricultural production and household duties. Table 4 Number of Household members per age group per village
Village
No of HH per Age group
0 - 5 6 - 10 11 – 17 18 – 49 50 – 60 >60
Bwage 16 17 16 20 12 3
Difinga 24 25 24 25 19 4
Kanga 21 18 18 26 15 2
Kinda 15 14 13 15 10 3
Masimba 20 18 19 26 4 3
Maskati 19 21 21 22 13 3
Mndela 7 7 6 9 4 0
Msolokelo 11 12 11 12 11 3
Ndole 24 22 24 25 14 7
Total 157 154 152 180 102 28
% of HH members per age group 20% 20% 20% 23% 13% 4%
Source: Field survey 2013 94% of respondents were married; 4 % were widowed and 2 % divorced. In terms of educational level, more than three quarters (80%) of the interviewed respondents had completed primary school while 17% did not attend any formal education, 2% had completed secondary school and 1% had completed college. The survey further noted that there were 306 children within the 6-17 age groups in the visited households, of which 172 were attending school (95 boys and 77girls) indicating 56% of the total children in the surveyed households were attending school and 44% were not attending school.

6
Regarding ethnic composition, the main tribes found in the study villages were Nguu (46%) and Zigua (38%). Other tribes include Chagga (5% of households), Kaguru (3%) and Hehe (3%), whilst Nyakyusa, Pare and Masai, Barabaig and Sukuma comprise 1 % each (Figure 2). It was realised during KIIs that Nguu and Zigua people are similar in terms of language and customs. The interview data shows that 59% of the respondents were born in the surveyed villages, while about 41% migrated in the village. Further analysis indicated that most of the people migrated into the village following villagilazation programme (Ujamaa programme) in 1970`s while others migrated in recent years in order to obtain farming and grazing lands. In recent years, conflicts have arisen between the pastoralists and the farmers over access to land and land use. This is exacerbated by the high demand for agriculture land as the young generation are looking for new areas for farming. Conflict situations were described in Difinga, Masimba, Bwage and Ndole villages.
Figure 1: Distribution of tribes in the landscape Table 5: Distribution of tribes per village
Tribe
Bwage (%)
Difinga (%)
Kanga (%)
Kinda (%)
Masimba (%)
Maskati (%)
Mndela(%)
Msolokelo (%)
Ndole (%)
Zigua 65 53 54 7 39 14 10 38 27
Nguu 5 17 0 93 54 86 90 48 69
Kaguru 25 17 0 0 4 0 0 5 0
Chagga 5 0 18 0 0 0 0 0 0
Pare 0 0 4 0 0 0 0 0 0
Sukuma 0 0 4 0 0 0 0 0 0
Hehe 0 0 14 0 0 0 0 5 4
Nyakusa 0 0 7 0 0 0 0 0 0
Gogo 0 10 0 0 32 0 0 0 0
Barabaig 0 3 0 0 0 0 0 0 0
Kinga 0 3 0 0 0 0 0 0 0
Maasai 0 0 0 0 0 0 0 5 0

7
Source: Field survey, 2013 Interview results show that, the major economic activities in the surveyed villages were crop cultivation, casual labourer, waged employment and livestock keeping (Table 6). However, crop cultivation emerged as the most practiced activity in the surveyed area. Through household interviews, 95% of respondents were engaged in crop cultivation (maize, beans, rice, sesame, cowpeas, banana, sugar cane and vegetables). While others were either engaged in casual labourer: in crop production (3%), livestock keeping (goat, cattle and sheep) (1%) or waged employment as teachers, village executive officers and clinical officer (1%). KIIs further indicated that most of livestock keepers who are predominantly the Maasai and Barabaig were from Kanga, Bwage, Masimba and Difinga villages. They had migrated in the villages in the past ten years. Table 6: Percentage of respondents engaged in various economic activities
Economic activity
Bwage (%)
Difinga (%)
Kanga (%)
Kinda (%)
Masimba (%)
Maskati (%)
Mndela(%)
Msolokelo (%)
Ndole (%)
Agriculture 90 87 100 87 79 100 100 100 85
Wage salary 0 3 0 0 4 0 0 0 0
Laborer 5 3 7 7 0 0 0 0 8
Livestock 10 3 0 0 0 0 0 5 0
Source: field survey 2013 3.2 Social economic 3.2.1 Household ownership asset The survey indicated that there was a difference in household asset ownership within and between the surveyed villages (Table 7). Of the total surveyed households, 34% own a radio, 29% own a mobile telephone, and 26% own a bicycle. A small percentage of households own a motor cycle (8%), vehicle (1%), satellite dish (1%) and TV (1%). Although the household survey did not document anyone owning a tractor, KIIs indicated that some villagers owned tractors. Respondents also explained that ownership of mobile phones, television and satellite dishes are limited to households with access to electricity and / or mobile phone network coverage. As electricity and mobile coverage is not available throughout the landscape, some items are impractical for some households. Table 7: Distribution of ownership assets per village
Village
Assets
Radio Bicycle Motor cycle
Mobile telephone
Satellite dish
Tractor TV Car
Masimba 4 17 3 10 0 0 1 2
Maskati 6 0 1 9 0 0 0 2
Ndole 16 8 2 15 1 1 0 0
Bwage 15 17 4 14 0 0 1 0
Difinga 20 19 8 11 0 0 0 0
Kanga 18 20 3 17 0 0 1 0
Kinda 11 0 2 9 1 0 0 0

8
Village
Assets
Radio Bicycle Motor cycle
Mobile telephone
Satellite dish
Tractor TV Car
Msolokelo 9 7 3 8 0 0 0 0
Mndela 7 1 7 0 0 0 0
Total 119 89 27 101 2 1 3 4
Source: Field survey, 2013 3.2.2 Household building material Building materials and house style is a widely used indicator for relative economic standing particularly when combined with household financial capacity. Hence the changes in building materials used by surveyed households throughout the duration of the project will provide one measure of the impact of the project intervention. The survey revealed four main types of house in the landscape, mud wall with thatched roof (33%), mud wall with iron sheet roof (18%), burnt brick wall with iron sheet roof (30%) and cement block and iron sheet (13%). The table 8 describes type of household per village. Table 8: Type of houses per village
Village
Mud wall with thatches roof (%)
Mud wall with iron roof (%)
Burnt brick with thatches (%)
Thatches wall with thatches (%)
Cement block wall with iron sheet (%)
Bwage 25 30 30 5 10
Difinga 37 23 23 3 13
Kanga 32 0 29 11 29
Kinda 47 13 33 7 0
Masimba 43 32 18 4 4
Maskati 23 5 55 5 14
Mndela 40 60 0 0 0
Msolokelo 33 14 33 5 10
Ndole 19 8 38 15 15
Source: field survey 2013 3.2.3 Drinking water and sanitation The survey indicated that the households obtain water from various sources. (Table 9).These findings indicate that nearly two thirds (65%) of the households are not connected to piped water. This shows that access to piped water is a problem in the surveyed villages. Table 9: Distribution of households by source of water in the project area
Water source Percentage (%)
Piped well 35
Surface water 25
Closed well 15
Open well 13
Spring 12
Source: Field survey, 2013

9
Plate 1: Piped and closed well at Difinga Village
It was further indicated that, the upland villages like Maskati, Kinda and Mndela are most dependent on surface water and springs. While the lowland villages such as Difinga, Bwage, Masimba, Msolokelo and Kanga have better access to piped water and closed wells (Table 10). Slightly more than three quarters of the surveyed households (76%) stated that water was available throughout the year while 24% stated that water was not available throughout the year. According to KIIs many of those people
who reported that they get water throughout the year were those living along the water bodies such as rivers and open wells constructed at the valleys. While those who mentioned that they experience seasonal water-shortages were those who depend on the shallow wells. Table 10: Percentage of households by source of water for domestic use during the normal season per village
Village Percentage of water sources
Surface water/River (%)
Closed well (%)
Piped well (%)
Spring (%)
Open well (%)
Bwage (N=20) 35 30 40 0 0
Difinga (N=30) 17 27 23 3 33
Kanga (N=28) 28 43 0 11 18
Kinda (N=15) 60 0 0 20 27
Masimba (N=28) 0 40 0 30 31
Maskati (N=22) 59 0 5 32 9
Mndela (N=10) 80 0 0 20 0
Msolokelo (N=21) 0 0 100 5 5
Ndole (N=26) 38 0 65 0 0
Source: Field survey, 2013
One of the most important indicators of household’s access to water supply is distance to the water point. About 60% of the surveyed households were spending between 5 and 40 minutes to fetch water during the normal season. While in the dry season it took respondents twice as long to collect water. The time estimated here includes travel time to and from the source and

10
waiting time at the water point to get water. However, this time differs between the upland villages where most of the households are close to the water sources. In villages like Maskati, Kinda, Mndela and Ndole, the average time used to fetch water is between 5 and 10 minutes (Table 11). This is because most households have diverted streams to flow near their households. Table 11: Average walk time to the water sources
Village Average walk time (Minutes)
Bwage 10-60
Difinga 10-45
Kanga 10-40
Kinda 4-8
Masimba 10-180
Maskati 5-30
Msolokelo 5-15
Mndela 5-15
Ndole 5-60
Source: Field survey 2013 In terms of sanitation, of the surveyed households nearly a hundred (99%) use pit latrine, either their own pit latrine per household or a shared pit latrine whilst 1% using open areas or bush land (Table 12 and 13). Table 12: Percentage distribution of households to access of toilet
Type of toilets Percentage (%)
Bush 1
Shared pit latrine 38
Own pit latrine 61
Total 100
Source: Field survey, 2013 Table 13: Percentage distribution of households to access of toilet per village
Village Bush (%) Shared pit latrine (%) Own pit latrine (%)
Bwage 0 30 70
Difinga 7 37 57
Kanga 0 50 50
Kinda 0 33 67
Masimba 4 46 50
Maskati 5 32 64
Mndela 0 30 70
Msolokelo 0 19 81
Ndole 8 38 54
Source: Field survey, 2013
11
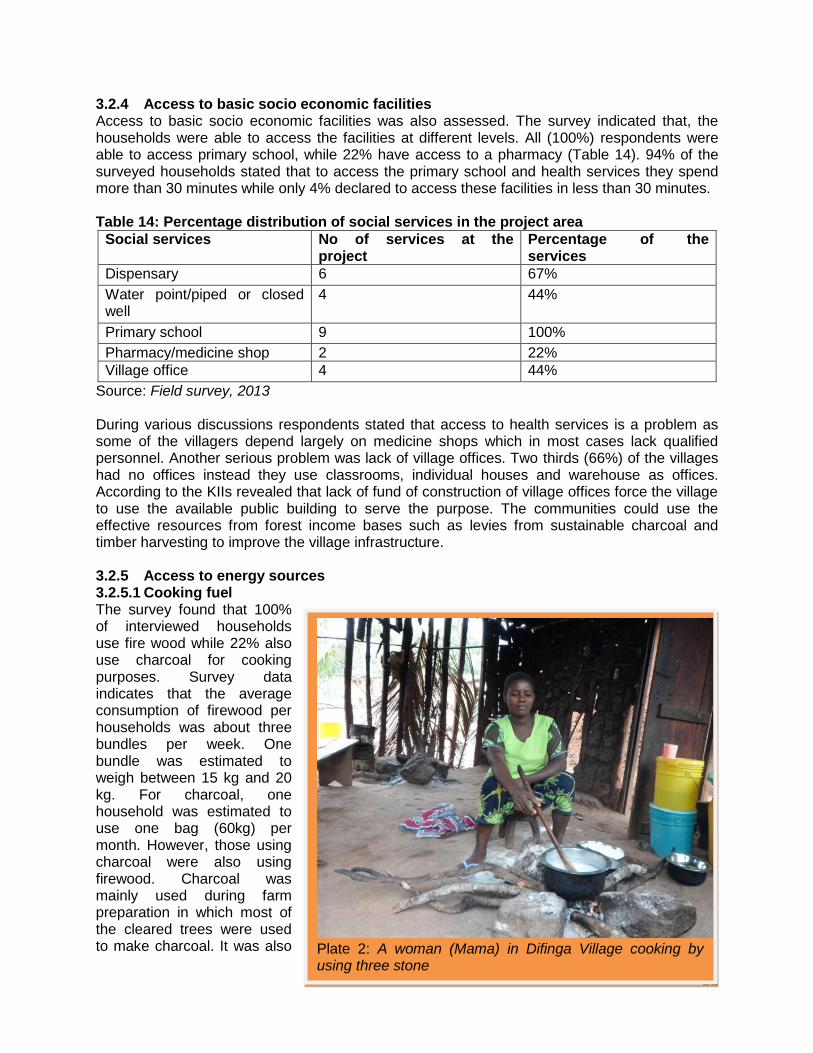
Plate 2: A woman (Mama) in Difinga Village cooking by using three stone
3.2.4 Access to basic socio economic facilities Access to basic socio economic facilities was also assessed. The survey indicated that, the households were able to access the facilities at different levels. All (100%) respondents were able to access primary school, while 22% have access to a pharmacy (Table 14). 94% of the surveyed households stated that to access the primary school and health services they spend more than 30 minutes while only 4% declared to access these facilities in less than 30 minutes. Table 14: Percentage distribution of social services in the project area
Social services No of services at the project
Percentage of the services
Dispensary 6 67%
Water point/piped or closed well
4 44%
Primary school 9 100%
Pharmacy/medicine shop 2 22%
Village office 4 44%
Source: Field survey, 2013 During various discussions respondents stated that access to health services is a problem as some of the villagers depend largely on medicine shops which in most cases lack qualified personnel. Another serious problem was lack of village offices. Two thirds (66%) of the villages had no offices instead they use classrooms, individual houses and warehouse as offices. According to the KIIs revealed that lack of fund of construction of village offices force the village to use the available public building to serve the purpose. The communities could use the effective resources from forest income bases such as levies from sustainable charcoal and timber harvesting to improve the village infrastructure. 3.2.5 Access to energy sources 3.2.5.1 Cooking fuel The survey found that 100% of interviewed households use fire wood while 22% also use charcoal for cooking purposes. Survey data indicates that the average consumption of firewood per households was about three bundles per week. One bundle was estimated to weigh between 15 kg and 20 kg. For charcoal, one household was estimated to use one bag (60kg) per month. However, those using charcoal were also using firewood. Charcoal was mainly used during farm preparation in which most of the cleared trees were used to make charcoal. It was also
12
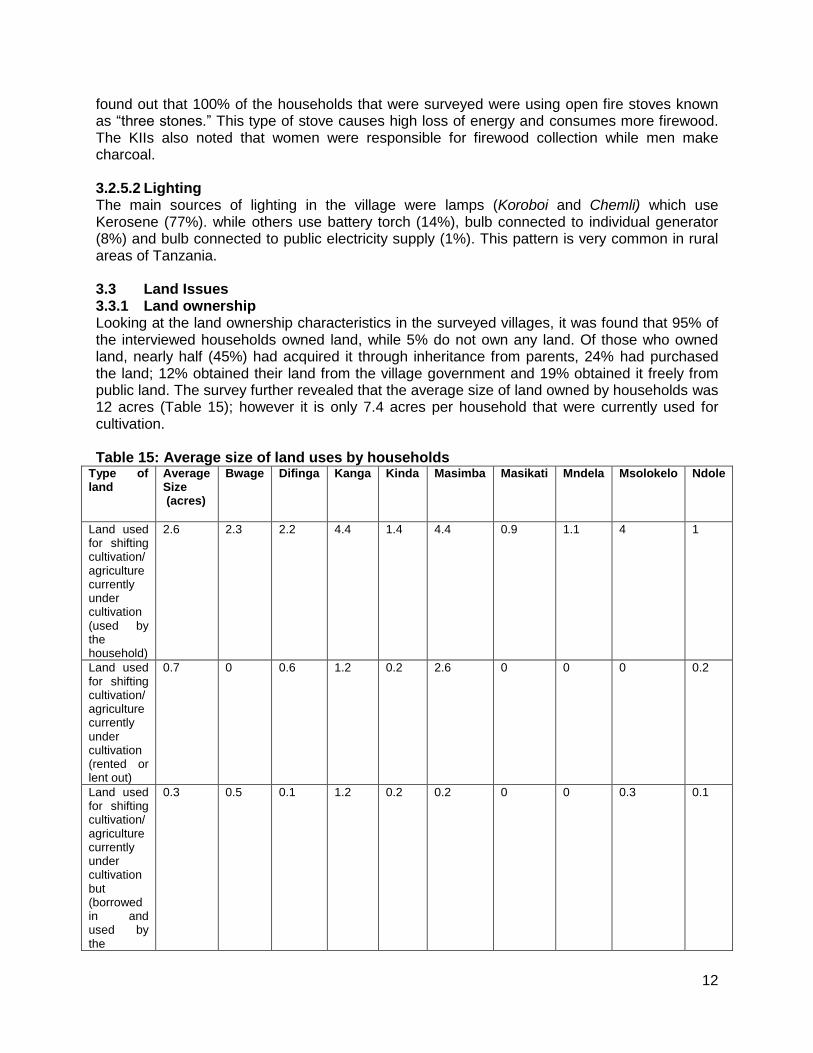
found out that 100% of the households that were surveyed were using open fire stoves known as “three stones.” This type of stove causes high loss of energy and consumes more firewood. The KIIs also noted that women were responsible for firewood collection while men make charcoal. 3.2.5.2 Lighting The main sources of lighting in the village were lamps (Koroboi and Chemli) which use Kerosene (77%). while others use battery torch (14%), bulb connected to individual generator (8%) and bulb connected to public electricity supply (1%). This pattern is very common in rural areas of Tanzania. 3.3 Land Issues 3.3.1 Land ownership Looking at the land ownership characteristics in the surveyed villages, it was found that 95% of the interviewed households owned land, while 5% do not own any land. Of those who owned land, nearly half (45%) had acquired it through inheritance from parents, 24% had purchased the land; 12% obtained their land from the village government and 19% obtained it freely from public land. The survey further revealed that the average size of land owned by households was 12 acres (Table 15); however it is only 7.4 acres per household that were currently used for cultivation. Table 15: Average size of land uses by households
Type of land
Average Size (acres)
Bwage
Difinga
Kanga
Kinda
Masimba
Masikati
Mndela
Msolokelo Ndole
Land used for shifting cultivation/ agriculture currently under cultivation (used by the household)
2.6 2.3 2.2 4.4 1.4 4.4 0.9 1.1 4 1
Land used for shifting cultivation/ agriculture currently under cultivation (rented or lent out)
0.7 0 0.6 1.2 0.2 2.6 0 0 0 0.2
Land used for shifting cultivation/ agriculture currently under cultivation but (borrowed in and used by the
0.3 0.5 0.1 1.2 0.2 0.2 0 0 0.3 0.1

13
Source: Field survey 2013 3.3.2 Land use plan As in many villages of Tanzania, the villages surveyed had no village land use plans to guide and control land use. However, villagers were using their land for various purposes such as settlement, agriculture, grazing and institutions. Lack of land use plans can create land use conflicts as reported earlier that there some observed conflict between the Maasai pastoralists and farmers in the surveyed villages. None of the village has a land use plan in the landscape, most of the village use land in an unplanned way. 3.4. Conservation Agriculture (CA) 3.4.1 Awareness of conservation agriculture To gauge the level of awareness of CA, respondents were asked if they had heard the word “Conservation Agriculture”, two thirds (66%) said that they had not heard of it, while 34% they had heard. This indicates that the level of awareness concerning CA in the surveyed area is low. Of those who were aware of CA, their perceived meaning of CA differs, almost two thirds (65%) failed to explain what they understand by CA, while 35% were able to explain the meaning of CA (Table 16). Table 16: Distribution of meaning of CA by household
Meaning of CA Percentage (%)
Terraces to avoid erosion 5
Mulching to conserve water in the filed 2
Tree and agriculture in the filed 5
Agriculture with forest conservation 14
Preparation of farm without burning 9
cannot define CA 65
Source: Field survey 2013 3.4.2 Training on conservation agriculture (CA) Villagers were also asked if they had been trained on CA. The results revealed that 94% had not been trained on CA, while 6% stated that they had attended training on CA. A similar impression was evident based on KIIs findings. This indicates that there has been little previous training on CA in the area. This may hinder farmer’s participation in CA.
household)
Land used for shifting agriculture currently under fallow
0.9 0.3 0.9 1.3 0.3 2.1 0.6 0.6 0.4 0.6
Land used for permanent agriculture
7.4 8.8 8.0 6.6 2.2 14 4.8 5 8.7 3.9
Agro forestry areas
0.3 0.2 0.7 1 0.02 0 0.2 0.2 0.4 0.1
Forest or woodland
0.1 0.3 0.3 0 0 0 0 0 0.2 0.1
Pasture 0.2 0 0.9 0.4 0 0.1 0 0.1 0 0

14
3.4.3 Adoption of conservation agriculture Of those who had heard of CA, only 32% had adopted the CA practices. This shows that the adoption of CA in the area is low. As stated earlier, limited training on CA is likely to have contributed to low adoption. With regards to CA techniques, almost (31%) had practice soil cover technique, while only 1% used herbicides (Table 17). Table 17: Percentage distribution of adoption of ca techniques by households
CA TECHNIQIES PERCENTAGE
Use of mulch to store water in the soil 5%
Use of terraces to avoid soil erosion 2%
Minimum tillage 28%
Cover the soil use crops cover 31%
Source: Field survey 2013 3.4.3 Farming preparation methods The survey assessed the degree to which farmers prepare their farms in accordance with CA principles. This helps to know whether they really practice CA or they are still using traditional methods (conventional methods). The survey found out that 53% did not slash or burn during farm preparation but they used hand hoe or tractor and collected the leaves on one place , 21% did slash and burning, 7% burning only and 19% slashing and leaves the slashes to decay in the farm. Therefore, the 19% of the farmers applied one principle of CA (slash and leave the slashes to decay in the farm). 3.4.4 Incentives for farmers No external incentives have been provided to the farmers to improve or to adopt conservation agriculture. The survey found that only 8% of farmers received seeds at a subsidized price from the government. However the key informants said that farmers are sometimes provided with killing poisons to fight vermin birds (e.g. quelea) and rats through ward extension or village extension officers. 3.4.5 Suggestions from farmers on CA In order to enhance CA practices, villagers were asked to suggest what should be done. The following were the suggestions.
It is important to integrate conservation agriculture practices with other practices such as agro forestry.
Farm villagers, extension officers and facilitators needs appropriate training and training.
Extension officer should not stay at the office all the time but rather should visit farmers frequently.
3.4.6 Crops growing in the landscape The main crops grown in the farming seasons were maize 93% of the respondents cultivate maize (Table 18). It is noted that coffee and cocoa were also grown as cash crops in the highland villages. Table 18 Crops growing in the landscape per village
Type of crop
Bwage (%)
Difinga (%)
Kanga (%)
Kinda (%)
Masimba (%)
Maskati (%)
Mndela (%)
Msolokelo (%)
Ndole (%)
Maize 95 100 93 93 75 95 90 100 100
Beans 25 20 14 93 39 100 40 14 38

15
Type of crop
Bwage (%)
Difinga (%)
Kanga (%)
Kinda (%)
Masimba (%)
Maskati (%)
Mndela (%)
Msolokelo (%)
Ndole (%)
Paddy 25 27 54 0 0 0 0 0 0
Sesame
35 3 21 0 11 0 0 14 8
Mbaazi 10 20 7 7 0 0 10 0 19
Source: Field survey, 2013 3.5. Crop yield According to the KIIs and household interviews, the yield of the major crops during first season (January to July) was higher compared to the yield during the second season (October to December). In the first season the yields of most crops were high ranging from 5 sacks/acre for beans to 9 sacks /acre for maize (estimated that 1 sack is equivalent to 120 kg). The farmers said that in all seasons they get grains that can feed their family for 6 - 12 months and they can sell some of their crops to generate a household income. Table 19 below shows the average of crop yield per household in both seasons. The crop yield per village attached at annex 3. Table 19: Crop yield sacks per acre / per season in the survey area
Crop Season
Season 1 (January to July) Season 2 (October to December)
Range Mean Range Mean
Maize 5 -13 9 5 - 6 5
Beans 3 - 8 5 3 - 8 5
Cowpeas 3 -5 4 0 – 1 0.5
Paddy 0 - 10 5 3 - 4 4
Pigeon peas 3-9 6 0.3 – 1.1 0.7
Sesame 0.2 – 1.5 1.7 0.7 – 2 2.7
Green peas 1 - 3 2 0 – 1.4 1.4
Source: Field survey 2013 3.5.1 Crop production constraints Crop production mainly depends on timely land preparation, rainfall, proper use of inputs such as fertilizer, seed, pest control and others. Results from the Household survey showed that the major crop production constraints were infrequent visits from agricultural extension officers (80%). The extension services in the project areas are inadequate for most farmers and respondents stated that although they have complained in village assembly meetings, no additional support has been provided. Other constraints that were mentioned include shortage of agriculture tools (10%); unpredictable weather patterns possibly due to climate change (5%); shortage of seeds (5%) and others including shortages of fertilizers and degraded land, lack of agricultural inputs shops/farm input supply centre and lack of market for crops. All farmers (100%) complained about access to market. Most of the crops harvested in the project area are sold to middle men at the village at a low price. Also the crop-raiding animals like baboon, wild pig and others as listed in table 20 below, contribute to low crop yields in the project area. Table 20: Percentage of respondents mentioning different crop-raiding animals
Vermin animal Frequency
Percentage of respondents who mentioned the animal
Wild pig 95 14%

16
Vermin animal Frequency
Percentage of respondents who mentioned the animal
Baboon 118 18%
Blue monkey 72 11%
Vivert monkey 87 13%
Mangoose 76 11%
Elephant 4 0%
Porcupine 12 2%
Canet 128 19%
Rat 11 2%
Leopard 7 1%
Hyena 8 1%
Civet 52 8%
Source: Field survey 2013 3.6 Livestock production 3.6.1 Livestock ownership Results of this survey indicated that 69% of the households that were surveyed kept indigenous chickens, 11% of the respondents kept cattle, 29% kept goat/sheep and 14% kept pigs. The average livestock ownership ranges from 2 to 11 although there are some households that keep up to 60 cattle but these are very few based on the survey results. On average per household, people keep more goats and chickens than pigs or cattle. 3.6.2 Water sources for livestock and system of grazing During interviews it was noted that the major sources of water for livestock were wells, streams/rivers, ponds, dams. However, water supplied through these sources was not enough to feed the livestock. As noted earlier that the villages surveyed lack land use plans, there was no specific area where the cattle can get water and for grazing. The grazing system was “free grazing”. Moreover, it was realized that there had been some nomadic pastoralists particularly in lowland who comes into the landscape during the dry season searching for pasture for their livestock. They normally graze their cattle freely on cultivated farms after harvest and sometimes in protected areas like Kanga forest reserve and Mkingu Nature Reserve which are government restricted areas for human activities. 3.7. Beekeeping 3.7.1 Beekeeping practices 9% of the respondents stated that they practice bee-keeping while the remaining (91%) were not practising beekeeping. Of those who were involved in beekeeping, more than 56% have their own beehives, while 44% owned group beehives. Concerning the status of the beehives, more than half (58%) was made locally, while 42% were modern beehives (Table 21) Table 21: Number of people practising beekeeping per village
Village Number of people involved in beekeeping
Number Local beehives
Modern beehives
Difinga 3 2 1
Kanga 6 1 6

17
Village Number of people involved in beekeeping
Number Local beehives
Modern beehives
Masimba 5 5 0
Mndela 1 0 1
Msolokelo 2 2 0
Ndole 1 1 0
Total 18 11 8
Source: Field survey 2013 3.7.2 Institution supporting beekeeping The survey indicated that beekeepers particularly beekeeping groups were supported by various institutions. These institutions include TFCG and CARE through PEMA II and AVA project. The beekeepers were supported by these institutions through provision of: modern beehives and beekeeping education. Others were provided with accessories related to beekeeping such as overalls, bee veils, gloves, bee smokers, hive tools, galvanized wire, hummer pliers, sisal rope and honey strainer. Through discussions it was found that most of these equipments were provided to KAHECO and Tumaini Jema groups in Kanga Village which is adjacent to Kanga Forest Reserve. 3.7.2 Beekeeping production The reported yield from one traditional beehive varies from 2 to 5 litres of honey per 4 months while the modern beehives were reported to produce 5 - 10 litres per 4 months. 3.7.3 Accessibility of market for honey According to this survey, the availability of market for honey is high (67%) and all (100%) of the honey produced in the studied area were sold locally. The price of the locally packed honey was 10,000/= shillings per litre. This indicates that there is good market for honey in the surveyed area. There is a great potential for beekeeping practices to generate income which can contribute to poverty reduction and improving biodiversity. 3.7.4 Constraints of beekeeping Through KIIS with village leaders and interviews with beekeepers in the surveyed villages, it was noted that honey yields both from modern and traditional beehives were low compared with potential production (traditional yield 3-6 litres per hive while modern 5-10 litres per hive). Factors affecting yield include pests attacking the hives; bee-keepers not following the bee-keeping calendar; and bush fires. 3.8 Village Saving and Loan association (VSLA) VSLAs were operational In 43% of the surveyed villages. The aim of the VSLAs is to help villagers to save money for their children’s education, small investments and agriculture. The VSLAs also have a Welfare Fund. This is a financial system where community members contribute a small amount of money each week. This money is made available for emergencies. If the communities are well involved in the program they can reduce their poverty to some extent where the communities take loans and invest in livelihood activities.
3.8.1 Household involvement in VSLA In 2004 when the VSLAs were introduced, 42 % of the households were involved. Currently 34 % of households are involved. This suggests that there has been a decline in VSLA membership.

18
Plate 3 Illegal timber harvesting at Mkingu Nature reserve
The villagers were of the opinion that the reasons for the decline include:
Confiscation of properties for loan defaulter brings bad impression to a group and non-group members.
Short loan term (3 months) especially of higher amounts makes it difficult for borrowers to repay. Most of the members borrow money to invest in the farms and depend on crops to return their loans. In that case, the period of three months is too short for most of them and hence it has been the reason for drop outs.
They did not have enterprises that would enable them to participate fully in VSLA activities.
Community had not enough information about groups.
Misconception of men that groups were for women.
Moreover, among the challenges that face the operation of the VSLA includes;
Lack of entrepreneurship skills.
Inadequate Community Based trainers (CBT) for supervising VSLA.
JUVIHIMTU does not provide adequate support to its members.
Members to be in more than one group.
3.8.2 Training provided to VSLA The survey revealed that more than three quarters (79%) of the group members had not received training on entrepreneurship skills. Only a few (21%) reported to have participated in seminars on entrepreneurship skills. It was further revealed that community based trainers (CBT) visited their group for clarification of some issues such as how to save money, how to collect credits and how to write a monthly report. 3.9 Uses of forest product 3.9.1 Timber harvesting KIIs and interviews reported timber harvesting activities carried out in the Kanga Forest Reserve and Mkingu Nature Reserve. However, these activities were carried out illegally. Through households interviews 98% reported that they were not involved in illegal timber harvesting in the forests, while only 2% stated that they were involved in illegal timber harvesting. Field survey observed illegal timber activities in the forest reserve (Plate 3) none of the harvesters had requested a permit from the relevant institutions. 3.9.2 Charcoal Production Almost 98% of the households interviewed stated that they were not involved in charcoal making, while 2% said that they were involved in charcoal making. Interviews, further noted that charcoal makers used local kilns which were not efficient. This means that too many logs were used to produce a small amount of charcoal.

19
3.9.3 Follow village Bylaws and regulation during the harvesting
71% of the villagers who harvest forest resources do not follow the village regulations, this percentage is very high and if the effort will not be taken into consideration, the rate of deforestation and degradation will increase year after year. 3.10Tree planting The survey found that 21% of households were involved in tree planting. Of this 21%, the 67% planted trees inside their farms, 23% around their homesteads and 10% plant along their farm boundaries. In terms of species, 83% plant teak, mango trees 36% and orange trees 19% (Figure 2)
Figure 2: Percentage distribution of type of tree planted by household in the project villages 3.10.1 Supporting or training on tree planting The survey revealed that almost (97%) of the households interviewed had not received any support or training on tree planting. While only 3% of them had received training on how to plant and the type of trees to plant in the surveyed area. They further reported that they got training during the PEMA project which was conducted by CARE and TFCG in 6 years ago. 3.11 Household income 3.11.1 Household income from farming The landscape has two farming seasons (long and short rain season). The income from agriculture differs from one season to another (Table 15). The income from the agriculture was calculated based on six crops (maize, beans, rice, pigeon peas, sesame and groundnuts) which were mainly cultivated by villagers. The survey results revealed that villagers were most dependent on maize as a source of income and food. Those who sell maize earn average 260,000TZS per long rain seasons and 285,000 TZS per short rain season. During the rainy season the amount of crop yield per villagers are many to compare with short rain seasons so

20
the price of maize raised during the short rain season. Moreover the survey noted also the other crops contributed to household incomes to the landscape as indicated on the table 22. Table 22: Income of the household per crop
Type of crops Number of households selling crops during the short rainy season
Average income per household during long rain season
Number of households selling crops during long rainy season
Average income per households during long rain season
Maize 81 260,000 52 285,000
Beans 13 102,000 91 230,000
Groundnut 7 114,000 2 265,000
Paddy 10 287,000 7 232,000
Pigeon peas 18 198,000 14 130,000
Sesame 18 375,000 13 220,000
Source: Field survey 2013 It is worth noting that the true income of surveyed households could be higher than what is given in the tables 20 as respondents generally show reluctance to provide accurate information about their income for various reasons. Consequently, the data on household income needs to be cautiously interpreted.
3.11.2 Household income from livestock As noted earlier, villagers in the surveyed area mostly keep chicken than other livestock. Therefore, the income here was considered that is obtained from sale of chicken and other animal products separately. The survey revealed that the average income was 125,000 Tanzania shillings per households per year for those keeping livestock, while other incomes from sales of animal product such as milk, eggs and skins were averaged to 83,000 Tanzania shillings per household per year. 3.11.3 Other income Apart from the income obtained in crop farming and livestock keeping, other incomes were obtained from other sources such as small business, carpenter, brick making, labourer and Video show (Table 23). Table 23: Other Source of income
Sources of income No of people involved
Average income per year per person involved
Small business(kiosk, shop selling crops) 14 1,900,000
Local brews 2 496,000
From relatives (remittances) 2 120,000
Brick making 1 12,000,000
Labourer 1 510,000
Fire wood selling 1 495,000
Video show 1 400,000
Beekeeping 2 144,000
Masonry 3 1,800,000
Basketry 1 72,000
Carpentry 1 600,000

21
Source: Field survey 2013
3.12 Perception of household to the wellbeing in the past two years People’s perception on the wellbeing in terms of income and wealth of the community was also considered for the current and for the past two years. More than half (56% of the respondents) stated that the income was not sufficient to cover basic needs, while 39% of the respondents said it was enough and 5% of the respondents said was reasonable. Furthermore, the respondents were asked to compare general wellbeing over the past two years and at present. The results indicated that the current situation is better than in the past two years. The results revealed that 43% of the respondents said that the wellbeing of the household is better than two years ago and the other (54%) said that wellbeing was the same as two years ago while 23% of the respondents stated that they felt worse off. 62% of the household who said that they felt better off said that that agriculture contributed to their income, 17% of the household who stated that they were better off said that small business also contributed to the income of the household and make it better. In addition the other 14%, 4% and 3% of the household said that livestock, small business and Village Saving and loan Association respectively contributed to the household being better off.

22
4 CONCLUSIONS AND RECOMMENDATIONS
4.1 Conclusions The study revealed that the main economic activity in the surveyed villages is agriculture (95% of the respondent involved). It was observed that maize, beans sesame, paddy and pigeon peas were the main crops cultivated in the villages. Also the survey observed that the farmers practice conventional agriculture with 32% practicing one or more conservation agriculture technique. The survey noted that there was low level of understanding and lack of knowledge on CA principles which lead the farmers to practice the conversional as the result lead to low production of crops. It was noted in the villages that there are some people involved in the Village Saving and Loan Association which helped the villagers to get small capital for the agriculture, business and sometimes to pay school fees and other domestic uses. Although the VSLA seems to be helpful to the villagers but facing some challenges such as lack of entrepreneur skill and poor coordination. Due to lack of alternative income generating activities, villagers were engaged in charcoal making and illegal timber harvesting in order to get income for the domestic uses. It was noted that the villagers were practicing sustainable harvesting. Similarly charcoal makers use local kilns which caused the uses of many logs to produce a small amount of charcoal and leads to deforestation and forest degradation. The survey revealed that the majority (95%) of the respondents own land through inheritance, buying, given by village government or open the forest. It was noted that those owning land can sell it or rent it to another person as a sources of income. As in many other villages in Tanzania, the villages that were surveyed had no village land use plans to guide and control land use. This leads to poor management of land and sometimes land use conflict among farmers and pastoralist or farmers and forest managers. There is also a serious shortage of water in some villages like Masimba, Bwage and Kanga where there is no connection to piped water. But it was noted some villages like Msolokelo and Difinga had some piped water and closed wells which were supported by iWash project. The surveyed also observed that all respondent households use firewood for cooking. Open three-stone stoves were used by almost all households. In the upland villages it was reported that people bought firewood or have to invest a lot of their time in firewood collection. 4.2 Recommendations The most critical factor that constrained crop production in the project area is poor method of cultivation. Hence increase crop productions by use of appropriate organic practices such as timely planting, conservation agriculture techniques are highly recommended. It is important to integrate conservation agriculture practices with other practices such as agro forestry. Farmers, extension officers and facilitators need appropriate training. The concept of community based trainers should be introduced in order to help farmers to access extension services at the village level.
23
The landscape villages lack proper land use plan which leads to conflict of land uses especially for farming and grazing areas. Therefore, the study recommends that the land use concept should be introduced to the villages where the community members can use the land efficiently to improve their livelihoods. There is a great potential for beekeeping practices to generate income which can contribute to poverty reduction and improving biodiversity. It is a duty and responsibilities of community to utilize this potential for the sake of improving their livelihood. In the landscape, firewood is the main source of energy and communities use three stone stoves; therefore, it recommended that communities should be trained on how to construct and use improved stoves which enhance the efficiency of energy consumption. Most of the village offices are in poor condition and more than half of surveyed villages have no village offices. Villagers should be encouraged to use the little resources they have to construct a standard village office. Among of the challenges facing VSLA is lack of entrepreneur skill and poor coordination. Hence increased capacity to VSLA is needed.

24
6 REFERENCE
Giliba, R. A., Mafuru, C. S., Paul, M., Kayombo, C. J., Kashindye, A. M., Chirenje, L. I and Musamba, E. B. 2011. Human Activities Influencing Deforestation on Meru Catchment Forest Reserve, Tanzania, Journal of Human Ecology, 33(1):17-20
Kasamila , A.L and Marusuli, B.M (2004). The Role of Traditional Irrigational Systems in Poverty Alleviation in Semi arid Areas: The case of Chamazi in Lushoto District, Tanzania. REPOA, Research Report No 04.3
Nonga, H. E., Mdegela, R. H., Lie, E., Sandvik, M and Skaale, J. U. 2010. “Socio-economic Values of Wetlands Resources around Lake Manyara, Tanzania: Assessment of Environmental Threats and Local Community Awareness on Environmental Degradation and Their Effects”, Journal of Wetlands Ecology, 4:83-101.
25
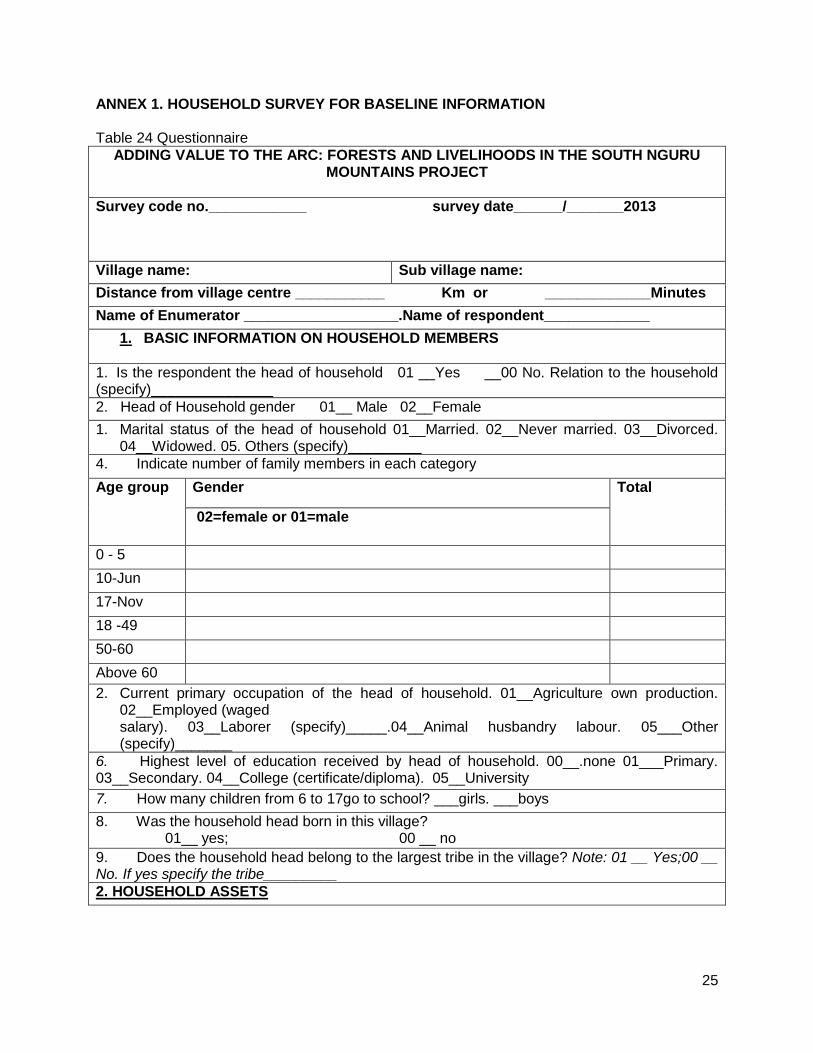
ANNEX 1. HOUSEHOLD SURVEY FOR BASELINE INFORMATION Table 24 Questionnaire
ADDING VALUE TO THE ARC: FORESTS AND LIVELIHOODS IN THE SOUTH NGURU MOUNTAINS PROJECT
Survey code no.____________ survey date______/_______2013
Village name: Sub village name:
Distance from village centre ___________ Km or _____________Minutes
Name of Enumerator ___________________.Name of respondent_____________
1. BASIC INFORMATION ON HOUSEHOLD MEMBERS
1. Is the respondent the head of household 01 __Yes __00 No. Relation to the household (specify)_______________
2. Head of Household gender 01__ Male 02__Female
1. Marital status of the head of household 01__Married. 02__Never married. 03__Divorced. 04__Widowed. 05. Others (specify)_________
4. Indicate number of family members in each category
Age group Gender Total
02=female or 01=male
0 - 5
10-Jun
17-Nov
18 -49
50-60
Above 60
2. Current primary occupation of the head of household. 01__Agriculture own production. 02__Employed (waged salary). 03__Laborer (specify)_____.04__Animal husbandry labour. 05___Other (specify)_______
6. Highest level of education received by head of household. 00__.none 01___Primary. 03__Secondary. 04__College (certificate/diploma). 05__University
7. How many children from 6 to 17go to school? ___girls. ___boys
8. Was the household head born in this village? 01__ yes; 00 __ no
9. Does the household head belong to the largest tribe in the village? Note: 01 __ Yes;00 __ No. If yes specify the tribe_________
2. HOUSEHOLD ASSETS

26
A.LAND ASSETS 1. Do you have land? 01__yes: 00__no 2. If yes, how did you obtained? 01.purchased 02.inherited 03.granted by village council 04.onverted public land/free land acquisition 05.other, (specify)
LAND TYPE
OWNED BY THE HOUSEHOLD NOT OWNED BY
THE HOUSEHOLD
1. Area of land used by the household acre
2. Area of land rented or lent out
3. Area of land rented or borrowed in and used by the household
Land used for shifting cultivation/ agriculture currently under cultivation
Land used for shifting agriculture currently under fallow
Land used for permanent agriculture
Agro forestry areas
Forest or woodland
Pasture
Other _____________
TOTAL
B.CONDITION OF THE HOUSE
1. What is the main material used in the construction of the floor?
2. What is the main material used in the construction of the walls?
3. What is the main material used in the construction of the roof?
Condition of the house
1. Floor 2. Walls 3. Roof

27
Codes for floor
Codes for walls Codes for roof
01 = mud 01 = leaves and tree poles 01 = thatch
02 = concrete/Cement
02 = raw boards/Timber 02 = Corrugated/Iron sheet
09 = other (specify
03 = mud and poles 09 = other (specify)
04 = burnt bricks
05 = cement blocks
09 = other (specify)
C.ACCESS TO UTILITIES
1. What is the main source of water for this household?
2. How far do you walk to fetch water?___ meters or ___minutes
3. Is water available throughout the year?
4. What is the main type of toilet facility used by this household?
Access to utilities
1. Source of water
2. Type of toilet Comments
Codes for water
Codes for toilet
01 = surface water (e.g. stream, river)
01 = bush
02 = spring water
02 = shared pit latrine
03 = open well
03 = own pit latrine
04 = closed well
09 = other (specify)
05 = piped water
06 = rainwater
07 = other
D. SOURCES OF ENERGY
1. What fuel do you use for cooking and lighting?

28
Cooking Lighting
01. Firewood,
01. Kerosene
02. Charcoal
02.Electricity
03. Faeces 03.Generator
04. Crop residue
04.Solar power
05. Gas 09. Other specify
09. Other specify
2. How many bundles of firewood / cans of charcoal does your household use per week? can you estimate the size in term of kg (take a photo of bundle and cane if necessary)
Sources Quantity per week (cane or bundle)
01.Firewood
02.Charcoal
E.LIVESTOCK AND OTHER ANIMALS
Please tell us the numbers of animals you have in the following categories, and also their current market value (not purchase price).
Type of animal
Number owned Value per unit (average)
Total value (Tsh)
1.
2.
3.
4.
F. OTHER ASSETS
Please tell us the items you may have in the following categories, including their number and current market value.
Note: It is important to record locally-important assets that might not be on this list. Please inquire about what these might be during the pretest. Additional items should only be those that are valued at 25 USD or 25,0000TSh and above.
Type of asset Number owned Value per unit (average)
Total value
1. Car
2. Tractor
3. Motorcycle

29
4. Bicycle
5. Cell phone
6. Television
7. Satellite dish
8. Radio
9. Stove for cooking (gas or electric only)
10. Sofa set, coaches
11. Chainsaw
12. Plough
13. Wooden cart or wheelbarrow
14. Water pump
15. Solar panel
16. Generator
17. Power tiller
18. Solar light
19. Maize mill
20. Other (>$25/25000)______________________
3. CONSERVATION AGRICULTURE
1. Have you heard of the term conservation agriculture? 00.No____01.Yes_______
2. if yes can you explain what does it mean?
3. Have you ever participated in any training and awareness raising event related with conservation agriculture? 00.No_01.Yes____
Event Organisation
4. Did you apply conservation agriculture technology in your farm field this season? 00.No______ 01. Yes_____

30
5. Do you practice any of the following techniques?
1. Use terracing to avoid soil erosion 6. Use herbicides? If so which one?
2. Minimum tillage 7. Use uphill and downhill ridges
3. Rotate crops on a given field 8. Mix crops and trees in your fields
4. Cover the soil by using crop covers to avoid soil erosion and store water
9. Use pesticides? If so, which ones
5. Use mulch to store water in the soil 10.Others specify
6. How did you prepare your farm this season?
01. Slash and burning 05. Ploughing
02. Burning 06. Pits
03. Slashing and leaving slashes to decay in the farm
07. Use slashed grasses to prepare terraces
04. Tilling by hand hoe 08. Others (specify)
7. Did you access agricultural credit/support for adding value to your agricultural produce this season?
Support Organisation
8. Have you ever advocate elected representatives and government officers for improvements in governance in relation to land, natural resources and agriculture 00.No______ 01. Yes_____
9. If yes, where did you do it?
10. What are your recommendations for more farmers to CA practices
4. BEEKEEPING
1. Are you involved in beekeeping? (If no skip beekeeping section)
00. No________01. Yes________ if Yes _Group or _____individual...? How much Dividends you received?
2. Have you ever participated in any training and awareness raising event related with beekeeping? 00. No________01. Yes_________
Event Organization

31
3. Do you use the modern or local beehives? 01. local _______02. Modern_______
4. How many beehives do you have? Local(Number)_________ Modern (Number)________
5. Have ever get support from any organization? 00. No________01. Yes_________
Type of support Institution
Do you access market for honey and beeswax? 01. Yes____(where_______) 00.No____
6. How much honey do you harvest per year per beehive?
7. How much money do you make from the beekeeping per year (sale of honey and beeswax)?
8. What are your recommendations for more villagers to practices beekeeping?
5.VILLAGE SAVINGS AND LOANS ASSOCIATION
1.Have ever engaged in VSLA? 00.No________01.Yes_____
2.Currently are a member of any VSLA group in your village? 00.No______ 01.Yes_____ (which group_______________)
3. Have you ever participated in any training and awareness raising event related with VSLA? 00.No_________01.Yes__________
Events Organization
4. Ever taken loan from your group? if Yes how much ______________
5. How do you use your loans related to VSLA?
6. what are the challenges are you facing as the member of VSLA?
7. What are your recommendations for more villagers to engaged more in VSLA?
USES OF FOREST PRODUCTS
1. Do you engaged in harvesting timber ? 00.No___01.Yes_____
2. Do you engaged in charcoal harvesting? 00. No_______. 01 Yes_______
3. Where do you harvesting timber and charcoal? Timber ________________ Charcoal _____________
4. Does the village has the regulation of harvesting forest product such as timber and charcoal? 00.No___01.Yes_____
5. If yes what are those regulations ?
6. Do you follow the village regulation during the harvesting this product? 00. No____01.Yes_______

32
7. If yes which procedure is required before harvesting this product?
8. What type of kilns are you use during charcoal burning (Local or improved); No.of bags per Kiln?
9. Where are the main markets of this forest product?
Product Market
Timber
Charcoal
10. How much money do you make in a year from
i. Timber _______________________ ii. Charcoal______________________ iii. Other forest products (Specify)______________ 11. Does the village have eco-tourism business?
12. How much money do you make in a year from ecotourism? 13. Are you involved in the wildlife trade (sale of live animals such a butterfly, chameleon and so on,? 14. Do you practsing hunting? 00. No__________01.Yes_________ 15. Do you follow the village procedures? 00. No___________01. Yes_______ 16. Do you cultivating at Mkingu Nature reserve or Kanga forest ? 00. No____ 01.Yes____ 17. Do you minining at the Mkingu NR or Kanga Forest Reserve? 00.No______01.Yes______ 18. Do you cut tree bark for making beehives? 00. No_______01. Yes_______ 19. Where do you cut poles for house and other constructions__________________________
TREE PLANTING/AGROFORESTRY
1. Do you planting trees? 00.No__________ 01.Yes__________ 2. Do you practising agro forestry in your farms? 00.No______ 01.Yes___
3. Where did you plant the trees?
Type of tree Where planted Who provided the trees seedlings/seeds
3. Have you ever participated in any training and awareness raising event related with tree planting/agro forestry? 00.No_________01.Yes__________
Events Organization
1. Have ever get support from any organisation? 00.No_________01.Yes__________
Type of support
Institution

33
CLIMATE CHANGE, REDD, JFM AND CBFM
1. Have you heard about climate change, REDD, JFM and CBFM 00.No________01Yes_____
2. If yes can you explain what about it?
Item If yes Explanation
CC Yes
REDD
JFM
CBFM/VLFRS
3. Can you list some of the causes and results of climate change?
Causes Results
4. Do you get any benefits from the forest?
5. If in term of money how much do you received as the result of forest conservation
6. Have you ever participated in any training and awareness raising event related with REDD, CC, CBFM and JFM
Event Yes/No From which organization
REDD
CC
CBFM
JFM
7. Have you heard of climate change adaptation? 00. No_______01.Yes___
8. If yes can you explain what is it?
01. Improve soil by adding fertilizers 02. proper management of forest 03. Improve agriculture practises 04. Improve water resources 05. Deforestation 06. Shifting cultivation
No. 1. Crop Total Production

34
2 3 4 5 6
Quantity harvested
Unit Quantity sold
Unit Price per unit
1
2
3
B.COST OF AGRICULTURAL PRODUCTION FROM FIRST SEASON IN THE LAST 12 MONTHS
No. Item Quantity
Units Price per unit
Total cost
1 Seeds
2 Fertilizers
3 Manure
4 Pesticides/herbicides/fungicides
5 Oxen to pull plough
6 Hired labor
7 Hired machinery
8 Transport/marketing
9 Packaging
10 Other, specify:
11 Payment for land rental
C.
No. 1. Crop Total Production
2 3 4 5
Quantity harvested
Unit Quantity
Unit
sold
1
2
3
4
5

35
D.
No. Item Quantity
Units Price per unit
Total cost
1 Seeds
2 Fertilizers
3 Manure
4 Pesticides/herbicides/fungicides
5 Oxen to pull plough
6 Hired labor
7 Hired machinery
8 Transport/marketing
9 Packaging
10 Other, specify:
11 Payment for land rental
E. INCOME FROM SALES OF ANIMALS IN THE LAST 12 MONTHS
1. Type of animal
2. Number slaughtered for own use (or given as gift)
3. Number sold (either live or slaughtered)
4. Price per unit
5. Total value of sales
(3 X 4)

36
F. INCOME FROM THE SALE OF ANIMAL PRODUCTS IN THE LAST 12 MONTHS
1. Product/service
2. Production (4+5) 3. Unit
4. Own use (including gifts)
5. Sold (including barter)
6. Price per unit
1. Milk[1]
2. Butter
3. Cheese
4. Eggs
5. Hides / skin
6. Manure
7. Bee hives
8. Honey
9. Other ____________
10. Other ____________
G. COSTS OF INPUTS FOR ANIMAL HUSBANDRY AND PRODUCTS IN THE LAST 12 MONTHS
1. Inputs 2. Unit 3. Quantity
4. Price per unit
5. Total costs (3X4)
1. Feed/fodder
2. Rental of grazing land
3. Medicines, veterinary services
4. Hired labor
5.Inputs

37
from own farm
6. Other _________________
7. Other _________________
H. OTHER INCOMES
7.CHANGE IN FOREST-BASED INCOME IN THE LAST TWO YEARS
We want to know how your forest-based income has changed in the last two years and the reasons for that change.
1. Has your household cleared any forest during the past two years? 1 = yes; 0 = no. If ‘yes,’ go to 2. If ‘no’, go to 9.(you have to define what is the forest as describe in the forest act).
2. How much forest was cleared in total in the last 2 years?
Plot 1
Plot 2 Plot 3
Indicate total area cleared in hectares, in up to 3 plots total.
If YES: 3. What was the main purpose of clearing the land?
Codes: 1=cropping; 2=tree plantation; 3=pasture; 4=non-agricultural uses
4. If used for crops (code ‘1’ in question above), which principal crop was grown?(code-crop)
5. What type of forest did you clear?
(code-forest)
6. If secondary forest, what was the age of the forest?
Indicate age of forest in years.
7. What was the ownership status of the forest cleared?
(code tenure)
8. How far from the house was the forest cleared located?
Indicate distance in kilometers
9. How much land used by the household has over the last 2 years been left for fallow or abandoned (left to convert to natural re-vegetation)?
In indicate area in hectares.
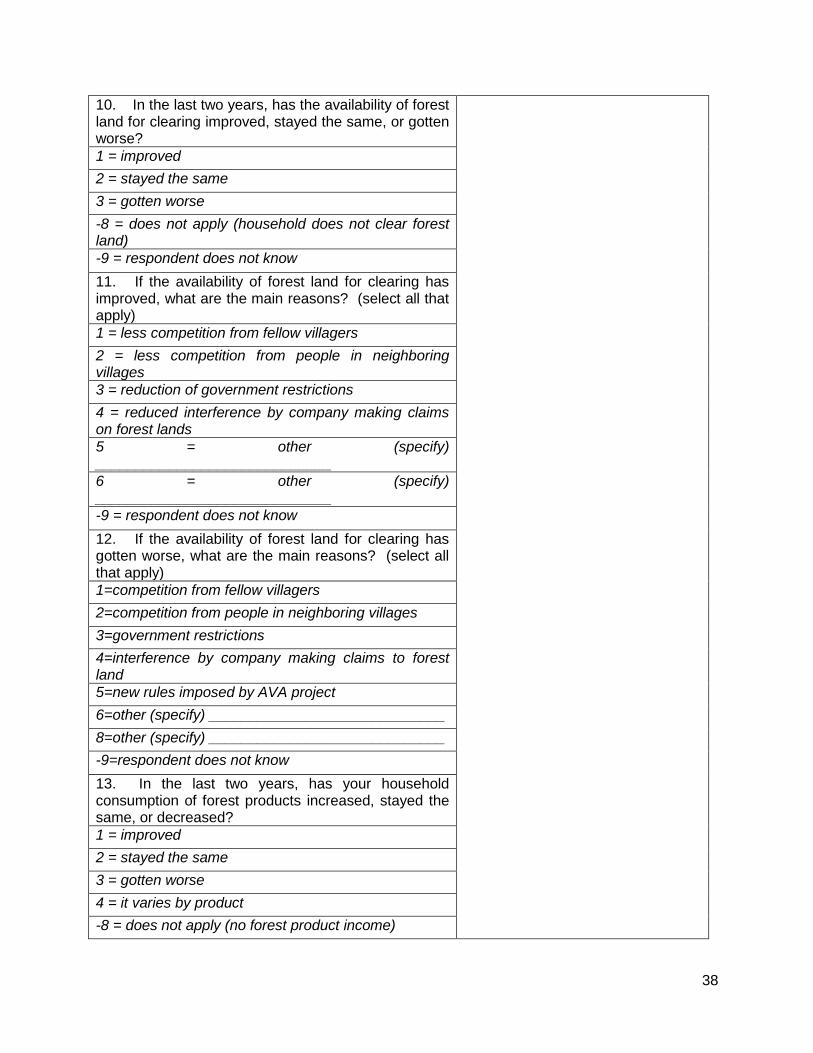
38
10. In the last two years, has the availability of forest land for clearing improved, stayed the same, or gotten worse?
1 = improved
2 = stayed the same
3 = gotten worse
-8 = does not apply (household does not clear forest land)
-9 = respondent does not know
11. If the availability of forest land for clearing has improved, what are the main reasons? (select all that apply)
1 = less competition from fellow villagers
2 = less competition from people in neighboring villages
3 = reduction of government restrictions
4 = reduced interference by company making claims on forest lands
5 = other (specify) _____________________________
6 = other (specify) _____________________________
-9 = respondent does not know
12. If the availability of forest land for clearing has gotten worse, what are the main reasons? (select all that apply)
1=competition from fellow villagers
2=competition from people in neighboring villages
3=government restrictions
4=interference by company making claims to forest land
5=new rules imposed by AVA project
6=other (specify) _____________________________
8=other (specify) _____________________________
-9=respondent does not know
13. In the last two years, has your household consumption of forest products increased, stayed the same, or decreased?
1 = improved
2 = stayed the same
3 = gotten worse
4 = it varies by product
-8 = does not apply (no forest product income)

39
-9 = respondent does not know
14. In the last two years, has the forest cash income (i.e. for sale, not home consumption) of your household improved, stayed the same, or gotten worse?
1 = improved
2 = stayed the same
3 = gotten worse
4 = it varies by product
-8 = does not apply (no forest product income)
-9 = respondent does not know
8. PERCEPTIONS OF WELLBEING AND WELLBEING CHANGE IN LAST TWO YEARS
1. Has the household’s income over the past two years been sufficient to cover what you consider to be the needs of the household?
Read out the codes 1 through 3:
1=yes; 2=reasonable (just about sufficient); 3=no
2. Compared with other households in the village (or community), how well-off is your household?
Read out the codes 1 through 3:
Codes: 1=better-off; 2=about average; 3=worse-off
3. How well-off is your household today compared with the situation two years ago?
Read out the codes:
1=better-off now; 2=about the same; 3=worse off now
If the answer is 1 go to question 5. If the answer is 3 go to question 6.
If the answer is 2 got to section 7.
9. HUMAN-WILDLIFE CONFLICT
1 Please tell us which wild animals raid your crops or attack livestock.
Animal Tick as many boxes as are mentioned
Bush pig
Baboon
Blue monkey
Vervet monkey

40
Mongoose
Elephant
Porcupine
Cane rat
Leopard
Lion
Hyena
Civet
Other. Please specify
10. FIRE
1. Do you use fire to clear your shamba? 00.No_________01.Yes__________
2. Which preventive measures do you take to protect against wild fires?
Preventive measure
Please tick
01. Clear fire break
02. Inform neighbours
03. Burn at night
09. Other (specify)
3. Have you ever participated in any training and awareness raising event related with bush fire management 00.No_________01.Yes__________

41
ANNEX 2: KEY INFORMANT
VILLAGE LEADER QUESTIONS
AVA PROJECT MVOMERO DISTRICT, MOROGORO
BASELINE DATA
Village name _____________Survey date_______________
Enumerator’s name__________________ 1. Number of village committee existing _______________ Number of VC and VNRC members segregated by gender __________________ 2. Number of VSLA existing in the Village ______________________ 3. Number of household planted trees (Type of trees most planted and places where the tree
planted) 4. Number of bee keeping groups existing in the village (which organization support them)
number of beekeeping equipments (no. Of hives, bee smokers etc)
5. Number of household practicing beekeeping
6. Does the village have conservation agriculture programme?
7. Number of household use improved stoves? Who introduced that?
8. Number of primary school existing in the school
9. Main economic livelihood activities
10. Main crop cultivated in the village? Production per acre?
11. What are the main driver of deforestation and forest degradation
12. Does the village have land use plan?
13. Has the village experience any conflict in the last 12 months with pastoralist or farmers

42
ANNEX 3 DATA SCORE
Table 25: Data score
Gender of the head of household
Male Female
85% 15%
Bwage 70% 30%
Difinga 87% 13%
Kanga 86% 14%
Kinda 87% 13%
Masimba 82%
16%
Maskati 82%
16%
Mndela 100% 0%
Msolokelo 95%
5%
Ndole 81% 19%
Age of household members and household size
0 - 5 6 - 10 11 – 17 18 – 49 50 – 60 >60 Total
Bwage 16 17 16 20 12 3 84
Difinga 24 25 24 25 19 4 121
Kanga 21 18 18 26 15 2 100
Kinda 15 14 13 15 10 3 70
Masimba 20 18 19 26 4 3 90
Maskati 19 21 21 22 13 3 99
Mndela 7 7 6 9 4 0 33
Msolokelo 11 12 11 12 11 3 60
Ndole 24 22 24 25 14 7 116
Total 157 154 152 180 102 28 773
% of HH members per age group 20% 20% 20% 23% 13% 4% 100%
Marital status
Married 94%
Widowed 4%
Divorced 2%
Education level

43
Completed primary school 80%
Completed secondary school 2%
Completed college 1%
Did not attend any formal education 17%
Children (6-7 age) attending school 56%
Not attending school 44%
Distribution of tribes per village
Tribe Bwage %
Difinga %
Kanga%
Kinda %
Masimba %
Maskati %
Mndela %
Msolokelo%
Ndole%
Zigua 65 53 54 7 39 14 10 38 27
Nguu 5 17 0 93 54 86 90 48 69
Kaguru 25 17 0 0 4 0 0 5 0
Chagga 5 0 18 0 0 0 0 0 0
Pare 0 0 4 0 0 0 0 0 0
Sukuma 0 0 4 0 0 0 0 0 0
Hehe 0 0 14 0 0 0 0 5 4
Nyakusa 0 0 7 0 0 0 0 0 0
Gogo 0 10 0 0 32 0 0 0 0
Barabaig 0 3 0 0 0 0 0 0 0

44
Kinga 0 3 0 0 0 0 0 0 0
Maasai 0 0 0 0 0 0 0 5 0
Main economic activities
Econonomic activity
Bwage (%)
Difinga (%)
Kanga (%)
Kinda (%)
Masimba (%)
Maskati ( %)
Mndela(%)
Msolokelo (%)
Ndole (%)
Agriculture 90 87 100 87 79 100 100 100 85
Wage salary 0 3 0 0 4 0 0 0 0
Laborer 5 3 7 7 0 0 0 0 8
Livestock 10 3 0 0 0 0 0 5 0
Ownership of assets
Village
Assets
Radio Bicycle Motor cycle
Mobile telephone
Satellite dish
Tractor TV Car
Masimba 4 17 3 10 0 0 1 2
Maskati 6 0 1 9 0 0 0 2
Ndole 16 8 2 15 1 1 0 0
Bwage 15 17 4 14 0 0 1 0
Difinga 20 19 8 11 0 0 0 0
Kanga 18 20 3 17 0 0 1 0
Kinda 11 0 2 9 1 0 0 0
Msolokelo 9 7 3 8 0 0 0 0
Mndela 7 1 7 0 0 0 0
Total 119 89 27 101 2 1 3 4
Water sources
Water source Percentage (%)
Piped well 35
Surface water 25
Closed well 15
Open well 13
Spring 12
Village Percentage of water sources
Surface water/River (%)
Closed well (%)
Piped well (%)
Spring (%)
Open well (%)
Bwage (N=20) 35 30 40 0 0
Difinga (N=30) 17 27 23 3 33
Kanga (N=28) 28 43 0 11 18
Kinda (N=15) 60 0 0 20 27
Masimba (N=28) 0 40 0 30 31
Maskati (N=22) 59 0 5 32 9

45
Village Percentage of water sources
Surface water/River (%)
Closed well (%)
Piped well (%)
Spring (%)
Open well (%)
Mndela (N=10) 80 0 0 20 0
Msolokelo (N=21) 0 0 100 5 5
Ndole (N=26) 38 0 65 0 0
Household access to toilet
Type of toilets Percentage (%)
Bush 1
Shared pit latrine 38
Own pit latrine 61
Total 100
Bush (%) Shared pit latrine (%) Own pit latrine (%)
Bwage 0 30 70
Difinga 7 37 57
Kanga 0 50 50
Kinda 0 33 67
Masimba 4 46 50
Maskati 5 32 64
Mndela 0 30 70
Msolokelo 0 19 81
Ndole 8 38 54
Social services
Social services No of services at the project
Percentage of the services
Dispensary 6 67%
Water point/piped or closed well
4 44%
Primary school 9 100%
Pharmacy/medicine shop 2 22%
Village office 4 44%
Conservation agriculture
Meaning of CA Percentage (%)
Terraces to avoid erosion 5
Mulching to conserve water in the filed 2
Tree and agriculture in the filed 5
Agriculture with forest conservation 14
Preparation of farm without burning 9
cannot define CA 65

46
CA TECHNIQIES PERCENTAGE
Use of mulch to store water in the soil 5%
Use of terraces to avoid soil erosion 2%
Minimum tillage 28%
Cover the soil use crops cover 31%
Type of crop
Bwage
Difinga
Kanga
Kinda
Masimba
Maskati
Mndela
Msolokelo
Ndole
Maize 95 100 93 93 75 95 90 100 100
Beans 25 20 14 93 39 100 40 14 38
Paddy 25 27 54 0 0 0 0 0 0
Sesame
35 3 21 0 11 0 0 14 8
Mbaazi 10 20 7 7 0 0 10 0 19
Vermin animal Frequency
Percentage of respondents who mentioned the animal
Wild pig 95 14%
Baboon 118 18%
Blue monkey 72 11%
Vivert monkey 87 13%
Mangoose 76 11%
Elephant 4 0%
Porcupine 12 2%
Canet 128 19%
Rat 11 2%
Leopard 7 1%
Hyena 8 1%
Civet 52 8%

47
Annex 4: Crop yield per acre per village in season one (long rain season)
Table 26 Crop yield per acre per village in season one (long rain season) Crop Bwage Difinga Kanga Kinda Masimba Maskati Mndela Msolokelo Ndole
Range
Average
Range
Average
Range
Average
Range
Average
Range
Average
Range Average
Range
Average
Range
Average
Range
Average
Maize 1-18 9 3-20 12 5-13
9 3-7 5 5-13 9 2-10 5 2-5 3 5-12 11 1-12 6
Beans - - 0-2 1 1-3 2 2-8 5 1-7 4 1-5 3 1-4 2 1-3 2 1-3 2
Paddy 3-10 6 1-8 4 0-10
10 - - - - - - - - - - - -
Pigeon peas
0-2 1 0-9 4.5 0-1 0.5 - - - - - - 0-4 2 0-1 0.5 0-1 0.5
Sesame 0-1 0.5
0-3 1.5 0-2 1 - - - - 0-1 0.5
- - 0-1 0.5 0-2 1
Green peas
0-1 0.5
0-3 1.5 0-3 1.5 0-1 0.5
0-1 0.5 - - - - - - - -
Source: Field survey 2013


![HPTN 068 Study Household Baseline Questionnaire …...Household Baseline Questionnaire 31 JANUARY 2011-- FINAL -- v1.0 [ ] [ ] Caregiver Relationship Codes Coding: List all household](https://img.dokumen.tips/doc/110x75/5f3b3afb5990ba394b68f5ae/hptn-068-study-household-baseline-questionnaire-household-baseline-questionnaire.jpg)

![Guiding focus group discussions [manual] · Baseline Household Level Questionnaire (CCAFS Household Baseline Survey 2010-12, ... class and age. In focus group discussions farmers](https://img.dokumen.tips/doc/110x75/5f4d59d4f0cfab39f828da03/guiding-focus-group-discussions-manual-baseline-household-level-questionnaire.jpg)