Embed Size (px)
Citation preview
8/8/2019 Adding Multiple Sources
http://slidepdf.com/reader/full/adding-multiple-sources 1/27
Adding Multiple Sources
Data is often partitioned into multiple physical sources for a single logical table in a
business model. When a logical table source does not contain the entire set of data at a
given level, you need to specify the portion of the set that it does contain. When
individual sources at a given level contain information for a portion or fragment of thedomain, Oracle BI Server needs to know the content of the sources in order to pick the
appropriate source for the query. The goal is to provide seamless and efficient access
from the users' perspective. When there are multiple sources, the metadata is built so thatOracle BI Server handles the navigation to the appropriate source. Oracle BI Server can
seamlessly access and process data from multiple sources in an efficient manner to satisfy
users’ requests.
In this example, sales quota numbers are stored in an Excel workbook. The workbook,
SHQuota.xls, is stored on your machine. You incorporate the quota numbers into the
business model and create business measures to report variance from quota and percent
of quota.
To add quota information to the business model, you perform the following steps.
Create an ODBC DSN
Import the Excel Source
Map Logical Dimension Columns
Create Quota Measures
Test
To create an ODBC DSN for the Excel workbook, perform the following steps:
1. Using Windows Explorer, navigate to the SetupFiles folder and copy the SHQuota.xls file to a
location on your machine.
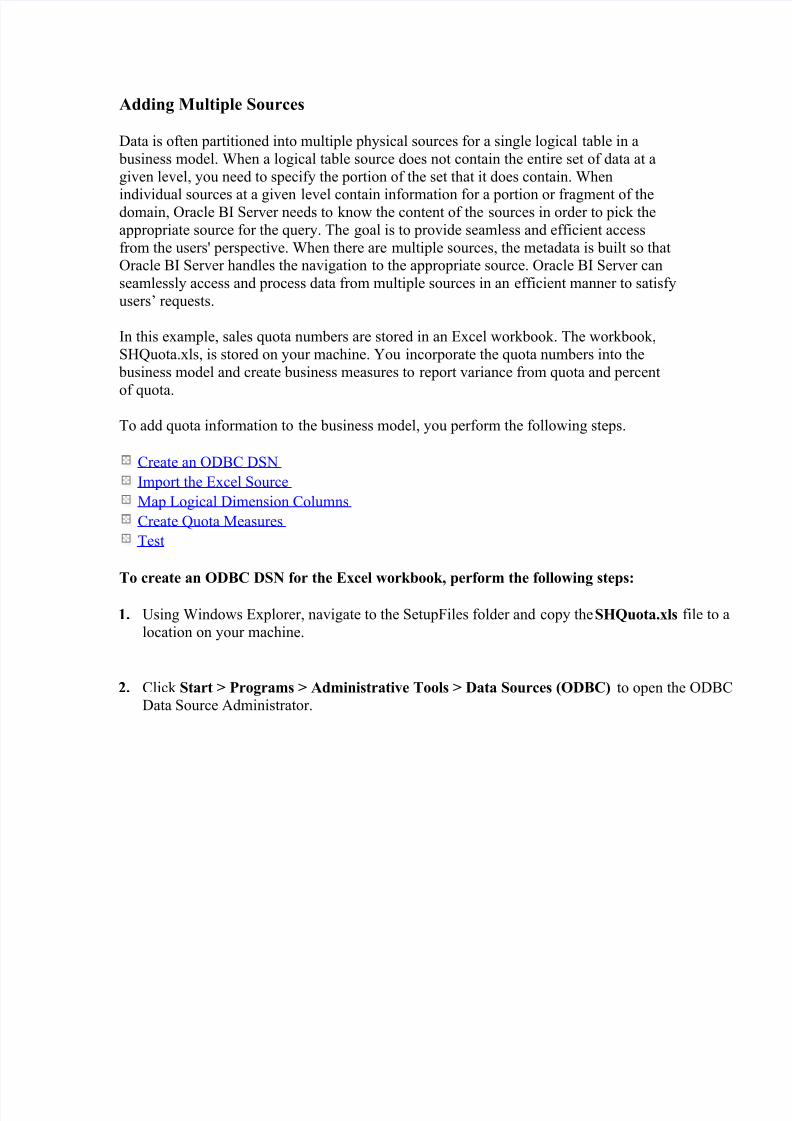
2. Click Start > Programs > Administrative Tools > Data Sources (ODBC) to open the ODBCData Source Administrator.
8/8/2019 Adding Multiple Sources
http://slidepdf.com/reader/full/adding-multiple-sources 2/27
3. Click the System DSN tab and click Add.

8/8/2019 Adding Multiple Sources
http://slidepdf.com/reader/full/adding-multiple-sources 3/27
The Create New Data Source dialog box opens.
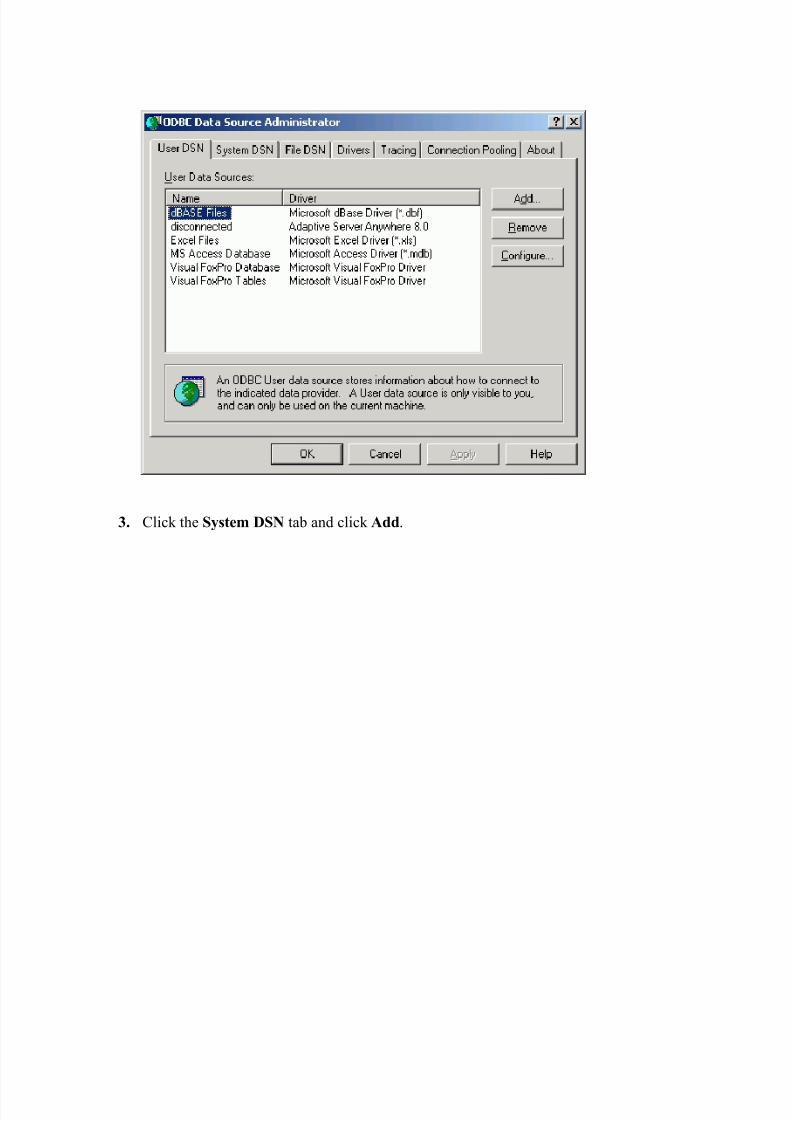
4. In the Create New Data Source dialog box, select the Microsoft Excel Driver.
8/8/2019 Adding Multiple Sources
http://slidepdf.com/reader/full/adding-multiple-sources 4/27
5. Click Finish to open the ODBC Microsoft Excel Setup dialog box.
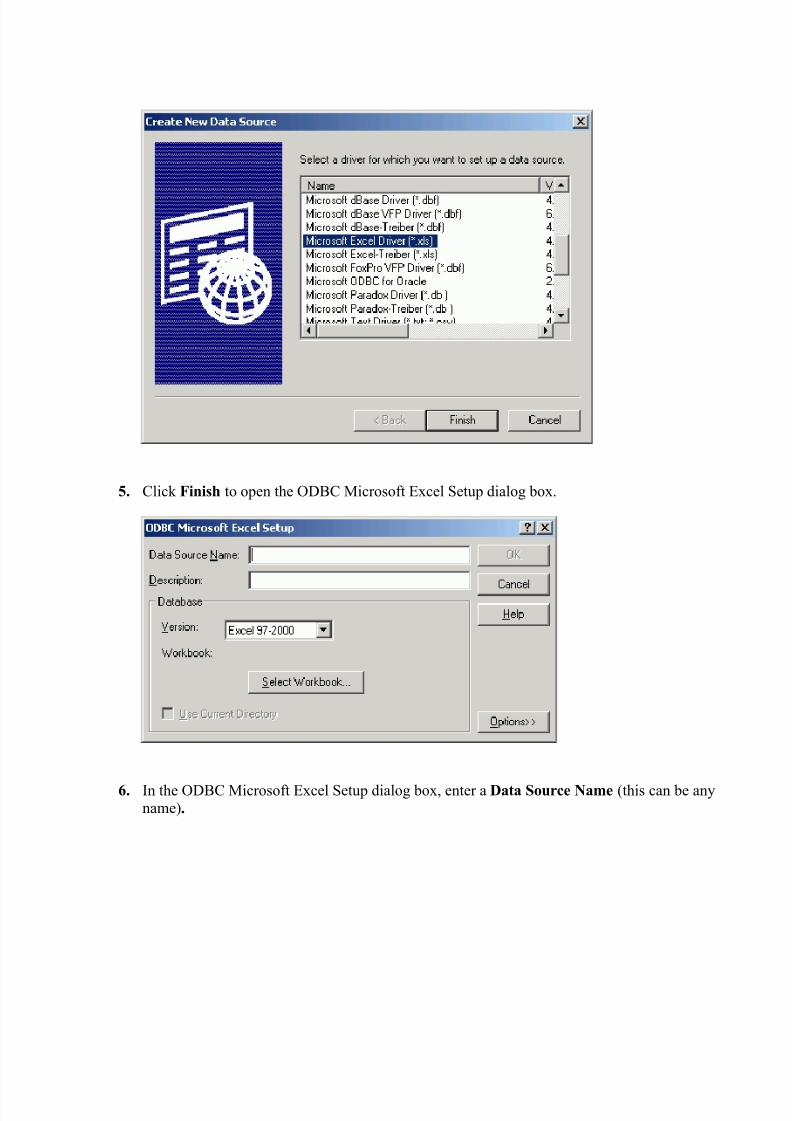
6. In the ODBC Microsoft Excel Setup dialog box, enter a Data Source Name (this can be anyname).
8/8/2019 Adding Multiple Sources
http://slidepdf.com/reader/full/adding-multiple-sources 5/27
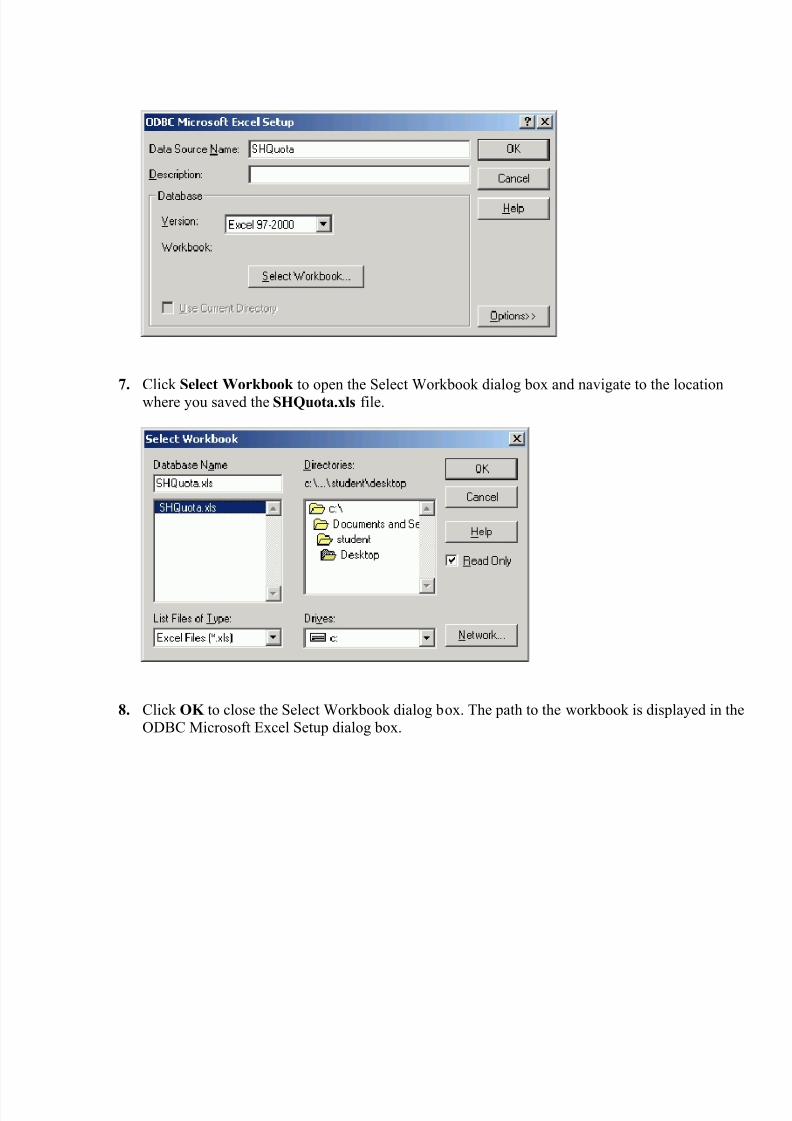
7. Click Select Workbook to open the Select Workbook dialog box and navigate to the locationwhere you saved the SHQuota.xls file.
8. Click OK to close the Select Workbook dialog box. The path to the workbook is displayed in theODBC Microsoft Excel Setup dialog box.

8/8/2019 Adding Multiple Sources
http://slidepdf.com/reader/full/adding-multiple-sources 6/27
9. Click OK to close the ODBC Microsoft Excel Setup dialog box.
10. Verify that the Excel system data source is added in the ODBC Data Source Administrator and
click OK to close the ODBC Data Source Administrator.
Back to Topic
8/8/2019 Adding Multiple Sources
http://slidepdf.com/reader/full/adding-multiple-sources 7/27
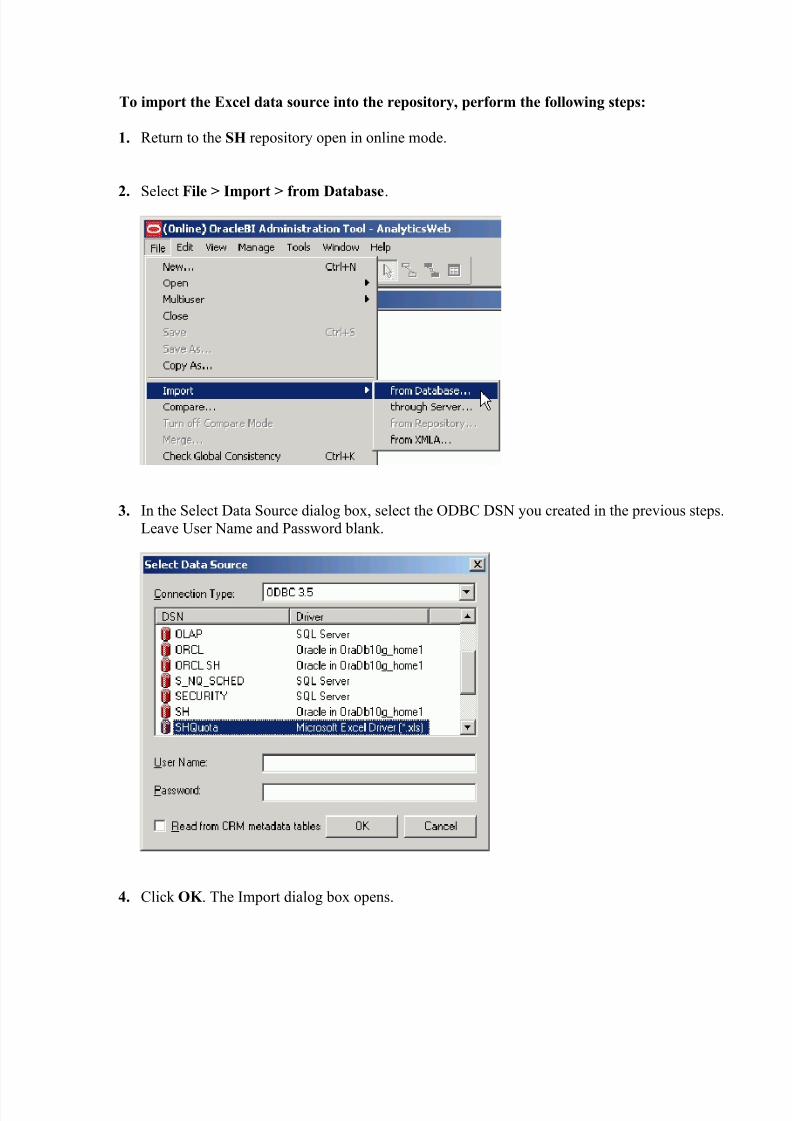
To import the Excel data source into the repository, perform the following steps:
1. Return to the SH repository open in online mode.
2. Select File > Import > from Database.
3. In the Select Data Source dialog box, select the ODBC DSN you created in the previous steps.
Leave User Name and Password blank.
4. Click OK . The Import dialog box opens.

8/8/2019 Adding Multiple Sources
http://slidepdf.com/reader/full/adding-multiple-sources 8/27
5. In the Import dialog box, select the SHQuota object.
6. Verify that only Tables and Keys are checked and click Import.
7. When import completes, close the Import dialog box and verify that all four range tables have
been imported into the Physical layer.
8/8/2019 Adding Multiple Sources
http://slidepdf.com/reader/full/adding-multiple-sources 9/27
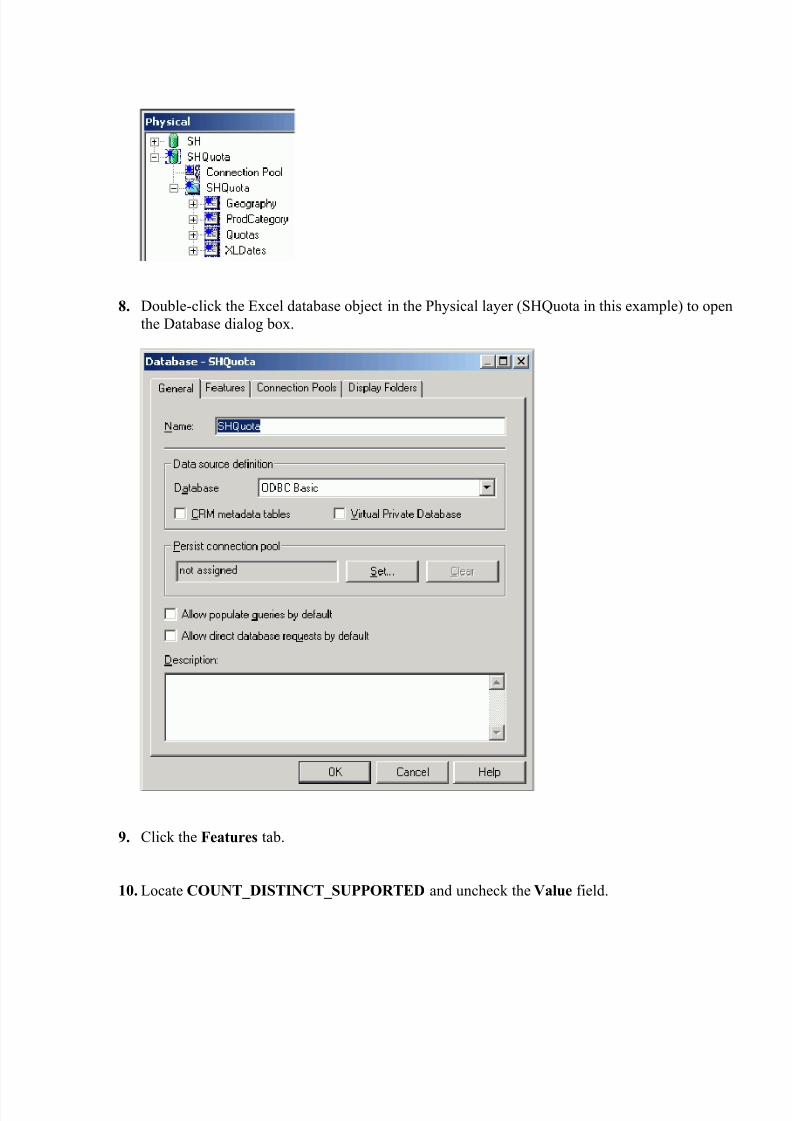
8. Double-click the Excel database object in the Physical layer (SHQuota in this example) to open
the Database dialog box.
9. Click the Features tab.
10. Locate COUNT_DISTINCT_SUPPORTED and uncheck the Value field.
8/8/2019 Adding Multiple Sources
http://slidepdf.com/reader/full/adding-multiple-sources 10/27
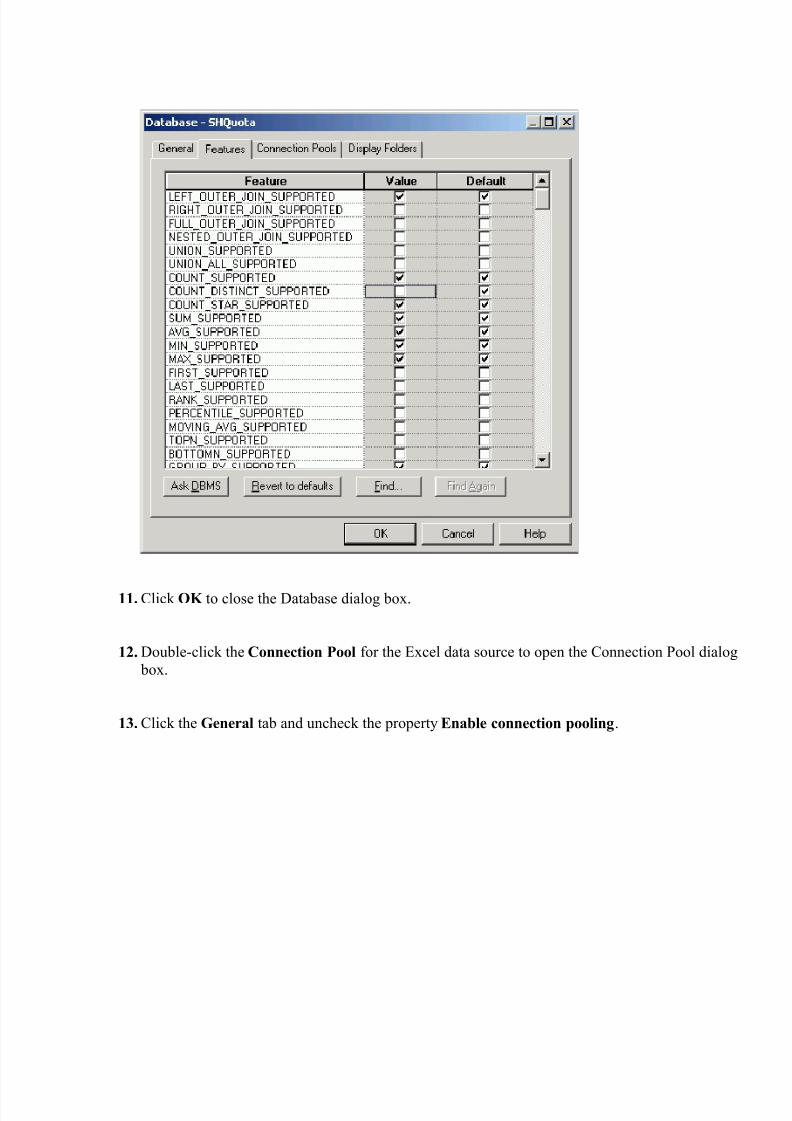
11. Click OK to close the Database dialog box.
12. Double-click the Connection Pool for the Excel data source to open the Connection Pool dialog
box.
13. Click the General tab and uncheck the property Enable connection pooling.

8/8/2019 Adding Multiple Sources
http://slidepdf.com/reader/full/adding-multiple-sources 11/27
14. Click OK to close the Connection Pool dialog box.
15. Check in changes.
16. Save the repository.
Back to Topic
To map the logical dimension columns, perform the following steps:
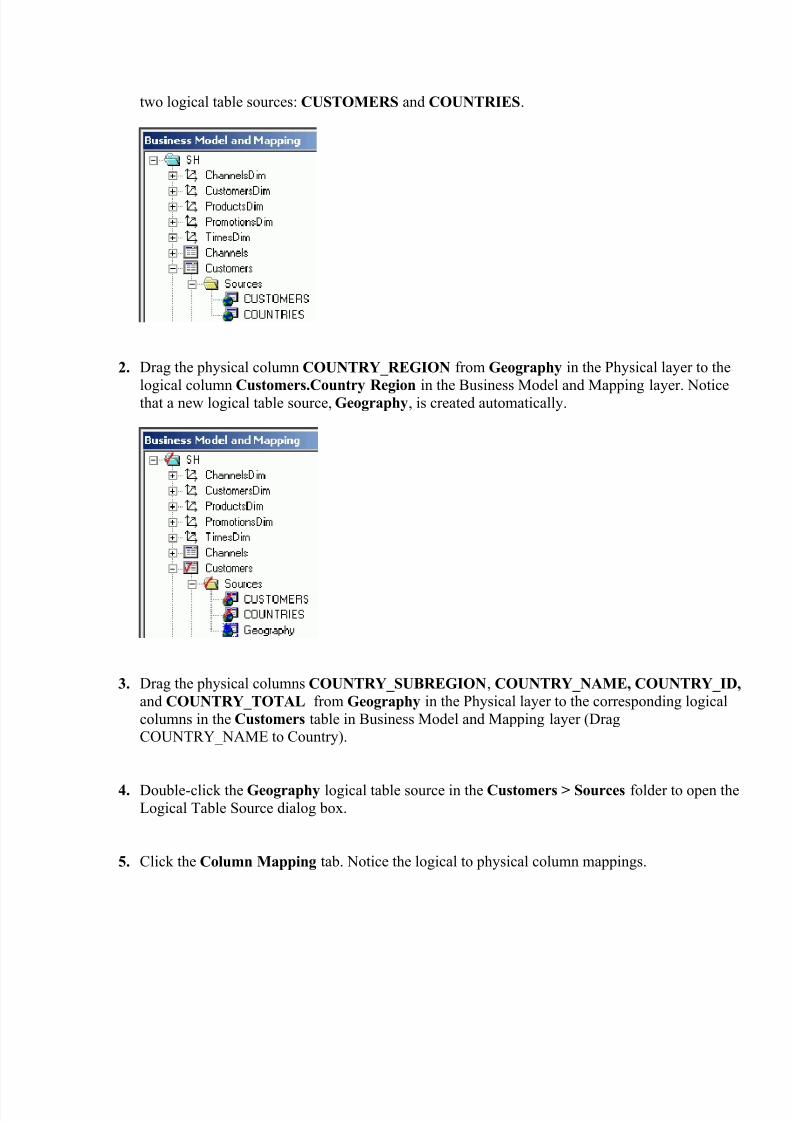
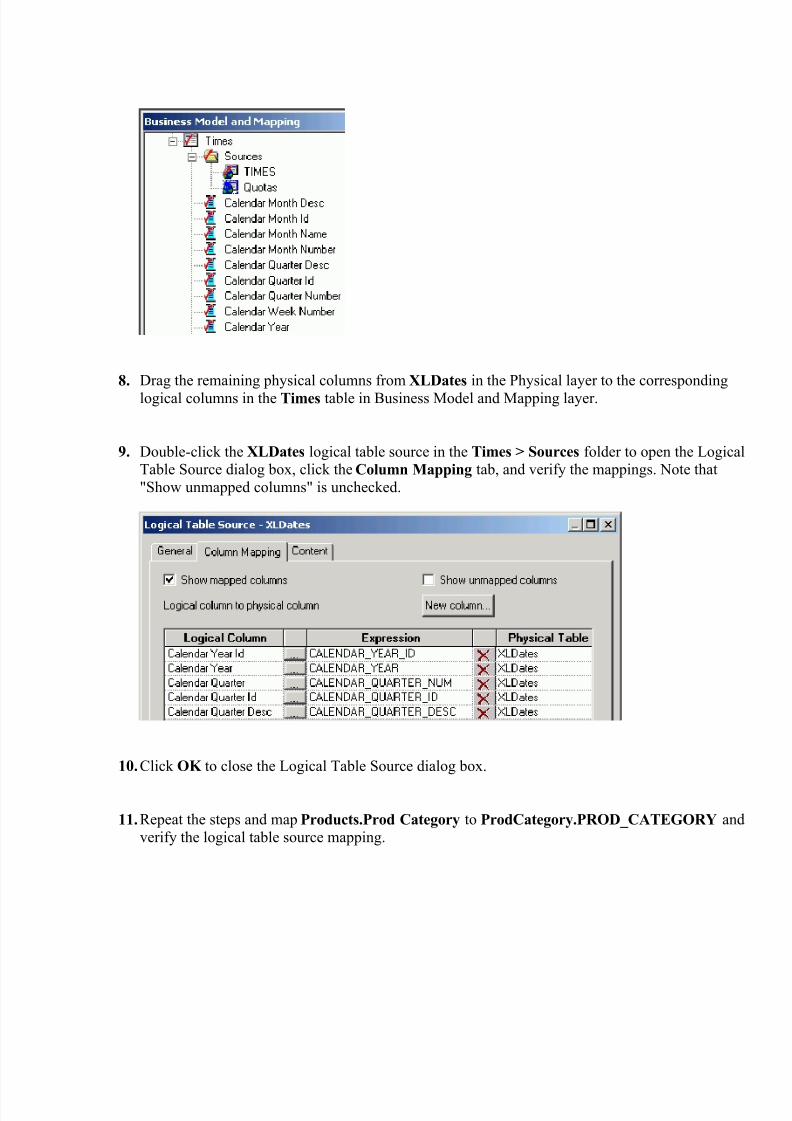
1. In the Business Model and Mapping layer, expand Customers > Sources and note that there are
8/8/2019 Adding Multiple Sources
http://slidepdf.com/reader/full/adding-multiple-sources 12/27
two logical table sources: CUSTOMERS and COUNTRIES.
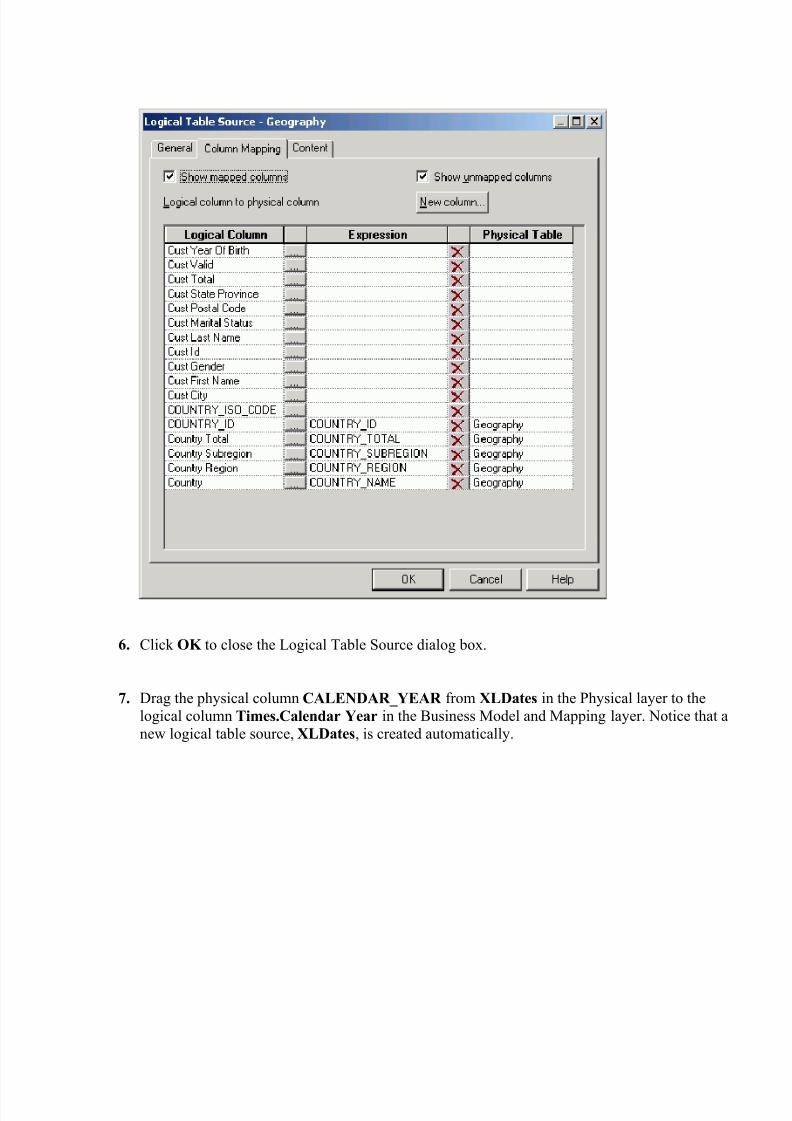
2. Drag the physical column COUNTRY_REGION from Geography in the Physical layer to the
logical column Customers.Country Region in the Business Model and Mapping layer. Noticethat a new logical table source, Geography, is created automatically.
3. Drag the physical columns COUNTRY_SUBREGION, COUNTRY_NAME, COUNTRY_ID,
and COUNTRY_TOTAL from Geography in the Physical layer to the corresponding logical
columns in the Customers table in Business Model and Mapping layer (DragCOUNTRY_NAME to Country).
4. Double-click the Geography logical table source in the Customers > Sources folder to open theLogical Table Source dialog box.
5. Click the Column Mapping tab. Notice the logical to physical column mappings.
8/8/2019 Adding Multiple Sources
http://slidepdf.com/reader/full/adding-multiple-sources 13/27
6. Click OK to close the Logical Table Source dialog box.
7. Drag the physical column CALENDAR_YEAR from XLDates in the Physical layer to the
logical column Times.Calendar Year in the Business Model and Mapping layer. Notice that a
new logical table source, XLDates, is created automatically.
8/8/2019 Adding Multiple Sources
http://slidepdf.com/reader/full/adding-multiple-sources 14/27
8. Drag the remaining physical columns from XLDates in the Physical layer to the corresponding
logical columns in the Times table in Business Model and Mapping layer.
9. Double-click the XLDates logical table source in the Times > Sources folder to open the LogicalTable Source dialog box, click the Column Mapping tab, and verify the mappings. Note that
"Show unmapped columns" is unchecked.
10.Click OK to close the Logical Table Source dialog box.
11.Repeat the steps and map Products.Prod Category to ProdCategory.PROD_CATEGORY and
verify the logical table source mapping.

8/8/2019 Adding Multiple Sources
http://slidepdf.com/reader/full/adding-multiple-sources 15/27
12.Use Ctrl+Click to select all four SHQuota tables in the Physical layer.
13.Right-click any one of the four tables and select Physical Diagram > Selected Object(s) Only to
open the Physical Diagram.
14. In the Physical Diagram, use the New foreign key button to create the following joins. Hint: Use
CTRL+click to create the multi-column joins or type the join expressions in the Expression field.
Create new keys when prompted.
XLDates.CALENDAR_QUARTER_NUMBER = Quotas."Calendar Quarter Number" AND
XLDates.CALENDAR_YEAR = Quotas."Year" AND
XLDates.CALENDAR_QUARTER_DESC = Quotas."Calendar Quarter Desc"
Geography.COUNTRY_NAME = Quotas.Country AND Geography.COUNTRY_SUBREGION
= Quotas."Country Subregion" AND Geography.COUNTRY_REGION = Quotas."CountryRegion"
ProdCategory.PROD_CATEGORY = Quotas."Prod Category".
15.Close the Physical Diagram.

8/8/2019 Adding Multiple Sources
http://slidepdf.com/reader/full/adding-multiple-sources 16/27
Back to Topic
To create the quota measures, perform the following steps:
1. Drag the column Quotas.Quota from the Physical layer onto the Sales Facts logical table.
Notice that a new logical table source, Quotas, and a new logical column, Quota, are created.
2. Double-click Sales Facts.Quota to open the Logical Table dialog box.
3. Click the Aggregation tab and set the aggregation rule to Sum.

8/8/2019 Adding Multiple Sources
http://slidepdf.com/reader/full/adding-multiple-sources 17/27
4. Close the Logical Table dialog box.
5. The Quota logical column states quota in thousands, so rename Quota to Quota (000).
6. Right-click Sales Facts and select New Object > Logical Column to open the Logical Columndialog box.
7. Click the General tab and name the logical column Quota.
8. Check Use existing logical columns as the source.

8/8/2019 Adding Multiple Sources
http://slidepdf.com/reader/full/adding-multiple-sources 18/27
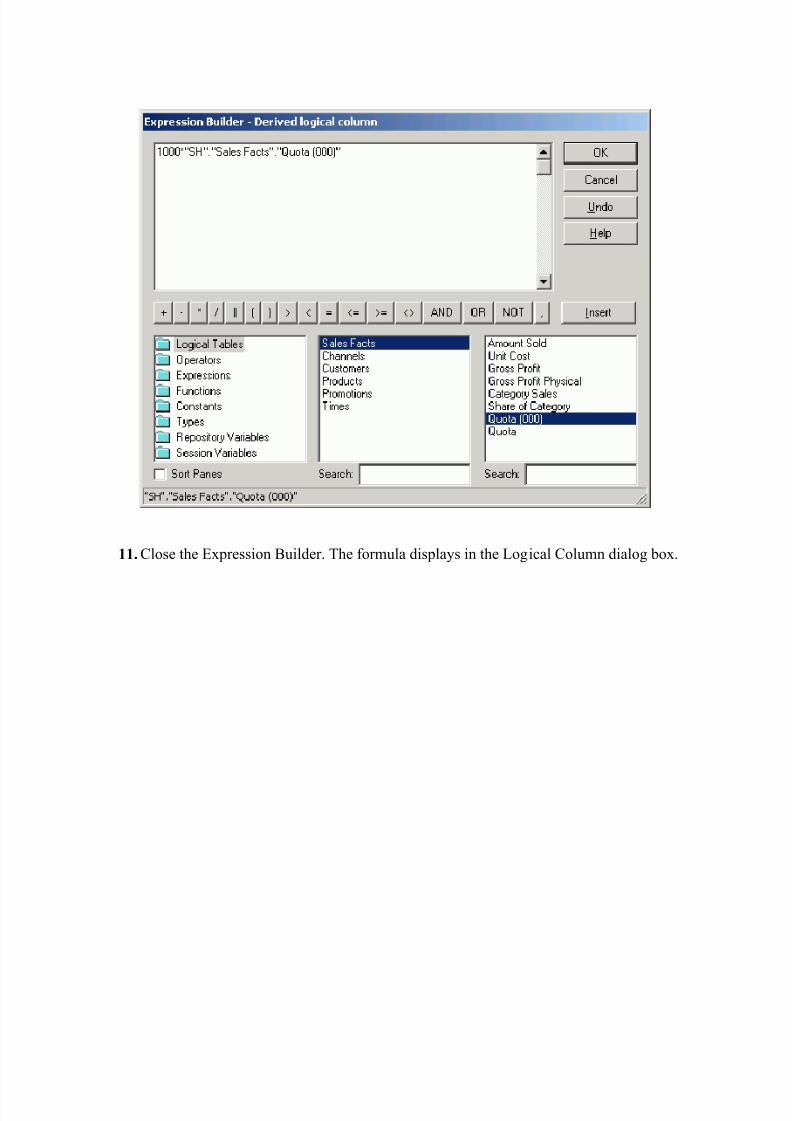
9. Click the Expression Builder button (three dots) to open the Expression Builder.
10. Create the following formula:
1000*"SH"."Sales Facts"."Quota (000)"
8/8/2019 Adding Multiple Sources
http://slidepdf.com/reader/full/adding-multiple-sources 19/27
11. Close the Expression Builder. The formula displays in the Logical Column dialog box.

8/8/2019 Adding Multiple Sources
http://slidepdf.com/reader/full/adding-multiple-sources 20/27
12. Close the Logical Column dialog box. The Quota column is added to the business model.
13. Right-click Sales Facts.Amount Sold and select Calculation Wizard.
14. Click Next.
15. Select the Quota column.

8/8/2019 Adding Multiple Sources
http://slidepdf.com/reader/full/adding-multiple-sources 21/27
16. Click Next.
17. Make sure Change is selected. In the Calculation Name field, name the calculation Variance
from Quota.

8/8/2019 Adding Multiple Sources
http://slidepdf.com/reader/full/adding-multiple-sources 22/27
18. Uncheck Percent Change.
19. Check Percent and make sure it is selected. In the Calculation Name field, leave the name as is:
% of Quota.

8/8/2019 Adding Multiple Sources
http://slidepdf.com/reader/full/adding-multiple-sources 23/27
20. Click Next.
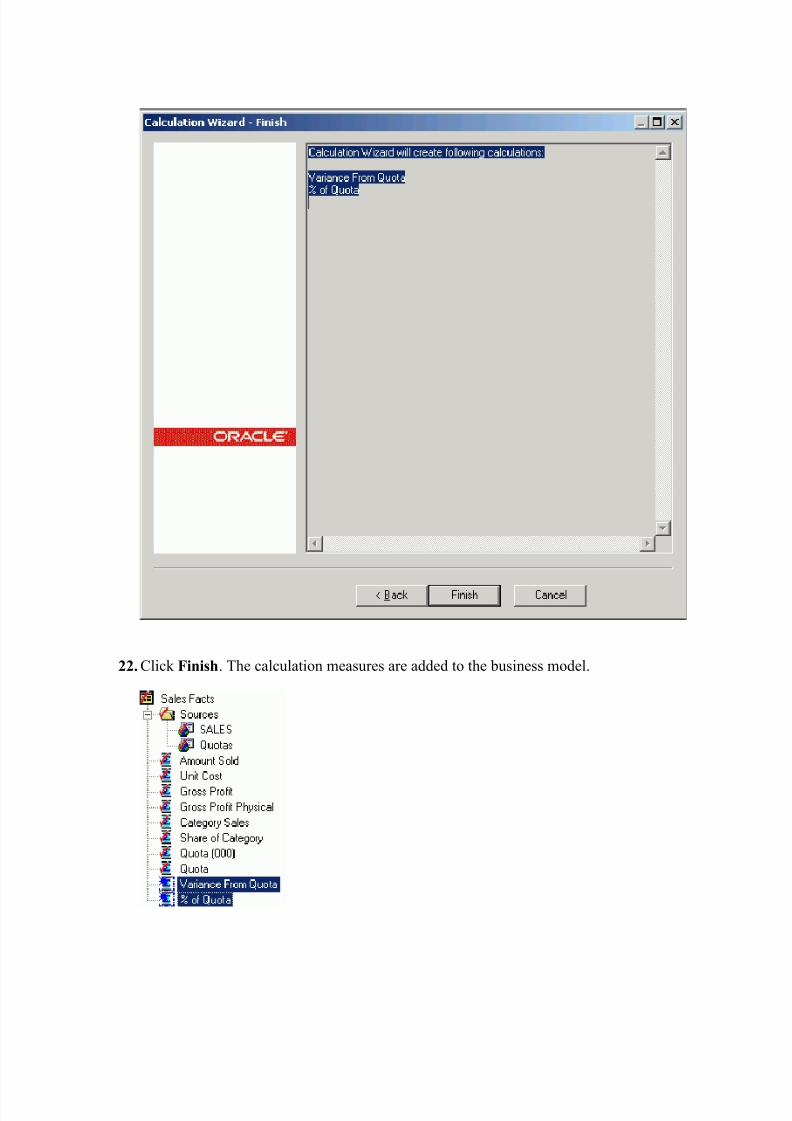
21. In the Finish window, verify the calculations that will be created by the Calculation Wizard.
8/8/2019 Adding Multiple Sources
http://slidepdf.com/reader/full/adding-multiple-sources 24/27
22. Click Finish. The calculation measures are added to the business model.
8/8/2019 Adding Multiple Sources
http://slidepdf.com/reader/full/adding-multiple-sources 25/27
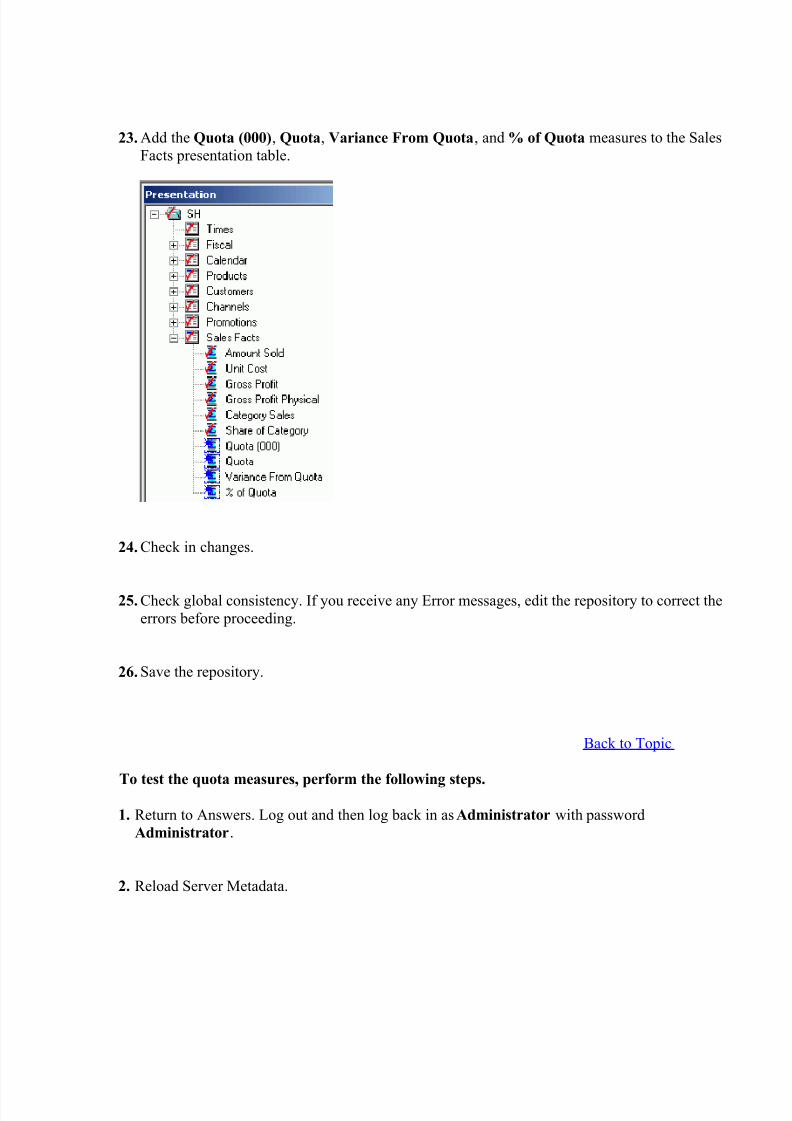
23. Add the Quota (000), Quota, Variance From Quota, and % of Quota measures to the Sales
Facts presentation table.
24. Check in changes.
25. Check global consistency. If you receive any Error messages, edit the repository to correct the
errors before proceeding.
26. Save the repository.
Back to Topic
To test the quota measures, perform the following steps.
1. Return to Answers. Log out and then log back in as Administrator with password
Administrator.
2. Reload Server Metadata.

8/8/2019 Adding Multiple Sources
http://slidepdf.com/reader/full/adding-multiple-sources 26/27
3. Create the following request:
Calendar.Calendar Year, Sales Facts.Amount Sold, Sales Facts.Quota, Sales Facts.Variance
From Quota, Sales Facts.% of Quota.
4. Create the following filter:
Calendar Year is equal to / is in 1999, 2000, 2001.
5. Click Results. (Please note that SHQuota contains data only for 2001).
6. Drill down on 2001.
7. Examine the query log.
8. Leave Answers open.
Back to Topic

8/8/2019 Adding Multiple Sources
http://slidepdf.com/reader/full/adding-multiple-sources 27/27


