Embed Size (px)
Citation preview

ADDENDUM TO THE WASTE STORAGE AREA (PHASE 11) DESIGN REPORT

1 TABLE OF CONTENTS
1 .O Introduction .. .. .. , . , .. , . .. . . . . , . .. . . . . , . , , , . . . , . . . . . . , . . . . , . . , , , . . . . . . .. . , . . . . . . . . . , , . . . . . . , . . . . . , . . . . . .. . , . .. . . . . . . . . . . . . . . . . .. . .. . , . . . , . . . . .. . . . . -1
2.0 Manganese Speciation and Compiled Kd Values .... ... .. , .......... ... . . .... . .... ., . ........ . .... ....... . ..... .. .... .. .... . ... , I
3 .O Direct-Push Sampling Results ....., ........................................ ......................................... . .......... . .......... 3 3.1 Techietium-99 ........................................................................................................................... 3 3.2 Nitratemitrite ... .. .. . . .. , .. . . . . , . . . . , . . . .. . , . . . . , . . , . . . .. . . . . . . . . . . . . . . . .. . . , . . .. . . . . , . , . , . , , .. . . . .. . . , . . . . . . . . . . .. . . . . . . . . . .. . . . . . , .. . . . .3 3.3 Manganese .. . . . . . , . . . . . . . , . , . . .. . . . . . . . . , .. . . , . , . , . , . . . . . . . . . . . . . . . . . . . . . . , . . . . . . . .. . . . . . . . .. . . . . . . . . . . , . . .. . . .. . . . . . .. . . . . . . . . . , . . . .. . . . . - 3
4.0 New Modeling for Manganese Reinediation ...... . .. .. , ...... ... ... , ,. .. . ........... .. .. . .... ...... .. ..... .. . .... .. .... ... ...... ..5 4.1 Modeled Target Pumping Rates.. ,. . . , , , . .. . , .. ... . . . . . . . . . .. . . . . . . . . . . . . . . . . . . , . .. .. . . . . . , .. . . . . . . . .. . .. . .. . . . . . . . . . . . . . ... . . . .5 4.2 Transport Modeling Assumptions for Manganese.. . , .. . . , . . . . . . . . . . .. . . . . . . . . . . , , . . . . . . . .. .. . . . .. . . . .. . . . . . . . . . . . . . . .5 4.3 ' Transport Modeling Results for Manganese .,. ,. . ... .. ... .... . ,... .... ... . .. .. . .. .. ... ..... ........ .. .. ... . ...... .... . .. .5
5.0 Conclusions ......................................................................................... . ................. . ............................. 5
References ,.........,.. ..... , ..... .,... .... .... ... . .... , .. .. ..... .... , , ,. , . . . . ..... .. . .. .. ... , ... .... .. . . . .... .... .... , ... ,. , . .. .. . . .. .... .... .. .... . .. . ...... .7
LIST OF TABLES
Table 1 Table 2 Table 3 Table 4
Figure 1 Figure 2 Figure 3 Figure 4 Figure 5 Figure 6 Figure 7 Figure 8 Figure 9
Preliminary Sampling Results from Direct-Push Location 13342 Preliminary Sampling Results fiom Direct-Push Location 13343 Preliminary Sampling Results from Direct-Push Location 13344 Preliminary Sampling Results from Direct-Push Location 13345
LIST OF FIGURES
WSA Phase II Sampling Locations Maximum Manganese Plume in the Waste Storage Area Layer 12 Initial Conditions Layer 1 1 Initial Conditions Layer 10 Initial Conditions Layer 09 Initial Conditions Layer 08 Initial Conditions Layer 07 Initial Conditions Layer 12 Model Conditions at April 1,2007
HYDROGROUP\WSAPHASEIIMDDENDUM.DOC\ 12/1/05 1 2 : a PM i

FCP-WSA-ADDENDUM FINAL Revision 0
December 2005
ADDENDUM TO THE WASTE STORAGE AREA (PHASE 11) DESIGN REPORT
1.0 INTRODUCTION This addendum to the Waste Storage Area (Phase n) Design Report, Revision A, Draft Final, (DOE 2005) provides the following information:
Manganese speciation in Great Miami Aquifer groundwater and compiled Kd Values for manganese, molybdenum, nickel, nitratehiitrite, carbon disulfide and trichloroethylene (Section 2)
Direct-push sampling results from four new locations in the Waste Storage Area, and a new manganese plume interpretation (Section 3)
. .
0 New groundwater modeling results for the remediation of the manganese plume in the Waste Storage Area (Section 4).
As reported in the Waste Storage Area (Phase II) Design Report, the footprint of the maximum manganese plume in the Waste Storage Area is larger than the footprint of the uranium plume that is being targeted in the Waste Storage Area for remediation. The highest manganese concentrations (4.08 milligrams per liter [mg/L] and 6.14 mg/L measured at Monitoring Wells 2648 and 2010,
respectively) are both located outside of the uranium plume footprint. Groundwater modeling presented in the Phase II Design (using a Kd of 10 liters per kilogram [Lkg]) indicates that the manganese plume would not be remediated along with the uranium plume but would instead remain almost stationary.
This addendum addresses a recommendation made in the Waste Storage Area (Phase 11) Design Report to conduct additional direct-push sampling between Monitoring Well 2648 and Monitoring Well 201 0 to determine if the high manganese concentrations measured in those wells are a result of bio-fouling. This addendum also addresses coininents received from the U.S. EPA and Ohio EPA on the Waste Storage Area (Phase II) Design Report concerning; manganese speciation, Kd values, and modeling results for remediation of the manganese plume.
2.0 MANGANESE SPECIATION AND COMPILED KD VALUES The geochemical code EQ3NR was used to calculate the manganese speciation in groundwater collected from Direct Push Location 13342 (Mn = 1 .1 mg/L, September 2005). Results are as follows: Mn2+ 84.6%, MnC03 (as> 9.65%, MnSOd (a@ 3.07%, and MnHCO; 2.64%. The manganese (II) ion is very mobile in carbonate groundwater, because Ca2' ions compete for sorption sites on the sediment (Merdy, et al. 2002). Moreover, manganese will not be removed from the aquifer by precipitation of MiOl, due to oxidation of manganese (II) to manganese (IV). Based on the observed concentrations for Mn (11) in the GMA, redox conditions in the Great Miami Aquifer are below 500 millivolts (mV) at the near-neutral pH. As MnOz has a very low solubility product, the observed concentrations for Mn (n> HYDROGROUP\WSAPHASEII\ADDENDUM.DOC\ IUl/Oj 1224 PM 1

FCP-WSA-ADDENDUM FINAL Revision 0
December 2005
* * would not b,e possible if redox conditions were above 500 mV. The long-term stability of the carbonate
geochemical system is ensured by the large percentage of carbonate minerals (calcite f dolomite >50%) I
in the aquifer sediments.
Partition coefficients for manganese, molybdenum, nickel, nitrate, carbon disulfide and trichloroethylene, are as follows:
COMPILED & VALUES
Kd (Wkg) Carbonate System Reference Specie Mn2+ 0.4 to 1.3 Yes Bryan, et al. 2004
0.2 to 1.0 Goldberg, et al. 2002 Mood2- 48 to 368 Yes Cantrell, et al. 2003 .N?+
0.65 to 1.1 Yes Mikolajkow 2003 Nos- Carbon disulfide 0.46 to 0.54 NA* ADEC 2004
No, but pH = 7
NYSDEC 2005 U.S. EPA 2005 Trichloroethylene 0.87 to 1.5 NA*
*Not applicable, as sorption of organic compounds is dependent on organic carbon in the sediment. Kd calculated (& = L*&) fiom reported waterlorganic-carbon partition coefficient (&), assuming fraction of organic carbon (f,) is 0.01 in the Great Miami Aquifer.
The Kd values reflect aqueous conditions similar to those .in tlie Great Miami Aquifer (i,e., carbonate groundwater at near neutral pH), with the exception of carbon disulfide and tricl~loroethylene. Adsorption of organic constituents is primarily a function of tlie fraction of organic carbon in the sediment.
Sorption studies by Saiidia National Laboratory (Bryan, et al. 2004), using Great Miami Aquifer sediment and groundwater, indicate that Mn Kd values range from 0.4 to 1.3 L/kg. Although the Sandia National Laboratory sorption studies focused on uranium and did not report results for manganese, manganese Kd values can be extracted froin the data because inajor and minor cations were tracked along with the uranium concentrations.
Excluding nickel, the Kd values are all less than the Kd value used to model uranium (3.0 LKg). This indicates that the contaminants will be captured during the remediation of the uranium plume. For nickel, Kd values are much greater than uranium, and persistent contamination is possible as nickel slowly desorbs from the sediment. However, nickel contamination is limited to a single location and it may not persist at Well 2649, because it is located within 500 feet of active recharge along Paddys Run. Nickel will be monitored at Well 2649 during remediation of the uranium plume, and further action may be warranted if the nickel contamination persists.
HYDROGROUP\WSAPHASEII\ADDENDUM.DOC\ IZilO5 1294 PM 2

FCP-WSA-ADDENDUM FINAL Revision 0
3.0 DIRECT-PUSH SAMPLING RESULTS
December 2005
607'3 Direct-push sampling was conducted at four additional locations (13342, 13343, 13344, and 13345).
Locations are illustrated in Figure 1. Location 13342 is next to Monitoring Well 2010. Location 13343 is next to Monitoring Well 2648. Locations 13344 and 13345 were selected to hetennine where the eastern edge of the manganese plume is located.
Each location was sampled for the following list of constituents: uranium, teclmetium-99, nitratehitrite, manganese, molybdenum, and nickel. Preliminary sampling results are provided in Tables 1 through 4.
Final remediation level (FRL) exceedances are shaded in the tables. There were no new FRL exceedances measured for uranium, so the uranium plume map from the Waste Storage Area Phase II Report was not revised. FRL exceedances were measured for technetium-99, nitratehitrite, and manganese. These exceedances are discussed below.
3.1 Technetium-99 The groundwater FRL for techiietium-99 is 94 picocuries per liter @Ci/L). An FRL exceedance for techietium-99 was measured at Location 13343 (163 p C K , at a depth of 10 feet below the water table). Sampling results for Location 13343 are provided in Table 2. This location is right next to Monitoring Well 2648. Exceedances for technetium99 have been measured at Monitoring Well 2648 in the past. The last groundwater FRL exceedance for techetium-99 at Monitoring We11 2648 was 1 1 1 pCi/L (January 13,2003). Monitoring Well 2648 is within the footprint of the uranium plume that is being targeted for remediation.
3.2 Nitratemitrite The groundwater FRL for nitratehiitrite is 11 mg/L. FRL exceedances for nitratelnitrite were measured at Location 13343 (15.5 mgL, 19.0 m a , and 19.5 mg/L) at depths of 10 and 20 feet below the water table. Sampling results for Location 13343 are provided in Table 2. This location is right next to Monitoring Well 2648. Monitoring Well 2648 is within the footprint of the uranium plume that is being targeted for remediation.
3.3 Manganese The groundwater FRL for manganese is 0.90 mg/L. FRL exceedances for manganese were measured at Locatioris 13342, 13343, and 13344. However, the FRL exceedances measured in these new locations were considerably lower than the exceedances measured in Monitoring Wells 2648 and 201 0. No FRL exceedances for manganese were measured at Location 13345. Location 13345 bounds the eastern extent of the manganese plunie. A new maximum manganese plume map for the Waste Storage Area is provided in Figure 2.
HYDROGROUP\WSAPHASEIRADDENDUM.DOC\ 12/1/05 1 2 2 4 PM 3

FCP-WSA-ADDENDUM FINAL Revision 0
December 2005
Results for Location 13342 are presented in Table 1. Location 13342 is next to Monitoring Well 2010.
One FRL exceedance for manganese (1.10 mg/L) was measured at 60 feet below the water able. This concentration is considerably lower than tlie inanganese concentration reported for Monitoring Well 20 10
(6.14 mgL) in tlie Waste Storage Area (Phase lI) Design Report. Monitoring Well 2010 is screened at
the water table. No FRL exceedance was detected at Location 13342 within 50 feet of the water able. The difference in measured concentrations between Monitoring Well 201 0 and Location 13342 implies that bio-fouling is occurring at Monitoring Well 2010 and concentrating manganese around the well
screen.
Results froin direct-push Location 13343 are presented in Table 2. Location 13343 is next to Monitoring Well 2648. One FRL exceedance for manganese (0.973 ing/L) was measured at 40 feet below the water table. This concentration is considerably lower thau the manganese concentration reported for Monitoring Well 2648 (4.08 mg/L) in the Waste Storage Area (Phase II) Design Report. Monitoring Well 2648 is screened at the water table. No FRL exceedance was detected at Location 13343 within 30 feet of the water table. Again, the difference in concentrations between Monitoring Well 2648 and Location 13343 implies that bio-fouling is occurring at Monitoring Well 2648 and concentrating manganese around the well screen.
Results from direct-push Location 13344 are presented in Table 3. Location 13344 is east of Monitoring Well 2010. Two FRL exceedances for manganese were measured at Location 13344 (0.943 mg/L at 10 feet below the water table and 2.320 mg/L at 60 feet below tlie water table.
Three of the four FRL exceedances for manganese measured at tlie four new sampling locations occur at the deepest sampled depth interval. This could be due to naturally occurring geologic conditions in the aquifer, as there does not appear to be any exceedances occurring at the water table or just beneath the water able, which would be expected if the plume were sourced from one of the former waste pits. Regardless of the cause, the deep exceedances were considered in producing a new maximum manganese plume map for the Waste Storage Area. T ie new map is shown in Figure 2. The main difference between this new inanganese map and the map presented in the Waste Storage Area (Phase II) Design Report is that the higher concentrations, for the most part, are situated near the silos area in the new map. The higher manganese concentrations are located in an area that will be strongly influenced by the new extraction well being installed in the silos area.
HYDROGROUP\WSAPHASElI\ADDENDUM.DOC\ lUll05 12:ZQ PM 4

FCP-WSA-ADDENDUM FINAL Revision 0
December 2005
4.0 NEW MODELING FOR MANGANESE REMEDIATION The groundwater model was used to predict how well the Waste Storage Area (Phase.II) Design would remediate the newly characterized manganese plume, using a Kd value of 1.3 L/kg instead of the 10 Lkg value previously used.
4.1 Modeled Target Puinpinn Rates Target pumping rates remained at the rates defuied in Table 3-1 of the Waste Storage Area (Phase II) Design Report. The target pumping rates range from 100 gallons per minute (gpm) to 500 gpm. The additional extraction well modeled in the WSA near the silos is identified in Table 3-1 as WSA-5. It has a target-pumping rate of 300 gpni. This pumping rate was selected because it provided a clean-up end date for the uranium plume that is consistent with the WSA Phase I module, as shown in Figure 3-1 8 of the WSA Phase II Design Report. Because the modeled prediction for cleanup of the uranium plume was deemed satisfactory using these puinpiiig rates, additional modeling runs with different pumping rates were not conducted for the Phase II Design.
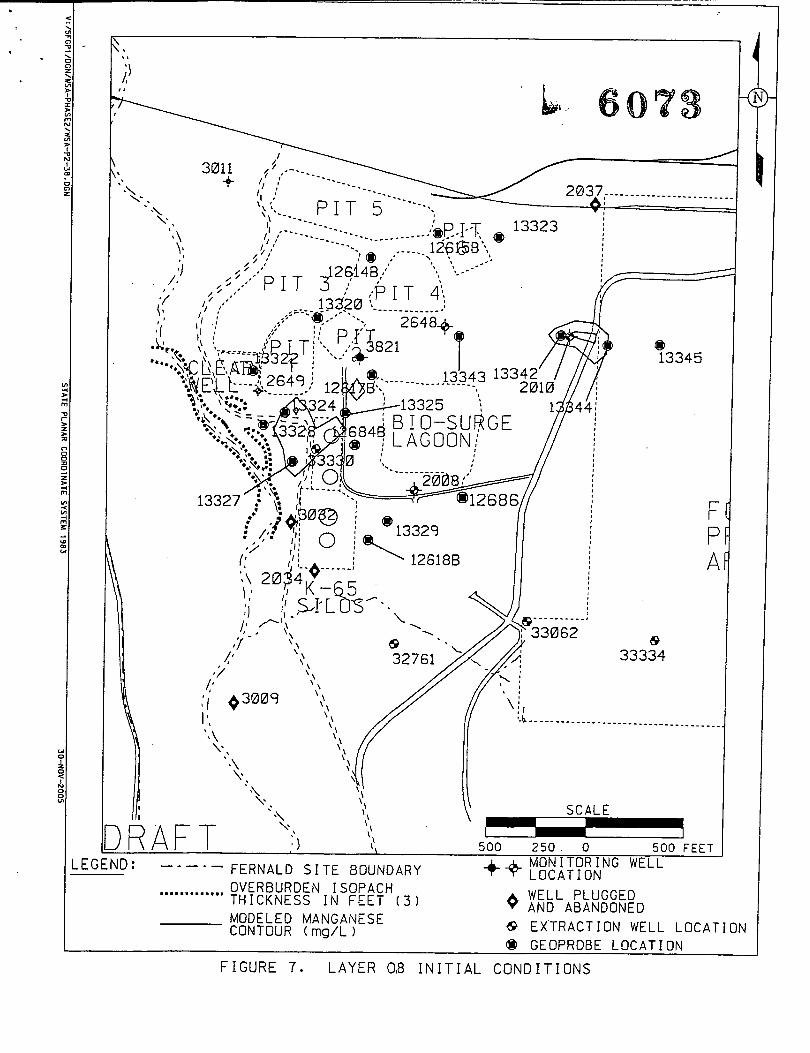
4.2 Transport Modeling Assuinutions for Maiiganese Initial conditions for manganese were developed from hand-drawn contours of concentration data collected in the Waste Storage Area. Hand-drawn contours of manganese concentrations were digitized, and then converted by hand into model grid node values for each effected model layer. Initial conditions for manganese in model layers 12, 11, 10, 9, 8, and 7 are shown in Figures 3 through 8, respectively. No manganese source terms were used for the model runs because all of the source terms in the WSA have been removed, or are in the process of being removed.
4.3 Transport Modeling Results for Manganese Modeled manganese coilcentrations in Layer 12 for the year 2007 are shown in Figure 9. These modeling results support that the manganese plume will be remediated given the current well field design that consists of one additional extraction well in the silos area.
5.0 CONCLUSIONS
0 Manganese concentrations measured at direct-push sampling locations next to Monitoring Wells 2648 and 2010 were considerably lower than the concentrations last measured at Monitoring Wells 2648 and 2010. This implies that bio-fouling is occurring around the well screens in the inonitoring wells and concentrating manganese there.
0 The footprint of the newly mapped manganese plume is larger than the uranium plume being targeted for remediation, but the manganese concentrations are not as high as previously mapped.
0 The highest manganese concentrations are situated near the silos area not near Monitoring Wells 2648 and 2010.
HYDROGROUP\WSAPHASEIRADDENDUM.DOC\ 12/1/03 1224 PM 5

. . f z
FCP-WSA-ADDENDUM FMAL Revision 0
December 2005
0 Sorption studies by Sandia National Laboratory indicate that the manganese Kd ranges from 0.4 to 1.3 L/kg. Much lower than the Kd of 10 L K g used to inodel manganese cleanup for the Waste Storage Area (Phase II) Design Report.
0 Modeling cleanup of the new manganese plume interpretation, at a Kd of 1.3 L/kg, indicates that below-FRL coiicentratioiis for manganese will be achieved in 2007.
0 The Waste Storage Area (Phase II) Design is sufficient to remediate the manganese plum in the Waste Storage Area.
HYDROGROUP\WSAPHASElI\ADDENDUM.DOQ 12/1/05 1224 PM 6

FCP-WSA-ADDENDUM FINAL Revision 0
December 2005
Alaska Deparhnent of Environmental Conservation (ADEC), 2004, 'I Cleanup Levels Guidance," Division of Spill'Prevention and Response, Contaminated Sites Remediation Program.
Bryan, C.R., M. Spilde, X. Huifang, C. Schloesslin, and ICD. Davis, 2004, "Results of Uranium AdsorptiodDesorptioii Experiments and Microanalytical Studies Characterizing Sediment Samples from the Great Miami Aquifer, Feriiald DOE Site, Ohio," SAND2004-4085, Sandia National Laboratories.
Cantrell, K.J., R.J. Serne, and G.V. Last, 2003, "Hanford Contaminant Distribution Coefficient Database and Users Guide," PNNL-13 895, Pacific Northwest National Laboratory.
Goldberg, S., S.M. Lescli, and D.L. Suarez, 2002, "Predicting Molybdenum Adsorption by Soils Using Soil Chemical Parameters in the Constant Capacitance Model," Soil Science Society of America Journal, v. 66, pp. 1836-1842.
Merdy, P., E. Guillon, and M. Aplincourt, 2002, "Iron and Manganese Surface Complex Formation with Extracted Lignin, Part 1 : Adsorption Isotherin Experiments and EPR Spectroscopy Analysis," New Journal of Chemistry, v. 26, pp. 1638-1645.
Mikolajkow, J., 2003, "Laboratory Methods of Estimating the'Retardatioii Factor of Migrating Mineral Nitrogen Compounds in Shallow Groundwater," Geological Quarterly, v. 47, pp. 9 1-96.
New York State Department of Enviroimental Conservation (NYSDEC), 2005, "VOCs Soil Cleanup Criteria Table," www.dec.s ta te .n~.us/websi te /der / ta~~s/~~~4046b.h~1.
U.S. Department of Energy (DOE), 2005, "Waste Storage Area (Phase II) Design Report," 52422-RP-0004, Revision A, Draft Final, Fernald Closure Project, Cincinnati, OH, June.
U. S. Environmental Protection Agency (U.S. EPA), 2005, "Technical Fact Sheet on Trichloroethylene," www.eDa. aov/OGWDW/dwldt-voc/tricli lor.htm1.
HYDROGROUP\WSAPHASEII\ADDENDUM.DOC\ 12/1/05 1224 PM 7

e4 d m f?
m 2 8


-7- -
m 0 0 9
J Jr E:
m V
c
9 0 N
9 ” 0 N
0 m
m fl v)
W z r3 00
\3 00
\o m
m N
00 d s
m N
2 3 v) - N d

. 1 '
k

F P A
P I
F E R N A L D S I T E BOUNDARY MON I TOR I NG WELL
- - - I - LEGEND:
' L O C A T I O N
TIT A I - - I - WELL P L U G G E D AND ABANDONED
J K A I - I @I GEOPROBE L O C A T I O N F I G U R E 1 . WSA PHASE I 1 SAMPLING LOCATIONS

F ' P A
\'; \ \
\ \ *\ \': ,' 1 I;, 500 250 0 500 FEET
MONITORING WELL
WELL PLUGGED
FERNALD SITE BOUNDARY +$ LOCATION
BOUNDARY OF OVERBURDEN AREA WHERE THICKNESS IS <3 FEET
3R.AFT. LEGEND: - - - - -
0 AND ABANDONED ............I
... _ _
e EXTRACTION WELL LOCATION MANGANESE CONTOUR (rng/L)
@ GEOPROBE LOCATION + @ MANGANESE SAMPLE LOCATION
F I G U R E 2. MAXIMUM MANGANESE PLUME I N THE WASTE STORAGE AREA

\ \ \ .,
I ,
I
@ GEOPROBE LOCATION
FIGURE 3. L A Y E R 12 INITIAL CONDITIONS

"\ SCALt -. ') -
~
OVERBURDEN ISOPACH WELL PLUGGtU THICKNESS I N FEET ( 3 ) 0 AND ABANDONED
@ GEOPROBE LOCATION
............I
MODELED MANGANESE CONTOUR ( m g / L 1
e EXTRACTION WELL LOCATION
LEGEND: -. - - - FERNALD S I T E BOUNDARY - _ _ _
FIGURE 4. LAYER 1 1 IN1 TIAL CONDITIONS

I
eo 33334
.E -
WELL P L U G G E D OVERBURDEN I S O P A C H T H I C K N E S S IN F E E T ( 3 ) MODELED M A N G A N E S E CONTOUR (mg/L 1
0 A N D A B A N D O N E D 8 E X T R A C T I O N WELL L O C A T I O N 0 GEOPROBE L O C A T I O N
............ I
F I G U R E 5. LAYER 10 INITIAL CONDITIONS

I

8 33334
SCALE e c \\ \\ ’ .\
1 500 FEET 500 250 0 (1
\> ,I )
MONITOR ING WELL
WELL PLUGGED FERNALD S I T E BOUNDARY +$ LOCATION OVERBURDEN ISOPACH THICKNESS I N FEET ( 3 ) MODELED MANGANESE CONTOUR (rng/L 1
)RAFT EGEND: - - - - -
0 AND ABANDONED
@ GEOPROBE LOCATION
............ I e EXTRACTION WELL LOCATION
FIGURE 7. LAYER 08 INITIAL CONDITIONS


OVERBURDEN ISOPACH THICKNESS I N FEET ( 3 ) ..... .I.... I WELL PLUGGED 0 AND ABANDONED
e EXTRACTION WELL LOCATION MODELED MANGANESE CONTOUR ( mg/L 1 0 GEOPROBE LOCATION
FIGURE 9. LAYER 1 2 MODEL CONDITIONS AT 4-1-2007

4
/
ADDENDUM TO THE WASTE STORAGE AREA (PHASE II) DESIGN REPORT

TABLE OF CONTENTS
1 .O Introduction ......................................................................................................................................... 1
2.0 Manganese Speciation and Compiled Kd Values .................................... ........................ . ................... I
3 .O Direct-Push Sampling Results ... ,. , .... . ... . .... ... ...... ...... . . .... ...... ............ ... .. ... ... .. .... ... . ..... ,.. .. .. .............. ..,. 3 3.1 Technetium99 ...... ... .... .. , .... . . .. . .. . .. . .... , . , . . .. .. ... , ....... ............. .... . ... . .... . .... .. .... ..... ..... ..... ..... . . . .... .. . .3 3.2 Nitratemitrite. .. . . . . . . .. , . . . . . . . . . . , , . . . .. . . . . . . .. . . . . . . . . . . .. , . . . . .. . . . .. , , , , , . . . . . . , . , . . , . . . . . . . ... .. . ... . ... . . . . . .. . . . .. . ..... . .. .. , . , .3 3.3 Manganese ................................................................................................................................. 3
. .
4.0 New Modeling for Manganese Remediation ............ I ........ ,.. ................ . ......... . ..... ... ...... .. .......... .......... 5 4.1 Modeled Target Pumping Rates.. , . . . . . . . . . , . . . . . . . . . . . . .. . . . .. . . . . . . . . . . . . .. . . . . ... . . . . . . . . . . .. . .. . . . . .. . . . . . . . . . . . . . . . . ... . . . .5 4.2 Transport Modeling Assuinptions for Manganese .... . ........ ..... ................... ................... ...... . ..... .5 4.3 ' Transport Modeling Results for Manganese ............................................................ . ................, 5
5.0 Conclusions ......................................................................................................................................... 5
References .............................................................................................................................................. ....... 7
LIST OF TABLES
Table 1 Table 2 Table 3 Table 4
Figure 1 Figure 2 Figure 3 Figure 4 Figure 5 Figure 6 Figure 7 Figure 8 Figure 9
Preliminary Sampling Results from Direct-Push Location 13342 Preliminary Sampling Results from Direct-Push Locatioii 13343 Preliminary Sampling Results from Direct-Push Location 13344 Preliminary Sampling Results from Direct-Push Location 13345
LIST OF FIGURES
WSA Phase II Sampling Locations Maximum Manganese Plume in the Waste Storage Area Layer 12 Initial Conditions Layer 1 1 Initial Conditions Layer 10 Initial Conditions Layer 09 Initial Conditioiis Layer 08 Initial Conditioiis Layer 07 Initial Conditions Layer 12 Model Conditions at April 1, 2007

FCP-WSA-ADDENDUM FINAL Revision 0
December 2005
ADDENDUM TO THE WASTE STORAGE AREA (PHASE 11) DESIGN REPORT
1 .O INTRODUCTION This addendum to the Waste Storage Area (Phase 11) Design Report, Revision A, Draft Final, (DOE 2005) provides the following information:
Manganese speciation in Great Miami Aquifer groundwater and compiled Kd Values for manganese, molybdenum, nickel, nitratehiitrite, carbon disulfide and trichloroethylene (Section 2)
Direct-push sampling results fioni four new locations in the Waste Storage Area, and a new manganese plume interpretation (Section 3)
. .
New groundwater modeling results for the remediation of the manganese plume in the Waste Storage Area (Section 4).
As reported in the Waste Storage Area (Phase II) Design Report, the footprint of the inaximum manganese plume in the Waste Storage Area is larger than the footprint of the uranium plume that is being targeted in the Waste Storage Area for remediation. The highest manganese concentrations (4.08 milligrams per liter [mg/L] and 6.14 mg/L measured at Monitoring Wells 2648 and 2010,
respectively) are both located outside of the uranium plume footprint. Groundwater modeling presented in the Phase II Design (using a Kd of 10 liters per kilogram &kg]) indicates that the manganese plume would not be remediated along with the uranium plume but would instead remain almost stationary.
This addendum addresses a recoinmendation made in the Waste Storage Area (Phase II) Design Report to conduct additional direct-push sampling between Monitoring Well 2648 and Monitoring Well 201 0 to determine if the high manganese concentrations measured in those wells are a result of bio-fouling. This addendum also addresses coininents received from the U.S. EPA and Ohio EPA on the Waste Storage Area (Phase 11) Design Report concerning; manganese speciation, Kd values, and modeling results for remediation of the manganese plume.
2.0 MANGANESE SPECIATION AND COMPILED KD VALUES The geochemical code EQ3NR was used to calculate the manganese speciation in groundwater collected from Direct Push Location 13342 (Mn = 1.1 mg/L, September 2005). Results are as follows: Mn2' 84.6%, MnC03 (as> 9.65%, MiSO4 (a@ 3.07%, and MnHC03' 2.64%. The manganese (II) ion is very mobile in carbonate groundwater, because Ca2' ions compete for sorption sites on thesediment (Merdy, et al. 2002). Moreover, manganese will not be removed fiom the aquifer by precipitation of h4n02, due to oxidation of manganese (11) to manganese (W). Based on the observed concentrations for Mn (II) in the GMA, redox conditions in the Great Miami Aquifer are below 500 millivolts (mV) at the near-neutral pH. As Mi102 has a very low solubility product, the observed concentrations for Mn (II) HYDROGROUP\WSAPHASEIIL4DDENDUM.DOC\ 12/1/05 1224 P M 1

FCP-WSA-ADDENDUM FINAL Revision 0
December 2005
would not be possible if redox conditioiis were above 500 mV. The long-term stability of the carbonate geochemical syitein is ensured by the large percentage of Carbonate minerals (calcite + dolomite >50%) in the aquifer sediments.
- b '
Partition coefficients for manganese, molybdenum, nickel, nitrate, carbon disulfide and trichloroethylene,
are as follows:
COMPILED I(d VALUES
Specie Kd (Lk) Carbonate System Reference Mn2+ 0.4 to 1.3 Yes Bryan, et a!. 2004 MOO? 0.2 to 1.0 No, but pH = 7 Goldberg, et al. 2002
. ~ i * + 48 to 368 Yes Cantrell, et a]. 2003
Carbon disulfide 0.46 to 0.54 NA" ADEC 2004 NYSDEC 2005
Trichloroethylene 0.87 to 1.5 NA* US. EPA 2005
*Not applicable, as sorption of organic compounds is dependent on organic carbon in the sediment. Kdcalculated (IC,, = I&*fOc) from reported watedorganic-carbon partition coefficient (&), assuming fraction of organic carbon (foe) is 0.01 in the Great Miami Aquifer.
0.65 to 1.1 Yes Mikolajkow 2003 NO,'
The Kd values reflect aqueous conditions similar to those .in the Great Miami Aquifer @e., carbonate groundwater at near neutral pK), with the exception of carbon disulfide and trichloroethylene. Adsorption of organic constituents is primarily a function of tlie fraction of organic carbon in the sediment.
Sorption studies by Sandia National Laboratory (Bryan, et al. 2004), using Great Miami Aquifer sediment and groundwater, indicate that Mn ICd values range from 0.4 to 1.3 L/kg. Although tlie Sandia National Laboratory sorption studies focused on uranium and did not report results for manganese, manganese Kd values can be extracted from the data because major and minor cations were tracked along with the uranium concentrations.
Excluding nickel, the Kd values are all less than the Kd value used to model uranium (3.0 LKg). This indicates that the contaminants will be captured during the remediation of the uranium plume. For nickel, Kd values are much greater than uranium, and persistent contamination is possible as nickel slowly desorbs from the sediment. However, nickel contamination is limited to a single location and it may not persist at Well 2649, because it is located within 500 feet of active recharge along Paddys Run. Nickel will be monitored at Well 2649 during remediation of the uranium plume, and further action may be warranted if the nickel contamination persists.
HYDROGROUP\WSAPHASEIJLADDENDUM.DOC3 12/1/05 1224 PM 2

FCP-WSA-ADDENDUM FINAL Revision 0
December 2005
3.0 DIRECT-PUSH SAMPLING RESULTS Direct-push sampling was conducted at four additional locations (13342, 13343, 13344, and 13345). Locations are illustrated in Figure 1. Location 13342 is next to Monitoring Well 2010. Location 13343 is next to Monitoring Well 2648. Locations 13344 and 13345 were selected to determine where the eastein edge of the manganese plume is located.
Each location was sampled for the following list of constituents: uranium, technetium-99, nitratehitrite, manganese, molybdenum, and nickel. Preliminary sampling results are provided in Tables 1 through 4. Final remediation level (FRL) exceedances are shaded in the tables. There were no new FRL exceedances measured for uranium, so the uranium plume map from the Waste Storage Area Phase II Report was not revised. FRL exceedances were measured for teclmetium-99, nitratelnitrite, and manganese. These exceedances are discussed below.
3.1 Technetium-99 The groundwater FRL for technetium-99 is 94 picocuries per liter @Ci/L). An FRL exceedance for technetium-99 was measured at Location 13343 (163 pCi/L, at a depth of 10 feet below the water table). Sampling results for Location 13343 are provided in Table 2. This location is right next to Monitoring Well 2648. Exceedances for technetium-99 have been measured at Monitoring Well 2648 in the past. The last groundwater FRL exceedance for techetium-99 at Monitoring Well 2648 was 11 1 pCi/L (January 13,2003). Monitoring Well 2648 is within the footprint of the uranium plume that is being targeted for remediation.
3.2 Nitratemitrite The groundwater FRL for nitratehitrite is 11 mg/L. FRL exceedances for nitratehitrite were measured at Location 13343 (15.5 mg/L, 19.0 nig/L, and 19.5 mg/L) at depths of 10 and 20 feet below the water table. Sampling results for Location 13343 are provided in Table 2. This location is right next to Monitoring Well 2648. Monitoring Well 2648 is within the footprint of the uranium plume that is being targeted for remediation.
3.3 Manganese The groundwater FRL for manganese is 0.90 in@. FRL exceedances for manganese were measured at Locations 13342, 13343, and 13344. However, the FRL exceedances measured in these new locations were considerably lower than the exceedances measured in Monitoring Wells 2648 and 201 0. No FRL exceedances for manganese were measured at Location 13345. Location 13345 bounds the eastern extent of the manganese plume. A new maximum manganese plume map for the Waste Storage Area is provided in Figure 2.
HYDROGROUP\WSAPHASEIIW)DENDUh4.DOC\ 12/1/05 1 2 2 4 P M 3

P '
FCP-WSA-ADDENDUM FINAL Revision 0
December 2005 - .
Results for Location 13342 are presented in Table 1. Location 13342 is next to Monitoring Well 2010. One FRL exceedance for manganese (1.10 ma) was measured at 60 feet below the water able. This Concentration is considerably lower than the manganese concentration reported for Monitoring Well 201 0
(6.14 ing/L,) in the Waste Storage Area (Phase II) Design Report. Monitoring Well 2010 is screened at the water table. No FRL exceedance was detected at Location 13342 within 50 feet of the water able. The difference in measured concentrations between Monitoring Well 2010 and Location 13342 implies that bio-fouling is occurring at Monitoring Well 20 10 and concentrating nianganese around the well
screen.
Results fioin direct-push Location 13343 are presented in Table 2. Location 13343 is next to Monitoring Well 2648. One FRL exceedance for manganese (0.973 mg/L) was measured at 40 feet below the water table. This concentration is considerably lower thau the manganese concentration reported for Monitoring Well 2648 (4.08 mg/L) in the Waste Storage Area (Phase II) Design Report. Monitoring Well 2648 is screened at the water table. No FRL exceedance was detected at Location 13343 within 30 feet of tlie water table. Again, the difference in concentrations between Monitoring Well 2648 and Location 133 43 implies that bio-fouling is occurring at Monitoring Well 2648 and concentrating manganese around tlie well screen.
Results fiom direct-push Location 13344 are presented in Table 3. Location 13344 is east of Monitoring Well 2010. Two FRL exceedances for manganese were measured at Location 13344 (0.943 m a at 10 feet below the water table and 2.320 mgL at 60 feet below the water table.
Three of the four FRL exceedances for mangaiese measured at the four new sampling locations occur at the deepest sampled depth interval. This could be due to naturally occurring geologic conditions in the aquifer, as there does not appear to be ally exceedances occurring at the water table or just beneath the water able, which would be expected if the plume were sourced from one of the former waste pits. Regardless of the cause, the deep exceedances were considered in producing a new maximum manganese plume map for the Waste Storage Area. The new map is shown in Figure 2. The main difference between this new inanganese map and the map presented hi the Waste Storage Area (Phase II) Design Report is that the higher concentrations, for tlie most part, are situated near the silos area in the new map. The higher manganese concentrations are located in an area that will be strongly influenced by the new extraction well being installed iu tlie silos area.
HYDROGROUP\WSAPHASElRADDENDUM.DOC\ 12/1/05 12~24 PM 4

FCP-WSA-ADDENDUM FINAL Revision 0
December 2005
4.0 NEW MODELING FOR MANGANESE REMEDIATION The groundwater model was used to predict how well tlie Waste Storage Area (Phase II) Design would remediate the newly characterized manganese plume, using a Kd value of 1.3 L/kg instead of the 10 L k g value previously used.
4.1 Modeled Target Pumping Rates Target pumping rates remained at tlie rates defined in Table 3-1 of the Waste Storage Area (Phase Iz) Design Report. The target pumping rates range froin 100 gallons per minute (gpm) to 500 gpm. The additional extraction well modeled in the WSA near the silos is identified in Table 3-1 as WSA-5. It has a target-pumping rate of 300 gpni. This pumping rate was selected because it provided a clean-up end date for the uranium plume that is consistent with tlie WSA Phase I module, as shown in Figure 3-1 8 of the WSA Phase 11 Design Report. Became the modeled prediction for cleanup of the uranium plume was deemed satisfactory using these pumping rates, additional modeling runs with different pumping rates were not conducted for the Phase 11 Design.
4.2 Transport Modeling Assuinutioiis for Manganese Initial conditions for manganese were developed froin hand-drawn contours of concentration data collected in the Waste Storage Area. Hand-drawn contours of manganese concentrations were digitized, and then converted by hand into model grid node values for each effected model layer. Initial conditions for manganese in model layers 12, 11, 10, 9, 8, and 7 are shown in Figures 3 through 8, respectively. No manganese source terms were used for tlie model runs because all of the source terms in the WSA have been removed, or are in tlie process of being removed.
4.3 Transport Modeling Results for Manganese Modeled manganese coiicentratjons in Layer 12 for the year 2007 are shown in Figure 9. These modeling results support that the manganese plume will be remediated given the current well field design that consists of one additional extraction well in the silos area.
5.0 CONCLUSIONS
0 Manganese concentrations measured at direct-push sampling locations next to Monitoring Wells 2648 and 2010 were considerably lower than the concentrations last measured at Monitoring Wells 2648 and 201 0. This implies that bio-fouling is occurring around the well screens in the monitoring wells and concentrating manganese there.
0 The footprint of the newly mapped manganese plume is larger than the uranium plume being targeted for remediation, but the manganese concentrations are not as high as previously mapped.
0 The highest manganese coilcentrations are situated near the silos area not near Monitoring Wells 2648 and 201 0.
HYDROGROUP\WSAPHASCIWDENDUM.DOC\ 12/1/05 1224 PM 5

FCP-WSA-ADDENDUM FINAL Revision 0
December 2005
0 Sorption studies by Saiidia National Laboratory indicate that the manganese Kd ranges from 0.4 to 1.3 L/kg. Much lower than the Kd of 10 L K g used to model manganese cleanup for the Waste Storage Area (Phase 11) Design Report.
0 Modeling cleanup of the new manganese plume interpretation, at a Kd of 1.3 L/kg, indicates that below-FRL concentrations for manganese will be achieved in 2007.
0 The Waste Storage Area (Phase II) Design is sufficient to remediate the manganese plume in the Waste Storage Area.
HYDROGROUP\WSAPHASEIIL4DDENDUM.DOC\ 12/1/03 1224 PM 6

FCP-WSA-ADDENDUM FINAL Revision 0
December 2005
REFERENCES
Alaska Department of Environmental Coiiservation (ADEC), 2004, Cleanup Levels Guidance," Division of Spill Prevention and Response, Contaminated Sites Remediation Program.
Bryan, C.R., M. Spilde, X. Huifang, C. Schloesslin, and K.D. Davis, 2004, "Results of Uranium AdsorptiodDesorption Experiments and Microanalytical Studies Characterizing Sediment Samples from the Great Miami Aquifer, Fernald DOE Site, Ohio," SAND2004-4085, Sandia National Laboratories.
Cantrell, K.J., R.J. Serne, and G.V. Last, 2003, "Hanford Contaminant Distribution Coefficient Database and Users Guide," PNNL-13 895, Pacific Northwest National Laboratory.
Goldberg, S., S.M. Lesch, and D.L. Suarez, 2002, "Predicting Molybdenum Adsorption by Soils Using Soil Chemical Parameters in the Constant Capacitance Model,'' Soil Science Society of America Journal, v. 66, pp. 1836-1842.
Merdy, P., E. Guillon, and M. Aplincourt, 2002, l'Iroii and Manganese Surface Complex Formation with Extracted Lignin, Part 1 : Adsorption Isotherm Experiments and EPR Spectroscopy Analysis," New Journal of Chemistry, v. 26, pp. 1638-1645.
Mikolajkow, J., 2003, "Laboratory Metlio'ds of Estiinating the Retardation Factor of Migrating Mineral Nitrogen Compounds in Shallow Groundwater," Geological Quurterh, v. 47, pp. 9 1-96.
New York State Department of Enviroimieiital Conservation (NYSDEC), 2005, "VOCs Soil Cleanup Criteria Table," www.dec.state.n~.us/website/der/ta~nis/~~~4046b.ht1nl.
U.S. Department of Energy (DOE), 2005, "Waste Storage Area (Phase II) Design Report," 52422-RP-0004, Revision A, Draft Final, Fernald Closure Project, Cincinnati, OH, June.
U. S. Environmental Protection Agency (U.S. EPA), 2005, "Technical Fact Sheet on Trichloroethylene," www.epa. ~ov/OGWDW/dwl~/t-voc/trich lor.Iitni1.
HYDROGROUP\WSAPHASEIIL4DDENDUM.DOC\ 12/1/05 1224 PM 7


..

\o d- 0
8
m v) 0
8
% 0
8 00 z 8
E N 2
a W


\ \ . .*
Ill 500 250 0 500 F E E T F E R N A L D S I T E BOUNDARY M O N I T O R I NG WELL
- ---- LEGEND:
' L O C A T I O N WELL P L U G G E D AND ABANDONED > R A F T @ GEOPROBE L O C A T I O N -
FIGURE 1 . WSA PHASE I 1 SAMPLING LOCATIONS

\ q) @ m . m 13345
13344 2.32
a 33334
NOTE: MANGANESE FRL = 0.90 mg
(\ \- SCALE \ \ \ \
'\ k . ' %\
1 500 FE
h: ,' ) "\, 500 250 0
MONITORING WELL FERNALD SITE BOUNDARY ++ LOCATION R A F T .
LEGEND: - - - - - -~
BOUNDARY OF OVERBURDEN AREA WHERE THICKNESS I S <3 FEET WELL PLUGGED 0 AND ABANDONED
............ I e EXTRACTION WELL LOCATION MANGANESE CONTOUR (rng/L) + 8 @ MANGANESE SAMPLE LOCATION 0 GEOPROBE LOCATION
F IGURE 2. MAXIMUM MANGANESE PLUME I N THE WASTE STORAGE AREA

' . .\ SCALE ' .'\ \ \ k, \ \
; 1 \?, 500 250 0 500 FEET MONITOR I NG WELL
FERNALD S I T E BOUNDARY +-$ LOCATION OVERBURDEN ISOPACH WELL PLUGGED THICKNESS I N FEET ( 3 ) MODELED MANGANESE
> R A F T -EGEND: - - - - -
6 AND ABANDONED
@J GEOPROBE LOCATION
............I
e EXTRACTION WELL LOCATION CONTOUR ( m g / L 1
F I G U R E 3. LAYER 12 INITIAL CONDITIONS

F P P
8 33334
'\ <\ p, SCALE i \., '\
\ \ \ \
500 FEE 500 250 0 '2, k:
I) )-R A F.T L I MONITORING WELL LEGEND. - - - - - r CKIYHLU J I I L Y V l l .I, .. -
OVERBURDEN ISOPACH THICKNESS I N FEET ( 3 ) ............I
-7 LOCATION
WELL PLUGGED 4 AND ABANDONED
ND IT I UNS

I
to 33334
FIGURE 5. LAYER 10 INITIAL CONDITIONS

LEGEND: - - - - - FERNALD S I T E BDUNUAKY OVERBURDEN ISOPACH WELL PLUGGED THICKNESS I N FEET ( 3 ) MODELED MANGANESE
0 AND ABANDONED 9 EXTRACTION WELL LOCATION
............I
F I G U R E 6. LAYER 09 I N I T I A L C O N D I T I O N S
\
\-
>RAFT
9 33334
SCALE
p!
0 GEOPROBE L O C A T I O N
FIGURE 7. LAYER 0,8 INITIAL C O N D I T I O N S

9 33334
” ..
ON

,
OVERBURDEN I S O P A C H T H I C K N E S S I N F E E T ( 3 ) ............ I WELL P L U G G E D 0 AND ABANDONED
e EXTRACTION WELL LOCATION MODELED MANGANESE CONTOUR ( mg/L 1 0 GEOPROBE L O C A T I O N
F I G U R E 9. LAYER 12 M O D E L C O N D I T I O N S A T 4-1-2007