Embed Size (px)
Citation preview
1
ADDENDUM TO EIA/EMP
FOR
THE PROPOSED
ADRIYALA SHAFT PROJECT
(One time capacity expansion for 50% in the existing operations under the provisions of MoEF Office
Memorandum J-11015/30/2004.IA.II (M), dated 07.01.2014)
DEPARTMENT OF ENVIRONMENT
(QCI / NABET Accredited EIA Consultant Organization)
THE SINGARENI COLLIERIES COMPANY LIMITED (A Government Company)
KOTHAGUDEM COLLIERIES – 507 101
TELANGANA STATE
OCTOBER 2014
2
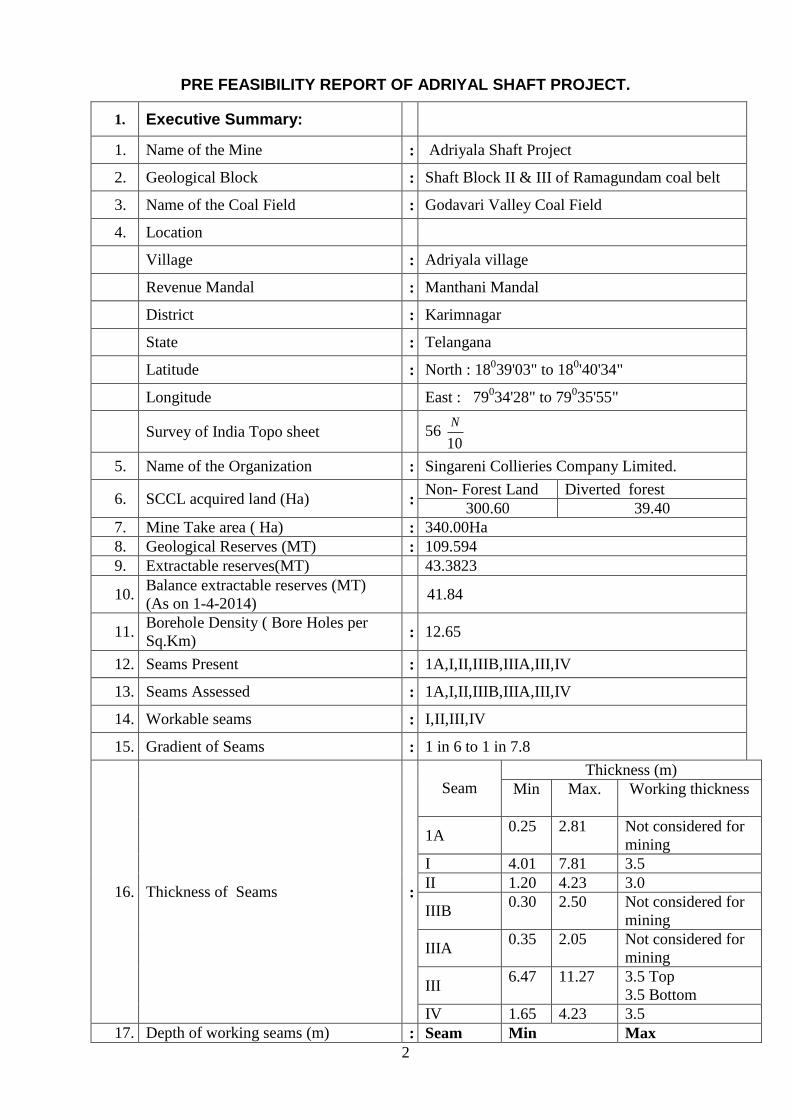
PRE FEASIBILITY REPORT OF ADRIYAL SHAFT PROJECT.
1. Executive Summary:
1. Name of the Mine : Adriyala Shaft Project
2. Geological Block : Shaft Block II & III of Ramagundam coal belt
3. Name of the Coal Field : Godavari Valley Coal Field
4. Location
Village : Adriyala village
Revenue Mandal : Manthani Mandal
District : Karimnagar
State : Telangana
Latitude : North : 18039'03" to 18
0'40'34"
Longitude East : 79034'28" to 79
035'55"
Survey of India Topo sheet 56 10
N
5. Name of the Organization : Singareni Collieries Company Limited.
6. SCCL acquired land (Ha) : Non- Forest Land Diverted forest
300.60 39.40
7. Mine Take area ( Ha) : 340.00Ha
8. Geological Reserves (MT) : 109.594
9. Extractable reserves(MT) 43.3823
10. Balance extractable reserves (MT)
(As on 1-4-2014) 41.84
11. Borehole Density ( Bore Holes per
Sq.Km) : 12.65
12. Seams Present : 1A,I,II,IIIB,IIIA,III,IV
13. Seams Assessed : 1A,I,II,IIIB,IIIA,III,IV
14. Workable seams : I,II,III,IV
15. Gradient of Seams : 1 in 6 to 1 in 7.8
16. Thickness of Seams :
Seam
Thickness (m)
Min
Max.
Working thickness
1A 0.25 2.81 Not considered for
mining
I 4.01 7.81 3.5
II 1.20 4.23 3.0
IIIB 0.30 2.50 Not considered for
mining
IIIA 0.35 2.05 Not considered for
mining
III 6.47 11.27 3.5 Top
3.5 Bottom
IV 1.65 4.23 3.5
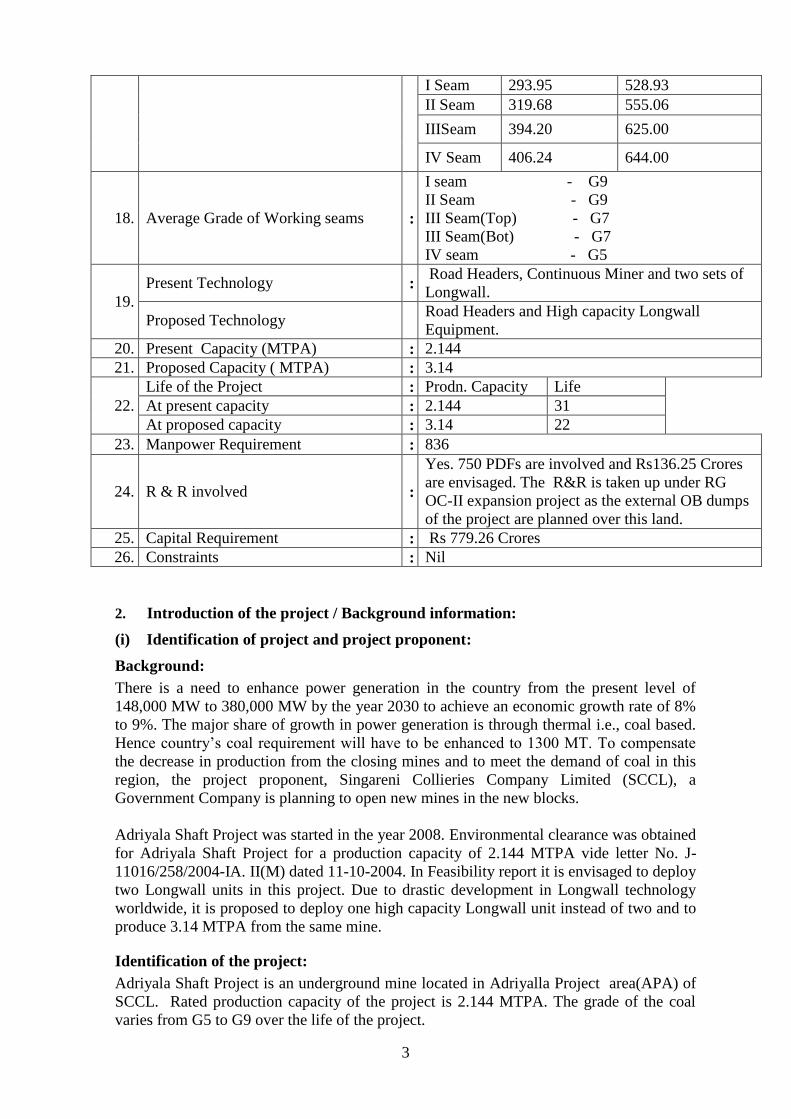
17. Depth of working seams (m) : Seam Min Max
3
I Seam 293.95 528.93
II Seam 319.68 555.06
IIISeam 394.20 625.00
IV Seam 406.24 644.00
18. Average Grade of Working seams :
I seam - G9
II Seam - G9
III Seam(Top) - G7
III Seam(Bot) - G7
IV seam - G5
19.
Present Technology : Road Headers, Continuous Miner and two sets of
Longwall.
Proposed Technology Road Headers and High capacity Longwall
Equipment.
20. Present Capacity (MTPA) : 2.144
21. Proposed Capacity ( MTPA) : 3.14
22.
Life of the Project : Prodn. Capacity Life
At present capacity : 2.144 31
At proposed capacity : 3.14 22
23. Manpower Requirement : 836
24. R & R involved :
Yes. 750 PDFs are involved and Rs136.25 Crores
are envisaged. The R&R is taken up under RG
OC-II expansion project as the external OB dumps
of the project are planned over this land.
25. Capital Requirement : Rs 779.26 Crores
26. Constraints : Nil
2. Introduction of the project / Background information:
(i) Identification of project and project proponent:
Background:
There is a need to enhance power generation in the country from the present level of
148,000 MW to 380,000 MW by the year 2030 to achieve an economic growth rate of 8%
to 9%. The major share of growth in power generation is through thermal i.e., coal based.
Hence country’s coal requirement will have to be enhanced to 1300 MT. To compensate
the decrease in production from the closing mines and to meet the demand of coal in this
region, the project proponent, Singareni Collieries Company Limited (SCCL), a
Government Company is planning to open new mines in the new blocks.
Adriyala Shaft Project was started in the year 2008. Environmental clearance was obtained
for Adriyala Shaft Project for a production capacity of 2.144 MTPA vide letter No. J-
11016/258/2004-IA. II(M) dated 11-10-2004. In Feasibility report it is envisaged to deploy
two Longwall units in this project. Due to drastic development in Longwall technology
worldwide, it is proposed to deploy one high capacity Longwall unit instead of two and to
produce 3.14 MTPA from the same mine.
Identification of the project:
Adriyala Shaft Project is an underground mine located in Adriyalla Project area(APA) of
SCCL. Rated production capacity of the project is 2.144 MTPA. The grade of the coal
varies from G5 to G9 over the life of the project.
4
Project Proponent:
The Singareni Collieries Company Limited (SCCL) has been exploiting coal for more than
122 years in the 350 km stretch of Pranahita Godavari Valley Coal Field spread in four
districts of Telangana viz. Adilabad, Karimnagar, Warangal and Khammam with man
power of 62805 and is the second largest public sector under taking in the state. It is the
only coal mining company in South India catering the needs of coal based industries in the
region. SCCL is currently operating 16 open cast projects and 32 underground mines and
has achieved coal production of 50.47 MT in the year 2013-14 and target for the year
2014-15is 55.00 MT.
Address of Project Proponent:
Project Officer
Adriyala Longwall Project
P.O 8 incline colony
Karimnagar dist
Telangana
PIN 505211
Email [email protected]
Fax No 08728-259843
Address of Owner:
Director (Operations)
The Singareni Collieries Company Limited
Po:Kothagudem, PIN. 507 101
Dist: Khammam, Telangana
E-Mail id: [email protected]
Ph.No. 08744 - 242602; Fax No. 08744 - 242305
Details of the Mining Lease:
The entire project area is covered in Pandullapalli Mining Lease valid upto 18-7-2021 and
South Godavari Mining Lease Valid upto:31.12.2014
(ii) Brief description of nature of the project:
Adriyal Shaft Project is an underground coal mine producing G-5 to G-9 grade coal with a capacity of 2.144 MTPA.
Present proposal envisaged for expansion project:
The project was granted environment clearance for a production capacity of 2.144 MTPA
with two Longwall sets and 150m face length. Keeping in view of the changes in
Longwall Technology globally, SCCL has decided to deploy high capacity Longwall
Technology which
is capable of producing more than 3.0 MTPA in the same minetake area by redesigning
the Longwall face length with 250m. Hence it is proposed to increase the production
capacity of the mine from 2.144 MTPA to 3.14 MTPA and to obtain environmental
clearance for this production capacity under MoEF memorandum J-11015/30/2004-IA-
II(M) dated 7/1/2014.
5
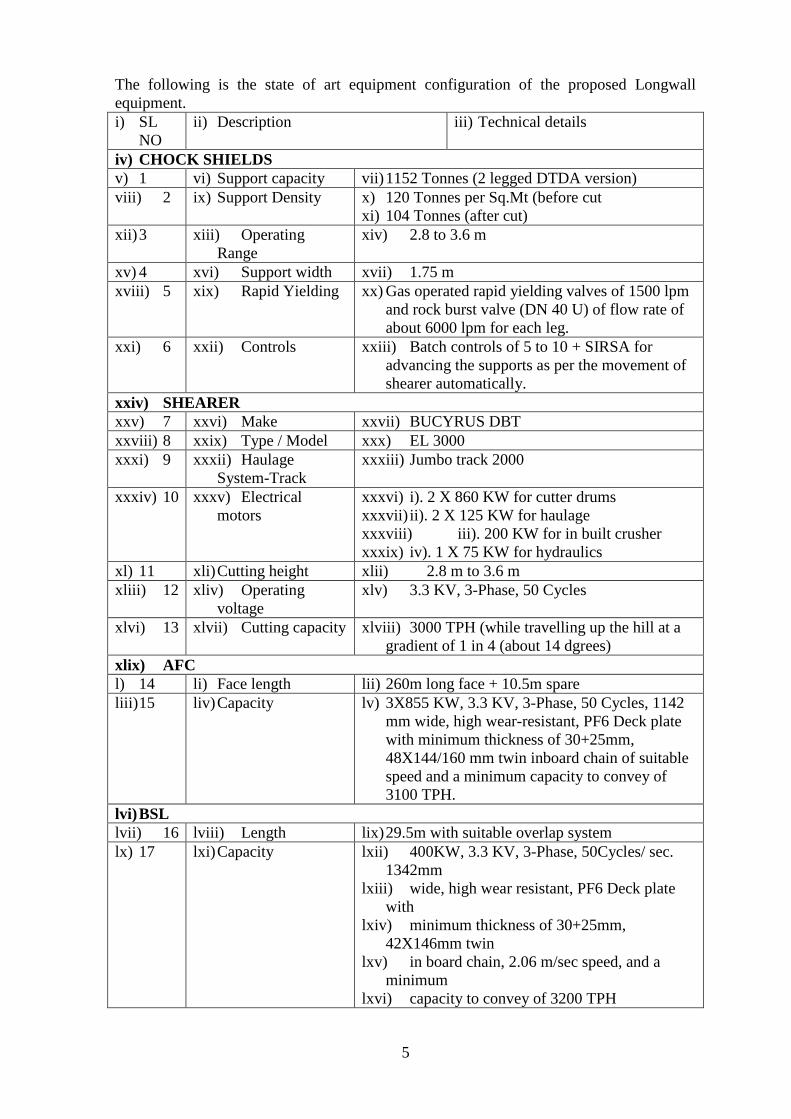
The following is the state of art equipment configuration of the proposed Longwall
equipment.
i) SL
NO
ii) Description iii) Technical details
iv) CHOCK SHIELDS
v) 1 vi) Support capacity vii) 1152 Tonnes (2 legged DTDA version)
viii) 2 ix) Support Density x) 120 Tonnes per Sq.Mt (before cut
xi) 104 Tonnes (after cut)
xii) 3 xiii) Operating
Range
xiv) 2.8 to 3.6 m
xv) 4 xvi) Support width xvii) 1.75 m
xviii) 5 xix) Rapid Yielding xx) Gas operated rapid yielding valves of 1500 lpm
and rock burst valve (DN 40 U) of flow rate of
about 6000 lpm for each leg.
xxi) 6 xxii) Controls xxiii) Batch controls of 5 to 10 + SIRSA for
advancing the supports as per the movement of
shearer automatically.
xxiv) SHEARER
xxv) 7 xxvi) Make xxvii) BUCYRUS DBT
xxviii) 8 xxix) Type / Model xxx) EL 3000
xxxi) 9 xxxii) Haulage
System-Track
xxxiii) Jumbo track 2000
xxxiv) 10 xxxv) Electrical
motors
xxxvi) i). 2 X 860 KW for cutter drums
xxxvii) ii). 2 X 125 KW for haulage
xxxviii) iii). 200 KW for in built crusher
xxxix) iv). 1 X 75 KW for hydraulics
xl) 11 xli) Cutting height xlii) 2.8 m to 3.6 m
xliii) 12 xliv) Operating
voltage
xlv) 3.3 KV, 3-Phase, 50 Cycles
xlvi) 13 xlvii) Cutting capacity xlviii) 3000 TPH (while travelling up the hill at a
gradient of 1 in 4 (about 14 dgrees)
xlix) AFC
l) 14 li) Face length lii) 260m long face + 10.5m spare
liii) 15 liv) Capacity lv) 3X855 KW, 3.3 KV, 3-Phase, 50 Cycles, 1142
mm wide, high wear-resistant, PF6 Deck plate
with minimum thickness of 30+25mm,
48X144/160 mm twin inboard chain of suitable
speed and a minimum capacity to convey of
3100 TPH.
lvi) BSL
lvii) 16 lviii) Length lix) 29.5m with suitable overlap system
lx) 17 lxi) Capacity lxii) 400KW, 3.3 KV, 3-Phase, 50Cycles/ sec.
1342mm
lxiii) wide, high wear resistant, PF6 Deck plate
with
lxiv) minimum thickness of 30+25mm,
42X146mm twin
lxv) in board chain, 2.06 m/sec speed, and a
minimum
lxvi) capacity to convey of 3200 TPH
6
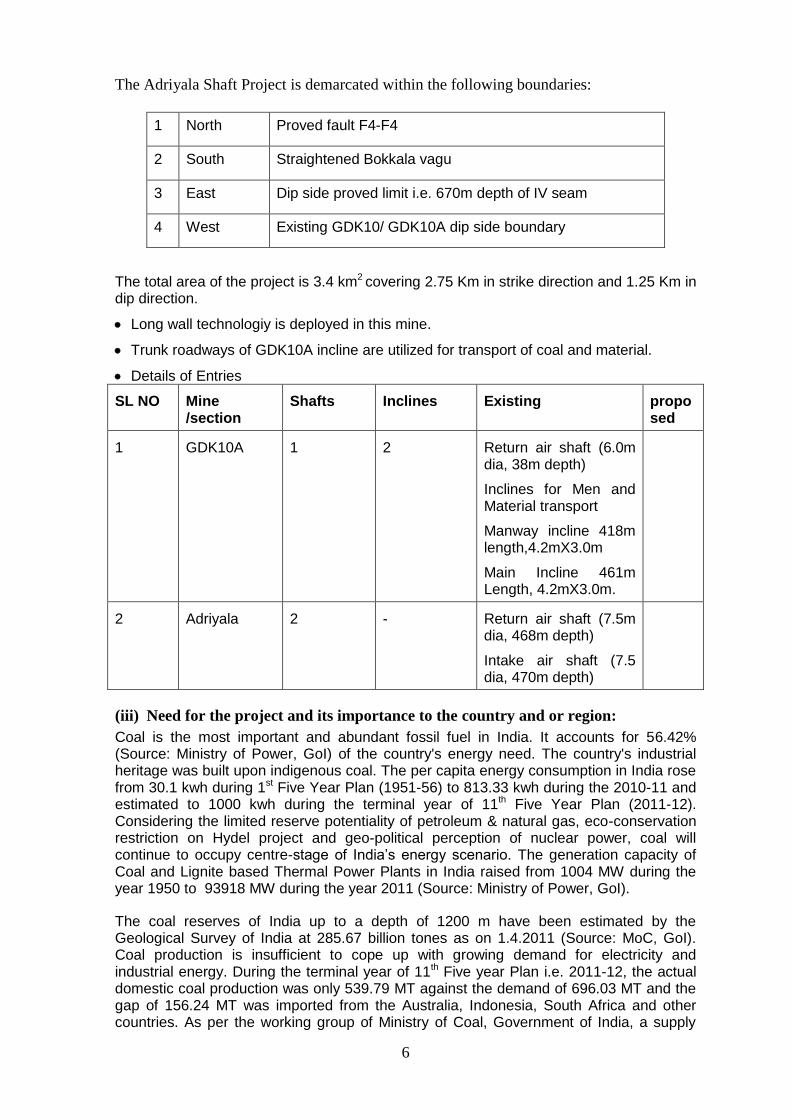
The Adriyala Shaft Project is demarcated within the following boundaries:
1 North Proved fault F4-F4
2 South Straightened Bokkala vagu
3 East Dip side proved limit i.e. 670m depth of IV seam
4 West Existing GDK10/ GDK10A dip side boundary
The total area of the project is 3.4 km2 covering 2.75 Km in strike direction and 1.25 Km in dip direction.
Long wall technologiy is deployed in this mine.
Trunk roadways of GDK10A incline are utilized for transport of coal and material.
Details of Entries
SL NO Mine /section
Shafts Inclines Existing proposed
1 GDK10A 1 2 Return air shaft (6.0m dia, 38m depth)
Inclines for Men and Material transport
Manway incline 418m length,4.2mX3.0m
Main Incline 461m Length, 4.2mX3.0m.
2 Adriyala 2 - Return air shaft (7.5m dia, 468m depth)
Intake air shaft (7.5 dia, 470m depth)
(iii) Need for the project and its importance to the country and or region:
Coal is the most important and abundant fossil fuel in India. It accounts for 56.42% (Source: Ministry of Power, GoI) of the country's energy need. The country's industrial heritage was built upon indigenous coal. The per capita energy consumption in India rose from 30.1 kwh during 1st Five Year Plan (1951-56) to 813.33 kwh during the 2010-11 and estimated to 1000 kwh during the terminal year of 11th Five Year Plan (2011-12). Considering the limited reserve potentiality of petroleum & natural gas, eco-conservation restriction on Hydel project and geo-political perception of nuclear power, coal will continue to occupy centre-stage of India’s energy scenario. The generation capacity of Coal and Lignite based Thermal Power Plants in India raised from 1004 MW during the year 1950 to 93918 MW during the year 2011 (Source: Ministry of Power, GoI).
The coal reserves of India up to a depth of 1200 m have been estimated by the Geological Survey of India at 285.67 billion tones as on 1.4.2011 (Source: MoC, GoI). Coal production is insufficient to cope up with growing demand for electricity and industrial energy. During the terminal year of 11th Five year Plan i.e. 2011-12, the actual domestic coal production was only 539.79 MT against the demand of 696.03 MT and the gap of 156.24 MT was imported from the Australia, Indonesia, South Africa and other countries. As per the working group of Ministry of Coal, Government of India, a supply
7
gap of about 265.50 million tones is forecasted by the terminal year of 12th Five Year Plan i.e. 2016-17. Even the increase in production is considered in optimistic scenario the gap of 185.50 MT will still be left by TY of 12th FY Plan (Source: Working Group of Ministry of Coal, GoI).
The Singareni Collieries Company Limited is only coal producing company catering the needs of energy requirements in South India. A supply gap of 16.40 million tones is projected by the terminal year of 12th Five Year Plan, i.e. 2016-17 (Working Group of MoC). Hence, SCCL is taking following steps to increase the coal production:
Reconstruction of existing mines for optimizing production with the introduction of intermediate and high technology.
Opening of new mines in the adjoining / superjacent areas / seams for higher production.
Adopting opencast working wherever possible for high rate of production.
Reconstruction of shallow underground workings for extraction of remnant coal reserves by opencast method.
Hence, the proposed project is justified in view of demand-supply gap in the country.
(iv) Demand - Supply Gap:
The below table reveals that total availability of coal from the existing projects, projects
under implementation and approved projects is inadequate to meet the total demand and a
substantial gap remains unfulfilled. Hence, opening of new mines in the adjoining /
superjacent areas / seams for higher production is justified to mitigate the demand -
supply gap.
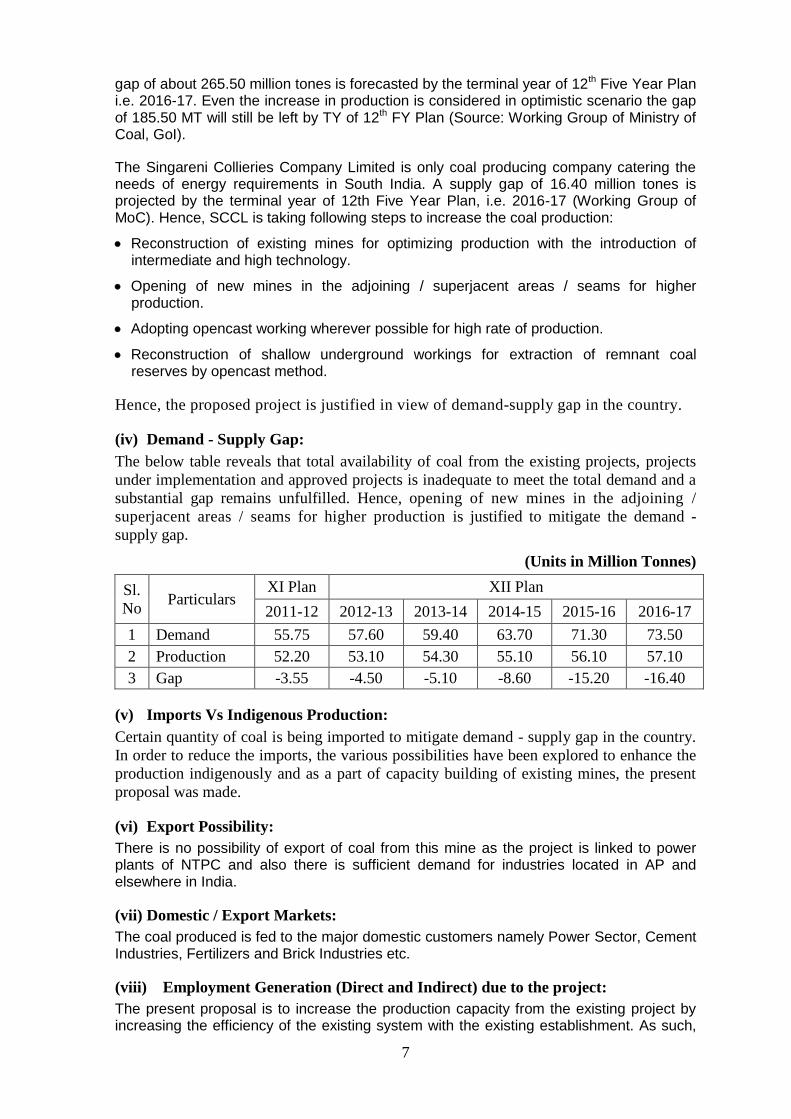
(Units in Million Tonnes)
Sl.
No Particulars
XI Plan XII Plan
2011-12 2012-13 2013-14 2014-15 2015-16 2016-17
1 Demand 55.75 57.60 59.40 63.70 71.30 73.50
2 Production 52.20 53.10 54.30 55.10 56.10 57.10
3 Gap -3.55 -4.50 -5.10 -8.60 -15.20 -16.40
(v) Imports Vs Indigenous Production:
Certain quantity of coal is being imported to mitigate demand - supply gap in the country.
In order to reduce the imports, the various possibilities have been explored to enhance the
production indigenously and as a part of capacity building of existing mines, the present
proposal was made.
(vi) Export Possibility:
There is no possibility of export of coal from this mine as the project is linked to power plants of NTPC and also there is sufficient demand for industries located in AP and elsewhere in India.
(vii) Domestic / Export Markets:
The coal produced is fed to the major domestic customers namely Power Sector, Cement Industries, Fertilizers and Brick Industries etc.
(viii) Employment Generation (Direct and Indirect) due to the project:
The present proposal is to increase the production capacity from the existing project by increasing the efficiency of the existing system with the existing establishment. As such,

8
there will not be any additional man power required for the project, however, indirect employment opportunities due to coal transportation, material supply, out sourcing operations will be increased to local people.
3. Project Description:
i. Type of project including interlinked and interdependent projects, if any:
The project is independent and not interlinked or interdependent on any project for its
production.
ii. Location (Map showing general location, specific location, and project boundary & project site layout) with coordinates:
Adriyala Shaft Project belonging to Adriyala Project Area (APA) is located in Manthani
Mandal of Karimnagar district of Telangana. APA area is well connected by Rail and
road. The nearest Railway Station is Peddapalli on the Kazipet-Balharsha line of south
central railway is about 20km. APA area is well connected to the state capital, Hyderabad
both by rail and road. Hyderabad is about 225km by road.
This mine is lying in between North Latitude of N 18039'03" to 18
0'40'34" and East
Longitude of E 79034'28" to 79
035'55" in Survey of India Top sheet No. 56N/8.
The Location and Key Plans showing general location, specific location, and project
boundary are enclosed as Figure - I & II respectively.
iii. Details of alternate sites considered and the basis of selecting the proposed site, particularly the environmental considerations gone into:
Exploring the alternatives is not applicable for mining as mining activity is site specific in nature. The present proposal is expansion of existing project, alternate site is not applicable.
iv. Size or magnitude of operation
The project is categorized as “A” as per the provisions of SO 1533 dated 14th September 2006 and its subsequent amendment SO 3067 dated 1st December 2009. The mine take area of the project is 340.0 Ha and the total project area is 363.90 Ha. This mine is planned for a production capacity of 3.14 MTPA.
The main mode of entries is by inclines, and shafts. The details of the entries and their purpose is described at point 2 (ii) under details of entries heading.
v. Project description with process details (A schematic diagram / flow chart showing the project layout, components of the project etc.)
The project is a coal producing unit referred to as a Coal mine. The coal produced in underground is brought to the surface and dispatched to the linked / identified customers.
The components of the project are:
The present proposal is for enhancement of the present production capacity by deploying high capacity Longwall equipment. However, the method of work of new underground coal mine comprises of -
Clearing of the land
Making approaches to the coal seams
Mine development
Drilling & Blasting/ Coal cutting
9
Face supporting
Coal loading in tubs/ belt conveyors
Transportation of coal to surface
Transportation of coal from pre-weigh bins to customers.
Underground water is pumped out by installing pumps in stages.
All the mining operations are carried out under the statutory Supervision of Mining / Mechanical / Electrical supervisors as per the Mines Act, 1952.
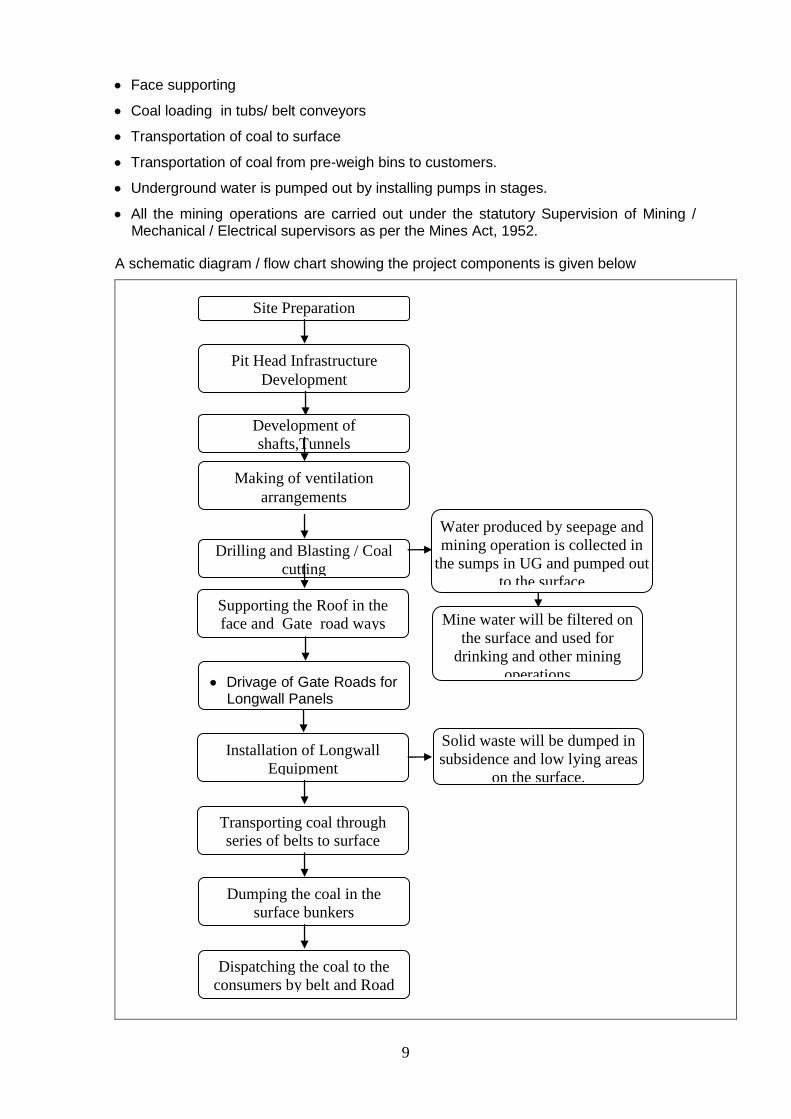
A schematic diagram / flow chart showing the project components is given below
Site Preparation
Pit Head Infrastructure
Development
Development of
shafts,Tunnels
Making of ventilation
arrangements
Drilling and Blasting / Coal
cutting
Supporting the Roof in the
face and Gate road ways
Installation of Longwall
Equipment
Transporting coal through
series of belts to surface
Dumping the coal in the
surface bunkers
Dispatching the coal to the
consumers by belt and Road
Drivage of Gate Roads for Longwall Panels
Water produced by seepage and
mining operation is collected in
the sumps in UG and pumped out
to the surface
Mine water will be filtered on
the surface and used for
drinking and other mining
operations
Solid waste will be dumped in
subsidence and low lying areas
on the surface.

10
vi. Raw material required along with estimated quantity, likely source, marketing area of final product, mode of transport of raw material and finished product:
Raw material required along with estimated quantity:
Coal is natural resource and does not require any raw material for production of coal. However in the process of extraction of coal explosives, hydraulic oils etc are used for the equipment deployed in the mine.
Mode of Transportation of Raw Material:
NA
Marketing area of final product:
Coal from this mine is transported to RG OC-I CHP from there it is supplied to NTPC Ramagundam, and to other cement industries
Mode of Transportation of Finished Product (Coal):
The coal obtained from this project is transported to RG OC-I CHP located at a distance of 10Km by belt conveyors, from there it is supplied to NTPC and other power plants by rail.
vii. Resource optimization / recycling and reuse envisaged in the project, if any:
Resources like explosives, hydraulic oils, machinery, land, power and water are fully optimized to minimize unnecessary losses during the process of extraction of coal and supply of coal to the customers.
As the coal mining process does not involve any chemical process, the excess pumping of water will be useful for domestic purpose, drinking and irrigation to nearby fields. The effluents from workshop and township will be treated in ETPs and Oxidation Ponds respectively and waste water will be utilized for watering plantations, parks, lawns, gardens and for spraying arrangement for dust control, etc.
Excess water let out from the mine will be treated in settling tanks / slow sand filters before discharged and used for agriculture purpose. The surplus water is being let out for irrigation of surrounding fields.
viii. Availability of water, its source, Energy / Power requirement and source:
The water required for the project will be met from the water pumped out from the mine workings. In the process of mining, water will be accumulated in the dip most places of the mine due to natural seepage. The water so accumulated will be collected in sumps at different places in the mine and pumped out to the surface with suitable capacity pumps. The pumped out water will be filtered on the surface and used for drinking and other mining operations on the pit head as well as supplied to the colonies. The estimated water to be pumped out from different sections of the mine and its usage is as follows:
SL No Description Quantity in KLD
1 Average quantity of water pumped out of the mine 13000
2 Water used for drinking/bathing and other industrial requirement
250
3 Water used for plantation 200
4 Used for dust suppression 1050
5 Excess water let out 11500
11
Adriyala Shaft Project is receiving power from Centenary colony, RG III 132/33 KV SCCL Sub-Station.
Source of power supply : SCCL 132/33 KV Sub station
Receiving voltage : 33 KV OHT Line (Double circuit)
Metering equipment : At 33/3.3 KV Substation
Annual power consumptions
The average annual power consumption of the project is 38679399 KWH
Sub-Station:
Adriyala Shaft Project has one independent substation at surface which is fed from 132/33
KV SCCL substation located at centenary colony by feeder No-9,12 at 33 KV. At this
substation power is stepped down to 3.3 KV and supplied to underground machinery. In
Adriyala section power is supplied to Trunk conveyors at 11KV, for remaining machinery
at 3.3 KV.
ix. Quantity of wastes to be generated (liquid / solid) and scheme for their management / disposal:
In underground mine, wastes generated during the mining is very less compared to that of
opencast mining.
The solid waste generated will be generally the stone bands / dirt bands / shale produced
during mining activity. The debris so produced will be used for underground track
ballasting, leveling of the uneven floors and strengthening of surface bank head. The other
wastes will include decayed timber in small proportions.
The liquid wastes like used oils, grease etc; will be stored in separate tins / drums and sent to surface at regular intervals for disposing as per Hazardous Waste Management Rules.
The water pumped out of the mine is treated in filter bed and reused for drinking purpose and other utilities.
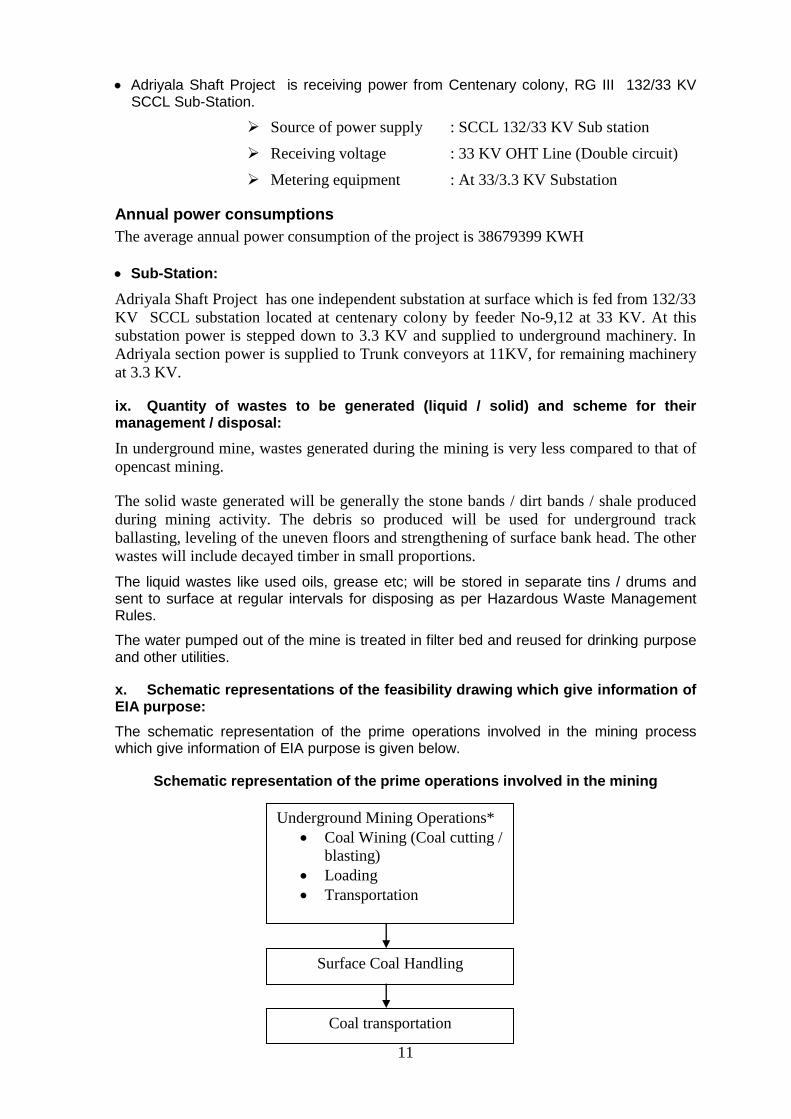
x. Schematic representations of the feasibility drawing which give information of EIA purpose:
The schematic representation of the prime operations involved in the mining process which give information of EIA purpose is given below.
Schematic representation of the prime operations involved in the mining
Underground Mining Operations*
Coal Wining (Coal cutting /
blasting)
Loading
Transportation
Surface Coal Handling
Coal transportation
12
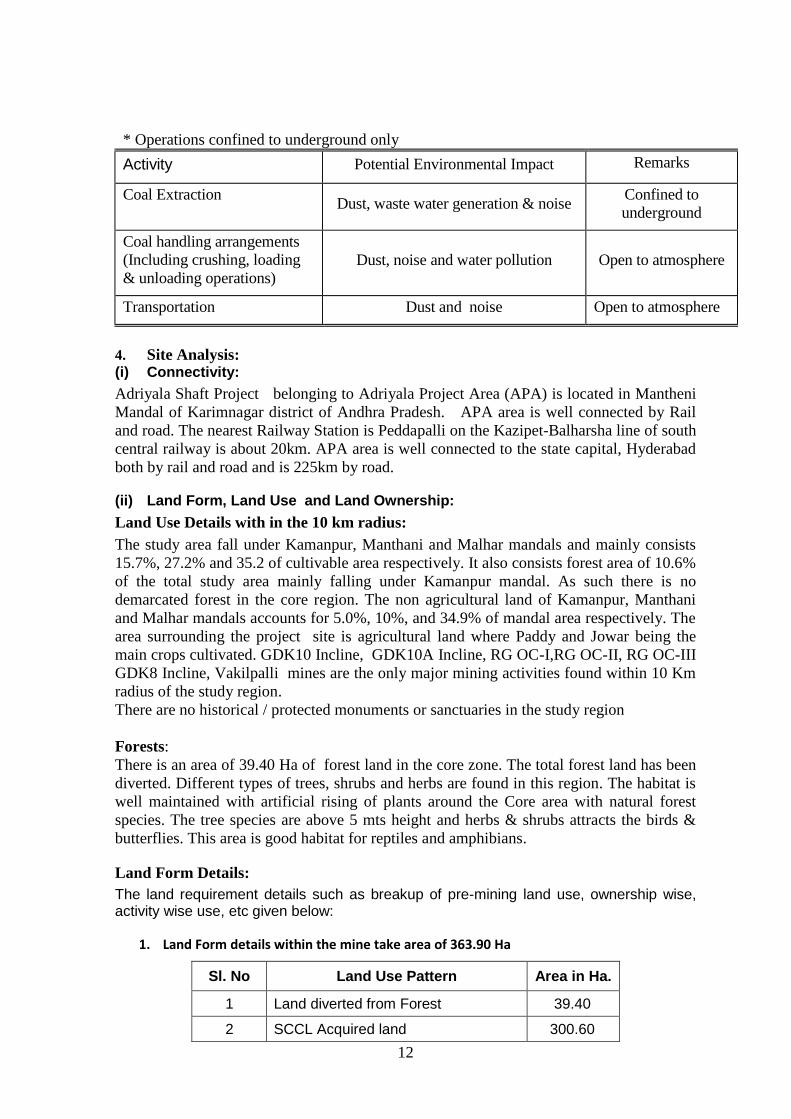
* Operations confined to underground only
Activity Potential Environmental Impact Remarks
Coal Extraction Dust, waste water generation & noise
Confined to
underground
Coal handling arrangements
(Including crushing, loading
& unloading operations)
Dust, noise and water pollution Open to atmosphere
Transportation Dust and noise Open to atmosphere
4. Site Analysis: (i) Connectivity:
Adriyala Shaft Project belonging to Adriyala Project Area (APA) is located in Mantheni
Mandal of Karimnagar district of Andhra Pradesh. APA area is well connected by Rail
and road. The nearest Railway Station is Peddapalli on the Kazipet-Balharsha line of south
central railway is about 20km. APA area is well connected to the state capital, Hyderabad
both by rail and road and is 225km by road.
(ii) Land Form, Land Use and Land Ownership:
Land Use Details with in the 10 km radius:
The study area fall under Kamanpur, Manthani and Malhar mandals and mainly consists
15.7%, 27.2% and 35.2 of cultivable area respectively. It also consists forest area of 10.6%
of the total study area mainly falling under Kamanpur mandal. As such there is no
demarcated forest in the core region. The non agricultural land of Kamanpur, Manthani
and Malhar mandals accounts for 5.0%, 10%, and 34.9% of mandal area respectively. The
area surrounding the project site is agricultural land where Paddy and Jowar being the
main crops cultivated. GDK10 Incline, GDK10A Incline, RG OC-I,RG OC-II, RG OC-III
GDK8 Incline, Vakilpalli mines are the only major mining activities found within 10 Km
radius of the study region.
There are no historical / protected monuments or sanctuaries in the study region
Forests:
There is an area of 39.40 Ha of forest land in the core zone. The total forest land has been
diverted. Different types of trees, shrubs and herbs are found in this region. The habitat is
well maintained with artificial rising of plants around the Core area with natural forest
species. The tree species are above 5 mts height and herbs & shrubs attracts the birds &
butterflies. This area is good habitat for reptiles and amphibians.
Land Form Details:
The land requirement details such as breakup of pre-mining land use, ownership wise, activity wise use, etc given below:
1. Land Form details within the mine take area of 363.90 Ha
Sl. No Land Use Pattern Area in Ha.
1 Land diverted from Forest 39.40
2 SCCL Acquired land 300.60
13
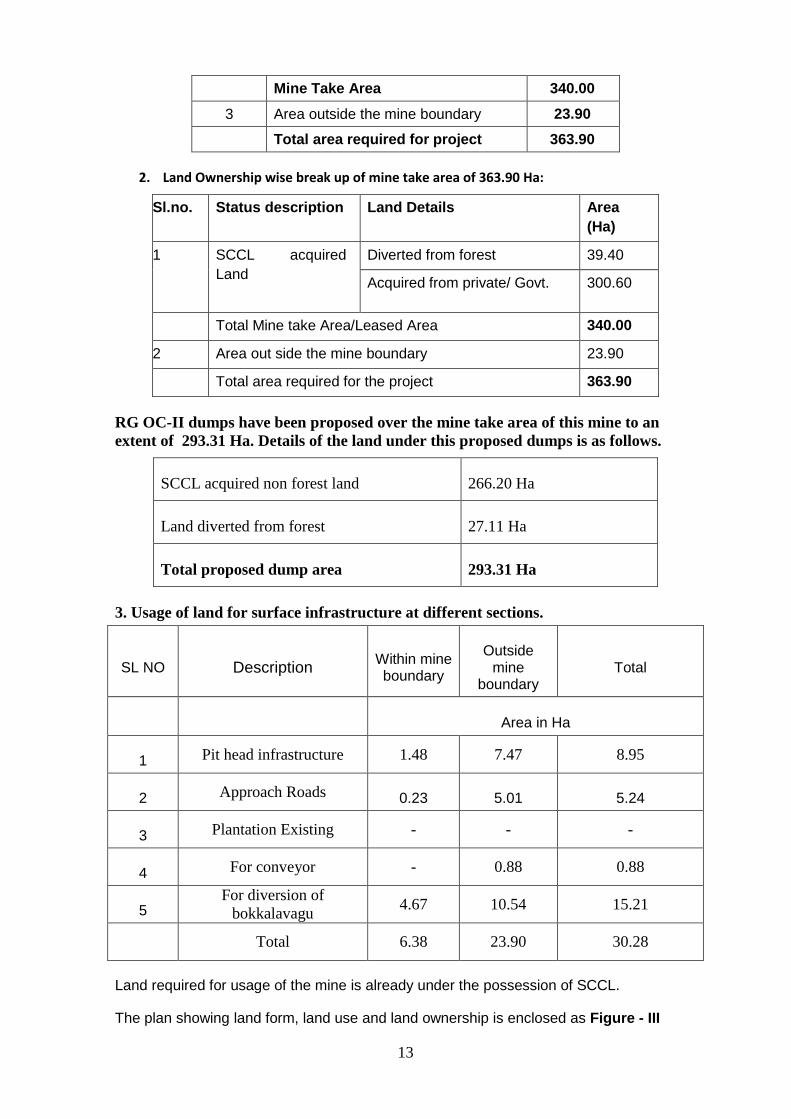
Mine Take Area 340.00
3 Area outside the mine boundary 23.90
Total area required for project 363.90
2. Land Ownership wise break up of mine take area of 363.90 Ha:
Sl.no. Status description Land Details Area
(Ha)
1 SCCL acquired
Land
Diverted from forest 39.40
Acquired from private/ Govt. 300.60
Total Mine take Area/Leased Area 340.00
2 Area out side the mine boundary 23.90
Total area required for the project 363.90
RG OC-II dumps have been proposed over the mine take area of this mine to an
extent of 293.31 Ha. Details of the land under this proposed dumps is as follows.
SCCL acquired non forest land 266.20 Ha
Land diverted from forest 27.11 Ha
Total proposed dump area 293.31 Ha
3. Usage of land for surface infrastructure at different sections.
SL NO Description Within mine boundary
Outside mine
boundary Total
Area in Ha
1 Pit head infrastructure 1.48 7.47 8.95
2 Approach Roads 0.23 5.01 5.24
3 Plantation Existing - - -
4 For conveyor - 0.88 0.88
5 For diversion of
bokkalavagu 4.67 10.54 15.21
Total 6.38 23.90 30.28
Land required for usage of the mine is already under the possession of SCCL.
The plan showing land form, land use and land ownership is enclosed as Figure - III
14
(iii) Topography (along with map):
Core Zone: The block is mostly plain terrain and gently sloping towards northeast with elevation range from 140.79m (BH.No. 1222) to 172. 83m (BH.No. GGK-23) above mean sea level. The area is covered by thin mantle of 1.25m to 3.5m thickness which is barren and is partly cultivated. SRSP canal and Bokkala vagu are flowing over minetake are which are proposed for diversion. Rachapalli village and Rachapalli tank are present over the minetake area. The R&R and diversion activities are taken up by the adjacent RG OC-II Project as most of the mine take area on surface pertaining to Adriyala Project area is proposed for dumping of overburden from RG OC-II project.
Buffer Zone: Buffer zone falls in Kamanpur, Manthani and Ramagundam Mandals consisting of 21.6% of cultivable area. It also consists forest area accounting to 9.4% of the total study area. Non agricultural land accounts for 69% of the total study area. There are no historically protected monuments or sanctuaries in the study area
Drainage:
The drainage of this area is affected by ephemeral tributaries of River Godavari viz., Jallaram vagu and Bokkala vagu. It is of dendritic type with a drainage density of 3.6 km/sq.km. The highest flood level (HFL) of Bokkala vagu recorded near GDK10 Inc. was 155m above Mean Sea Level during August, 1983. The HFL of Godavari River recorded at intake well near GDK-1 inc. on 10th October, 1995 is 138.10m above MSL
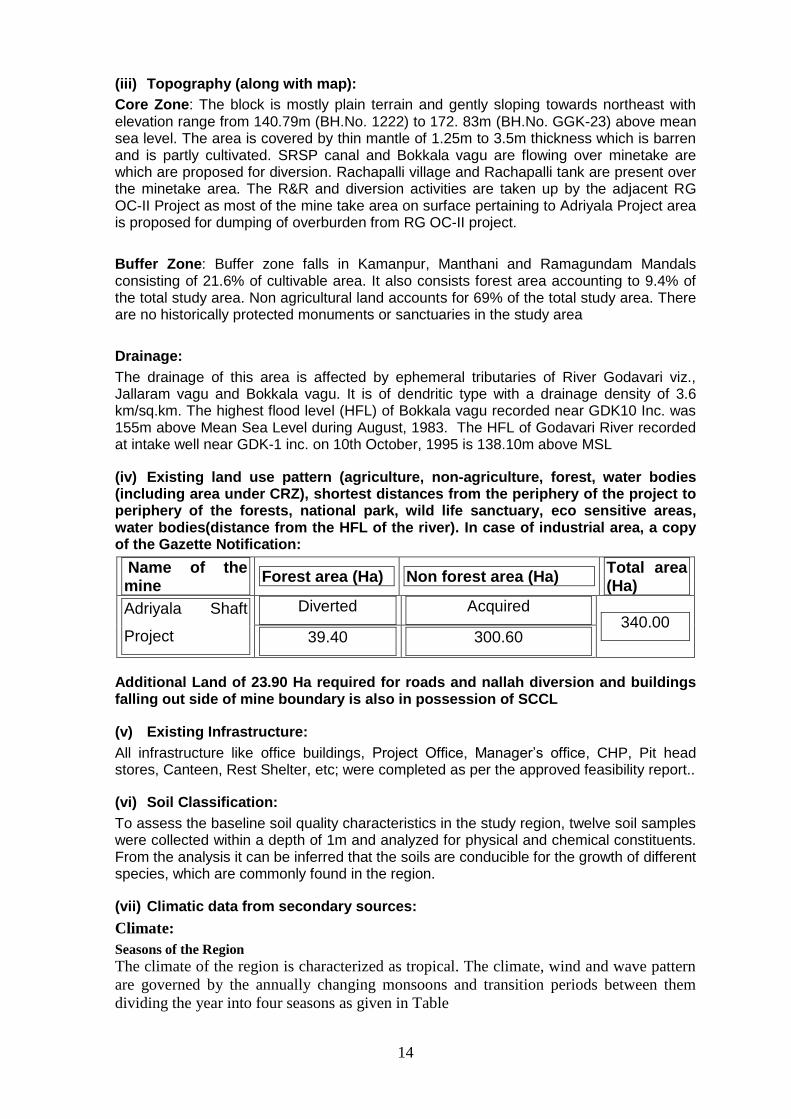
(iv) Existing land use pattern (agriculture, non-agriculture, forest, water bodies (including area under CRZ), shortest distances from the periphery of the project to periphery of the forests, national park, wild life sanctuary, eco sensitive areas, water bodies(distance from the HFL of the river). In case of industrial area, a copy of the Gazette Notification:
Name of the mine
Forest area (Ha) Non forest area (Ha) Total area (Ha)
Adriyala Shaft
Project
Diverted Acquired 340.00
39.40 300.60
Additional Land of 23.90 Ha required for roads and nallah diversion and buildings falling out side of mine boundary is also in possession of SCCL
(v) Existing Infrastructure:
All infrastructure like office buildings, Project Office, Manager’s office, CHP, Pit head stores, Canteen, Rest Shelter, etc; were completed as per the approved feasibility report..
(vi) Soil Classification:
To assess the baseline soil quality characteristics in the study region, twelve soil samples were collected within a depth of 1m and analyzed for physical and chemical constituents. From the analysis it can be inferred that the soils are conducible for the growth of different species, which are commonly found in the region.
(vii) Climatic data from secondary sources:
Climate:
Seasons of the Region
The climate of the region is characterized as tropical. The climate, wind and wave pattern
are governed by the annually changing monsoons and transition periods between them
dividing the year into four seasons as given in Table
15
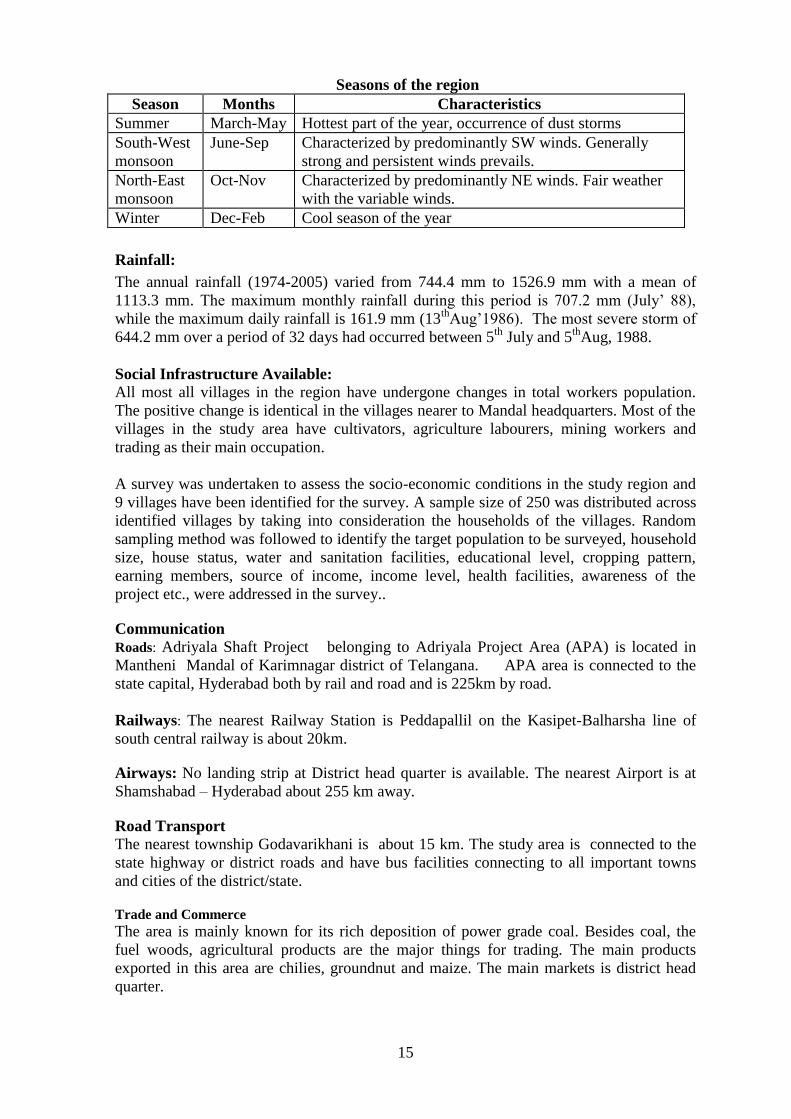
Seasons of the region
Season Months Characteristics
Summer March-May Hottest part of the year, occurrence of dust storms
South-West
monsoon
June-Sep Characterized by predominantly SW winds. Generally
strong and persistent winds prevails.
North-East
monsoon
Oct-Nov Characterized by predominantly NE winds. Fair weather
with the variable winds.
Winter Dec-Feb Cool season of the year
Rainfall:
The annual rainfall (1974-2005) varied from 744.4 mm to 1526.9 mm with a mean of
1113.3 mm. The maximum monthly rainfall during this period is 707.2 mm (July’ 88),
while the maximum daily rainfall is 161.9 mm (13th
Aug’1986). The most severe storm of
644.2 mm over a period of 32 days had occurred between 5th
July and 5th
Aug, 1988.
Social Infrastructure Available: All most all villages in the region have undergone changes in total workers population.
The positive change is identical in the villages nearer to Mandal headquarters. Most of the
villages in the study area have cultivators, agriculture labourers, mining workers and
trading as their main occupation.
A survey was undertaken to assess the socio-economic conditions in the study region and
9 villages have been identified for the survey. A sample size of 250 was distributed across
identified villages by taking into consideration the households of the villages. Random
sampling method was followed to identify the target population to be surveyed, household
size, house status, water and sanitation facilities, educational level, cropping pattern,
earning members, source of income, income level, health facilities, awareness of the
project etc., were addressed in the survey..
Communication
Roads: Adriyala Shaft Project belonging to Adriyala Project Area (APA) is located in
Mantheni Mandal of Karimnagar district of Telangana. APA area is connected to the
state capital, Hyderabad both by rail and road and is 225km by road.
Railways: The nearest Railway Station is Peddapallil on the Kasipet-Balharsha line of
south central railway is about 20km.
Airways: No landing strip at District head quarter is available. The nearest Airport is at
Shamshabad – Hyderabad about 255 km away.
Road Transport
The nearest township Godavarikhani is about 15 km. The study area is connected to the
state highway or district roads and have bus facilities connecting to all important towns
and cities of the district/state.
Trade and Commerce
The area is mainly known for its rich deposition of power grade coal. Besides coal, the
fuel woods, agricultural products are the major things for trading. The main products
exported in this area are chilies, groundnut and maize. The main markets is district head
quarter.
16
Places of Historical Importance:There are no historical/protected monuments or sanctuaries
in the study region.
5. Planning Brief:
(i) Planning concept (type of industries, facilities, transportation etc) Town and Country Planning / Development Authority Classification:
The proposed project is aimed to reduce the gap between the demand and production of
the coal in the country and to maintain the sustained growth of the company by improving
productivity and profits. Ultimately it gives financial and social benefits for the local
people their by improving their standard of living.
The area does not fall under any Industrial Estate / Industrial Park / Special Economic Zone and in the jurisdiction of Town Planning / Development Authority.
Facilities: The following facilities are already available in the existing project which will
cater the needs of expansion project:
Surface infrastructure buildings
Surface Coal Handling arrangements
Provision of coal transportation road
Communication and manpower
Water filtration and supply arrangements
Rest shelters, Canteen and First Aid facilities
Power Supply arrangements
Magazine
Transportation:
Coal from Adriyala Shaft Project is supplied to RG OC-I CHP situated at a distance of 10.0KM by belt conveyor and from there it is transported by rail to Power plants and cement industries. Some part of G9 grade coal is supplied to Ramagundam B power house, KTPP Bhupalpalli, and private customers by road.
.Population Projection:
The present proposal is to enhance the existing project capacity by increasing the efficiency of the existing system, and opening of new Jallaram section. Sufficient funds have been provided for environmental protection in feasibility report.
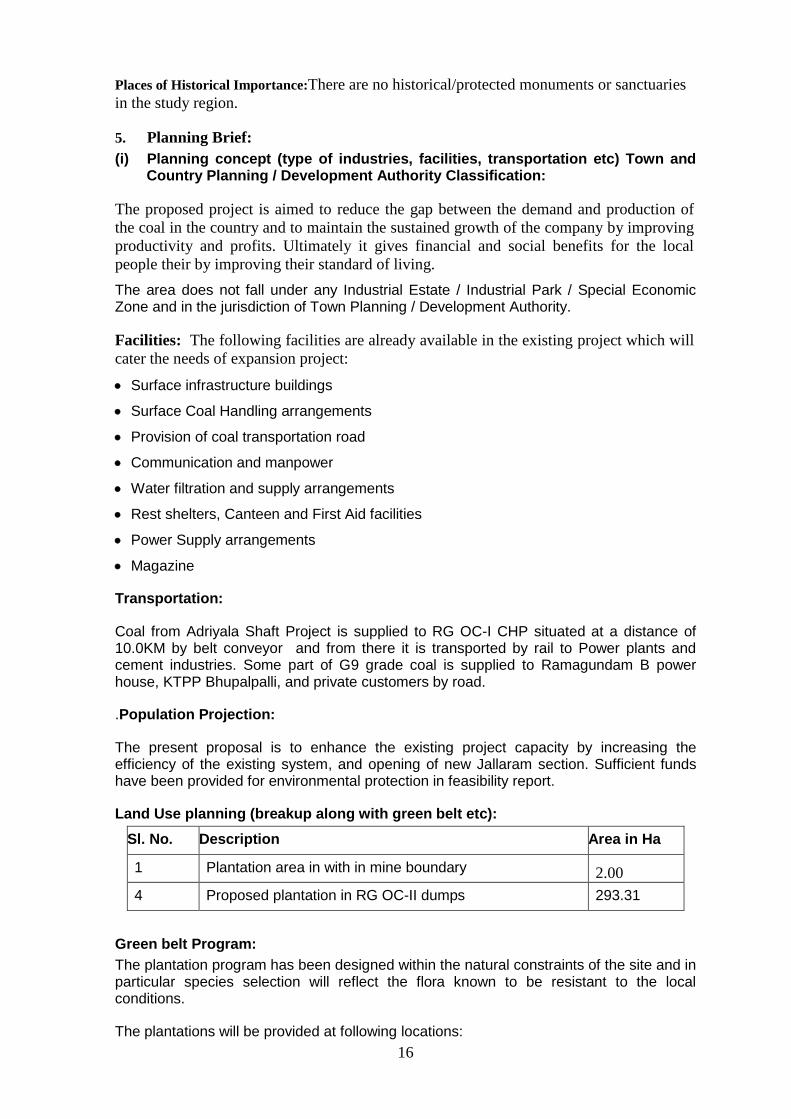
Land Use planning (breakup along with green belt etc):
Sl. No. Description Area in Ha
1 Plantation area in with in mine boundary 2.00
4 Proposed plantation in RG OC-II dumps 293.31
Green belt Program:
The plantation program has been designed within the natural constraints of the site and in particular species selection will reflect the flora known to be resistant to the local conditions.
The plantations will be provided at following locations:
17
Around fan house
Along the road sides both in the project, mine complex and in the vacant lands of the residential area
Within the mine premises.
Stabilized subsidence area
Within the residential colony
(ii) Assessment of Infrastructure Demand (Physical & Social):
Physical Infrastructure:
As this is a operating mine physical infrastructure including buildings for the purpose of offices, workshops, filter beds & substations etc were constructed and welfare amenities like rest shelters, canteen conference hall, pit head bath rooms and toilets are also provided .
(iii) Amenities / Facilities:
The amenities / facilities will be provided to the persons connected to mining operation whether direct or indirect in the mine premises are as below:
Rest shelters for taking rest, canteen facilities at subsidized rates, washing / bathing facilities, first aid room, provision of motor cycle / cycle sheds, provision of drinking water points etc shall be provided. Construction of the above infrastructural facilities is completed.
6. Proposed Infrastructure:
(i) Industrial area (Processing Area):
The following infrastructural facilities are already available in the present working mine and area. No additional infrastructure is proposed for this project.
Surface infrastructure:
Surface Coal Handling Arrangement:
Well established coal handling plant is available in the area for distribution of coal to consumers.
Service Buildings:
The service buildings cover sheds required as per the technology selection, statutory buildings and other office buildings. The technological buildings cover lamp room, pithead workshop, stores, substitute office etc. The plinth area provided for all the above buildings have been based on standard guidelines. Further, sufficient funds are provided in capital for water supply arrangement, sewerage, street lighting and horticultural operations.
Unit Work Shop:
Well established area workshop facilities exist in the area to cater the workshop needs. In
addition to the above electrical workshop, machine shop, equipment repair rooms are
provided.
The following scope of work has been envisaged
Day to day minor repair and routine maintenance of SDLs and other Equipment.
Minor repairs, maintenance and testing of hydraulic equipment.
Minor repairs of cables.
Day to day maintenance and minor repair of pumps and light motor vehicles
18
Minor repairs of electrical motors, transformers and switch gears
Washing and lubrication of equipment
Rebuilding of small worn-out parts.
(ii) Residential area (Non Processing Area):
Township:
Housing facilities for the workmen working in the mine is provided in townships situated at a distance of around 4 Kms from the project.
Area Administration:
The mining activities are being carried out in Ramagundam III Area since 1970. The Present Adriyala Shaft Project comes under the administrative control Adriyala Project Area. Hence, there is no need of further construction of area level administrative buildings.
(iii) Green Belt:
It is proposed to carry out plantation as a part of Green belt development at areas along the roads, around the CHP, MMV house, mine colony interface to dampen the noise, all over surface in the mine take area, along ML boundary and also in township outside lease area.
(iv) Social Infrastructure:
Social Infrastructure available in the Ramagundam III Area is sufficient to cater the needs of the employees working in the mine. Further there is 150 bedded Area Hospital to cater the hospitalization needs of workmen. Company has extended the hospitalization facility free of cost for the white card holders and also at nominal cost for the population residing in and around the project area. Community Hall and School is available for the company employees as well as the local population constructed and operated by the company at nominal rates.
(v) Connectivity (Traffic and Transportation Road / Rail / Metro / Water ways etc.):
Roads: Adriyala Shaft Project belonging to Adriyala Project Area (APA) are located in
Manthani Mandal of Karimnagar district of Andhra Pradesh. APA area is well connected
road. APA area is well connected to the state capital, Hyderabad both by rail and road and
is 225km by road.
Railways: The nearest Railway Station is Peddapallil on the Kasipet-Balharsha line of
south central railway is about 20km.
(vi) Drinking Water Management (Source and Supply of Water):
The water required for drinking within the project (including lean season) will be met
from the pumped out water from underground workings of the proposed project after
necessary treatment. The excess water from the proposed mine can be supplied to nearby
villages / colonies.
The water produced in the mine during mining activity due to natural seepage will be collected at identified sumps and will be pumped out to surface by means of suitable capacity of pumps. The mine discharge water may contain coal fines and contamination due to underground mechanization, need sedimentation and filtration before using for drinking at the mine and supplying to colonies for domestic purposes like drinking, washing, bathing etc.
19
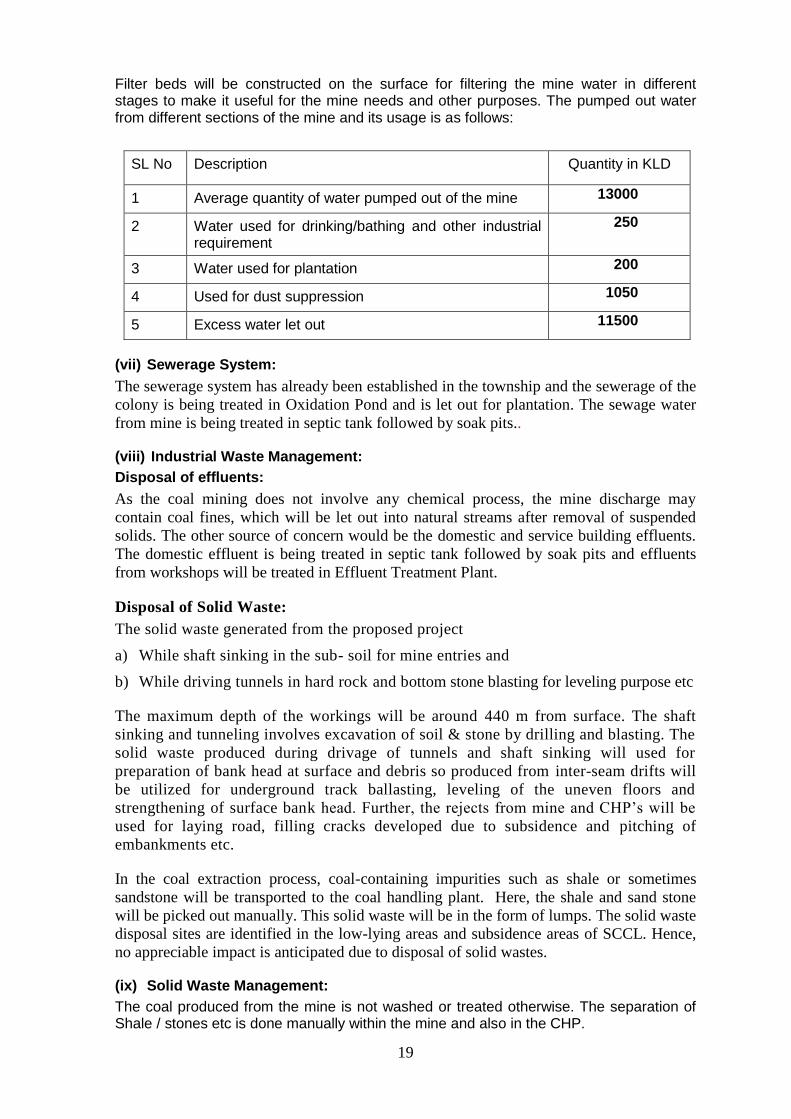
Filter beds will be constructed on the surface for filtering the mine water in different stages to make it useful for the mine needs and other purposes. The pumped out water from different sections of the mine and its usage is as follows:
SL No Description Quantity in KLD
1 Average quantity of water pumped out of the mine 13000
2 Water used for drinking/bathing and other industrial requirement
250
3 Water used for plantation 200
4 Used for dust suppression 1050
5 Excess water let out 11500
(vii) Sewerage System:
The sewerage system has already been established in the township and the sewerage of the
colony is being treated in Oxidation Pond and is let out for plantation. The sewage water
from mine is being treated in septic tank followed by soak pits..
(viii) Industrial Waste Management:
Disposal of effluents:
As the coal mining does not involve any chemical process, the mine discharge may
contain coal fines, which will be let out into natural streams after removal of suspended
solids. The other source of concern would be the domestic and service building effluents.
The domestic effluent is being treated in septic tank followed by soak pits and effluents
from workshops will be treated in Effluent Treatment Plant.
Disposal of Solid Waste:
The solid waste generated from the proposed project
a) While shaft sinking in the sub- soil for mine entries and
b) While driving tunnels in hard rock and bottom stone blasting for leveling purpose etc
The maximum depth of the workings will be around 440 m from surface. The shaft
sinking and tunneling involves excavation of soil & stone by drilling and blasting. The
solid waste produced during drivage of tunnels and shaft sinking will used for
preparation of bank head at surface and debris so produced from inter-seam drifts will
be utilized for underground track ballasting, leveling of the uneven floors and
strengthening of surface bank head. Further, the rejects from mine and CHP’s will be
used for laying road, filling cracks developed due to subsidence and pitching of
embankments etc.
In the coal extraction process, coal-containing impurities such as shale or sometimes
sandstone will be transported to the coal handling plant. Here, the shale and sand stone
will be picked out manually. This solid waste will be in the form of lumps. The solid waste
disposal sites are identified in the low-lying areas and subsidence areas of SCCL. Hence,
no appreciable impact is anticipated due to disposal of solid wastes.
(ix) Solid Waste Management:
The coal produced from the mine is not washed or treated otherwise. The separation of Shale / stones etc is done manually within the mine and also in the CHP.
20
The debris so produced is being utilized for underground track ballasting, leveling of the
uneven floors and strengthening of surface bank head.
The solid waste from the townships will be collected from the collection bins and tricycles
provided by SCCL. The domestic solid waste collected will be transported to the disposal
sites of SCCL. The solid waste disposal sites are identified in the low-lying areas and
subsidence areas of SCCL. Hence, no appreciable impact is anticipated due to disposal of
solid wastes.
(x) Power Requirement & Supply / Source:
Adriyala Shaft Project is receiving power from Centenary colony, RG III 132/33 KV SCCL Sub-Station.
Source of power supply : SCCL 132/33 KV Sub station
Receiving voltage : 33 KV OHT Line (Double circuit)
Metering equipment : At 33/3.3 KV Substation
Adriyala Shaft Project has one independent substation at surface which is fed from 132/33 KV SCCL substation located at centenary colony by feeder No-9,12 at 33 KV. At this substation power is stepped down to 3.3 KV and supplied to underground machinery. In Adriyala section power is supplied to Trunk conveyors at 11KV, for remaining machinery at 3.3 KV.
7. Rehabilitation and Resettlement (R & R) Plan:
Rachapalli village is present over the mine take area. However this R&R will be taken up under RG OC-II project as the OB dumps are proposed in this area. 750 PDFs are involved and Rs136.25 Crores of R&R funds are envisaged.
8. Project Schedule & Cost Estimates:
(i) Likely date of start of construction and likely date of completion (With time schedule)
Introduction:
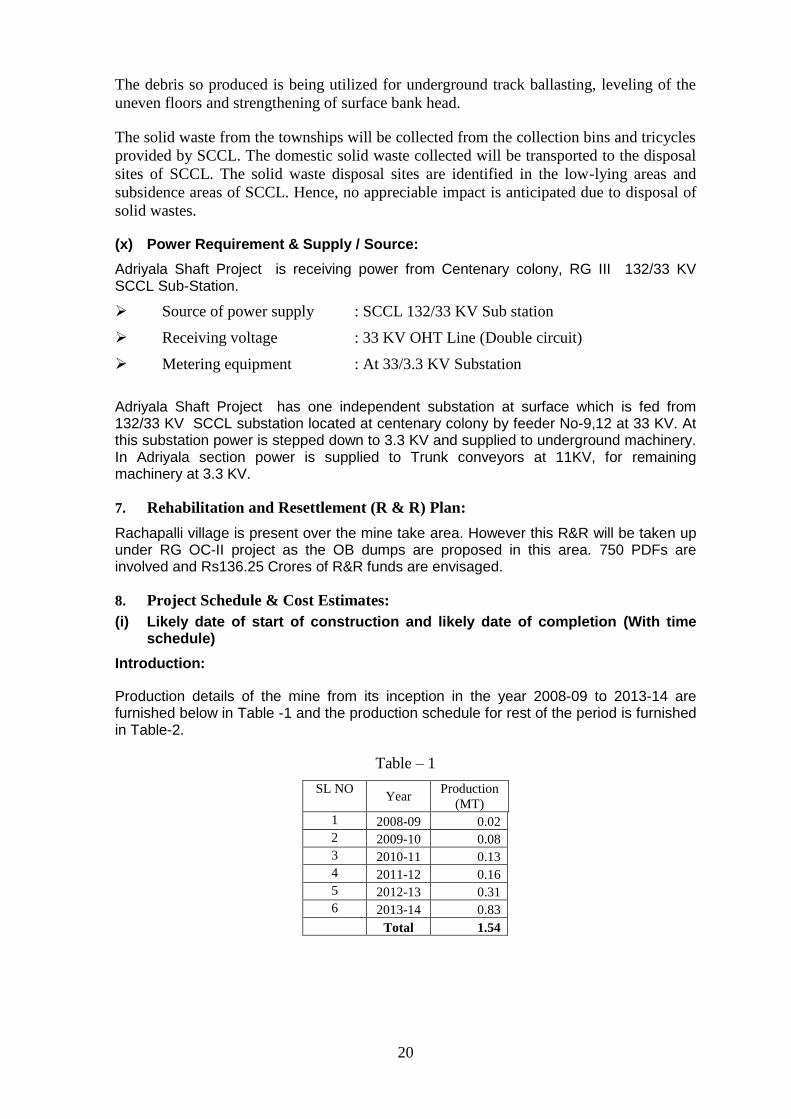
Production details of the mine from its inception in the year 2008-09 to 2013-14 are furnished below in Table -1 and the production schedule for rest of the period is furnished in Table-2.
Table – 1
SL NO Year
Production
(MT)
1 2008-09 0.02
2 2009-10 0.08
3 2010-11 0.13
4 2011-12 0.16
5 2012-13 0.31
6 2013-14 0.83
Total 1.54
21
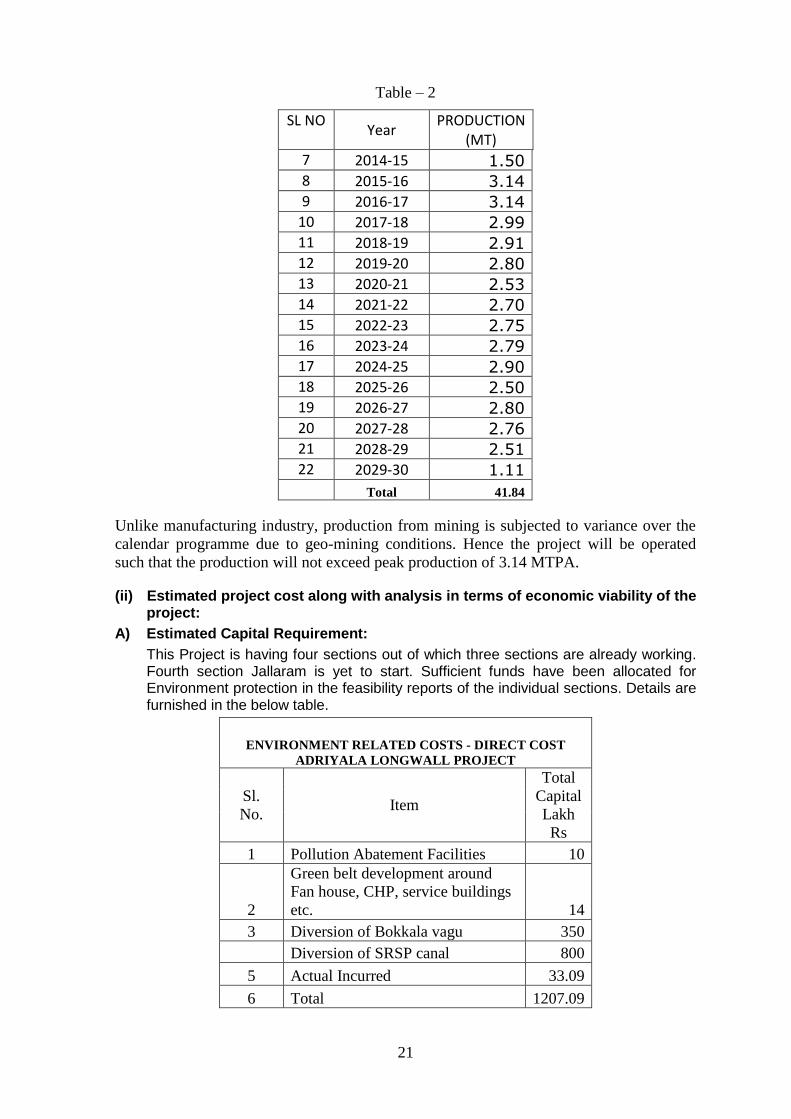
Table – 2
SL NO Year
PRODUCTION (MT)
7 2014-15 1.50 8 2015-16 3.14 9 2016-17 3.14
10 2017-18 2.99 11 2018-19 2.91 12 2019-20 2.80 13 2020-21 2.53 14 2021-22 2.70 15 2022-23 2.75 16 2023-24 2.79 17 2024-25 2.90 18 2025-26 2.50 19 2026-27 2.80 20 2027-28 2.76 21 2028-29 2.51 22 2029-30 1.11
Total 41.84
Unlike manufacturing industry, production from mining is subjected to variance over the
calendar programme due to geo-mining conditions. Hence the project will be operated
such that the production will not exceed peak production of 3.14 MTPA.
(ii) Estimated project cost along with analysis in terms of economic viability of the project:
A) Estimated Capital Requirement:
This Project is having four sections out of which three sections are already working. Fourth section Jallaram is yet to start. Sufficient funds have been allocated for Environment protection in the feasibility reports of the individual sections. Details are furnished in the below table.
ENVIRONMENT RELATED COSTS - DIRECT COST
ADRIYALA LONGWALL PROJECT
Sl.
No. Item
Total
Capital
Lakh
Rs
1 Pollution Abatement Facilities 10
2
Green belt development around
Fan house, CHP, service buildings
etc. 14
3 Diversion of Bokkala vagu 350
Diversion of SRSP canal 800
5 Actual Incurred 33.09
6 Total 1207.09
22
In addition to the above, a provision of Rs 8.39 per tonne of coal is made in revenue cost towards environmental protection measures.
B) Financial Viability Analysis:
(i) General:
Adriyala Shaft Project will earn a profit of Rs 675 at 85% performance of its rated
capacity.
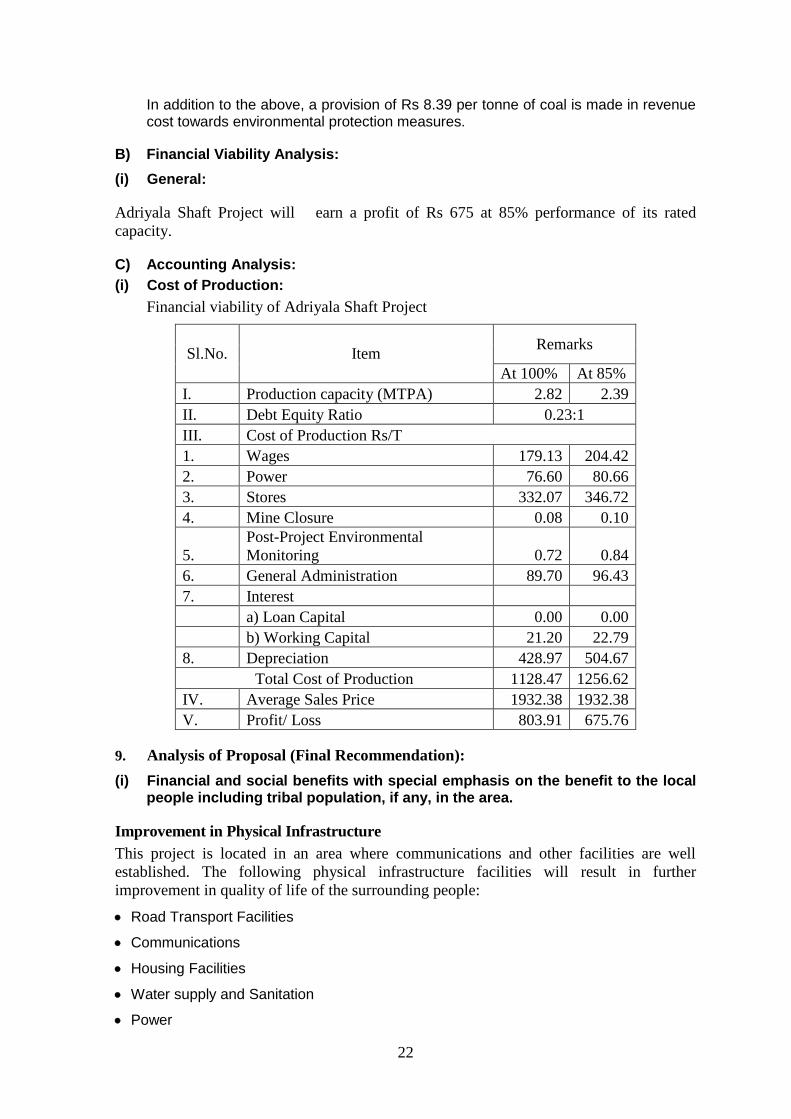
C) Accounting Analysis:
(i) Cost of Production:
Financial viability of Adriyala Shaft Project
Sl.No. Item Remarks
At 100% At 85%
I. Production capacity (MTPA) 2.82 2.39
II. Debt Equity Ratio 0.23:1
III. Cost of Production Rs/T
1. Wages 179.13 204.42
2. Power 76.60 80.66
3. Stores 332.07 346.72
4. Mine Closure 0.08 0.10
5.
Post-Project Environmental
Monitoring 0.72 0.84
6. General Administration 89.70 96.43
7. Interest
a) Loan Capital 0.00 0.00
b) Working Capital 21.20 22.79
8. Depreciation 428.97 504.67
Total Cost of Production 1128.47 1256.62
IV. Average Sales Price 1932.38 1932.38
V. Profit/ Loss 803.91 675.76
9. Analysis of Proposal (Final Recommendation):
(i) Financial and social benefits with special emphasis on the benefit to the local people including tribal population, if any, in the area.
Improvement in Physical Infrastructure
This project is located in an area where communications and other facilities are well
established. The following physical infrastructure facilities will result in further
improvement in quality of life of the surrounding people:
Road Transport Facilities
Communications
Housing Facilities
Water supply and Sanitation
Power
23
Medical, Educational and social benefits will be made available to the nearby civilian population in addition to the workmen employed in the project.
Improvement in Social Infrastructure
Coal mining and agriculture is the basic sector of employment for the local people in this area. This project will lead to direct and indirect employment opportunity. Employment is expected during civil construction period, in trade, garbage lifting, sanitation and other ancillary services, Employment in these sectors will be primarily temporary or contractual and involvement of unskilled labor will be more. A major part of this labor force will be mainly from local villagers who are expected to engage themselves both in agriculture and project activities. This will enhance their income and lead to overall economic growth of the area.
The following changes in socio-economic status are expected to take place with this project.
The project will have a strong positive employment and income effect, both direct as well as indirect. Migrant - non-migrant ratio will shift towards migrant side because a number of people will migrate towards the central region of study circle in the years to come. This will happen because of better indirect employment opportunities due to this project.
The project is going to have positive impact on consumption behavior by way of raising average consumption and income through multiplier effect.
The project is going to bring about changes in the pattern of demand from food to non-food items and sufficient income is generated.
The project will help in the development of social infrastructures / such as.
- Education facilities
- Banking facilities
- Post offices and Communication facilities
- Medical facilities
- Recreation facilities
- Business establishments & Community facilities
- Plantation and parks
Other Tangible Benefits
The proposed expansion is likely to have other tangible benefits as given below.
- Indirect employment opportunities to local people in contractual works like housing
construction, transportation, sanitation, for supply of goods and services to the
project and other community services.
- Establishment of coal based / dependent industries in the area
- Market and business establishment facilities will also increase.
- Cultural, recreation and aesthetic facilities will also improve.
- Improvement in communication, transport, education, community development and
medical facilities.
- Overall change in employment and income opportunity.
24
- The State Government will also be benefitted directly from the proposed project,
through increased revenue from royalties, excise duty and etc.
- The project specific CSR activities will enhance the Infrastructure facilities thereby
creating indirect employment for the people of the surrounding villages.
Risk Factors Analysed
The following risk factors are analyzed.
- Operating in low height seams
Justification:
- To reduce the gap between the demand and production of the coal in the country and
to maintain the sustained growth of the company by improving productivity and
profits. Ultimately it gives financial and social benefits for the local people there by
improving their standard of living.
- Optimization of the existing mine improves the overall financial performance of the
mine and the increase in production will pave way for further increase in
ancillary/support/dependant industries in the surrounding villages.
* * * * *
25
ADDENDUM TO ENVIRONMENTAL IMPACT ASSESSMENT / ENVIRONMENT MANAGEMENT PLAN
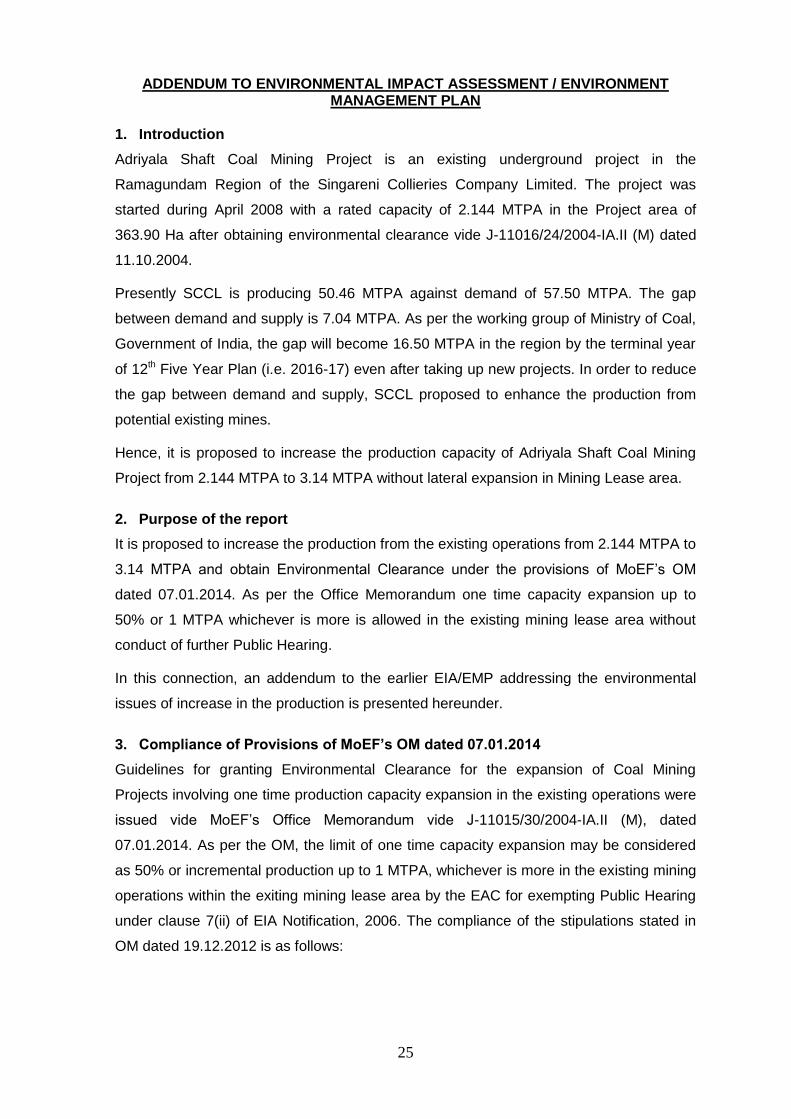
1. Introduction
Adriyala Shaft Coal Mining Project is an existing underground project in the
Ramagundam Region of the Singareni Collieries Company Limited. The project was
started during April 2008 with a rated capacity of 2.144 MTPA in the Project area of
363.90 Ha after obtaining environmental clearance vide J-11016/24/2004-IA.II (M) dated
11.10.2004.
Presently SCCL is producing 50.46 MTPA against demand of 57.50 MTPA. The gap
between demand and supply is 7.04 MTPA. As per the working group of Ministry of Coal,
Government of India, the gap will become 16.50 MTPA in the region by the terminal year
of 12th Five Year Plan (i.e. 2016-17) even after taking up new projects. In order to reduce
the gap between demand and supply, SCCL proposed to enhance the production from
potential existing mines.
Hence, it is proposed to increase the production capacity of Adriyala Shaft Coal Mining
Project from 2.144 MTPA to 3.14 MTPA without lateral expansion in Mining Lease area.
2. Purpose of the report
It is proposed to increase the production from the existing operations from 2.144 MTPA to
3.14 MTPA and obtain Environmental Clearance under the provisions of MoEF’s OM
dated 07.01.2014. As per the Office Memorandum one time capacity expansion up to
50% or 1 MTPA whichever is more is allowed in the existing mining lease area without
conduct of further Public Hearing.
In this connection, an addendum to the earlier EIA/EMP addressing the environmental
issues of increase in the production is presented hereunder.
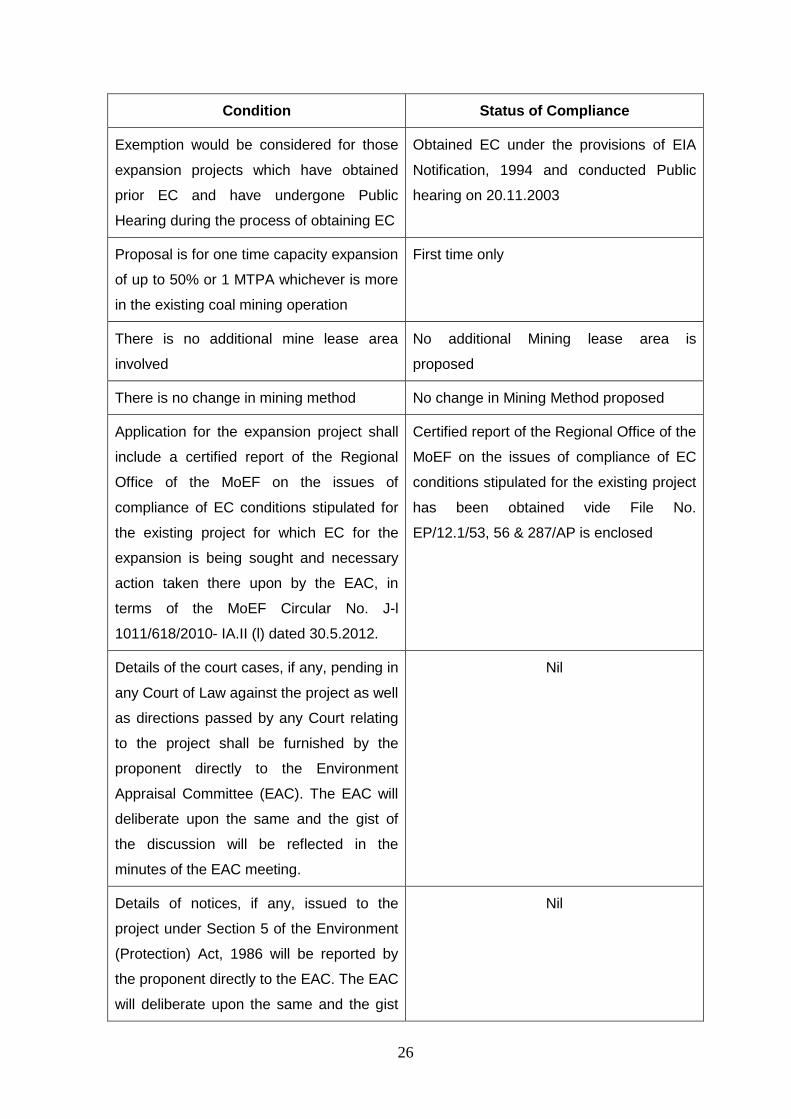
3. Compliance of Provisions of MoEF’s OM dated 07.01.2014
Guidelines for granting Environmental Clearance for the expansion of Coal Mining
Projects involving one time production capacity expansion in the existing operations were
issued vide MoEF’s Office Memorandum vide J-11015/30/2004-IA.II (M), dated
07.01.2014. As per the OM, the limit of one time capacity expansion may be considered
as 50% or incremental production up to 1 MTPA, whichever is more in the existing mining
operations within the exiting mining lease area by the EAC for exempting Public Hearing
under clause 7(ii) of EIA Notification, 2006. The compliance of the stipulations stated in
OM dated 19.12.2012 is as follows:
26
Condition Status of Compliance
Exemption would be considered for those
expansion projects which have obtained
prior EC and have undergone Public
Hearing during the process of obtaining EC
Obtained EC under the provisions of EIA
Notification, 1994 and conducted Public
hearing on 20.11.2003
Proposal is for one time capacity expansion
of up to 50% or 1 MTPA whichever is more
in the existing coal mining operation
First time only
There is no additional mine lease area
involved
No additional Mining lease area is
proposed
There is no change in mining method No change in Mining Method proposed
Application for the expansion project shall
include a certified report of the Regional
Office of the MoEF on the issues of
compliance of EC conditions stipulated for
the existing project for which EC for the
expansion is being sought and necessary
action taken there upon by the EAC, in
terms of the MoEF Circular No. J-l
1011/618/2010- IA.II (l) dated 30.5.2012.
Certified report of the Regional Office of the
MoEF on the issues of compliance of EC
conditions stipulated for the existing project
has been obtained vide File No.
EP/12.1/53, 56 & 287/AP is enclosed
Details of the court cases, if any, pending in
any Court of Law against the project as well
as directions passed by any Court relating
to the project shall be furnished by the
proponent directly to the Environment
Appraisal Committee (EAC). The EAC will
deliberate upon the same and the gist of
the discussion will be reflected in the
minutes of the EAC meeting.
Nil
Details of notices, if any, issued to the
project under Section 5 of the Environment
(Protection) Act, 1986 will be reported by
the proponent directly to the EAC. The EAC
will deliberate upon the same and the gist
Nil
27
of the discussion will be reflected in the
minutes of the EAC meeting.
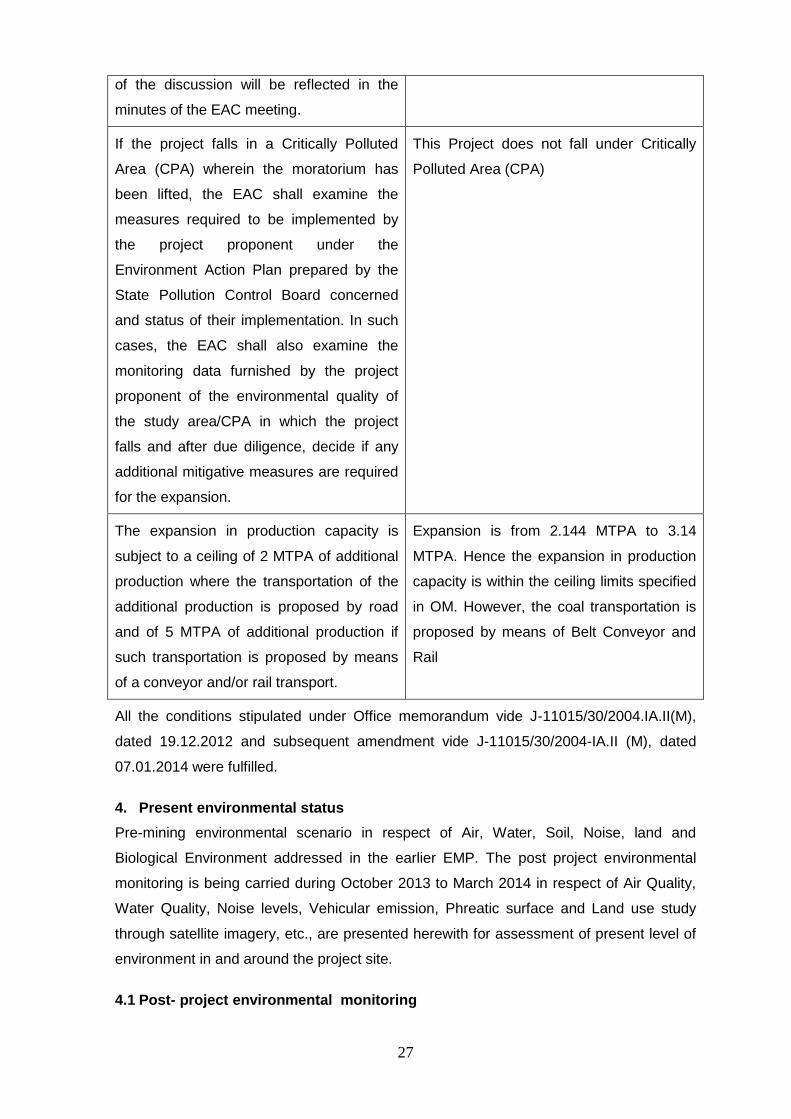
If the project falls in a Critically Polluted
Area (CPA) wherein the moratorium has
been lifted, the EAC shall examine the
measures required to be implemented by
the project proponent under the
Environment Action Plan prepared by the
State Pollution Control Board concerned
and status of their implementation. In such
cases, the EAC shall also examine the
monitoring data furnished by the project
proponent of the environmental quality of
the study area/CPA in which the project
falls and after due diligence, decide if any
additional mitigative measures are required
for the expansion.
This Project does not fall under Critically
Polluted Area (CPA)
The expansion in production capacity is
subject to a ceiling of 2 MTPA of additional
production where the transportation of the
additional production is proposed by road
and of 5 MTPA of additional production if
such transportation is proposed by means
of a conveyor and/or rail transport.
Expansion is from 2.144 MTPA to 3.14
MTPA. Hence the expansion in production
capacity is within the ceiling limits specified
in OM. However, the coal transportation is
proposed by means of Belt Conveyor and
Rail
All the conditions stipulated under Office memorandum vide J-11015/30/2004.IA.II(M),
dated 19.12.2012 and subsequent amendment vide J-11015/30/2004-IA.II (M), dated
07.01.2014 were fulfilled.
4. Present environmental status
Pre-mining environmental scenario in respect of Air, Water, Soil, Noise, land and
Biological Environment addressed in the earlier EMP. The post project environmental
monitoring is being carried during October 2013 to March 2014 in respect of Air Quality,
Water Quality, Noise levels, Vehicular emission, Phreatic surface and Land use study
through satellite imagery, etc., are presented herewith for assessment of present level of
environment in and around the project site.
4.1 Post- project environmental monitoring
28
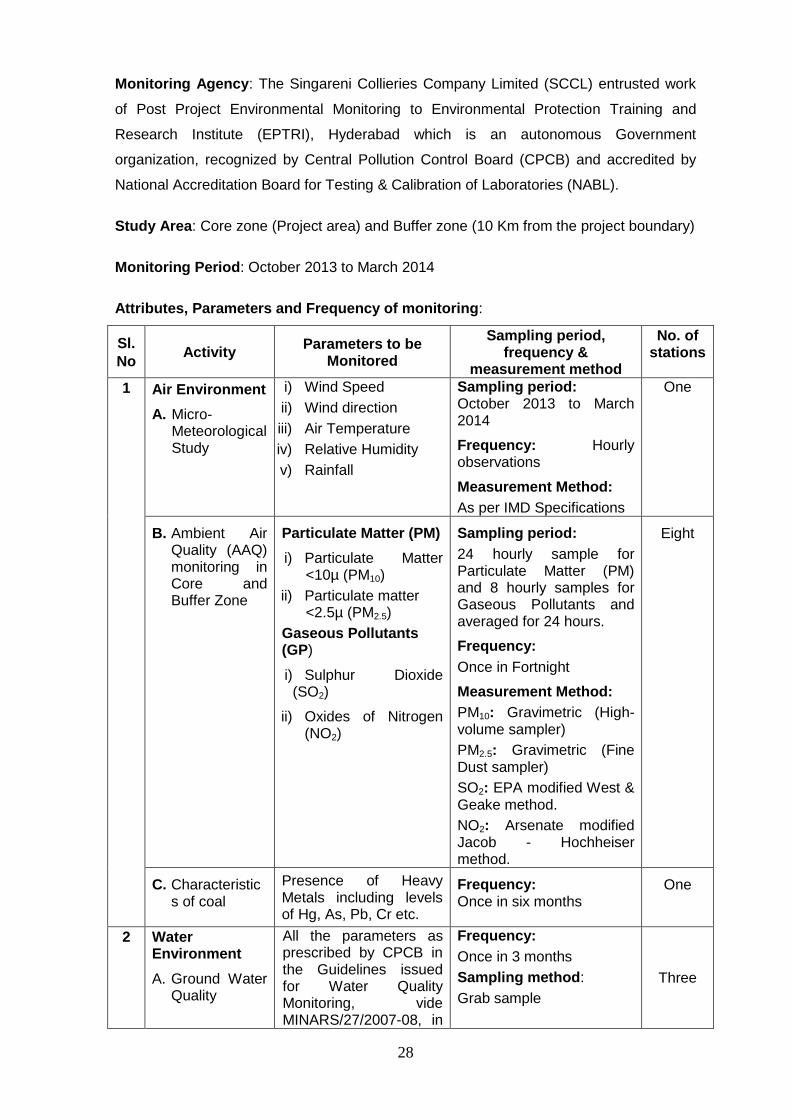
Monitoring Agency: The Singareni Collieries Company Limited (SCCL) entrusted work
of Post Project Environmental Monitoring to Environmental Protection Training and
Research Institute (EPTRI), Hyderabad which is an autonomous Government
organization, recognized by Central Pollution Control Board (CPCB) and accredited by
National Accreditation Board for Testing & Calibration of Laboratories (NABL).
Study Area: Core zone (Project area) and Buffer zone (10 Km from the project boundary)
Monitoring Period: October 2013 to March 2014
Attributes, Parameters and Frequency of monitoring:
Sl.
No Activity
Parameters to be Monitored
Sampling period, frequency &
measurement method
No. of stations
1 Air Environment
A. Micro-Meteorological Study
i) Wind Speed
ii) Wind direction
iii) Air Temperature
iv) Relative Humidity
v) Rainfall
Sampling period: October 2013 to March 2014
Frequency: Hourly observations
Measurement Method:
As per IMD Specifications
One
B. Ambient Air Quality (AAQ) monitoring in Core and Buffer Zone
Particulate Matter (PM)
i) Particulate Matter <10µ (PM10)
ii) Particulate matter <2.5µ (PM2.5)
Gaseous Pollutants (GP)
i) Sulphur Dioxide (SO2)
ii) Oxides of Nitrogen (NO2)
Sampling period:
24 hourly sample for Particulate Matter (PM) and 8 hourly samples for Gaseous Pollutants and averaged for 24 hours.
Frequency:
Once in Fortnight
Measurement Method:
PM10: Gravimetric (High-volume sampler)
PM2.5: Gravimetric (Fine Dust sampler)
SO2: EPA modified West & Geake method.
NO2: Arsenate modified Jacob - Hochheiser method.
Eight
C. Characteristics of coal
Presence of Heavy Metals including levels of Hg, As, Pb, Cr etc.
Frequency: Once in six months
One
2 Water Environment
A. Ground Water Quality
All the parameters as prescribed by CPCB in the Guidelines issued for Water Quality Monitoring, vide
MINARS/27/2007-08, in
Frequency:
Once in 3 months
Sampling method:
Grab sample
Three
29
Sl.
No Activity
Parameters to be Monitored
Sampling period, frequency &
measurement method
No. of stations
respect of Ground Water samples
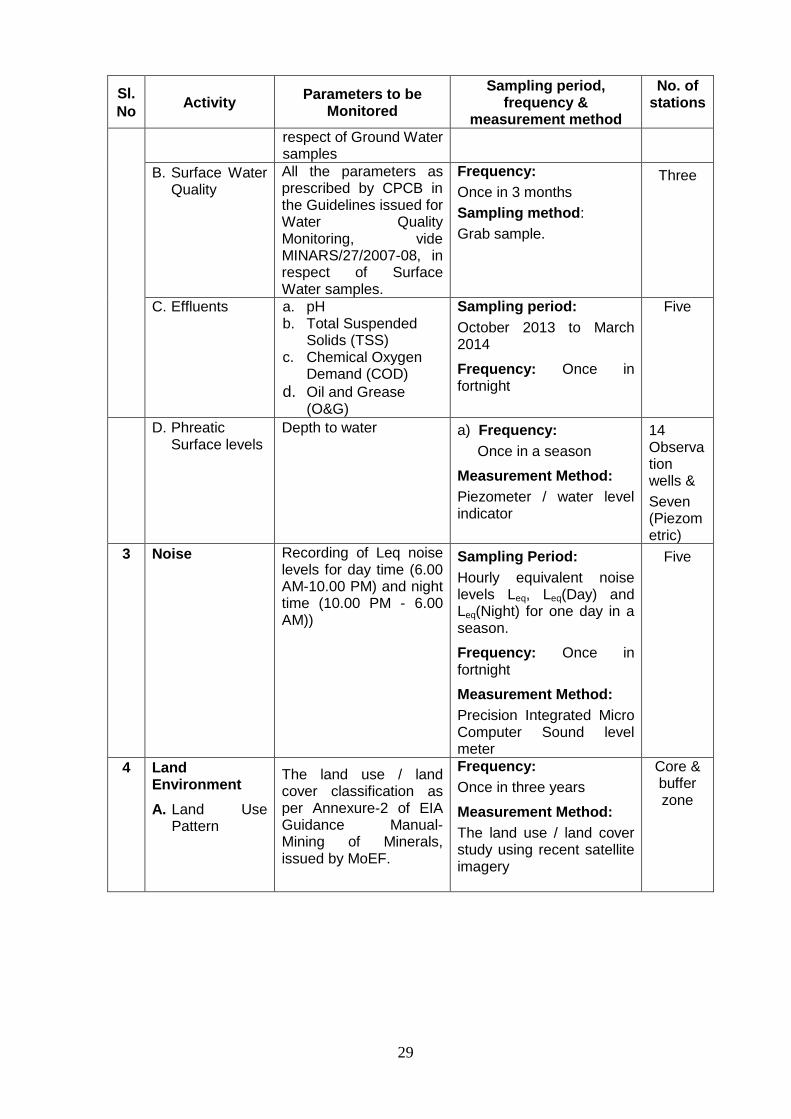
B. Surface Water Quality
All the parameters as prescribed by CPCB in the Guidelines issued for Water Quality Monitoring, vide MINARS/27/2007-08, in respect of Surface Water samples.
Frequency:
Once in 3 months
Sampling method:
Grab sample.
Three
C. Effluents a. pH b. Total Suspended
Solids (TSS) c. Chemical Oxygen
Demand (COD)
d. Oil and Grease (O&G)
Sampling period:
October 2013 to March 2014
Frequency: Once in fortnight
Five
D. Phreatic Surface levels
Depth to water a) Frequency:
Once in a season
Measurement Method:
Piezometer / water level indicator
14 Observation wells &
Seven (Piezometric)
3 Noise Recording of Leq noise levels for day time (6.00 AM-10.00 PM) and night time (10.00 PM - 6.00 AM))
Sampling Period:
Hourly equivalent noise levels Leq, Leq(Day) and Leq(Night) for one day in a season.
Frequency: Once in fortnight
Measurement Method:
Precision Integrated Micro Computer Sound level meter
Five
4 Land Environment
A. Land Use Pattern
The land use / land cover classification as per Annexure-2 of EIA Guidance Manual-Mining of Minerals, issued by MoEF.
Frequency:
Once in three years
Measurement Method:
The land use / land cover study using recent satellite imagery
Core & buffer zone
30
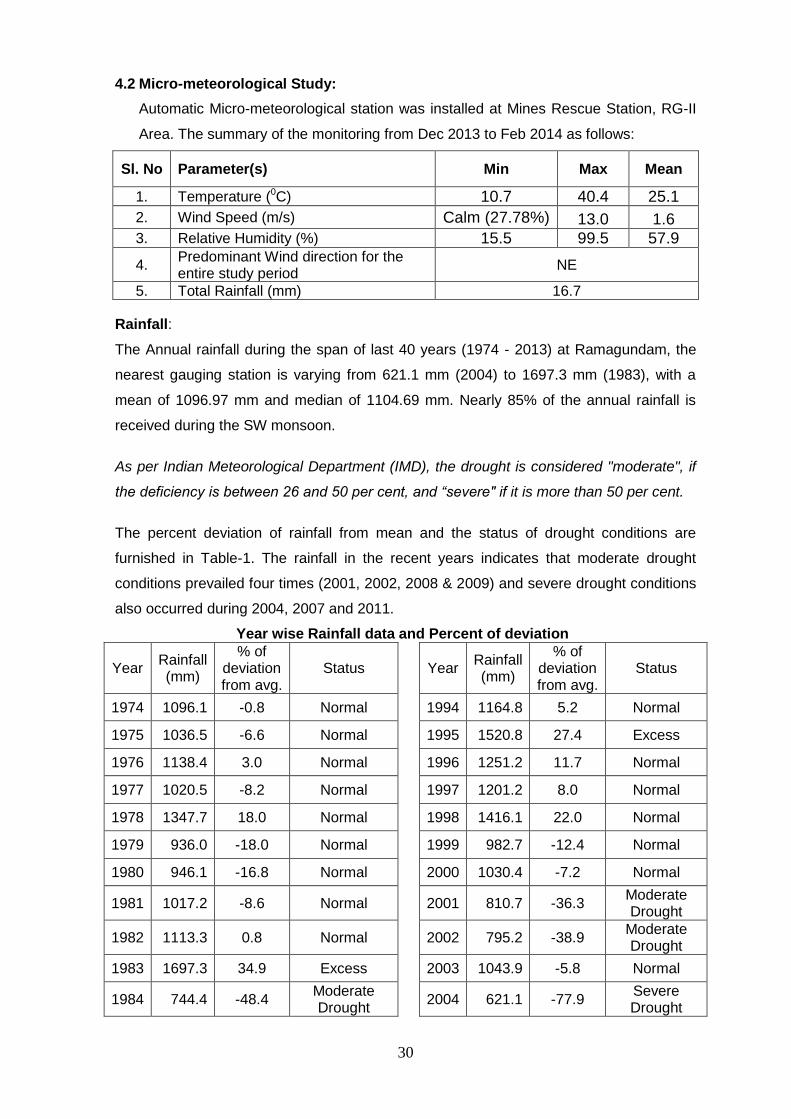
4.2 Micro-meteorological Study:
Automatic Micro-meteorological station was installed at Mines Rescue Station, RG-II
Area. The summary of the monitoring from Dec 2013 to Feb 2014 as follows:
Sl. No Parameter(s) Min Max Mean
1. Temperature (0C) 10.7 40.4 25.1
2. Wind Speed (m/s) Calm (27.78%) 13.0 1.6 3. Relative Humidity (%) 15.5 99.5 57.9
4. Predominant Wind direction for the entire study period
NE
5. Total Rainfall (mm) 16.7
Rainfall:
The Annual rainfall during the span of last 40 years (1974 - 2013) at Ramagundam, the
nearest gauging station is varying from 621.1 mm (2004) to 1697.3 mm (1983), with a
mean of 1096.97 mm and median of 1104.69 mm. Nearly 85% of the annual rainfall is
received during the SW monsoon.
As per Indian Meteorological Department (IMD), the drought is considered "moderate", if
the deficiency is between 26 and 50 per cent, and “severe" if it is more than 50 per cent.
The percent deviation of rainfall from mean and the status of drought conditions are
furnished in Table-1. The rainfall in the recent years indicates that moderate drought
conditions prevailed four times (2001, 2002, 2008 & 2009) and severe drought conditions
also occurred during 2004, 2007 and 2011.
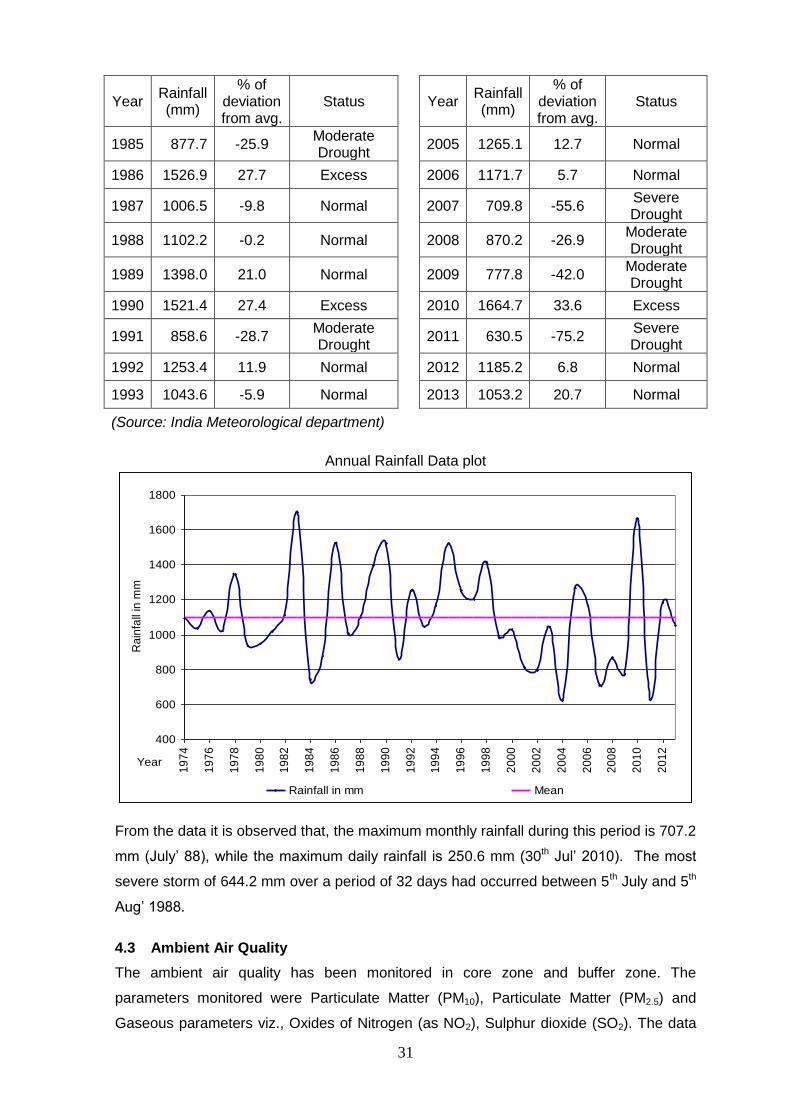
Year wise Rainfall data and Percent of deviation
Year Rainfall (mm)
% of deviation from avg.
Status Year Rainfall (mm)
% of deviation from avg.
Status
1974 1096.1 -0.8 Normal 1994 1164.8 5.2 Normal
1975 1036.5 -6.6 Normal 1995 1520.8 27.4 Excess
1976 1138.4 3.0 Normal 1996 1251.2 11.7 Normal
1977 1020.5 -8.2 Normal 1997 1201.2 8.0 Normal
1978 1347.7 18.0 Normal 1998 1416.1 22.0 Normal
1979 936.0 -18.0 Normal 1999 982.7 -12.4 Normal
1980 946.1 -16.8 Normal 2000 1030.4 -7.2 Normal
1981 1017.2 -8.6 Normal 2001 810.7 -36.3 Moderate Drought
1982 1113.3 0.8 Normal 2002 795.2 -38.9 Moderate Drought
1983 1697.3 34.9 Excess 2003 1043.9 -5.8 Normal
1984 744.4 -48.4 Moderate Drought
2004 621.1 -77.9 Severe Drought
31
Year Rainfall (mm)
% of deviation from avg.
Status Year Rainfall (mm)
% of deviation from avg.
Status
1985 877.7 -25.9 Moderate Drought
2005 1265.1 12.7 Normal
1986 1526.9 27.7 Excess 2006 1171.7 5.7 Normal
1987 1006.5 -9.8 Normal 2007 709.8 -55.6 Severe Drought
1988 1102.2 -0.2 Normal 2008 870.2 -26.9 Moderate Drought
1989 1398.0 21.0 Normal 2009 777.8 -42.0 Moderate Drought
1990 1521.4 27.4 Excess 2010 1664.7 33.6 Excess
1991 858.6 -28.7 Moderate Drought
2011 630.5 -75.2 Severe Drought
1992 1253.4 11.9 Normal 2012 1185.2 6.8 Normal
1993 1043.6 -5.9 Normal 2013 1053.2 20.7 Normal
(Source: India Meteorological department)
Annual Rainfall Data plot
400
600
800
1000
1200
1400
1600
1800
19
74
19
76
19
78
19
80
19
82
19
84
19
86
19
88
19
90
19
92
19
94
19
96
19
98
20
00
20
02
20
04
20
06
20
08
20
10
20
12
Year
Ra
infa
ll in
mm
Rainfall in mm Mean
From the data it is observed that, the maximum monthly rainfall during this period is 707.2
mm (July’ 88), while the maximum daily rainfall is 250.6 mm (30th Jul’ 2010). The most
severe storm of 644.2 mm over a period of 32 days had occurred between 5th July and 5th
Aug’ 1988.
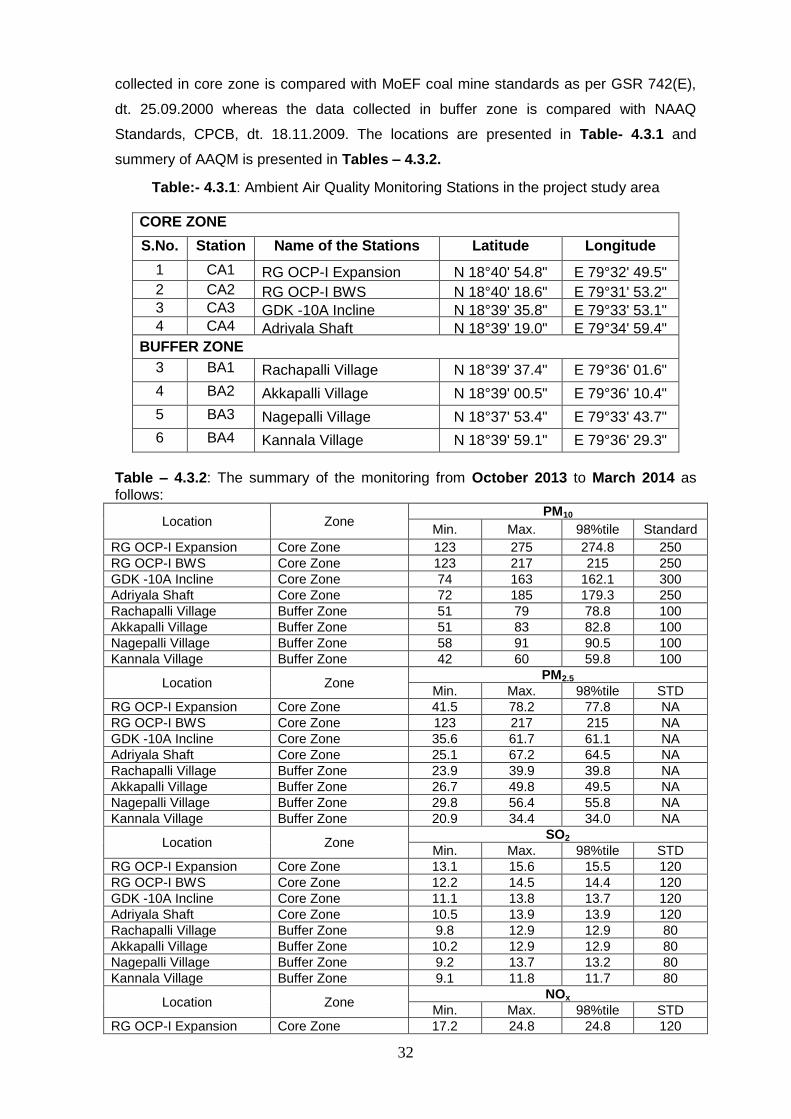
4.3 Ambient Air Quality
The ambient air quality has been monitored in core zone and buffer zone. The
parameters monitored were Particulate Matter (PM10), Particulate Matter (PM2.5) and
Gaseous parameters viz., Oxides of Nitrogen (as NO2), Sulphur dioxide (SO2). The data
32
collected in core zone is compared with MoEF coal mine standards as per GSR 742(E),
dt. 25.09.2000 whereas the data collected in buffer zone is compared with NAAQ
Standards, CPCB, dt. 18.11.2009. The locations are presented in Table- 4.3.1 and
summery of AAQM is presented in Tables – 4.3.2.
Table:- 4.3.1: Ambient Air Quality Monitoring Stations in the project study area
CORE ZONE
KTK-1 & 1A Incline
N18027’59.8”
E079050’24.0”
S.No. Station
Code
Name of the Stations Latitude Longitude
1 CA1 RG OCP-I Expansion N 18°40' 54.8" E 79°32' 49.5"
2 CA2 RG OCP-I BWS N 18°40' 18.6" E 79°31' 53.2" 3 CA3 GDK -10A Incline N 18°39' 35.8" E 79°33' 53.1" 4 CA4 Adriyala Shaft N 18°39' 19.0" E 79°34' 59.4"
BUFFER ZONE
3 BA1 Rachapalli Village N 18°39' 37.4" E 79°36' 01.6"
4 BA2 Akkapalli Village N 18°39' 00.5" E 79°36' 10.4"
5 BA3 Nagepalli Village N 18°37' 53.4" E 79°33' 43.7"
6 BA4 Kannala Village N 18°39' 59.1" E 79°36' 29.3"
Table – 4.3.2: The summary of the monitoring from October 2013 to March 2014 as follows:
Location Zone PM10
Min. Max. 98%tile Standard
RG OCP-I Expansion Core Zone 123 275 274.8 250
RG OCP-I BWS Core Zone 123 217 215 250
GDK -10A Incline Core Zone 74 163 162.1 300
Adriyala Shaft Core Zone 72 185 179.3 250
Rachapalli Village Buffer Zone 51 79 78.8 100
Akkapalli Village Buffer Zone 51 83 82.8 100
Nagepalli Village Buffer Zone 58 91 90.5 100
Kannala Village Buffer Zone 42 60 59.8 100
Location Zone PM2.5
Min. Max. 98%tile STD
RG OCP-I Expansion Core Zone 41.5 78.2 77.8 NA
RG OCP-I BWS Core Zone 123 217 215 NA
GDK -10A Incline Core Zone 35.6 61.7 61.1 NA
Adriyala Shaft Core Zone 25.1 67.2 64.5 NA
Rachapalli Village Buffer Zone 23.9 39.9 39.8 NA
Akkapalli Village Buffer Zone 26.7 49.8 49.5 NA
Nagepalli Village Buffer Zone 29.8 56.4 55.8 NA
Kannala Village Buffer Zone 20.9 34.4 34.0 NA
Location Zone SO2
Min. Max. 98%tile STD
RG OCP-I Expansion Core Zone 13.1 15.6 15.5 120
RG OCP-I BWS Core Zone 12.2 14.5 14.4 120
GDK -10A Incline Core Zone 11.1 13.8 13.7 120
Adriyala Shaft Core Zone 10.5 13.9 13.9 120
Rachapalli Village Buffer Zone 9.8 12.9 12.9 80
Akkapalli Village Buffer Zone 10.2 12.9 12.9 80
Nagepalli Village Buffer Zone 9.2 13.7 13.2 80
Kannala Village Buffer Zone 9.1 11.8 11.7 80
Location Zone NOx
Min. Max. 98%tile STD
RG OCP-I Expansion Core Zone 17.2 24.8 24.8 120
33
RG OCP-I BWS Core Zone 18.8 25.6 25.4 120
GDK -10A Incline Core Zone 15.5 26.9 26.5 120
Adriyala Shaft Core Zone 16.6 23.4 23.2 120
Rachapalli Village Buffer Zone 16.5 22.4 22.3 80
Akkapalli Village Buffer Zone 16.7 23.7 23.6 80
Nagepalli Village Buffer Zone 15.1 24.6 24.0 80
Kannala Village Buffer Zone 15.9 22.7 21.6 80
The monitoring reveals that dust concentrations are within the prescribed limits.
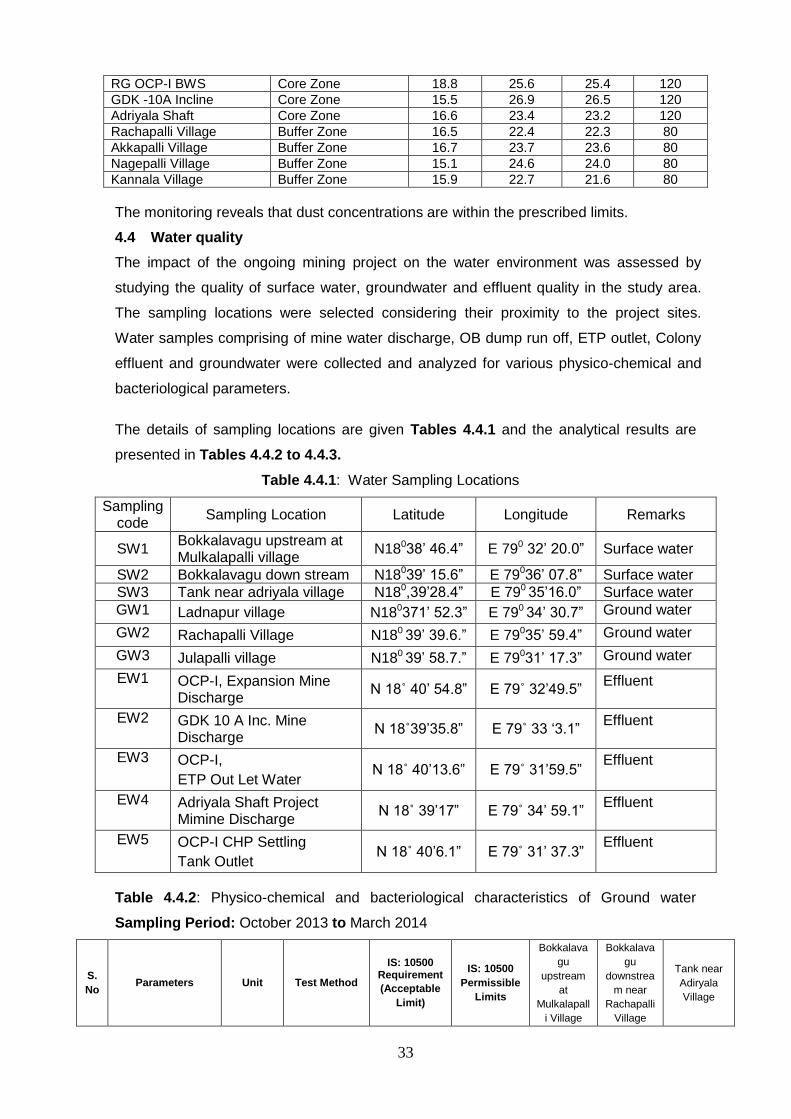
4.4 Water quality
The impact of the ongoing mining project on the water environment was assessed by
studying the quality of surface water, groundwater and effluent quality in the study area.
The sampling locations were selected considering their proximity to the project sites.
Water samples comprising of mine water discharge, OB dump run off, ETP outlet, Colony
effluent and groundwater were collected and analyzed for various physico-chemical and
bacteriological parameters.
The details of sampling locations are given Tables 4.4.1 and the analytical results are
presented in Tables 4.4.2 to 4.4.3.
Table 4.4.1: Water Sampling Locations
Sampling code
Sampling Location Latitude Longitude Remarks
SW1 Bokkalavagu upstream at Mulkalapalli village
N18038’ 46.4” E 790 32’ 20.0” Surface water
SW2 Bokkalavagu down stream N18039’ 15.6” E 79036’ 07.8” Surface water
SW3 Tank near adriyala village N180,39’28.4” E 790 35’16.0” Surface water
GW1 Ladnapur village N180371’ 52.3” E 790 34’ 30.7” Ground water
GW2 Rachapalli Village N180 39’ 39.6.” E 79035’ 59.4” Ground water
GW3 Julapalli village N180 39’ 58.7.” E 79031’ 17.3” Ground water
EW1 OCP-I, Expansion Mine Discharge
N 18˚ 40’ 54.8” E 79˚ 32’49.5” Effluent
EW2 GDK 10 A Inc. Mine Discharge
N 18˚39’35.8” E 79˚ 33 ‘3.1” Effluent
EW3 OCP-I,
ETP Out Let Water N 18˚ 40’13.6” E 79˚ 31’59.5”
Effluent
EW4 Adriyala Shaft Project Mimine Discharge
N 18˚ 39’17” E 79˚ 34’ 59.1” Effluent
EW5 OCP-I CHP Settling
Tank Outlet N 18˚ 40’6.1” E 79˚ 31’ 37.3”
Effluent
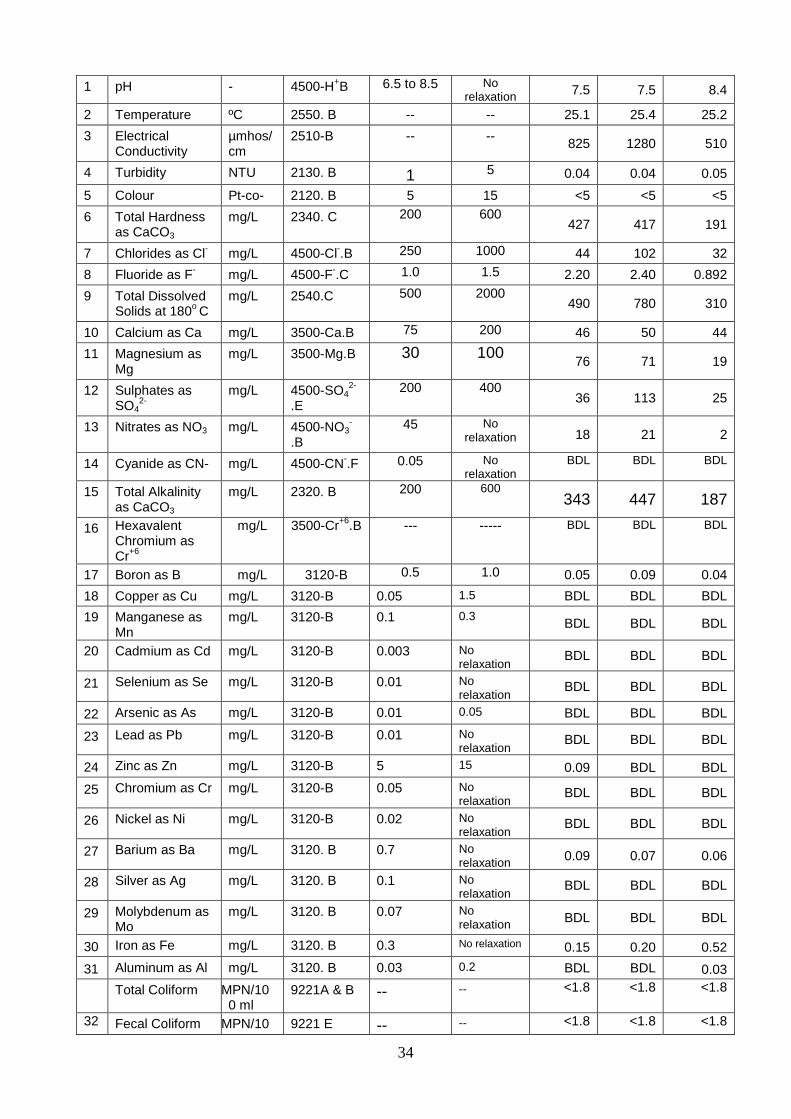
Table 4.4.2: Physico-chemical and bacteriological characteristics of Ground water
Sampling Period: October 2013 to March 2014
S.
No Parameters Unit Test Method
IS: 10500 Requirement
(Acceptable
Limit)
IS: 10500
Permissible
Limits
Bokkalava
gu
upstream
at
Mulkalapall
i Village
Bokkalava
gu
downstrea
m near
Rachapalli
Village
Tank near
Adiryala
Village
34
1 pH - 4500-H+B 6.5 to 8.5 No
relaxation 7.5 7.5 8.4
2 Temperature ºC 2550. B -- -- 25.1 25.4 25.2
3 Electrical Conductivity
µmhos/cm
2510-B -- -- 825 1280 510
4 Turbidity NTU 2130. B 1 5 0.04 0.04 0.05
5 Colour Pt-co- 2120. B 5 15 <5 <5 <5
6 Total Hardness as CaCO3
mg/L 2340. C 200 600 427 417 191
7 Chlorides as Cl-
mg/L 4500-Cl-.B 250 1000 44 102 32
8 Fluoride as F-
mg/L 4500-F-.C 1.0 1.5 2.20 2.40 0.892
9 Total Dissolved Solids at 180
o C
mg/L 2540.C 500 2000 490 780 310
10 Calcium as Ca mg/L 3500-Ca.B 75 200 46 50 44
11 Magnesium as Mg
mg/L 3500-Mg.B 30 100 76 71 19
12 Sulphates as SO4
2- mg/L 4500-SO4
2-
.E
200 400 36 113 25
13 Nitrates as NO3 mg/L 4500-NO3-
.B
45 No relaxation 18 21 2
14 Cyanide as CN- mg/L 4500-CN-.F 0.05 No
relaxation BDL BDL BDL
15 Total Alkalinity as CaCO3
mg/L 2320. B 200 600 343 447 187
16 Hexavalent Chromium as Cr
+6
mg/L 3500-Cr+6
.B --- ----- BDL BDL BDL
17 Boron as B mg/L 3120-B 0.5 1.0 0.05 0.09 0.04
18 Copper as Cu mg/L 3120-B 0.05 1.5 BDL BDL BDL
19 Manganese as Mn
mg/L 3120-B 0.1 0.3 BDL BDL BDL
20 Cadmium as Cd mg/L 3120-B 0.003 No relaxation
BDL BDL BDL
21 Selenium as Se mg/L 3120-B 0.01 No relaxation
BDL BDL BDL
22 Arsenic as As mg/L 3120-B 0.01 0.05 BDL BDL BDL
23 Lead as Pb mg/L 3120-B 0.01 No relaxation
BDL BDL BDL
24 Zinc as Zn mg/L 3120-B 5 15 0.09 BDL BDL
25 Chromium as Cr mg/L 3120-B 0.05 No relaxation
BDL BDL BDL
26 Nickel as Ni mg/L 3120-B 0.02 No relaxation
BDL BDL BDL
27 Barium as Ba mg/L 3120. B 0.7 No relaxation
0.09 0.07 0.06
28 Silver as Ag mg/L 3120. B 0.1 No relaxation
BDL BDL BDL
29 Molybdenum as Mo
mg/L 3120. B 0.07 No relaxation
BDL BDL BDL
30 Iron as Fe mg/L 3120. B 0.3 No relaxation 0.15 0.20 0.52
31 Aluminum as Al mg/L 3120. B 0.03 0.2 BDL BDL 0.03
Total Coliform MPN/100 ml
9221A & B -- -- <1.8 <1.8 <1.8
32 Fecal Coliform MPN/10 9221 E -- -- <1.8 <1.8 <1.8
35
0 ml
33 E. Coli Presence / Absence
9221 F -- -- <1.8 <1.8 <1.8
34 Pesticides: α–BHC, β-BHC,
γ-BHC, δ-BHC, o,p-DDT, p,p’ –DDT, α - Endosulfan, β- Endosulfan, Aldrin, Dieldrin
µg/L 6630. D Absent 0.001 ND ND ND
NTU – Nephelometric Turbidity Unit; TON – Threshold Odour Number; FTN – Flavor Threshold Number;
BDL – Below Detection Limit,
Detection Limit – Phenols – 0.1 mg/L; Mercury – 20 µg/L; Cyanide – 0.05 mg/L ; Hex. Chromium – 0.05 mg/L;
Manganese – 0.01 mg/L; Cadmium – 0.01 mg/L; Selenium – 0.04 mg/L; Arsenic –0.04 mg/L; Lead – 0.04 mg/L;
Aluminum – 0.04 mg/L; Chromium – 0.03 mg/L; Nickel – 0.03 mg/L; Residual free chlorine – 1 mg/L; Nitrites – 0.01
mg/L; Orthophosphates – 0.05 mg/L; ND-Not Detected; Detection
Limit : Pesticides– 0.1 ppm; PAHs – 1 ppm;
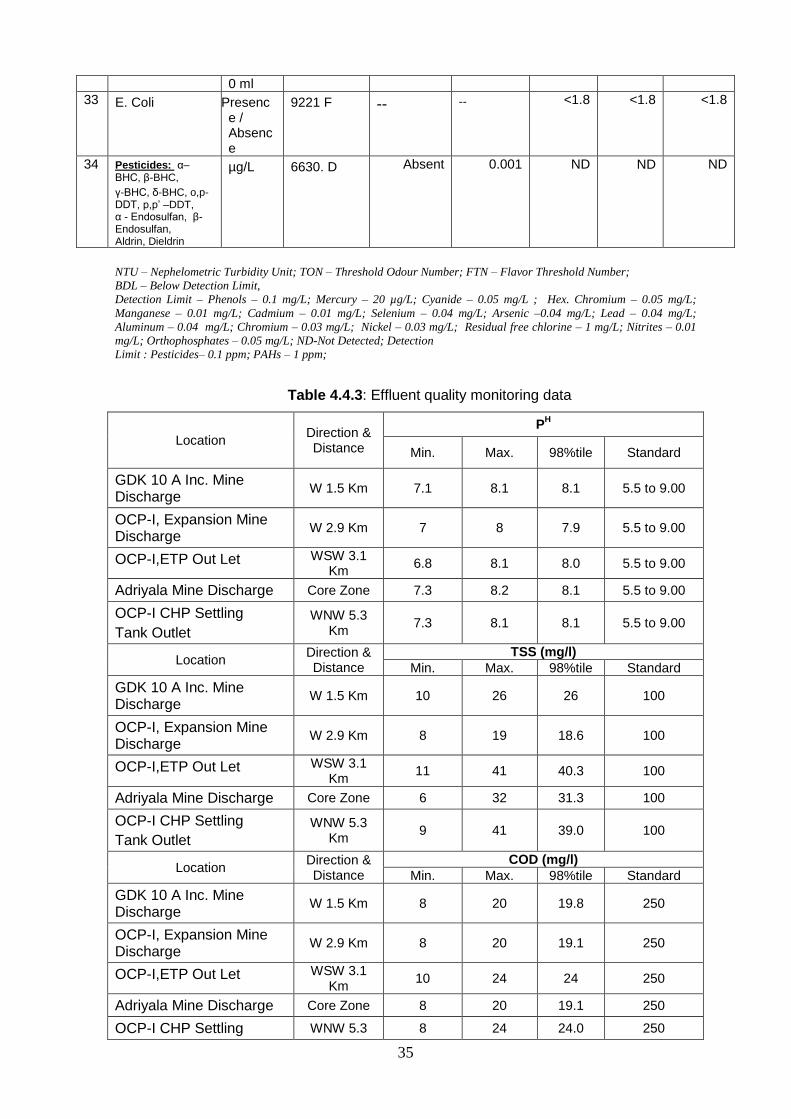
Table 4.4.3: Effluent quality monitoring data
Location Direction & Distance
PH
Min. Max. 98%tile Standard
GDK 10 A Inc. Mine Discharge
W 1.5 Km 7.1 8.1 8.1 5.5 to 9.00
OCP-I, Expansion Mine Discharge
W 2.9 Km 7 8 7.9 5.5 to 9.00
OCP-I,ETP Out Let WSW 3.1 Km
6.8 8.1 8.0 5.5 to 9.00
Adriyala Mine Discharge Core Zone 7.3 8.2 8.1 5.5 to 9.00
OCP-I CHP Settling
Tank Outlet
WNW 5.3 Km
7.3 8.1 8.1 5.5 to 9.00
Location Direction & Distance
TSS (mg/l)
Min. Max. 98%tile Standard
GDK 10 A Inc. Mine Discharge
W 1.5 Km 10 26 26 100
OCP-I, Expansion Mine Discharge
W 2.9 Km 8 19 18.6 100
OCP-I,ETP Out Let WSW 3.1 Km
11 41 40.3 100
Adriyala Mine Discharge Core Zone 6 32 31.3 100
OCP-I CHP Settling
Tank Outlet
WNW 5.3 Km
9 41 39.0 100
Location Direction & Distance
COD (mg/l)
Min. Max. 98%tile Standard
GDK 10 A Inc. Mine Discharge
W 1.5 Km 8 20 19.8 250
OCP-I, Expansion Mine Discharge
W 2.9 Km 8 20 19.1 250
OCP-I,ETP Out Let WSW 3.1 Km
10 24 24 250
Adriyala Mine Discharge Core Zone 8 20 19.1 250
OCP-I CHP Settling WNW 5.3 8 24 24.0 250
36
Tank Outlet Km
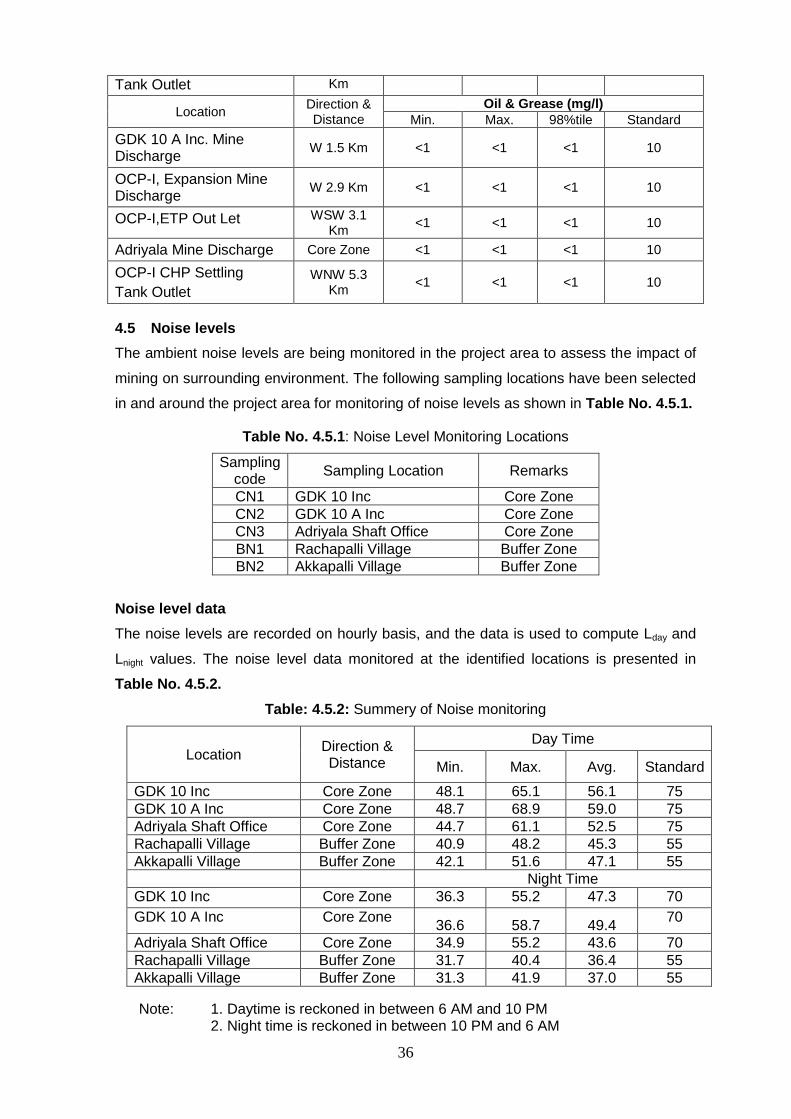
Location Direction & Distance
Oil & Grease (mg/l)
Min. Max. 98%tile Standard
GDK 10 A Inc. Mine Discharge
W 1.5 Km <1 <1 <1 10
OCP-I, Expansion Mine Discharge
W 2.9 Km <1 <1 <1 10
OCP-I,ETP Out Let WSW 3.1 Km
<1 <1 <1 10
Adriyala Mine Discharge Core Zone <1 <1 <1 10
OCP-I CHP Settling
Tank Outlet
WNW 5.3 Km
<1 <1 <1 10
4.5 Noise levels
The ambient noise levels are being monitored in the project area to assess the impact of
mining on surrounding environment. The following sampling locations have been selected
in and around the project area for monitoring of noise levels as shown in Table No. 4.5.1.
Table No. 4.5.1: Noise Level Monitoring Locations
Sampling code
Sampling Location Remarks
CN1 GDK 10 Inc Core Zone
CN2 GDK 10 A Inc Core Zone
CN3 Adriyala Shaft Office Core Zone
BN1 Rachapalli Village Buffer Zone
BN2 Akkapalli Village Buffer Zone
Noise level data
The noise levels are recorded on hourly basis, and the data is used to compute Lday and
Lnight values. The noise level data monitored at the identified locations is presented in
Table No. 4.5.2.
Table: 4.5.2: Summery of Noise monitoring
Location Direction & Distance
Day Time
Min. Max. Avg. Standard
GDK 10 Inc Core Zone 48.1 65.1 56.1 75
GDK 10 A Inc Core Zone 48.7 68.9 59.0 75
Adriyala Shaft Office Core Zone 44.7 61.1 52.5 75
Rachapalli Village Buffer Zone 40.9 48.2 45.3 55
Akkapalli Village Buffer Zone 42.1 51.6 47.1 55
Night Time
GDK 10 Inc Core Zone 36.3 55.2 47.3 70
GDK 10 A Inc Core Zone 36.6 58.7 49.4
70
Adriyala Shaft Office Core Zone 34.9 55.2 43.6 70
Rachapalli Village Buffer Zone 31.7 40.4 36.4 55
Akkapalli Village Buffer Zone 31.3 41.9 37.0 55
Note: 1. Daytime is reckoned in between 6 AM and 10 PM 2. Night time is reckoned in between 10 PM and 6 AM

37
The noise level data indicates that the Leq values monitored during daytime & nighttime
are found to be within limits as stipulated under Noise Pollution (Regulation and Control)
Rules, 2000.
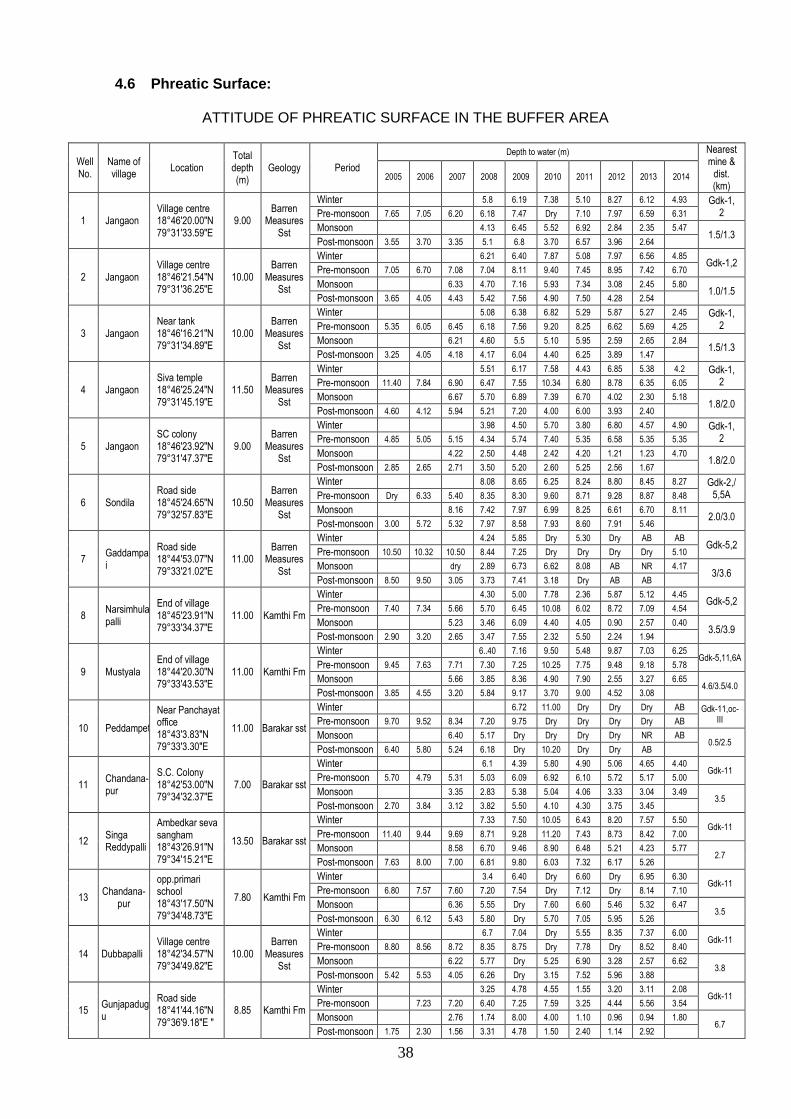
38
4.6 Phreatic Surface:
ATTITUDE OF PHREATIC SURFACE IN THE BUFFER AREA
Well No.
Name of village
Location Total depth (m)
Geology Period
Depth to water (m) Nearest mine &
dist. (km)
2005 2006 2007 2008 2009 2010 2011 2012 2013 2014
1 Jangaon Village centre 18°46'20.00"N 79°31'33.59"E
9.00 Barren
Measures Sst
Winter 5.8 6.19 7.38 5.10 8.27 6.12 4.93 Gdk-1, 2 Pre-monsoon 7.65 7.05 6.20 6.18 7.47 Dry 7.10 7.97 6.59 6.31
Monsoon 4.13 6.45 5.52 6.92 2.84 2.35 5.47 1.5/1.3
Post-monsoon 3.55 3.70 3.35 5.1 6.8 3.70 6.57 3.96 2.64
2 Jangaon Village centre 18°46'21.54"N 79°31'36.25"E
10.00 Barren
Measures Sst
Winter 6.21 6.40 7.87 5.08 7.97 6.56 4.85 Gdk-1,2
Pre-monsoon 7.05 6.70 7.08 7.04 8.11 9.40 7.45 8.95 7.42 6.70
Monsoon 6.33 4.70 7.16 5.93 7.34 3.08 2.45 5.80 1.0/1.5
Post-monsoon 3.65 4.05 4.43 5.42 7.56 4.90 7.50 4.28 2.54
3 Jangaon Near tank 18°46'16.21"N 79°31'34.89"E
10.00 Barren
Measures Sst
Winter 5.08 6.38 6.82 5.29 5.87 5.27 2.45 Gdk-1, 2 Pre-monsoon 5.35 6.05 6.45 6.18 7.56 9.20 8.25 6.62 5.69 4.25
Monsoon 6.21 4.60 5.5 5.10 5.95 2.59 2.65 2.84 1.5/1.3
Post-monsoon 3.25 4.05 4.18 4.17 6.04 4.40 6.25 3.89 1.47
4 Jangaon Siva temple 18°46'25.24"N 79°31'45.19"E
11.50 Barren
Measures Sst
Winter 5.51 6.17 7.58 4.43 6.85 5.38 4.2 Gdk-1, 2 Pre-monsoon 11.40 7.84 6.90 6.47 7.55 10.34 6.80 8.78 6.35 6.05
Monsoon 6.67 5.70 6.89 7.39 6.70 4.02 2.30 5.18 1.8/2.0
Post-monsoon 4.60 4.12 5.94 5.21 7.20 4.00 6.00 3.93 2.40
5 Jangaon SC colony 18°46'23.92"N 79°31'47.37"E
9.00 Barren
Measures Sst
Winter 3.98 4.50 5.70 3.80 6.80 4.57 4.90 Gdk-1, 2 Pre-monsoon 4.85 5.05 5.15 4.34 5.74 7.40 5.35 6.58 5.35 5.35
Monsoon 4.22 2.50 4.48 2.42 4.20 1.21 1.23 4.70 1.8/2.0
Post-monsoon 2.85 2.65 2.71 3.50 5.20 2.60 5.25 2.56 1.67
6 Sondila Road side 18°45'24.65"N 79°32'57.83"E
10.50 Barren
Measures Sst
Winter 8.08 8.65 6.25 8.24 8.80 8.45 8.27 Gdk-2,/ 5,5A Pre-monsoon Dry 6.33 5.40 8.35 8.30 9.60 8.71 9.28 8.87 8.48
Monsoon 8.16 7.42 7.97 6.99 8.25 6.61 6.70 8.11 2.0/3.0
Post-monsoon 3.00 5.72 5.32 7.97 8.58 7.93 8.60 7.91 5.46
7 Gaddampalli
Road side 18°44'53.07"N 79°33'21.02"E
11.00 Barren
Measures Sst
Winter 4.24 5.85 Dry 5.30 Dry AB AB Gdk-5,2
Pre-monsoon 10.50 10.32 10.50 8.44 7.25 Dry Dry Dry Dry 5.10
Monsoon dry 2.89 6.73 6.62 8.08 AB NR 4.17 3/3.6
Post-monsoon 8.50 9.50 3.05 3.73 7.41 3.18 Dry AB AB
8 Narsimhulapalli
End of village 18°45'23.91"N 79°33'34.37"E
11.00 Kamthi Fm
Winter 4.30 5.00 7.78 2.36 5.87 5.12 4.45 Gdk-5,2
Pre-monsoon 7.40 7.34 5.66 5.70 6.45 10.08 6.02 8.72 7.09 4.54
Monsoon 5.23 3.46 6.09 4.40 4.05 0.90 2.57 0.40 3.5/3.9
Post-monsoon 2.90 3.20 2.65 3.47 7.55 2.32 5.50 2.24 1.94
9 Mustyala End of village 18°44'20.30"N 79°33'43.53"E
11.00 Kamthi Fm
Winter 6..40 7.16 9.50 5.48 9.87 7.03 6.25 Gdk-5,11,6A
Pre-monsoon 9.45 7.63 7.71 7.30 7.25 10.25 7.75 9.48 9.18 5.78
Monsoon 5.66 3.85 8.36 4.90 7.90 2.55 3.27 6.65 4.6/3.5/4.0
Post-monsoon 3.85 4.55 3.20 5.84 9.17 3.70 9.00 4.52 3.08
10 Peddampet
Near Panchayat office 18°43'3.83"N 79°33'3.30"E
11.00 Barakar sst
Winter 6.72 11.00 Dry Dry Dry AB Gdk-11,oc-III Pre-monsoon 9.70 9.52 8.34 7.20 9.75 Dry Dry Dry Dry AB
Monsoon 6.40 5.17 Dry Dry Dry Dry NR AB 0.5/2.5
Post-monsoon 6.40 5.80 5.24 6.18 Dry 10.20 Dry Dry AB
11 Chandana-pur
S.C. Colony 18°42'53.00"N 79°34'32.37"E
7.00 Barakar sst
Winter 6.1 4.39 5.80 4.90 5.06 4.65 4.40 Gdk-11
Pre-monsoon 5.70 4.79 5.31 5.03 6.09 6.92 6.10 5.72 5.17 5.00
Monsoon 3.35 2.83 5.38 5.04 4.06 3.33 3.04 3.49 3.5
Post-monsoon 2.70 3.84 3.12 3.82 5.50 4.10 4.30 3.75 3.45
12 Singa Reddypalli
Ambedkar seva sangham 18°43'26.91"N 79°34'15.21"E
13.50 Barakar sst
Winter 7.33 7.50 10.05 6.43 8.20 7.57 5.50 Gdk-11
Pre-monsoon 11.40 9.44 9.69 8.71 9.28 11.20 7.43 8.73 8.42 7.00
Monsoon 8.58 6.70 9.46 8.90 6.48 5.21 4.23 5.77 2.7
Post-monsoon 7.63 8.00 7.00 6.81 9.80 6.03 7.32 6.17 5.26
13 Chandana-
pur
opp.primari school 18°43'17.50"N 79°34'48.73"E
7.80 Kamthi Fm
Winter 3.4 6.40 Dry 6.60 Dry 6.95 6.30 Gdk-11
Pre-monsoon 6.80 7.57 7.60 7.20 7.54 Dry 7.12 Dry 8.14 7.10
Monsoon 6.36 5.55 Dry 7.60 6.60 5.46 5.32 6.47 3.5
Post-monsoon 6.30 6.12 5.43 5.80 Dry 5.70 7.05 5.95 5.26
14 Dubbapalli Village centre 18°42'34.57"N 79°34'49.82"E
10.00 Barren
Measures Sst
Winter 6.7 7.04 Dry 5.55 8.35 7.37 6.00 Gdk-11
Pre-monsoon 8.80 8.56 8.72 8.35 8.75 Dry 7.78 Dry 8.52 8.40
Monsoon 6.22 5.77 Dry 5.25 6.90 3.28 2.57 6.62 3.8
Post-monsoon 5.42 5.53 4.05 6.26 Dry 3.15 7.52 5.96 3.88
15 Gunjapadugu
Road side 18°41'44.16"N 79°36'9.18"E "
8.85 Kamthi Fm
Winter 3.25 4.78 4.55 1.55 3.20 3.11 2.08 Gdk-11
Pre-monsoon 7.23 7.20 6.40 7.25 7.59 3.25 4.44 5.56 3.54
Monsoon 2.76 1.74 8.00 4.00 1.10 0.96 0.94 1.80 6.7
Post-monsoon 1.75 2.30 1.56 3.31 4.78 1.50 2.40 1.14 2.92
Table :3
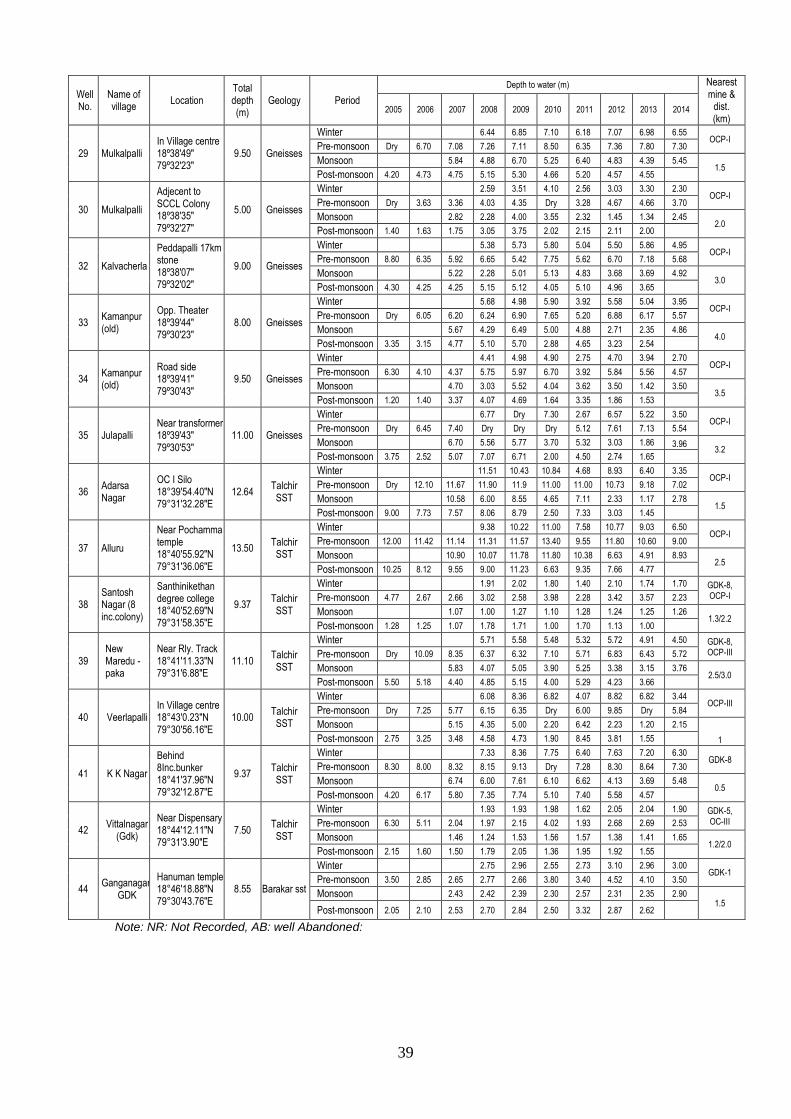
39
Well No.
Name of village
Location Total depth (m)
Geology Period
Depth to water (m) Nearest mine &
dist. (km)
2005 2006 2007 2008 2009 2010 2011 2012 2013 2014
29 Mulkalpalli In Village centre 18º38'49" 79º32'23"
9.50 Gneisses
Winter 6.44 6.85 7.10 6.18 7.07 6.98 6.55 OCP-I
Pre-monsoon Dry 6.70 7.08 7.26 7.11 8.50 6.35 7.36 7.80 7.30
Monsoon 5.84 4.88 6.70 5.25 6.40 4.83 4.39 5.45 1.5
Post-monsoon 4.20 4.73 4.75 5.15 5.30 4.66 5.20 4.57 4.55
30 Mulkalpalli
Adjecent to SCCL Colony 18º38'35" 79º32'27"
5.00 Gneisses
Winter 2.59 3.51 4.10 2.56 3.03 3.30 2.30 OCP-I
Pre-monsoon Dry 3.63 3.36 4.03 4.35 Dry 3.28 4.67 4.66 3.70
Monsoon 2.82 2.28 4.00 3.55 2.32 1.45 1.34 2.45 2.0
Post-monsoon 1.40 1.63 1.75 3.05 3.75 2.02 2.15 2.11 2.00
32 Kalvacherla
Peddapalli 17km stone 18º38'07" 79º32'02"
9.00 Gneisses
Winter 5.38 5.73 5.80 5.04 5.50 5.86 4.95 OCP-I
Pre-monsoon 8.80 6.35 5.92 6.65 5.42 7.75 5.62 6.70 7.18 5.68
Monsoon 5.22 2.28 5.01 5.13 4.83 3.68 3.69 4.92 3.0
Post-monsoon 4.30 4.25 4.25 5.15 5.12 4.05 5.10 4.96 3.65
33 Kamanpur (old)
Opp. Theater 18º39'44" 79º30'23"
8.00 Gneisses
Winter 5.68 4.98 5.90 3.92 5.58 5.04 3.95 OCP-I
Pre-monsoon Dry 6.05 6.20 6.24 6.90 7.65 5.20 6.88 6.17 5.57
Monsoon 5.67 4.29 6.49 5.00 4.88 2.71 2.35 4.86 4.0
Post-monsoon 3.35 3.15 4.77 5.10 5.70 2.88 4.65 3.23 2.54
34 Kamanpur (old)
Road side 18º39'41" 79º30'43"
9.50 Gneisses
Winter 4.41 4.98 4.90 2.75 4.70 3.94 2.70 OCP-I
Pre-monsoon 6.30 4.10 4.37 5.75 5.97 6.70 3.92 5.84 5.56 4.57
Monsoon 4.70 3.03 5.52 4.04 3.62 3.50 1.42 3.50 3.5
Post-monsoon 1.20 1.40 3.37 4.07 4.69 1.64 3.35 1.86 1.53
35 Julapalli Near transformer 18º39'43" 79º30'53"
11.00 Gneisses
Winter 6.77 Dry 7.30 2.67 6.57 5.22 3.50 OCP-I
Pre-monsoon Dry 6.45 7.40 Dry Dry Dry 5.12 7.61 7.13 5.54
Monsoon 6.70 5.56 5.77 3.70 5.32 3.03 1.86 3.96 3.2
Post-monsoon 3.75 2.52 5.07 7.07 6.71 2.00 4.50 2.74 1.65
36 Adarsa Nagar
OC I Silo 18°39'54.40"N 79°31'32.28"E
12.64 Talchir SST
Winter 11.51 10.43 10.84 4.68 8.93 6.40 3.35 OCP-I
Pre-monsoon Dry 12.10 11.67 11.90 11.9 11.00 11.00 10.73 9.18 7.02
Monsoon 10.58 6.00 8.55 4.65 7.11 2.33 1.17 2.78 1.5
Post-monsoon 9.00 7.73 7.57 8.06 8.79 2.50 7.33 3.03 1.45
37 Alluru
Near Pochamma temple 18°40'55.92"N 79°31'36.06"E
13.50 Talchir SST
Winter 9.38 10.22 11.00 7.58 10.77 9.03 6.50 OCP-I
Pre-monsoon 12.00 11.42 11.14 11.31 11.57 13.40 9.55 11.80 10.60 9.00
Monsoon 10.90 10.07 11.78 11.80 10.38 6.63 4.91 8.93 2.5
Post-monsoon 10.25 8.12 9.55 9.00 11.23 6.63 9.35 7.66 4.77
38 Santosh Nagar (8 inc.colony)
Santhinikethan degree college 18°40'52.69"N 79°31'58.35"E
9.37 Talchir SST
Winter 1.91 2.02 1.80 1.40 2.10 1.74 1.70 GDK-8, OCP-I Pre-monsoon 4.77 2.67 2.66 3.02 2.58 3.98 2.28 3.42 3.57 2.23
Monsoon 1.07 1.00 1.27 1.10 1.28 1.24 1.25 1.26 1.3/2.2
Post-monsoon 1.28 1.25 1.07 1.78 1.71 1.00 1.70 1.13 1.00
39 New Maredu -paka
Near Rly. Track 18°41'11.33"N 79°31'6.88"E
11.10 Talchir SST
Winter 5.71 5.58 5.48 5.32 5.72 4.91 4.50 GDK-8, OCP-III Pre-monsoon Dry 10.09 8.35 6.37 6.32 7.10 5.71 6.83 6.43 5.72
Monsoon 5.83 4.07 5.05 3.90 5.25 3.38 3.15 3.76 2.5/3.0
Post-monsoon 5.50 5.18 4.40 4.85 5.15 4.00 5.29 4.23 3.66
40 Veerlapalli In Village centre 18°43'0.23"N 79°30'56.16"E
10.00 Talchir SST
Winter 6.08 8.36 6.82 4.07 8.82 6.82 3.44 OCP-III
Pre-monsoon Dry 7.25 5.77 6.15 6.35 Dry 6.00 9.85 Dry 5.84
Monsoon 5.15 4.35 5.00 2.20 6.42 2.23 1.20 2.15
1 Post-monsoon 2.75 3.25 3.48 4.58 4.73 1.90 8.45 3.81 1.55
41 K K Nagar
Behind 8Inc.bunker 18°41'37.96"N 79°32'12.87"E
9.37 Talchir SST
Winter 7.33 8.36 7.75 6.40 7.63 7.20 6.30 GDK-8
Pre-monsoon 8.30 8.00 8.32 8.15 9.13 Dry 7.28 8.30 8.64 7.30
Monsoon 6.74 6.00 7.61 6.10 6.62 4.13 3.69 5.48 0.5
Post-monsoon 4.20 6.17 5.80 7.35 7.74 5.10 7.40 5.58 4.57
42 Vittalnagar
(Gdk)
Near Dispensary 18°44'12.11"N 79°31'3.90"E
7.50 Talchir SST
Winter 1.93 1.93 1.98 1.62 2.05 2.04 1.90 GDK-5, OC-III Pre-monsoon 6.30 5.11 2.04 1.97 2.15 4.02 1.93 2.68 2.69 2.53
Monsoon 1.46 1.24 1.53 1.56 1.57 1.38 1.41 1.65 1.2/2.0
Post-monsoon 2.15 1.60 1.50 1.79 2.05 1.36 1.95 1.92 1.55
44 Ganganagar,
GDK
Hanuman temple 18°46'18.88"N 79°30'43.76"E
8.55 Barakar sst
Winter 2.75 2.96 2.55 2.73 3.10 2.96 3.00 GDK-1
Pre-monsoon 3.50 2.85 2.65 2.77 2.66 3.80 3.40 4.52 4.10 3.50
Monsoon 2.43 2.42 2.39 2.30 2.57 2.31 2.35 2.90 1.5
Post-monsoon 2.05 2.10 2.53 2.70 2.84 2.50 3.32 2.87 2.62 Note: NR: Not Recorded, AB: well Abandoned:

40
HYDROGRAPS (Attitude of Phreatic Surface)
Well no.4 at Jangoan village
y = -0.2285x + 467.1
y = -0.1743x + 355.06
0
2
4
6
8
10
12
2005 2006 2007 2008 2009 2010 2011 2012 2013Year
DT
W(m
)
Pre-monsoon Post-monsoon Linear (Pre-monsoon) Linear (Post-monsoon)
Well no.14 at Dubbapalli village
y = 0.0495x - 90.614
y = -0.0173x + 40.575
0
2
4
6
8
10
12
2005 2006 2007 2008 2009 2010 2011 2012 2013Year
DT
W(m
)
Pre-monsoon Post-monsoon Linear (Pre-monsoon) Linear (Post-monsoon)
Well no. 41 at KK Nagar Colony
y = 0.0233x - 38.489
y = 0.011x - 16.109
0
2
4
6
8
10
2005 2006 2007 2008 2009 2010 2011 2012 2013Year
DT
W(m
)
Pre-monsoon Post-monsoon Linear (Pre-monsoon) Linear (Post-monsoon)
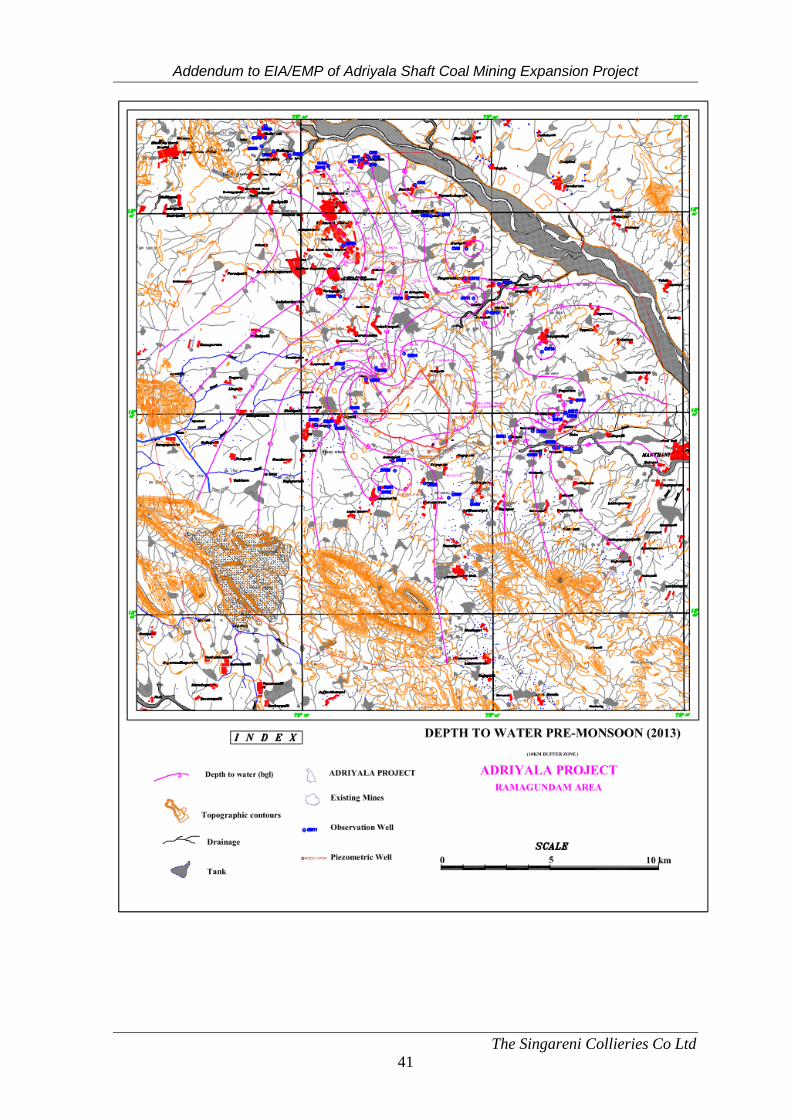
Addendum to EIA/EMP of Adriyala Shaft Coal Mining Expansion Project
The Singareni Collieries Co Ltd
41
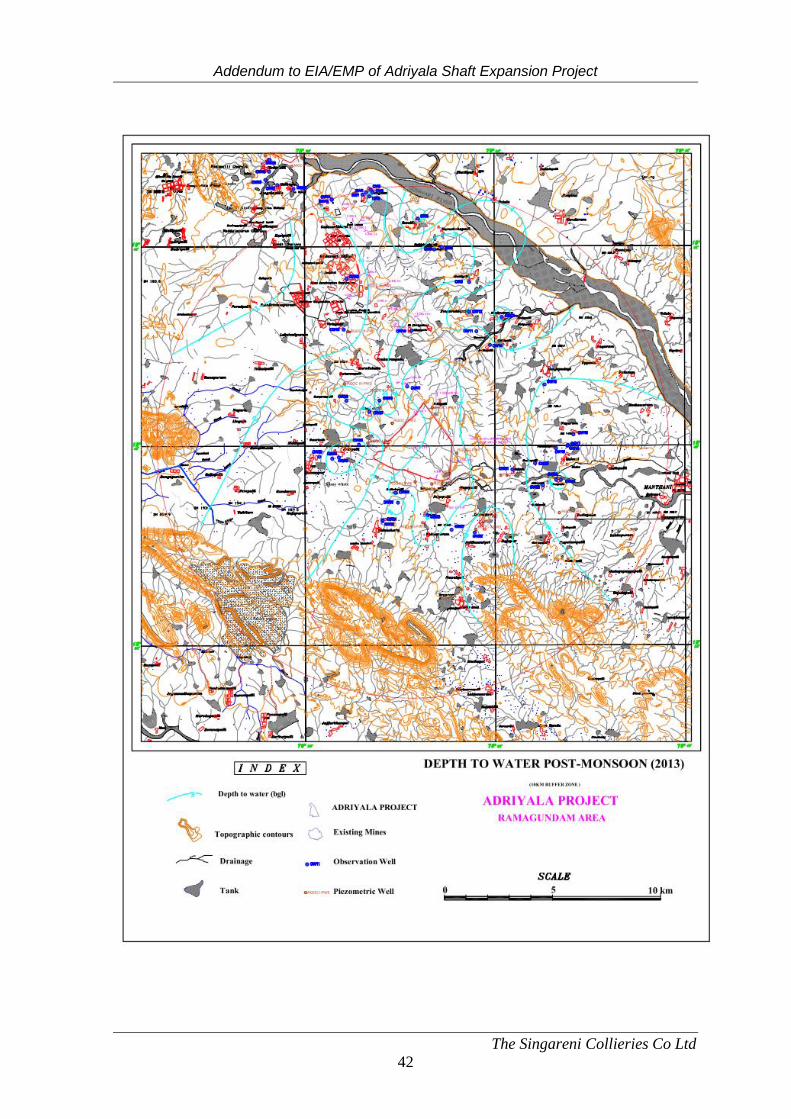
Addendum to EIA/EMP of Adriyala Shaft Expansion Project
The Singareni Collieries Co Ltd
42
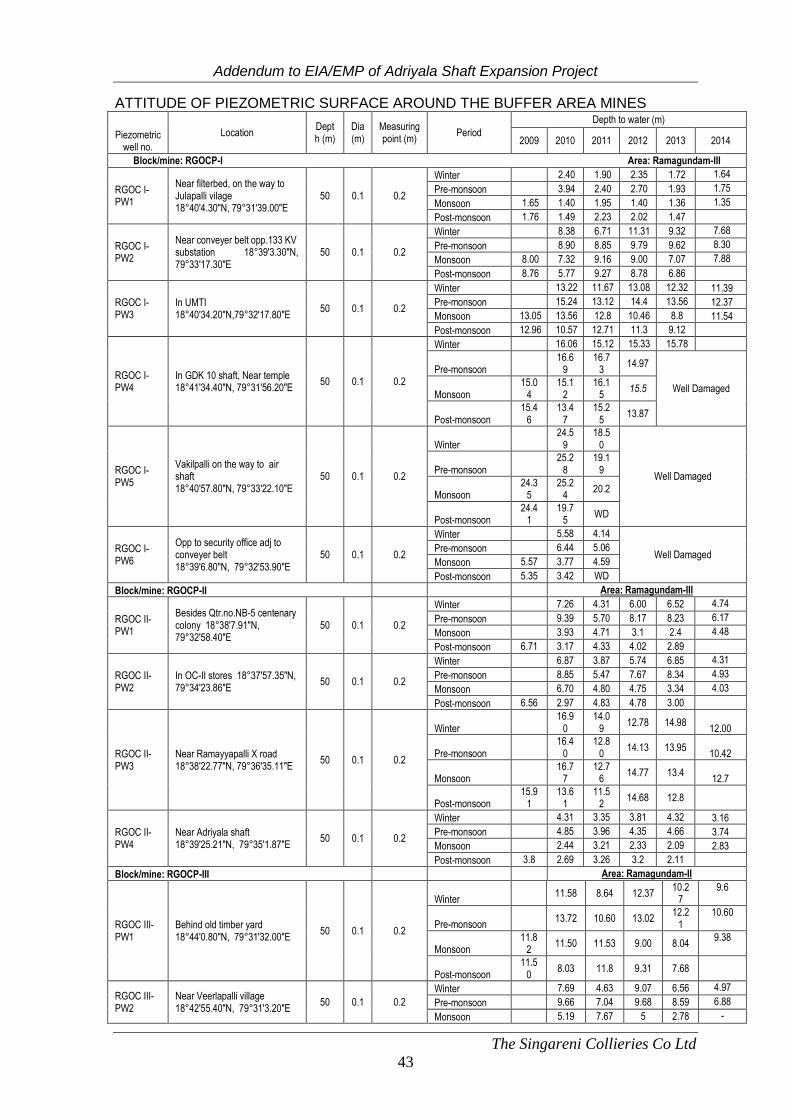
Addendum to EIA/EMP of Adriyala Shaft Expansion Project
The Singareni Collieries Co Ltd
43
ATTITUDE OF PIEZOMETRIC SURFACE AROUND THE BUFFER AREA MINES
Piezometric
well no.
Location Depth (m)
Dia (m)
Measuring point (m)
Period
Depth to water (m)
2009 2010 2011 2012 2013 2014
Block/mine: RGOCP-I Area: Ramagundam-III
RGOC I-PW1
Near filterbed, on the way to Julapalli vilage 18°40'4.30"N, 79°31'39.00"E
50 0.1 0.2
Winter 2.40 1.90 2.35 1.72 1.64
Pre-monsoon 3.94 2.40 2.70 1.93 1.75
Monsoon 1.65 1.40 1.95 1.40 1.36 1.35
Post-monsoon 1.76 1.49 2.23 2.02 1.47
RGOC I-PW2
Near conveyer belt opp.133 KV substation 18°39'3.30"N, 79°33'17.30"E
50 0.1 0.2
Winter 8.38 6.71 11.31 9.32 7.68
Pre-monsoon 8.90 8.85 9.79 9.62 8.30
Monsoon 8.00 7.32 9.16 9.00 7.07 7.88
Post-monsoon 8.76 5.77 9.27 8.78 6.86
RGOC I-PW3
In UMTI 18°40'34.20"N,79°32'17.80"E
50 0.1 0.2
Winter 13.22 11.67 13.08 12.32 11.39
Pre-monsoon 15.24 13.12 14.4 13.56 12.37
Monsoon 13.05 13.56 12.8 10.46 8.8 11.54
Post-monsoon 12.96 10.57 12.71 11.3 9.12
RGOC I-PW4
In GDK 10 shaft, Near temple 18°41'34.40"N, 79°31'56.20"E
50 0.1 0.2
Winter 16.06 15.12 15.33 15.78
Pre-monsoon
16.69
16.73
14.97
Well Damaged Monsoon
15.04
15.12
16.15
15.5
Post-monsoon 15.4
6 13.4
7 15.2
5 13.87
RGOC I-PW5
Vakilpalli on the way to air shaft 18°40'57.80"N, 79°33'22.10"E
50 0.1 0.2
Winter
24.59
18.50
Well Damaged Pre-monsoon
25.2
8 19.1
9
Monsoon 24.3
5 25.2
4 20.2
Post-monsoon 24.4
1 19.7
5 WD
RGOC I-PW6
Opp to security office adj to conveyer belt 18°39'6.80"N, 79°32'53.90"E
50 0.1 0.2
Winter 5.58 4.14
Well Damaged Pre-monsoon 6.44 5.06
Monsoon 5.57 3.77 4.59
Post-monsoon 5.35 3.42 WD
Block/mine: RGOCP-II Area: Ramagundam-III
RGOC II-PW1
Besides Qtr.no.NB-5 centenary colony 18°38'7.91"N, 79°32'58.40"E
50 0.1 0.2
Winter 7.26 4.31 6.00 6.52 4.74
Pre-monsoon 9.39 5.70 8.17 8.23 6.17
Monsoon 3.93 4.71 3.1 2.4 4.48
Post-monsoon 6.71 3.17 4.33 4.02 2.89
RGOC II-PW2
In OC-II stores 18°37'57.35"N, 79°34'23.86"E
50 0.1 0.2
Winter 6.87 3.87 5.74 6.85 4.31
Pre-monsoon 8.85 5.47 7.67 8.34 4.93
Monsoon 6.70 4.80 4.75 3.34 4.03
Post-monsoon 6.56 2.97 4.83 4.78 3.00
RGOC II-PW3
Near Ramayyapalli X road 18°38'22.77"N, 79°36'35.11"E
50 0.1 0.2
Winter
16.90
14.09
12.78 14.98 12.00
Pre-monsoon
16.40
12.80
14.13 13.95 10.42
Monsoon
16.77
12.76
14.77 13.4 12.7
Post-monsoon 15.9
1 13.6
1 11.5
2 14.68 12.8
RGOC II-PW4
Near Adriyala shaft 18°39'25.21"N, 79°35'1.87"E
50 0.1 0.2
Winter 4.31 3.35 3.81 4.32 3.16
Pre-monsoon 4.85 3.96 4.35 4.66 3.74
Monsoon 2.44 3.21 2.33 2.09 2.83
Post-monsoon 3.8 2.69 3.26 3.2 2.11
Block/mine: RGOCP-III Area: Ramagundam-II
RGOC III-PW1
Behind old timber yard 18°44'0.80"N, 79°31'32.00"E
50 0.1 0.2
Winter 11.58 8.64 12.37
10.27
9.6
Pre-monsoon 13.72 10.60 13.02
12.21
10.60
Monsoon 11.8
2 11.50 11.53 9.00 8.04
9.38
Post-monsoon 11.5
0 8.03 11.8 9.31 7.68
RGOC III-PW2
Near Veerlapalli village 18°42'55.40"N, 79°31'3.20"E
50 0.1 0.2
Winter 7.69 4.63 9.07 6.56 4.97
Pre-monsoon 9.66 7.04 9.68 8.59 6.88
Monsoon 5.19 7.67 5 2.78 -
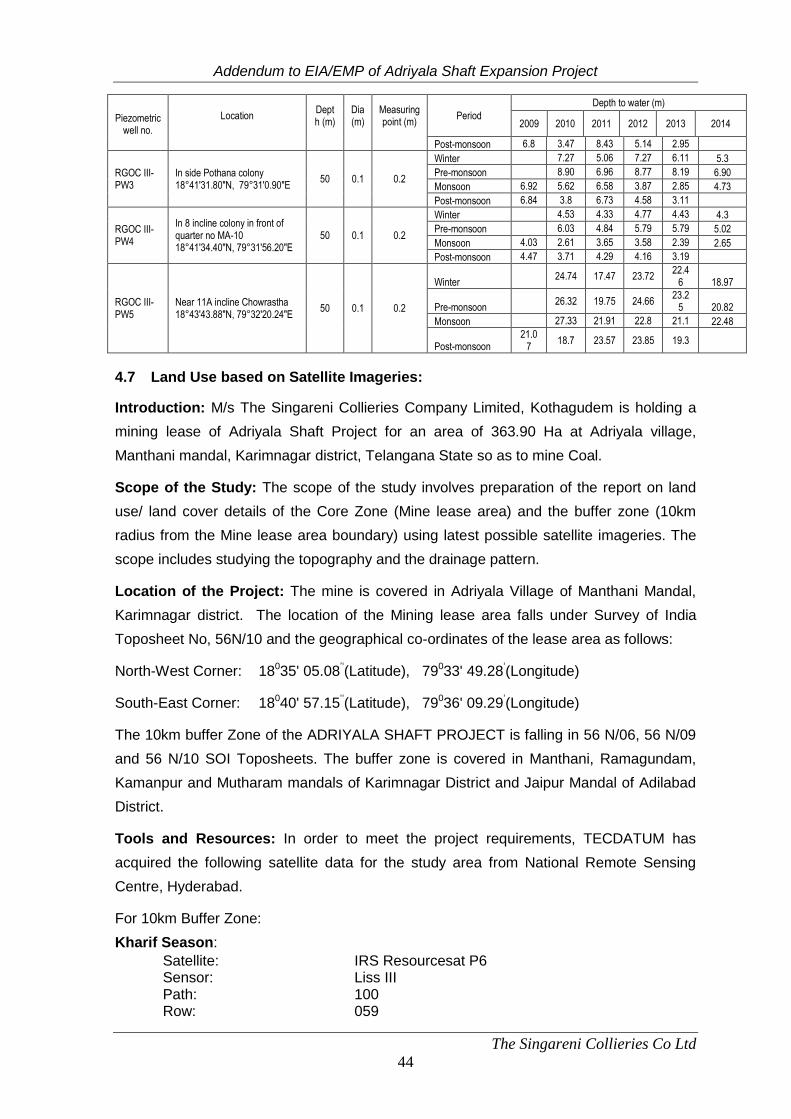
Addendum to EIA/EMP of Adriyala Shaft Expansion Project
The Singareni Collieries Co Ltd
44
Piezometric
well no.
Location Depth (m)
Dia (m)
Measuring point (m)
Period
Depth to water (m)
2009 2010 2011 2012 2013 2014
Post-monsoon 6.8 3.47 8.43 5.14 2.95
RGOC III-PW3
In side Pothana colony 18°41'31.80"N, 79°31'0.90"E
50 0.1 0.2
Winter 7.27 5.06 7.27 6.11 5.3
Pre-monsoon 8.90 6.96 8.77 8.19 6.90
Monsoon 6.92 5.62 6.58 3.87 2.85 4.73
Post-monsoon 6.84 3.8 6.73 4.58 3.11
RGOC III-PW4
In 8 incline colony in front of quarter no MA-10 18°41'34.40"N, 79°31'56.20"E
50 0.1 0.2
Winter 4.53 4.33 4.77 4.43 4.3
Pre-monsoon 6.03 4.84 5.79 5.79 5.02
Monsoon 4.03 2.61 3.65 3.58 2.39 2.65
Post-monsoon 4.47 3.71 4.29 4.16 3.19
RGOC III-PW5
Near 11A incline Chowrastha 18°43'43.88"N, 79°32'20.24"E
50 0.1 0.2
Winter 24.74 17.47 23.72
22.46 18.97
Pre-monsoon 26.32 19.75 24.66
23.25 20.82
Monsoon 27.33 21.91 22.8 21.1 22.48
Post-monsoon 21.0
7 18.7 23.57 23.85 19.3
4.7 Land Use based on Satellite Imageries:
Introduction: M/s The Singareni Collieries Company Limited, Kothagudem is holding a
mining lease of Adriyala Shaft Project for an area of 363.90 Ha at Adriyala village,
Manthani mandal, Karimnagar district, Telangana State so as to mine Coal.
Scope of the Study: The scope of the study involves preparation of the report on land
use/ land cover details of the Core Zone (Mine lease area) and the buffer zone (10km
radius from the Mine lease area boundary) using latest possible satellite imageries. The
scope includes studying the topography and the drainage pattern.
Location of the Project: The mine is covered in Adriyala Village of Manthani Mandal,
Karimnagar district. The location of the Mining lease area falls under Survey of India
Toposheet No, 56N/10 and the geographical co-ordinates of the lease area as follows:
North-West Corner: 18035' 05.08’‘(Latitude), 79033' 49.28‘(Longitude)
South-East Corner: 18040' 57.15‘‘(Latitude), 79036' 09.29‘(Longitude)
The 10km buffer Zone of the ADRIYALA SHAFT PROJECT is falling in 56 N/06, 56 N/09
and 56 N/10 SOI Toposheets. The buffer zone is covered in Manthani, Ramagundam,
Kamanpur and Mutharam mandals of Karimnagar District and Jaipur Mandal of Adilabad
District.
Tools and Resources: In order to meet the project requirements, TECDATUM has
acquired the following satellite data for the study area from National Remote Sensing
Centre, Hyderabad.
For 10km Buffer Zone:
Kharif Season:
Satellite: IRS Resourcesat P6 Sensor: Liss III Path: 100 Row: 059
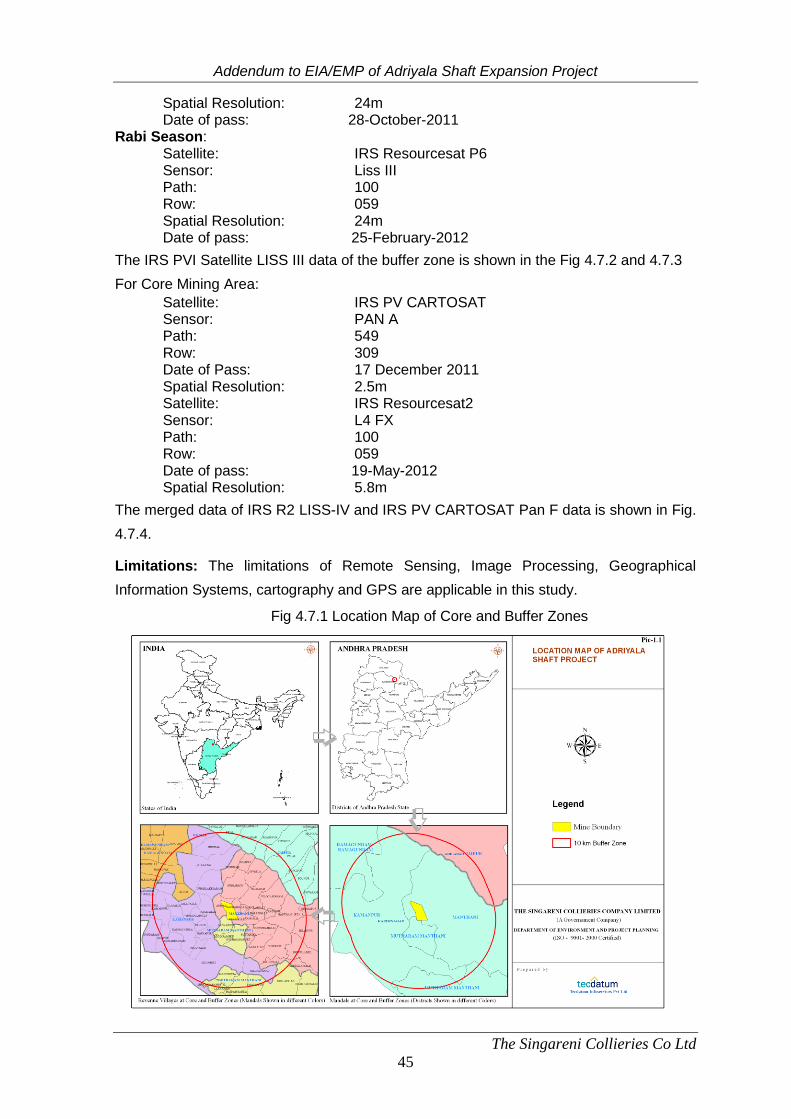
Addendum to EIA/EMP of Adriyala Shaft Expansion Project
The Singareni Collieries Co Ltd
45
Spatial Resolution: 24m Date of pass: 28-October-2011 Rabi Season:
Satellite: IRS Resourcesat P6 Sensor: Liss III Path: 100 Row: 059
Spatial Resolution: 24m Date of pass: 25-February-2012
The IRS PVI Satellite LISS III data of the buffer zone is shown in the Fig 4.7.2 and 4.7.3
For Core Mining Area:
Satellite: IRS PV CARTOSAT Sensor: PAN A Path: 549 Row: 309 Date of Pass: 17 December 2011
Spatial Resolution: 2.5m Satellite: IRS Resourcesat2 Sensor: L4 FX Path: 100 Row: 059 Date of pass: 19-May-2012
Spatial Resolution: 5.8m
The merged data of IRS R2 LISS-IV and IRS PV CARTOSAT Pan F data is shown in Fig.
4.7.4.
Limitations: The limitations of Remote Sensing, Image Processing, Geographical
Information Systems, cartography and GPS are applicable in this study.
Fig 4.7.1 Location Map of Core and Buffer Zones
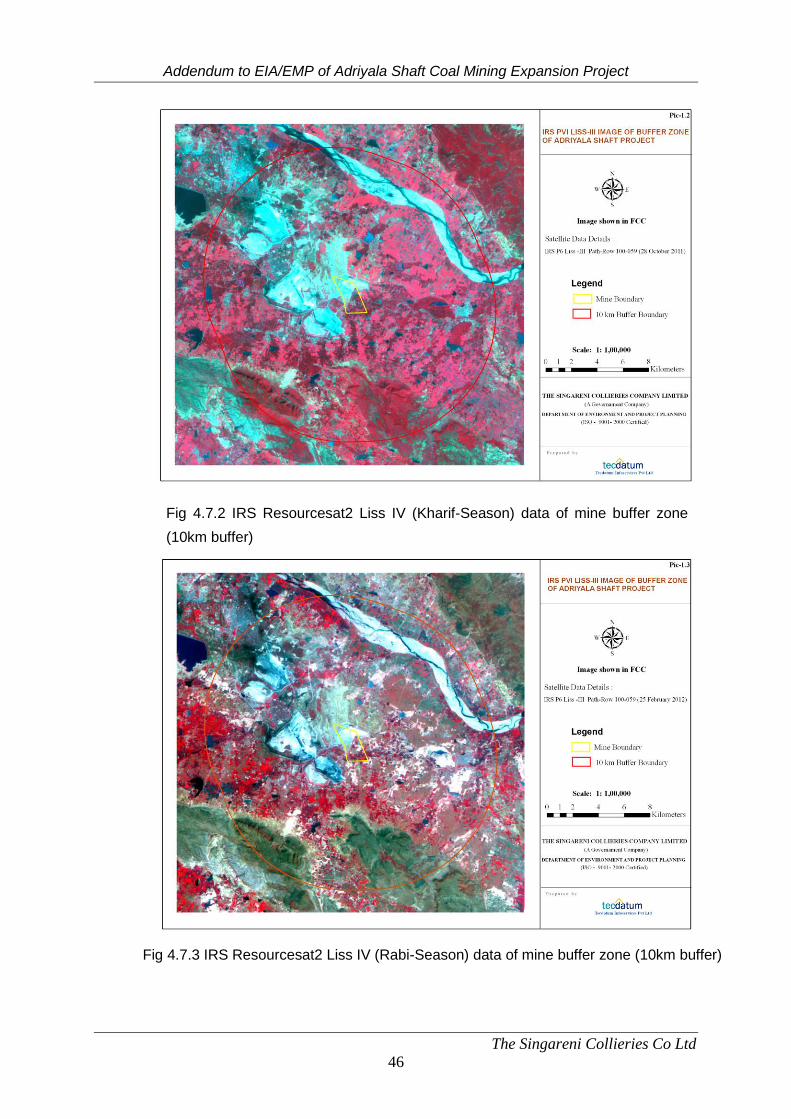
Addendum to EIA/EMP of Adriyala Shaft Coal Mining Expansion Project
The Singareni Collieries Co Ltd
46
Fig 4.7.2 IRS Resourcesat2 Liss IV (Kharif-Season) data of mine buffer zone (10km buffer)
Fig 4.7.3 IRS Resourcesat2 Liss IV (Rabi-Season) data of mine buffer zone (10km buffer)
Fig 4.7.2 IRS Resourcesat2 Liss IV (Kharif-Season) data of mine buffer zone
(10km buffer)
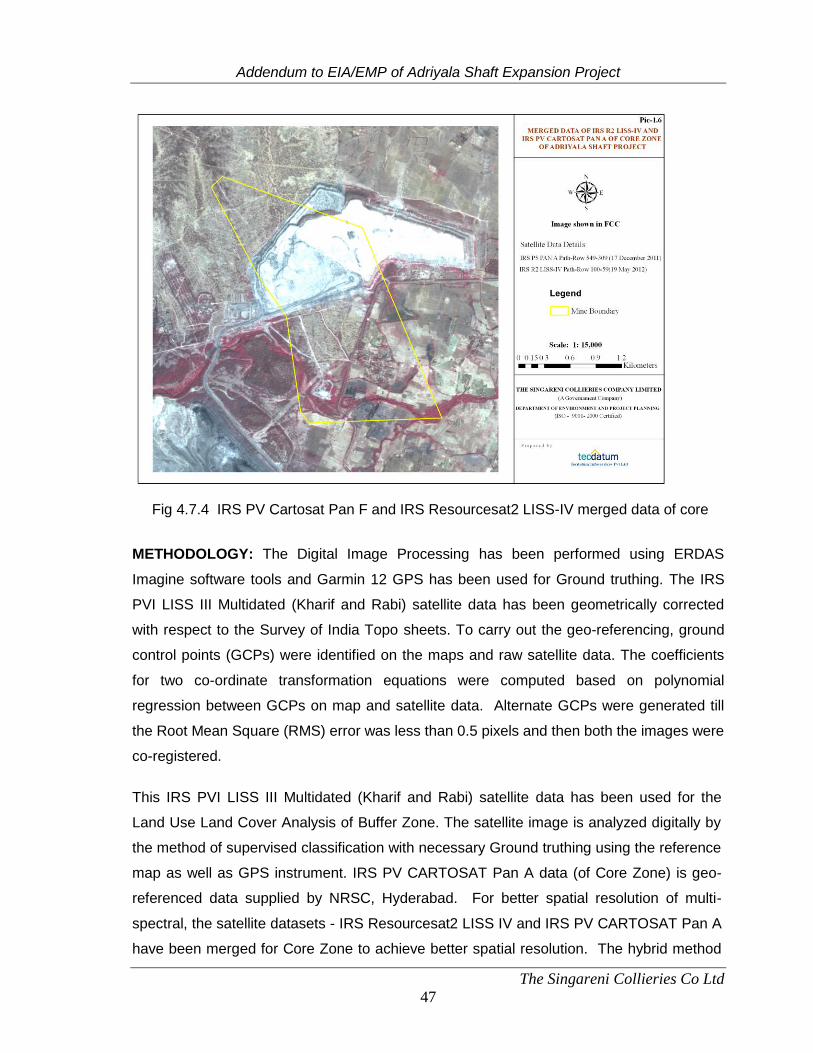
Addendum to EIA/EMP of Adriyala Shaft Expansion Project
The Singareni Collieries Co Ltd
47
METHODOLOGY: The Digital Image Processing has been performed using ERDAS
Imagine software tools and Garmin 12 GPS has been used for Ground truthing. The IRS
PVI LISS III Multidated (Kharif and Rabi) satellite data has been geometrically corrected
with respect to the Survey of India Topo sheets. To carry out the geo-referencing, ground
control points (GCPs) were identified on the maps and raw satellite data. The coefficients
for two co-ordinate transformation equations were computed based on polynomial
regression between GCPs on map and satellite data. Alternate GCPs were generated till
the Root Mean Square (RMS) error was less than 0.5 pixels and then both the images were
co-registered.
This IRS PVI LISS III Multidated (Kharif and Rabi) satellite data has been used for the
Land Use Land Cover Analysis of Buffer Zone. The satellite image is analyzed digitally by
the method of supervised classification with necessary Ground truthing using the reference
map as well as GPS instrument. IRS PV CARTOSAT Pan A data (of Core Zone) is geo-
referenced data supplied by NRSC, Hyderabad. For better spatial resolution of multi-
spectral, the satellite datasets - IRS Resourcesat2 LISS IV and IRS PV CARTOSAT Pan A
have been merged for Core Zone to achieve better spatial resolution. The hybrid method
Fig 4.7.4 IRS PV Cartosat Pan F and IRS Resourcesat2 LISS-IV merged data of core
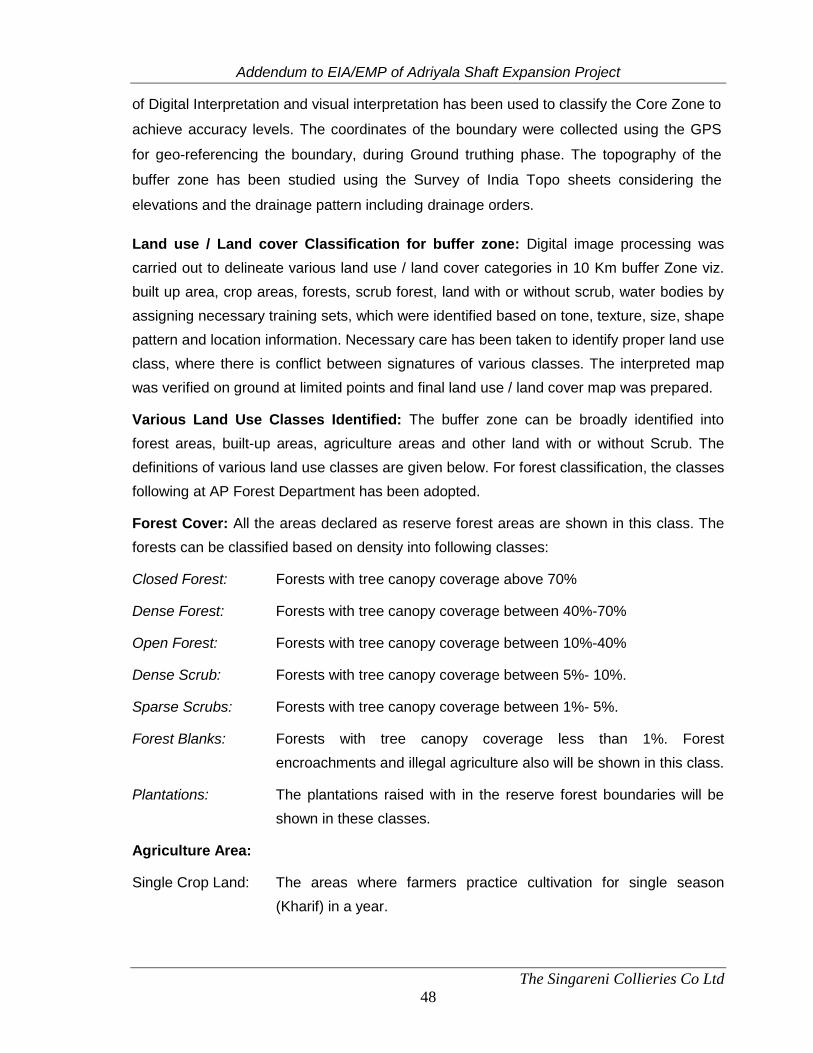
Addendum to EIA/EMP of Adriyala Shaft Expansion Project
The Singareni Collieries Co Ltd
48
of Digital Interpretation and visual interpretation has been used to classify the Core Zone to
achieve accuracy levels. The coordinates of the boundary were collected using the GPS
for geo-referencing the boundary, during Ground truthing phase. The topography of the
buffer zone has been studied using the Survey of India Topo sheets considering the
elevations and the drainage pattern including drainage orders.
Land use / Land cover Classification for buffer zone: Digital image processing was
carried out to delineate various land use / land cover categories in 10 Km buffer Zone viz.
built up area, crop areas, forests, scrub forest, land with or without scrub, water bodies by
assigning necessary training sets, which were identified based on tone, texture, size, shape
pattern and location information. Necessary care has been taken to identify proper land use
class, where there is conflict between signatures of various classes. The interpreted map
was verified on ground at limited points and final land use / land cover map was prepared.
Various Land Use Classes Identified: The buffer zone can be broadly identified into
forest areas, built-up areas, agriculture areas and other land with or without Scrub. The
definitions of various land use classes are given below. For forest classification, the classes
following at AP Forest Department has been adopted.
Forest Cover: All the areas declared as reserve forest areas are shown in this class. The
forests can be classified based on density into following classes:
Closed Forest: Forests with tree canopy coverage above 70%
Dense Forest: Forests with tree canopy coverage between 40%-70%
Open Forest: Forests with tree canopy coverage between 10%-40%
Dense Scrub: Forests with tree canopy coverage between 5%- 10%.
Sparse Scrubs: Forests with tree canopy coverage between 1%- 5%.
Forest Blanks: Forests with tree canopy coverage less than 1%. Forest
encroachments and illegal agriculture also will be shown in this class.
Plantations: The plantations raised with in the reserve forest boundaries will be
shown in these classes.
Agriculture Area:
Single Crop Land: The areas where farmers practice cultivation for single season
(Kharif) in a year.
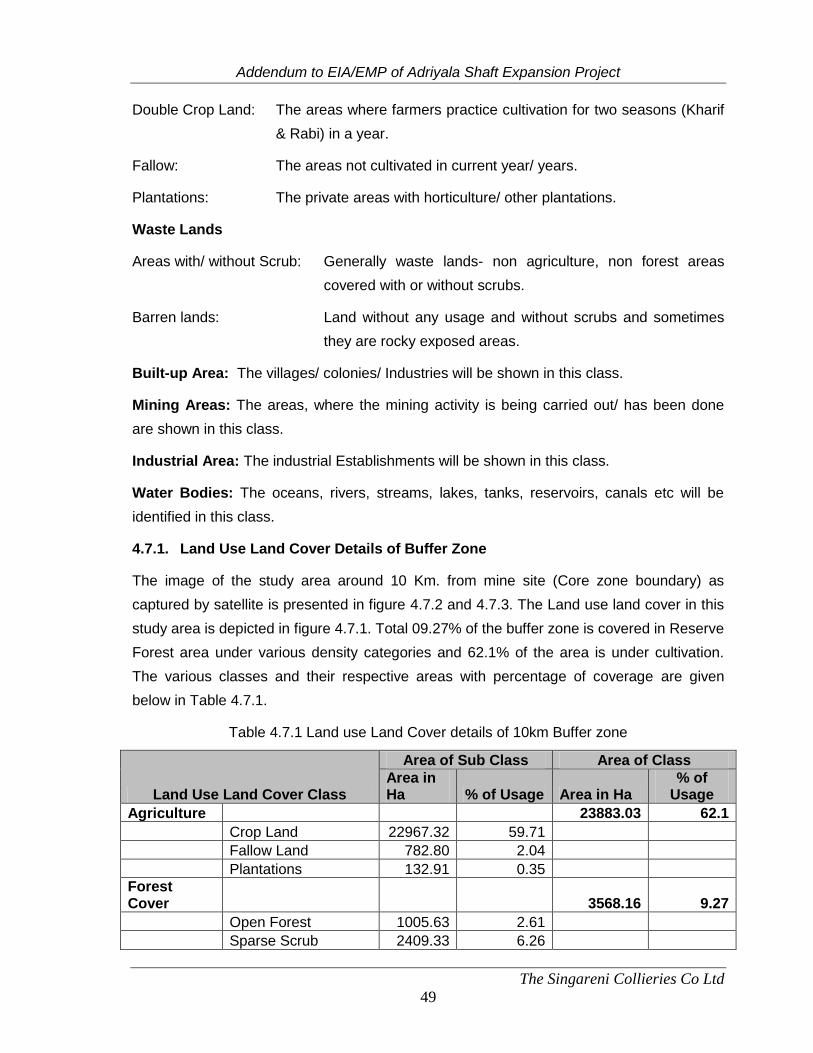
Addendum to EIA/EMP of Adriyala Shaft Expansion Project
The Singareni Collieries Co Ltd
49
Double Crop Land: The areas where farmers practice cultivation for two seasons (Kharif
& Rabi) in a year.
Fallow: The areas not cultivated in current year/ years.
Plantations: The private areas with horticulture/ other plantations.
Waste Lands
Areas with/ without Scrub: Generally waste lands- non agriculture, non forest areas
covered with or without scrubs.
Barren lands: Land without any usage and without scrubs and sometimes
they are rocky exposed areas.
Built-up Area: The villages/ colonies/ Industries will be shown in this class.
Mining Areas: The areas, where the mining activity is being carried out/ has been done
are shown in this class.
Industrial Area: The industrial Establishments will be shown in this class.
Water Bodies: The oceans, rivers, streams, lakes, tanks, reservoirs, canals etc will be
identified in this class.
4.7.1. Land Use Land Cover Details of Buffer Zone
The image of the study area around 10 Km. from mine site (Core zone boundary) as
captured by satellite is presented in figure 4.7.2 and 4.7.3. The Land use land cover in this
study area is depicted in figure 4.7.1. Total 09.27% of the buffer zone is covered in Reserve
Forest area under various density categories and 62.1% of the area is under cultivation.
The various classes and their respective areas with percentage of coverage are given
below in Table 4.7.1.
Table 4.7.1 Land use Land Cover details of 10km Buffer zone
Land Use Land Cover Class
Area of Sub Class Area of Class
Area in Ha % of Usage Area in Ha
% of Usage
Agriculture 23883.03 62.1
Crop Land 22967.32 59.71
Fallow Land 782.80 2.04
Plantations 132.91 0.35
Forest Cover 3568.16 9.27
Open Forest 1005.63 2.61
Sparse Scrub 2409.33 6.26
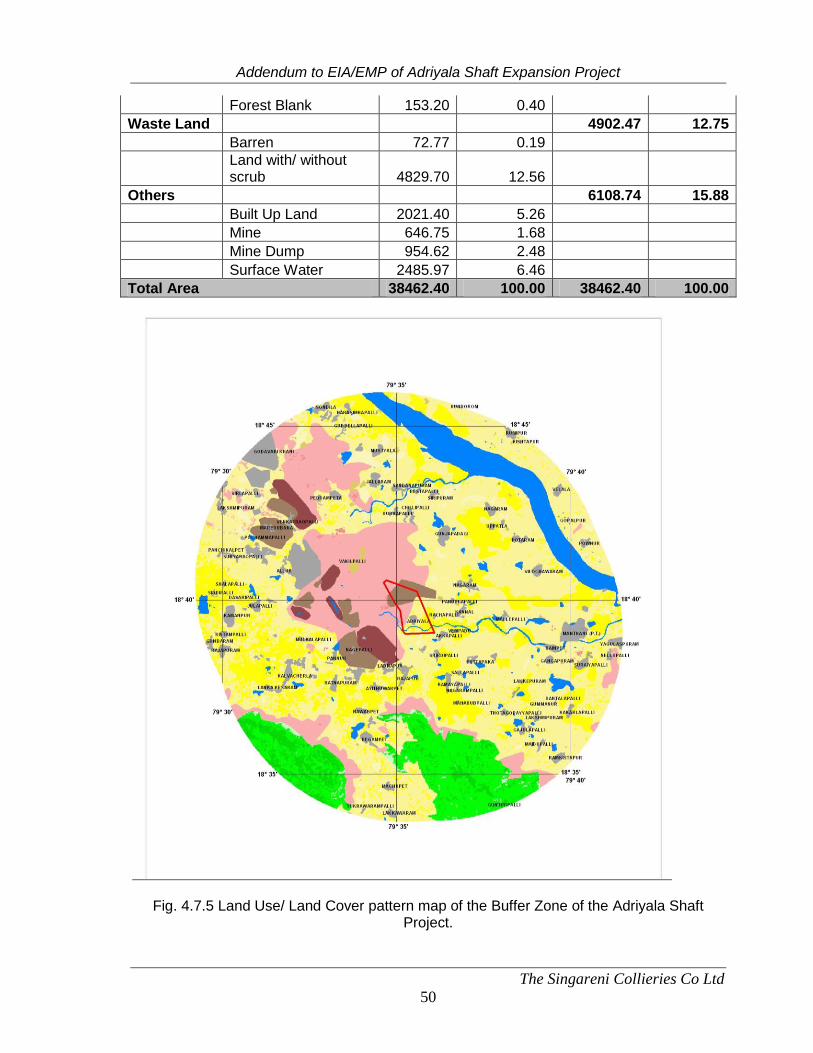
Addendum to EIA/EMP of Adriyala Shaft Expansion Project
The Singareni Collieries Co Ltd
50
Forest Blank 153.20 0.40
Waste Land 4902.47 12.75
Barren 72.77 0.19
Land with/ without scrub 4829.70 12.56
Others 6108.74 15.88
Built Up Land 2021.40 5.26
Mine 646.75 1.68
Mine Dump 954.62 2.48
Surface Water 2485.97 6.46
Total Area 38462.40 100.00 38462.40 100.00
Fig. 4.7.5 Land Use/ Land Cover pattern map of the Buffer Zone of the Adriyala Shaft Project.
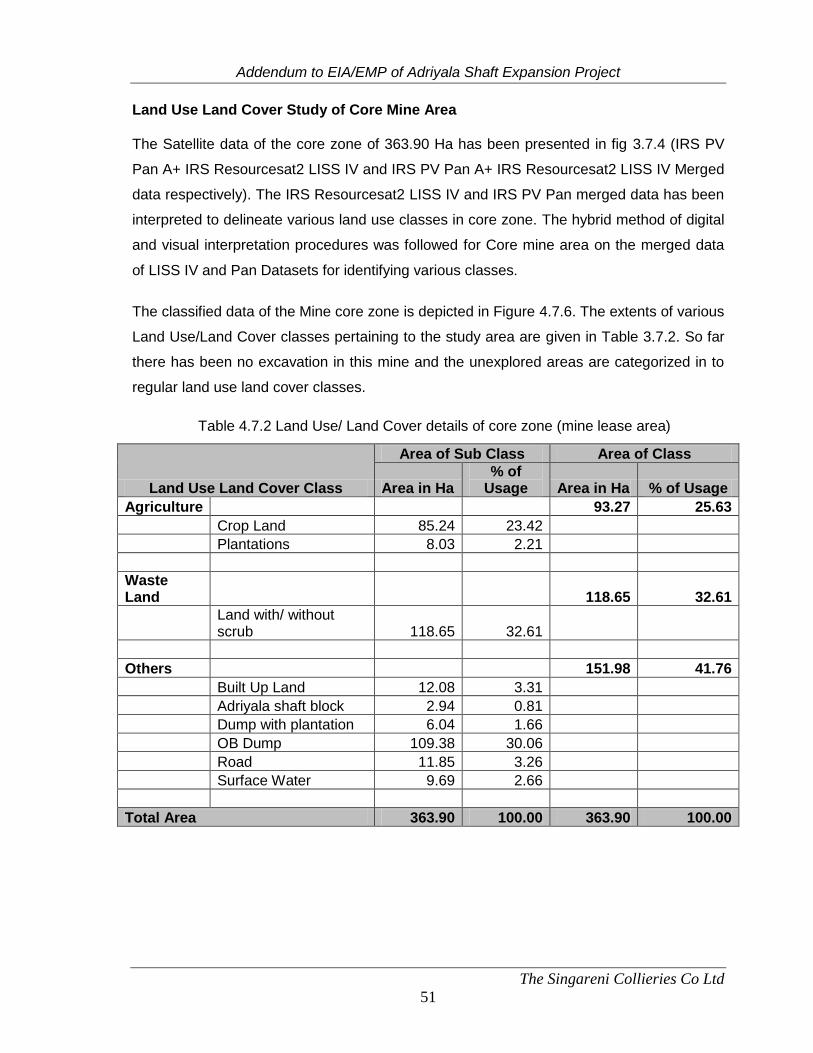
Addendum to EIA/EMP of Adriyala Shaft Expansion Project
The Singareni Collieries Co Ltd
51
Land Use Land Cover Study of Core Mine Area
The Satellite data of the core zone of 363.90 Ha has been presented in fig 3.7.4 (IRS PV
Pan A+ IRS Resourcesat2 LISS IV and IRS PV Pan A+ IRS Resourcesat2 LISS IV Merged
data respectively). The IRS Resourcesat2 LISS IV and IRS PV Pan merged data has been
interpreted to delineate various land use classes in core zone. The hybrid method of digital
and visual interpretation procedures was followed for Core mine area on the merged data
of LISS IV and Pan Datasets for identifying various classes.
The classified data of the Mine core zone is depicted in Figure 4.7.6. The extents of various
Land Use/Land Cover classes pertaining to the study area are given in Table 3.7.2. So far
there has been no excavation in this mine and the unexplored areas are categorized in to
regular land use land cover classes.
Table 4.7.2 Land Use/ Land Cover details of core zone (mine lease area)
Land Use Land Cover Class
Area of Sub Class Area of Class
Area in Ha % of
Usage Area in Ha % of Usage
Agriculture 93.27 25.63
Crop Land 85.24 23.42
Plantations 8.03 2.21
Waste Land 118.65 32.61
Land with/ without scrub 118.65 32.61
Others 151.98 41.76
Built Up Land 12.08 3.31
Adriyala shaft block 2.94 0.81
Dump with plantation 6.04 1.66
OB Dump 109.38 30.06
Road 11.85 3.26
Surface Water 9.69 2.66
Total Area 363.90 100.00 363.90 100.00
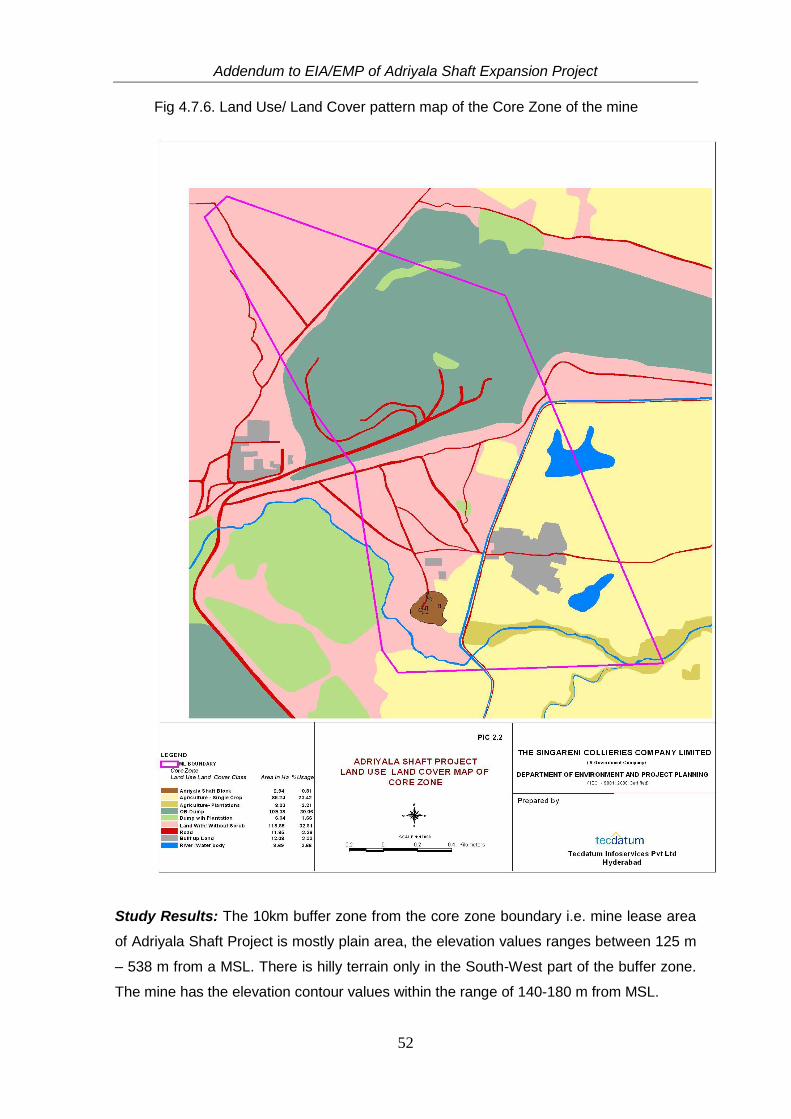
Addendum to EIA/EMP of Adriyala Shaft Expansion Project
52
Study Results: The 10km buffer zone from the core zone boundary i.e. mine lease area
of Adriyala Shaft Project is mostly plain area, the elevation values ranges between 125 m
– 538 m from a MSL. There is hilly terrain only in the South-West part of the buffer zone.
The mine has the elevation contour values within the range of 140-180 m from MSL.
Fig 4.7.6. Land Use/ Land Cover pattern map of the Core Zone of the mine
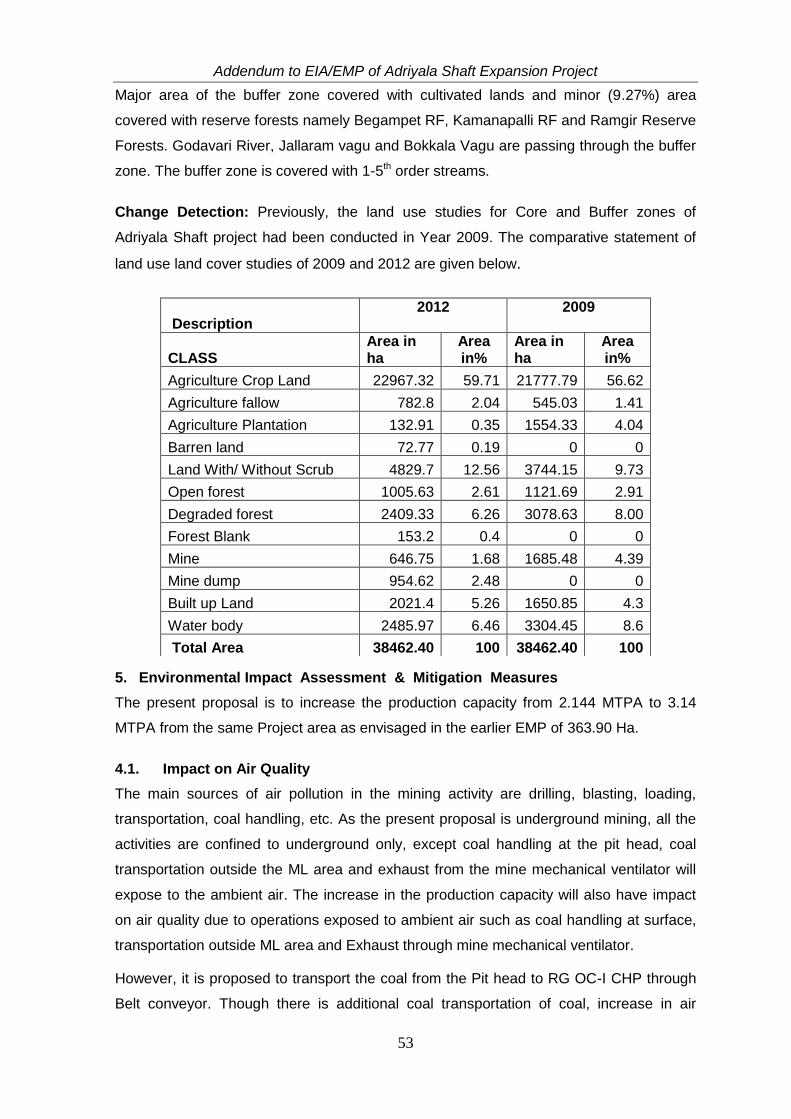
Addendum to EIA/EMP of Adriyala Shaft Expansion Project
53
Major area of the buffer zone covered with cultivated lands and minor (9.27%) area
covered with reserve forests namely Begampet RF, Kamanapalli RF and Ramgir Reserve
Forests. Godavari River, Jallaram vagu and Bokkala Vagu are passing through the buffer
zone. The buffer zone is covered with 1-5th order streams.
Change Detection: Previously, the land use studies for Core and Buffer zones of
Adriyala Shaft project had been conducted in Year 2009. The comparative statement of
land use land cover studies of 2009 and 2012 are given below.
5. Environmental Impact Assessment & Mitigation Measures
The present proposal is to increase the production capacity from 2.144 MTPA to 3.14
MTPA from the same Project area as envisaged in the earlier EMP of 363.90 Ha.
4.1. Impact on Air Quality
The main sources of air pollution in the mining activity are drilling, blasting, loading,
transportation, coal handling, etc. As the present proposal is underground mining, all the
activities are confined to underground only, except coal handling at the pit head, coal
transportation outside the ML area and exhaust from the mine mechanical ventilator will
expose to the ambient air. The increase in the production capacity will also have impact
on air quality due to operations exposed to ambient air such as coal handling at surface,
transportation outside ML area and Exhaust through mine mechanical ventilator.
However, it is proposed to transport the coal from the Pit head to RG OC-I CHP through
Belt conveyor. Though there is additional coal transportation of coal, increase in air
Description 2012
2009
CLASS Area in ha
Area in%
Area in ha
Area in%
Agriculture Crop Land 22967.32 59.71 21777.79 56.62
Agriculture fallow 782.8 2.04 545.03 1.41
Agriculture Plantation 132.91 0.35 1554.33 4.04
Barren land 72.77 0.19 0 0
Land With/ Without Scrub 4829.7 12.56 3744.15 9.73
Open forest 1005.63 2.61 1121.69 2.91
Degraded forest 2409.33 6.26 3078.63 8.00
Forest Blank 153.2 0.4 0 0
Mine 646.75 1.68 1685.48 4.39
Mine dump 954.62 2.48 0 0
Built up Land 2021.4 5.26 1650.85 4.3
Water body 2485.97 6.46 3304.45 8.6
Total Area 38462.40 100 38462.40 100
Addendum to EIA/EMP of Adriyala Shaft Expansion Project
54
pollution due to additional coal transportation will be minimum as it is proposed by the
dedicated belt conveyor. Hence, the impact due to coal transportation of additional
produced coal will be meager by taking necessary mitigative measures.
The increase in coal production will also contributes to increase in concentration of the
methane, dust, smoke, CO2, etc., from the mine mechanical ventilator but the impact is
meager as it will be diluted as soon as exhaust mixes with the ambient air. The impact on
air pollution due to additional quantity of coal handling at the surface can also controlled
by effective dust suppression measures.
The following mitigative measures are proposed:
Effective water sprinkling and extraction of dust by automatic interlocked water
sprinkling system at longwall face is proposed.
Coal evacuation is proposed from the face to Pit head also by belt conveyor.
Additional water sprinkling arrangements at longwall face, lump breaker, transfer
points, loading and unloading points along the belt conveyor in the underground
suitably for incremental production will be made.
Effective water spraying by mist spray is also proposed in the CHP.
Enclosing of transfer points where ever possible.
Development of green belt within the mine premises, CHP, avenue plantation
along the coal transportation belt / routes
Eight ambient air quality monitoring stations have been provided and monitoring
once in every fortnight as per the guidelines of CPCB and MoEF for the
parameters of PM10, PM2.5, SO2 and NOx. The monitoring will also be continued in
the expansion project.
To assess the location of ambient air quality monitoring locations, Automatic Micro
Meteorological Station has been established in the Ramagundam Region.
Data on ambient air quality is being submitted to Regional office of MoEF,
Bangalore as a part of Half Yearly Monitoring Reports of EC compliance and State
Pollution Control Board in the every quarter.
Vehicular emissions will be kept under control and regularly monitored.
Establishment of Belt conveyor from pit head to RG OC-I CHP completed and
from the RG OC-I CHP, the coal will be transported to the customers through Rail.
Addendum to EIA/EMP of Adriyala Shaft Expansion Project
55
4.2. Air Quality in underground workings - Air Cooling System for Underground Mine Workings:
The mining operations of Adriyala Longwall Project involve heavy mechanization with
1000-3000 kW face machines operating at 300 – 600 m depth. Workings are extended to
about 4.5 - 6.5 Km length from surface. These high capacity machines, geo-mining
conditions and faster extraction rates add substantial heat to working environment.
To maintain comfort conditions at workplace, air quantity flow is to be substantially
increased. Under certain conditions, increase of air quantity is not possible and also
there is limitation to increase comfort by increasing the air quantity. Under these
circumstances it is required to adopt artificial air cooling arrangements to achieve comfort
at workplace for improving production, productivity and safety.
Keeping in view of the operating conditions at Longwall and Road header workings in
ALP, it is proposed to install Air-cooling system to reduce the air temperature in workings.
It is proposed to cool ventilation air of three major working areas by installing this air
cooling plant. Each working area is expected to be ventilated by 50 m3/s of air and
therefore, total amount of air to be cooled for three working area is 150 m3/s.
In this system, 50% of each of the air stream (i.e. 25 m3/s) shall be passed through Air
Handling units which would cool the air from 32 0C Td & 310C Tw to 180C. Approximate
cooling capacity required for each stream of air is 462 TR. 180C cold air (from the Air
Handling Units) will mix up with 32 0C air (in equal proportion) and produce a mixed air
temperature of 25 0C, which will get carried forward (under the overall ventilation system
of the mine) to the working area.
Considering some safety factor of about 5%, 500 TR (Tonnes of Refrigeration) of
refrigeration capacity per stream shall be required. Hence for three working areas taken
together, the total capacity requirement shall be 1500 TR.
Details of the proposed Air-cooling System:
Intake air temperature is proposed to be reduced from 32.00C to 25.00C for air flow
quantity of 150m3/s
Modeling and simulation studies have been carried out by ISMU, Dhanbad for the
design of Air-cooling system
The system consists of Refrigeration plant (Chillers) to chill the water in closed cycle
Addendum to EIA/EMP of Adriyala Shaft Expansion Project
56
Chilled water circulated through Air Handling Units (AHU’s) strategically located in
intake of working districts
Refrigeration plant will be installed in underground/surface and suitably located
considering optimum/high positional efficiency. Chilled water is circulated through
insulated pipes from plant to AHU’s
Intake air of 50 m3/s is split into 2 streams of 25 m3/s. Two AHU’s will be installed
with capacity of 12.5 m3/s each (one AHU in each stream)
AHU reduces the air temperature from 32.00C to 18.00C, mixed air temperature in
each air stream will be about 25.00C-26.00C
Refrigeration capacity requirement is about 1500 TR. Refrigeration is proposed to be
achieved by installing multiple capacity water cooled screw chillers facilitating to use
partial capacity during winter
Total system power consumption will be about 2500-2500 kW at 100% load
Procurement of the system is in active stage and necessary fund provision is made for
the same in RCE June-2013 (₹ 7.0 crores). Earlier, during May 2012, Air-cooling system
of 500TR capacity was installed in underground at VK No. 7 Incline for cooling mine air
ventilating Continuous Miner workings. Due to the introduction of Air-cooling system,
work place comfort improved substantially in Continuous Miner district. It is the first of its
kind to be installed in underground coal mines of India and operating successfully.
Experience gained from the installation of VK No.7 Incline will be useful for the future
SCCL underground projects in procurement, installation and operation of Air-cooling
systems to achieve comfortable environmental conditions in mine workings.
4.3. Impact on water quality
The possible sources of water due to the proposed project activates are mine discharge
water and effluents from the workshop and sewage from the township. The increase in
production was planned by capacity utilization of longwall equipment with latest
technology longwall equipment. As such, there will not be any additional mine discharge
from the project over the earlier EMP. The maximum estimated mine discharge will be
13000 KLD. However the requirement of water for the dust suppression, workshop, etc
will increase from 800 KLD to 1050 KLD. Additional mitigative measures were proposed
to control the water pollution over the earlier EMP. Presently the consent for operation is
granted for 11550 KLD from the State Pollution Control Board
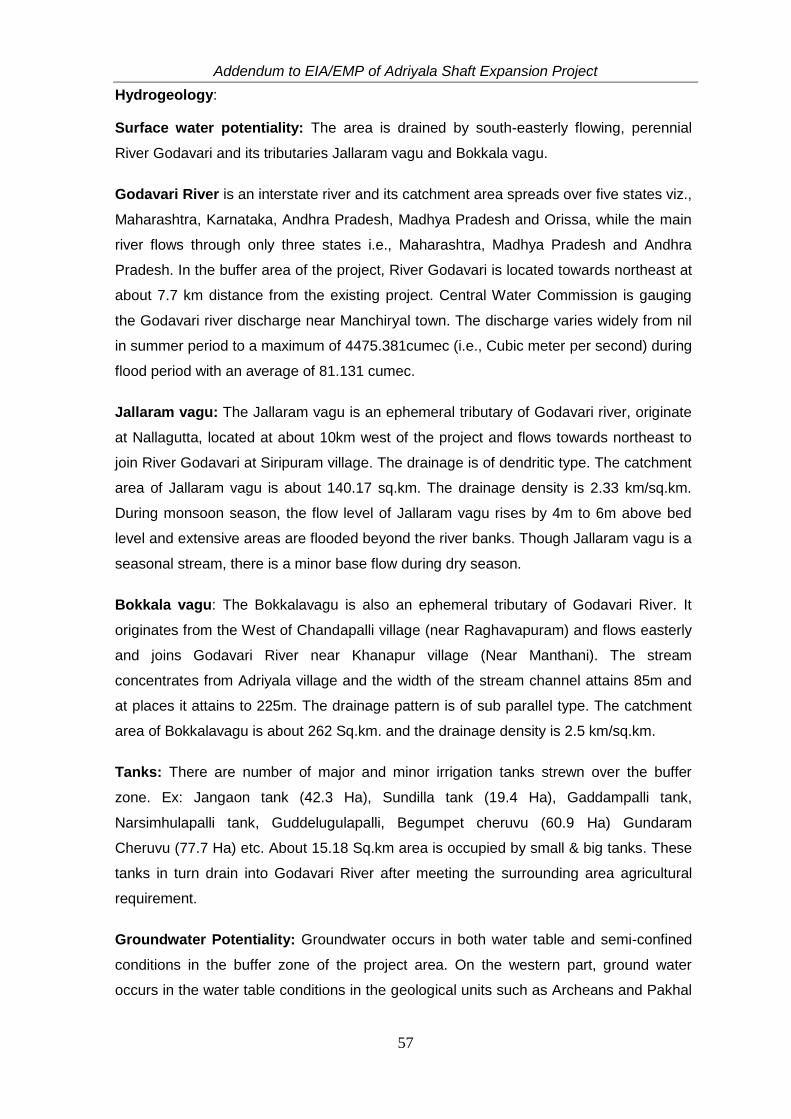
Addendum to EIA/EMP of Adriyala Shaft Expansion Project
57
Hydrogeology:
Surface water potentiality: The area is drained by south-easterly flowing, perennial
River Godavari and its tributaries Jallaram vagu and Bokkala vagu.
Godavari River is an interstate river and its catchment area spreads over five states viz.,
Maharashtra, Karnataka, Andhra Pradesh, Madhya Pradesh and Orissa, while the main
river flows through only three states i.e., Maharashtra, Madhya Pradesh and Andhra
Pradesh. In the buffer area of the project, River Godavari is located towards northeast at
about 7.7 km distance from the existing project. Central Water Commission is gauging
the Godavari river discharge near Manchiryal town. The discharge varies widely from nil
in summer period to a maximum of 4475.381cumec (i.e., Cubic meter per second) during
flood period with an average of 81.131 cumec.
Jallaram vagu: The Jallaram vagu is an ephemeral tributary of Godavari river, originate
at Nallagutta, located at about 10km west of the project and flows towards northeast to
join River Godavari at Siripuram village. The drainage is of dendritic type. The catchment
area of Jallaram vagu is about 140.17 sq.km. The drainage density is 2.33 km/sq.km.
During monsoon season, the flow level of Jallaram vagu rises by 4m to 6m above bed
level and extensive areas are flooded beyond the river banks. Though Jallaram vagu is a
seasonal stream, there is a minor base flow during dry season.
Bokkala vagu: The Bokkalavagu is also an ephemeral tributary of Godavari River. It
originates from the West of Chandapalli village (near Raghavapuram) and flows easterly
and joins Godavari River near Khanapur village (Near Manthani). The stream
concentrates from Adriyala village and the width of the stream channel attains 85m and
at places it attains to 225m. The drainage pattern is of sub parallel type. The catchment
area of Bokkalavagu is about 262 Sq.km. and the drainage density is 2.5 km/sq.km.
Tanks: There are number of major and minor irrigation tanks strewn over the buffer
zone. Ex: Jangaon tank (42.3 Ha), Sundilla tank (19.4 Ha), Gaddampalli tank,
Narsimhulapalli tank, Guddelugulapalli, Begumpet cheruvu (60.9 Ha) Gundaram
Cheruvu (77.7 Ha) etc. About 15.18 Sq.km area is occupied by small & big tanks. These
tanks in turn drain into Godavari River after meeting the surrounding area agricultural
requirement.
Groundwater Potentiality: Groundwater occurs in both water table and semi-confined
conditions in the buffer zone of the project area. On the western part, ground water
occurs in the water table conditions in the geological units such as Archeans and Pakhal
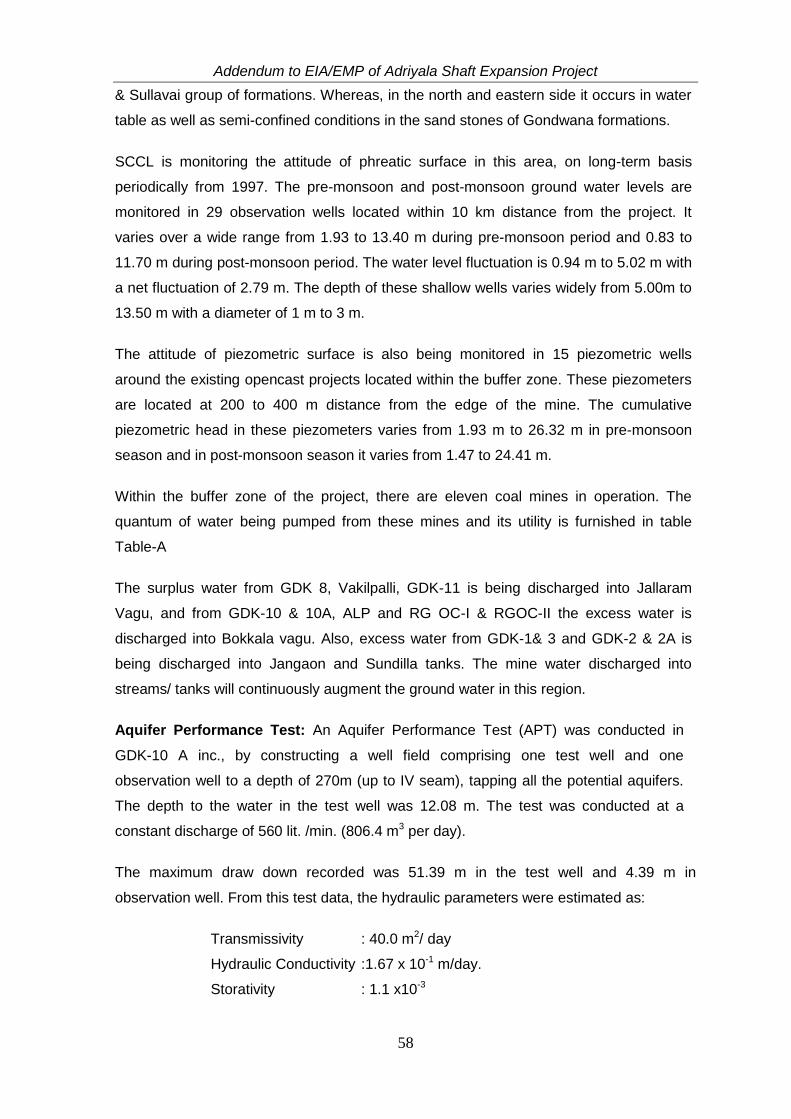
Addendum to EIA/EMP of Adriyala Shaft Expansion Project
58
& Sullavai group of formations. Whereas, in the north and eastern side it occurs in water
table as well as semi-confined conditions in the sand stones of Gondwana formations.
SCCL is monitoring the attitude of phreatic surface in this area, on long-term basis
periodically from 1997. The pre-monsoon and post-monsoon ground water levels are
monitored in 29 observation wells located within 10 km distance from the project. It
varies over a wide range from 1.93 to 13.40 m during pre-monsoon period and 0.83 to
11.70 m during post-monsoon period. The water level fluctuation is 0.94 m to 5.02 m with
a net fluctuation of 2.79 m. The depth of these shallow wells varies widely from 5.00m to
13.50 m with a diameter of 1 m to 3 m.
The attitude of piezometric surface is also being monitored in 15 piezometric wells
around the existing opencast projects located within the buffer zone. These piezometers
are located at 200 to 400 m distance from the edge of the mine. The cumulative
piezometric head in these piezometers varies from 1.93 m to 26.32 m in pre-monsoon
season and in post-monsoon season it varies from 1.47 to 24.41 m.
Within the buffer zone of the project, there are eleven coal mines in operation. The
quantum of water being pumped from these mines and its utility is furnished in table
Table-A
The surplus water from GDK 8, Vakilpalli, GDK-11 is being discharged into Jallaram
Vagu, and from GDK-10 & 10A, ALP and RG OC-I & RGOC-II the excess water is
discharged into Bokkala vagu. Also, excess water from GDK-1& 3 and GDK-2 & 2A is
being discharged into Jangaon and Sundilla tanks. The mine water discharged into
streams/ tanks will continuously augment the ground water in this region.
Aquifer Performance Test: An Aquifer Performance Test (APT) was conducted in
GDK-10 A inc., by constructing a well field comprising one test well and one
observation well to a depth of 270m (up to IV seam), tapping all the potential aquifers.
The depth to the water in the test well was 12.08 m. The test was conducted at a
constant discharge of 560 lit. /min. (806.4 m3 per day).
The maximum draw down recorded was 51.39 m in the test well and 4.39 m in
observation well. From this test data, the hydraulic parameters were estimated as:
Transmissivity : 40.0 m2/ day
Hydraulic Conductivity :1.67 x 10⁻¹ m/day.
Storativity : 1.1 x10⁻³
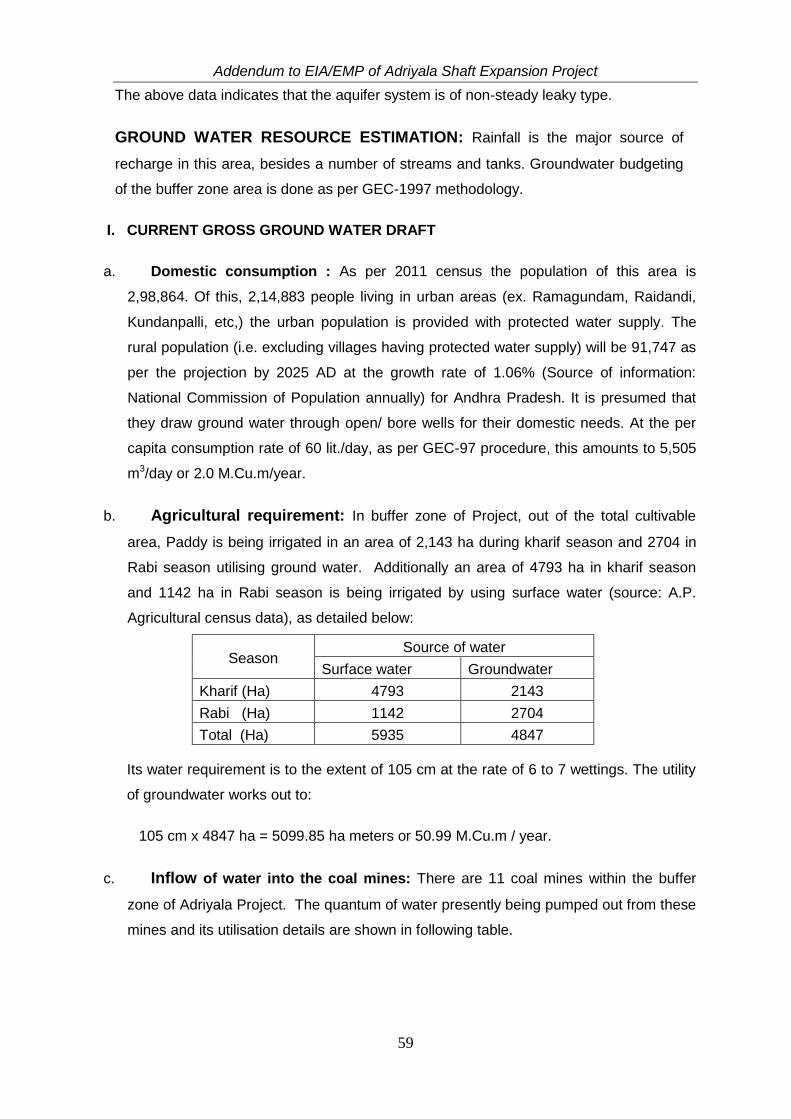
Addendum to EIA/EMP of Adriyala Shaft Expansion Project
59
The above data indicates that the aquifer system is of non-steady leaky type.
GROUND WATER RESOURCE ESTIMATION: Rainfall is the major source of
recharge in this area, besides a number of streams and tanks. Groundwater budgeting
of the buffer zone area is done as per GEC-1997 methodology.
I. CURRENT GROSS GROUND WATER DRAFT
a. Domestic consumption : As per 2011 census the population of this area is
2,98,864. Of this, 2,14,883 people living in urban areas (ex. Ramagundam, Raidandi,
Kundanpalli, etc,) the urban population is provided with protected water supply. The
rural population (i.e. excluding villages having protected water supply) will be 91,747 as
per the projection by 2025 AD at the growth rate of 1.06% (Source of information:
National Commission of Population annually) for Andhra Pradesh. It is presumed that
they draw ground water through open/ bore wells for their domestic needs. At the per
capita consumption rate of 60 lit./day, as per GEC-97 procedure, this amounts to 5,505
m3/day or 2.0 M.Cu.m/year.
b. Agricultural requirement: In buffer zone of Project, out of the total cultivable
area, Paddy is being irrigated in an area of 2,143 ha during kharif season and 2704 in
Rabi season utilising ground water. Additionally an area of 4793 ha in kharif season
and 1142 ha in Rabi season is being irrigated by using surface water (source: A.P.
Agricultural census data), as detailed below:
Season Source of water
Surface water Groundwater
Kharif (Ha) 4793 2143
Rabi (Ha) 1142 2704
Total (Ha) 5935 4847
Its water requirement is to the extent of 105 cm at the rate of 6 to 7 wettings. The utility
of groundwater works out to:
105 cm x 4847 ha = 5099.85 ha meters or 50.99 M.Cu.m / year.
c. Inflow of water into the coal mines: There are 11 coal mines within the buffer
zone of Adriyala Project. The quantum of water presently being pumped out from these
mines and its utilisation details are shown in following table.
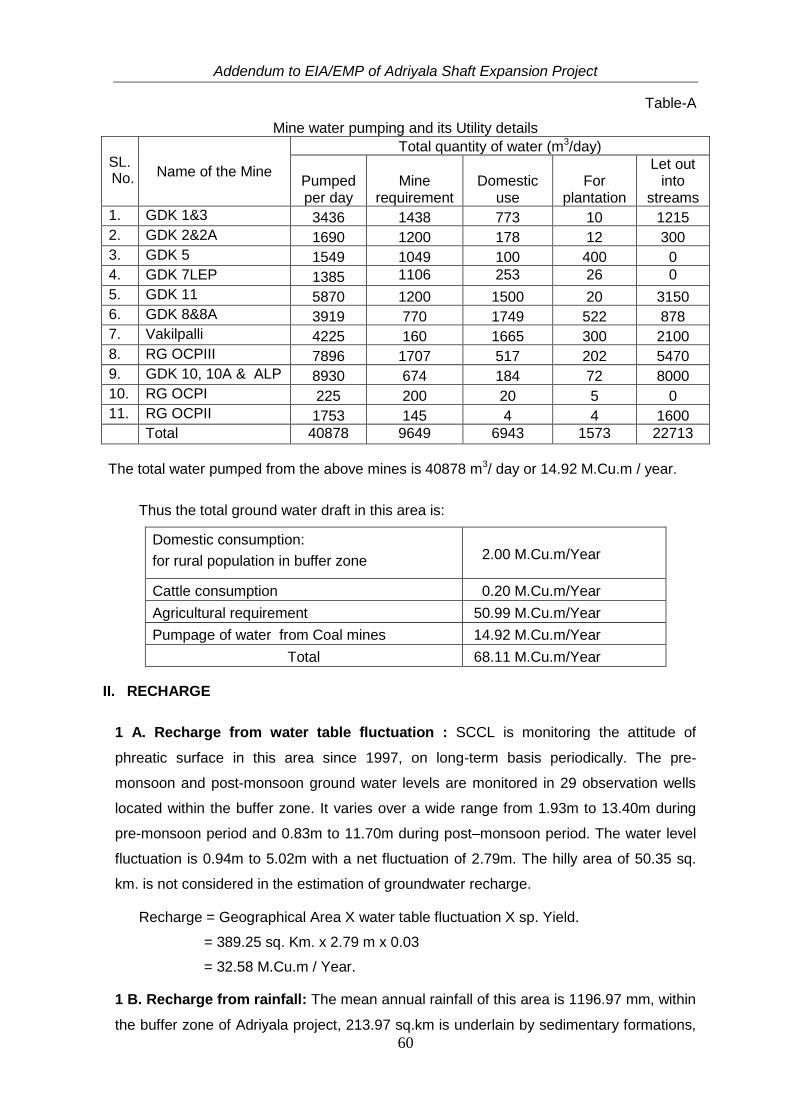
Addendum to EIA/EMP of Adriyala Shaft Expansion Project
60
Table-A
Mine water pumping and its Utility details
SL. No. Name of the Mine
Total quantity of water (m3/day)
Pumped per day
Mine requirement
Domestic use
For plantation
Let out into
streams
1. GDK 1&3 3436 1438 773 10 1215
2. GDK 2&2A 1690 1200 178 12 300
3. GDK 5 1549 1049 100 400 0
4. GDK 7LEP 1385 1106 253 26 0
5. GDK 11 5870 1200 1500 20 3150
6. GDK 8&8A 3919 770 1749 522 878
7. Vakilpalli 4225 160 1665 300 2100
8. RG OCPIII 7896 1707 517 202 5470
9. GDK 10, 10A & ALP 8930 674 184 72 8000
10. RG OCPI 225 200 20 5 0
11. RG OCPII 1753 145 4 4 1600
Total 40878 9649 6943 1573 22713
The total water pumped from the above mines is 40878 m3/ day or 14.92 M.Cu.m / year.
Thus the total ground water draft in this area is:
Domestic consumption:
for rural population in buffer zone 2.00 M.Cu.m/Year
Cattle consumption 0.20 M.Cu.m/Year
Agricultural requirement 50.99 M.Cu.m/Year
Pumpage of water from Coal mines 14.92 M.Cu.m/Year
Total 68.11 M.Cu.m/Year
II. RECHARGE
1 A. Recharge from water table fluctuation : SCCL is monitoring the attitude of
phreatic surface in this area since 1997, on long-term basis periodically. The pre-
monsoon and post-monsoon ground water levels are monitored in 29 observation wells
located within the buffer zone. It varies over a wide range from 1.93m to 13.40m during
pre-monsoon period and 0.83m to 11.70m during post–monsoon period. The water level
fluctuation is 0.94m to 5.02m with a net fluctuation of 2.79m. The hilly area of 50.35 sq.
km. is not considered in the estimation of groundwater recharge.
Recharge = Geographical Area X water table fluctuation X sp. Yield.
= 389.25 sq. Km. x 2.79 m x 0.03
= 32.58 M.Cu.m / Year.
1 B. Recharge from rainfall: The mean annual rainfall of this area is 1196.97 mm, within
the buffer zone of Adriyala project, 213.97 sq.km is underlain by sedimentary formations,
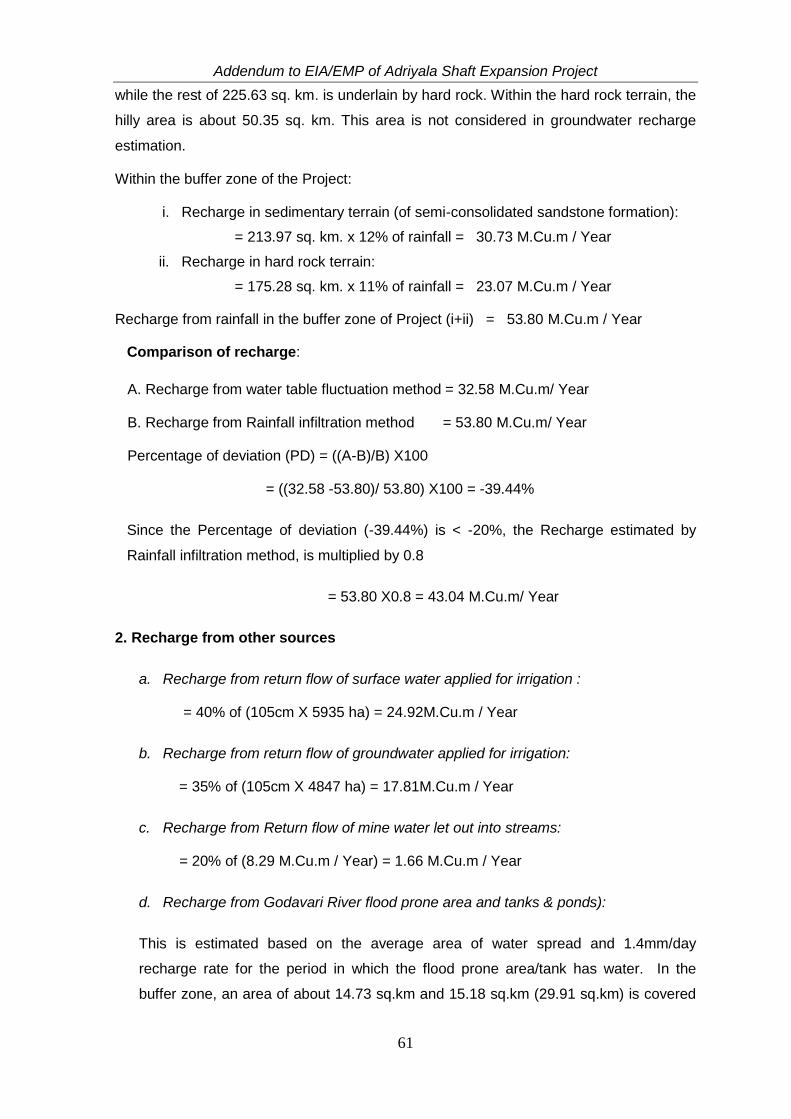
Addendum to EIA/EMP of Adriyala Shaft Expansion Project
61
while the rest of 225.63 sq. km. is underlain by hard rock. Within the hard rock terrain, the
hilly area is about 50.35 sq. km. This area is not considered in groundwater recharge
estimation.
Within the buffer zone of the Project:
i. Recharge in sedimentary terrain (of semi-consolidated sandstone formation):
= 213.97 sq. km. x 12% of rainfall = 30.73 M.Cu.m / Year
ii. Recharge in hard rock terrain:
= 175.28 sq. km. x 11% of rainfall = 23.07 M.Cu.m / Year
Recharge from rainfall in the buffer zone of Project (i+ii) = 53.80 M.Cu.m / Year
Comparison of recharge:
A. Recharge from water table fluctuation method = 32.58 M.Cu.m/ Year
B. Recharge from Rainfall infiltration method = 53.80 M.Cu.m/ Year
Percentage of deviation (PD) = ((A-B)/B) X100
= ((32.58 -53.80)/ 53.80) X100 = -39.44%
Since the Percentage of deviation (-39.44%) is < -20%, the Recharge estimated by
Rainfall infiltration method, is multiplied by 0.8
= 53.80 X0.8 = 43.04 M.Cu.m/ Year
2. Recharge from other sources
a. Recharge from return flow of surface water applied for irrigation :
= 40% of (105cm X 5935 ha) = 24.92M.Cu.m / Year
b. Recharge from return flow of groundwater applied for irrigation:
= 35% of (105cm X 4847 ha) = 17.81M.Cu.m / Year
c. Recharge from Return flow of mine water let out into streams:
= 20% of (8.29 M.Cu.m / Year) = 1.66 M.Cu.m / Year
d. Recharge from Godavari River flood prone area and tanks & ponds):
This is estimated based on the average area of water spread and 1.4mm/day
recharge rate for the period in which the flood prone area/tank has water. In the
buffer zone, an area of about 14.73 sq.km and 15.18 sq.km (29.91 sq.km) is covered
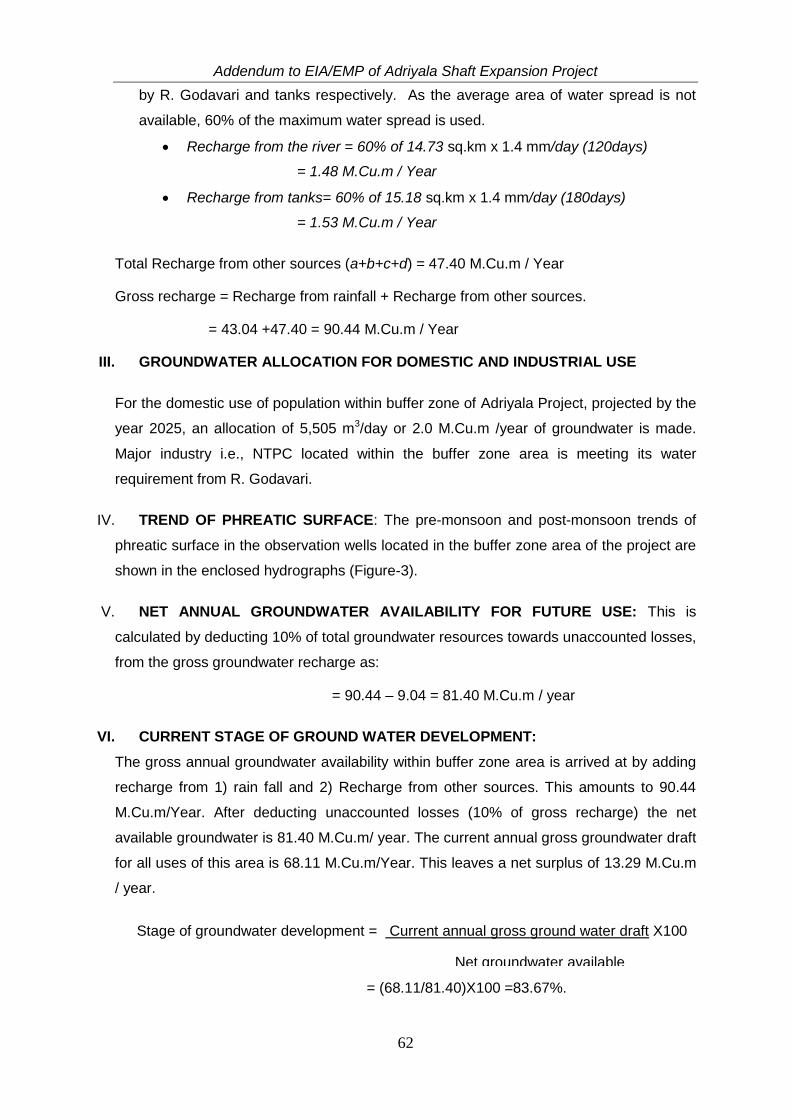
Addendum to EIA/EMP of Adriyala Shaft Expansion Project
62
by R. Godavari and tanks respectively. As the average area of water spread is not
available, 60% of the maximum water spread is used.
Recharge from the river = 60% of 14.73 sq.km x 1.4 mm/day (120days)
= 1.48 M.Cu.m / Year
Recharge from tanks= 60% of 15.18 sq.km x 1.4 mm/day (180days)
= 1.53 M.Cu.m / Year
Total Recharge from other sources (a+b+c+d) = 47.40 M.Cu.m / Year
Gross recharge = Recharge from rainfall + Recharge from other sources.
= 43.04 +47.40 = 90.44 M.Cu.m / Year
III. GROUNDWATER ALLOCATION FOR DOMESTIC AND INDUSTRIAL USE
For the domestic use of population within buffer zone of Adriyala Project, projected by the
year 2025, an allocation of 5,505 m3/day or 2.0 M.Cu.m /year of groundwater is made.
Major industry i.e., NTPC located within the buffer zone area is meeting its water
requirement from R. Godavari.
IV. TREND OF PHREATIC SURFACE: The pre-monsoon and post-monsoon trends of
phreatic surface in the observation wells located in the buffer zone area of the project are
shown in the enclosed hydrographs (Figure-3).
V. NET ANNUAL GROUNDWATER AVAILABILITY FOR FUTURE USE: This is
calculated by deducting 10% of total groundwater resources towards unaccounted losses,
from the gross groundwater recharge as:
= 90.44 – 9.04 = 81.40 M.Cu.m / year
VI. CURRENT STAGE OF GROUND WATER DEVELOPMENT:
The gross annual groundwater availability within buffer zone area is arrived at by adding
recharge from 1) rain fall and 2) Recharge from other sources. This amounts to 90.44
M.Cu.m/Year. After deducting unaccounted losses (10% of gross recharge) the net
available groundwater is 81.40 M.Cu.m/ year. The current annual gross groundwater draft
for all uses of this area is 68.11 M.Cu.m/Year. This leaves a net surplus of 13.29 M.Cu.m
/ year.
= (68.11/81.40)X100 =83.67%.
Stage of groundwater development = Current annual gross ground water draft X100
Net groundwater available
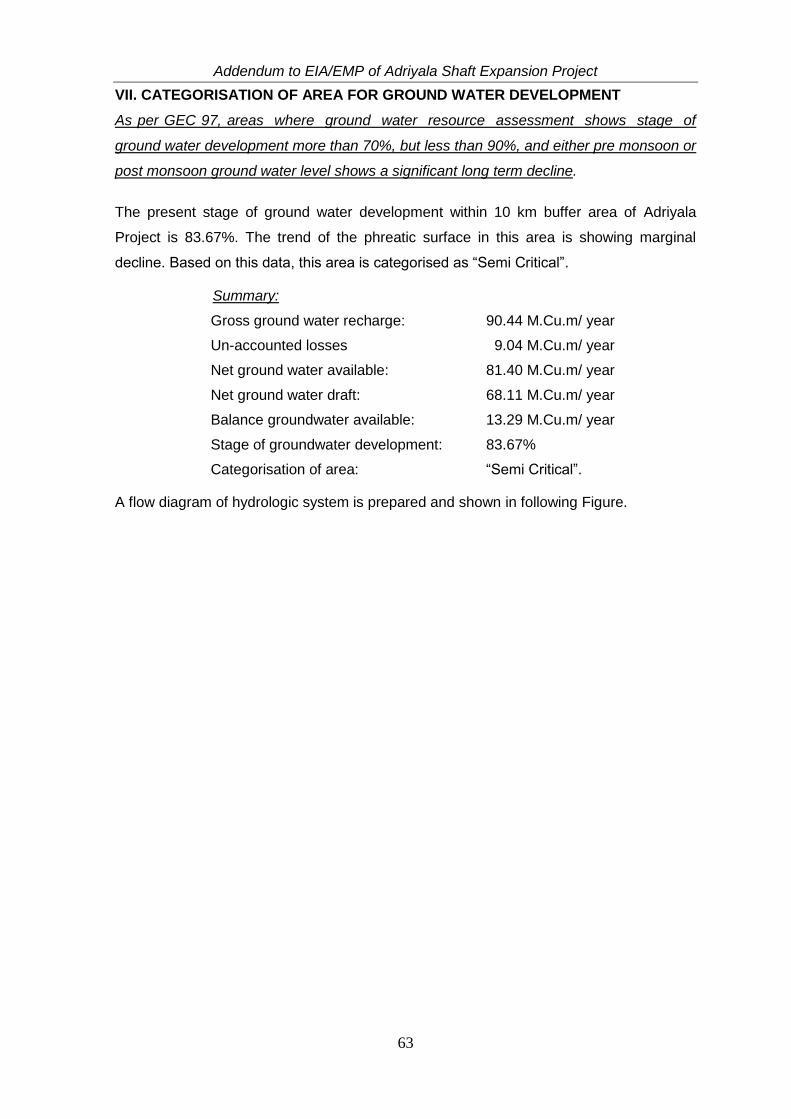
Addendum to EIA/EMP of Adriyala Shaft Expansion Project
63
VII. CATEGORISATION OF AREA FOR GROUND WATER DEVELOPMENT
As per GEC 97, areas where ground water resource assessment shows stage of
ground water development more than 70%, but less than 90%, and either pre monsoon or
post monsoon ground water level shows a significant long term decline.
The present stage of ground water development within 10 km buffer area of Adriyala
Project is 83.67%. The trend of the phreatic surface in this area is showing marginal
decline. Based on this data, this area is categorised as “Semi Critical”.
Summary:
Gross ground water recharge: 90.44 M.Cu.m/ year
Un-accounted losses 9.04 M.Cu.m/ year
Net ground water available: 81.40 M.Cu.m/ year
Net ground water draft: 68.11 M.Cu.m/ year
Balance groundwater available: 13.29 M.Cu.m/ year
Stage of groundwater development: 83.67%
Categorisation of area: “Semi Critical”.
A flow diagram of hydrologic system is prepared and shown in following Figure.
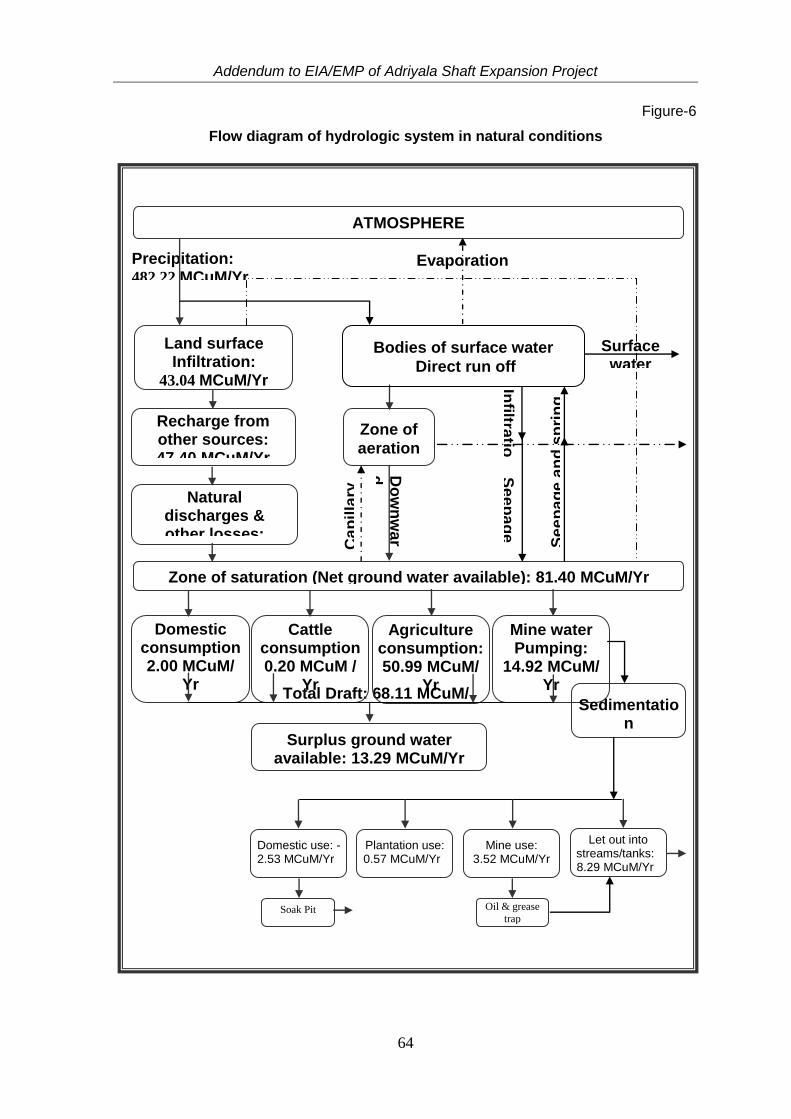
Addendum to EIA/EMP of Adriyala Shaft Expansion Project
64
Figure-6
Flow diagram of hydrologic system in natural conditions
Precipitation: 482.22 MCuM/Yr
Zone of
aeration
Cap
illa
ry
ris
e
Total Draft: 68.11 MCuM/ Yr
Let out into streams/tanks: 8.29 MCuM/Yr
Surface water
out flow D
ow
nw
ar
d
Pe
rco
lati
on
Evaporation
Domestic consumption 2.00 MCuM/
Yr
Surplus ground water available: 13.29 MCuM/Yr
Land surface Infiltration:
43.04 MCuM/Yr
Bodies of surface water
Direct run off
Zone of saturation (Net ground water available): 81.40 MCuM/Yr
ATMOSPHERE
Natural discharges & other losses:
(-) 9.04 MCuM/Yr
Recharge from other sources: 47.40 MCuM/Yr
Se
ep
ag
e S
ee
pag
e a
nd
sp
rin
g
flo
w
Infiltra
tio
n
Cattle consumption 0.20 MCuM /
Yr
Agriculture consumption: 50.99 MCuM/
Yr
Mine water Pumping:
14.92 MCuM/ Yr
Sedimentation
Tank
Mine use: 3.52 MCuM/Yr
Domestic use: -2.53 MCuM/Yr
Plantation use: 0.57 MCuM/Yr
Oil & grease
trap Soak Pit
Addendum to EIA/EMP of Adriyala Shaft Expansion Project
65
3. Ground water seepage from the aquifers into I seam workings:
In view of annexing block A& B property of GDK-10 Inc.(i.e., rise side) to RG OC-I, the
recharging area of the aquifers exposing in Adriyala LW project is already excavated in
RGOC-I Project. Besides this, the goaf areas of already excavated longwall panels of
GDK -10A Inc. (i.e., located rise side of Adriyala LW-1 panel) has also reduced the
aquifer storage significantly. Hence I seam roof aquifer is being recharged only lateral
conductivity. Considering the stabilized inflow of 450 gpm from 3A to 3E longwall goafs, it
is opined that the clay horizon separating Barakar Fm. and Barren measures retarding
the extension of cracks resulted the caving of roof rocks. Hence, the inflow of water into
the Adriyala LW was calculated by considering the thickness from I seam roof to BM/B
(i.e., 45m).
Average depth to I seam =445m (40m aquicludes/aquitards) Depth of water level = 15m Hydraulic head (h) up to I seam 45m Av. Transmissivity (KD) = 40 m2/day Hydraulic conductivity upto I seam is 2.67 x 10⁻¹ m/day. Av. Storativity = 1.1 x 10⁻³
Rate of mine expansion R = 2500 m2/day Ground water flow into I seam workings: Q1 = SRh = 1.1x 10-3 x 2500 x 45 = 123.75 m3/day. Q2= 2πKh2/ W(Uo)
U = SR/4πKD = 5.47 x 10⁻³ Hence, W(U0) = 1.869
= (2 x 3.14x 2.67 x 10-1 x45 x 45)/ (1.869) Q2 = 3395.45 m3/day. Q = Q1 +Q2 = 123.75 + 3395.45= 3519.2 m3/day. Q = 2445 GPM
IMPACT ON SURFACE WATER REGIME:
The Bokkala vagu and SRSP canal are flowing adjacent and above the mine take area.
Were ever the Bokkala vagu and SRSP canal crossing the mine take area will be diverted
as per the recommendations suggested by ICAD department. While diverting the stream
following precautions viz, prevailing stream gradient will be maintained, stream catchment
will not be disturbed etc,.
Addendum to EIA/EMP of Adriyala Shaft Expansion Project
66
The excess mine seepage water will be pumped out & discharged into settling tanks
where the coal fines will be settled and only clear water will be discharged into the
Bokkalavagu and will be utilized in irrigation purposes for the downstream users.
IMPACT ON GROUNDWATER REGIME
The impact of mining on local ground water regime depends on various parameters like
method of mining, depth and rate of expansion, ground water recharge and hydraulic
parameters of the aquifers system of the area. In underground mining, the aquifer lying in
the immediate roof of the working coal seam contributes major inflow and gets affected.
Due to the presence of a number of impermeable strata overlying the working seams
(such as clay, shale and coal beds), the impact on the phreatic aquifer at shallow depth
will be negligible.
In view of wider and longer longwall panels proposed in Adriyala Longwall project,
detailed and comprehensive investigations were carried out in the project. As advised by
CSIRO, Australia insitu permeability and insitu stress measurements were carried in this
project. Various numerical modelling studies were also carried out for prediction of
subsidence and its extent. The studies reveled that the subsidence will not propagate to
the surface. Hence the aquifer system will not get affected due to mining.
The phreatic level varies in pre-monsoon season from 1.93m to 13.40m and in post-
monsoon it varies from 0.83m to 11.70m. In this area, the mine workings progressed far
beyond the locations of these observation wells. Due to sand stowing of the void space,
the ground water levels are stabilized.
The attitude of phreatic surface is being monitored in 53 phreatic wells in the buffer zone
area for the last 15 years. Also the piezometric surface is being monitored 21 specifically
constructed piezometric wells in the buffer zone. These wells are located at a distance of
100m to 7.5 km from the coal mines in operation. This monitoring is aimed at studying the
impact of coal mining on ground water regime, if any.
Mitigative measures:
As per the Groundwater Resource Estimation, the present stage of groundwater
development is 83.67% and the area is categorised as “semi critical”.
The total groundwater draft in the buffer area is about 68.11 M.Cu.m/Year. Of this, from
mines it is about 14.92 M.Cu.m/Year and cultivation requirements is about 50.99
M.Cu.m/Year. From the agriculture census records, it is observed that in the buffer area
of the project, the land irrigated during 2006-2007 with ground water was about 1126 ha
and during 2011-12 land irrigated by ground water is 4847 ha. This resulted increase in
Addendum to EIA/EMP of Adriyala Shaft Expansion Project
67
ground water draft from about 13.51 M.Cu.m/year to 50.99 M.Cu.m/year. In the same
period the pumping of water from coal mines in the buffer area has come down from
26.45 M.Cu.m/year to 17.91 M.Cu.m/year. If the same rate of ground water draft towards
agricultural requirement continues, it may lead to fall in critical category.
Keeping in view of the above and consciousness towards corporate social responsibility,
it is suggested to take up ground water recharge measures to the tune of
20M.Cu.m/Year. Most of the coalmines are located on the eastern side of the buffer
zone. Hence, construction of artificial recharge structures for augmenting ground water
recharge is to be taken up in the western side of the buffer zone. The roof top water
harvesting is to be carried out in SCCL colonies where ever the large extent of roof tops
are available viz., Office buildings, community recreation centres, housing complexes
etc.,. It is also suggested that, awareness on optimum utilisation of groundwater resource
among the people has to be inculcated by enhancing their knowledge on consumptive
use of different irrigation methods.
While diverting the Bokkala vagu and SRSP canals which are flowing adjacent and above
the mine take area. A comprehensive study has to be made for any diversion of stream or
nallahs over mine take areas. The stream alignment, gradients are to be maintained and
simultaneously the total catchment water has to flow through the proposed diversion.
While diverting the streams or Nallahs SCCL will adhere to the recommendations
suggested by ICAD department.
The attitude of phreatic surface is being monitored in 53 observation wells in the buffer
zone of projects area for the last 17 years. These wells are located at a distance of 500 m
to 6 km from the existing coal mines. Around the existing open cast coal mines in the
buffer area, 21 Piezometric wells were constructed at a distance of 50 to 400m from the
edge of the mines. In these wells the attitude of piezometric surface is being monitored on
long term basis since 2009. This monitoring is aimed at studying the impact of coal
mining on ground water regime, if any, so that measures to mitigate it can be
implemented. As on date, no considerable impact of coal mining on ground water regime
is recorded.
Conclusion: From the long term monitoring of Phreatic and Piezometric levels at various
distances from existing coal mines, it is observed that, there is no considerable impact of
mining on water regime in this area.
Based on hydrogeological investigations carried out at various coal mines and from the
present studies, it is suggested to take up ground water recharge measures to bring back
Addendum to EIA/EMP of Adriyala Shaft Expansion Project
68
the area in to “safe category”. For this, suitable water conservation measures and artificial
groundwater recharge methods shall be taken up with the advice of A.P. State Ground
Water Department.
Presently, the surplus water from the existing mine in the buffer area is being discharged
into nearby streams / tanks, which is being utilised by the local people to meet their
agricultural needs which in turn augment the recharge of ground water regime of the
area.
In view of the above, it can be inferred that there will be no further impact on water regime
in this area. However, the monitoring of phreatic and piezometric levels around the
existing and proposed mines periodically on long term basis will be continued to observe
the mining impact on ground water if any.
The following mitigative measures for water pollution control are proposed:
Normally the mine discharge water will be re-utilized for dust suppression, drinking,
domestic, washing at workshop, green belt development, etc. the surplus water will
be discharged only after necessary treatment.
There will not be any additional diversion proposal in the expansion operation. The
diverted Bokkala vagu will be confluence in the original course outside the mine
boundary.
Garland drains along the boundary of the panels will be made and the catchments
will be joined to the Bokkala Vagu.
Well drainage system was maintained at septic tank, soak pits followed by oxidation
pond. The quality of the treated effluent from the oxidation pond is regularly
monitored, which will finally joins the vagu flowing adjacent to it. Regular cleaning of
septic tanks soak pits and periodical cleaning of sludge from the natural oxidation
pond taken up for effective function of the same.
The effluent from the workshop will be treated in the Effluent Treatment Plant (Oil &
Grease Trap)
Rain water harvesting measures will be taken to augment the ground water in
addition to the summer storage tank existing at RG OC-II Project.
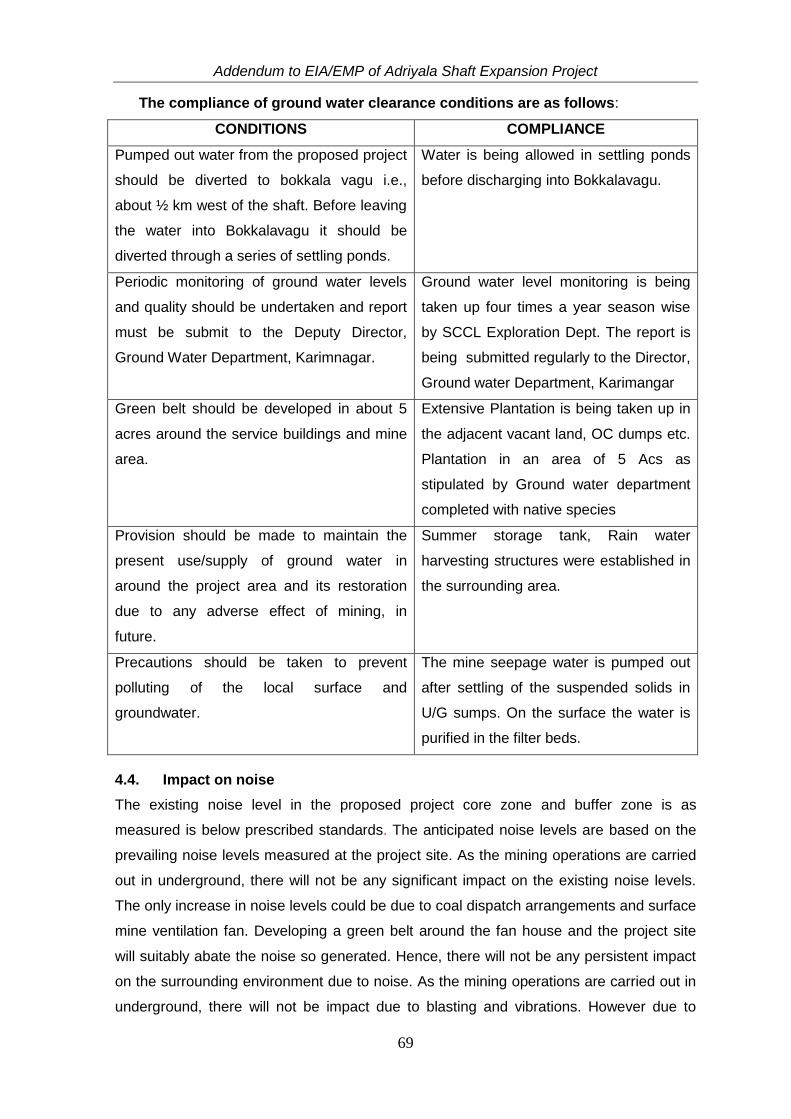
Addendum to EIA/EMP of Adriyala Shaft Expansion Project
69
The compliance of ground water clearance conditions are as follows:
CONDITIONS COMPLIANCE
Pumped out water from the proposed project
should be diverted to bokkala vagu i.e.,
about ½ km west of the shaft. Before leaving
the water into Bokkalavagu it should be
diverted through a series of settling ponds.
Water is being allowed in settling ponds
before discharging into Bokkalavagu.
Periodic monitoring of ground water levels
and quality should be undertaken and report
must be submit to the Deputy Director,
Ground Water Department, Karimnagar.
Ground water level monitoring is being
taken up four times a year season wise
by SCCL Exploration Dept. The report is
being submitted regularly to the Director,
Ground water Department, Karimangar
Green belt should be developed in about 5
acres around the service buildings and mine
area.
Extensive Plantation is being taken up in
the adjacent vacant land, OC dumps etc.
Plantation in an area of 5 Acs as
stipulated by Ground water department
completed with native species
Provision should be made to maintain the
present use/supply of ground water in
around the project area and its restoration
due to any adverse effect of mining, in
future.
Summer storage tank, Rain water
harvesting structures were established in
the surrounding area.
Precautions should be taken to prevent
polluting of the local surface and
groundwater.
The mine seepage water is pumped out
after settling of the suspended solids in
U/G sumps. On the surface the water is
purified in the filter beds.
4.4. Impact on noise
The existing noise level in the proposed project core zone and buffer zone is as
measured is below prescribed standards. The anticipated noise levels are based on the
prevailing noise levels measured at the project site. As the mining operations are carried
out in underground, there will not be any significant impact on the existing noise levels.
The only increase in noise levels could be due to coal dispatch arrangements and surface
mine ventilation fan. Developing a green belt around the fan house and the project site
will suitably abate the noise so generated. Hence, there will not be any persistent impact
on the surrounding environment due to noise. As the mining operations are carried out in
underground, there will not be impact due to blasting and vibrations. However due to
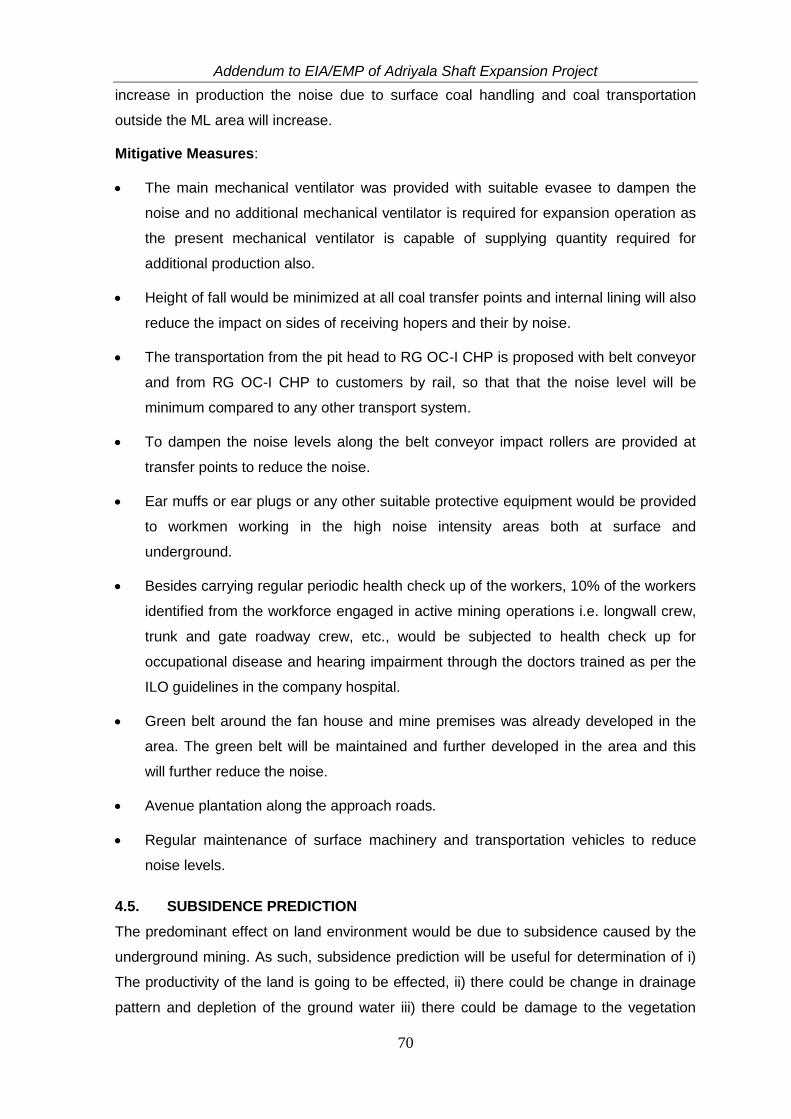
Addendum to EIA/EMP of Adriyala Shaft Expansion Project
70
increase in production the noise due to surface coal handling and coal transportation
outside the ML area will increase.
Mitigative Measures:
The main mechanical ventilator was provided with suitable evasee to dampen the
noise and no additional mechanical ventilator is required for expansion operation as
the present mechanical ventilator is capable of supplying quantity required for
additional production also.
Height of fall would be minimized at all coal transfer points and internal lining will also
reduce the impact on sides of receiving hopers and their by noise.
The transportation from the pit head to RG OC-I CHP is proposed with belt conveyor
and from RG OC-I CHP to customers by rail, so that that the noise level will be
minimum compared to any other transport system.
To dampen the noise levels along the belt conveyor impact rollers are provided at
transfer points to reduce the noise.
Ear muffs or ear plugs or any other suitable protective equipment would be provided
to workmen working in the high noise intensity areas both at surface and
underground.
Besides carrying regular periodic health check up of the workers, 10% of the workers
identified from the workforce engaged in active mining operations i.e. longwall crew,
trunk and gate roadway crew, etc., would be subjected to health check up for
occupational disease and hearing impairment through the doctors trained as per the
ILO guidelines in the company hospital.
Green belt around the fan house and mine premises was already developed in the
area. The green belt will be maintained and further developed in the area and this
will further reduce the noise.
Avenue plantation along the approach roads.
Regular maintenance of surface machinery and transportation vehicles to reduce
noise levels.
4.5. SUBSIDENCE PREDICTION
The predominant effect on land environment would be due to subsidence caused by the
underground mining. As such, subsidence prediction will be useful for determination of i)
The productivity of the land is going to be effected, ii) there could be change in drainage
pattern and depletion of the ground water iii) there could be damage to the vegetation

Addendum to EIA/EMP of Adriyala Shaft Expansion Project
71
over the mine take area iv) Fire may occur in coal seams due to the leakage of air
through cracks formed due to subsidence causing air pollution.
However, it is possible to minimize the damage to the surface land by careful planning
and design of the underground workings as well as maximizing the coal recovery. In this
connection, during 2004, the subsidence prediction study using 3D Numerical Modeling
was carried for the production capacity of 2.144 MTPA in the block area of 340 Ha. As
per the study, the mining operations were divided into seven blocks of 5 year interval over
the life of 35 years.
As the production capacity is proposed to increase from the 2.144 MTPA to 3.14 MTPA,
the subsidence prediction study using 3D Numerical Modeling is carried for the same
mining block with the production capacity of 3.14 MTPA. As the rated capacity increased,
the time blocks were reduced from seven to five. The details of the study and impact of
the subsidence on various surface structures for the rated capacity 2.144 MTPA Vs 3.14
MTPA is presented herewith:
Objective: To evaluate the subsidence and the other effects on surface features and
village due to working 250m face length Longwall panels in Adriyala Shaft Project at RG
III area.
Geology: The proposed Adriyala Shaft Project extends from the north of Bokkala vagu
up to Fault F4. The regional strike of the deposit is more or less NNW-SSE. The
gradient of beds varies between 1 in 6.00 to 1 in 7.8. The block is virgin and contains
seven seams, viz., IA, I, II, IIIB, IIIA, III and IV in descending order. The depth of bottom-
most IV seam varies from 406 m to 644 m. Out of the above seven seams, only four
seams have attained workable thickness and are persistent. The generalized sequence
of coal seams, their parting and thickness in the proposed block is given in Table 1.
Table 1: Stratigraphic Succession of the Sub Block
Sl. No. Seam/Parting Thickness
1. I-Seam 5.64
2. Parting 19.53
3. II-Seam 3.278
4. Parting 64.51
5. III-Seam 9.40
6. Parting 6.31
7. IV-Seam 3.66
Geo-mining parameters for the seams of the block:
Sl. No.
Seam
Depth (m) Thickness (m) Avg. Thic-kness (m)
Roof Floor Min. Max. Min.*** Max.**
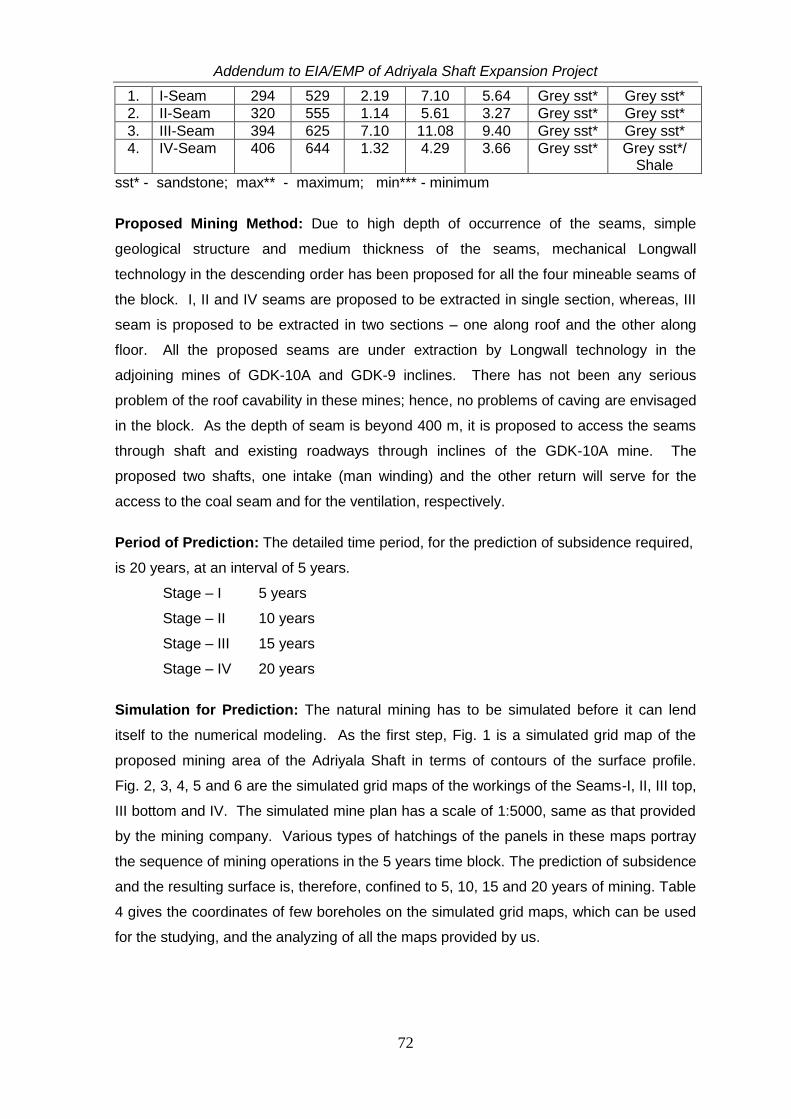
Addendum to EIA/EMP of Adriyala Shaft Expansion Project
72
1. I-Seam 294 529 2.19 7.10 5.64 Grey sst* Grey sst*
2. II-Seam 320 555 1.14 5.61 3.27 Grey sst* Grey sst*
3. III-Seam 394 625 7.10 11.08 9.40 Grey sst* Grey sst*
4. IV-Seam 406 644 1.32 4.29 3.66 Grey sst* Grey sst*/ Shale
sst* - sandstone; max** - maximum; min*** - minimum
Proposed Mining Method: Due to high depth of occurrence of the seams, simple
geological structure and medium thickness of the seams, mechanical Longwall
technology in the descending order has been proposed for all the four mineable seams of
the block. I, II and IV seams are proposed to be extracted in single section, whereas, III
seam is proposed to be extracted in two sections – one along roof and the other along
floor. All the proposed seams are under extraction by Longwall technology in the
adjoining mines of GDK-10A and GDK-9 inclines. There has not been any serious
problem of the roof cavability in these mines; hence, no problems of caving are envisaged
in the block. As the depth of seam is beyond 400 m, it is proposed to access the seams
through shaft and existing roadways through inclines of the GDK-10A mine. The
proposed two shafts, one intake (man winding) and the other return will serve for the
access to the coal seam and for the ventilation, respectively.
Period of Prediction: The detailed time period, for the prediction of subsidence required,
is 20 years, at an interval of 5 years.
Stage – I 5 years
Stage – II 10 years
Stage – III 15 years
Stage – IV 20 years
Simulation for Prediction: The natural mining has to be simulated before it can lend
itself to the numerical modeling. As the first step, Fig. 1 is a simulated grid map of the
proposed mining area of the Adriyala Shaft in terms of contours of the surface profile.
Fig. 2, 3, 4, 5 and 6 are the simulated grid maps of the workings of the Seams-I, II, III top,
III bottom and IV. The simulated mine plan has a scale of 1:5000, same as that provided
by the mining company. Various types of hatchings of the panels in these maps portray
the sequence of mining operations in the 5 years time block. The prediction of subsidence
and the resulting surface is, therefore, confined to 5, 10, 15 and 20 years of mining. Table
4 gives the coordinates of few boreholes on the simulated grid maps, which can be used
for the studying, and the analyzing of all the maps provided by us.
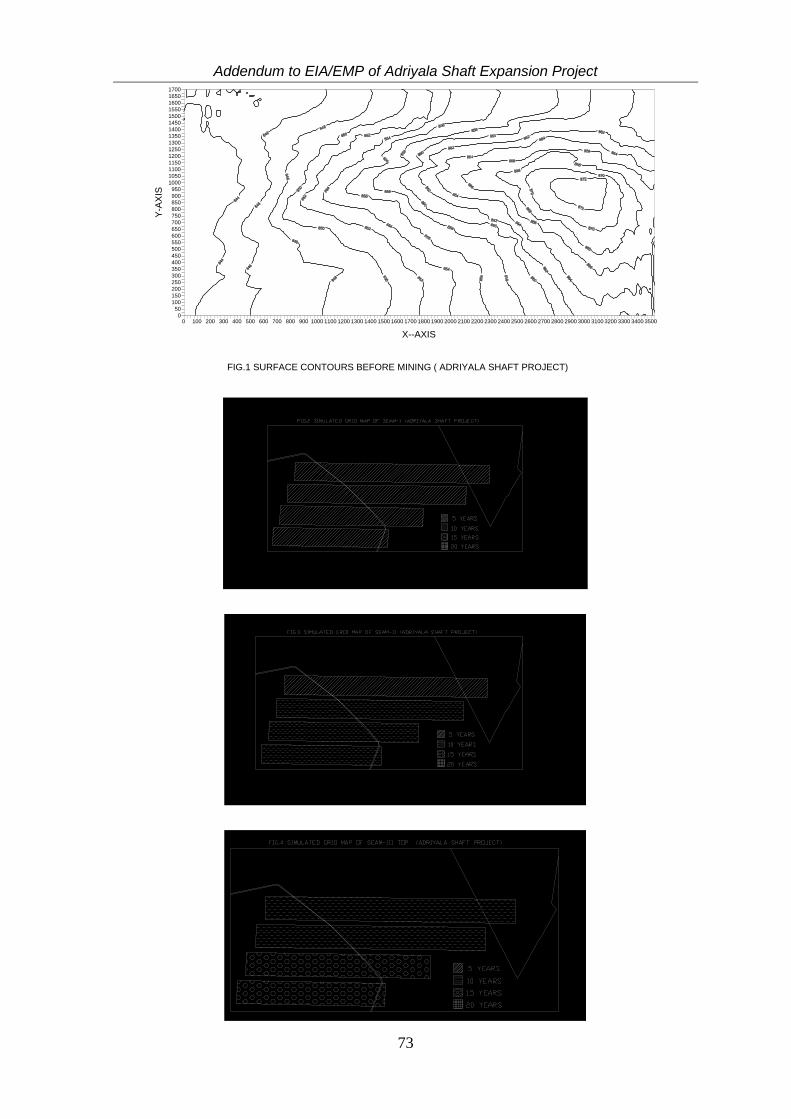
Addendum to EIA/EMP of Adriyala Shaft Expansion Project
73
FIG.1 SURFACE CONTOURS BEFORE MINING ( ADRIYALA SHAFT PROJECT)
0 100 200 300 400 500 600 700 800 900 1000 1100 1200 1300 1400 1500 1600 1700 1800 1900 2000 2100 2200 2300 2400 2500 2600 2700 2800 2900 3000 3100 3200 3300 3400 3500
X--AXIS
0
50
100
150
200
250
300
350
400
450
500
550
600
650
700
750
800
850
900
950
1000
1050
1100
1150
1200
1250
1300
1350
1400
1450
1500
1550
1600
1650
1700
Y-A
XIS
Addendum to EIA/EMP of Adriyala Shaft Expansion Project
74
Table 4 : Coordinates of boreholes on the simulated grip map
Sl. No. Borehole No. X-Coordinate Y-Coordinate
1. 1017 2310 910
2. 1007 2845 1130
3 707 925 1510
4. 1101 785 1005
5. 1098 730 415
Requisite Geotechnical Parameters for the Prediction: The numerical prediction of
subsidence requires basic data 1) Geotechnical parameters of the seam and surrounding
rock mass upto the surface, 2) Mathematical model and computer programs (software)
3) Major structural features of the strata, 4) Details of the mine excavation 5) Sequence
of extraction and size of panels, and 6) Important features on the surface. The
information on the above mentioned parameters were provided by the company. The
company also provided the data for the physico-mechanical properties used in the
simulation. The above properties were taken for various panels as per their proximity to
the above boreholes in the block. The boreholes nearest to the panels were considered
to be representative one and hence selected for the simulation.
Prediction Technique: The computer-simulated model was developed for the prediction
of subsidence and alterations in the resulting profile of the surface, keeping in mind the
total area, the mining sequence and geo-technical properties and above all, depth of each
mining panel, which varies significantly from panel to panel and seam to seam. The grid
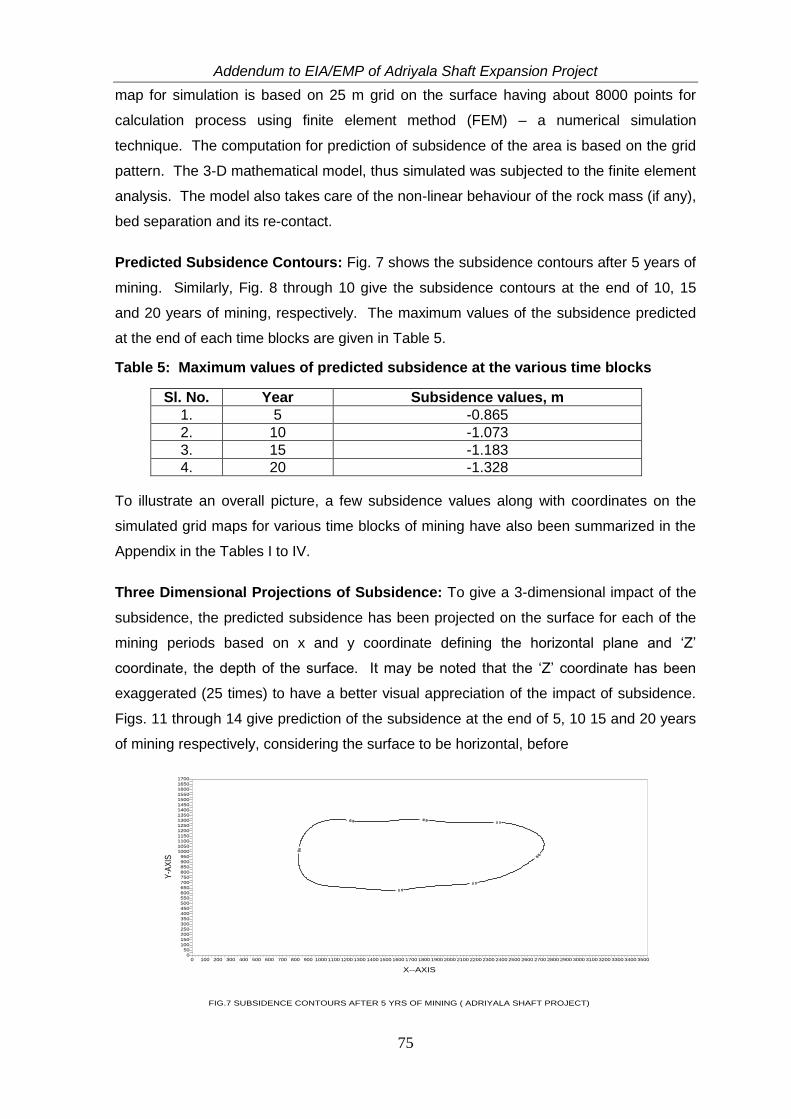
Addendum to EIA/EMP of Adriyala Shaft Expansion Project
75
map for simulation is based on 25 m grid on the surface having about 8000 points for
calculation process using finite element method (FEM) – a numerical simulation
technique. The computation for prediction of subsidence of the area is based on the grid
pattern. The 3-D mathematical model, thus simulated was subjected to the finite element
analysis. The model also takes care of the non-linear behaviour of the rock mass (if any),
bed separation and its re-contact.
Predicted Subsidence Contours: Fig. 7 shows the subsidence contours after 5 years of
mining. Similarly, Fig. 8 through 10 give the subsidence contours at the end of 10, 15
and 20 years of mining, respectively. The maximum values of the subsidence predicted
at the end of each time blocks are given in Table 5.
Table 5: Maximum values of predicted subsidence at the various time blocks
Sl. No. Year Subsidence values, m
1. 5 -0.865
2. 10 -1.073
3. 15 -1.183
4. 20 -1.328
To illustrate an overall picture, a few subsidence values along with coordinates on the
simulated grid maps for various time blocks of mining have also been summarized in the
Appendix in the Tables I to IV.
Three Dimensional Projections of Subsidence: To give a 3-dimensional impact of the
subsidence, the predicted subsidence has been projected on the surface for each of the
mining periods based on x and y coordinate defining the horizontal plane and ‘Z’
coordinate, the depth of the surface. It may be noted that the ‘Z’ coordinate has been
exaggerated (25 times) to have a better visual appreciation of the impact of subsidence.
Figs. 11 through 14 give prediction of the subsidence at the end of 5, 10 15 and 20 years
of mining respectively, considering the surface to be horizontal, before
FIG.7 SUBSIDENCE CONTOURS AFTER 5 YRS OF MINING ( ADRIYALA SHAFT PROJECT)
0 100 200 300 400 500 600 700 800 900 1000 1100 1200 1300 1400 1500 1600 1700 1800 1900 2000 2100 2200 2300 2400 2500 2600 2700 2800 2900 3000 3100 3200 3300 3400 3500
X--AXIS
0
50
100
150
200
250
300
350
400
450
500
550
600
650
700
750
800
850
900
950
1000
1050
1100
1150
1200
1250
1300
1350
1400
1450
1500
1550
1600
1650
1700
Y-A
XIS
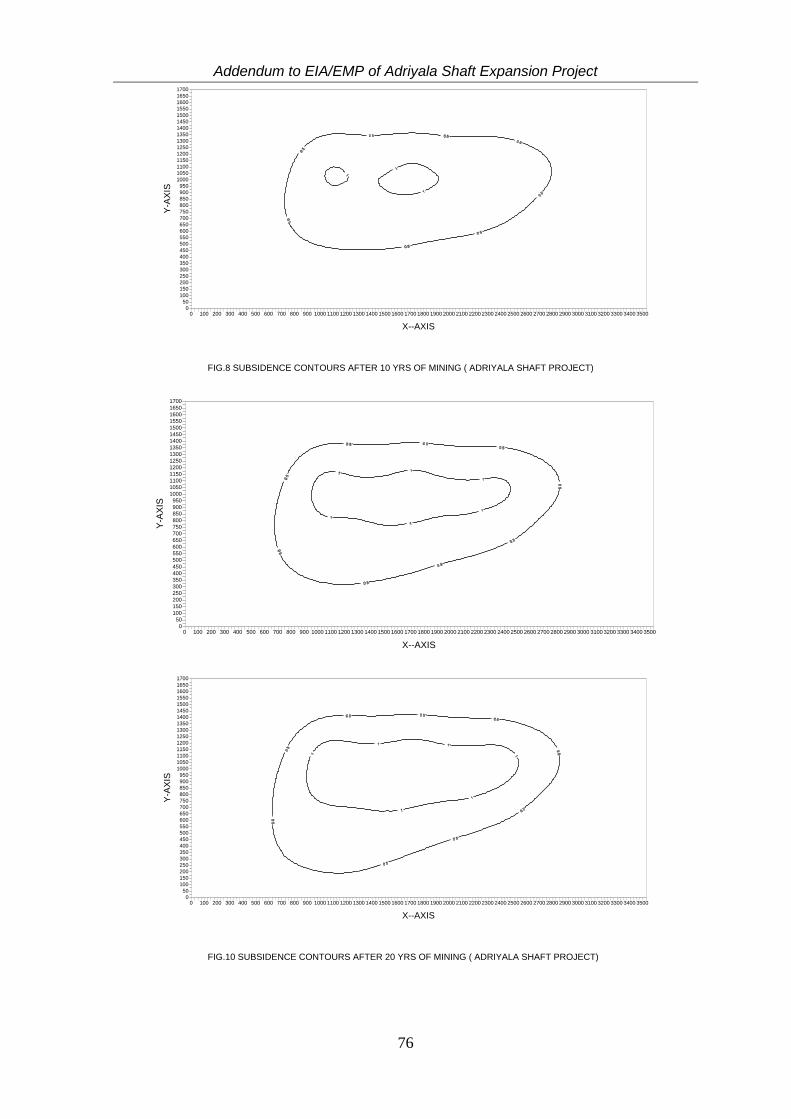
Addendum to EIA/EMP of Adriyala Shaft Expansion Project
76
FIG.8 SUBSIDENCE CONTOURS AFTER 10 YRS OF MINING ( ADRIYALA SHAFT PROJECT)
0 100 200 300 400 500 600 700 800 900 1000 1100 1200 1300 1400 1500 1600 1700 1800 1900 2000 2100 2200 2300 2400 2500 2600 2700 2800 2900 3000 3100 3200 3300 3400 3500
X--AXIS
0
50
100
150
200
250
300
350
400
450
500
550
600
650
700
750
800
850
900
950
1000
1050
1100
1150
1200
1250
1300
1350
1400
1450
1500
1550
1600
1650
1700
Y-A
XIS
FIG.10 SUBSIDENCE CONTOURS AFTER 20 YRS OF MINING ( ADRIYALA SHAFT PROJECT)
0 100 200 300 400 500 600 700 800 900 1000 1100 1200 1300 1400 1500 1600 1700 1800 1900 2000 2100 2200 2300 2400 2500 2600 2700 2800 2900 3000 3100 3200 3300 3400 3500
X--AXIS
0
50
100
150
200
250
300
350
400
450
500
550
600
650
700
750
800
850
900
950
1000
1050
1100
1150
1200
1250
1300
1350
1400
1450
1500
1550
1600
1650
1700
Y-A
XIS

Addendum to EIA/EMP of Adriyala Shaft Expansion Project
77
FIG.11a SUBSIDENCE PROFILE AFTER 5 YRS OF MINING (ADRIYALA SHAFT PROJECT)
FIG.11b SUBSIDENCE PROFILE AFTER 5 YRS OF MINING (ADRIYALA SHAFT PROJECT)
FIG.12a SUBSIDENCE PROFILE AFTER 10 YRS OF MINING (ADRIYALA SHAFT PROJECT)
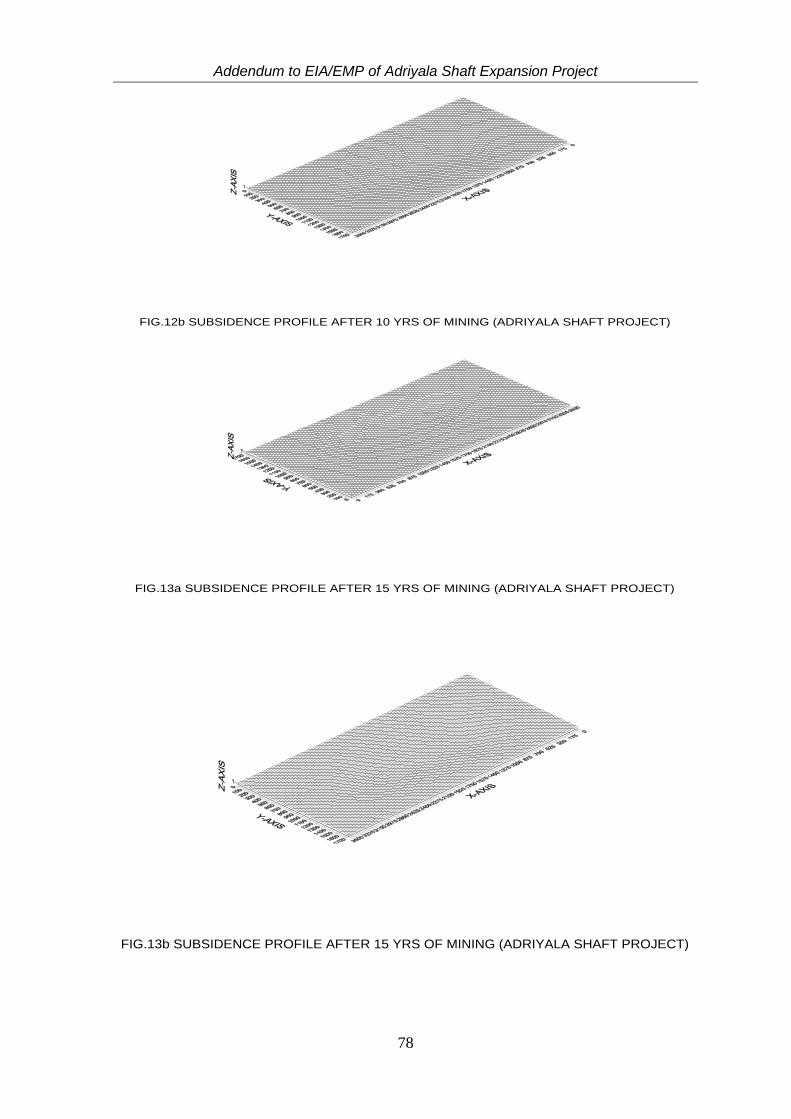
Addendum to EIA/EMP of Adriyala Shaft Expansion Project
78
FIG.12b SUBSIDENCE PROFILE AFTER 10 YRS OF MINING (ADRIYALA SHAFT PROJECT)
FIG.13a SUBSIDENCE PROFILE AFTER 15 YRS OF MINING (ADRIYALA SHAFT PROJECT)
FIG.13b SUBSIDENCE PROFILE AFTER 15 YRS OF MINING (ADRIYALA SHAFT PROJECT)
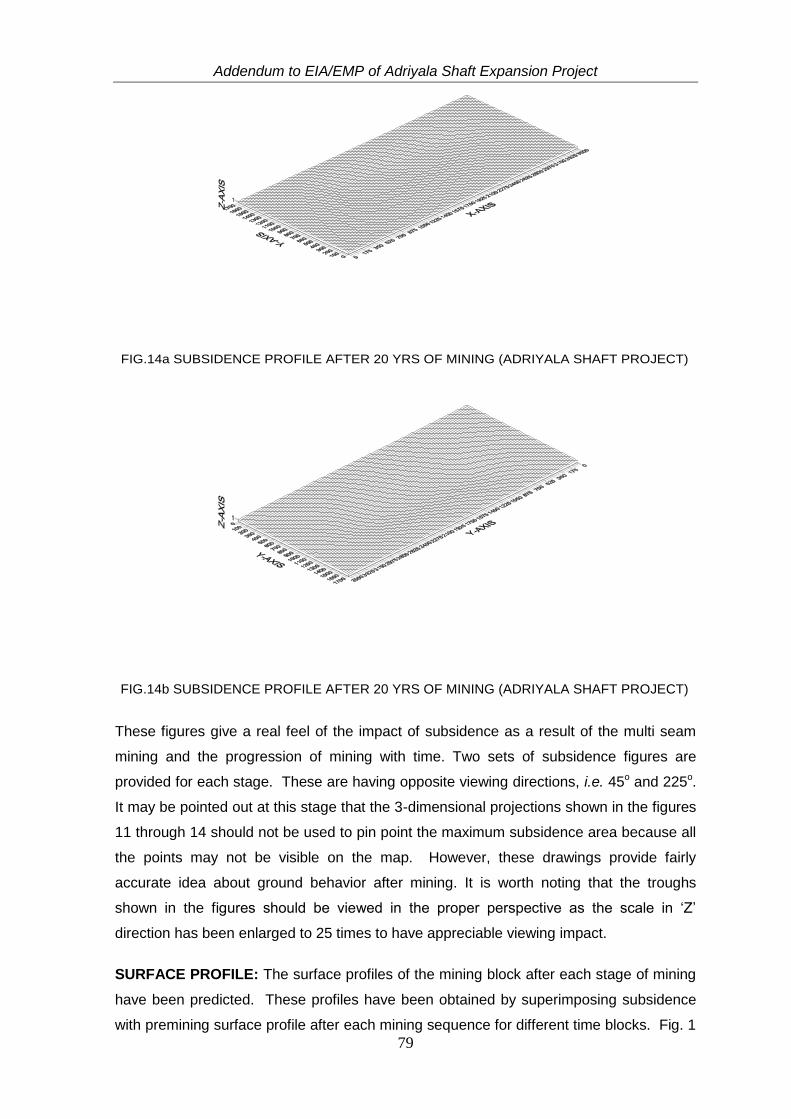
Addendum to EIA/EMP of Adriyala Shaft Expansion Project
79
FIG.14a SUBSIDENCE PROFILE AFTER 20 YRS OF MINING (ADRIYALA SHAFT PROJECT)
FIG.14b SUBSIDENCE PROFILE AFTER 20 YRS OF MINING (ADRIYALA SHAFT PROJECT)
These figures give a real feel of the impact of subsidence as a result of the multi seam
mining and the progression of mining with time. Two sets of subsidence figures are
provided for each stage. These are having opposite viewing directions, i.e. 45o and 225o.
It may be pointed out at this stage that the 3-dimensional projections shown in the figures
11 through 14 should not be used to pin point the maximum subsidence area because all
the points may not be visible on the map. However, these drawings provide fairly
accurate idea about ground behavior after mining. It is worth noting that the troughs
shown in the figures should be viewed in the proper perspective as the scale in ‘Z’
direction has been enlarged to 25 times to have appreciable viewing impact.
SURFACE PROFILE: The surface profiles of the mining block after each stage of mining
have been predicted. These profiles have been obtained by superimposing subsidence
with premining surface profile after each mining sequence for different time blocks. Fig. 1
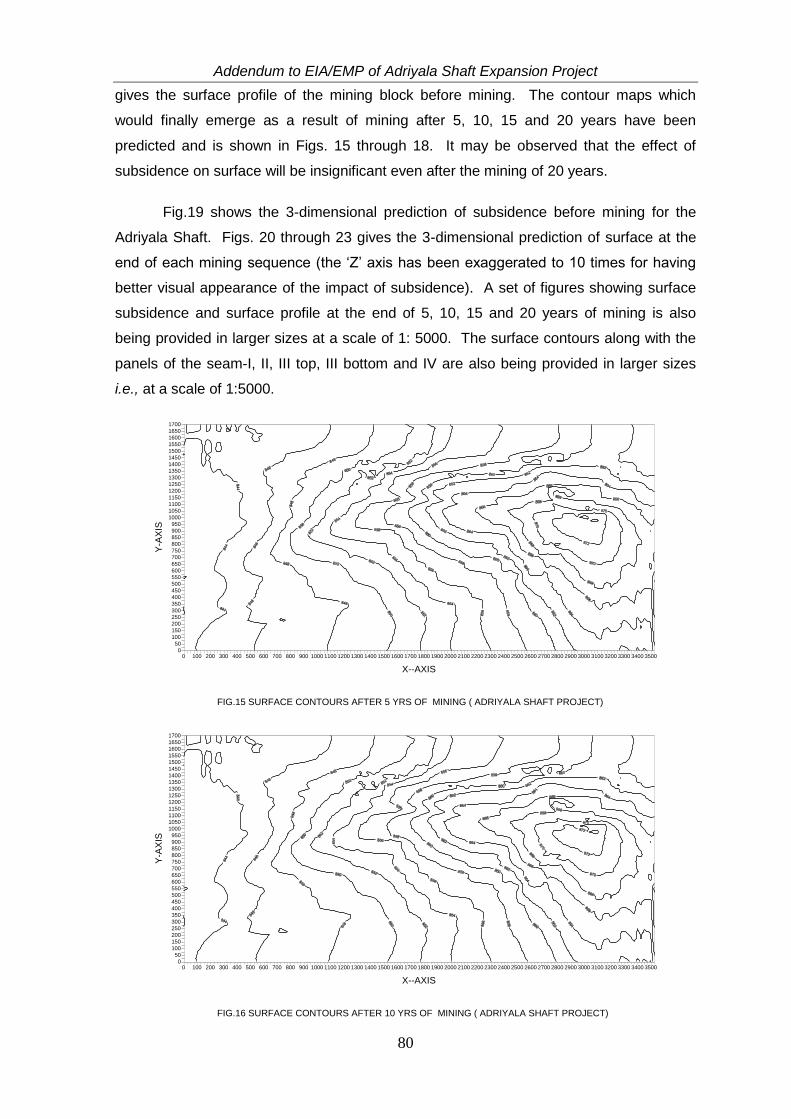
Addendum to EIA/EMP of Adriyala Shaft Expansion Project
80
gives the surface profile of the mining block before mining. The contour maps which
would finally emerge as a result of mining after 5, 10, 15 and 20 years have been
predicted and is shown in Figs. 15 through 18. It may be observed that the effect of
subsidence on surface will be insignificant even after the mining of 20 years.
Fig.19 shows the 3-dimensional prediction of subsidence before mining for the
Adriyala Shaft. Figs. 20 through 23 gives the 3-dimensional prediction of surface at the
end of each mining sequence (the ‘Z’ axis has been exaggerated to 10 times for having
better visual appearance of the impact of subsidence). A set of figures showing surface
subsidence and surface profile at the end of 5, 10, 15 and 20 years of mining is also
being provided in larger sizes at a scale of 1: 5000. The surface contours along with the
panels of the seam-I, II, III top, III bottom and IV are also being provided in larger sizes
i.e., at a scale of 1:5000.
FIG.15 SURFACE CONTOURS AFTER 5 YRS OF MINING ( ADRIYALA SHAFT PROJECT)
0 100 200 300 400 500 600 700 800 900 1000 1100 1200 1300 1400 1500 1600 1700 1800 1900 2000 2100 2200 2300 2400 2500 2600 2700 2800 2900 3000 3100 3200 3300 3400 3500
X--AXIS
0
50
100
150
200
250
300
350
400
450
500
550
600
650
700
750
800
850
900
950
1000
1050
1100
1150
1200
1250
1300
1350
1400
1450
1500
1550
1600
1650
1700
Y-A
XIS
FIG.16 SURFACE CONTOURS AFTER 10 YRS OF MINING ( ADRIYALA SHAFT PROJECT)
0 100 200 300 400 500 600 700 800 900 1000 1100 1200 1300 1400 1500 1600 1700 1800 1900 2000 2100 2200 2300 2400 2500 2600 2700 2800 2900 3000 3100 3200 3300 3400 3500
X--AXIS
0
50
100
150
200
250
300
350
400
450
500
550
600
650
700
750
800
850
900
950
1000
1050
1100
1150
1200
1250
1300
1350
1400
1450
1500
1550
1600
1650
1700
Y-A
XIS
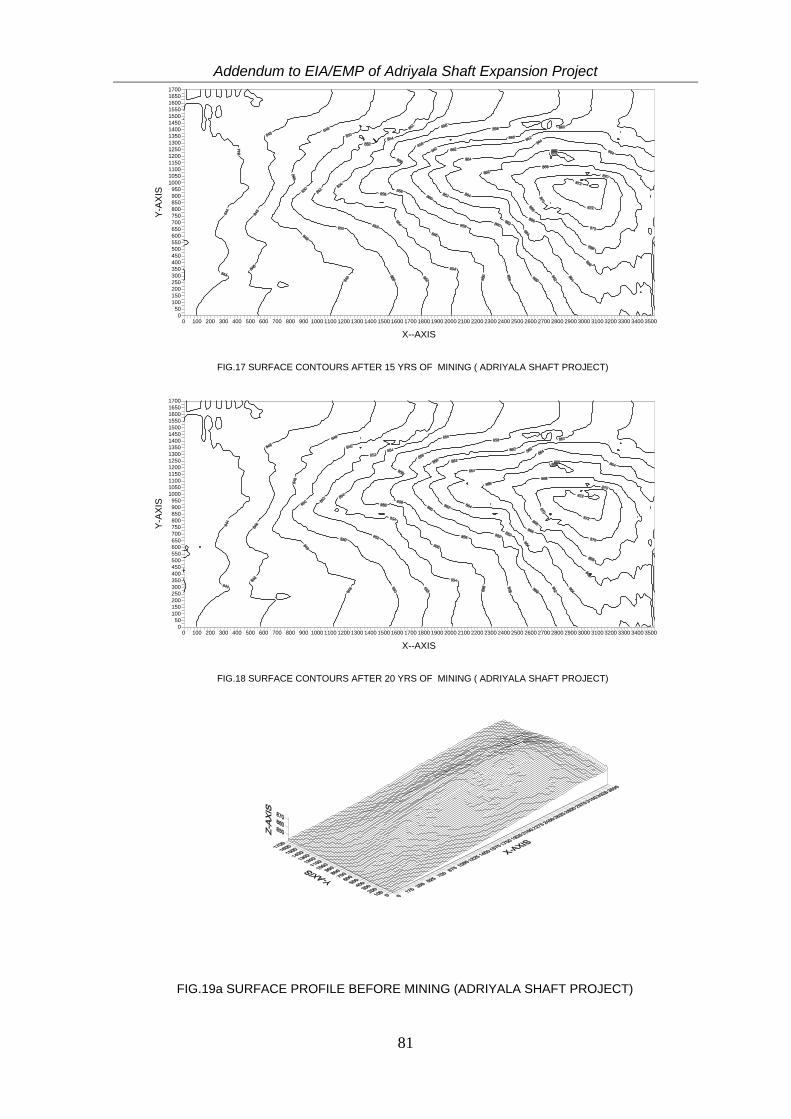
Addendum to EIA/EMP of Adriyala Shaft Expansion Project
81
FIG.17 SURFACE CONTOURS AFTER 15 YRS OF MINING ( ADRIYALA SHAFT PROJECT)
0 100 200 300 400 500 600 700 800 900 1000 1100 1200 1300 1400 1500 1600 1700 1800 1900 2000 2100 2200 2300 2400 2500 2600 2700 2800 2900 3000 3100 3200 3300 3400 3500
X--AXIS
0
50
100
150
200
250
300
350
400
450
500
550
600
650
700
750
800
850
900
950
1000
1050
1100
1150
1200
1250
1300
1350
1400
1450
1500
1550
1600
1650
1700
Y-A
XIS
FIG.18 SURFACE CONTOURS AFTER 20 YRS OF MINING ( ADRIYALA SHAFT PROJECT)
0 100 200 300 400 500 600 700 800 900 1000 1100 1200 1300 1400 1500 1600 1700 1800 1900 2000 2100 2200 2300 2400 2500 2600 2700 2800 2900 3000 3100 3200 3300 3400 3500
X--AXIS
0
50
100
150
200
250
300
350
400
450
500
550
600
650
700
750
800
850
900
950
1000
1050
1100
1150
1200
1250
1300
1350
1400
1450
1500
1550
1600
1650
1700
Y-A
XIS
FIG.19a SURFACE PROFILE BEFORE MINING (ADRIYALA SHAFT PROJECT)
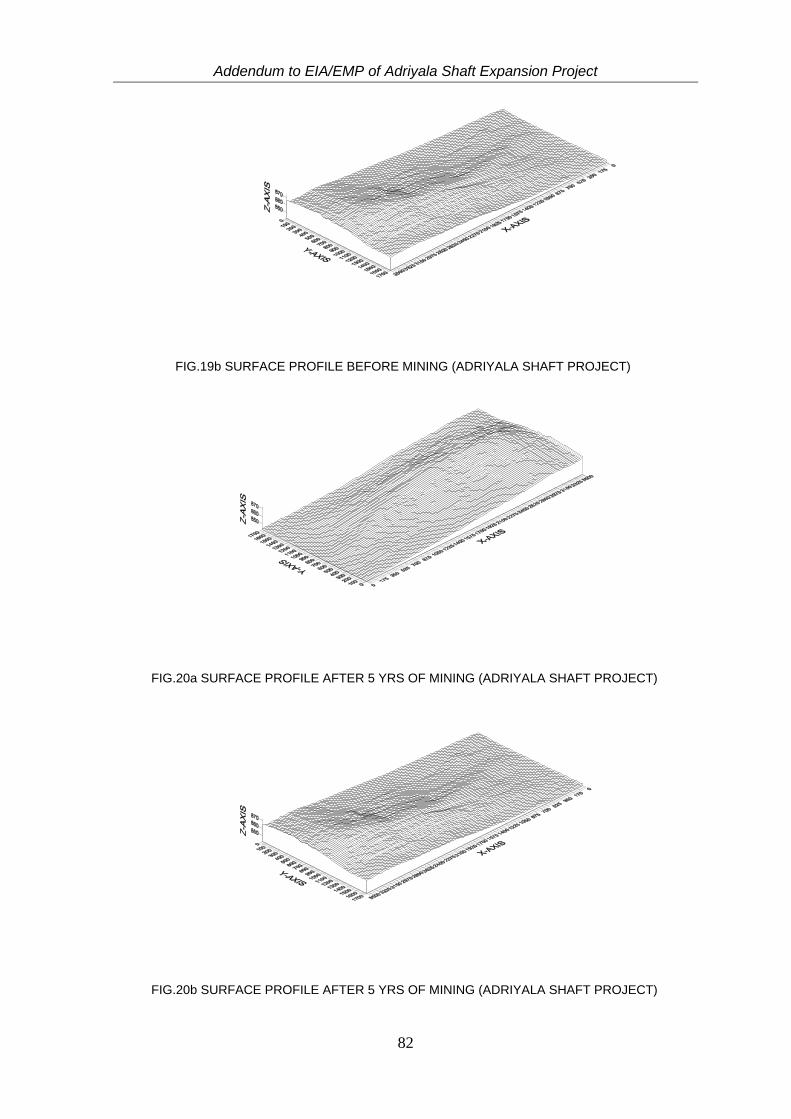
Addendum to EIA/EMP of Adriyala Shaft Expansion Project
82
FIG.19b SURFACE PROFILE BEFORE MINING (ADRIYALA SHAFT PROJECT)
FIG.20a SURFACE PROFILE AFTER 5 YRS OF MINING (ADRIYALA SHAFT PROJECT)
FIG.20b SURFACE PROFILE AFTER 5 YRS OF MINING (ADRIYALA SHAFT PROJECT)
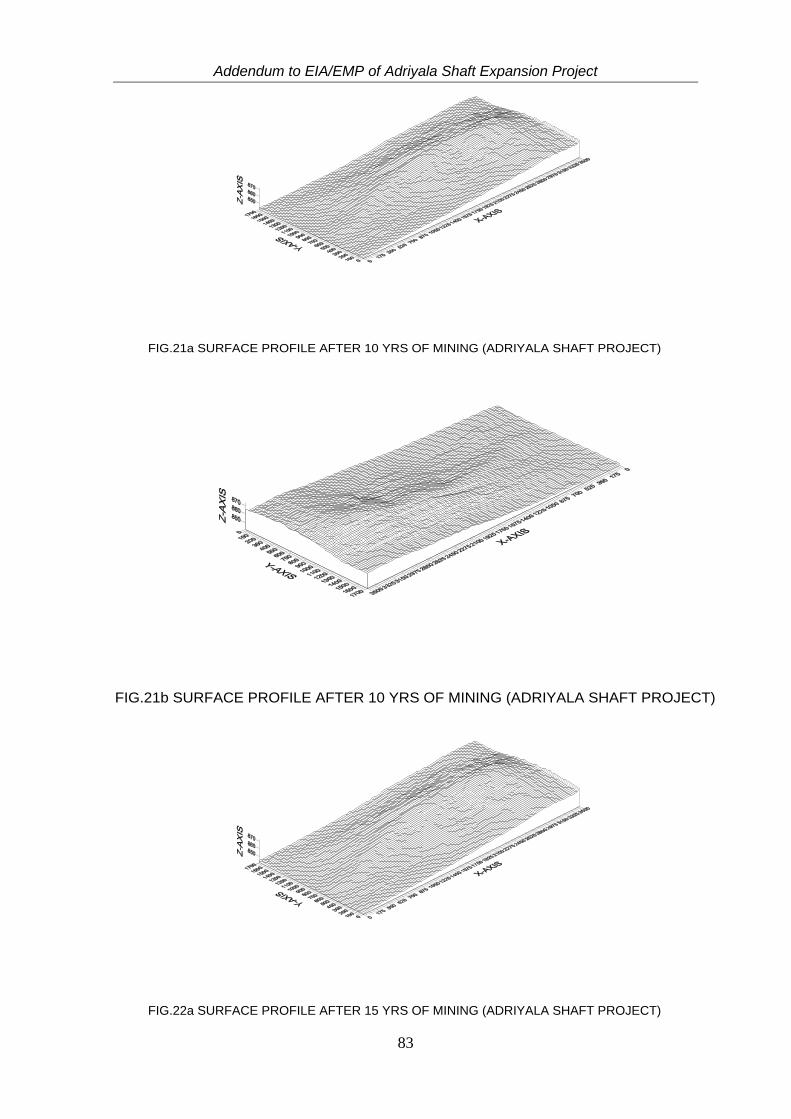
Addendum to EIA/EMP of Adriyala Shaft Expansion Project
83
FIG.21a SURFACE PROFILE AFTER 10 YRS OF MINING (ADRIYALA SHAFT PROJECT)
FIG.21b SURFACE PROFILE AFTER 10 YRS OF MINING (ADRIYALA SHAFT PROJECT)
FIG.22a SURFACE PROFILE AFTER 15 YRS OF MINING (ADRIYALA SHAFT PROJECT)
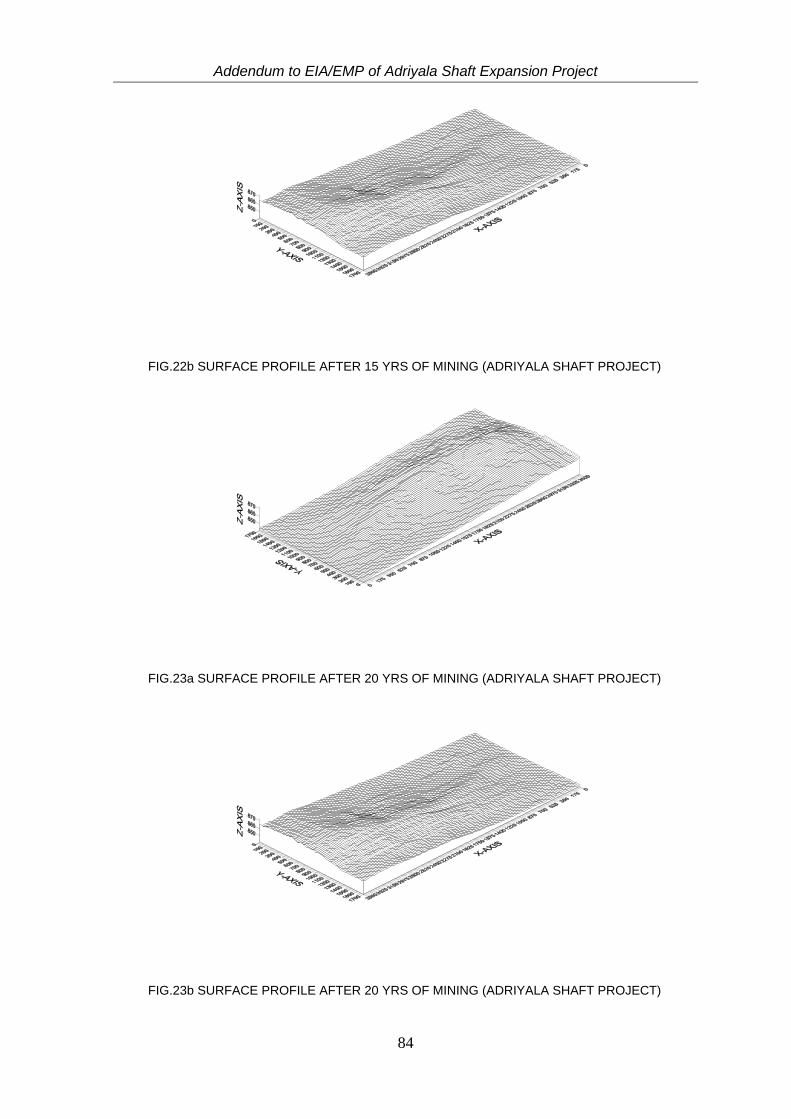
Addendum to EIA/EMP of Adriyala Shaft Expansion Project
84
FIG.22b SURFACE PROFILE AFTER 15 YRS OF MINING (ADRIYALA SHAFT PROJECT)
FIG.23a SURFACE PROFILE AFTER 20 YRS OF MINING (ADRIYALA SHAFT PROJECT)
FIG.23b SURFACE PROFILE AFTER 20 YRS OF MINING (ADRIYALA SHAFT PROJECT)
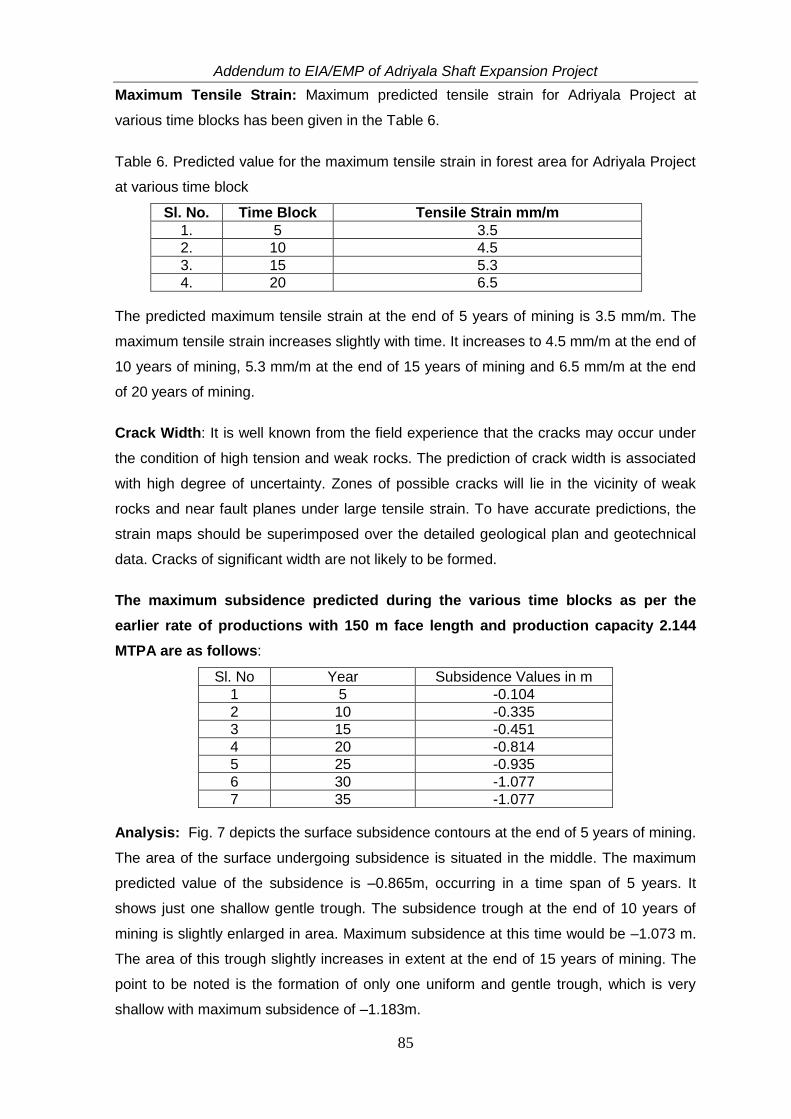
Addendum to EIA/EMP of Adriyala Shaft Expansion Project
85
Maximum Tensile Strain: Maximum predicted tensile strain for Adriyala Project at
various time blocks has been given in the Table 6.
Table 6. Predicted value for the maximum tensile strain in forest area for Adriyala Project
at various time block
Sl. No. Time Block Tensile Strain mm/m
1. 5 3.5
2. 10 4.5
3. 15 5.3
4. 20 6.5
The predicted maximum tensile strain at the end of 5 years of mining is 3.5 mm/m. The
maximum tensile strain increases slightly with time. It increases to 4.5 mm/m at the end of
10 years of mining, 5.3 mm/m at the end of 15 years of mining and 6.5 mm/m at the end
of 20 years of mining.
Crack Width: It is well known from the field experience that the cracks may occur under
the condition of high tension and weak rocks. The prediction of crack width is associated
with high degree of uncertainty. Zones of possible cracks will lie in the vicinity of weak
rocks and near fault planes under large tensile strain. To have accurate predictions, the
strain maps should be superimposed over the detailed geological plan and geotechnical
data. Cracks of significant width are not likely to be formed.
The maximum subsidence predicted during the various time blocks as per the
earlier rate of productions with 150 m face length and production capacity 2.144
MTPA are as follows:
Sl. No Year Subsidence Values in m
1 5 -0.104
2 10 -0.335
3 15 -0.451
4 20 -0.814
5 25 -0.935
6 30 -1.077
7 35 -1.077
Analysis: Fig. 7 depicts the surface subsidence contours at the end of 5 years of mining.
The area of the surface undergoing subsidence is situated in the middle. The maximum
predicted value of the subsidence is –0.865m, occurring in a time span of 5 years. It
shows just one shallow gentle trough. The subsidence trough at the end of 10 years of
mining is slightly enlarged in area. Maximum subsidence at this time would be –1.073 m.
The area of this trough slightly increases in extent at the end of 15 years of mining. The
point to be noted is the formation of only one uniform and gentle trough, which is very
shallow with maximum subsidence of –1.183m.
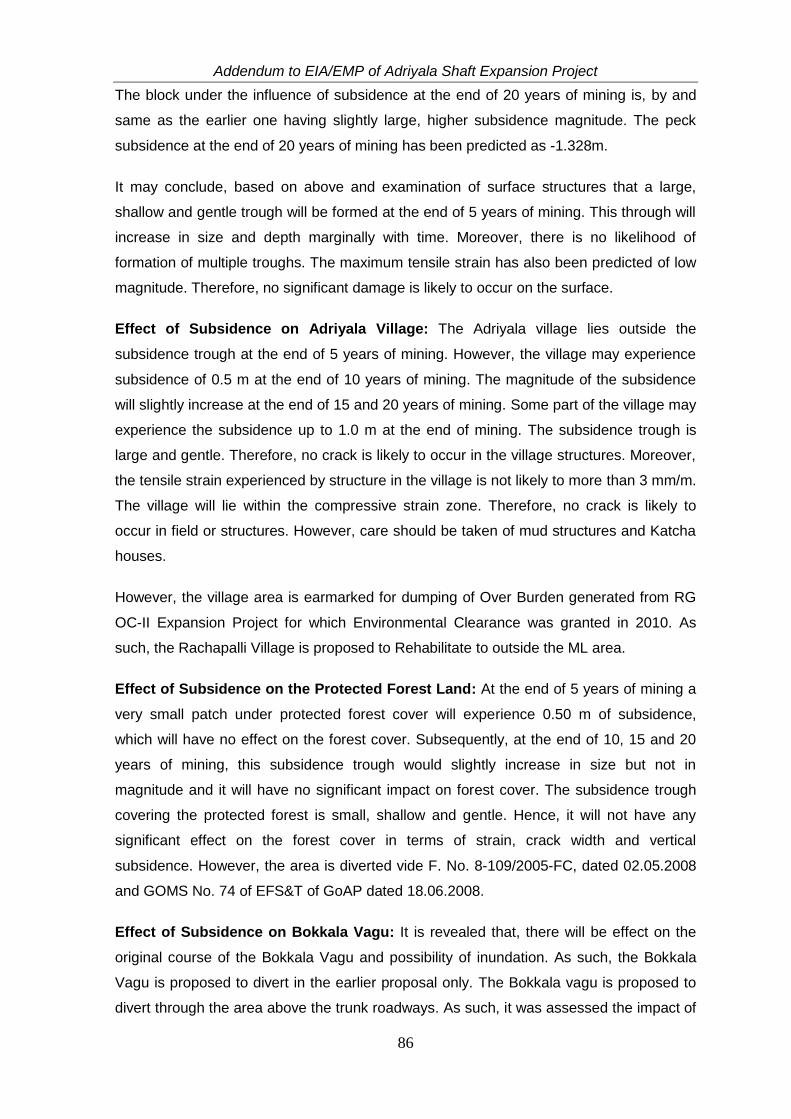
Addendum to EIA/EMP of Adriyala Shaft Expansion Project
86
The block under the influence of subsidence at the end of 20 years of mining is, by and
same as the earlier one having slightly large, higher subsidence magnitude. The peck
subsidence at the end of 20 years of mining has been predicted as -1.328m.
It may conclude, based on above and examination of surface structures that a large,
shallow and gentle trough will be formed at the end of 5 years of mining. This through will
increase in size and depth marginally with time. Moreover, there is no likelihood of
formation of multiple troughs. The maximum tensile strain has also been predicted of low
magnitude. Therefore, no significant damage is likely to occur on the surface.
Effect of Subsidence on Adriyala Village: The Adriyala village lies outside the
subsidence trough at the end of 5 years of mining. However, the village may experience
subsidence of 0.5 m at the end of 10 years of mining. The magnitude of the subsidence
will slightly increase at the end of 15 and 20 years of mining. Some part of the village may
experience the subsidence up to 1.0 m at the end of mining. The subsidence trough is
large and gentle. Therefore, no crack is likely to occur in the village structures. Moreover,
the tensile strain experienced by structure in the village is not likely to more than 3 mm/m.
The village will lie within the compressive strain zone. Therefore, no crack is likely to
occur in field or structures. However, care should be taken of mud structures and Katcha
houses.
However, the village area is earmarked for dumping of Over Burden generated from RG
OC-II Expansion Project for which Environmental Clearance was granted in 2010. As
such, the Rachapalli Village is proposed to Rehabilitate to outside the ML area.
Effect of Subsidence on the Protected Forest Land: At the end of 5 years of mining a
very small patch under protected forest cover will experience 0.50 m of subsidence,
which will have no effect on the forest cover. Subsequently, at the end of 10, 15 and 20
years of mining, this subsidence trough would slightly increase in size but not in
magnitude and it will have no significant impact on forest cover. The subsidence trough
covering the protected forest is small, shallow and gentle. Hence, it will not have any
significant effect on the forest cover in terms of strain, crack width and vertical
subsidence. However, the area is diverted vide F. No. 8-109/2005-FC, dated 02.05.2008
and GOMS No. 74 of EFS&T of GoAP dated 18.06.2008.
Effect of Subsidence on Bokkala Vagu: It is revealed that, there will be effect on the
original course of the Bokkala Vagu and possibility of inundation. As such, the Bokkala
Vagu is proposed to divert in the earlier proposal only. The Bokkala vagu is proposed to
divert through the area above the trunk roadways. As such, it was assessed the impact of
Addendum to EIA/EMP of Adriyala Shaft Expansion Project
87
subsidence on the proposed diversion course of Bokkala Vagu also. There will not be any
effect of subsidence on proposed diverted Bokkala Vagu. A fund provision of ₹ 250.00
lakhs were made towards diversion of Bokkal Vagu. The diversion will be carried with the
permission of the I&CAD department only.
The Effect of subsidence on the Sriram Sagar Canal: Fig 7 through 10 shows that the
contour of up to 1.0 m will intersect the Sriram Sagar canal. In first five years, only a small
portion of canal will get affected. However, larges canal lengths will be covered by
subsidence trough with progression of mining with time. The maximum vertical
subsidence will be slightly more than 1.0 m at the end of mining. Therefore, the canal will
be affected most, out of all the surface features on the property, by the subsidence. The
subsidence trough formed on the surface, through which the canal passes is large,
shallow and gentle in slope. The following measures are suggested by IT BHU, Varanasi:
1) Regular monitoring of the subsidence along the canal should be done. Though, no
crack is likely to occur, however, proper monitoring should be done at the regular interval.
2) Part of the canal will experience the vertical movement. Therefore, adequate measures
should be under taken, to maintain flow of water and 3) Embankment of the canal should
gradually be increased.
In view of the impact on the SRSP Canal, it is proposed to diver the canal along non-coal
bearing area for which a fund provision of ₹ 800 lakhs were made. In the earlier proposal
also it was proposed to diver the canal.
Effect of Subsidence on Crop Productivity: The total magnitude of subsidence, in 20
years of mining is slightly more than 1 m. However, a subsidence trough of about 1 m will
take place gently, gradually over a large area. Hence, its impact will not be there on crop
productivity. The subsidence trough will not alter the natural drainage pattern or land
profile significantly as evident from Figs. 11 through 14. However, the entire land on the
mine take area acquired.
4.6. Impact on Socio Economic Environment
No significant changes have been visualized in the traditional way of life and occupation
of the local people in coal mining areas. The local people are rather benefited due to the
provision of more infrastructure facilities provided by the management.
Corporate Social Responsibility The Company CSR Policies aimed
To contribute to sustainable economic development, working with employees,
their families, the local community and society at large.
To provide humane, healthy and safe working conditions for the employees.
Addendum to EIA/EMP of Adriyala Shaft Expansion Project
88
To put in sustained efforts to improve the quality of life of employees and their
families.
To promote harmonious industrial relations weaning away the from strike culture.
To constantly improve upon the welfare measures for the employees and their
families.
To continuously endeavor for decent working and living environment by controlling
air, water and noise pollution.
To augment the efforts for providing civic amenities in and around the SCCL
command area.
The following needs of the Community were identified by SCCL:
Unemployment
Illiteracy
Lack of awareness of the opportunities
Lack of support from the Govt. agencies / Financial agencies.
The Associates in CSR (Concern for Social Rehabilitations)
Singareni Seva Samithi (SSS)
Surrounding Habitat Assistance Programme (SHAPE)
Singareni Employees Wives Association (SEWA)
Local Communities
Singareni Seva Samithi (SSS)
Singareni Seva Samithi (SSS) is registered under Andhra Pradesh Public Societies Act to
take up all Educational Training Programs, Self-employment Schemes, help for Army
Recruitment etc. and other Educational Training programs for the children of employees
who died in harness and unemployed youth which includes daughters and sons of
employees & Ex-employees and also to spouses of Ex-employees.
Activities of Singareni Seva Samithi:
Employment training for children of workers
Workers Education Programme
Women’s literacy
Educare Initiatives
Army/ Police/Para-Military Recruitment Training
Medical and Health Measures
Mobile Medical Services
Health Awareness Programs
S.T Orphan Home for Girls at Manuguru

Addendum to EIA/EMP of Adriyala Shaft Expansion Project
89
Welfare of Project Affected Persons
Entrepreneurship Development Program
Social and Community Initiatives
SCCL is carrying out coal mining operations in the four Districts of Andhra Pradesh
namely Khammam, Warangal, Karimnagar and Adilabad. Surrounding Habitat
Assistance Programme (SHAPE), started during the year 2003-04 with a concept that
partner in progress.
The mechanism adopted to identify the community needs is very pragmatic. The local
bodies in these habitats will identify the works in association with the community and
Rural Development Agencies of the State Government. The funds are provided under
SHAPE program by the company for the Government to execute the work. Under this
programme, Drinking water supply, education facilities and infrastructure development in
the surrounding habitats of SCCL are taken-up.
Habitats which are less than 8.00 Km from townships or 10.00 Km from mine entries and
having SCCL workmen at 25% of total population or 200 Nos., whichever is less are
generally considered.
About 15 Lakhs population in nearly 81 Gram Panchayaths, 7 Municipalities and the
District Administration of 4 Districts in Andhra Pradesh are partners in the Community
Development Projects of “SHAPE” launched by SCCL. Modalities of the developmental
work are being finalized in consultation with District Collectors and Peoples
representatives (Sarapanch, Village Chief etc.).
About 229 works in Adilabad, 221 works in Karimnagar, 101 works in Warangal and 327
woks in Khammam districts are taken up such as protected drinking water supply,
education facilities and infrastructure development in the surrounding habitats of SCCL.
The following CSR Works were already taken up in Buffer zone of the Project area:
SL. NO.
NAME OF THE WORK & PROCEEDING DATE SANCTIONED AMOUNT (RS)
1 CC ROAD AT SRIRAM NAGAR(V) MANTHANI(M) 18-02-2011 2,50,000
2. CON. OF CS ROAD & SIDE DRAINES AT KUCHI RAJ PALLY (V) MANTHANI (M) LR.NO. E4/4040/2009 DT. 08-07-2010
31-08-2010 2,50,000
3. CC ROAD & SIDE DRAINS GANGAPUR(V) MANTHANI(M) LR.NO.E4/4040/2009 DT.24-01-2010
15-04-2010 2,50,000
4. CC ROAD FROM SRIPADA COLONY AT MANTHANI(V) (M) LR.NO. E4/4040/2009 DT. 24-01-2010
15-04-2010 2,50,000
5. CC ROAD AT NAGULAVEEDI MANTHANI (V) (M) LR.NO. E4/4040/2009 DT.24-01-2010
15-04-2010 2,50,000
6. APPROACH ROAD TO GOVT. JUNIOR COLLEGE (GIRLS) MANTHANI (V) (M) E4/4040/2009 DT.08-07-2010
31-08-2010 3,00,000
7. CONSTRUCTION OF DHOBI GHAT (V&M), MB 02-01-2011 7,00,000
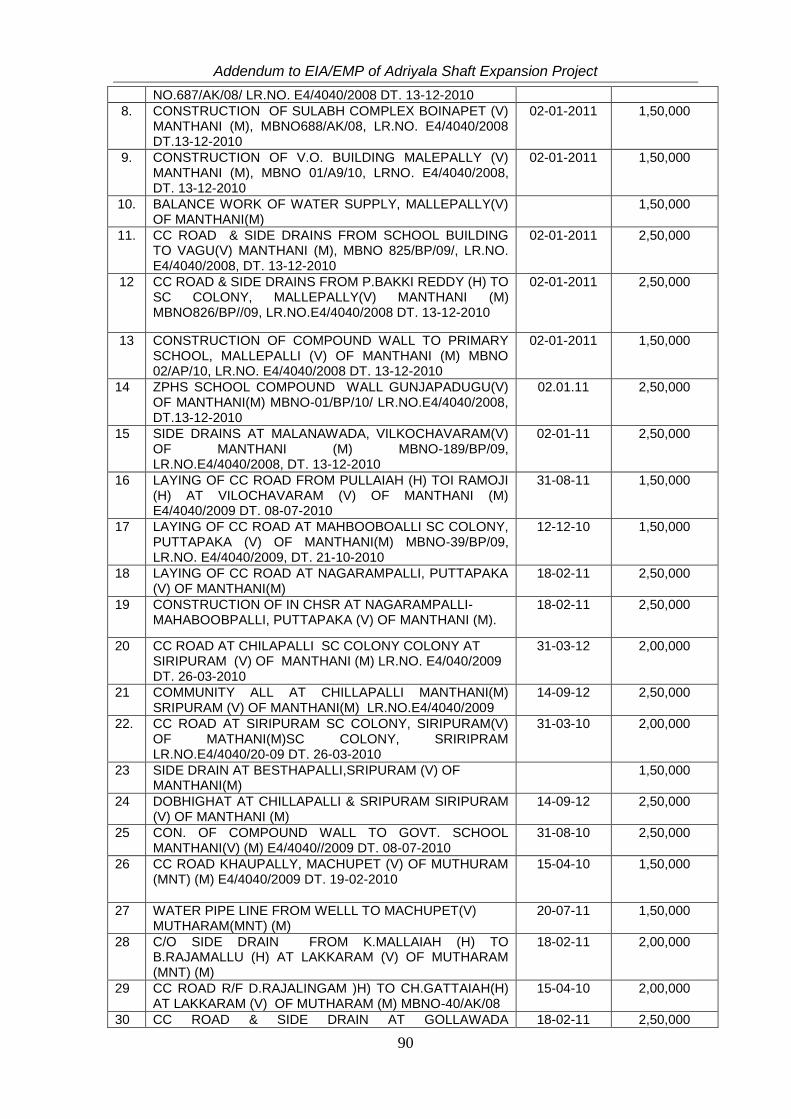
Addendum to EIA/EMP of Adriyala Shaft Expansion Project
90
NO.687/AK/08/ LR.NO. E4/4040/2008 DT. 13-12-2010
8. CONSTRUCTION OF SULABH COMPLEX BOINAPET (V) MANTHANI (M), MBNO688/AK/08, LR.NO. E4/4040/2008 DT.13-12-2010
02-01-2011 1,50,000
9. CONSTRUCTION OF V.O. BUILDING MALEPALLY (V) MANTHANI (M), MBNO 01/A9/10, LRNO. E4/4040/2008, DT. 13-12-2010
02-01-2011 1,50,000
10. BALANCE WORK OF WATER SUPPLY, MALLEPALLY(V) OF MANTHANI(M)
1,50,000
11. CC ROAD & SIDE DRAINS FROM SCHOOL BUILDING TO VAGU(V) MANTHANI (M), MBNO 825/BP/09/, LR.NO. E4/4040/2008, DT. 13-12-2010
02-01-2011 2,50,000
12 CC ROAD & SIDE DRAINS FROM P.BAKKI REDDY (H) TO SC COLONY, MALLEPALLY(V) MANTHANI (M) MBNO826/BP//09, LR.NO.E4/4040/2008 DT. 13-12-2010
02-01-2011
2,50,000
13 CONSTRUCTION OF COMPOUND WALL TO PRIMARY SCHOOL, MALLEPALLI (V) OF MANTHANI (M) MBNO 02/AP/10, LR.NO. E4/4040/2008 DT. 13-12-2010
02-01-2011 1,50,000
14 ZPHS SCHOOL COMPOUND WALL GUNJAPADUGU(V) OF MANTHANI(M) MBNO-01/BP/10/ LR.NO.E4/4040/2008, DT.13-12-2010
02.01.11 2,50,000
15 SIDE DRAINS AT MALANAWADA, VILKOCHAVARAM(V) OF MANTHANI (M) MBNO-189/BP/09, LR.NO.E4/4040/2008, DT. 13-12-2010
02-01-11 2,50,000
16 LAYING OF CC ROAD FROM PULLAIAH (H) TOI RAMOJI (H) AT VILOCHAVARAM (V) OF MANTHANI (M) E4/4040/2009 DT. 08-07-2010
31-08-11 1,50,000
17 LAYING OF CC ROAD AT MAHBOOBOALLI SC COLONY, PUTTAPAKA (V) OF MANTHANI(M) MBNO-39/BP/09, LR.NO. E4/4040/2009, DT. 21-10-2010
12-12-10 1,50,000
18 LAYING OF CC ROAD AT NAGARAMPALLI, PUTTAPAKA (V) OF MANTHANI(M)
18-02-11 2,50,000
19 CONSTRUCTION OF IN CHSR AT NAGARAMPALLI-MAHABOOBPALLI, PUTTAPAKA (V) OF MANTHANI (M).
18-02-11 2,50,000
20 CC ROAD AT CHILAPALLI SC COLONY COLONY AT SIRIPURAM (V) OF MANTHANI (M) LR.NO. E4/040/2009 DT. 26-03-2010
31-03-12 2,00,000
21 COMMUNITY ALL AT CHILLAPALLI MANTHANI(M) SRIPURAM (V) OF MANTHANI(M) LR.NO.E4/4040/2009
14-09-12 2,50,000
22. CC ROAD AT SIRIPURAM SC COLONY, SIRIPURAM(V) OF MATHANI(M)SC COLONY, SRIRIPRAM LR.NO.E4/4040/20-09 DT. 26-03-2010
31-03-10 2,00,000
23 SIDE DRAIN AT BESTHAPALLI,SRIPURAM (V) OF MANTHANI(M)
1,50,000
24 DOBHIGHAT AT CHILLAPALLI & SRIPURAM SIRIPURAM (V) OF MANTHANI (M)
14-09-12 2,50,000
25 CON. OF COMPOUND WALL TO GOVT. SCHOOL MANTHANI(V) (M) E4/4040//2009 DT. 08-07-2010
31-08-10 2,50,000
26 CC ROAD KHAUPALLY, MACHUPET (V) OF MUTHURAM (MNT) (M) E4/4040/2009 DT. 19-02-2010
15-04-10 1,50,000
27 WATER PIPE LINE FROM WELLL TO MACHUPET(V) MUTHARAM(MNT) (M)
20-07-11 1,50,000
28 C/O SIDE DRAIN FROM K.MALLAIAH (H) TO B.RAJAMALLU (H) AT LAKKARAM (V) OF MUTHARAM (MNT) (M)
18-02-11 2,00,000
29 CC ROAD R/F D.RAJALINGAM )H) TO CH.GATTAIAH(H) AT LAKKARAM (V) OF MUTHARAM (M) MBNO-40/AK/08
15-04-10 2,00,000
30 CC ROAD & SIDE DRAIN AT GOLLAWADA 18-02-11 2,50,000
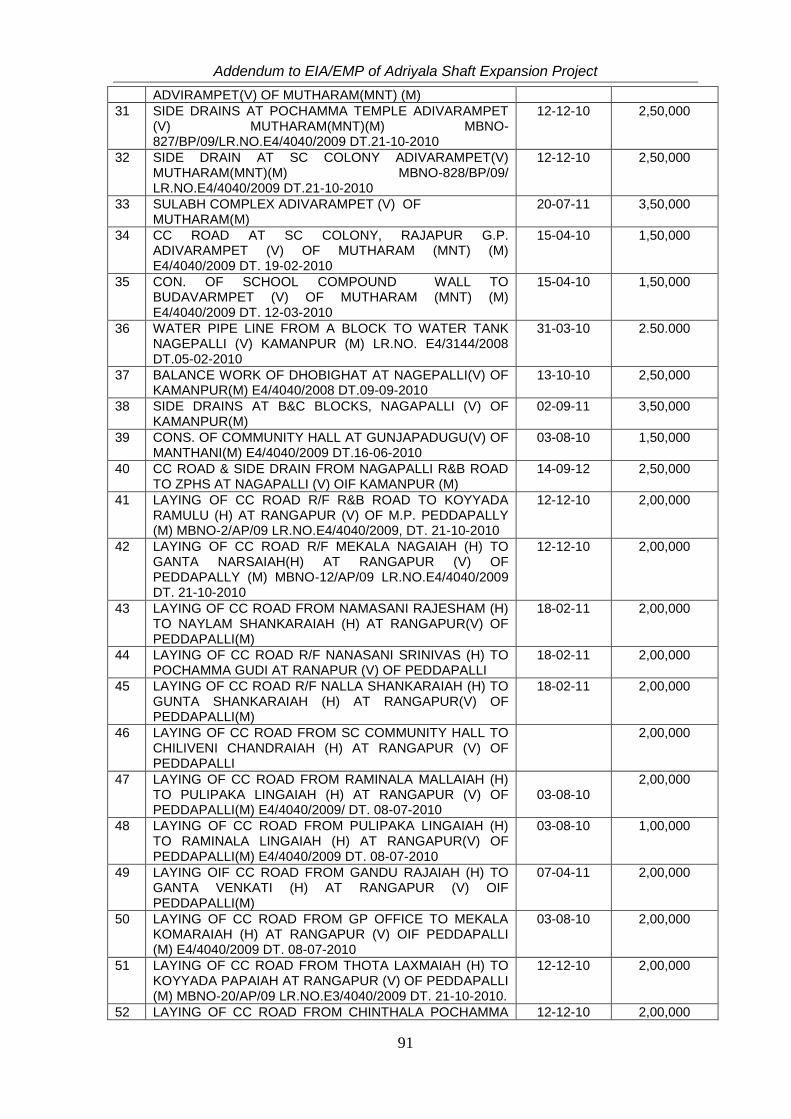
Addendum to EIA/EMP of Adriyala Shaft Expansion Project
91
ADVIRAMPET(V) OF MUTHARAM(MNT) (M)
31 SIDE DRAINS AT POCHAMMA TEMPLE ADIVARAMPET (V) MUTHARAM(MNT)(M) MBNO-827/BP/09/LR.NO.E4/4040/2009 DT.21-10-2010
12-12-10 2,50,000
32 SIDE DRAIN AT SC COLONY ADIVARAMPET(V) MUTHARAM(MNT)(M) MBNO-828/BP/09/ LR.NO.E4/4040/2009 DT.21-10-2010
12-12-10 2,50,000
33 SULABH COMPLEX ADIVARAMPET (V) OF MUTHARAM(M)
20-07-11 3,50,000
34 CC ROAD AT SC COLONY, RAJAPUR G.P. ADIVARAMPET (V) OF MUTHARAM (MNT) (M) E4/4040/2009 DT. 19-02-2010
15-04-10 1,50,000
35 CON. OF SCHOOL COMPOUND WALL TO BUDAVARMPET (V) OF MUTHARAM (MNT) (M) E4/4040/2009 DT. 12-03-2010
15-04-10 1,50,000
36 WATER PIPE LINE FROM A BLOCK TO WATER TANK NAGEPALLI (V) KAMANPUR (M) LR.NO. E4/3144/2008 DT.05-02-2010
31-03-10 2.50.000
37 BALANCE WORK OF DHOBIGHAT AT NAGEPALLI(V) OF KAMANPUR(M) E4/4040/2008 DT.09-09-2010
13-10-10 2,50,000
38 SIDE DRAINS AT B&C BLOCKS, NAGAPALLI (V) OF KAMANPUR(M)
02-09-11 3,50,000
39 CONS. OF COMMUNITY HALL AT GUNJAPADUGU(V) OF MANTHANI(M) E4/4040/2009 DT.16-06-2010
03-08-10 1,50,000
40 CC ROAD & SIDE DRAIN FROM NAGAPALLI R&B ROAD TO ZPHS AT NAGAPALLI (V) OIF KAMANPUR (M)
14-09-12 2,50,000
41 LAYING OF CC ROAD R/F R&B ROAD TO KOYYADA RAMULU (H) AT RANGAPUR (V) OF M.P. PEDDAPALLY (M) MBNO-2/AP/09 LR.NO.E4/4040/2009, DT. 21-10-2010
12-12-10 2,00,000
42 LAYING OF CC ROAD R/F MEKALA NAGAIAH (H) TO GANTA NARSAIAH(H) AT RANGAPUR (V) OF PEDDAPALLY (M) MBNO-12/AP/09 LR.NO.E4/4040/2009 DT. 21-10-2010
12-12-10 2,00,000
43 LAYING OF CC ROAD FROM NAMASANI RAJESHAM (H) TO NAYLAM SHANKARAIAH (H) AT RANGAPUR(V) OF PEDDAPALLI(M)
18-02-11 2,00,000
44 LAYING OF CC ROAD R/F NANASANI SRINIVAS (H) TO POCHAMMA GUDI AT RANAPUR (V) OF PEDDAPALLI
18-02-11 2,00,000
45 LAYING OF CC ROAD R/F NALLA SHANKARAIAH (H) TO GUNTA SHANKARAIAH (H) AT RANGAPUR(V) OF PEDDAPALLI(M)
18-02-11 2,00,000
46 LAYING OF CC ROAD FROM SC COMMUNITY HALL TO CHILIVENI CHANDRAIAH (H) AT RANGAPUR (V) OF PEDDAPALLI
2,00,000
47 LAYING OF CC ROAD FROM RAMINALA MALLAIAH (H) TO PULIPAKA LINGAIAH (H) AT RANGAPUR (V) OF PEDDAPALLI(M) E4/4040/2009/ DT. 08-07-2010
03-08-10
2,00,000
48 LAYING OF CC ROAD FROM PULIPAKA LINGAIAH (H) TO RAMINALA LINGAIAH (H) AT RANGAPUR(V) OF PEDDAPALLI(M) E4/4040/2009 DT. 08-07-2010
03-08-10 1,00,000
49 LAYING OIF CC ROAD FROM GANDU RAJAIAH (H) TO GANTA VENKATI (H) AT RANGAPUR (V) OIF PEDDAPALLI(M)
07-04-11 2,00,000
50 LAYING OF CC ROAD FROM GP OFFICE TO MEKALA KOMARAIAH (H) AT RANGAPUR (V) OIF PEDDAPALLI (M) E4/4040/2009 DT. 08-07-2010
03-08-10 2,00,000
51 LAYING OF CC ROAD FROM THOTA LAXMAIAH (H) TO KOYYADA PAPAIAH AT RANGAPUR (V) OF PEDDAPALLI (M) MBNO-20/AP/09 LR.NO.E3/4040/2009 DT. 21-10-2010.
12-12-10 2,00,000
52 LAYING OF CC ROAD FROM CHINTHALA POCHAMMA 12-12-10 2,00,000
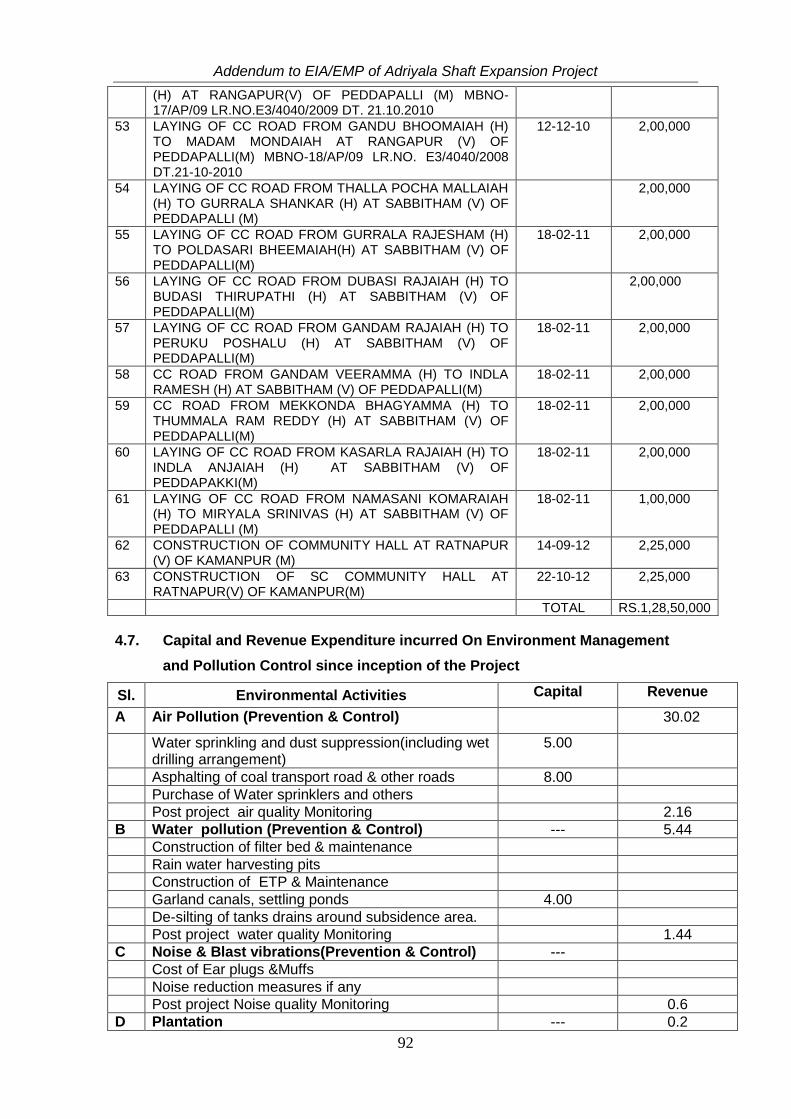
Addendum to EIA/EMP of Adriyala Shaft Expansion Project
92
(H) AT RANGAPUR(V) OF PEDDAPALLI (M) MBNO-17/AP/09 LR.NO.E3/4040/2009 DT. 21.10.2010
53 LAYING OF CC ROAD FROM GANDU BHOOMAIAH (H) TO MADAM MONDAIAH AT RANGAPUR (V) OF PEDDAPALLI(M) MBNO-18/AP/09 LR.NO. E3/4040/2008 DT.21-10-2010
12-12-10 2,00,000
54 LAYING OF CC ROAD FROM THALLA POCHA MALLAIAH (H) TO GURRALA SHANKAR (H) AT SABBITHAM (V) OF PEDDAPALLI (M)
2,00,000
55 LAYING OF CC ROAD FROM GURRALA RAJESHAM (H) TO POLDASARI BHEEMAIAH(H) AT SABBITHAM (V) OF PEDDAPALLI(M)
18-02-11 2,00,000
56 LAYING OF CC ROAD FROM DUBASI RAJAIAH (H) TO BUDASI THIRUPATHI (H) AT SABBITHAM (V) OF PEDDAPALLI(M)
2,00,000
57 LAYING OF CC ROAD FROM GANDAM RAJAIAH (H) TO PERUKU POSHALU (H) AT SABBITHAM (V) OF PEDDAPALLI(M)
18-02-11 2,00,000
58 CC ROAD FROM GANDAM VEERAMMA (H) TO INDLA RAMESH (H) AT SABBITHAM (V) OF PEDDAPALLI(M)
18-02-11 2,00,000
59 CC ROAD FROM MEKKONDA BHAGYAMMA (H) TO THUMMALA RAM REDDY (H) AT SABBITHAM (V) OF PEDDAPALLI(M)
18-02-11 2,00,000
60 LAYING OF CC ROAD FROM KASARLA RAJAIAH (H) TO INDLA ANJAIAH (H) AT SABBITHAM (V) OF PEDDAPAKKI(M)
18-02-11 2,00,000
61 LAYING OF CC ROAD FROM NAMASANI KOMARAIAH (H) TO MIRYALA SRINIVAS (H) AT SABBITHAM (V) OF PEDDAPALLI (M)
18-02-11 1,00,000
62 CONSTRUCTION OF COMMUNITY HALL AT RATNAPUR (V) OF KAMANPUR (M)
14-09-12 2,25,000
63 CONSTRUCTION OF SC COMMUNITY HALL AT RATNAPUR(V) OF KAMANPUR(M)
22-10-12 2,25,000
TOTAL RS.1,28,50,000
4.7. Capital and Revenue Expenditure incurred On Environment Management
and Pollution Control since inception of the Project
Sl. Environmental Activities Capital Revenue
A Air Pollution (Prevention & Control) 30.02
Water sprinkling and dust suppression(including wet drilling arrangement)
5.00
Asphalting of coal transport road & other roads 8.00
Purchase of Water sprinklers and others
Post project air quality Monitoring 2.16
B Water pollution (Prevention & Control) --- 5.44
Construction of filter bed & maintenance
Rain water harvesting pits
Construction of ETP & Maintenance
Garland canals, settling ponds 4.00
De-silting of tanks drains around subsidence area.
Post project water quality Monitoring 1.44
C Noise & Blast vibrations(Prevention & Control) ---
Cost of Ear plugs &Muffs
Noise reduction measures if any
Post project Noise quality Monitoring 0.6
D Plantation --- 0.2
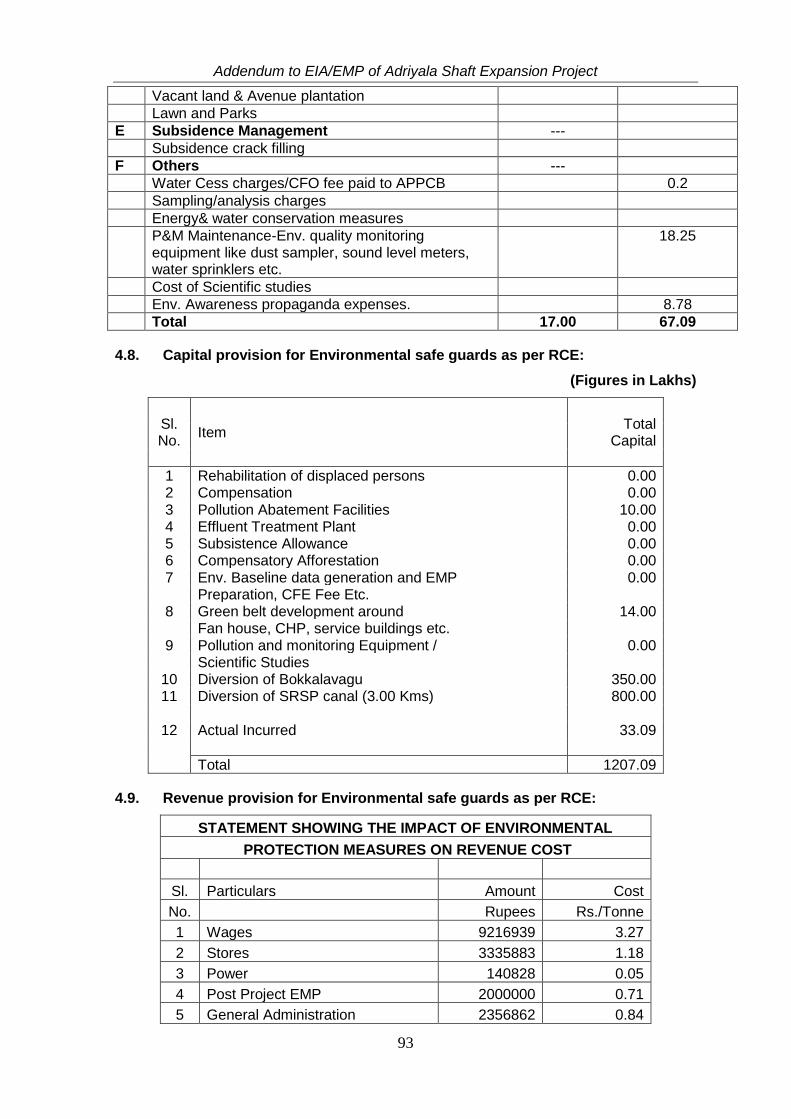
Addendum to EIA/EMP of Adriyala Shaft Expansion Project
93
Vacant land & Avenue plantation
Lawn and Parks
E Subsidence Management ---
Subsidence crack filling
F Others ---
Water Cess charges/CFO fee paid to APPCB 0.2
Sampling/analysis charges
Energy& water conservation measures
P&M Maintenance-Env. quality monitoring equipment like dust sampler, sound level meters, water sprinklers etc.
18.25
Cost of Scientific studies
Env. Awareness propaganda expenses. 8.78
Total 17.00 67.09
4.8. Capital provision for Environmental safe guards as per RCE:
(Figures in Lakhs)
Sl. No.
Item Total
Capital
1 Rehabilitation of displaced persons 0.00 2 Compensation 0.00 3 Pollution Abatement Facilities 10.00 4 Effluent Treatment Plant 0.00 5 Subsistence Allowance 0.00 6 Compensatory Afforestation 0.00 7 Env. Baseline data generation and EMP 0.00 Preparation, CFE Fee Etc. 8 Green belt development around 14.00 Fan house, CHP, service buildings etc. 9 Pollution and monitoring Equipment / 0.00 Scientific Studies
10 Diversion of Bokkalavagu 350.00 11 Diversion of SRSP canal (3.00 Kms) 800.00
12 Actual Incurred 33.09
Total 1207.09
4.9. Revenue provision for Environmental safe guards as per RCE:
STATEMENT SHOWING THE IMPACT OF ENVIRONMENTAL
PROTECTION MEASURES ON REVENUE COST
Sl. Particulars Amount Cost
No. Rupees Rs./Tonne
1 Wages 9216939 3.27
2 Stores 3335883 1.18
3 Power 140828 0.05
4 Post Project EMP 2000000 0.71
5 General Administration 2356862 0.84
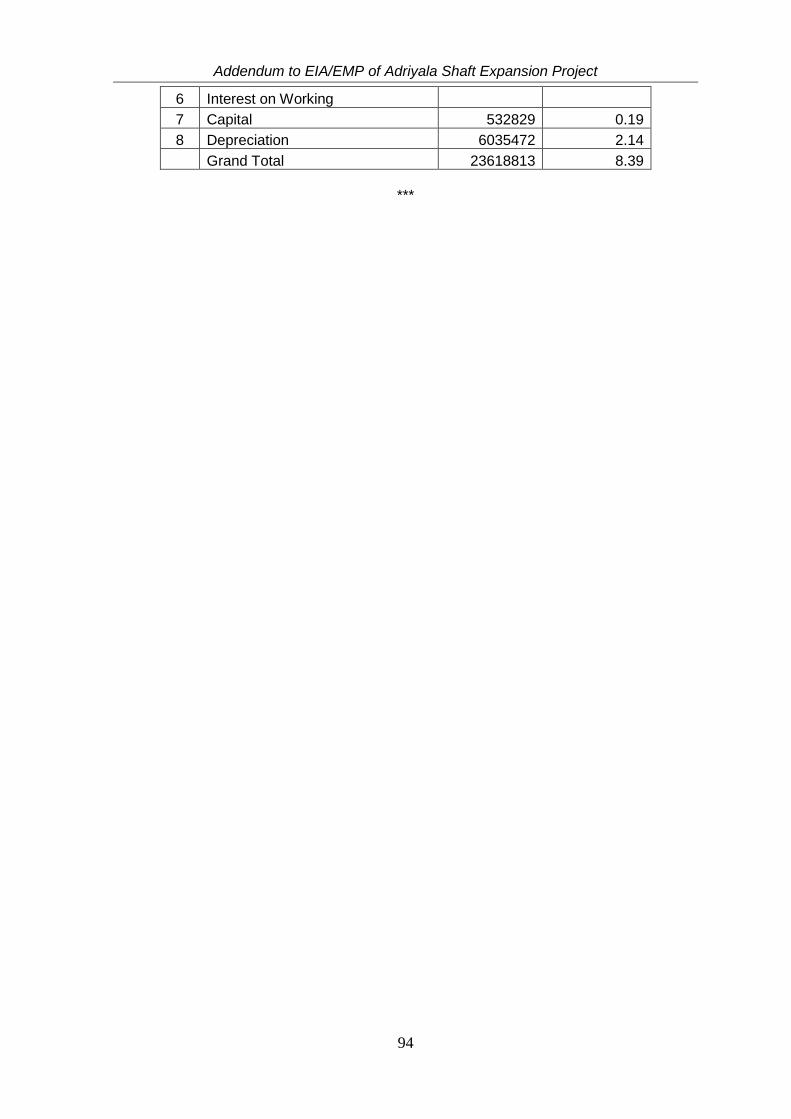
Addendum to EIA/EMP of Adriyala Shaft Expansion Project
94
6 Interest on Working 7 Capital 532829 0.19
8 Depreciation 6035472 2.14
Grand Total 23618813 8.39
***