Embed Size (px)
Citation preview

Health Reports
Catalogue no. 82-003-X ISSN 1209-1367
by Siyuan Liu, Lalani L. Munasinghe, Arto Ohinmaa and Paul J. Veugelers
Added, free and total sugar content and consumption of foods and beverages in Canada
Release date: October 21, 2020
How to obtain more informationFor information about this product or the wide range of services and data available from Statistics Canada, visit our website, www.statcan.gc.ca. You can also contact us by Email at [email protected] Telephone, from Monday to Friday, 8:30 a.m. to 4:30 p.m., at the following numbers:
• Statistical Information Service 1-800-263-1136 • National telecommunications device for the hearing impaired 1-800-363-7629 • Fax line 1-514-283-9350
Depository Services Program
• Inquiries line 1-800-635-7943 • Fax line 1-800-565-7757
Note of appreciationCanada owes the success of its statistical system to a long-standing partnership between Statistics Canada, the citizens of Canada, its businesses, governments and other institutions. Accurate and timely statistical information could not be produced without their continued co-operation and goodwill.
Standards of service to the publicStatistics Canada is committed to serving its clients in a prompt, reliable and courteous manner. To this end, Statistics Canada has developed standards of service that its employees observe. To obtain a copy of these service standards, please contact Statistics Canada toll-free at 1-800-263-1136. The service standards are also published on www.statcan.gc.ca under “Contact us” > “Standards of service to the public.”
Published by authority of the Minister responsible for Statistics Canada
© Her Majesty the Queen in Right of Canada as represented by the Minister of Industry, 2020
All rights reserved. Use of this publication is governed by the Statistics Canada Open Licence Agreement.
An HTML version is also available.
Cette publication est aussi disponible en français.
Research Article Added, free and total sugar content and consumption of foods and beverages in Canada
Statistics Canada, Catalogue no. 82-003-X 14 Health Reports, Vol. 31, no. 10, October 2020
DOI: https://www.doi.org/10.25318/82‑003‑x202001000002‑eng
ABSTRACT
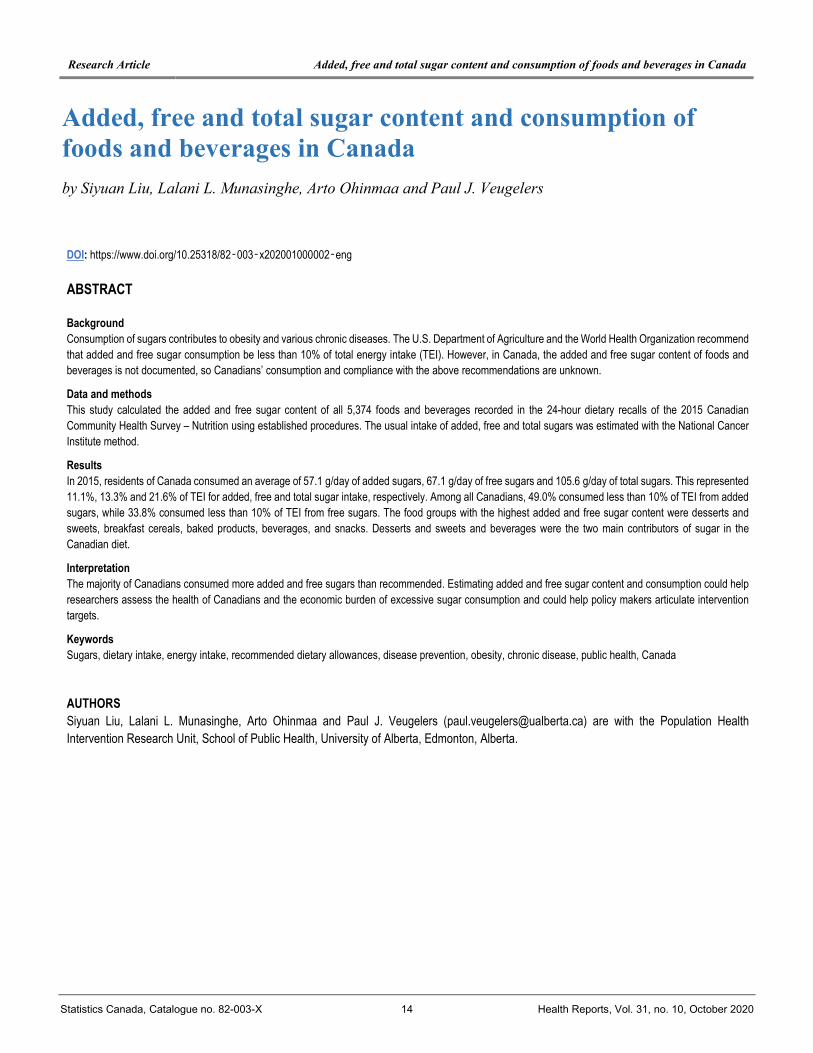
Background
Consumption of sugars contributes to obesity and various chronic diseases. The U.S. Department of Agriculture and the World Health Organization recommend
that added and free sugar consumption be less than 10% of total energy intake (TEI). However, in Canada, the added and free sugar content of foods and
beverages is not documented, so Canadians’ consumption and compliance with the above recommendations are unknown.
Data and methods
This study calculated the added and free sugar content of all 5,374 foods and beverages recorded in the 24-hour dietary recalls of the 2015 Canadian
Community Health Survey – Nutrition using established procedures. The usual intake of added, free and total sugars was estimated with the National Cancer
Institute method.
Results
In 2015, residents of Canada consumed an average of 57.1 g/day of added sugars, 67.1 g/day of free sugars and 105.6 g/day of total sugars. This represented
11.1%, 13.3% and 21.6% of TEI for added, free and total sugar intake, respectively. Among all Canadians, 49.0% consumed less than 10% of TEI from added
sugars, while 33.8% consumed less than 10% of TEI from free sugars. The food groups with the highest added and free sugar content were desserts and
sweets, breakfast cereals, baked products, beverages, and snacks. Desserts and sweets and beverages were the two main contributors of sugar in the
Canadian diet.
Interpretation
The majority of Canadians consumed more added and free sugars than recommended. Estimating added and free sugar content and consumption could help
researchers assess the health of Canadians and the economic burden of excessive sugar consumption and could help policy makers articulate intervention
targets.
Keywords
Sugars, dietary intake, energy intake, recommended dietary allowances, disease prevention, obesity, chronic disease, public health, Canada
AUTHORS
Siyuan Liu, Lalani L. Munasinghe, Arto Ohinmaa and Paul J. Veugelers ([email protected]) are with the Population Health
Intervention Research Unit, School of Public Health, University of Alberta, Edmonton, Alberta.
Added, free and total sugar content and consumption of foods and beverages in Canada
by Siyuan Liu, Lalani L. Munasinghe, Arto Ohinmaa and Paul J. Veugelers

Research Article Added, free and total sugar content and consumption of foods and beverages in Canada
Statistics Canada, Catalogue no. 82-003-X 15 Health Reports, Vol. 31, no. 10, October 2020
n Canada, chronic diseases account for 89% of all deaths1 and more than $80 billion in annual health care costs.2 Adopting healthy lifestyle behaviours, such as healthy eating, has the
potential to prevent 80% of type 2 diabetes and cardiovascular disease, 40% of cancers, and other chronic diseases.1,3 Despite healthy eating recommendations issued by Health Canada,4
eating habits continue to deteriorate, and overweight prevalence rates continue to increase.5
Since sugars contribute to the overall energy composition of diet, excess sugar intake may lead to a positive energy balance and weight gain. Considerable epidemiological and experimental evidence has emerged suggesting an association between sugar consumption and obesity, high blood lipid levels, visceral adiposity, fatty liver disease, insulin resistance, type 2 diabetes, cardiovascular disease, metabolic syndrome, and dental caries.6-
13 While nutritious foods like fruits and milk contain naturally occurring sugars,14 many other foods and beverages contain added and free sugars that, when consumed in excess amounts, increase calorie intake and displace consumption of nutritious foods.15
The definitions of added, free and total sugars vary. This study uses the World Health Organization (WHO) definition of free sugars: “all monosaccharides and disaccharides added to foods by the manufacturer, cook or consumer, and sugars naturally present in honey, syrups, fruit juices and fruit juice concentrates.”6 Added sugars are defined as refined sugars added during cooking or manufacturing, not including naturally occurring sugars and fruit juice.16,17 Total sugars are defined as the sum of all naturally occurring and added sugars.
In 2015, the WHO released new recommendations to reduce the consumption of free sugars to less than 10% of daily total energy intake (TEI), and ideally to less than 5% of TEI to achieve
additional health benefits.6 The 2015-to-2020 edition of Dietary Guidelines for Americans, released by the U.S. Department of Agriculture (USDA), recommends that Americans consume less than 10% of calories from added sugars.
Various countries have documented added and free sugar consumption. For example, in the United States, added sugars were estimated to comprise 13.1% to 17.5% of TEI among children and 11.2% to 14.5% of TEI among adults.18,19 Children in Greece were estimated to obtain 11.2% of TEI from free sugars.20 These population averages exceed the sugar recommendations of the WHO and the USDA and call for interventions to reduce added and free sugar intake. Estimates of added and free sugar consumption are not available for Canada because the added and free sugar content of foods and beverages in Canada is not systematically documented.
In 2004, the average total sugar intake of Canadians was estimated to be 21.4% of daily TEI,21 an estimate that includes both naturally occurring and added sugars. While subsequent work was done to quantify added sugar intake specifically, these estimates did not consider all sources of added sugars.22 Research showed that 66% of 40,000 packaged food products in Canada contained at least one added sugar.23 In a recent study, Bernstein et al.24 estimated the free sugar content of prepackaged foods in Canada using the Food Label Information Program. Although the authors were able to estimate the free sugar content for a large number of prepackaged foods, their work did not include all dietary sources. Therefore, to date, there are no accurate population-based estimates of the added and free sugar content of the Canadian diet.
Given the increasing concerns about the health consequences of excess added and free sugar intake, there is growing interest in applying policies and programs to reduce this consumption.
I
What is already known on this subject?
• Excessive sugar consumption increases the risk of obesity and various chronic diseases.
• Various countries have estimated added and free sugar consumption and proposed or introduced interventions to reduce the consumption of these sugars.
• In Canada, the added and free sugar content of foods and beverages is not systematically documented; therefore, consumption and the potential benefits of interventions are unknown.
What does this study add?
• This study documents the added and free sugar content of all food items recorded in the 2015 Canadian Community Health Survey – Nutrition.
• The majority of Canadians consume more added and free sugars than recommended.
• Added and free sugar value and consumption estimates could facilitate future research into the potential benefits of interventions targeting added or free sugar consumption.
Research Article Added, free and total sugar content and consumption of foods and beverages in Canada
Statistics Canada, Catalogue no. 82-003-X 16 Health Reports, Vol. 31, no. 10, October 2020
Various jurisdictions have introduced such policies and programs to reduce consumption at the population level.25,26 For Canada, scientific research into the health effects of excess added and free
sugar consumption and the potential benefits of interventions starts with a good understanding of added and free sugar consumption at the population level. Therefore, to provide
Research Article Added, free and total sugar content and consumption of foods and beverages in Canada
Statistics Canada, Catalogue no. 82-003-X 17 Health Reports, Vol. 31, no. 10, October 2020
accurate sugar consumption information for researchers and policy makers, this study aims (1) to document the added, free and total sugar content of foods and beverages consumed in Canada; and (2) to estimate the consumption and dietary sources of added, free and total sugars in Canada.
Data and methods
Data sources
The 2015 Canadian Community Health Survey (CCHS) – Nutrition is a cross-sectional national survey that was conducted by Statistics Canada and Health Canada from January to December 2015. The survey recruited individuals aged 1 and older living in private dwellings in the 10 Canadian provinces using a multi-stage, clustered design.27 A national response rate of 61.6% was achieved. The survey’s 24-hour dietary recall collected the food intakes of 20,487 respondents, 7,608 of whom completed a second 24-hour dietary recall. These 24-hour dietary recalls were administered using an Automated Multiple-Pass Method.28 Respondents reported the consumption of 2,784
ingredient-level foods and 2,590 recipe-level foods in the 2015 CCHS – Nutrition. Recipe-level foods are foods that consist of two or more ingredients. A sandwich and Caesar salad are examples of recipe-level foods, and an apple and noodles are examples of ingredient-level foods.27 The nutrient content of ingredient-level foods was used to calculate the nutrient content of recipe-level foods. The Canada Food Guide file was used to determine the serving sizes.28
The University of Alberta Research Ethics Board approved this study (Pro00073295). The 2015 CCHS – Nutrition data were accessed through Statistics Canada’s Research Data Centres Program.
Estimation of the added and free sugar content of foods
and beverages
Statistics Canada calculated the nutrient intake, including total sugar intake, for respondents based on the consumption and nutrient content of the reported foods and beverages. However, this calculation does not include added and free sugar intake, as
0.0 5.0 10.0 15.0 20.0 25.0 30.0 35.0 40.0 45.0
Fats and oils
Meats
Sausages and luncheon meats
Pasta, grains and flours
Eggs
Vegetables
Spices
Soups, sauces and gravies
Nuts and seeds
Dairy products
Snacks
Fruit juice
Breakfast cereals
Beverages
Baby foods
Baked products
Fruits
Desserts and sweets
Average sugar content (g / 100 g)
Food group
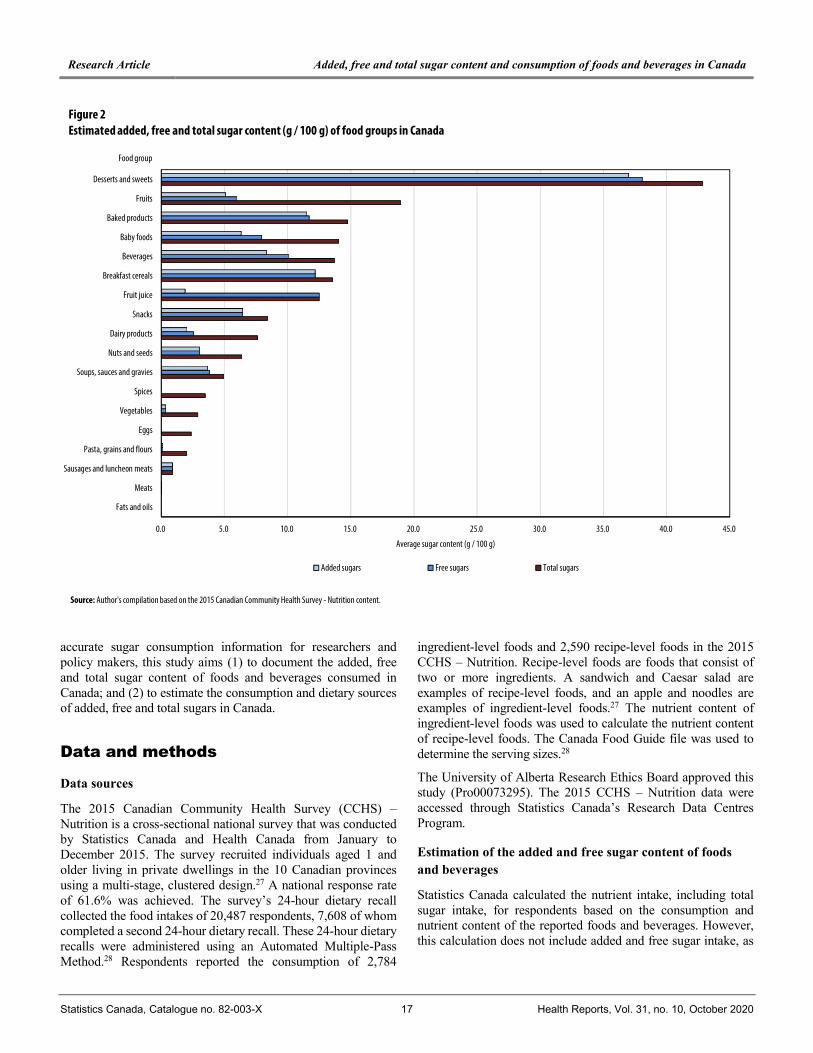
Figure 2 Estimated added, free and total sugar content (g / 100 g) of food groups in Canada
Added sugars Free sugars Total sugars
Source: Author's compilation based on the 2015 Canadian Community Health Survey - Nutrition content.

Research Article Added, free and total sugar content and consumption of foods and beverages in Canada
Statistics Canada, Catalogue no. 82-003-X 18 Health Reports, Vol. 31, no. 10, October 2020
the added and free sugar content of foods and beverages is not systematically documented in Canada.
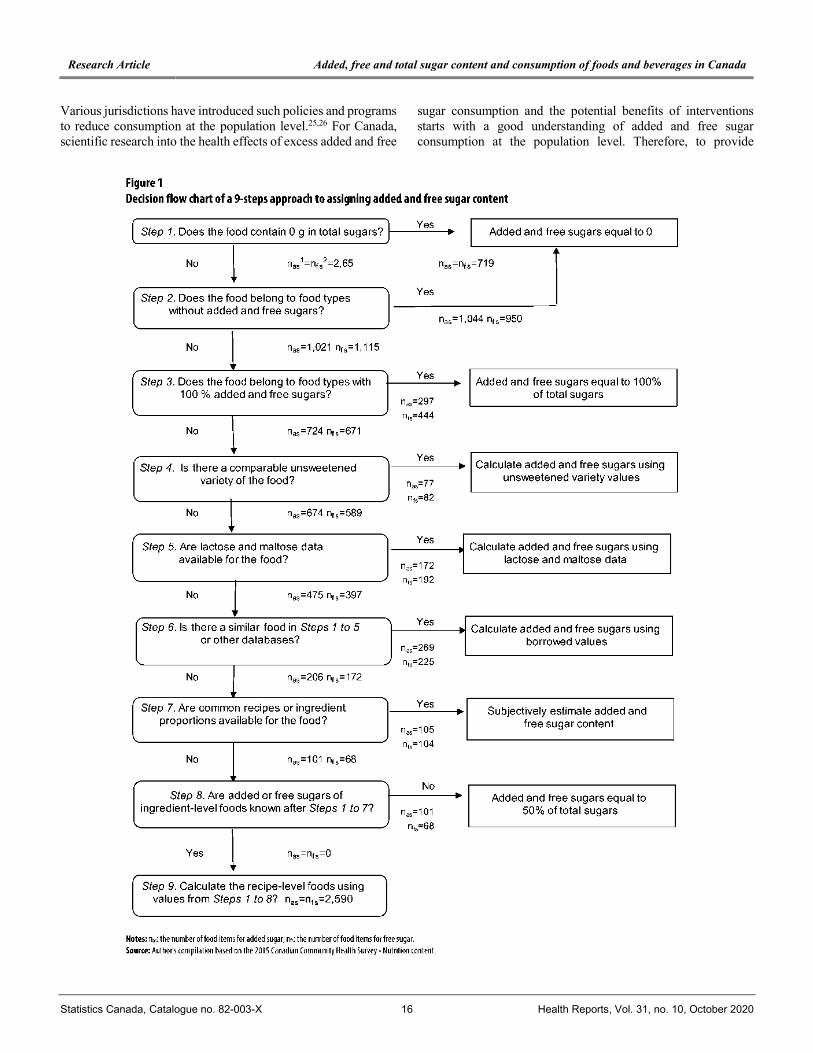
In 2015, Louie et al. 17 published a decision tree with a systematic methodology to estimate the added sugar content of foods in Australia. Their 10-step standardized approach had high inter-rater repeatability and was designed for both national (Australia) and international use.17 The approach by Louie et al.17 was adapted for use in Canada. Figure 1 illustrates the decision algorithm of the nine-step approach. Note that 1 of the 10 steps from the Louie et al. approach (step number 4) was omitted because recipe-level foods in the 2015 CCHS – Nutrition dataset used more than one recipe. A brief description of each of the nine steps is provided below. More details on each of the steps are provided elsewhere.29
Step 1: Assign 0 g of added and free sugars for ingredient-level foods that contain 0 g in total sugars.
Step 2: Assign 0 g of added and free sugars for ingredient-level foods that are unprocessed or processed without added or free sugars.
Assign 0 g of added sugars for food types such as unsweetened fruit or vegetable juice (including concentrate), unsweetened dairy products, and all fats and oils. Assign 0 g of free sugars for these food types, except for fruit juice and foods with fruit juice.
Step 3: Assign 100% of total sugars as added and free sugars for ingredient-level foods with very little naturally occurring sugars.
Assign 100% of total sugars as added sugars for food types such as sugar-sweetened beverages, confectionery, sugars, syrups and
sweetener without added fruits, chocolate, and dairy products. Assign 100% of total sugars as free sugars for these food types and for 100% fruit juice and foods that contain fruits.
Step 4: Calculate added and free sugar content by comparing the total sugar content of a food or beverage with the sugar content of an unsweetened version of this food or beverage.
Added sugars and free sugars per 100 g (AS100g and FS100g) were calculated using the following formulas:
AS100g = ��� x (��� – ����)
(���– ���� ), and
FS100g = ��� x (��� – ����)
(���– ���� ),
where TS� is the total sugar content per 100 g of the sweetened food or beverage, and TS�� is the total sugar content per 100 g of the unsweetened food or beverage.
Step 5: Calculate added and free sugar content based on lactose and maltose content.
Where data for lactose and maltose were available in the Canadian Nutrient File or the USDA Food Composition Database, added sugar and free sugar content of ingredient-level foods was calculated using the following formulas:
AS100g = TS100g – lactose100g – maltose100g, and
FS100g = TS100g – lactose100g – maltose100g.
Food name Added sugars (g / 100 g) Free sugars (g / 100 g) Total sugars (g / 100 g)
Ravioli, cheese-filled with marinara sauce 2.0 2.2 4.5
Granola bar, chewy, fruit flavour, yogurt coated 18.2 25.3 34.1
Cereal, hot, oats, instant, flavoured, dry 0.7 0.7 1.4
Dessert, frozen, ices, water, lime 30.5 32.6 32.6
Yogurt, goat, fruit flavoured 4.8 7.3 9.6
Juice drink, cranberry and apricot, bottled 0.0 14.6 14.6
Spread, 20% butter / 80% canola oil 0.0 0.0 0.0
Mollusks, oyster, eastern (blue point), wild, raw 0.0 0.0 0.6
Deli meat, salami (Hungarian), pork and beef, cooked 0.8 0.8 0.8
Nuts, almonds, toasted, unblanched 0.0 0.0 4.8
Beans, baked, canned, with pork and tomato sauce 5.1 5.7 5.7
Cherry, sweet, canned, juice pack, solids and liquid 0.0 4.5 12.3
Snacks, plantain chips 0.5 0.5 0.9
Pomegranate juice, ready-to-drink 0.0 12.7 12.7
Soup, tomato rice, canned, condensed, water added 1.8 3.0 3.0
Baby food, cereal, rice, with milk powder and fruit, dry 14.5 16.3 29.1
Spices, onion powder 0.0 0.0 6.6
Egg, chicken, dried, whole 0.0 0.0 0.3
Table 1 Added, free and total sugar content of selected ingredient-level foods
Notes: A table with added, free and total sugar content of all 2,784 ingredient-level foods recorded in the 2015 Canadian Community Health Survey – Nutrition is available elsewhere [29]. In addition to added sugars and free sugars, total sugars include mostly naturally occurring sugars such as lactose, fructose and maltose (see text and [29] for details).
Source: Author's compilation based on the 2015 Canadian Community Health Survey - Nutrition content.

Research Article Added, free and total sugar content and consumption of foods and beverages in Canada
Statistics Canada, Catalogue no. 82-003-X 19 Health Reports, Vol. 31, no. 10, October 2020
Step 6: Calculate added sugar and free sugar content using the content values of similar foods from steps 1 to 5 or other nutrient databases.
Similar foods captured in steps 1 to 5 and in the Australian Food, Supplement and Nutrient Database were searched for information on added and free sugars. Foods were considered to be similar if they differed only in water content, if they contained similar ingredients (such as similar vegetables in soup), or if they were reduced in calories or energy or fat. Where a similar food was identified (matching), the added and free sugar content of the target food was estimated using the following formulas:
AStarget = TStarget x (ASmatching/TSmatching),
and FStarget = TStarget x (FSmatching/TSmatching).
Step 7: Estimate added and free sugar content for ingredient-level foods subjectively based on common recipes and ingredient lists.
Step 8: Assign 50% of total sugars as added and free sugar content for all remaining ingredient-level foods.
Step 9: Calculate added and free sugar content for recipe-level foods using respondent-specific recipes and the above estimated added and free sugar content of ingredient-level foods.
After all ingredient-level foods in the 2015 CCHS – Nutrition were estimated (steps 1 to 8), the added and free sugar content of recipe-level foods was calculated using the following formulas:
AS100g = ∑ ��� x �������
∑ ������
and FS100g = ∑ ��� x �������
∑ ������
,
where ��� is the raw weight of the �th ingredient in the recipe, �� is the weight of the �th ingredient in the recipe after cooking, ��� is the added sugar content per 100 g of the �th ingredient and ��� is the free sugar content per 100 g of the �th ingredient.
The average added and free sugar content of ingredient-level foods was calculated for 18 food groups (displayed in Figure 2). These food groups were based on the Bureau of Nutritional Sciences Food Group Codes and Descriptions30 and the Canadian Nutrient File food groups.31
Estimation of usual intake of added, free and total sugar
The National Cancer Institute (NCI) method was applied to estimate the distribution of usual intake of added, free and total sugar by Canadians.32 The NCI method assumes that usual intake is equal to the probability of consumption on a given day times the average amount consumed on a “consumption day”33 and uses repeated 24-hour recalls. Depending on whether certain nutrients are commonly consumed (i.e., daily and by most respondents), this method uses either a one-part or a two-part model.34 The one-part model considers only the amount of a nutrient consumed and is to be applied to nutrients that are commonly consumed. The two-part model considers both the proportion of the population consuming the nutrient and the amount of the nutrient consumed, and it is to be applied to nutrients that are not commonly consumed. This study assumed that added, free and total sugars were consumed daily and by all members of the population. For the usual intake of added, free and total sugars for each of the 18 food groups, this study considered the proportion of the population that consumed no sugar. A one-part model was applied for food groups where less than 5% of the population consumed no sugar. A two-part model was applied for food groups where more than 20% of the population consumed no sugar. For food groups where 5% to 20% of the population consumed no sugar, both models were fitted, and the model with the best fit was used.34 For the usual intake of added and free sugars expressed as a percentage of TEI, an extension of the NCI method was used.34,35
All analyses included age, sex, the sequence of 24-hour recalls (first recall versus second recall), and the 24-hour recall collection day of the week (weekdays, or Monday to Thursday, versus weekends, or Friday to Sunday) as covariates when accommodating individual-level and within-individual variation. Sampling weights provided by Statistics Canada were used to ensure study estimates apply to residents of Canada (for ease of presentation referred to as Canadians). All statistical analyses were performed using SAS (version 9.4, SAS Institute) software. SAS Macros of the NCI method were available online.36
5th 10th 25th 50th 75th 90th 95th <5% TEI <10% TEIAdded sugar intake (grams per day) 57.1 13.8 18.5 29.6 47.7 74.2 107.2 132.3 … …Free sugar intake (grams per day) 67.1 17.7 23.7 37.0 58.0 87.2 122.1 147.8 … …Total sugar intake‡ (grams per day) 105.6 45.3 54.2 72.4 98.0 130.5 166.6 191.9 … …TEI†† from added sugars (%) 11.1 3.8 4.9 7.1 10.1 14.1 18.4 21.4 … 49.0TEI from free sugars (%) 13.3 4.9 6.2 8.7 12.3 16.8 21.6 24.9 5.4 33.8TEI from total sugars (%) 21.6 11.3 13.0 16.3 20.6 25.8 31.5 35.3 … …… not applicable ‡ Total sugar intake, free sugar intake and added sugar intake were adjusted for inter-individual variation (sequence of the 24-hour recall and 24-hour recall collection day of the week) and for intra-individual variation (age and gender).†† TEI: total energy intake.Notes: The U.S. Department of Agriculture recommends that added sugar consumption not exceed 10% of TEI; the World Health Organization recommends that free sugar not exceed 5% and 10% of the TEI.
Source: Author's compilation based on the 2015 Canadian Community Health Survey - Nutrition content.
Percentile RecommendationsMean
Table 2 The distribution of usual intake of added, free and total sugars and adherence to recommendations, Canada, 2015

Research Article Added, free and total sugar content and consumption of foods and beverages in Canada
Statistics Canada, Catalogue no. 82-003-X 20 Health Reports, Vol. 31, no. 10, October 2020
Results
Estimated added, free and total sugar content of foods and
beverages
The added and free sugar content of 2,784 ingredient-level foods and 2,590 recipe-level foods consumed in Canada was calculated using the nine-step method. Table 1 shows the sugar content of selected ingredient-level food items recorded in the 2015 CCHS – Nutrition. The table provides one example for each of the 18 food groups. A table with the added, free and total sugar content of all ingredient-level foods is available elsewhere29 for public use. Recipes (and recipe-level foods) are respondent-specific and subject to restricted release for confidentiality reasons, but they can be calculated from the ingredient-level foods.
Estimated added, free and total sugar content of food
groups
For each of the 18 food groups, Figure 2 shows the average added, free and total sugar content of all foods and beverages reported by respondents. Desserts and sweets had the highest added, free and total sugar content, at 37.0, 38.1 and 42.9 g per
100 g, respectively. Except for fruits, all food groups high in total sugar also had high added and free sugar content. Breakfast cereals, baked products, beverages, baby foods and snacks were the food groups that contained high free and added sugar content. Fruit juice had high free sugar content (12.5 g / 100 g) but low added sugar content (1.9 g / 100 g). Fats and oils, meats, sausages and luncheon meats, pasta, grains and flours, eggs, vegetables, spices, soups, sauces and gravies, nuts and seeds, and dairy products had relatively low sugar content.
Estimated added, free and total sugar consumption and
adherence to recommendations
Table 2 shows the mean and percentiles of usual added, free and total sugar intake in Canada. Canadians consume daily, on average, 57.1 g of added sugars, 67.1 g of free sugars and 105.6 g of total sugars. On average, added sugars constitute approximately 54.1% of total sugars, and free sugars make up approximately 63.5% of total sugars. The average estimated added, free and total sugar intake contributed to 11.1%, 13.3% and 21.6% of TEI, respectively.
A comparison between added and free sugar consumption and the recommended added and free sugar intake is also presented in Table 2. The USDA recommendation (added sugar intake below
67.3
57.5
41.1
12.9
17.4
17.5
12.6
11.6
2.5
3.9 7.2 7.9
5.3 5.8 6.7
4.8 4.2 4.0 2.6 2.9 2.4 2.0
0
10
20
30
40
50
60
70
80
90
100
Added sugar intake (percent) Free sugar intake (percent) Total sugar intake (percent)
percent
Sugar intake
Figure 3 Contribution of food groups to the intake of added, free and total sugars in Canada
Desserts and sweets Fruits Beverages Dairy products Baked products Fruit juice Others Soups, sauces and gravies Breakfast cereals
Source: Author's compilation based on the 2015 Canadian Community Health Survey - Nutrition content.
Research Article Added, free and total sugar content and consumption of foods and beverages in Canada
Statistics Canada, Catalogue no. 82-003-X 21 Health Reports, Vol. 31, no. 10, October 2020
10% of TEI) was met by 49.0% of Canadians. A lower percentage of Canadians adhered to the WHO recommendations for free sugars: free sugars made up less than 10% of TEI for 33.8% of Canadians; free sugars made up less than 5% of TEI for 5.4% of Canadians.
Contribution of food groups to added, free and total sugar
intake
The contribution of each of the 18 food groups to added, free and total sugar intake is summarized in Figure 3. Desserts and sweets and beverages were the two food groups that contributed the most to added, free and total sugar intake in the Canadian diet. An estimated 67.3%, 57.5% and 41.1% of added, free and total sugar intake, respectively, came from desserts and sweets, and an estimated 17.4%, 17.5% and 12.6% of added, free and total sugar intake, respectively, came from beverages. Other food groups, such as baked products, soups, sauces and gravies, and breakfast cereals, also contributed to added, free and total sugar intake.
There were some differences in the relative contribution of food groups to the intake of added, free and total sugars (Figure 3). Fruits (12.9%) and dairy products (11.6%) were significant sources of total sugar intake, but not primary sources of added and free sugar intake.
Discussion
This study revealed the added, free and total sugar content and consumption of foods and beverages in Canada. For the majority of Canadians, consumption of added and free sugars exceeded USDA and WHO recommendations. Desserts and sweets and beverages contributed to most of the added, free and total sugar intake of Canadians.
Both the USDA’s added sugar definition and the WHO’s free sugar definition were applied in the present study. Added sugars differ from free sugars in their exclusion of naturally occurring sugars in fruit juices and fruit juice concentrates. Various studies have not clearly defined added and free sugars,17,18,19,24 whereas the present study and others37,38 have demonstrated substantial differences in the consumption of added versus free sugars.
Total sugar intake in Canada was estimated at 110.0 g/day using the 2004 CCHS – Nutrition.21 This seems higher than the 105.6 g/day that was estimated in this study using the 2015 CCHS – Nutrition. Langlois et al.,39 who studied the temporal changes in total sugar consumption, concluded that the apparent reduction between 2004 and 2015 may actually be caused by misreporting as a result of changes in survey methodology. They also reported that total sugar consumption from foods actually increased between 2004 and 2015, while total sugar intake from beverages decreased.39 Studies from other countries and of earlier time periods concluded that total sugar intake either decreased or levelled off, both in absolute terms (g/day) and in relative terms (percentage of total sugar in TEI).40,41,42
To date, very few studies of added and free sugar consumption have been population-based, and very few have reported on compliance with USDA and WHO recommendations. Louie et al. found that 1% of Australian children and youth (aged 2 to 16) consumed added sugars below 5% of TEI, and 18.1% consumed added sugars below 10% of TEI.42 Sluik et al. revealed that 29% of Dutch residents (aged 7 and older) met the recommendation for added sugars (less than 10% of TEI) and 19% met the recommendation for free sugars (less than 10% of TEI).38 The present study’s estimates that 49.0% and 33.8% of Canadians met the existing recommendations for added and free sugars, respectively, are notably higher than these Australian and Dutch estimates.
This study revealed that desserts and sweets, breakfast cereals, baked products, beverages, and snacks are food groups with high added and free sugar content. This ranking seems consistent with the ranking by Bernstein et al. for prepackaged foods and beverages.24 This study also showed that the intake of added, free and total sugars through desserts and sweets was substantially higher than the intake of these sugars through beverages. This appears to be consistent with observations from a review of 11 European studies that concluded that sweet products contributed to a higher proportion of added sugar intake (40% to 50% for children and 36% to 61% for adults) than beverages did (20% to 34% for children and 12% to 31% for adults).43
Various countries and jurisdictions have adopted strategies to improve diet quality or reduce energy intake. These include food guides, school nutrition policies, front-of-package labelling, social marketing and various forms of taxation.4,25,44,45 Several studies have reported on the effectiveness of these interventions and the extent to which they resulted in a decrease in added and free sugar consumption.26,46,47 However, other studies have shown that there remains plenty of room for improvement. For example, economic evaluations revealed that Canada would have avoided health care costs of approximately $863 million in 2014 and $830 million in 2018 if Canadians had avoided consuming sugar-sweetened beverages.48,49 The present study’s added and free sugar value and consumption estimates may support future research into the health and economic costs associated with the consumption of these sugars. They may also inform potential intervention targets for added and free sugar consumption.
The present study has several strengths. It uses the 2015 CCHS – Nutrition, which is a large population-based survey that included the 24-hour recall data of more than 20,000 respondents, with repeat measures, to allow for the estimation of usual intake. A study limitation relates to the subjective judgment used in steps 6, 7 and 8, as this may have introduced error in the estimates of added and free sugar content. However, these steps did involve a limited number of foods and beverages: Figure 1 shows that they involved 475 (8.8%) of the 5,374 recorded foods and beverages when estimating added sugars and 397 (7.4%) of the foods and beverages when estimating free sugars. In addition, Louie et al.17
reported high inter-rater repeatability for this methodology. Another limitation relates to the use of 24-hour recalls, which are prone to error, as is every dietary assessment method.
Research Article Added, free and total sugar content and consumption of foods and beverages in Canada
Statistics Canada, Catalogue no. 82-003-X 22 Health Reports, Vol. 31, no. 10, October 2020
Acknowledgments
This research was funded through an operating grant by the Canadian Institutes of Health Research (grant number 384559) to Paul J. Veugelers. This research was also supported by funds to the Canadian Research Data Centres Network (CRDCN) from the Social Sciences and Humanities Research Council, the
Canada Foundation for Innovation, and Statistics Canada. Although the research and analysis are based on data from Statistics Canada, the opinions expressed do not represent the views of Statistics Canada or the CRDCN.
Research Article Added, free and total sugar content and consumption of foods and beverages in Canada
Statistics Canada, Catalogue no. 82-003-X 23 Health Reports, Vol. 31, no. 10, October 2020
References 1. World Health Organization. Facing the facts: the impact of chronic
disease in Canada. In: Preventing Chronic Diseases: A Vital Investment.
2015.
2. Mirolla M. The cost of chronic disease in Canada. The Chronic Disease
Prevention Alliance of Canada, 2004.
3. Willms JD, Tremblay MS, Katzmarzyk PT. Geographic and
demographic variation in the prevalence of overweight Canadian
children. Obesity Research 2003; 11(5): 668-73.
4. Health Canada. Canada’s Dietary Guidelines for Health Professionals
and Policy Makers. 2019.
5. Twells LK, Gregory DM, Reddigan J, Midodzi WK. Current and
predicted prevalence of obesity in Canada: a trend analysis. CMAJ Open
2014; 2(1): e18-26.
6. World Health Organization. Guideline: Sugars Intake for Adults and
Children. Geneva, 2015.
7. Malik VS, Pan A, Willett WC, Hu FB. Sugar-sweetened beverages and
weight gain in children and adults: a systematic review and meta-
analysis. American Journal of Clinical Nutrition 2013; 98(4): 1084-102.
8. Malik VS, Popkin BM, Bray GA, et al. Sugar-sweetened beverages and
risk of metabolic syndrome and type 2 diabetes: a meta-analysis.
Diabetes Care 2010; 33(11): 2477-83.
9. Duffey KJ, Gordon-Larsen P, Steffen LM, et al. Drinking caloric
beverages increases the risk of adverse cardiometabolic outcomes in the
Coronary Artery Risk Development in Young Adults (CARDIA) Study.
American Journal of Clinical Nutrition 2010; 92(4): 954-9.
10. Bremer AA, Auinger P, Byrd RS. Sugar-sweetened beverage intake
trends in US adolescents and their association with insulin resistance-
related parameters. Journal of Nutrition and Metabolism 2010; 2010: 1-8.
11. Fung TT, Malik V, Rexrode KM, et al. Sweetened beverage
consumption and risk of coronary heart disease in women. American
Journal of Clinical Nutrition 2009; 89(4): 1037-42.
12. Odegaard AO, Choh AC, Czerwinski SA, et al. Sugar-sweetened and
diet beverages in relation to visceral adipose tissue. Obesity (Silver
Spring) 2012; 20(3): 689-91.
13. Sheiham A, James WPT. A reappraisal of the quantitative relationship
between sugar intake and dental caries: the need for new criteria for
developing goals for sugar intake. BMC Public Health 2014; 14: 863.
14. Murphy SP, Johnson RK. The scientific basis of recent US guidance on
sugars intake. American Journal of Clinical Nutrition 2003; 78(4): 827-
33.
15. Vartanian LR, Schwartz MB, Brownell KD. Effects of soft drink
consumption on nutrition and health: a systematic review and meta-
analysis. American Journal of Public Health 2007; 97(4): 667-75.
16. U.S. Department of Health and Human Services and U.S. Department
of Agriculture. 2015–2020 Dietary Guidelines for Americans. 8th
edition. December 2015.
17. Louie JCY, Moshtaghian H, Boylan S, et al. A systematic methodology
to estimate added sugar content of foods. European Journal of Clinical
Nutrition 2015; 69(2): 154-61.
18. Ervin RB, Ogden CL. Consumption of added sugars among U.S. adults,
2005-2010. NCHS Data Briefs 2013; 122: 1-8.
19. Ervin RB, Kit BK, Carroll MD, Ogden CL. Consumption of added
sugar among U.S. children and adolescents, 2005-2008. NCHS Data
Briefs 2012; 87: 1-8.
20. Farajian P, Risvas G, Panagiotakos DB, Zampelas A. Food sources of
free sugars in children’s diet and identification of lifestyle patterns
associated with free sugars intake: the GRECO (Greek Childhood
Obesity) study. Public Health Nutrition 2016; 19(13): 2326-35.
21. Langlois K, Garriguet D. Sugar consumption among Canadians of all
ages. Health Reports 2011; 22(3): 23-7.
22. Brisbois TD, Marsden SL, Anderson GH, Sievenpiper JL. Estimated
intakes and sources of total and added sugars in the Canadian diet.
Nutrients 2014; 6(5): 1899-912.
23. Acton RBV, Hobin EP, Hammond D. Added sugar in the packaged
foods and beverages available at a major Canadian retailer in 2015: a
descriptive analysis. CMAJ Open 2017; 5(1): e1-6.
24. Bernstein JT, Schermel A, Mills CM, L’Abbé MR. Total and free sugar
content of Canadian prepackaged foods and beverages. Nutrients 2016;
8(9): 582.
25. Falbe J, Thompson HR, Becker CM, et al. Impact of the Berkeley excise
tax on sugar-sweetened beverage consumption. American Journal of
Public Health 2016; 106(10): 1865-71.
26. Colchero MA, Popkin BM, Rivera JA, Ng SW. Beverage purchases
from stores in Mexico under the excise tax on sugar sweetened
beverages: observational study. The BMJ 2016; 352: h6704.
27. Health Canada. 2015 Canadian Community Health Survey—Nutrition
User Guide, Ottawa: Health Canada, 2018.
28. Tooze JA, Midthune D, Dodd KW, et al., A new statistical method for
estimating the usual intake of episodically consumed foods with
application to their distribution. Journal of the American Dietetic
Association 2006; 106: 1575-87.
29. A description of the nine-step approach for calculating added and free
sugar content is available in https://roi4kids.com/wp-
content/uploads/2020/07/description-of-calculating-added-and-free-
sugar.pdf and the estimated values of added and free sugar content of
all foods and beverages recorded in the 2015 Canadian Community
Health Survey – Nutrition are in https://roi4kids.com/wp-
content/uploads/2020/07/calculated-values-of-added-and-free-
sugar.pdf .
30. Health Canada. Bureau of Nutritional Sciences (BNS) Food Group
Codes and Descriptions - Canadian Community Health Survey (CCHS)
2.2. Available at: http://www23.statcan.gc.ca/imdb-
bmdi/pub/document/5049_D23_T9_V1-eng.pdf.

Research Article Added, free and total sugar content and consumption of foods and beverages in Canada
Statistics Canada, Catalogue no. 82-003-X 24 Health Reports, Vol. 31, no. 10, October 2020
31. Health Canada. Canadian Nutrient File, 2015. Available at:
www.healthcanada.gc.ca/cnf.
32. National Cancer Institute. Usual Dietary Intakes: The NCI Method.
Available at:
http://riskfactor.cancer.gov/diet/usualintakes/method.html.
33. National Cancer Institute. Usual Dietary Intakes: Food Intakes, U.S.
Population, 2007-10. Epidemiology and Genomics Research Program.
Available at: https://epi.grants.cancer.gov/diet/usualintakes/national-
data-usual-dietary-intakes-2007-to-2010.pdf.
34. National Cancer Institute. Selected Intakes as Ratios of Energy Intake,
U.S. Population, 2001-04. Epidemiology and Genomics Research
Program. Available at:
https://epi.grants.cancer.gov/diet/usualintakes/national-data-usual-
dietary-intakes-2001-to-2004.
35. Freedman LS, Guenther PM, Dodd KW, et al. The population
distribution of ratios of usual intakes of dietary components that are
consumed every day can be estimated from repeated 24-hour recalls.
The Journal of Nutrition 2010; 140: 111-6.
36. National Cancer Institute. Usual Dietary Intakes: SAS Macros for the
NCI Method. Epidemiology and Genomics Research Program.
Available at:
https://epi.grants.cancer.gov/diet/usualintakes/macros.html.
37. Sluik D, Lee LV, Engelen AI, Feskens EJM. Total, free, and added
sugar consumption and adherence to guidelines: the Dutch National
Food Consumption Survey 2007–2010. Nutrients 2016; 8: 70.
38. Kibblewhite R, Nettleton A, McLean R, et al. Estimating free and added
sugar intakes in New Zealand. Nutrients 2017; 9: 1292.
39. Langlois K, Garriguet D, Gonzalez A, et al. Change in total sugars
consumption among Canadian children and adults. Health Reports
2019; 30(1): 10-19.
40. Welsh JA, Sharma AJ, Grellinger L, Vos MB. Consumption of added
sugars is decreasing in the United States. American Journal of Clinical
Nutrition 2011; 94: 726-34.
41. Wittekind A, Walton J. Worldwide trends in dietary sugars intake.
Nutrition Research Reviews 2014; 27: 330-45.
42. Louie JCY, Moshtaghian H, Rangan AM, et al. Intake and sources of
added sugars among Australian children and adolescents. European
Journal of Nutrition 2016; 55: 2347-55.
43. Azaïs-Braesco V, Sluik D, Maillot M, et al. A review of total & added
sugar intakes and dietary sources in Europe. Nutrition Journal 2017;
16: 6.
44. Cradock AL, McHugh A, Mont-Ferguson H, et al. Effect of school
district policy change on consumption of sugar-sweetened beverages
among high school students, Boston, Massachusetts, 2004-2006.
Preventing Chronic Disease 2011; 8(4): A74.
45. Sandoval LA, Carpio CE, Sanchez-Plata M. The effect of “Traffic-
Light” nutritional labelling in carbonated soft drink purchases in
Ecuador. PLOS One 2019; 14(10): e0222866.
46. Cobiac LJ, Tam K, Veerman L, Blakely T. Taxes and subsidies for
improving diet and population health in Australia: a cost-effectiveness
modelling study. PLOS Medicine 2017; 14(2): e1002232.
47. Jones AC. Predicting the Potential Health and Economic Impact of a
Sugary Drink Tax in Canada: A Modelling Study. 2018. Available at:
https://uwspace.uwaterloo.ca/handle/10012/13021.
48. Lieffers JRL, Ekwaru JP, Ohinmaa A, Veugelers PJ. The economic
burden of not meeting food recommendations in Canada: the cost of
doing nothing. PLOS One 2018; 13(4): e0196333.
49. Loewen OK, Ekwaru JP, Ohinmaa A, Veugelers PJ. Economic burden
of not complying with Canadian food recommendations in 2018.
Nutrients 2019; 11: 2529.