Embed Size (px)
Citation preview
ADAPTIVE TRANSMIT POWER CONTROL BASED ONSIGNAL STRENGTH AND FRAME LOSS
MEASUREMENTS FOR WLANS
BY HARIHARASUDHAN VISWANATHAN
A thesis submitted to the
Graduate School—New Brunswick
Rutgers, The State University of New Jersey
in partial fulfillment of the requirements
for the degree of
Master of Science
Graduate Program in Electrical and Computer Engineering
Written under the direction of
Prof. Dipankar Raychaudhuri
and approved by
New Brunswick, New Jersey
October, 2009
ABSTRACT OF THE THESIS
Adaptive Transmit Power Control based on Signal Strength
and Frame Loss Measurements for WLANs
by Hariharasudhan Viswanathan
Thesis Director: Prof. Dipankar Raychaudhuri
In the past few years, we witnessed a rapid penetration of Wireless Local Area Networks
(WLANs) into the home and enterprise. Emerging technology such as the IEEE 802.11n
radio, which is getting increasingly affordable, makes delivering multimedia content over
wireless networks possible and this would drive the technology further into our daily life.
As the number of available wireless channels in the unlicensed spectrum is limited (3 non-
overlapping channels in 2.4GHz unlicensed band and up to 24 non-overlapping channels in
5GHz unlicensed band), they have to be shared by multiple WLANs consisting of Access
Points (APs) and STAtions (STAs). In a Multi-Dwelling Unit (MDU) WLAN deployment,
e.g. in an apartment building or hotel, transmissions in overlapping cells tend to interfere
with each other. This will adversely impact the aggregate wireless network throughput and
thus the quality of experience for applications such as multimedia streaming. Hence there is
a need for automatic and adaptive resource management strategy to ensure a good overall
network performance.
In this thesis we propose an adaptive per-link Transmit Power Control (TPC) solution
for WLANs. TPC can reduce interference, increase channel reuse, and eventually increase
the overall capacity in dense 802.11 wireless networks. However intelligent algorithms are
required to adapt transmit power in a practical and distributed way to achieve optimal
performance. It becomes more challenging given different types of interference (cooperative
and non-cooperative) in the unlicensed band as well as the hidden node problem. From a
ii
detailed study of the previous efforts at power control, we observe that in order to make
better decisions on transmit power; an AP needs to actively monitor several factors. Hence
we develop a TPC algorithm based on both link margin estimation as well as frame loss
rate measurement. Compared to previous solutions that adapt the transmit power based
on measurement of a single parameter (either received signal strength or frame loss rate),
the proposed power control mechanism can diagnose and take remedial action for hidden
nodes and channel access asymmetry problems manifesting as frame losses. It is adaptive
to mobility, complementary to any rate control algorithm and can also be incrementally
deployed amidst non-cooperative nodes. We have implemented the algorithm as an ap-
plication running on Atheros chipset-based 802.11n APs, taking all practical system-level
limitations into account. The proposed solution achieves significant transmit power reduc-
tion at the APs (to as low as 60% of the maximum power) for STAs as far as 70ft and over
∼60% increase in total network throughput through interference mitigation.
iii

Acknowledgements
I would like to take this opportunity to thank all the wonderful people who have played a
significant role in my years as a graduate student. Firstly, I would like to thank my graduate
advisor, my role model and guru Prof. Dipankar Raychaudhuri. I have always been awed,
inspired and motivated by his vision, simplicity and timely words of encouragement and I
feel honored to have been associated with him.
I am greatly indebted to the people at Thomson Corporate Research, In-home Wireless
Video Distribution team who taught me responsibility and team work. I thank my manager
Saurabh Mathur for giving me the wonderful opportunity to intern with his team. I would
like to thank Dr. Hang Liu, my supervisor at Thomson. I consider him my mentor and am
immensely indebted to him for his faith in my abilities. His friendly demeanor, approacha-
bility and an ever eager readiness to listen to the lengthy and sometimes boring analysis by
a fledgling researcher like me is something amazing. I would like to thank Ishan Mandrekar,
one of my very good friends at Thomson for his huge help in the implementation of my
thesis. I would also like to thank other team members Ramkumar Perumanam, Minquan
Wu, John Li and Xiuping Lu for their help, feedback and comments.
I was lucky to have wonderful roommates in Raghu, Shyam, Shiva, Sreevatsa and Venkat
who are my family in the US. I am greatly indebted to my seniors and friends Rajesh, Sankar,
Sandeep, Varadan and Guru and I cannot thank them enough for their show of love and
support in all my endeavors.
I would like to thank Prof. Dario Pompili and Prof. Marco Gruteser for accepting to
be the committee members in my thesis defense.
I thank all the faculty and staff of ECE department at Rutgers for their help and support.
iv

Dedication
To my parents, brother and my late grandparents.
v
Table of Contents
Abstract . . . . . . . . . . . . . . . . . . . . . . . . . . . . . . . . . . . . . . . . . . ii
Acknowledgements . . . . . . . . . . . . . . . . . . . . . . . . . . . . . . . . . . . iv
Dedication . . . . . . . . . . . . . . . . . . . . . . . . . . . . . . . . . . . . . . . . . v
List of Tables . . . . . . . . . . . . . . . . . . . . . . . . . . . . . . . . . . . . . . . 1
List of Figures . . . . . . . . . . . . . . . . . . . . . . . . . . . . . . . . . . . . . . 2
1. Introduction . . . . . . . . . . . . . . . . . . . . . . . . . . . . . . . . . . . . . 4
1.1. Need for Adaptive Transmit Power Control . . . . . . . . . . . . . . . . . . 4
1.2. TPC Design Considerations . . . . . . . . . . . . . . . . . . . . . . . . . . . 6
1.2.1. Need for Two Triggers . . . . . . . . . . . . . . . . . . . . . . . . . . 7
1.2.2. Interaction with PHY rate control . . . . . . . . . . . . . . . . . . . 8
1.2.3. Granularity of power control . . . . . . . . . . . . . . . . . . . . . . 8
1.2.4. 802.11h Measurement Framework . . . . . . . . . . . . . . . . . . . . 9
1.3. Our contribution . . . . . . . . . . . . . . . . . . . . . . . . . . . . . . . . . 10
1.4. Thesis Organization . . . . . . . . . . . . . . . . . . . . . . . . . . . . . . . 11
2. Prior Work . . . . . . . . . . . . . . . . . . . . . . . . . . . . . . . . . . . . . . 12
2.1. TPC for ad hoc networks . . . . . . . . . . . . . . . . . . . . . . . . . . . . 13
2.2. TPC for WLANs . . . . . . . . . . . . . . . . . . . . . . . . . . . . . . . . . 14
2.2.1. SNR based TPC techniques . . . . . . . . . . . . . . . . . . . . . . . 14
2.2.2. SNR and FLR based TPC techniques . . . . . . . . . . . . . . . . . 15
2.2.3. FLR based TPC techniques . . . . . . . . . . . . . . . . . . . . . . . 16
2.2.4. TPC for controller based WLANs . . . . . . . . . . . . . . . . . . . 16
3. AP Side TPC Algorithm . . . . . . . . . . . . . . . . . . . . . . . . . . . . . 18
3.1. Transmit power estimation based on signal strength measurements . . . . . 18
vi
3.2. Power adjustment based on Frame Loss Rate trigger . . . . . . . . . . . . . 22
3.3. Two modes of operation . . . . . . . . . . . . . . . . . . . . . . . . . . . . . 25
4. STA Side TPC . . . . . . . . . . . . . . . . . . . . . . . . . . . . . . . . . . . . 30
4.1. Transmit power estimation based on signal strength measurements . . . . . 30
4.2. Power adjustment based on Frame Loss Rate trigger . . . . . . . . . . . . . 32
4.3. Two modes of operation . . . . . . . . . . . . . . . . . . . . . . . . . . . . . 34
5. Results and Discussion . . . . . . . . . . . . . . . . . . . . . . . . . . . . . . . 38
5.1. Implementation and setup . . . . . . . . . . . . . . . . . . . . . . . . . . . . 38
5.2. Reduction in Transmit Power . . . . . . . . . . . . . . . . . . . . . . . . . . 39
5.2.1. Per Station Power Control . . . . . . . . . . . . . . . . . . . . . . . . 41
5.3. Increase in Spatial Reuse . . . . . . . . . . . . . . . . . . . . . . . . . . . . 43
5.4. Use of FLR Trigger . . . . . . . . . . . . . . . . . . . . . . . . . . . . . . . . 45
6. Conclusion . . . . . . . . . . . . . . . . . . . . . . . . . . . . . . . . . . . . . . 48
6.1. Suggestions for Future Work . . . . . . . . . . . . . . . . . . . . . . . . . . 48
References . . . . . . . . . . . . . . . . . . . . . . . . . . . . . . . . . . . . . . . . . 50
vii
1
List of Tables
3.1. Parameter values used in our implementation . . . . . . . . . . . . . . . . . 23
2
List of Figures
1.1. Typical Wireless Video Distribution System in a Multi-dwelling Unit . . . . 5
1.2. Scenarios that result from TPC . . . . . . . . . . . . . . . . . . . . . . . . . 6
1.3. (a)TPC Request IE (b)TPC Report IE . . . . . . . . . . . . . . . . . . . . . 9
1.4. Power Constraint IE . . . . . . . . . . . . . . . . . . . . . . . . . . . . . . . 10
3.1. AP TPC measurement operation . . . . . . . . . . . . . . . . . . . . . . . . 19
3.2. AP side TPC operation based on RSSI measurement reports from the STA
only . . . . . . . . . . . . . . . . . . . . . . . . . . . . . . . . . . . . . . . . 21
3.3. AP side TPC operation based on RSSI measurement reports from the STA
and the frame loss trigger . . . . . . . . . . . . . . . . . . . . . . . . . . . . 24
3.4. AP side TPC operation based on RSSI measurement reports from the STA
and the frame loss trigger where the AP maintains the transmission status
of a window of packets . . . . . . . . . . . . . . . . . . . . . . . . . . . . . . 26
3.5. Choice of transmit power on the AP when operating in Mode2 . . . . . . . 27
3.6. AP TPC operating in Mode1 and Mode2 in a time sharing fashion . . . . . 28
4.1. STA TPC measurement operation . . . . . . . . . . . . . . . . . . . . . . . 31
4.2. STA side TPC operation based on RSSI measurement and frame loss rate
trigger . . . . . . . . . . . . . . . . . . . . . . . . . . . . . . . . . . . . . . . 34
4.3. STA side TPC operation based on RSSI measurement and the frame loss
trigger where the STA maintains the transmission status of a window of
packets . . . . . . . . . . . . . . . . . . . . . . . . . . . . . . . . . . . . . . 35
4.4. STA TPC Mode1 operation . . . . . . . . . . . . . . . . . . . . . . . . . . . 36
5.1. AP and STA positions on Thomson CR floor plan for verifying TPC power
reduction functionality . . . . . . . . . . . . . . . . . . . . . . . . . . . . . . 40
5.2. Power reduction achieved by TPC . . . . . . . . . . . . . . . . . . . . . . . 40
5.3. AP and STA positions on Thomson CR floor plan for verifying per-link TPC 42
3
5.4. Per-STA capability of TPC demonstrated with one AP and three STAs . . 42
5.5. AP and STA positions on Thomson CR floor plan for verifying increased
spatial reuse using TPC . . . . . . . . . . . . . . . . . . . . . . . . . . . . . 43
5.6. Demonstration of spatial reuse by using adaptive TPC . . . . . . . . . . . . 44
5.7. AP and STA positions on Thomson CR floor plan to show distance vs ag-
gregated throughput with and without TPC . . . . . . . . . . . . . . . . . . 45
5.8. Distance vs aggregated throughput with and without TPC . . . . . . . . . 45
5.9. AP and STA positions on Thomson CR floor plan for demonstrating use of
FLR trigger in TPC . . . . . . . . . . . . . . . . . . . . . . . . . . . . . . . 46
5.10. Advantage of using of FLR trigger in TPC (Mode2 TPC) . . . . . . . . . . 47
5.11. Transmit power of Link L2 based on FLR trigger in TPC (Mode2 TPC) . . 47
4
Chapter 1
Introduction
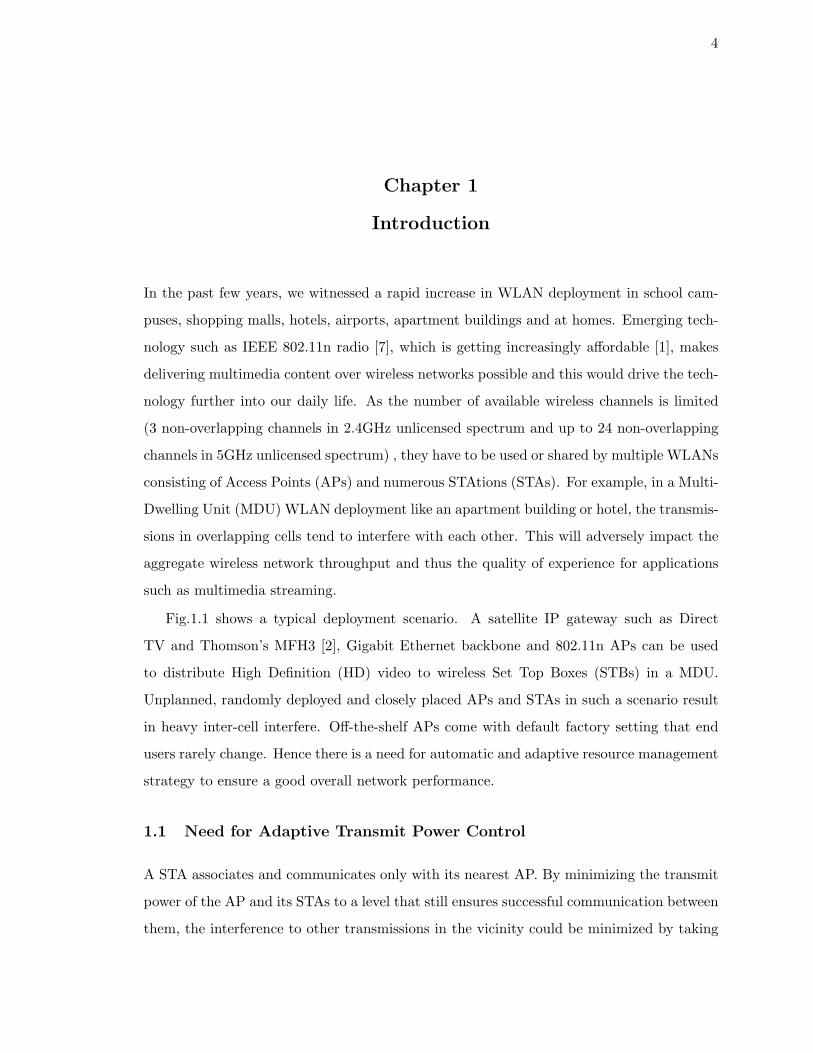
In the past few years, we witnessed a rapid increase in WLAN deployment in school cam-
puses, shopping malls, hotels, airports, apartment buildings and at homes. Emerging tech-
nology such as IEEE 802.11n radio [7], which is getting increasingly affordable [1], makes
delivering multimedia content over wireless networks possible and this would drive the tech-
nology further into our daily life. As the number of available wireless channels is limited
(3 non-overlapping channels in 2.4GHz unlicensed spectrum and up to 24 non-overlapping
channels in 5GHz unlicensed spectrum) , they have to be used or shared by multiple WLANs
consisting of Access Points (APs) and numerous STAtions (STAs). For example, in a Multi-
Dwelling Unit (MDU) WLAN deployment like an apartment building or hotel, the transmis-
sions in overlapping cells tend to interfere with each other. This will adversely impact the
aggregate wireless network throughput and thus the quality of experience for applications
such as multimedia streaming.
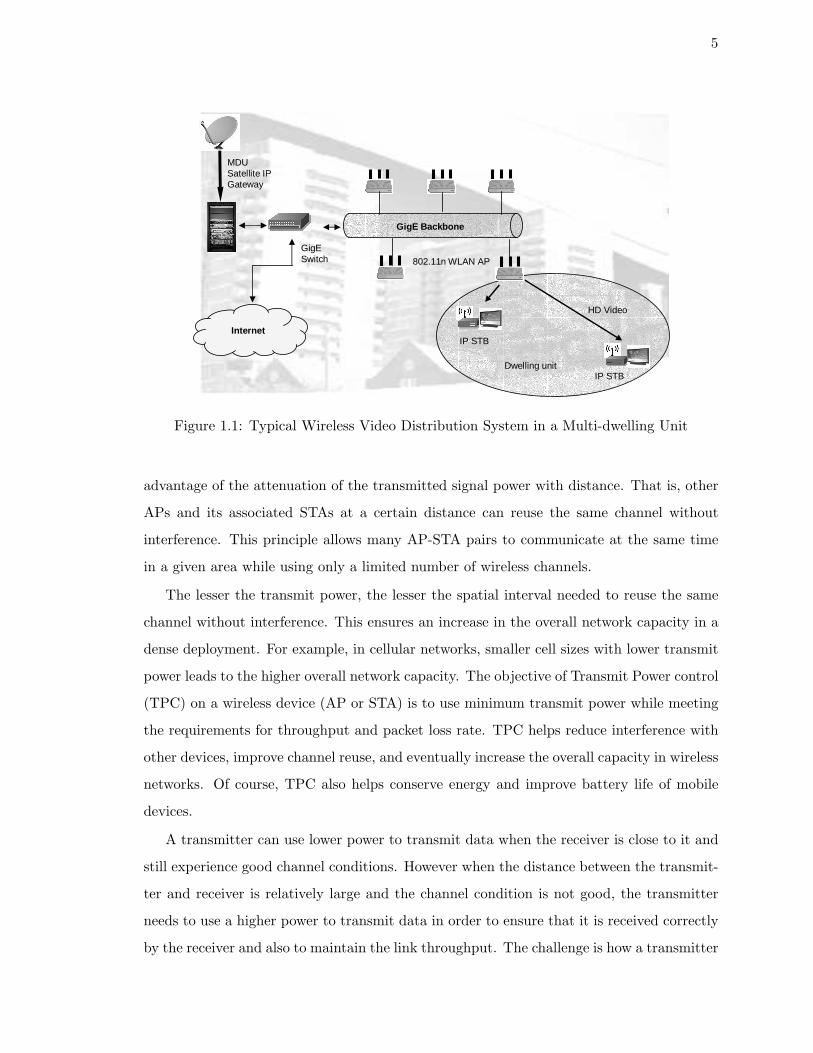
Fig.1.1 shows a typical deployment scenario. A satellite IP gateway such as Direct
TV and Thomson’s MFH3 [2], Gigabit Ethernet backbone and 802.11n APs can be used
to distribute High Definition (HD) video to wireless Set Top Boxes (STBs) in a MDU.
Unplanned, randomly deployed and closely placed APs and STAs in such a scenario result
in heavy inter-cell interfere. Off-the-shelf APs come with default factory setting that end
users rarely change. Hence there is a need for automatic and adaptive resource management
strategy to ensure a good overall network performance.
1.1 Need for Adaptive Transmit Power Control
A STA associates and communicates only with its nearest AP. By minimizing the transmit
power of the AP and its STAs to a level that still ensures successful communication between
them, the interference to other transmissions in the vicinity could be minimized by taking
5
GigE Backbone
Internet
Dwelling unit
802.11n WLAN AP
MDU Satellite IP Gateway
GigESwitch
IP STB
HD Video
IP STB
Figure 1.1: Typical Wireless Video Distribution System in a Multi-dwelling Unit
advantage of the attenuation of the transmitted signal power with distance. That is, other
APs and its associated STAs at a certain distance can reuse the same channel without
interference. This principle allows many AP-STA pairs to communicate at the same time
in a given area while using only a limited number of wireless channels.
The lesser the transmit power, the lesser the spatial interval needed to reuse the same
channel without interference. This ensures an increase in the overall network capacity in a
dense deployment. For example, in cellular networks, smaller cell sizes with lower transmit
power leads to the higher overall network capacity. The objective of Transmit Power control
(TPC) on a wireless device (AP or STA) is to use minimum transmit power while meeting
the requirements for throughput and packet loss rate. TPC helps reduce interference with
other devices, improve channel reuse, and eventually increase the overall capacity in wireless
networks. Of course, TPC also helps conserve energy and improve battery life of mobile
devices.
A transmitter can use lower power to transmit data when the receiver is close to it and
still experience good channel conditions. However when the distance between the transmit-
ter and receiver is relatively large and the channel condition is not good, the transmitter
needs to use a higher power to transmit data in order to ensure that it is received correctly
by the receiver and also to maintain the link throughput. The challenge is how a transmitter
6
determines and adapts (if the channel condition changes) its transmit power to transmit
data signal to a receiver optimally.
1.2 TPC Design Considerations
TPC aims to use the minimum transmit power possible to achieve successful transmission at
a target data rate. Since power control is done in a distributed manner certain undesirable
side effects are inevitable. The design of an efficient TPC algorithm has to take those
effects into account. TPC can exacerbate the classic hidden terminal problem and also
introduce channel access asymmetry between two links operating on the same channel. The
interaction between two transmitter (Tx )- receiver (Rx ) links can be summarized in the
Fig.1.2.
Tx 1
Rx 1
Tx 2
Rx 2
Tx 1
Rx 1
Tx 2
Rx 2
Tx 1
Rx 1
Tx 2
Rx 2
Tx 1
Rx 1
Tx 2
Rx 2
Tx 1
Rx 1
Tx 2
Rx 2
Tx 1
Rx 1
Tx 2
Rx 2
(a) (b) (c)
(d) (e) (f)
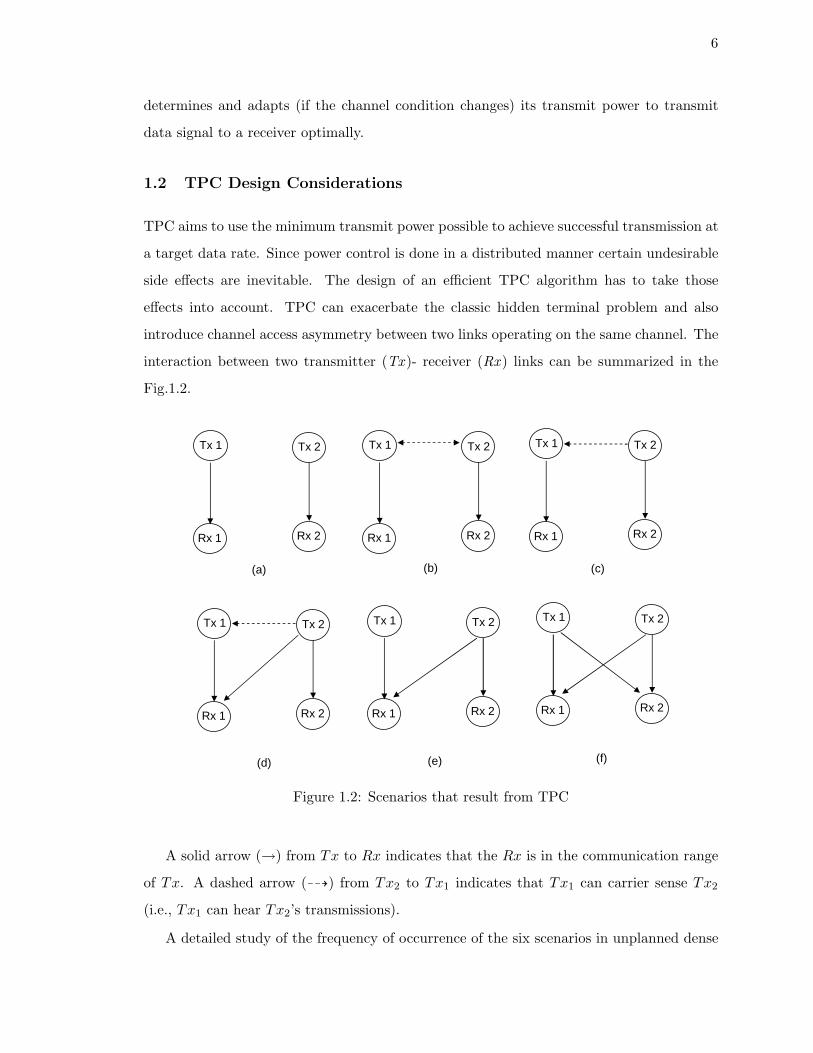
Figure 1.2: Scenarios that result from TPC
A solid arrow (→) from Tx to Rx indicates that the Rx is in the communication range
of Tx. A dashed arrow (99K) from Tx2 to Tx1 indicates that Tx1 can carrier sense Tx2
(i.e., Tx1 can hear Tx2’s transmissions).
A detailed study of the frequency of occurrence of the six scenarios in unplanned dense
7
deployments has been presented in [16]. When TPC is applied on a link it can result in
any of the five scenarios presented in Fig.1.2. Scenario (a) represents the best case where,
the application of TPC has resulted complete spatial reuse. Scenario (b) represents no gain
as far as spatial reuse is concerned but it is a wise choice to operate in the lowest possible
transmit power if the target data rate can be sustained. Scenario (c) represents the exposed
node problem that results in channel access asymmetry. Tx1 → Rx1 link is starved since
Tx2 cannot hear Tx1’s transmissions and always perceives a clear channel. Scenario (d)
also results in channel access asymmetry but the problem manifests itself in the form of
packet losses at Rx1 due to simultaneous transmissions by Tx1 and Tx2. Scenario (e) and
(f )represent the classic hidden terminal problem. The transmitters are not in each other’s
carrier sensing range and hence this problem again manifests itself as packet losses at Rx1
or both Rx1 and Rx2 due to simultaneous transmissions.
1.2.1 Need for Two Triggers
Most TPC solutions presented in literature fail to account for scenarios (c),(d),(e) and (f )
(and power control has an increased tendency to result in one of the scenarios) since they
rely entirely on only one trigger, either the Signal to Noise Ratio (SNR) deduced from
Received Signal Strength Indicator (RSSI) measurements or Frame Loss Rate (FLR). If the
power control solution is based on SNR, hidden terminal problem and asymmetric channel
access problems cannot be diagnosed and there would be performance degradation due to
frame losses. In such cases if the frame losses were monitored, an increase in transmit power
to either leverage capture effect or to bring the interfering transmitter within the carrier
sensing range would have a desirable effect. Solutions based on frame loss rate measurements
alone are non-trivial as the minimum number of samples required to accurately deduce the
channel conditions is a critical design choice and also they take a lot of time to converge.
In this thesis we propose an adaptive per-link TPC solution that precisely converges
to the optimal transmit power based on RSSI and link margin measurements and also
leverages FLR measurements to diagnose and remedy any adverse effects that TPC might
have introduced. The need to quickly converge to the optimal power to operate at justifies
the choice of RSSI measurements as the primary trigger. The desire to counteract the
adverse effects that might have arisen due to power control as detailed earlier justifies the use
of FLR as the secondary trigger. Our algorithm as demonstrated in our experimental results
8
clearly identifies and remedies scenarios (d),(e) and (f ). Scenario (c) cannot be identified,
since exposed terminal problem does not result in packet losses. In [16], Symphony identifies
exposed terminal problem through the use of a metric called Expected Transmission Time
(ETT). Calculation of ETT and diagnosis of asymmetry in channel access is non-trivial
since ETT calculation is complicated by variable packet size, queuing before transmission
and packet aggregation in 802.11n.
1.2.2 Interaction with PHY rate control
Calculation of link margin depends on the target data rate for transmissions. We use the
maximum data rate that can be supported on a 802.11n device, Modulation and Coding
Scheme 15 (MCS15, 130Mbps in 20MHz bandwidth with 2 spatial streams) as our target
data rate. The reason being, the airtime will be the smallest to transmit a frame using the
highest data rate so that the time that a transmitter interferes with other devices will be
minimized. The possible values of target data rate can be selected by the AP or STA in
different ways. Our TPC algorithm is complementary to any rate control algorithm since
the constant monitoring of FLR ensures that we would negate any adverse effect TPC might
have had on rate control.
1.2.3 Granularity of power control
A TPC algorithms shouldn’t make unrealistic assumptions about the capabilities of the
wireless card and driver. The granularity of power control in terms of magnitude is a
critical design choice. Commercially available Atheros 802.11n AR5008 cards [3] allow power
settings between a minimum and maximum of 1dBm and 15dBm in steps of 0.5dBm. In our
implementation we choose to use any one of 15 different power levels in 1dBm increments
between 1dBm and 15dBm. Our TPC solution entirely uses the statistics provided by
the Atheros driver for Linux kernel and this makes it readily deployable even without any
modifications to the driver. In fact, the statistics we use are provided almost by all wireless
cards making it easily adaptable to work with any make of wireless cards.
The power adjustment is effected by issuing a request to the wireless card through
ioctl (input/output control) calls provided by the device-driver. The algorithm we have
developed has been evaluated only on the AP side for now assuming predominant down
9
Element ID Length
Octets 1 1
Element ID Length
Octets 1 1
Transmit Power
Link Margin
1 1
(a)
(b)
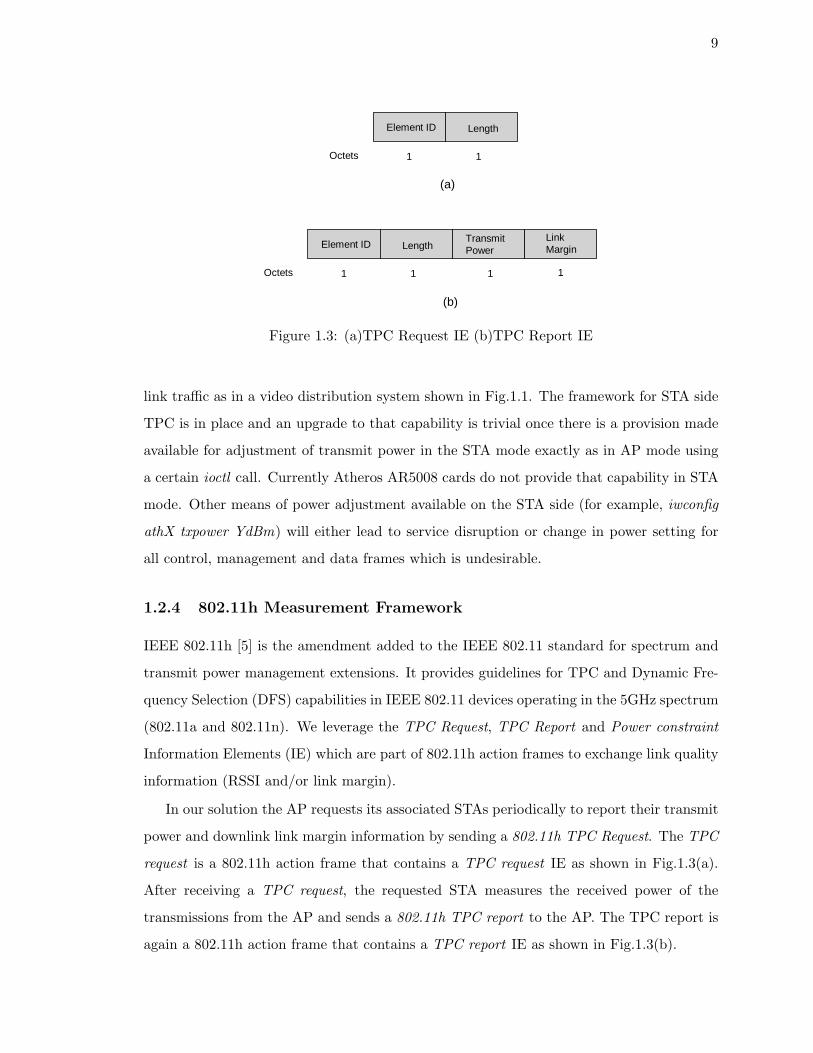
Figure 1.3: (a)TPC Request IE (b)TPC Report IE
link traffic as in a video distribution system shown in Fig.1.1. The framework for STA side
TPC is in place and an upgrade to that capability is trivial once there is a provision made
available for adjustment of transmit power in the STA mode exactly as in AP mode using
a certain ioctl call. Currently Atheros AR5008 cards do not provide that capability in STA
mode. Other means of power adjustment available on the STA side (for example, iwconfig
athX txpower YdBm) will either lead to service disruption or change in power setting for
all control, management and data frames which is undesirable.
1.2.4 802.11h Measurement Framework
IEEE 802.11h [5] is the amendment added to the IEEE 802.11 standard for spectrum and
transmit power management extensions. It provides guidelines for TPC and Dynamic Fre-
quency Selection (DFS) capabilities in IEEE 802.11 devices operating in the 5GHz spectrum
(802.11a and 802.11n). We leverage the TPC Request, TPC Report and Power constraint
Information Elements (IE) which are part of 802.11h action frames to exchange link quality
information (RSSI and/or link margin).
In our solution the AP requests its associated STAs periodically to report their transmit
power and downlink link margin information by sending a 802.11h TPC Request. The TPC
request is a 802.11h action frame that contains a TPC request IE as shown in Fig.1.3(a).
After receiving a TPC request, the requested STA measures the received power of the
transmissions from the AP and sends a 802.11h TPC report to the AP. The TPC report is
again a 802.11h action frame that contains a TPC report IE as shown in Fig.1.3(b).
10
Element ID Length
Octets 1 1
Local Power Constraint
1
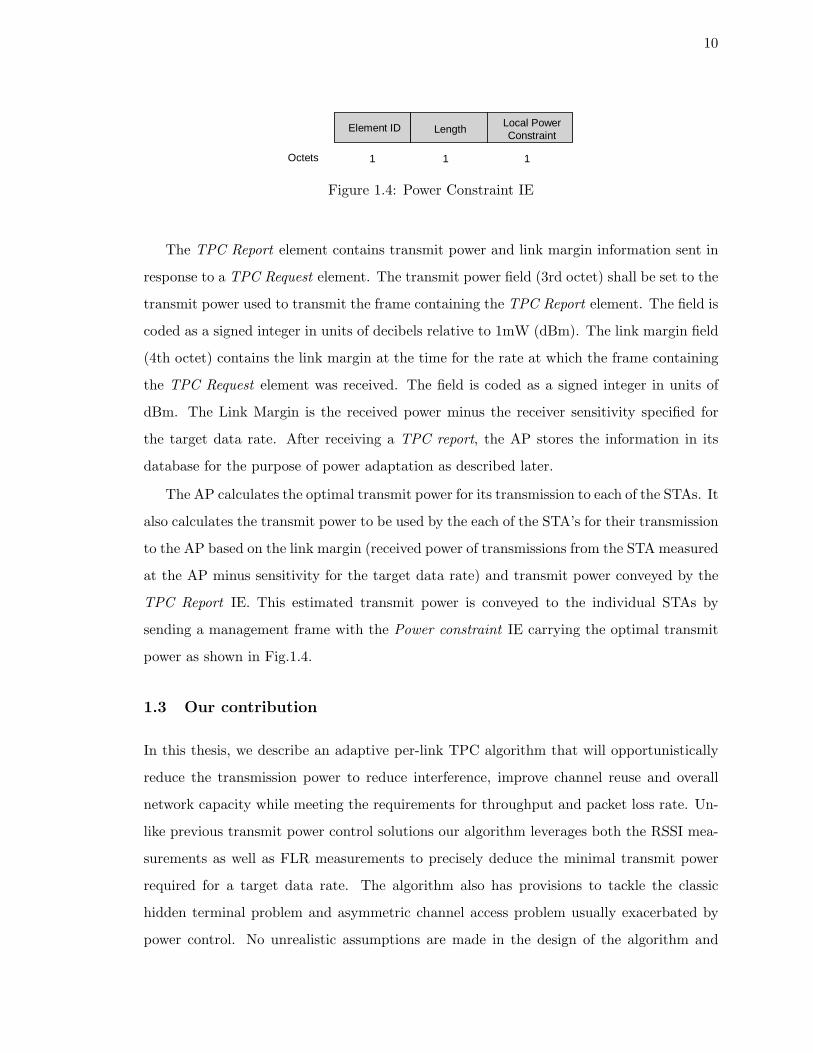
Figure 1.4: Power Constraint IE
The TPC Report element contains transmit power and link margin information sent in
response to a TPC Request element. The transmit power field (3rd octet) shall be set to the
transmit power used to transmit the frame containing the TPC Report element. The field is
coded as a signed integer in units of decibels relative to 1mW (dBm). The link margin field
(4th octet) contains the link margin at the time for the rate at which the frame containing
the TPC Request element was received. The field is coded as a signed integer in units of
dBm. The Link Margin is the received power minus the receiver sensitivity specified for
the target data rate. After receiving a TPC report, the AP stores the information in its
database for the purpose of power adaptation as described later.
The AP calculates the optimal transmit power for its transmission to each of the STAs. It
also calculates the transmit power to be used by the each of the STA’s for their transmission
to the AP based on the link margin (received power of transmissions from the STA measured
at the AP minus sensitivity for the target data rate) and transmit power conveyed by the
TPC Report IE. This estimated transmit power is conveyed to the individual STAs by
sending a management frame with the Power constraint IE carrying the optimal transmit
power as shown in Fig.1.4.
1.3 Our contribution
In this thesis, we describe an adaptive per-link TPC algorithm that will opportunistically
reduce the transmission power to reduce interference, improve channel reuse and overall
network capacity while meeting the requirements for throughput and packet loss rate. Un-
like previous transmit power control solutions our algorithm leverages both the RSSI mea-
surements as well as FLR measurements to precisely deduce the minimal transmit power
required for a target data rate. The algorithm also has provisions to tackle the classic
hidden terminal problem and asymmetric channel access problem usually exacerbated by
power control. No unrealistic assumptions are made in the design of the algorithm and
11
also the solution does not need any modification to the existing MAC protocol. Our TPC
algorithm is currently implemented to support the maximum data rate but is complemen-
tary to any rate adaptation algorithm. These attributes makes our solution readily and
incrementally deployable. Performance evaluation of the scheme has been done by imple-
menting the TPC algorithm as an application running on Atheros 802.11n APs based on
AR5008 chipset. These 802.11n transmitter receiver pairs have 3×3 antenna configuration
and can provide up to 130Mbps throughput with 2 spatial streams (third antenna for diver-
sity) while operating in the 20MHz bandwidth. Results show a significant transmit power
reduction at the AP (to as low as 60% of the maximum) for STAs as far as 70ft and over
∼60% increase network capacity through interference mitigation. Also performance in the
presence of non-cooperative interference and remedial action for channel access asymmetry
problems manifesting as frame losses are demonstrated.
1.4 Thesis Organization
The thesis is organized as follows. Chapter 2 introduces related and prior work in the field,
their approach, pros and cons. Chapter 3 details the AP side TPC algorithm. Chapter 4
explains the STA side TPC algorithm. Chapter 5 deals with the discussion of experimental
results. Chapter 6 concludes and provides suggestions for future work.
12
Chapter 2
Prior Work
A number of distributed transmit power control algorithms were proposed to reduce inter-
ference and increase capacity in 802.11 wireless networks. Most of them adapt the transmit
power based on the either the FLR or SNR. If the power control solution is purely based on
SNR, hidden terminal problem and asymmetric channel access problems cannot be prop-
erly diagnosed and there would be performance degradation due to frame losses unless
RTS/CTS is used. However, the use of RTS/CTS eliminates potential interference limited
simultaneous transmissions. In such cases if the frame losses were monitored, an increase
in transmit power to either leverage capture effect or to bring the interfering transmitter
within the carrier sensing range would have a desirable effect. Solutions based on FLR mea-
surements alone are non-trivial as the minimum number of samples required to accurately
deduce the channel conditions is a critical design choice and also they take a lot of time
to converge. Most solutions have not been implemented and realized in practice to verify
effectiveness in real world environment and also make unrealistic assumptions that makes
them not incrementally deployable in the presence of non-cooperative nodes.
A lot of work has been done in the area of transmit power control for cellular networks,
but the solutions cannot be used for infrastructure WLANs since the fundamental MAC
scheme is different. Similarly solutions proposed for ad hoc networks, though discussed here,
cannot be directly extended to infrastructure WLANs since the goal of those solutions and
the fundamental assumptions vary significantly. Most of the solutions suggested advocate
modification to the 802.11 MAC which makes them difficult to either be implemented or
incrementally deployed. The TPC solutions discussed in this thesis are all per-link solutions
(except for [11] which is a per-cell solution) aimed at either reducing power consumption
or interference mitigation and spatial reuse.
13
2.1 TPC for ad hoc networks
BASIC proposed in [10] is a simple scheme which uses maximum power to transmit RTS/CTS
and minimum power to transmit data for reducing power consumption. This results in poor
spatial reuse since the whole transmission floor is reserved. PCM [10] was suggested as an
improvement to BASIC where maximum power is used for data transmission periodically to
mitigate the loss of ACK packets due to collisions at the transmitter. They were primarily
aimed at conserving battery life. Both the methods do not promise significant gains in
terms of spatial reuse.
In [20], the authors propose SHUSH, a reactive TPC algorithm sensitive to interference
as an improvement to PCM and BASIC. SHUSH uses the optimum power for RTS/CTS
and data transmissions until there is interference. The interferers are identified and the
transmit power required to reach them is calculated and used for RTS/CTS or first data
packets to SHUSH them. The algorithm tackles asymmetric channel access problem through
two principles: principle of interruption and principle of patience. When an ongoing trans-
mission is interfered, it calculates the transmit power required to SHUSH the receiver and
waits till the interferer is done to avoid domino effect (principle of patience). Interrupted
transmission has a higher priority to regain access of the channel (principle of interruption).
This method requires modification of the MAC to identify interferers and to achieve the
interruption principle.
In PCMA [12], the authors aim to create a power control MAC protocol that retains the
collision avoidance property. In case of [10] RTS/CTS precludes simultaneous transmissions
in the vicinity. But PCMA increases spatial reuse by allowing simultaneous transmissions
that does not affect the ongoing ones to occur. Periodic out of band busy tones are used to
advertise interference tolerance levels based on which other nodes calculate their transmit
power bounds. Modified RTS/CTS is used to convey desired power levels for successful data
transfer. If the desired transmit powers are less than the power bound then transmissions
can go ahead. This ensures simultaneous transmissions. Problem of hidden terminals
doesn’t arise since transmissions are power bounded to ensure concurrency. Asymmetric
channel access problem however is not solved. The algorithm requires extensive modification
of the MAC and hence cannot be incrementally deployed.
In [13], Muqattash and Krunz suggest POWMAC for Mobile Adhoc NETworks (MANETS).
14
POWMAC allows concurrent transmissions that satisfy interference constraints to occur.
Instead of using RTS/CTS to reserve transmission floor, they are used within an access win-
dow to exchange maximum tolerable interference limits at each station so that concurrent
interference limited transmissions can occur in future. Each device maintains a power con-
straint list which consists of every other node’s address, channel gain, maximum tolerable
interference and activity time. This enables interference limited concurrent transmissions
to occur thus improving spatial reuse. However, assumptions such as precise measurement
of interference and changes to the fundamental MAC make this solution not incrementally
deployable.
All the TPC solutions for ad hoc networks that are presented here are purely SNR
based techniques and have been evaluated only through simulations. None of the above
mentioned algorithms have been implemented in practice to assess performance in real
world deployment.
2.2 TPC for WLANs
2.2.1 SNR based TPC techniques
Sheth and Han in [17, 18, 19] detail their implementation of TPC in 802.11b WLAN. They
address practical issues such as the layer to implement the TPC solution in, provisions to
tackle mobility, etc. The notion of leveraging the 802.11h framework for power control is
not entirely new. In [9] Grilo and Nunes proposed a link adaptation and TPC scheme based
on 802.11h, 802.11a and 802.11e for goodput maximization.
In [21], the authors highlight the limitations of power control in indoor WLANs. They
study the possible granularity of power control in both the magnitude and time dimensions
given the practical limitations of radio hardware. They highlight the distribution of RSSI in
indoor environments and through measurements show that there are only 2-4 distinct power
levels that result in significant RSSI variations. They propose online RSSI, an algorithm to
determine the set of useful power levels and argue that it leads to faster convergence.
All the three solutions, since entirely based on SNR cannot diagnose and remedy hidden
terminal problem and channel access asymmetry resulting in frame collisions at the receiver.
In [11], Mhatre et al., propose a conservative per-cell power control solution in which
all nodes in a cell use the same transmit power and Clear Channel Assessment (CCA)
15
threshold. The algorithm requires precise measurement of total interference at each AP
which is unrealistic. The solution is not incrementally deployable as CCA tuning is forbidden
in 802.11. Joint tuning of power and CCA ensures that asymmetry in channel access is
completely eliminated but there are no provisions to tackle the hidden terminal problem
since packet losses are not monitored.
2.2.2 SNR and FLR based TPC techniques
Automatic and adaptive radio resource management strategies have already been investi-
gated in unplanned infrastructure WLAN deployments. Aditya et al., in [8] have studied
the impact of AP density on end user experience in detail. They prove that optimal channel
selection and TPC can help accommodate more APs in a given area. They also suggest
ARF and ERF for rate adaptation and PARF and PERF for power adaptation. ARF and
PARF are FLR based methods while ERF and PERF innovate on their previous versions
by incorporating SNR feed back to avoid probing to arrive at the appropriate rate or power.
The solution has been implemented in actual hardware but lacks provision to react to frame
losses due to receiver side interference.
In [15] and [14], the authors propose joint rate adaptation and TPC mechanisms for
reducing power consumption. Every transmitter constructs a rate-power table offline with
a quadruplet matched against a transmit power-rate combination that ensures more data
transfer per unit energy consumption than the traditional approach. The quadruplet con-
sists of the packet length, path loss between the transmitter and receiver, short retry count
and long retry count. MiSer [15], assumes knowledge of network configuration (possible
sources of interference) and the wireless channel model at the transmitter to construct the
table a priori. The authors suggest a pragmatic approach of using 802.11h to deduce the
wireless channel conditions at run time. Both the algorithms have not been implemented in
practice. Receiver side interference is eliminated by the use of RTS/CTS but it precludes
spatial reuse. Also in highly dynamic and mobile environments the algorithm might face
severe degradation in performance.

16
2.2.3 FLR based TPC techniques
Symphony [16], proposed by Kishore et al., is a joint rate and power control solution that
aims at opportunistic throughput maximization and reduction in power consumption. It
requires loose synchronization between the transmitter and the receiver to periodically
switch between a reference phase and operational phase where the reference phase provides
the benchmark for the performance after optimization in operational phase. The algorithm
is not SNR based and uses packet delivery ratio to estimate link quality and the appropriate
data rate for transmission. Once the data rate is deduced it tunes its transmit power to
the lowest possible value. Hidden terminal problem is diagnosed by comparing performance
with and without RTS/CTS and asymmetry in channel access is found by calculating the
Expected Transmission Time (ETT). The problem with the solution however is the choice
of mechanisms to diagnose every problem associated with power control. The dilemma that
arises whether to increase transmit power or decrease rate does not arise when SNR is also
used simultaneously with FLR to make decisions. Also ETT calculation is non-trivial as it is
complicated by variable packet size, queuing before transmission and packet aggregation in
802.11n. Symphony deals with system level implementation issues and hardware limitations
that only a handful of power control solutions do.
2.2.4 TPC for controller based WLANs
In enterprise class controller based WLAN architectures some solutions for adaptive power
control and channel selection have been successfully implemented. Such solutions cannot be
adopted directly to unplanned and randomly deployed WLANs such as the ones addressed
by our work since they are centralized solutions. The central controller makes optimum
resource management decisions on the fly with reliable information from its APs. Aruba’s
Adaptive Radio Management (ARM) [4] is one such product that ensures adaptive chan-
nel and power assignment, airtime fairness and load balancing among others through a
controller based centralized solution.
The adaptive per-link TPC algorithm presented in this thesis addresses most of the
drawbacks pointed out in the previous techniques. The algorithm cognitively adjusts the
transmit power based on active monitoring of two parameters including SNR (RSSI mea-
surements) at the receiver and the FLR at the transmitter. Both the parameters can pick
17
up variations due to mobility and this makes the algorithm reactive to node mobility. In
addition the algorithm also addresses remedies for common problems aggravated by the use
of TPC such as hidden terminal problem and asymmetric channel access problem mani-
festing as frame losses at the receiver. Pure exposed node problem is not addressed in this
solution. Our TPC algorithm is easily implementable as it does not require modifications
to the driver or the fundamental 802.11 MAC and is also incrementally deployable with
provisions to perform independently in the presence of non-cooperative interference. As
mentioned in Section 1.2.4 the algorithm makes use of the measurement framework pro-
vided by 802.11h for TPC to determine the link quality. Our solution is complementary to
any rate adaptation algorithm which doesn’t lay any restrictions on its deployment. The
algorithm has been implemented and evaluated on Atheros AR5008 chipset based APs.
18
Chapter 3
AP Side TPC Algorithm
3.1 Transmit power estimation based on signal strength measurements
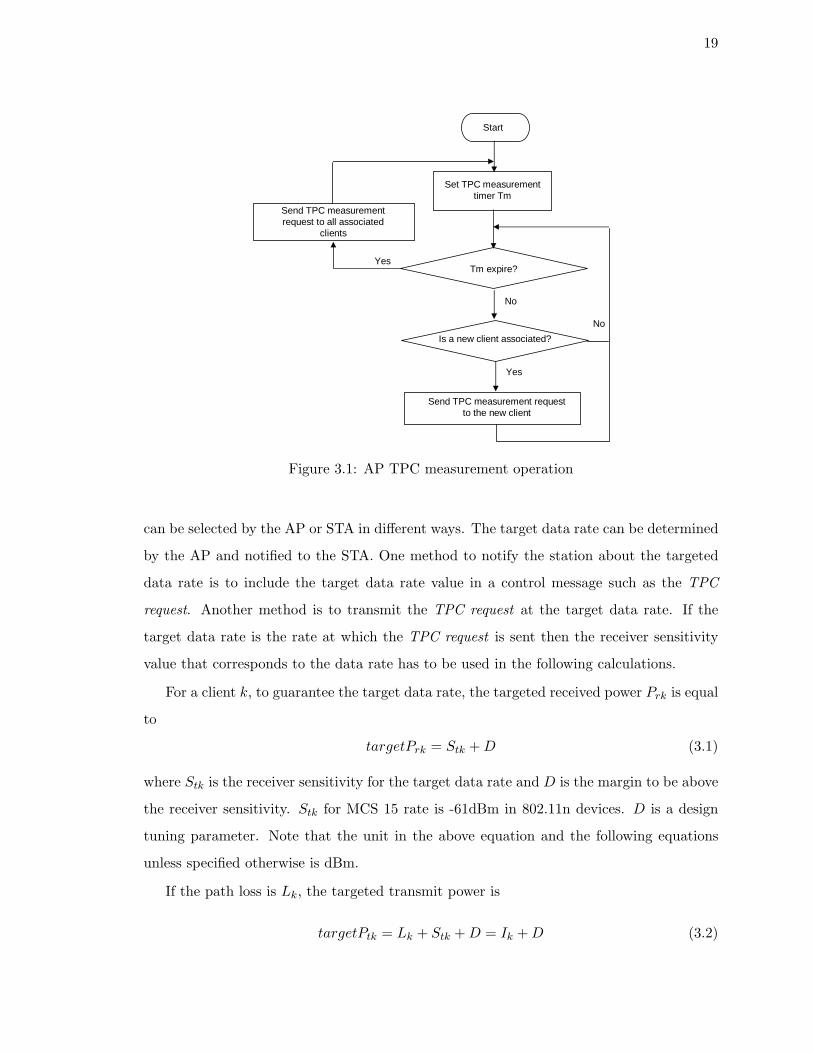
To determine the transmit power, an AP requests each of its associated clients (STAs)
to measure its received signal strength and to report the received signal strength or its
estimated link margin as well as the STA’s current transmit power. The AP unicasts or
multicasts TPC Request message to each of its associated STAs periodically (every Tm
seconds, set to 100ms in our implementation). In addition, once a new STA is associated,
the AP issues new TPC request to it. Fig.3.1 shows the AP TPC measurement operation.
The requested STA will measure the received signal power, estimate the link margin for
the down link, and report the received signal strength or the estimated link margin and its
transmit power to the AP by sending a TPC Report message. Here the down link is the
transmission link from the AP to the STA, and the uplink is the transmission link from the
STA to the AP. The link margin estimation is described below.
Based on the received signal strength or link margin measurement reported by the
STAs, the AP determines its desired down link transmit power to each of them. The
transmit power will meet the throughput and FLR requirements while generating the least
interference to other devices in the neighborhood.
The TPC algorithm is to control the transmit power as low as possible while maintaining
a target data rate Rt and a target FLR. In our implementation of the algorithm, the target
data rate is set to be the highest data rate, MCS15 supported by the 802.11n transmitter
and receiver. The reason being the airtime will be the smallest to transmit a frame using
the highest data rate so that the time that a transmitter interferes with other devices will
be minimized. The target FLR can be set to be the same value to determine the receiver
sensitivity for the target data rate (<10% as specified in IEEE 802.11n standard), or a value
small enough to ensure the quality of service. The possible the values of target data rate
19
Start
Set TPC measurement timer Tm
Tm expire?
Send TPC measurement request to the new client
Send TPC measurement request to all associated
clients
Yes
No
Is a new client associated?
No
Yes
Figure 3.1: AP TPC measurement operation
can be selected by the AP or STA in different ways. The target data rate can be determined
by the AP and notified to the STA. One method to notify the station about the targeted
data rate is to include the target data rate value in a control message such as the TPC
request. Another method is to transmit the TPC request at the target data rate. If the
target data rate is the rate at which the TPC request is sent then the receiver sensitivity
value that corresponds to the data rate has to be used in the following calculations.
For a client k, to guarantee the target data rate, the targeted received power Prk is equal
to
targetPrk = Stk + D (3.1)
where Stk is the receiver sensitivity for the target data rate and D is the margin to be above
the receiver sensitivity. Stk for MCS 15 rate is -61dBm in 802.11n devices. D is a design
tuning parameter. Note that the unit in the above equation and the following equations
unless specified otherwise is dBm.
If the path loss is Lk, the targeted transmit power is
targetPtk = Lk + Stk + D = Ik + D (3.2)
20
where Ik is defined as Ik = Lk + Stk
The link margin Mk(j) in the TPC report for the jth measurement is
Mk(j) = Prk(j)− Stk (3.3)
Note that Prk(j) is the jth sample of the received power measured at the receiver. The
jth sample of Ik is then
Ik(j) = Lk(j) + Stk = Ptk(j)− Prk(j) + Stk = Ptk(j)−Mk(j) (3.4)
where Ptk(j) is the actual transmit power of the jth TPC request.
We use a linear estimation method to calculate Ik,
aveIk(j) = α× aveIk(j − 1) + (1− α)× Ik(j) (3.5)
∆Ik(j) = |Ik(j)− aveIk(j)| (3.6)
varIk(j) = β × varIk(j − 1) + (1− β)×∆Ik(j) (3.7)
where aveIk(j) is the smoothed link quality (path loss plus receiver sensitivity) after the jth
measurement, i.e. the estimator of the average. varIk(j) is the smoothed mean deviation
of link quality. ∆Ik(j) = |Ik(j)− aveIk(j)| is the difference between the jth measured value
just obtained and the current estimation of the average. Both aveIk(j) and varIk(j) are
used to calculate the estimated value of Ik . The estimated value of Ik is equal to
Ik(j) = aveIk(j) + q × varIk(j) (3.8)
where α, β and q are design tuning parameters. The value of α and β are chosen to be 0.8
so that random fluctuations in RSSI if any is smoothed out. The value of q is chosen to be
2 so that the system is sensitive to mobility which manifests as variation in path loss.
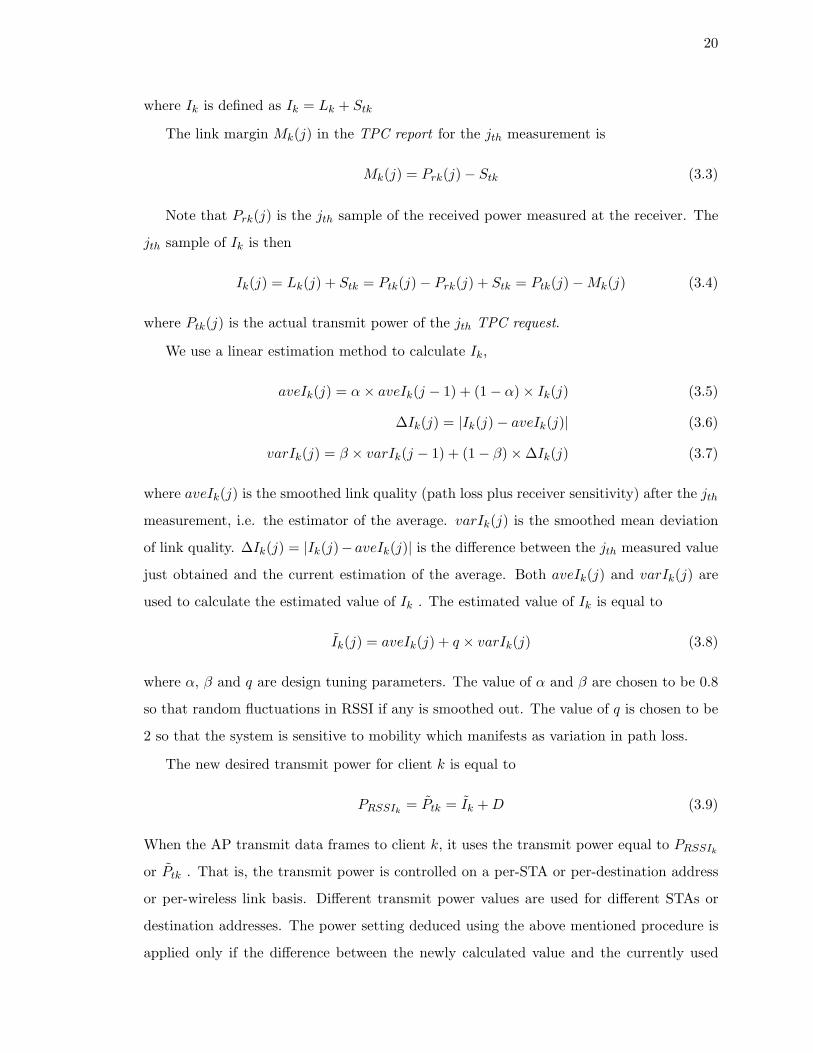
The new desired transmit power for client k is equal to
PRSSIk= Ptk = Ik + D (3.9)
When the AP transmit data frames to client k, it uses the transmit power equal to PRSSIk
or Ptk . That is, the transmit power is controlled on a per-STA or per-destination address
or per-wireless link basis. Different transmit power values are used for different STAs or
destination addresses. The power setting deduced using the above mentioned procedure is
applied only if the difference between the newly calculated value and the currently used
21
Yes
Estimate uplink path loss for client k
Store downlink margin and uplink path loss in the database against client k
Receive TPC report ?
Estimate and send desired uplink Txpower for the transmission from client k,
PRSSI uk
Start
Set TPC power adjustment timer Ta and TPC expiry timer Te
No
No Yes
Estimate desired Tx power for the transmission to client k, PRSSI k
Ta expire?
Set Tx power for transmission to each client k to be Pt k= PRSSI k
Reset Ta
Te expired? && Lost all TPC reports
from the client in the last Te?
No
Set Tx power for transmission to each client k to be Pt k= max P
Reset Te
Yes
Figure 3.2: AP side TPC operation based on RSSI measurement reports from the STA only
value is grater than or equal to 2dBm. As already pointed out in [21] in Section 2.2.1
the number of distinct power levels that result in a significant change in RSSI is very less.
Symphony [16] operates at a 3dBm granularity. We just choose 2dBm to provide a finer
granularity to our power control algorithm. Fig.3.2 shows the TPC operation on the AP
side based on RSSI measurement reports form the STA only.
In an alternative version of the algorithm, the AP does not change its transmit power
per STA (since many wireless cards do not have that capability). The AP determines
its transmit power based on the STA experiencing the worst link conditions. It selects a
22
transmit power value to ensure that the received signal strength at its worst STA is high
enough for that STA to successfully decode the received frames that are transmitted at the
target data rate. If multiple STAs are associated with an AP, the AP’s transmit power is
Pt = maxk(Ptk) (3.10)
When an AP boots up, its initial power is the maximum supported power, that is,
Pt(0) = maxP (3.11)
When a new STA powers up and associates with the AP again, the AP uses the maximum
supported transmit power for this STA as its initial value.
Ptk(0) = maxP (3.12)
Furthermore, when a new STA associates to the AP, the AP issues a TPC request for this
new client after its association process.
3.2 Power adjustment based on Frame Loss Rate trigger
To react to sudden deterioration of link quality or loss of link, for example, as a client moves
away or frame losses caused by receiver side interference, the AP also monitors the loss rate
of the frames that it transmitted and adjusts the transmit power based on the Frame Loss
Rate (FLR).
In our implemented version of the algorithm, the AP periodically determines the frame
loss rate (FLR) for its down link transmissions to all of its associated clients. If the FLR
during a time interval (say x seconds) is greater than a threshold FT , i.e. FLR ≥ FT , the
AP increases its transmit power to each of its associated client by a value Pd. If the current
AP transmit power for the transmission from the AP to client k is Ptk, the new transmit
power for the AP transmission to client k is the smaller value of Ptk +Pd and the maximum
transmit power supported by AP, maxP , i.e. the new transmit power is
PFLRk= Ptk = min{Ptk + Pd,maxP} (3.13)
Since the change to the transmit power at the AP is made to account for sudden deteri-
oration of the link quality, the AP continues to monitor the FLR periodically and adjusts
the transmit power at the AP as mentioned above until the FLR is below the threshold
23
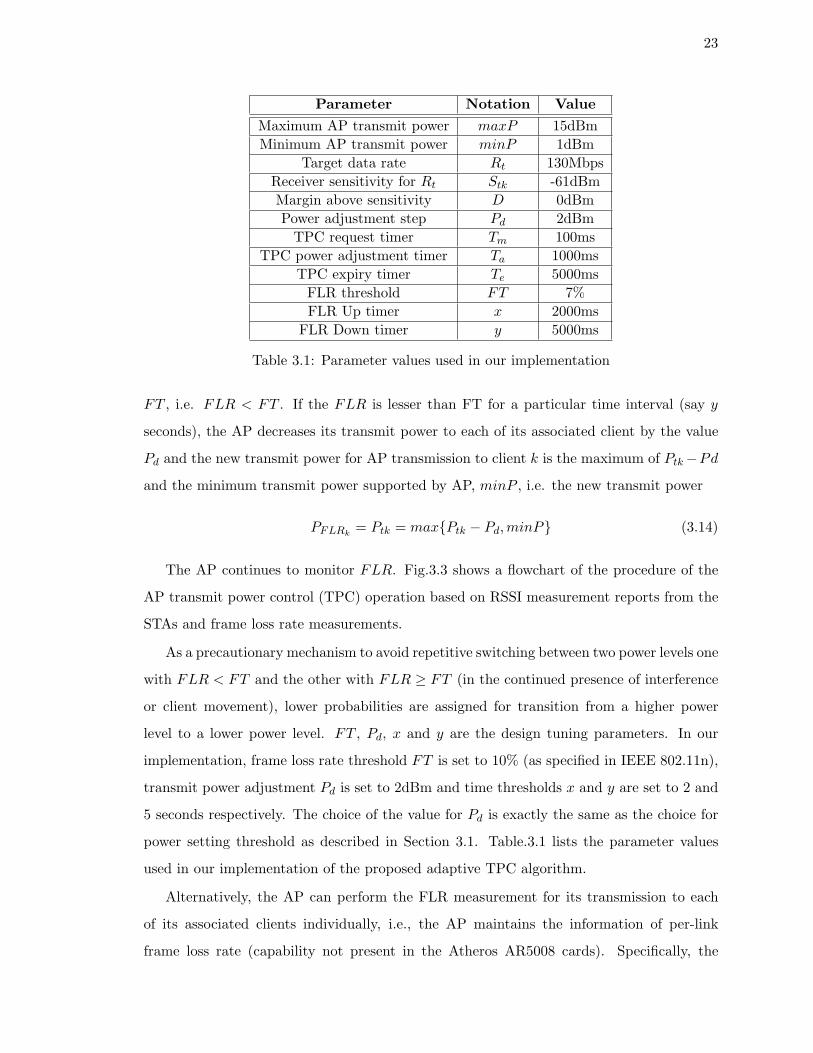
Parameter Notation Value
Maximum AP transmit power maxP 15dBmMinimum AP transmit power minP 1dBm
Target data rate Rt 130MbpsReceiver sensitivity for Rt Stk -61dBmMargin above sensitivity D 0dBmPower adjustment step Pd 2dBm
TPC request timer Tm 100msTPC power adjustment timer Ta 1000ms
TPC expiry timer Te 5000msFLR threshold FT 7%FLR Up timer x 2000ms
FLR Down timer y 5000ms
Table 3.1: Parameter values used in our implementation
FT , i.e. FLR < FT . If the FLR is lesser than FT for a particular time interval (say y
seconds), the AP decreases its transmit power to each of its associated client by the value
Pd and the new transmit power for AP transmission to client k is the maximum of Ptk−Pd
and the minimum transmit power supported by AP, minP , i.e. the new transmit power
PFLRk= Ptk = max{Ptk − Pd,minP} (3.14)
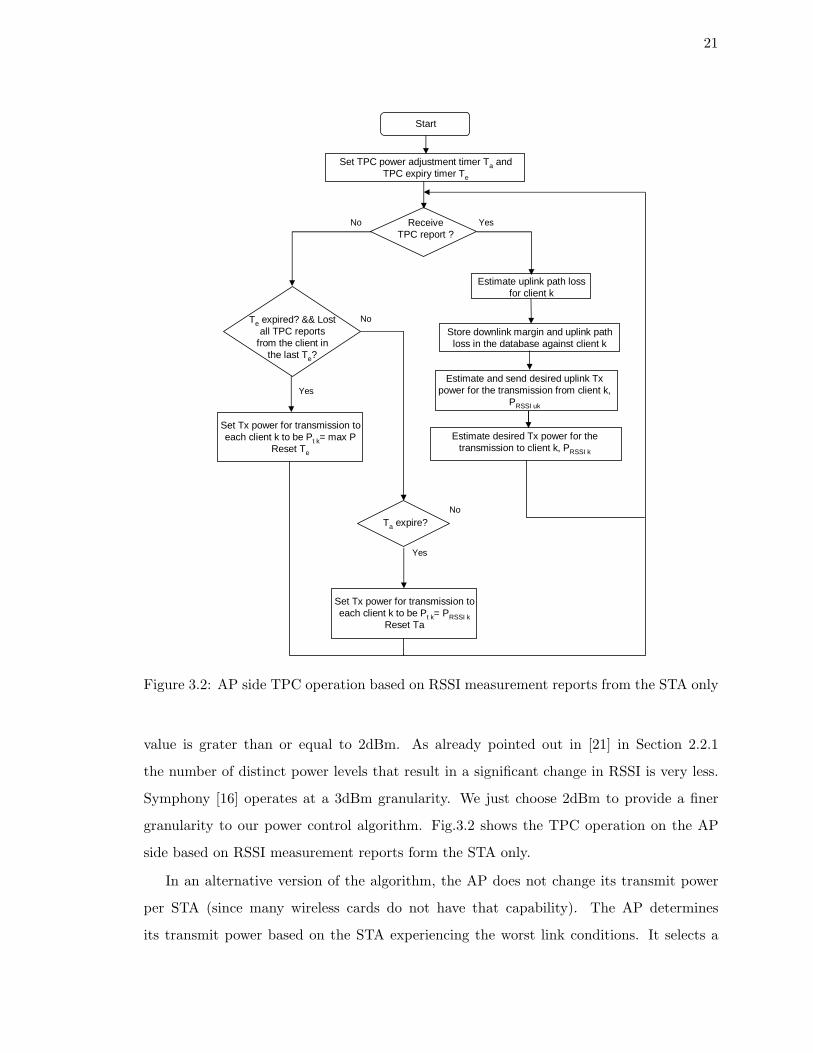
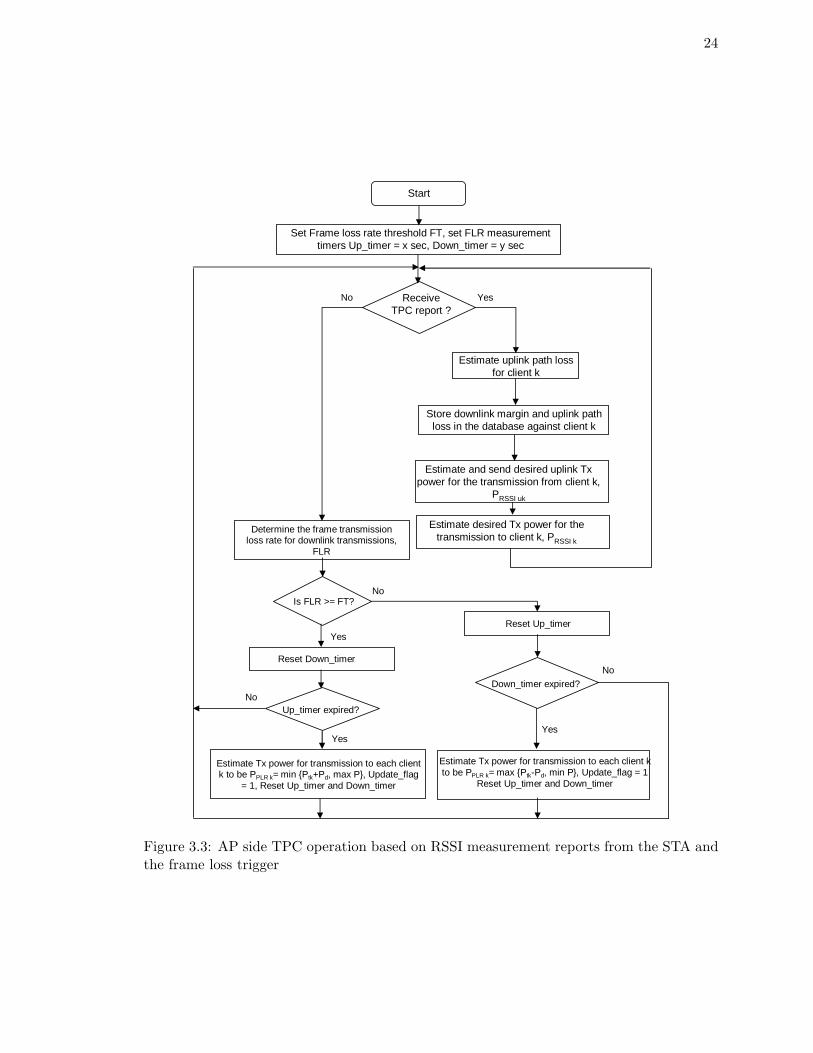
The AP continues to monitor FLR. Fig.3.3 shows a flowchart of the procedure of the
AP transmit power control (TPC) operation based on RSSI measurement reports from the
STAs and frame loss rate measurements.
As a precautionary mechanism to avoid repetitive switching between two power levels one
with FLR < FT and the other with FLR ≥ FT (in the continued presence of interference
or client movement), lower probabilities are assigned for transition from a higher power
level to a lower power level. FT , Pd, x and y are the design tuning parameters. In our
implementation, frame loss rate threshold FT is set to 10% (as specified in IEEE 802.11n),
transmit power adjustment Pd is set to 2dBm and time thresholds x and y are set to 2 and
5 seconds respectively. The choice of the value for Pd is exactly the same as the choice for
power setting threshold as described in Section 3.1. Table.3.1 lists the parameter values
used in our implementation of the proposed adaptive TPC algorithm.
Alternatively, the AP can perform the FLR measurement for its transmission to each
of its associated clients individually, i.e., the AP maintains the information of per-link
frame loss rate (capability not present in the Atheros AR5008 cards). Specifically, the
24
Determine the frame transmission loss rate for downlink transmissions,
FLR
Estimate Tx power for transmission to each client k to be PPLR k= min {Ptk+Pd, max P}, Update_flag
= 1, Reset Up_timer and Down_timer
Yes
Estimate Tx power for transmission to each client k to be PPLR k= max {Ptk-Pd, min P}, Update_flag = 1
Reset Up_timer and Down_timer
Estimate uplink path loss for client k
Store downlink margin and uplink path loss in the database against client k
Receive TPC report ?
Estimate and send desired uplink Txpower for the transmission from client k,
PRSSI uk
Start
Set Frame loss rate threshold FT, set FLR measurement timers Up_timer = x sec, Down_timer = y sec
No
No
Yes
No Yes
Reset Up_timer
Is FLR >= FT?
Reset Down_timer
Yes
Up_timer expired?
Down_timer expired?No
Estimate desired Tx power for the transmission to client k, PRSSI k
Figure 3.3: AP side TPC operation based on RSSI measurement reports from the STA andthe frame loss trigger
25
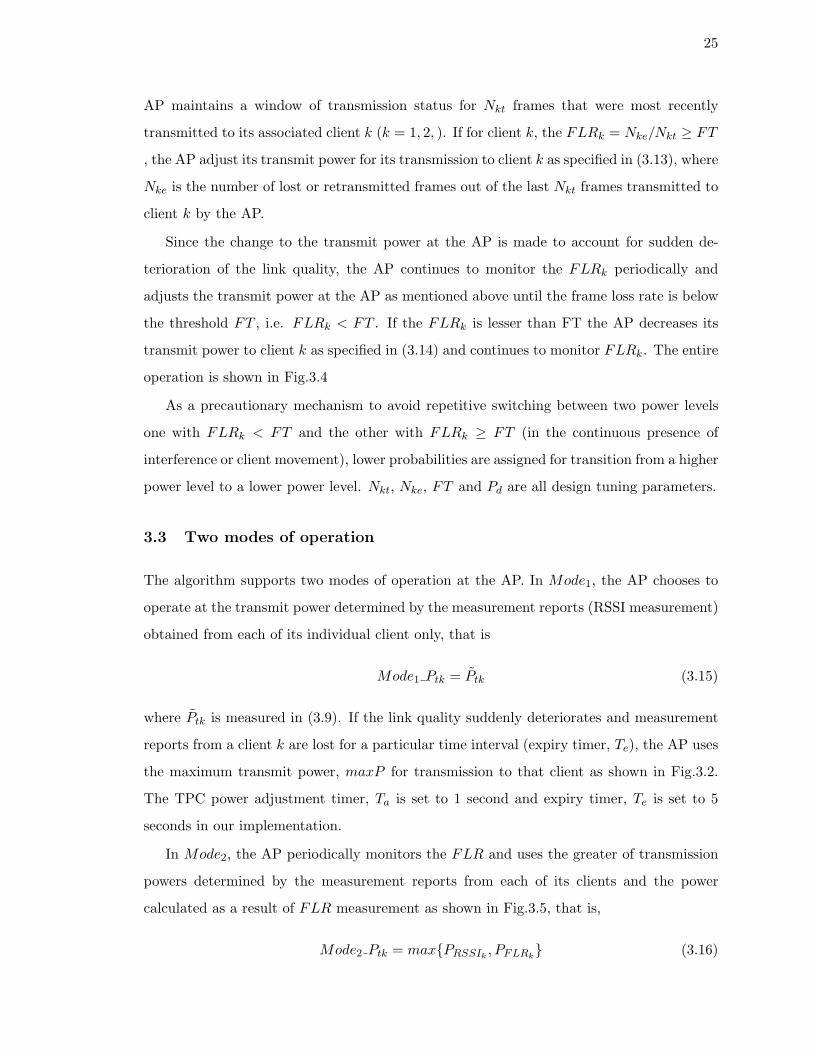
AP maintains a window of transmission status for Nkt frames that were most recently
transmitted to its associated client k (k = 1, 2, ). If for client k, the FLRk = Nke/Nkt ≥ FT
, the AP adjust its transmit power for its transmission to client k as specified in (3.13), where
Nke is the number of lost or retransmitted frames out of the last Nkt frames transmitted to
client k by the AP.
Since the change to the transmit power at the AP is made to account for sudden de-
terioration of the link quality, the AP continues to monitor the FLRk periodically and
adjusts the transmit power at the AP as mentioned above until the frame loss rate is below
the threshold FT , i.e. FLRk < FT . If the FLRk is lesser than FT the AP decreases its
transmit power to client k as specified in (3.14) and continues to monitor FLRk. The entire
operation is shown in Fig.3.4
As a precautionary mechanism to avoid repetitive switching between two power levels
one with FLRk < FT and the other with FLRk ≥ FT (in the continuous presence of
interference or client movement), lower probabilities are assigned for transition from a higher
power level to a lower power level. Nkt, Nke, FT and Pd are all design tuning parameters.
3.3 Two modes of operation
The algorithm supports two modes of operation at the AP. In Mode1, the AP chooses to
operate at the transmit power determined by the measurement reports (RSSI measurement)
obtained from each of its individual client only, that is
Mode1 Ptk = Ptk (3.15)
where Ptk is measured in (3.9). If the link quality suddenly deteriorates and measurement
reports from a client k are lost for a particular time interval (expiry timer, Te), the AP uses
the maximum transmit power, maxP for transmission to that client as shown in Fig.3.2.
The TPC power adjustment timer, Ta is set to 1 second and expiry timer, Te is set to 5
seconds in our implementation.
In Mode2, the AP periodically monitors the FLR and uses the greater of transmission
powers determined by the measurement reports from each of its clients and the power
calculated as a result of FLR measurement as shown in Fig.3.5, that is,
Mode2 Ptk = max{PRSSIk, PFLRk
} (3.16)
26
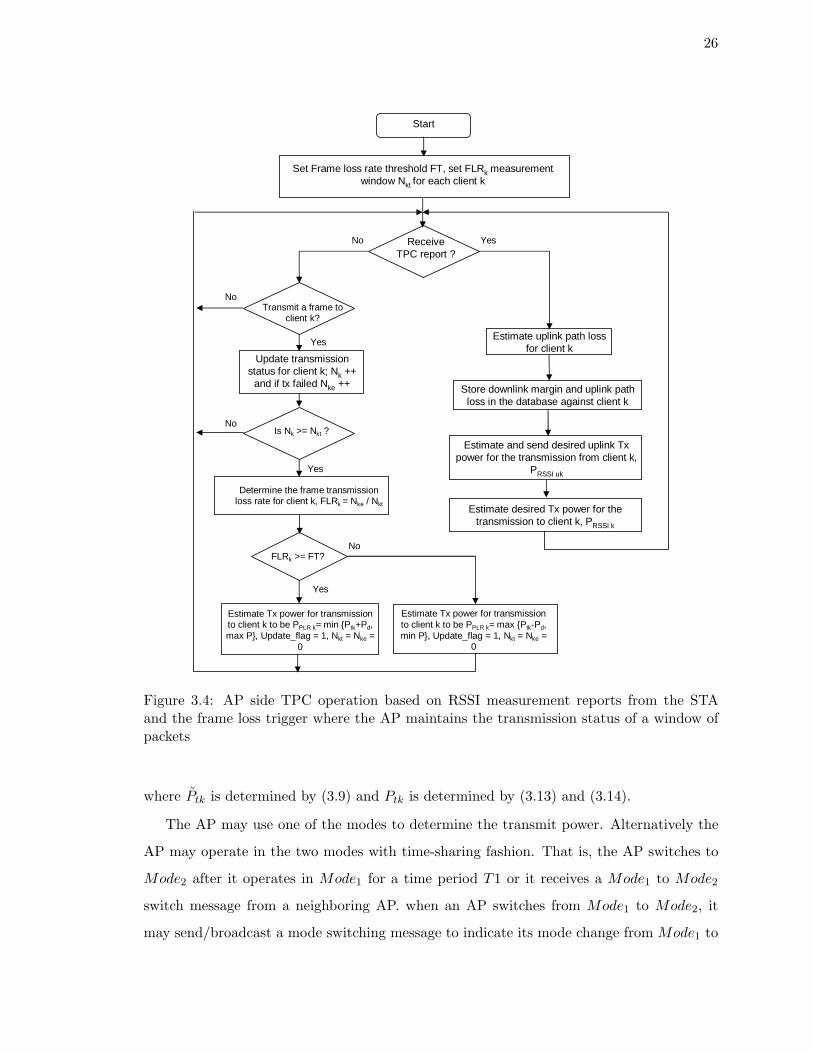
Determine the frame transmission loss rate for client k, FLRk = Nke / Nkt
Estimate Tx power for transmission to client k to be PPLR k= min {Ptk+Pd, max P}, Update_flag = 1, Nkt = Nke =
0
Yes
Estimate Tx power for transmission to client k to be PPLR k= max {Ptk-Pd, min P}, Update_flag = 1, Nkt = Nke =
0
Estimate uplink path loss for client k
Store downlink margin and uplink path loss in the database against client k
Receive TPC report ?
Estimate and send desired uplink Txpower for the transmission from client k,
PRSSI uk
Start
Set Frame loss rate threshold FT, set FLRk measurement window Nkt for each client k
No
No Yes
Transmit a frame to client k?
Update transmission status for client k; Nk ++
and if tx failed Nke ++
Is Nk >= Nkt ?
FLRk >= FT?
Yes
No
Yes
No
Estimate desired Tx power for the transmission to client k, PRSSI k
Figure 3.4: AP side TPC operation based on RSSI measurement reports from the STAand the frame loss trigger where the AP maintains the transmission status of a window ofpackets
where Ptk is determined by (3.9) and Ptk is determined by (3.13) and (3.14).
The AP may use one of the modes to determine the transmit power. Alternatively the
AP may operate in the two modes with time-sharing fashion. That is, the AP switches to
Mode2 after it operates in Mode1 for a time period T1 or it receives a Mode1 to Mode2
switch message from a neighboring AP. when an AP switches from Mode1 to Mode2, it
may send/broadcast a mode switching message to indicate its mode change from Mode1 to
27
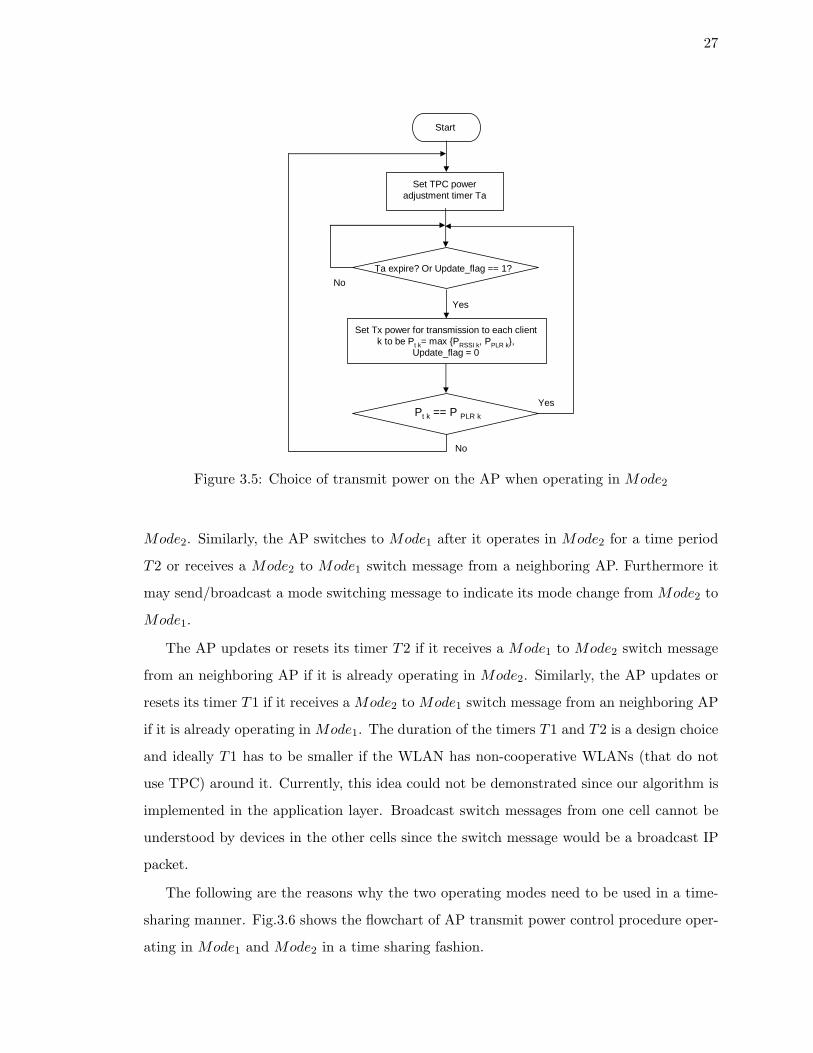
Start
Set TPC power adjustment timer Ta
Ta expire? Or Update_flag == 1?
No
Yes
Set Tx power for transmission to each client k to be Pt k= max {PRSSI k, PPLR k},
Update_flag = 0
Pt k == P PLR k
No
Yes
Figure 3.5: Choice of transmit power on the AP when operating in Mode2
Mode2. Similarly, the AP switches to Mode1 after it operates in Mode2 for a time period
T2 or receives a Mode2 to Mode1 switch message from a neighboring AP. Furthermore it
may send/broadcast a mode switching message to indicate its mode change from Mode2 to
Mode1.
The AP updates or resets its timer T2 if it receives a Mode1 to Mode2 switch message
from an neighboring AP if it is already operating in Mode2. Similarly, the AP updates or
resets its timer T1 if it receives a Mode2 to Mode1 switch message from an neighboring AP
if it is already operating in Mode1. The duration of the timers T1 and T2 is a design choice
and ideally T1 has to be smaller if the WLAN has non-cooperative WLANs (that do not
use TPC) around it. Currently, this idea could not be demonstrated since our algorithm is
implemented in the application layer. Broadcast switch messages from one cell cannot be
understood by devices in the other cells since the switch message would be a broadcast IP
packet.
The following are the reasons why the two operating modes need to be used in a time-
sharing manner. Fig.3.6 shows the flowchart of AP transmit power control procedure oper-
ating in Mode1 and Mode2 in a time sharing fashion.
28
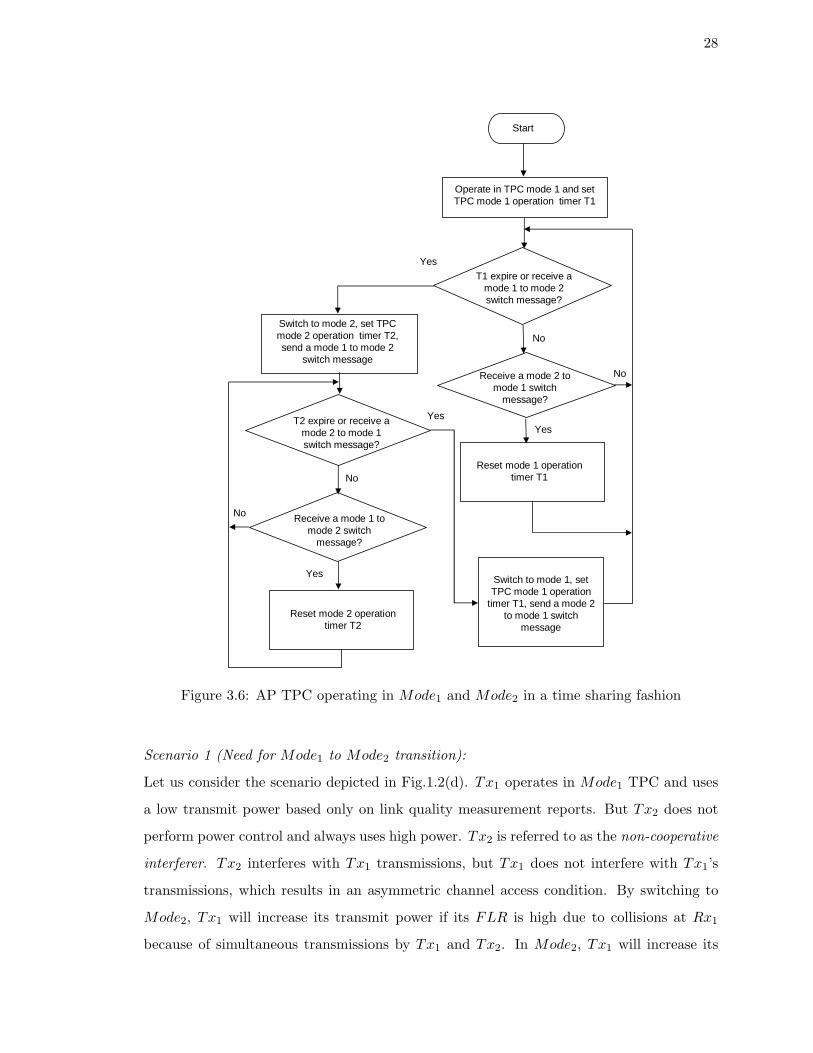
Operate in TPC mode 1 and set TPC mode 1 operation timer T1
T1 expire or receive a mode 1 to mode 2 switch message?
Switch to mode 2, set TPC mode 2 operation timer T2, send a mode 1 to mode 2
switch message
Yes
No
Start
Receive a mode 2 to mode 1 switch
message?
No
Yes
T2 expire or receive a mode 2 to mode 1 switch message?
No
Reset mode 1 operation timer T1
Receive a mode 1 to mode 2 switch
message?
Yes
No
Yes
Reset mode 2 operation timer T2
Switch to mode 1, set TPC mode 1 operation
timer T1, send a mode 2 to mode 1 switch
message
Figure 3.6: AP TPC operating in Mode1 and Mode2 in a time sharing fashion
Scenario 1 (Need for Mode1 to Mode2 transition):
Let us consider the scenario depicted in Fig.1.2(d). Tx1 operates in Mode1 TPC and uses
a low transmit power based only on link quality measurement reports. But Tx2 does not
perform power control and always uses high power. Tx2 is referred to as the non-cooperative
interferer. Tx2 interferes with Tx1 transmissions, but Tx1 does not interfere with Tx1’s
transmissions, which results in an asymmetric channel access condition. By switching to
Mode2, Tx1 will increase its transmit power if its FLR is high due to collisions at Rx1
because of simultaneous transmissions by Tx1 and Tx2. In Mode2, Tx1 will increase its
29
transmit power to counteract the frame losses that it suffers.
Scenario 2 (Need for Mode2 to Mode1 transition):
Consider two transmitter (Tx) - receiver (Rx) pairs (Tx1 → Rx1 and Tx2 → Rx2) in
scenario depicted in Fig.1.2(a). Both the pairs operate in Mode2 TPC, use reduced trans-
mission power and hence do not interfere with each other. If Tx2 increases its transmission
power to react to sudden movement of Rx2, it causes the transmission power of Tx1 to go
up because of frame or packet losses at Rx1 due to interference from Tx2. Now even if
Rx2 gets back to its previous state the two pairs start interfering with each other resulting
in packet losses at the receivers because the transmitters use higher transmit powers as
shown in scenario Fig.1.2(f). The transmitters are still out of the carrier sensing range of
each other. The transmission powers of Tx1 and Tx2 will not decrease due to continued
interference to each other at the receiver end. By switching to Mode1 synchronously, the
two transmitters will decrease their transmit powers based on only on RSSI reports and
hence do not interfere each other anymore. Also, later on when the transmitters switch to
Mode2 from Mode1, they do not interfere with each other anymore, the packet loss rate is
low and they will not increase the transmission powers.
If Tx1 broadcasts a mode switch frame, even though Tx2 is not in the communication
range of Tx1, Rx2 hears the message and forwards it to its AP, Tx2. Such an arrangement
is possible as there is a provision for the STA to report its beacon receptions to its AP in
802.11k [6].
30
Chapter 4
STA Side TPC
4.1 Transmit power estimation based on signal strength measurements
The AP also calculates the transmit power of its associated clients or STAs. The target
data rate and the target packet loss rate for uplink may be different from the down link
data rate. In our implementation, we use the highest supported data rate as the target
uplink data rate (MCS15, 130Mbps in 20MHz bandwidth with 2 spatial streams), and the
target packet loss rate is set to be the same value used to determine the receiver sensitivity
for the target data rate (<10% as specified in IEEE 802.11n standard), or a value small
enough to ensure the quality of service.
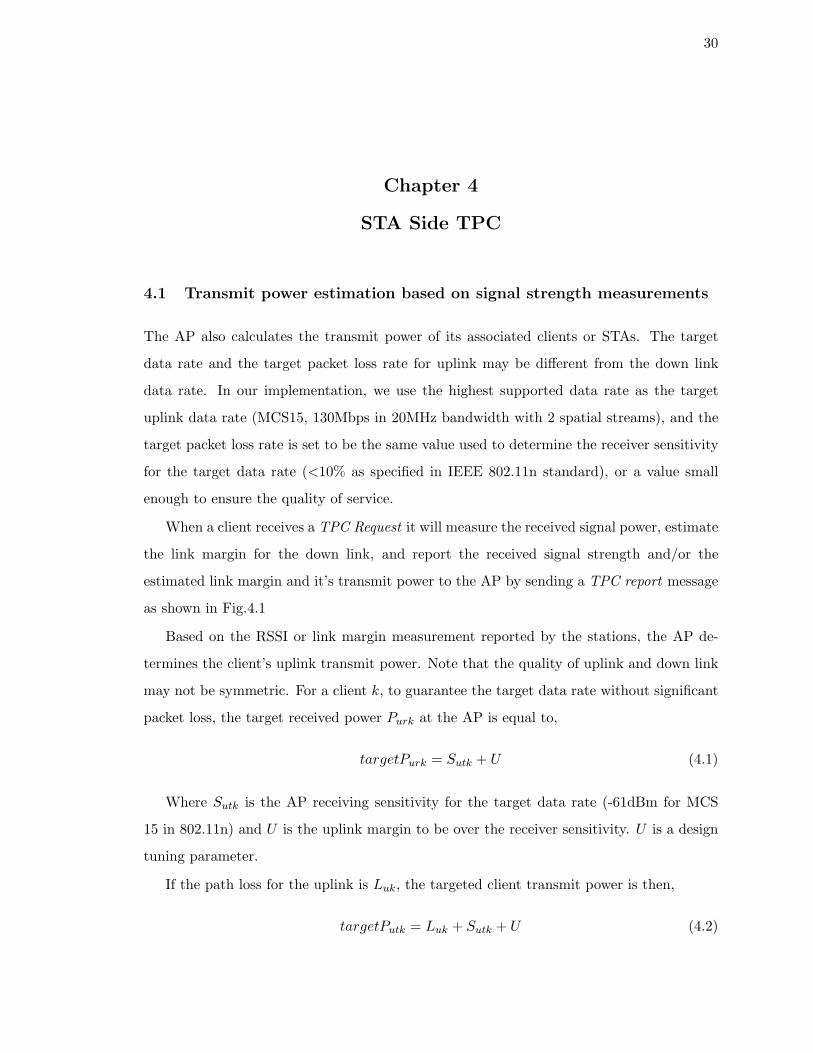
When a client receives a TPC Request it will measure the received signal power, estimate
the link margin for the down link, and report the received signal strength and/or the
estimated link margin and it’s transmit power to the AP by sending a TPC report message
as shown in Fig.4.1
Based on the RSSI or link margin measurement reported by the stations, the AP de-
termines the client’s uplink transmit power. Note that the quality of uplink and down link
may not be symmetric. For a client k, to guarantee the target data rate without significant
packet loss, the target received power Purk at the AP is equal to,
targetPurk = Sutk + U (4.1)
Where Sutk is the AP receiving sensitivity for the target data rate (-61dBm for MCS
15 in 802.11n) and U is the uplink margin to be over the receiver sensitivity. U is a design
tuning parameter.
If the path loss for the uplink is Luk, the targeted client transmit power is then,
targetPutk = Luk + Sutk + U (4.2)
31
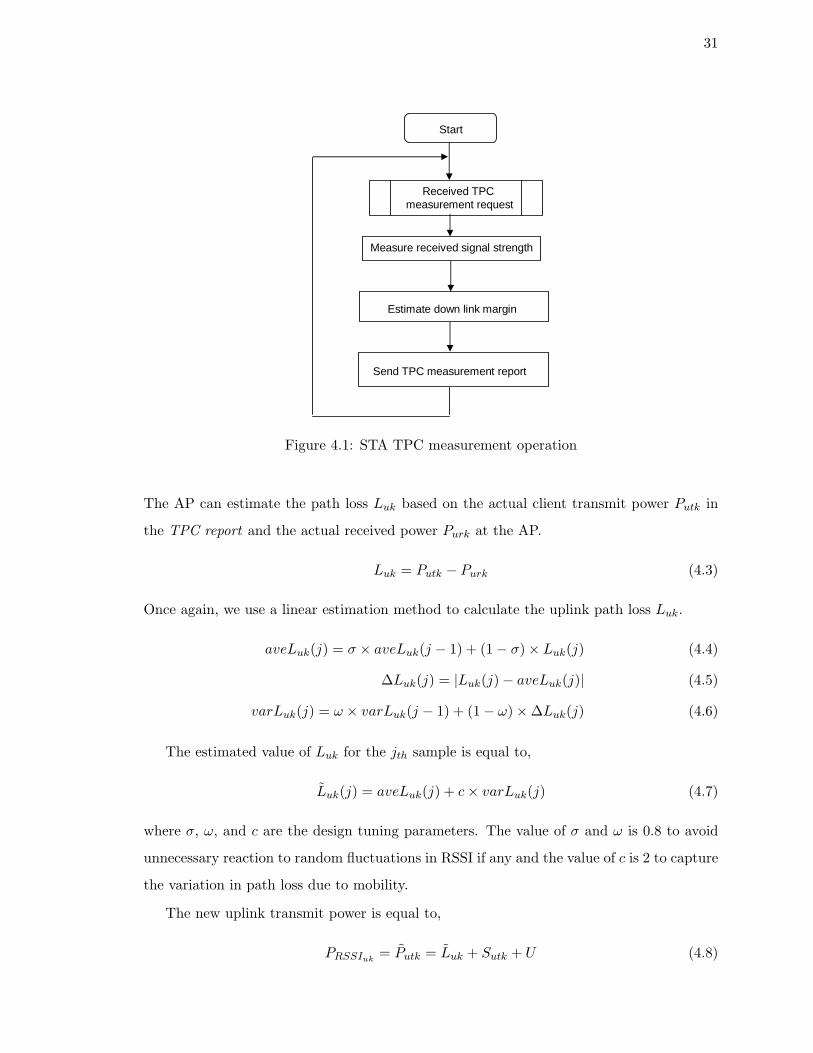
Measure received signal strength
Estimate down link margin
Send TPC measurement report
Received TPC measurement request
Start
Figure 4.1: STA TPC measurement operation
The AP can estimate the path loss Luk based on the actual client transmit power Putk in
the TPC report and the actual received power Purk at the AP.
Luk = Putk − Purk (4.3)
Once again, we use a linear estimation method to calculate the uplink path loss Luk.
aveLuk(j) = σ × aveLuk(j − 1) + (1− σ)× Luk(j) (4.4)
∆Luk(j) = |Luk(j)− aveLuk(j)| (4.5)
varLuk(j) = ω × varLuk(j − 1) + (1− ω)×∆Luk(j) (4.6)
The estimated value of Luk for the jth sample is equal to,
Luk(j) = aveLuk(j) + c× varLuk(j) (4.7)
where σ, ω, and c are the design tuning parameters. The value of σ and ω is 0.8 to avoid
unnecessary reaction to random fluctuations in RSSI if any and the value of c is 2 to capture
the variation in path loss due to mobility.
The new uplink transmit power is equal to,
PRSSIuk= Putk = Luk + Sutk + U (4.8)
32
The AP can instruct the client to use the new transmit power by sending the message
through the Power constraint IE to the STA.
In an alternative embodiment, the AP may want all the STAs to use the same transmit
power for uplink. The AP then determines the uplink transmit power based on the client
experiencing the worst link conditions. If multiple clients are associated with an AP, the
uplink transmit power is,
Put = maxkPutk (4.9)
When a STA boots up, its initial power can be the maximum supported power by it
Pu−supported. Alternatively, it can be the maximum allowed transmit power specified in
the AP management frames (Power constraint IE) Pu−allowed, or the minimum of the max-
imum supported power and the maximum allowed transmit power, i.e.,
Put(0) = min{Pu−supported, Pu−allowed} (4.10)
The new STA will use this maximum power for association and transmission until it success-
fully receives an instruction to change its transmitting power. When a new STA associates
to the AP, the AP issues a TPC request for this new client after its association process. Af-
ter receiving the TPC report from this client, the AP determines and adapts the uplink and
down link transmit power. The updated uplink transmit power is sent to the client using
a management frame (Power constraint IE) to instruct the client to use the new transmit
power value for uplink transmission.
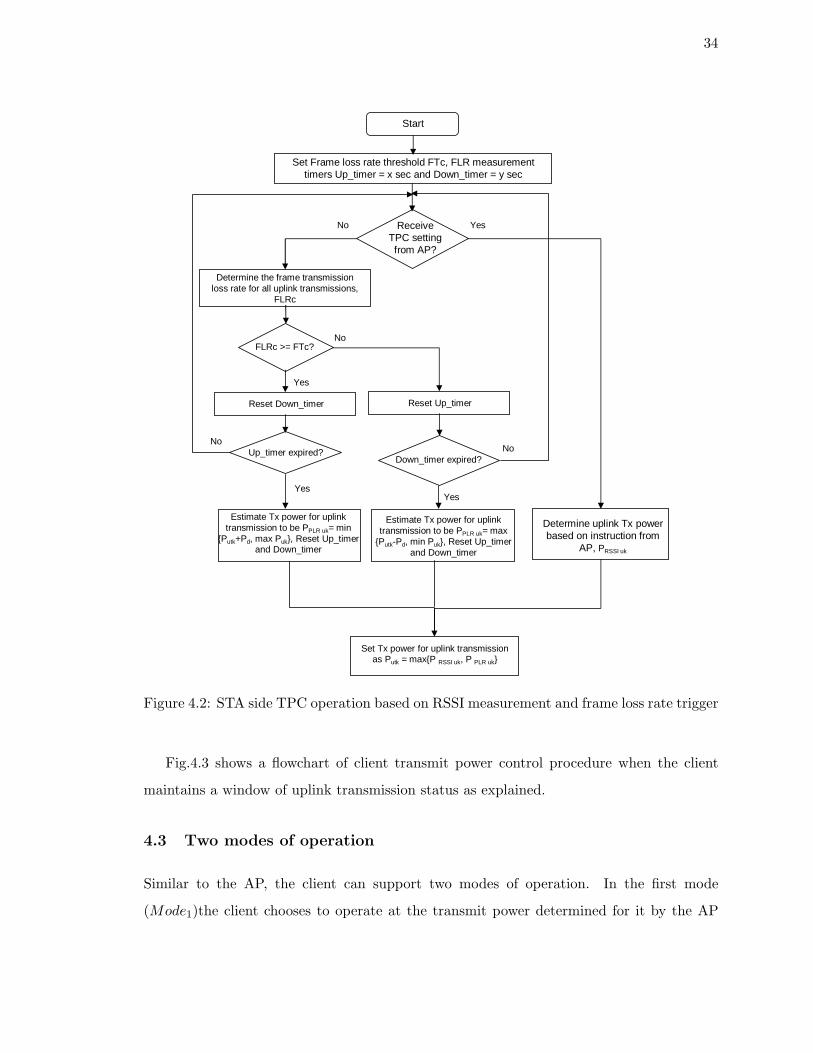
4.2 Power adjustment based on Frame Loss Rate trigger
To react to sudden deterioration of link quality or loss of link, for example, as a client moves
away or frame losses caused by receiver side interference at the AP, the client also monitors
its frame loss rate and adjusts the transmit power based on the frame loss rate. In our
implementation, a client periodically determines its frame loss rate (FLRc) for its uplink
transmissions to its associated AP. If the FLRc during a time interval (say x seconds) is
greater than a threshold FTc, FLRc ≥ FTc, the client adjusts its uplink transmit power.
If the current uplink transmit power for client k is Putk, the new transmit power for the
client k’s uplink transmission to the AP is the smaller one of Putk + Pud and the maximum
33
uplink power supported by client, maxPuk, i.e. new transmit power is,
PFLRuk= Putk = min{Putk + Pud, maxPuk} (4.11)
Since the change to the transmit power at the client is made to account for sudden
deterioration of the link quality, the client continues to monitor the FLRc periodically
and adjusts its transmit power as mentioned above until the frame loss rate is below the
threshold FTc, i.e. FLRc < FTc. If the FLRc is lesser than FTc for a particular time
interval (say y seconds), the client decreases its uplink transmit power by the value Pud and
the new transmit power for uplink transmission at client k is the maximum of Putk − Pud
and the minimum transmit power supported by client, minPuk, i.e. new transmit power is,
PFLRuk= Putk = max{Putk − Pud,minPuk} (4.12)
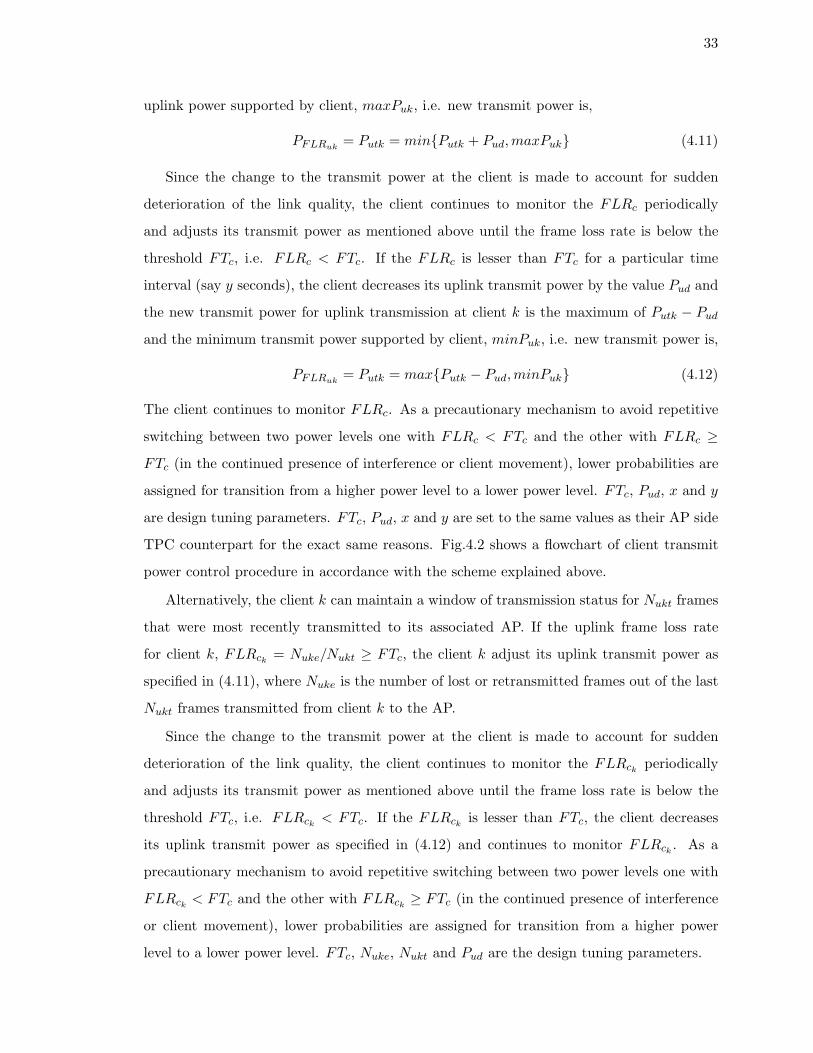
The client continues to monitor FLRc. As a precautionary mechanism to avoid repetitive
switching between two power levels one with FLRc < FTc and the other with FLRc ≥FTc (in the continued presence of interference or client movement), lower probabilities are
assigned for transition from a higher power level to a lower power level. FTc, Pud, x and y
are design tuning parameters. FTc, Pud, x and y are set to the same values as their AP side
TPC counterpart for the exact same reasons. Fig.4.2 shows a flowchart of client transmit
power control procedure in accordance with the scheme explained above.
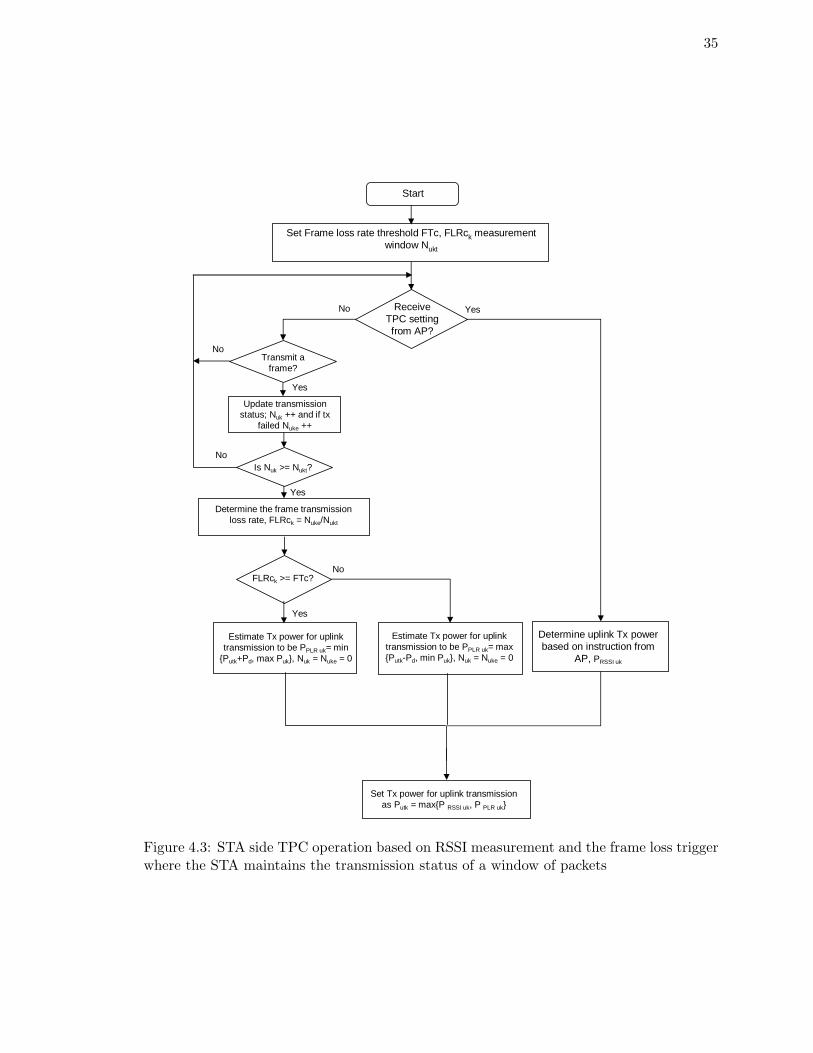
Alternatively, the client k can maintain a window of transmission status for Nukt frames
that were most recently transmitted to its associated AP. If the uplink frame loss rate
for client k, FLRck= Nuke/Nukt ≥ FTc, the client k adjust its uplink transmit power as
specified in (4.11), where Nuke is the number of lost or retransmitted frames out of the last
Nukt frames transmitted from client k to the AP.
Since the change to the transmit power at the client is made to account for sudden
deterioration of the link quality, the client continues to monitor the FLRckperiodically
and adjusts its transmit power as mentioned above until the frame loss rate is below the
threshold FTc, i.e. FLRck< FTc. If the FLRck
is lesser than FTc, the client decreases
its uplink transmit power as specified in (4.12) and continues to monitor FLRck. As a
precautionary mechanism to avoid repetitive switching between two power levels one with
FLRck< FTc and the other with FLRck
≥ FTc (in the continued presence of interference
or client movement), lower probabilities are assigned for transition from a higher power
level to a lower power level. FTc, Nuke, Nukt and Pud are the design tuning parameters.
34
Determine the frame transmission loss rate for all uplink transmissions,
FLRc
Estimate Tx power for uplink transmission to be PPLR uk= min
{Putk+Pd, max Puk}, Reset Up_timerand Down_timer
Yes
Receive TPC setting from AP?
Determine uplink Tx power based on instruction from
AP, PRSSI uk
Start
Set Frame loss rate threshold FTc, FLR measurement timers Up_timer = x sec and Down_timer = y sec
No
No
Yes
No Yes
Reset Up_timer
FLRc >= FTc?
Reset Down_timer
Yes
Up_timer expired?Down_timer expired?
No
Estimate Tx power for uplink transmission to be PPLR uk= max
{Putk-Pd, min Puk}, Reset Up_timerand Down_timer
Set Tx power for uplink transmission as Putk = max{P RSSI uk, P PLR uk}
Figure 4.2: STA side TPC operation based on RSSI measurement and frame loss rate trigger
Fig.4.3 shows a flowchart of client transmit power control procedure when the client
maintains a window of uplink transmission status as explained.
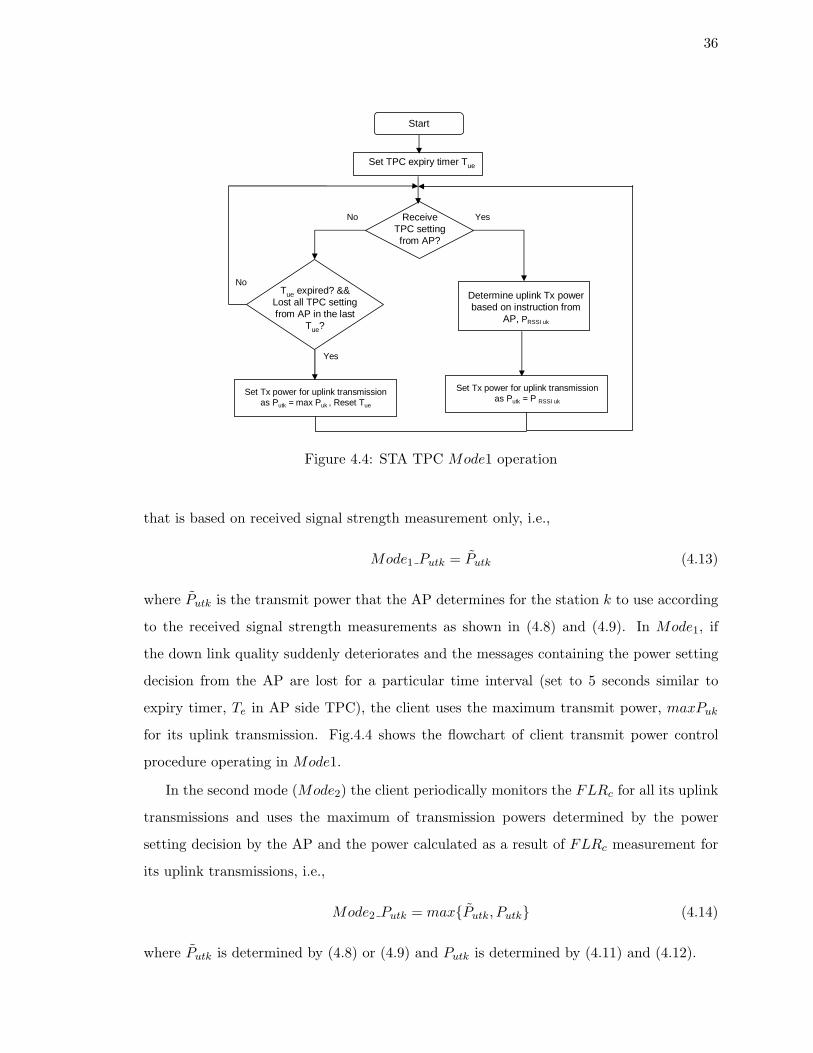
4.3 Two modes of operation
Similar to the AP, the client can support two modes of operation. In the first mode
(Mode1)the client chooses to operate at the transmit power determined for it by the AP
35
Determine the frame transmission loss rate, FLRck = Nuke/Nukt
Estimate Tx power for uplink transmission to be PPLR uk= min
{Putk+Pd, max Puk}, Nuk = Nuke = 0
Yes
Receive TPC setting from AP?
Determine uplink Tx power based on instruction from
AP, PRSSI uk
Start
Set Frame loss rate threshold FTc, FLRck measurement window Nukt
No
No Yes
FLRck >= FTc?
Estimate Tx power for uplink transmission to be PPLR uk= max {Putk-Pd, min Puk}, Nuk = Nuke = 0
Set Tx power for uplink transmission as Putk = max{P RSSI uk, P PLR uk}
Is Nuk >= Nukt?
Update transmission status; Nuk ++ and if tx
failed Nuke ++
Transmit a frame?
Yes
No
No
Yes
Figure 4.3: STA side TPC operation based on RSSI measurement and the frame loss triggerwhere the STA maintains the transmission status of a window of packets
36
Receive TPC setting from AP?
Determine uplink Tx power based on instruction from
AP, PRSSI uk
Start
Set TPC expiry timer Tue
No Yes
Set Tx power for uplink transmission as Putk = P RSSI uk
Tue expired? && Lost all TPC setting from AP in the last
Tue?
Set Tx power for uplink transmission as Putk = max Puk , Reset Tue
Yes
No
Figure 4.4: STA TPC Mode1 operation
that is based on received signal strength measurement only, i.e.,
Mode1 Putk = Putk (4.13)
where Putk is the transmit power that the AP determines for the station k to use according
to the received signal strength measurements as shown in (4.8) and (4.9). In Mode1, if
the down link quality suddenly deteriorates and the messages containing the power setting
decision from the AP are lost for a particular time interval (set to 5 seconds similar to
expiry timer, Te in AP side TPC), the client uses the maximum transmit power, maxPuk
for its uplink transmission. Fig.4.4 shows the flowchart of client transmit power control
procedure operating in Mode1.
In the second mode (Mode2) the client periodically monitors the FLRc for all its uplink
transmissions and uses the maximum of transmission powers determined by the power
setting decision by the AP and the power calculated as a result of FLRc measurement for
its uplink transmissions, i.e.,
Mode2 Putk = max{Putk, Putk} (4.14)
where Putk is determined by (4.8) or (4.9) and Putk is determined by (4.11) and (4.12).
37
The client may use one of the modes to determine the transmit power. Alternatively the
client may operate in the two modes in a time-sharing fashion. That is, the client switches
to Mode2 after it operates in Mode1 for a time period T1 or it receives a Mode1 to Mode2
switch message from the AP. Similarly, it switches to Mode1 after it operates in Mode2
for a time period T2 or receives a Mode2 to Mode1 switch message from the AP. If the
client receives a Mode1 to Mode2 switch message from the AP and it is already operating
in Mode2, it reset its timer T2. Similarly, if the client receives a Mode2 to Mode1 switch
message from the AP and it is already operating in Mode1, it reset its timer T1. Similar
to the AP, timer T1 is set to a low value compared to T2. Fig.3.6 shows the flowchart of
client transmit power control procedure operating in Mode1 and Mode2 in a time sharing
fashion.
38
Chapter 5
Results and Discussion
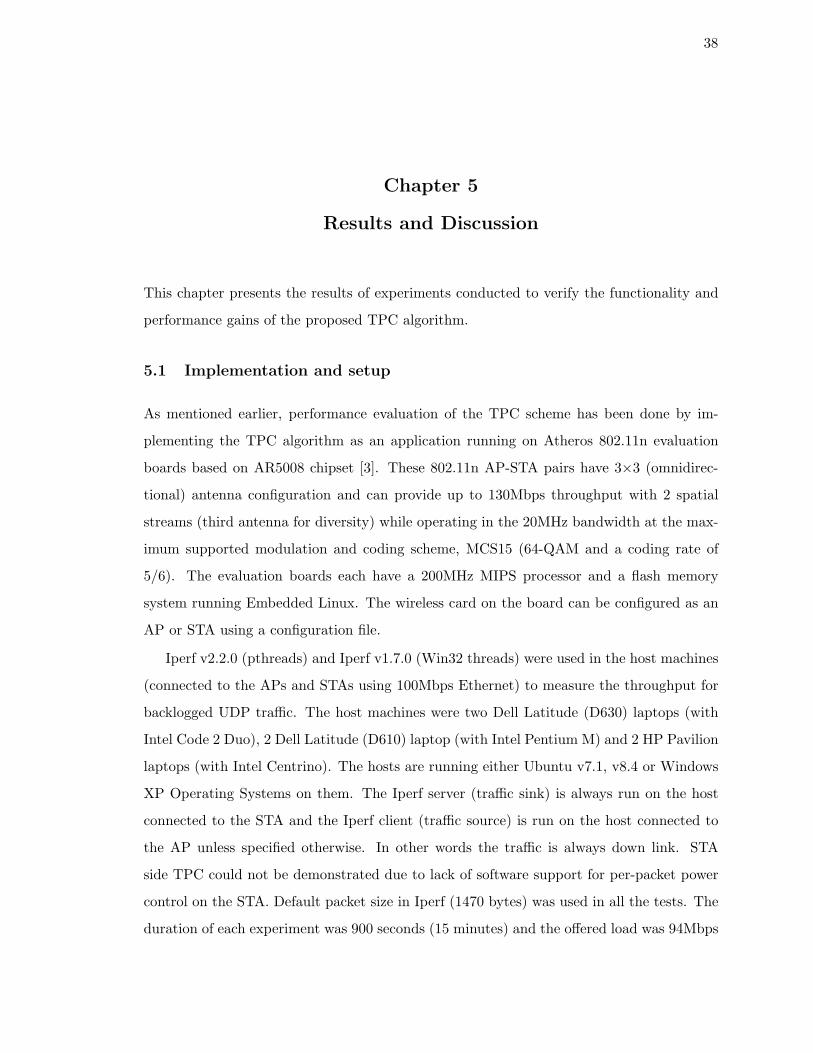
This chapter presents the results of experiments conducted to verify the functionality and
performance gains of the proposed TPC algorithm.
5.1 Implementation and setup
As mentioned earlier, performance evaluation of the TPC scheme has been done by im-
plementing the TPC algorithm as an application running on Atheros 802.11n evaluation
boards based on AR5008 chipset [3]. These 802.11n AP-STA pairs have 3×3 (omnidirec-
tional) antenna configuration and can provide up to 130Mbps throughput with 2 spatial
streams (third antenna for diversity) while operating in the 20MHz bandwidth at the max-
imum supported modulation and coding scheme, MCS15 (64-QAM and a coding rate of
5/6). The evaluation boards each have a 200MHz MIPS processor and a flash memory
system running Embedded Linux. The wireless card on the board can be configured as an
AP or STA using a configuration file.
Iperf v2.2.0 (pthreads) and Iperf v1.7.0 (Win32 threads) were used in the host machines
(connected to the APs and STAs using 100Mbps Ethernet) to measure the throughput for
backlogged UDP traffic. The host machines were two Dell Latitude (D630) laptops (with
Intel Code 2 Duo), 2 Dell Latitude (D610) laptop (with Intel Pentium M) and 2 HP Pavilion
laptops (with Intel Centrino). The hosts are running either Ubuntu v7.1, v8.4 or Windows
XP Operating Systems on them. The Iperf server (traffic sink) is always run on the host
connected to the STA and the Iperf client (traffic source) is run on the host connected to
the AP unless specified otherwise. In other words the traffic is always down link. STA
side TPC could not be demonstrated due to lack of software support for per-packet power
control on the STA. Default packet size in Iperf (1470 bytes) was used in all the tests. The
duration of each experiment was 900 seconds (15 minutes) and the offered load was 94Mbps
39
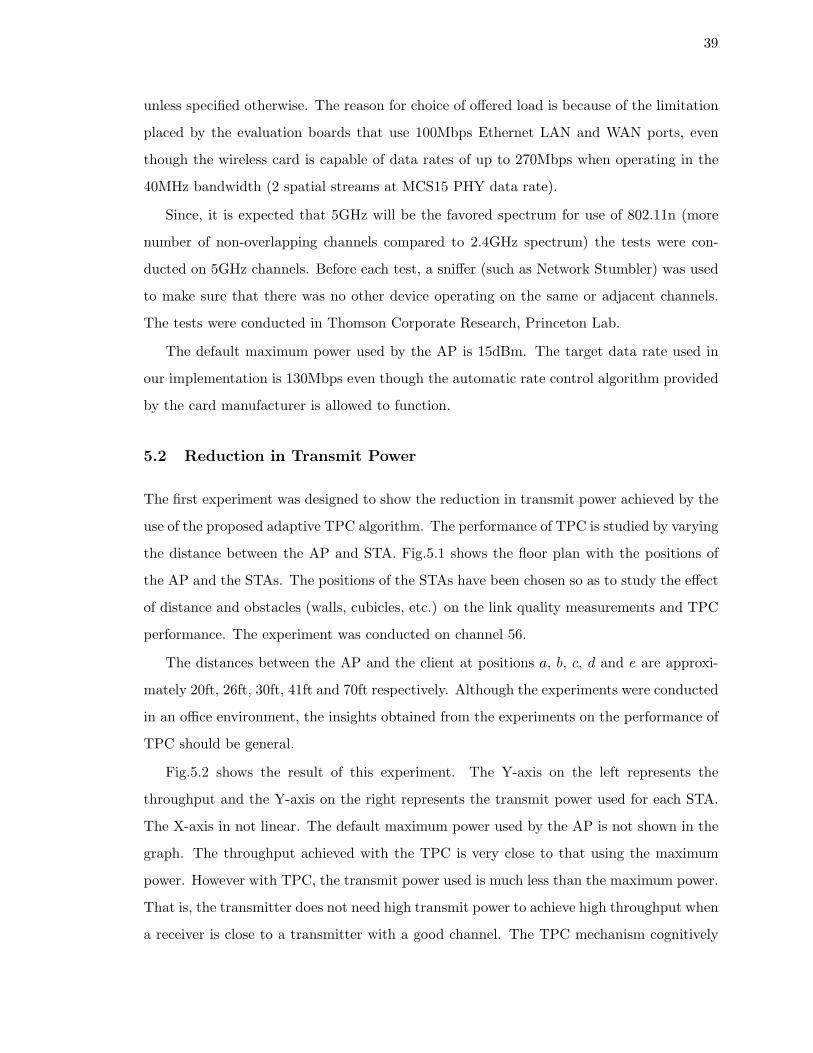
unless specified otherwise. The reason for choice of offered load is because of the limitation
placed by the evaluation boards that use 100Mbps Ethernet LAN and WAN ports, even
though the wireless card is capable of data rates of up to 270Mbps when operating in the
40MHz bandwidth (2 spatial streams at MCS15 PHY data rate).
Since, it is expected that 5GHz will be the favored spectrum for use of 802.11n (more
number of non-overlapping channels compared to 2.4GHz spectrum) the tests were con-
ducted on 5GHz channels. Before each test, a sniffer (such as Network Stumbler) was used
to make sure that there was no other device operating on the same or adjacent channels.
The tests were conducted in Thomson Corporate Research, Princeton Lab.
The default maximum power used by the AP is 15dBm. The target data rate used in
our implementation is 130Mbps even though the automatic rate control algorithm provided
by the card manufacturer is allowed to function.
5.2 Reduction in Transmit Power
The first experiment was designed to show the reduction in transmit power achieved by the
use of the proposed adaptive TPC algorithm. The performance of TPC is studied by varying
the distance between the AP and STA. Fig.5.1 shows the floor plan with the positions of
the AP and the STAs. The positions of the STAs have been chosen so as to study the effect
of distance and obstacles (walls, cubicles, etc.) on the link quality measurements and TPC
performance. The experiment was conducted on channel 56.
The distances between the AP and the client at positions a, b, c, d and e are approxi-
mately 20ft, 26ft, 30ft, 41ft and 70ft respectively. Although the experiments were conducted
in an office environment, the insights obtained from the experiments on the performance of
TPC should be general.
Fig.5.2 shows the result of this experiment. The Y-axis on the left represents the
throughput and the Y-axis on the right represents the transmit power used for each STA.
The X-axis in not linear. The default maximum power used by the AP is not shown in the
graph. The throughput achieved with the TPC is very close to that using the maximum
power. However with TPC, the transmit power used is much less than the maximum power.
That is, the transmitter does not need high transmit power to achieve high throughput when
a receiver is close to a transmitter with a good channel. The TPC mechanism cognitively
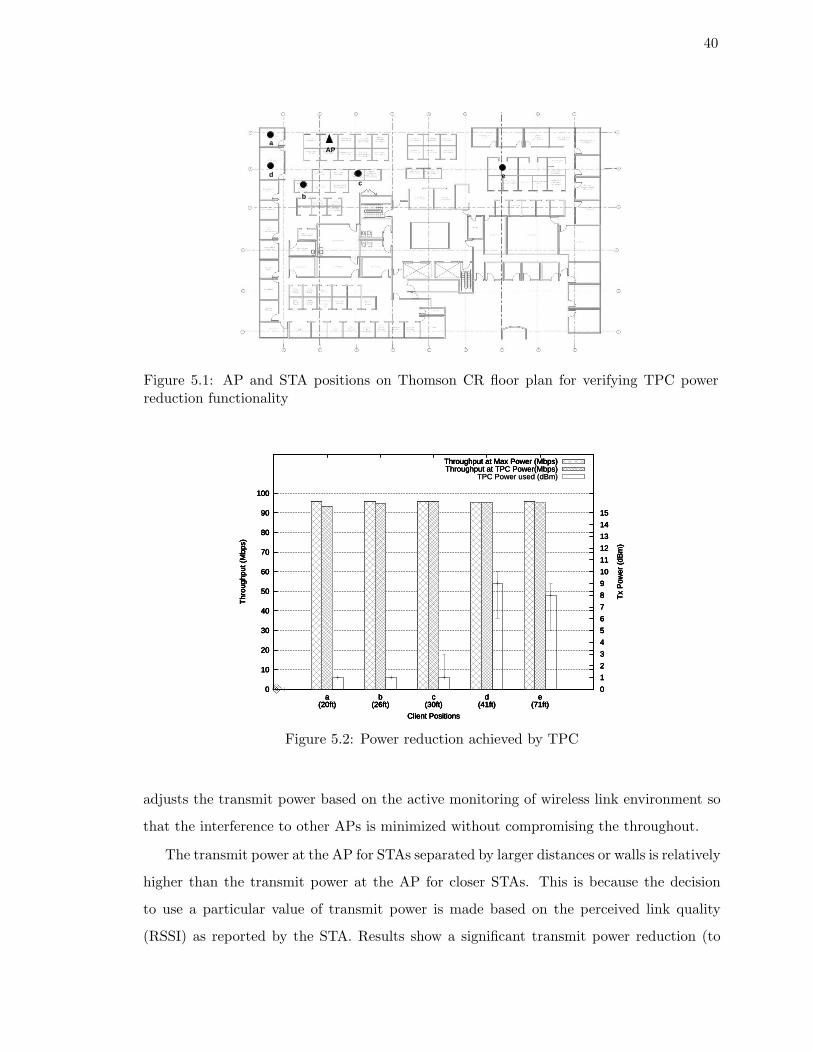
40
b
e
APa
dc
Figure 5.1: AP and STA positions on Thomson CR floor plan for verifying TPC powerreduction functionality
0
10
20
30
40
50
60
70
80
90
100
a(20ft)
b(26ft)
c(30ft)
d(41ft)
e(71ft)
0
1
2
3
4
5
6
7
8
9
10
11
12
13
14
15
Thr
ough
put (
Mbp
s)
Tx
Pow
er (
dBm
)
Client Positions
Throughput at Max Power (Mbps)
0
10
20
30
40
50
60
70
80
90
100
a(20ft)
b(26ft)
c(30ft)
d(41ft)
e(71ft)
0
1
2
3
4
5
6
7
8
9
10
11
12
13
14
15
Thr
ough
put (
Mbp
s)
Tx
Pow
er (
dBm
)
Client Positions
Throughput at Max Power (Mbps)Throughput at TPC Power(Mbps)
0
10
20
30
40
50
60
70
80
90
100
a(20ft)
b(26ft)
c(30ft)
d(41ft)
e(71ft)
0
1
2
3
4
5
6
7
8
9
10
11
12
13
14
15
Thr
ough
put (
Mbp
s)
Tx
Pow
er (
dBm
)
Client Positions
Throughput at Max Power (Mbps)Throughput at TPC Power(Mbps)
TPC Power used (dBm)
0
10
20
30
40
50
60
70
80
90
100
a(20ft)
b(26ft)
c(30ft)
d(41ft)
e(71ft)
0
1
2
3
4
5
6
7
8
9
10
11
12
13
14
15
Thr
ough
put (
Mbp
s)
Tx
Pow
er (
dBm
)
Client Positions
Throughput at Max Power (Mbps)Throughput at TPC Power(Mbps)
TPC Power used (dBm)
Figure 5.2: Power reduction achieved by TPC
adjusts the transmit power based on the active monitoring of wireless link environment so
that the interference to other APs is minimized without compromising the throughout.
The transmit power at the AP for STAs separated by larger distances or walls is relatively
higher than the transmit power at the AP for closer STAs. This is because the decision
to use a particular value of transmit power is made based on the perceived link quality
(RSSI) as reported by the STA. Results show a significant transmit power reduction (to
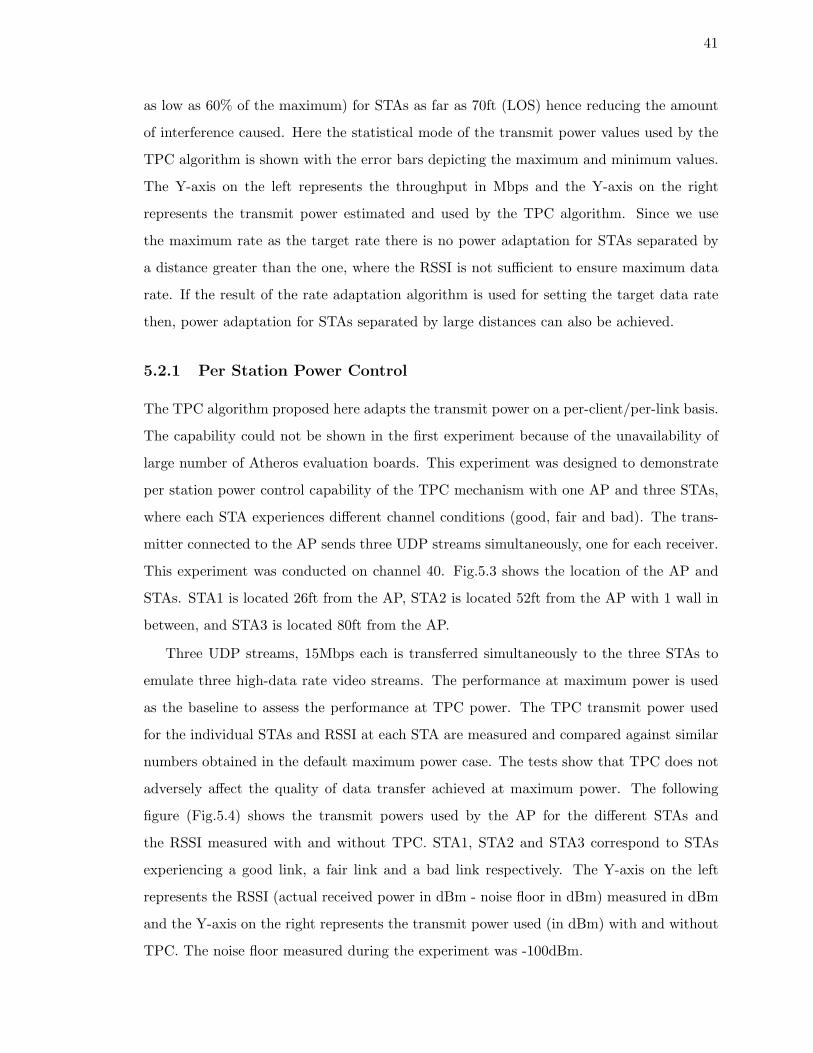
41
as low as 60% of the maximum) for STAs as far as 70ft (LOS) hence reducing the amount
of interference caused. Here the statistical mode of the transmit power values used by the
TPC algorithm is shown with the error bars depicting the maximum and minimum values.
The Y-axis on the left represents the throughput in Mbps and the Y-axis on the right
represents the transmit power estimated and used by the TPC algorithm. Since we use
the maximum rate as the target rate there is no power adaptation for STAs separated by
a distance greater than the one, where the RSSI is not sufficient to ensure maximum data
rate. If the result of the rate adaptation algorithm is used for setting the target data rate
then, power adaptation for STAs separated by large distances can also be achieved.
5.2.1 Per Station Power Control
The TPC algorithm proposed here adapts the transmit power on a per-client/per-link basis.
The capability could not be shown in the first experiment because of the unavailability of
large number of Atheros evaluation boards. This experiment was designed to demonstrate
per station power control capability of the TPC mechanism with one AP and three STAs,
where each STA experiences different channel conditions (good, fair and bad). The trans-
mitter connected to the AP sends three UDP streams simultaneously, one for each receiver.
This experiment was conducted on channel 40. Fig.5.3 shows the location of the AP and
STAs. STA1 is located 26ft from the AP, STA2 is located 52ft from the AP with 1 wall in
between, and STA3 is located 80ft from the AP.
Three UDP streams, 15Mbps each is transferred simultaneously to the three STAs to
emulate three high-data rate video streams. The performance at maximum power is used
as the baseline to assess the performance at TPC power. The TPC transmit power used
for the individual STAs and RSSI at each STA are measured and compared against similar
numbers obtained in the default maximum power case. The tests show that TPC does not
adversely affect the quality of data transfer achieved at maximum power. The following
figure (Fig.5.4) shows the transmit powers used by the AP for the different STAs and
the RSSI measured with and without TPC. STA1, STA2 and STA3 correspond to STAs
experiencing a good link, a fair link and a bad link respectively. The Y-axis on the left
represents the RSSI (actual received power in dBm - noise floor in dBm) measured in dBm
and the Y-axis on the right represents the transmit power used (in dBm) with and without
TPC. The noise floor measured during the experiment was -100dBm.
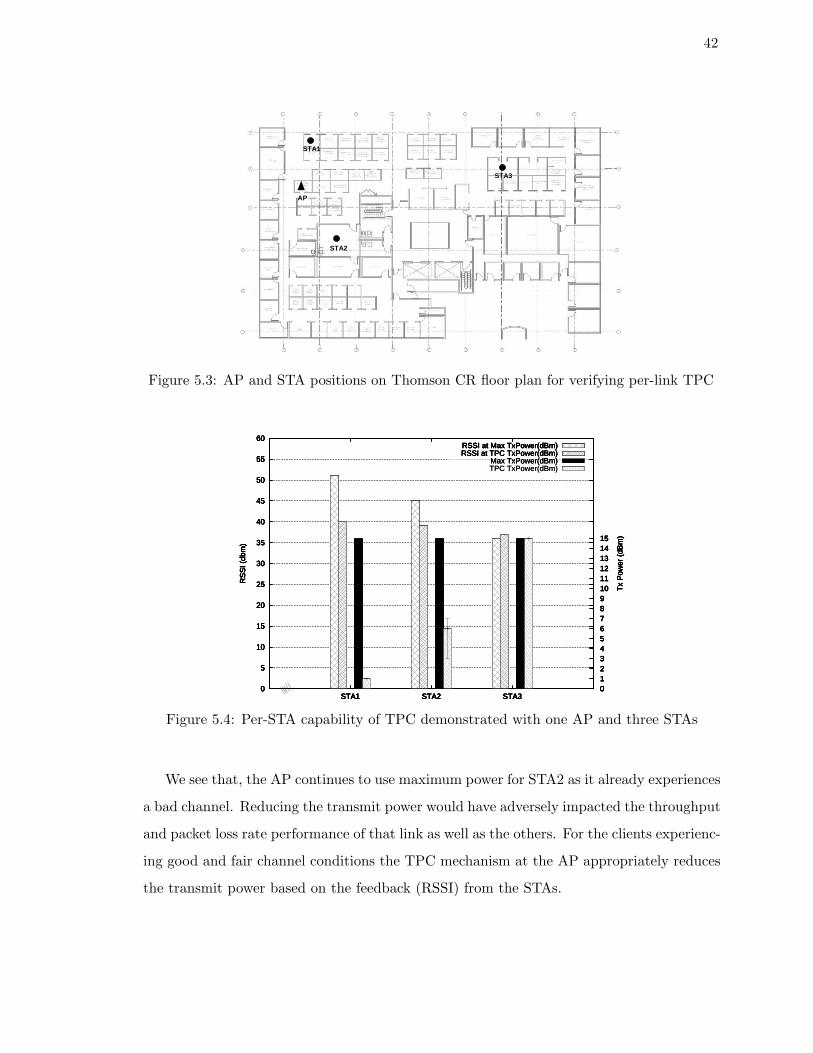
42
STA3
AP
STA1
STA2
Figure 5.3: AP and STA positions on Thomson CR floor plan for verifying per-link TPC
0
5
10
15
20
25
30
35
40
45
50
55
60
STA1 STA2 STA3 0 1 2 3 4 5 6 7 8 9 10 11 12 13 14 15
RS
SI (
dbm
)
Tx
Pow
er (
dBm
)
RSSI at Max TxPower(dBm)
0
5
10
15
20
25
30
35
40
45
50
55
60
STA1 STA2 STA3 0 1 2 3 4 5 6 7 8 9 10 11 12 13 14 15
RS
SI (
dbm
)
Tx
Pow
er (
dBm
)
RSSI at Max TxPower(dBm)RSSI at TPC TxPower(dBm)
0
5
10
15
20
25
30
35
40
45
50
55
60
STA1 STA2 STA3 0 1 2 3 4 5 6 7 8 9 10 11 12 13 14 15
RS
SI (
dbm
)
Tx
Pow
er (
dBm
)
RSSI at Max TxPower(dBm)RSSI at TPC TxPower(dBm)
Max TxPower(dBm)
0
5
10
15
20
25
30
35
40
45
50
55
60
STA1 STA2 STA3 0 1 2 3 4 5 6 7 8 9 10 11 12 13 14 15
RS
SI (
dbm
)
Tx
Pow
er (
dBm
)
RSSI at Max TxPower(dBm)RSSI at TPC TxPower(dBm)
Max TxPower(dBm)TPC TxPower(dBm)
0
5
10
15
20
25
30
35
40
45
50
55
60
STA1 STA2 STA3 0 1 2 3 4 5 6 7 8 9 10 11 12 13 14 15
RS
SI (
dbm
)
Tx
Pow
er (
dBm
)
RSSI at Max TxPower(dBm)RSSI at TPC TxPower(dBm)
Max TxPower(dBm)TPC TxPower(dBm)
Figure 5.4: Per-STA capability of TPC demonstrated with one AP and three STAs
We see that, the AP continues to use maximum power for STA2 as it already experiences
a bad channel. Reducing the transmit power would have adversely impacted the throughput
and packet loss rate performance of that link as well as the others. For the clients experienc-
ing good and fair channel conditions the TPC mechanism at the AP appropriately reduces
the transmit power based on the feedback (RSSI) from the STAs.

43
STA2
AP1 STA1
STA3
AP3
AP2
L1
L3
L2
Figure 5.5: AP and STA positions on Thomson CR floor plan for verifying increased spatialreuse using TPC
5.3 Increase in Spatial Reuse
This experiment demonstrates increased spatial reuse by showing that the TPC lowers
transmit power for closer STAs and hence mitigates co-channel interference with neighboring
APs. The result is a significant increase in total network throughput. Links L1, L2 and
L3 are depicted in the Fig.5.5. First we study the interaction between L1 and L3 with and
without TPC and then we do the same with links L2 and L3 i.e., a pair of links is involved
in an experiment at any given time. Channel 40 is used for experimentation. Maximum
possible load is pumped over each link simultaneously. The performance at maximum power
is used as the baseline to assess the performance with TPC mechanism. The TPC transmit
powers used over each link, the UDP throughput over each link and the aggregated network
throughput were measured.
The aggregate UDP throughput for the two link pairs L1L3 and L2L3 at maximum
transmit power and TPC transmit power are shown in Fig.5.6. It clearly illustrates the
spatial reuse achieved by interference mitigation when using the TPC mechanism. Both
link pairs show a ∼60% increase in aggregated throughput when operating at the power
determined with TPC mechanism that is calculated by the APs based on link quality reports
from the corresponding STAs. Due to the limitation of 100 Mbps Ethernet interface on the
802.11n board the actual throughput gain achieved due to transmit power reduction could
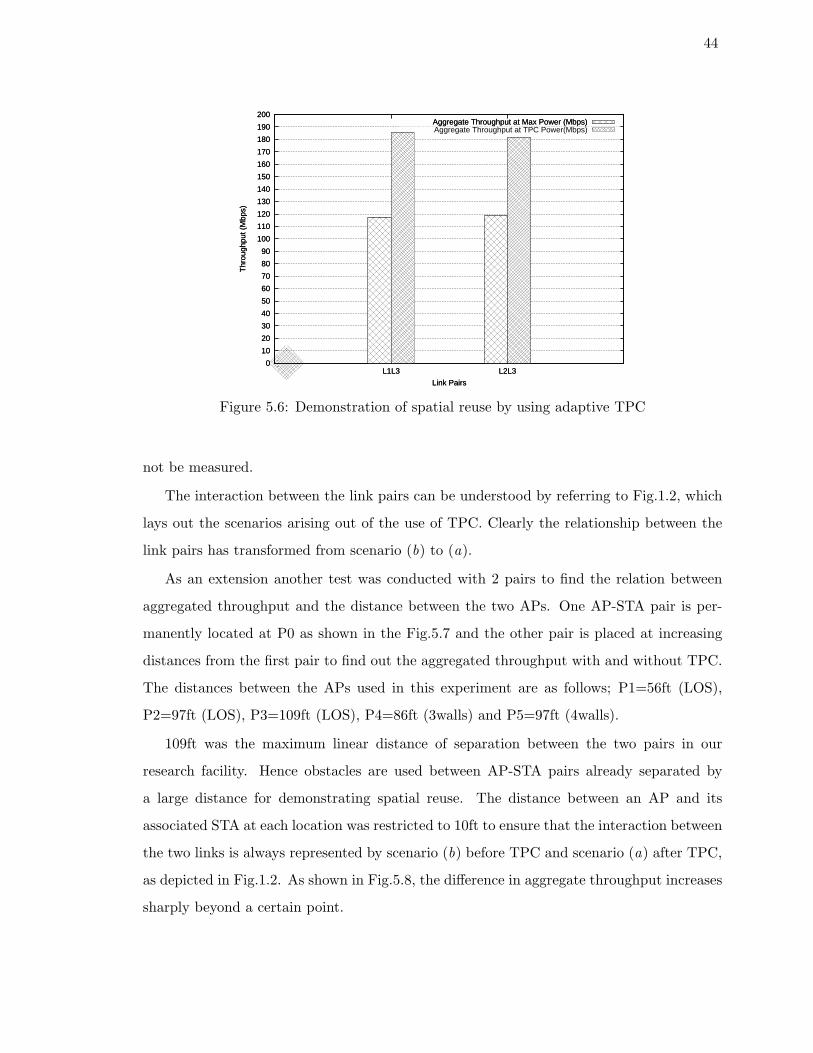
44
0
10
20
30
40
50
60
70
80
90
100
110
120
130
140
150
160
170
180
190
200
L1L3 L2L3
Thr
ough
put (
Mbp
s)
Link Pairs
Aggregate Throughput at Max Power (Mbps)
0
10
20
30
40
50
60
70
80
90
100
110
120
130
140
150
160
170
180
190
200
L1L3 L2L3
Thr
ough
put (
Mbp
s)
Link Pairs
Aggregate Throughput at Max Power (Mbps)Aggregate Throughput at TPC Power(Mbps)
Figure 5.6: Demonstration of spatial reuse by using adaptive TPC
not be measured.
The interaction between the link pairs can be understood by referring to Fig.1.2, which
lays out the scenarios arising out of the use of TPC. Clearly the relationship between the
link pairs has transformed from scenario (b) to (a).
As an extension another test was conducted with 2 pairs to find the relation between
aggregated throughput and the distance between the two APs. One AP-STA pair is per-
manently located at P0 as shown in the Fig.5.7 and the other pair is placed at increasing
distances from the first pair to find out the aggregated throughput with and without TPC.
The distances between the APs used in this experiment are as follows; P1=56ft (LOS),
P2=97ft (LOS), P3=109ft (LOS), P4=86ft (3walls) and P5=97ft (4walls).
109ft was the maximum linear distance of separation between the two pairs in our
research facility. Hence obstacles are used between AP-STA pairs already separated by
a large distance for demonstrating spatial reuse. The distance between an AP and its
associated STA at each location was restricted to 10ft to ensure that the interaction between
the two links is always represented by scenario (b) before TPC and scenario (a) after TPC,
as depicted in Fig.1.2. As shown in Fig.5.8, the difference in aggregate throughput increases
sharply beyond a certain point.
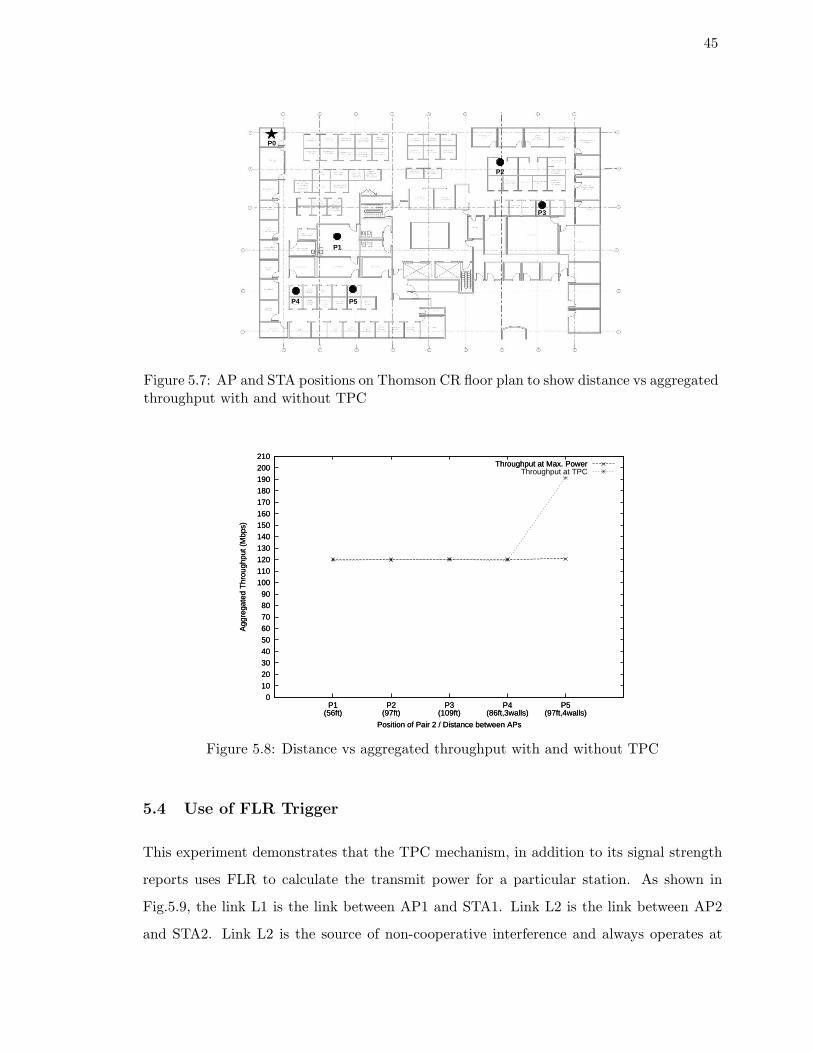
45
P0
P5P4
P3
P2
P1
Figure 5.7: AP and STA positions on Thomson CR floor plan to show distance vs aggregatedthroughput with and without TPC
0
10
20
30
40
50
60
70
80
90
100
110
120
130
140
150
160
170
180
190
200
210
P1(56ft)
P2(97ft)
P3(109ft)
P4(86ft,3walls)
P5(97ft,4walls)
Agg
rega
ted
Thr
ough
put (
Mbp
s)
Position of Pair 2 / Distance between APs
Throughput at Max. Power
0
10
20
30
40
50
60
70
80
90
100
110
120
130
140
150
160
170
180
190
200
210
P1(56ft)
P2(97ft)
P3(109ft)
P4(86ft,3walls)
P5(97ft,4walls)
Agg
rega
ted
Thr
ough
put (
Mbp
s)
Position of Pair 2 / Distance between APs
Throughput at Max. PowerThroughput at TPC
Figure 5.8: Distance vs aggregated throughput with and without TPC
5.4 Use of FLR Trigger
This experiment demonstrates that the TPC mechanism, in addition to its signal strength
reports uses FLR to calculate the transmit power for a particular station. As shown in
Fig.5.9, the link L1 is the link between AP1 and STA1. Link L2 is the link between AP2
and STA2. Link L2 is the source of non-cooperative interference and always operates at
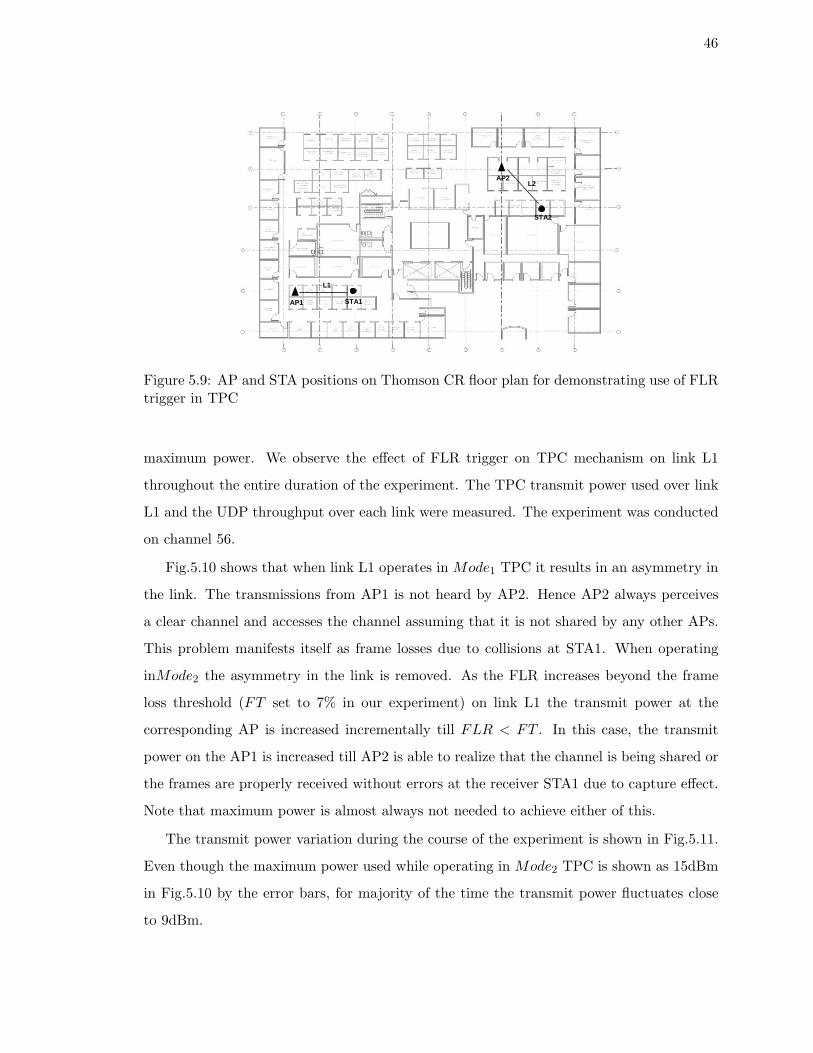
46
STA2
STA1AP1
AP2
L1
L2
Figure 5.9: AP and STA positions on Thomson CR floor plan for demonstrating use of FLRtrigger in TPC
maximum power. We observe the effect of FLR trigger on TPC mechanism on link L1
throughout the entire duration of the experiment. The TPC transmit power used over link
L1 and the UDP throughput over each link were measured. The experiment was conducted
on channel 56.
Fig.5.10 shows that when link L1 operates in Mode1 TPC it results in an asymmetry in
the link. The transmissions from AP1 is not heard by AP2. Hence AP2 always perceives
a clear channel and accesses the channel assuming that it is not shared by any other APs.
This problem manifests itself as frame losses due to collisions at STA1. When operating
inMode2 the asymmetry in the link is removed. As the FLR increases beyond the frame
loss threshold (FT set to 7% in our experiment) on link L1 the transmit power at the
corresponding AP is increased incrementally till FLR < FT . In this case, the transmit
power on the AP1 is increased till AP2 is able to realize that the channel is being shared or
the frames are properly received without errors at the receiver STA1 due to capture effect.
Note that maximum power is almost always not needed to achieve either of this.
The transmit power variation during the course of the experiment is shown in Fig.5.11.
Even though the maximum power used while operating in Mode2 TPC is shown as 15dBm
in Fig.5.10 by the error bars, for majority of the time the transmit power fluctuates close
to 9dBm.
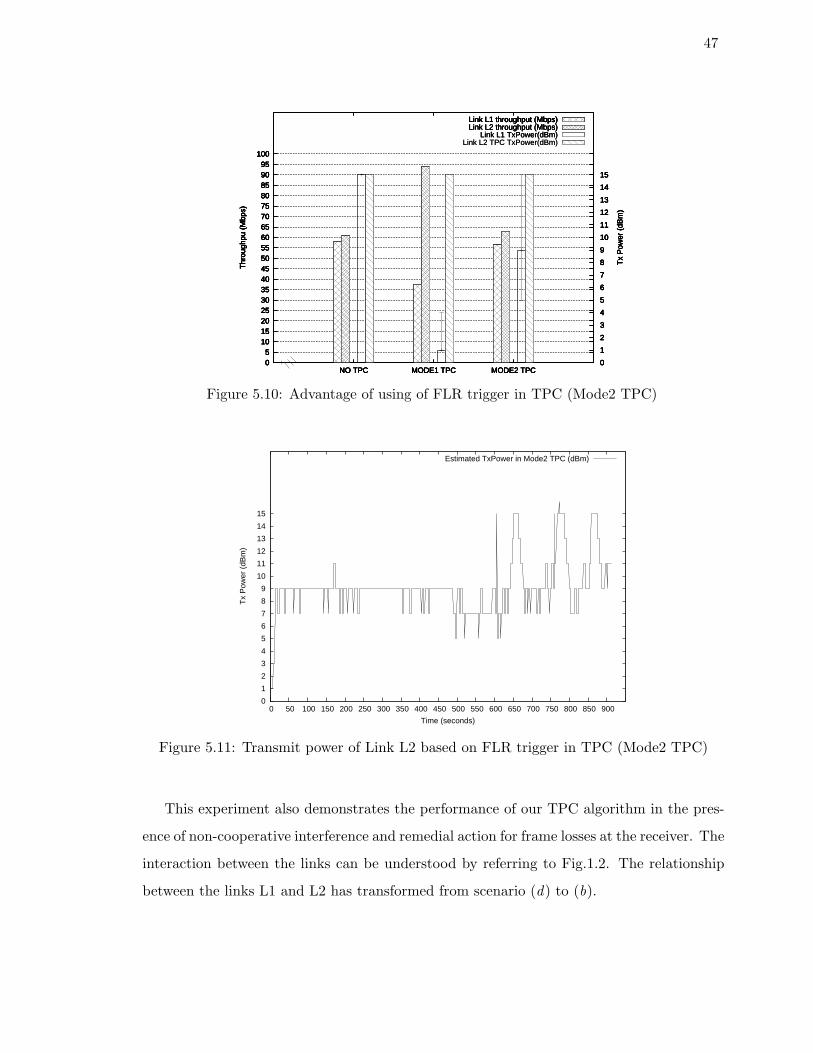
47
0 5
10 15 20 25 30 35 40 45 50 55 60 65 70 75 80 85 90 95
100
NO TPC MODE1 TPC MODE2 TPC 0
1
2
3
4
5
6
7
8
9
10
11
12
13
14
15
Thr
ough
pu (
Mbp
s)
Tx
Pow
er (
dBm
)
Link L1 throughput (Mbps)
0 5
10 15 20 25 30 35 40 45 50 55 60 65 70 75 80 85 90 95
100
NO TPC MODE1 TPC MODE2 TPC 0
1
2
3
4
5
6
7
8
9
10
11
12
13
14
15
Thr
ough
pu (
Mbp
s)
Tx
Pow
er (
dBm
)
Link L1 throughput (Mbps)Link L2 throughput (Mbps)
0 5
10 15 20 25 30 35 40 45 50 55 60 65 70 75 80 85 90 95
100
NO TPC MODE1 TPC MODE2 TPC 0
1
2
3
4
5
6
7
8
9
10
11
12
13
14
15
Thr
ough
pu (
Mbp
s)
Tx
Pow
er (
dBm
)
Link L1 throughput (Mbps)Link L2 throughput (Mbps)
Link L1 TxPower(dBm)
0 5
10 15 20 25 30 35 40 45 50 55 60 65 70 75 80 85 90 95
100
NO TPC MODE1 TPC MODE2 TPC 0
1
2
3
4
5
6
7
8
9
10
11
12
13
14
15
Thr
ough
pu (
Mbp
s)
Tx
Pow
er (
dBm
)
Link L1 throughput (Mbps)Link L2 throughput (Mbps)
Link L1 TxPower(dBm)Link L2 TPC TxPower(dBm)
0 5
10 15 20 25 30 35 40 45 50 55 60 65 70 75 80 85 90 95
100
NO TPC MODE1 TPC MODE2 TPC 0
1
2
3
4
5
6
7
8
9
10
11
12
13
14
15
Thr
ough
pu (
Mbp
s)
Tx
Pow
er (
dBm
)
Link L1 throughput (Mbps)Link L2 throughput (Mbps)
Link L1 TxPower(dBm)Link L2 TPC TxPower(dBm)
Figure 5.10: Advantage of using of FLR trigger in TPC (Mode2 TPC)
0
1
2
3
4
5
6
7
8
9
10
11
12
13
14
15
0 50 100 150 200 250 300 350 400 450 500 550 600 650 700 750 800 850 900
Tx
Pow
er (
dBm
)
Time (seconds)
Estimated TxPower in Mode2 TPC (dBm)
Figure 5.11: Transmit power of Link L2 based on FLR trigger in TPC (Mode2 TPC)
This experiment also demonstrates the performance of our TPC algorithm in the pres-
ence of non-cooperative interference and remedial action for frame losses at the receiver. The
interaction between the links can be understood by referring to Fig.1.2. The relationship
between the links L1 and L2 has transformed from scenario (d) to (b).
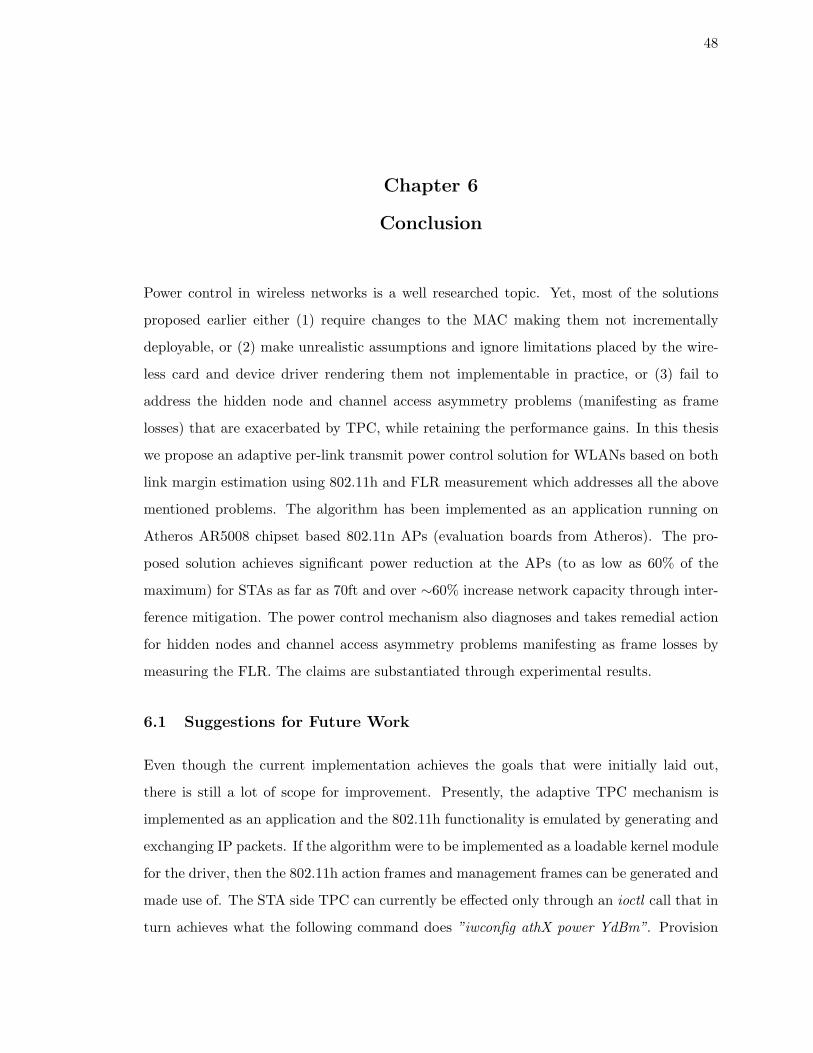
48
Chapter 6
Conclusion
Power control in wireless networks is a well researched topic. Yet, most of the solutions
proposed earlier either (1) require changes to the MAC making them not incrementally
deployable, or (2) make unrealistic assumptions and ignore limitations placed by the wire-
less card and device driver rendering them not implementable in practice, or (3) fail to
address the hidden node and channel access asymmetry problems (manifesting as frame
losses) that are exacerbated by TPC, while retaining the performance gains. In this thesis
we propose an adaptive per-link transmit power control solution for WLANs based on both
link margin estimation using 802.11h and FLR measurement which addresses all the above
mentioned problems. The algorithm has been implemented as an application running on
Atheros AR5008 chipset based 802.11n APs (evaluation boards from Atheros). The pro-
posed solution achieves significant power reduction at the APs (to as low as 60% of the
maximum) for STAs as far as 70ft and over ∼60% increase network capacity through inter-
ference mitigation. The power control mechanism also diagnoses and takes remedial action
for hidden nodes and channel access asymmetry problems manifesting as frame losses by
measuring the FLR. The claims are substantiated through experimental results.
6.1 Suggestions for Future Work
Even though the current implementation achieves the goals that were initially laid out,
there is still a lot of scope for improvement. Presently, the adaptive TPC mechanism is
implemented as an application and the 802.11h functionality is emulated by generating and
exchanging IP packets. If the algorithm were to be implemented as a loadable kernel module
for the driver, then the 802.11h action frames and management frames can be generated and
made use of. The STA side TPC can currently be effected only through an ioctl call that in
turn achieves what the following command does ”iwconfig athX power YdBm”. Provision
49
for per-packet power control on the STA is required to successfully implement the solution
on the STA.
The AP maintains and makes available certain statistics (frames sent, frames lost, frames
retried, etc.) for all the down link transmissions. This results in making power adjustments
at the AP for all data transmission when frame losses occur due to receiver side interference
at one of the STAs. Per-link statistics at the AP would help in tracking down the troubled
node and power adjustments can be made for transmissions to that STA alone.
The exposed node problem as depicted in Fig.1.2(c) cannot be solved by our TPC
solution. Such a scenario can lead to asymmetric channel access problem that does not
manifest as frame losses since the receiver Rx1 is out of the communication range of Tx1.
Even though Expected Transmission Time (ETT) of frames is a good metric to diagnose the
problem, its calculation is non-trivial with frame aggregation, queuing and variable frame
sizes. An efficient mechanism to accurately estimate ETT is worth exploring.
Currently the algorithm uses the maximum PHY rate as the target rate for power
adjustment with the aim of minimizing frame airtime and hence the duration of interference.
Another approach is to have an efficient link adaptation strategy can accurately estimate
the target rate and provide it as an input to our power control mechanism. Comparison
between such a strategy and ours could provide valuable insights.
Large scale experiments to assess performance in dense deployments could not be carried
out due to unavailability of a large number of evaluation boards and a proper field test
setting. Even though provisions to adapt to mobility are in place they could not be evaluated
since the evaluation boards were not battery run.
50
References
[1] http://www.networkworld.com/news/2009/022609-wlan-11n-affordable.html?page=1.
[2] http://www.directv.com/images/assets/mdu/DIRECTV_MFH3.pdf.
[3] http://www.atheros.com/pt/AR50082NX.htm.
[4] http://www.arubanetworks.com/pdf/solutions/TB_ARM.pdf.
[5] IEEE 802.11h, Part 11:Wireless LAN Medium Access Control (MAC) and Physicallayer (PHY) specifications, Amendment 5:Spectrum and Transmit Power ManagementExtensions in the 5GHz band in Europe, December 2003.
[6] IEEE 802.11k, Part 11:Wireless LAN Medium Access Control (MAC) and Physicallayer (PHY) specifications, Amendment 1:Radio Resource Measurement of WirelessLANs, June 2008.
[7] IEEE 802.11n/D4.00, Part 11:Wireless LAN Medium Access Control (MAC) and Phys-ical layer (PHY) specifications, Amendment 4:Enhancements for Higher Throughput,March 2008.
[8] Aditya Akella, Glenn Judd, Srinivasan Seshan, and Peter Steenkiste. Self-managementin chaotic wireless deployments. In Proc. of the 11th Annual International Confer-ence on Mobile Computing and Networking (MobiCom), Cologne, Germany, August-September 2005.
[9] Antonio Grilo and Mario Nunes. Link-adaptation and transmit power control forunicast and multicast in IEEE 802.11a/h/e WLANs. In Proc. of the 28th AnnualIEEE International Conference on Local Computer Networks (LCN), Bonn, Germany,October 2003.
[10] Eun-Sun Jung and Nitin H. Vaidya. A power control MAC protocol for ad hoc net-works. In Proc. of the 8th Annual International Conference on Mobile Computing andNetworking (MobiCom), Atlanta, Georgia, USA, September 2002.
[11] V.P. Mhatre, K. Papagiannaki, and F. Baccelli. Interference mitigation through powercontrol in high density 802.11 WLANs. Anchorage, AK, USA, May 2007.
[12] J.P. Monks, V. Bharghavan, and Wen-mei W. Hwu. A power controlled multiple accessprotocol for wireless packet networks. Anchorage, AK, USA, April 2001.
[13] Alaa Muqattash and Marwan Krunz. A single-channel solution for transmission powercontrol in wireless ad hoc networks. In Proc. of the 5th ACM International Sympo-sium on Mobile Ad hoc Networking and Computing (MobiHoc), Roppongi Hills, Tokyo,Japan, May 2004.
51
[14] Daji Qiao, Sunghyun Choi, Amit Jain, and Shin K.G. Adaptive transmit power controlin 802.11a Wireless LANs. In Vehicular Technology Conference, 2003. VTC 2003-Spring. The 57th IEEE Semiannual, April 2003.
[15] Daji Qiao, Sunghyun Choi, Amit Jain, and Kang G. Shin. MiSer: An optimal low-energy transmission strategy for IEEE 802.11a/h. In Proc. of the 9th Annual Interna-tional Conference on Mobile Computing and Networking (MobiCom), San Diego, CA,USA, September 2003.
[16] Kishore Ramachandran, Ravi Kokku, Honghai Zhang, and Marco Gruteser. Sym-phony: Synchronous two-phase rate and power control in 802.11 WLANs. In Proc. ofthe 6th International Conference on Mobile Systems, Applications, and Services (Mo-biSys), Breckenridge, CO, USA, June 2008.
[17] Anmol Sheth and Richard Han. A mobility-aware adaptive power control algorithmfor wireless LANs. In IEEE CAS Low Power Workshop, August 2002.
[18] Anmol Sheth and Richard Han. An implementation of Transmit Power Control in802.11b wireless networks. Technical Report. Technical report, Department of Com-puter Science, University of Colorado, USA, 2002.
[19] Anmol Sheth and Richard Han. Adaptive Power Control and Selective Radio Acti-vation for Low-Power Infrastructure-Mode 802.11 LANs. In Proc. of the 23rd Inter-national Conference on Distributed Computing Systems (ICDCSW), Providence, RI,USA, May 2003.
[20] Anmol Sheth and Richard Han. SHUSH: Reactive transmit power control for wirelessMAC protocols. In Proc. of the First International Conference on Wireless Internet(WICON), Budapest, Hungary, July 2005.
[21] Vivek Shrivastava, Dheeraj Agrawal, Arunesh Mishra, Suman Banerjee, and TamerNadeem. Understanding the limitations of transmit power control for indoor WLANs.In Proc. of the 7th ACM SIGCOMM Conference on Internet Measurement (IMC), SanDiego, California, USA, October 2007.