Embed Size (px)
Citation preview

Marek ReiChurchill College
CSTIT 2009
Computer Laboratory
MPhil in Computer Speech, Text andInternet Technology: Dissertation
Adaptive Interactive Information Extraction
Author: Marek ReiSupervisor: Prof Ted Briscoe
2009


Declaration of Originality
I, Marek Rei of Churchill College , being a candidate for M.Phil in Computer Speech, Text and Internet Technology, hereby declare that this dissertation and the work described in it are my own work, unaided except as may be specified below, and that the dissertation does not contain material that has already been used to any substantial extent for a comparable purpose.
Signed:
Date:
The word count for this dissertation: 14261
Acknowledgements
I would first of all like to thank Prof Ted Briscoe for suggesting the project idea and providing me with excellent supervision and constant support.
Rebecca Watson for providing the initial baseline system and being very helpful with all my questions.
Advaith Siddharthan for giving valuable feedback and ideas for the project.
Andreas Vlachos and Nikiforos Karamanis for constructing the synonym sets used in the experiments.
Lise Gough for organising a wonderful MPhil course.
The Computer Laboratory and the Cambridge European Trust for giving me necessary and much appreciated financial support.
3

Abstract
Traditional Information Extraction systems use prespecified questions
and manually constructed templates, encoding the mapping from text to
the template. In this thesis we describe an IE system that uses an
adaptive approach, enabling new queries to be run without special
configuration. The system is meant to be used by domain specialists
who can indirectly specify the query. Several approaches are proposed
and tested to improve the quality of the results. Synonym expansion is
introduced to increase recall; grammatical patterns are used to highly
rank sentences that contain certain structures; the distance through
grammatical relations is measured to enable automatic scoring. Finally, a
system combining all of the approaches is put together and the results
presented.
4
ContentsChapter One: Introduction.....................................................................................................6
1.1 Background..................................................................................................................61.2 Aim...............................................................................................................................7
Chapter Two: Environment....................................................................................................82.1 Lucene.........................................................................................................................82.2 Indexed papers...........................................................................................................92.3 The interface.............................................................................................................122.3 Synonym sets............................................................................................................13
Chapter 3: The Query System............................................................................................153.1 Baseline.....................................................................................................................153.2 Synonym expansion..................................................................................................173.3 Pattern scoring..........................................................................................................213.4 Distance scoring.......................................................................................................26
Chapter 4: Evaluation Methods..........................................................................................294.1 Basic measures.........................................................................................................294.2 PrecisionRecall curve..............................................................................................304.3 MAP (Mean average precision)...............................................................................304.4 Precision, recall and Fmeasure curves..................................................................314.5 Lexical variance........................................................................................................314.6 Number of new results.............................................................................................324.7 Spearman's rank correlation....................................................................................33
Chapter 5: Experiments......................................................................................................345.1 Gold standard............................................................................................................345.2 Results.......................................................................................................................37
5.2.1 Baseline.............................................................................................................375.2.2 Synonym expansion..........................................................................................405.2.3 Pattern scoring..................................................................................................435.2.4 Distance scoring................................................................................................46
Chapter 6: Conclusion and Future Work............................................................................52References...........................................................................................................................53Appendix A: ExpressGene patterns..................................................................................55Appendix B: GeneCGID patterns......................................................................................56
5

Chapter One: Introduction
1.1 BackgroundIn this age of computer science and digital technology, text is the primary medium of representing and transmitting information. There are already vast quantities of diverse information available digitally and this amount is growing exponentially. IBM researchers claim that by 2010 the amount of data in the world may double every 11 hours (Coles et al., 2006). Aside from all the documents, homepages, forums, blogs and emails, even books and research papers that were previously only available on paper are now being systematically digitalised. This leaves us with the problem of navigating in the abundance of data and finding relevant information fast and efficiently.
Traditional Information Extraction (IE) requires prespecified questions and manually constructed templates which represent the structure of the targeted information and encode the mapping from the text to the template. For instance, in genomics a template might be 'express(gene, protein)' and the task would be to find all instances of this template licensed by text in genomics papers, e.g. 'express(FasII, interleukin)' would be licensed by sentences like 'the gene FasII was found by Winterbottom et al (2003) to express interleukin'. The disadvantage of this approach is that it requires significant manual work by IE and domain experts to build each new system. (Briscoe, 2009)
Several researchers have investigated the IE problem in the biomedical domain. Most work has been done to group genes and proteins by functional relationships – it is believed that this can help in gene expression analysis and database annotation, both very important in the genomic research (Raychaudhuri et al., 2002). Recent biomedical IE systems generally include a step where natural language processing is used to reduce text into a standard structure. These include systems using shallow parsing (Leroy & Chen, 2002), full parsing (Yakushiji et al., 2001) and pattern matching (Bunescu et al., 2005).
The rules needed to extract relevant information can be either handwritten or generated using machinelearning (ML) techniques. Daraselia et al. used full parsing based on contextfree grammar and handwritten rules to extract mammalian protein functional links with the precision of 91% and estimated recall at 3050%. Their extraction rules require much manual modification to apply to different kinds of information. Brunescu et al. used machine learning techniques to construct extraction patterns based on text fragments between participating entities. They reached 48% precision at 45% recall when extracting proteinprotein interactions.
6

From the current work it is clear that some types of information are easier to extract than others and most of them present an unsolved problem. But IE in the biomedical domain has numerous potential benefits and ongoing work is trying to find new and innovative ways of making IE systems beneficial to biomedical researchers.
1.2 AimThe aim of this project is to help develop a more flexible IE system. Instead of having specialists construct the extraction patterns manually or generating specific ones from large training sets, we focus on giving the user greater control over what kind of information can be extracted.
The idea is that a user can specify the types of relationships they are interested in using the interface. The selections are then expanded to better represent the information need. An IE pattern is constructed based on this knowledge and a search is run on the database of papers. Finally, the user is presented with a set of sentences that match the required pattern or patterns and they can access the text passages around that area. This kind of interactive system would be beneficial to researchers who are seeking relevant papers for further reading or information relevant to specific hypotheses. Any user can introduce a new unseen information need since it doesn't require any special annotation or machine training. Basic design goals for the system are:
● Scalability. The system should be able to scale up and accommodate significantly larger amounts of papers for future research.
● Precision and recall. This is a system meant to be used by researchers in the biomedical domain, trying to find all the relevant information available. In contrast to running a common search, where a user is satisfied if they find an answer within the top ranking results, researchers using IE would generally be interested in all the matches. Therefore we prioritise recall over precision, although a certain level of precision must be maintained in order to guarantee user satisfaction.
● Speed. Since the system will be running complex searches over a large database, some execution time will be needed. However, as long as the system is usable as an interactive application, the time needed will still be far less than what it would be using traditional methods. At least for the first versions of the system time will not be a factor.
● User interface. The methods of communicating to the system need to be fairly simple and not require any knowledge of IE patterns, semantics or computer programming. It is meant for use by domain experts, not computer scientists, and they should be able to specify the search patterns indirectly.
7

Chapter Two: Environment
2.1 LuceneLucene (Goetz, 2000) is an open source indexing and information retrieval library, originally created in Java by Doug Cutting. At the core of Lucene's logical architecture is the idea of a document containing fields of text. This flexibility allows Lucene's API to be independent of the file format. Text from PDFs, HTML, Microsoft Word, and OpenDocument documents, as well as many others can all be indexed so long as their textual information can be extracted. Lucene has been shown to scale up efficiently and handle large amounts of queries (Gospodnetic & Hatcher, 2005).
In order to use Lucene for searching, the data needs to be indexed – processed into a highly efficient crossreference lookup in order to facilitate rapid searching processes. Analysis is performed when indexing, splitting the text up into tokens, removing whitespaces, converting words to lowercase and performing stemming.
For example, the following sentence
It's also relatively well established that Rel proteins are expressed in the CNS of mammals.
will be indexed as
[it] [is] [also] [rel] [well] [establish] [that] [Rel] [protein] [ar] [express] [in] [the] [cn] [of] [mammal] [.]
When searching, the index is used to find documents that match a criteria. The same kind of analysis has to be performed on the search keywords as was used when doing the original indexing. As the randomly chosen example above showed, stemming isn't perfect and can sometimes return unexpected results. Using the same analyser will make sure that the same words get reduced to the same stems and different morphological forms of the same word get a match when searching.
To perform a search, we have to formulate a query in terms of values in specific fields. The following query means that we are looking for documents that contain both adapt and interact in their llem fields.
+llem:adapt +llem:interact
Lucene also returns a score for each document, based on how well it matches the
8

query. We can control how that score is calculated and therefore also manipulate the ranking process. The following query gives 4 times more weight to the lemma interact being present in the llem field:
+llem:adapt +(llem:interact)^4
To speed up complex queries, filters are used. A simple filter query is constructed and it is run on the entire set of documents, getting a yes/no match. Next, the complex main query is run only on the documents that matched the filter, giving the final score for each result. This is designed to speed up the process since the scoring is only performed on a subset of the whole database. For example, for a main query that tries to find Rel translocation cases, where Rel is a gene
+gn:Rel +grb:transloc-rel
we would first use a filter query that checks if the lemmas rel and transloc are present.
+llem:rel +llem:transloc
2.2 Indexed papersThe index used in this project was generated over 5000 biomedical papers from the FlyBase (Tweedie et al., 2009) collection. The original papers were first either scanned or converted to XML. Because papers were scanned and OCR (Optical Character Recognition) was used without manual checking, some of them still contain errors like false character recognition, Greek characters instead of Latin ones, hyphenation splitting the word etc. This will impact the precision of the final system but is a faster and more laboreffective way of inputting papers to the system compared to manual work.
Next, the RASP (Robust Accurate Statistical Parsing (Briscoe et al., 2006)) toolkit was used to do sentence boundary detection, tokenisation, PoS tagging, morphological analysis and to find grammatical relations (GR) within the text (Briscoe et al., 2008).
Figure 1: RASP Pipeline
9
Full parse
Raw text
Parse Ranking ModelParser/GrammarMorph AnalyserPoS TaggerTokeniser

Figure 1 shows the module sequence of the RASP pipeline. The relations from nbest parses are used, where n is currently 5.
Instead of indexing as whole documents, each sentence is added to the index independently. This enables us to search on sentencelevel and retrieve very precise results. The index uses 12 fields to hold information about each sentence.
Field Sample value Explanation
abs Exon 18 of the muscle myosin [...] Article abstract
aid FBrf0106660 Article ID
gn Wg Genes
grb resultin Grammatical relations
grs {gs:{Ln:51,Gn:36,L:[["three", [...] Lemmas and relations
jid Genetics:151.1 Journal ID
llem protein Lemmas
pid FBrf01066601 Paragraph ID
said FBrf0106660 Article ID
sid 5261 Sentence ID
tit The Role of Evolutionarily [...] Article title
yop 1999 Year of publication
Table 1: Fields in the Lucene index
The information about each lemma and relation in a sentence is held in the grs field. For a lemma, an entry has the structure
[luclem, fword, affix, pos, “G”/””, “U”]
Luclem is the stem for the word; fword is the full word in an unaltered form, only if it differs from luclem; affix gives the appropriate affix; pos holds the partofspeech; G marks if the word is a gene name. For example
["we","We","_","PPIS2","","U"]["gener","generated","ed","VVD","","U"]["transgen","transgenic","_","JJ","","U"]["fli","flies","s","NN2","","U"]
The order of lemmas also uniquely determines their ID numbers. These are used to represent grammatical relations between lemmas.
10

The structure for a GR:
[gr-type, gr-head, gr-dep, gr-subtype, gr-init]
For example
[10,7,3,0,-1][19,7,9,3,-1][20,1,7,1,-1]
The last line represents a relation of type 20 where lemma number 1 is the head and lemma number 7 the dependent. The sets of unique grtype and grsubtype values (unique values given a current grammar) seen during indexing are mapped to integer values. The lemma ID in a relation may also be a negative number, in which case it represents a mapping to a nonlemma slot value – it would correspond to a value like that, to, etc.
Luke (Figure 2) is a development and diagnostics tool used to access an existing Lucene index. It enables to execute various manually constructed queries on the database and examine the returned results.
The index size for 5000 indexed papers containing 1417816 sentences is 2.2GB.
11
Figure 2: Luke showing search results

2.3 The interface
FlySearch (Figure 3) is the user interface for running and constructing queries for the sentences in the indexed papers.
As the first step, the user performs a simple keyword search, for example “express Adh”. This would return all sentences that contain the words express and Adh. The green color coding indicates recognised gene names, the blue words show the entered keywords in results.
Next, the user can select specific words in the returned sentences to indirectly specify a relationship. Clicking on a word will select it, indicated by underlining of the word. In the image above, the words “expression of Adh” are selected. Clicking on <MORE> will construct a new query and return sentences where express and Adh are semantically related in the same or similar way as selected. Every sentence is scored, based on how well it matches the query, the score is shown next to each result. Consecutive matches from the same paper are grouped together.
Clicking SHOW INFO displays information about the paper (title, abstract, journal ID); CONTEXT will reveal text preceding and following that specific sentence. This interface is designed for use by domain specialists – someone who knows what kind of information they are looking for but is not experienced in constructing complex queries manually. A researcher might want to find information on certain genes or proteins interacting, in which case they first perform a keyword search, followed by a more specific grsearch.
12
Figure 3: FlySearch user interface

That would return ranked matching sentences and the user can access text paragraphs around them to gather more information.
2.3 Synonym setsFor some of the experiments in this project, synonyms of various words were needed. Common databases like WordNet (AlHalimi, 1998) do not apply very well to biomedical papers, therefore specific synonym sets related to genomic research were used.
The first is a set of gene and protein synonyms put together by Nikiforos Karamanis from the FlyBase database. It contains lists with the following structure:
19 | Adh | FBgn0000055 | ADH1 | Adh | FBgn0000055 | Alcohol dehydrogenase2 | Adh | FBgn0000055 | BG:DS01486.81 | Adh | FBgn0000055 | CG329541 | Adh | FBgn0000055 | CG34811 | Adh | FBgn0000055 | DmADH1 | Adh | FBgn0000055 | Dreg-11 | Adh | FBgn0000055 | Drosophila Rhythmically
expressed gene 11 | Adh | FBgn0000055 | T165 | Adh | FBgn0000055 | adh1 | Adh | FBgn0000055 | alcohol dehydrogenase1 | Adh | FBgn0000055 | dADH
Each line corresponds to one synonym. The number in the first column shows the frequency of that specific name; second column specifies a common name for that gene/protein; third column contains a FlyBase gene identifier; the last column contains a name for that gene.
The second set is a collection of trigger words related to different types of biological events and was created by Andreas Vlachos. A fragment of the collection:
bind Bindinginteract Bindingcrosslink Bindingassociate Bindingligate Bindingrecognize Bindingengage Bindinginduce Positive_regulation
13

activate Positive_regulationincrease Positive_regulation
The first column contains a verb; the second column holds an event identifier, defined by the BioNLP09 (Tsujii, 2009) shared task.
These two synonym sets were used during development and evaluation to enable query expansion. Other similar sets could be used to replace or extend the current collections.
14

Chapter 3: The Query System
3.1 BaselineThe interface sends a query to the search system. The following parameters are passed along:
● The name/location of the Lucene index that will be used for the query.
● The ID of the sentence that contains the selected lemmas and will be used for constructing the query.
● The IDs of lemmas that were selected.
● Hit size, the number of results that should be returned (on one page).
● Page number.
These get to the class RunMphilQuery which runs the query with both the baseline system and an alternative system using some kind of an improvement. The evaluation is also run on both sets and against each other, comparing them and finding the correlation.
To construct a query for retrieving results from the Lucene index, two query strings using the Lucene syntax have to be constructed – query_filter, used for getting the initial subset of the index, and query_gr, that is used for scoring. The system also constructs two additional strings, display_gr and display_text, that are designed to give feedback to the user about the query.
Sample values, when selecting the lemmas Adh and express in a sentence (the query explained in more detail in 4.1):
query_filter: +llem:Adh gn:Adh^2 +llem:expressquery_gr: gn:Adh^2 grb:"express-Adh"^8display_text: Adh GENE:[Adh] expressed display_gr: GR: expressed-->Adh Adh GENE:[Adh]
expressed
To construct the filter query, the baseline system goes through every selected lemma and adds it to the string. This results in a bagofwords search that returns all sentences that contain all the selected lemmas. Having a selected gene also tagged as a gene in the candidate sentence is an option but not a requirement.
The GR query is run only on the sentences that first satisfy the filter query so it does not necessarily contain all the lemmas used in the original query. Instead, it specifies
15

conditions that will assign a higher score to a result. In the example above a sentence is scored high if the selected gene is tagged as a gene. It is scored even higher if it contains the relation that was selected by the user, in this case express-Adh. To construct it, the system goes through every relation in the query sentence, finding ones that have both their head and dependent lemmas selected and adding them to the query string along with selected lemmas that are tagged as genes. If there are no GR relations that have both their lemmas selected, therefore no selected relations, the system falls back and uses the filter query for scoring also.
The filter and gr queries are run using the Lucene API. This enables to also specify a class that goes through all the returned results after scoring and rescores them using its own rules. This is useful since we can examine each specific sentence in various ways and assign a score based on what it contains or how similar it is to the original query.
The baseline system uses MphilGRSMatch class for the rescoring process. It gets the grammatical relations and the original score of a sentence and returns a new score value. The new score is calculated using the following algorithm:
1. Initialise the new score with 10% of the original score.
2. Go through each selected GR in the original query sentence.
3. Go through each GR in the candidate sentence that is being rescored.
4. Calculate head_score, dep_score and type_score for each GR pair.
5. Add (head_score * dep_score * type_score) to the new score.
6. Return the new score.
Head_score is calculated by looking at the head lemmas of both relations. If they match, it is set to 1.0; otherwise 0.0. Dep_score is calculated in the same way by looking at the lemmas of GR dependents, returning either 1.0 or 0.0. Type_score is found by looking at the types of both GRs – if they match, it gets the value 1.0, otherwise 0.5.
The total value added to the new score is the multiplication of these three scores, resulting in three different cases:
● 1.0 if both lemmas and the GR types match exactly.
● 0.5 if both lemmas match but the GR type does not.
● 0.0 if one or both of the lemmas does not match.
By adding together these values for each selected relation, the system calculated the new score for a sentence. This is then used to reorder the result set which is then
16

presented to the user. The baseline system returns sentences that contain exactly what the user selected – containing the same lemmas and raking highly results that have the same type of grammatical relations. This means a system with quite high precision but limited set of results – we would like to find all the sentences that satisfy the information need, not only the ones that are identical to the users query. The following improvements try to increase the recall of the system and introduce variability into the results.
3.2 Synonym expansionWhen searching for sentences that contain information about the expression of Adh, a typical user query passed to the system would be in the form of a relation express-Adh. The three highest ranking results from the baseline system are:
Adh is not expressed in the developing embryo , and we find no difference in the hatching times among our four different transformant types ( Tables 1 and 2 ) .
Specifically , we investigate whether the disruption of a conserved shortrange pairing within Adh exon 2 has an effect on Adh expression or if there is a dual functional role of a conserved sequence in the 3\'UTR in both longrange pairing and the negative regulation of Adh expression .
This is expected , however , because Adh is not expressed in pupae ( C ~S and ~ 1989 ) . Ο ΙΝ ΜΑΝΙΑΤΙ
The first result in the set is the same that was used to construct the query. The second and third are very similar when looking at the lemmas and relations between the gene and the verb. The other 149 results follow roughly the same pattern. Because of this, the returned sentences have a fairly high probability of containing information about Adh expression. The system achieves high precision but, as stated in the project goals, we are more interested in high recall finding all relevant results while still maintaining a userfriendly precision level.
One way of expanding the query and introducing variance is to use synonyms. Very often lemmas can be replaced by others with very similar meaning, resulting in new queries that still represent the same information need.
The verb express in the example query represent the general gene expression action and can therefore be replaced by verbs from the following set:
express, overexpress, produce, detect, transfect, coexpress, synthesize
17

The biomedical literature does not follow a fixed naming schema for genes and the same gene can be referred to in different ways. This leads to an entire new problem of finding all the different names for any gene. This is tackled by researchers working on extracting biomedical synonyms and it has proven to be a challenging problem. However, work is being undertaken to standardise the use of official gene and protein names and symbols, so the problem may lessen in the future (Cohen & Hersh, 2004). For this project we can use a generated list of genes and their synonyms. According to the list, gene Adh can be referred to using any of the following names:
Adh, ADH, Alcohol dehydrogenase, BG:DS01486.8, CG32954, CG3481, DmADH, Dreg-1, Drosophila Rhythmically expressed gene 1, T16, adh, alcohol dehydrogenase, dADH, Dari\Adh1, Adh-1, Dari\Adh2, Adh-2, Dbuz\Adh1, Dbuz\Adh2, Dere\Adh, Dhyd\Adh1, Alcohol dehydrogenase-1, Dhyd\Adh2, Alcohol dehydrogenase-2, Dlac\Adh1, Dmau\Adh, Dmic\Adh, Dmoj\Adh2, Dnep\Adh, Dore\Adh, Dpse\Adh, DpADH, Dsec\Adh, Dsim\Adh, ADH-sim, Dsub\Adh, Dsub\Adh-Psi1, Dtei\Adh, Dvir\Adh1, Dvir\Adh, Dvir\Adh2, Dyak\Adh
Introducing synonyms means large modifications to nearly every part of the original system. The filter and GR query construction, rescoring and evaluation modules all have to understand that synonyms are merely different representations of the same word. For this purpose the MphilQueryExpander class was created so that it can dispense synonyms to other parts of the system as needed. It reads in all the synonyms and keeps them in memory. When another module makes a call, it returns the set of words that mean the same thing and are also of the same type (eg gene or verb).
To construct the filter query, we first loop through all the selected lemmas of the original sentence. Instead of demanding that this one lemma is present, at least one of the synonyms now has to be contained in the candidate sentence. This is made more difficult by the fact that synonyms can be composites of several words and cannot be directly used as a lemma value. To count as a match, all of these words would have to be in a sequence at the same time. The algorithm for constructing the filter query becomes:
1. For every selected lemma in the original sentence.
2. For every synonym of that lemma, one of them has to be present.
3. For every word in a synonym
4. All words have to be present
18

The filter query for the baseline system (seen in 2.1) contained only two lemmas. The same filter query after applying all the synonyms and escaping special characters becomes:
+( (+llem:Adh) (+llem:ADH)(+llem:Alcohol +llem:dehydrogenase) (+llem:BG\:DS01486.8) (+llem:CG32954)(+llem:CG3481) (+llem:DmADH) (+llem:Dreg\-1)(+llem:Drosophila +llem:Rhythmically
+llem:expressed +llem:gene +llem:1) (+llem:T16 ) (+llem:adh) (+llem:alcohol +llem:dehydrogenase) (+llem:dADH) (+llem:Dari\\Adh1) (+llem:Adh\-1) (+llem:Dari\\Adh2) (+llem:Adh\-2 ) (+llem:Dbuz\\Adh1) (+llem:Dbuz\\Adh2) (+llem:Dere\\Adh) (+llem:Dhyd\\Adh1) (+llem:Alcohol +llem:dehydrogenase\-1) (+llem:Dhyd\\Adh2) (+llem:Alcohol +llem:dehydrogenase\-2) (+llem:Dlac\\Adh1) (+llem:Dmau\\Adh) (+llem:Dmic\\Adh) (+llem:Dmoj\\Adh2) (+llem:Dnep\\Adh) (+llem:Dore\\Adh) (+llem:Dpse\\Adh) (+llem:DpADH) (+llem:Dsec\\Adh) (+llem:Dsim\\Adh) (+llem:ADH\-sim) (+llem:Dsub\\Adh) (+llem:Dsub\\Adh\-Psi1) (+llem:Dtei\\Adh) (+llem:Dvir\\Adh1) (+llem:Dvir\\Adh) (+llem:Dvir\\Adh2)(+llem:Dyak\\Adh)
) +( (+llem:express) (+llem:overexpress)
(+llem:produce) (+llem:transfect) (+llem:coexpress) (+llem:synthesize)
)
Depending on the query and the synonyms used, this kind of expansion can make the system return a much larger set of sentences.
The next step is to construct a GR query using the synonyms. This will mainly contain lemma pairs denoting the possible relations using the sample case, these are verbgene (express-Adh) relations. Since both the verb and the gene part of this pair can be expanded using synonyms, the set of new relations will be the Cartesian product of both synonym sets, constructed by associating every element of the first set with every
19

element of the second set. Proportionally higher weights are assigned to lemmas that represent genes and to relations that contain lemmas which were selected in the original sentence. The algorithm for building the GR query becomes:
1. For every selected lemma in the original sentence that was also a gene
2. For every synonym of that gene, assign weight 2
3. For every word of that gene, all have to be present
4. For every selected relation in the original sentence
5. For every synonym of the head lemma
6. For every synonym of the dependent lemma
7. Assign weight 4 if both lemmas were also in the original sentence
8. Assign weight 2 is one lemma was present in the original sentence
9. Otherwise assign weight 1 to the relation
10. For every word in head lemma synonym
11. For every word in dependent lemma synonym
12. All words have to be present
The original GR query can be seen in 2.1. The full expanded query is too long to be printed here but a few fragments from it:
( +gn:Adh )^2 ( +gn:ADH )^2 ( +gn:Alcohol +gn:dehydrogenase )^2 ( +gn:BG\:DS01486.8 )^2 ( +gn:CG32954 )^2 ( +gn:CG3481 )^2[....](+(grb:express-Adh) )^4 (+(grb:express-ADH) )^2 (+(grb:express-Alcohol)
+(grb:express-dehydrogenase) )^2 (+(grb:express-BG\:DS01486.8) )^2 (+(grb:express-CG32954) )^2[...](+(grb:overexpress-ADH) )^1 (+(grb:overexpress-Alcohol)
+(grb:overexpress-dehydrogenase) )^1 (+(grb:overexpress-BG\:DS01486.8) )^1 (+(grb:overexpress-CG32954) )^1
20

[...](+(grb:coexpress-Dari\\Adh2) )^1 (+(grb:coexpress-Adh\-2) )^1 (+(grb:coexpress-Dbuz\\Adh1) )^1 [...]
The rescoring algorithm also needs to adjust to using synonyms. To get a recalculated score for lemmas, we count the number of words in the candidate sentence that match exactly or are synonyms to any of the selected lemmas in the original sentence. The possibility of synonyms containing multiple words also has to be taken into account.
1. For each selected lemma in the original sentence
2. For each synonym of the selected lemma
3. For each word in the synonym
4. For each lemma in the candidate sentence
5. If there is a word sequence matching the synonym
6. Add 1 to the lemma matching score
Furthermore, to score the relations, the system needs to understand that any lemma present in a selected relation from the original sentence could be replaced by synonyms possibly containing multiple words. The algorithm goes through every selected relation, looks at the head lemma and tries to find a matching lemma from the candidate sentence. If successful, it looks for a relation that connects that lemma to another lemma which can be mapped to the dependent of the original selected relation.
3.3 Pattern scoringWhen the set of results has been assembled by the filter query and the GR query, we would like to order them so that the most likely ones end up on top. One way of doing this is to rank them using patterns.
When looking through sentences, there are certain structures that convey the same idea in different ways. These can be either syntactic, a set of grammatical relations or both and we refer to them as patterns. If the system can identify sentences matching these patterns, it can assign them a higher score and therefore boost their ranking, giving the user more precision in the top end. Patterns can be constructed to be very general or very specific, depending on the need.
To construct patterns we first have to understand the various ways of how the data can
21

be represented. We are going to use the example of a development query concerning the expression of Adh and show fragments from sentences that contain the kind of information the system would want to find. Arrows indicate relations between lemmas in the sentence and point from the head lemma to the dependent lemma. There can be several relations between the same two lemmas, in which case they are of a different type.
In Figure 4 Adh and expressed are connected with two relations where expressed is the head and Adh is the dependent. It shows that they are immediately connected even though they are not positioned together in the sequence of words. The two relations are of type passive and ncsubj (indicating that Adh is the nonclausal subject of express). When searching for sentences about Adh expression, this is something that the baseline system finds very well. But we are also interested in sentences that contain significantly more complex relations or word sequences that still mean roughly the same thing. A few more common structures in the data:
22
Figure 4: Example expressAdh relations, type 1
Adh is not expressed in the developing embryo
Figure 5: ExpressAdh relations, type 2
Adh is definitely expressed in
Figure 7: ExpressAdh relations, type 4
The expression of the Drosophilia alcohol dehydrogenase
Figure 6: ExpressAdh relations, type 3
The Adh gene is expressed from

The next step is to find common themes in these sets of relations and construct patterns based on them. One thing that stands out is that there are various ways of referring to the gene Adh, even without synonyms. Type 2 shows that in the case of “Adh is expressed” Adh is directly attached to express as the subject. In type 3 the sentence structure is very similar (passive) but Adh is referred to as “Adh gene”. This results in gene being the subject to express and Adh becomes the modifier for gene. A similar problem comes up with types 4 and 5, where expression-of connects either directly to the gene (type 4) or first to the conjunction and and then to the gene (type 5).
This issue can come up with any other structure and to solve it we split the pattern into two and refer to TARGET as anything that marks the target gene. For example, this can be
1. The gene name itself: Adh
2. Any part of a gene name with multiple lemmas: dehydrogenase
3. Lemma gene that has a gene name as a modifier: gene ---> Adh
4. Lemma protein that has a gene name as a modifier: protein ---> Adh
5. Lemma and that connects to a gene as a conjunction: and ---> Adh
Pattern types 1, 2 and 3 can be combined to construct a pattern for passive sentence structures. The lemma express has to be in a direct relation to the TARGET and the relation type has to be ncsubj (nonclausal subject). For the system the first pattern would look like this:
express -ncsubj-> TARGET (P1)
23
Figure 8: ExpressAdh relations, type 5
Expression of both Adh and Adhr
Figure 9: ExpressAdh relations, type 6
The expression of the Adh gene
Relation types 4, 5 and 6 give the second pattern type:
express -iobj-> of -dobj-> TARGET (P2)
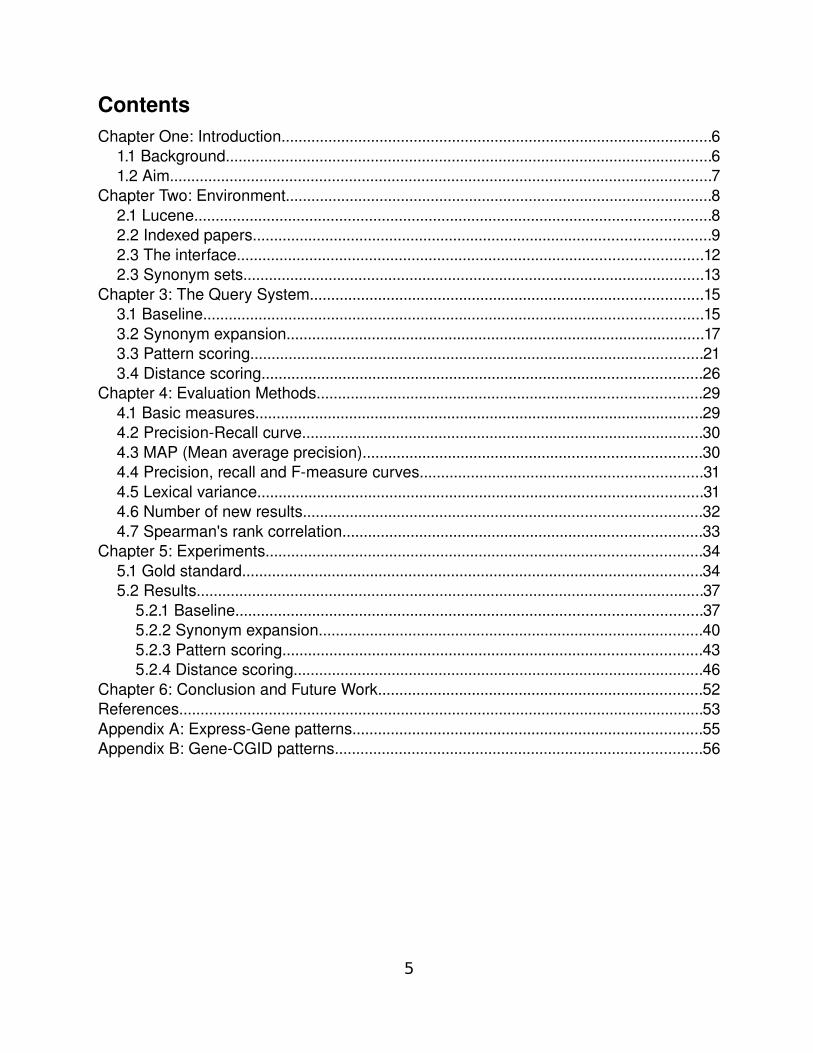
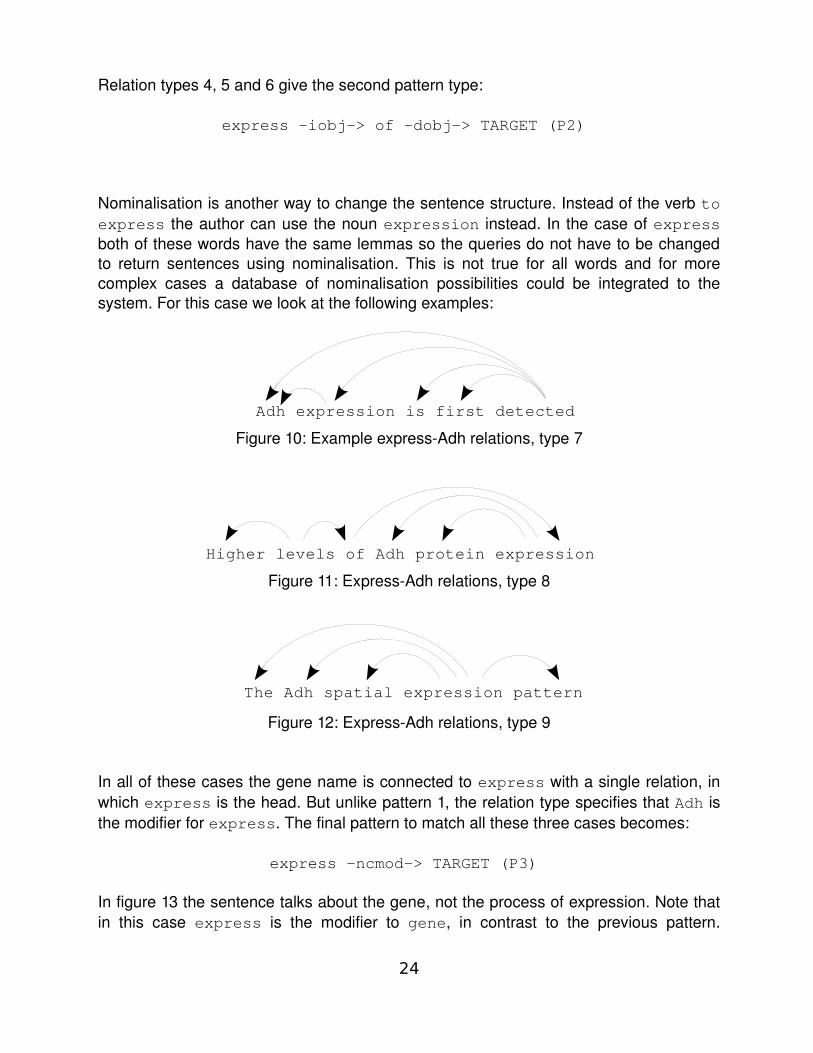
Nominalisation is another way to change the sentence structure. Instead of the verb to express the author can use the noun expression instead. In the case of express both of these words have the same lemmas so the queries do not have to be changed to return sentences using nominalisation. This is not true for all words and for more complex cases a database of nominalisation possibilities could be integrated to the system. For this case we look at the following examples:
In all of these cases the gene name is connected to express with a single relation, in which express is the head. But unlike pattern 1, the relation type specifies that Adh is the modifier for express. The final pattern to match all these three cases becomes:
express -ncmod-> TARGET (P3)
In figure 13 the sentence talks about the gene, not the process of expression. Note that in this case express is the modifier to gene, in contrast to the previous pattern.
24
Figure 10: Example expressAdh relations, type 7
Adh expression is first detected
Figure 11: ExpressAdh relations, type 8
Higher levels of Adh protein expression
Figure 12: ExpressAdh relations, type 9
The Adh spatial expression pattern

Depending on the needs of the user we still might want to include it in the set of results since it references the correct process and contains relevant information. But patterns can also be used to identify sentences with the wrong structure. When the users decide they do not want results that contain the type of information in figure 13, the pattern can be used to lower the score for sentences that match to it.
The resulting pattern would be:
express <-ncmod- TARGET (P4)
The final patterns are used in the rescoring stage. Every sentence gets compared to every pattern and if a match is discovered, the sentence receives a higher score. When using this technique, we also have greater influence over the order of the results. If, for example, we prefer sentences with the passive structure, the system can assign a higher score to the sentences that match that specific pattern, while giving medium scores to other results.
To learn more about what kind of patterns are present in the 1417816 sentences, an independent pattern finder was written for this project. Its purpose was to locate and group patterns in the relation trees between certain endpoints. For the first experiment, the goal was to find all cases where the lemma express is connected to any gene. The pattern finder goes through all the sentences and first marks lemmas that qualify as the first or last point in the path. In this experiment, the starting nodes would be words with express as the lemma and the last nodes would be gene names. Lemmas that mark gene names are already identified in the index and this information was used.
Next, the system starts with every lemma that qualifies as a starting point and tries to find the closest legal endpoint, forming a path through relations. The connection finding function is called for each starting lemma with two possible cases:
1. There is a direct relation between the lemma and a legal endpoint, in which case the function stops and returns a complete path.
2. No relation to a legal endpoint is found, in which case the function is called recursively for every lemma that it does have a direct relation to.
25
Figure 13: ExpressAdh relations, type 10
The highly expressed Adh gene

Since this number of recursive function calls increases exponentially, the limit of 5 relations or 6 lemmas was introduced. This decreased the time needed to run the pattern finder and connections with more than 5 links are unlikely to have relevant meaning for our purposes.
When grouping, the relation types were discarded to give a better overview of the different types on connections. The direction of the headdependent relation is still relevant and indicated by the pointing arrow. Gene names are replaced by generic tokens. The five most common patterns in the corpus:
1: express ---> [::GENE::]2: express ---> of ---> [::GENE::]3: express <--- and ---> [::GENE::]4: express ---> and ---> [::GENE::]5: express ---> [::GENE::] ---> [::GENE::]
Appendix A shows a larger number of top patterns that were collected using this method. Many of these machinecollected patterns can be mapped to our handconstructed versions, especially when using the TARGET functionality (above). For example, when looking at the top 15 collected patterns, ranks 1, 4, 11 and 12 correspond to P1; ranks 2, 6 and 7 correspond to P3; ranks 3 and 13 correspond to P4. Ranks 5 and 8 stand out since they connect gene names to other gene names. It is unknown if both of these lemmas are different parts of the same gene name or they are really different genes in relation with each other, therefore those patterns do not directly map back to our versions.
The results from the pattern finder indicate that our four patterns are a good representation of the available data. Experiments will show how well this technique performs. Even though these patterns were assembled manually, machine learning could be used to cluster together automatically extracted patterns that are found to convey the same or similar meaning, giving a much wider flexibility and better efficiency.
3.4 Distance scoringPutting together a suitable set of patterns demands important resources. If it is done manually, domain experts with sufficient linguistic knowledge need to construct patterns that match all the sensible cases that might come up. Even then the data will most likely contain sentences that are relevant to the query but do not match a single pattern. Using machine learning is a more efficient approach but will probably result in smaller precision and an annotated training set is still needed to develop the system. These problems are enough motivation to try an automated approach that does not involve a learning process.
26

Every sentence contains a set of directed relations, each connecting two lemmas. When moving through these relations, we can construct a path between lemmas that are not immediately connected. The assumption we make for this scoring method is that if two relevant lemmas have a short distance between them, the sentence as a whole is more relevant and should therefore receive a higher score. By looking at the relationships between lemmas instead of the word sequence the system can easily find connections between words from opposite ends of a sentence. This also means we rely more heavily on the parser and if there is a mistake in the set of relations, either a missing or an unwanted connection, the system is likely to make the wrong conclusion.
As an example of distancebased scoring, the following sentence does not match any patterns proposed in 3.3:
First , the types of synonymous changes were deliberately selected to maximize the probability of observing an effect : Adh is one of the most highly expressed genes , and exhibits some of the highest levels of codon bias , in the Drosophila genome .
When looking at a section of this sentence (Figure 14), it is clear that there is a continuous path between the lemmas express and Adh. This connection is too specific to be added as a pattern but the system should still be able to understand that it is a relevant sentence.
The following algorithm is used to score each sentence:
1. For every selected relation in the original sentence
2. Locate lemmas in the candidate sentence that match the head
3. Locate lemmas in the candidate sentence that match the dependent
4. For every lemma that matches the head
5. Score the path between the lemma and the closest lemma that matches the dependent
The path from one lemma to another is found recursively. The scoring function is called with a single starting point and a set of potential endpoints. If there is a direct connection between the starting lemma and any legal endpoint, the function finishes and returns 1
27
Figure 14: Example of a path through the set of relations
Adh is one of the most highly expressed genes

as a score. Otherwise, it calls itself and uses every directly connected lemma as the new starting point. Any jump that doesn't lead directly to the endpoint gets a penalty of multiplying the score with 0.9. Jump limit of 5 was introduced since lemmas that are more that 5 jumps apart are unlikely to be related in a way that is useful for this task.
In schema 11 there are two possible routes between express and Adh:
expressed <--- genes <--- of <--- one <--- is ---> Adh
expressed <--- most <--- of <--- one <--- is ---> Adh
In either case the distance between the lemmas is 5 jumps so the new score would be:
0.9∗0.9∗0.9∗0.9∗1=0.6561
As the example shows, the searching process can move through relations in either directions are doesn't pay attention to what kind of lemmas it passes. This means that when the conditions are right it can easily jump to a “main” lemma in the sentence that has direct connections to many other lemmas. Using this, the algorithm can assign high scores to sentences that do not contain a suitable relation. Another problem comes up with sentences that do not have a complete parse – some sentences in the data have clusters of relations for different parts of the sentence but no relations connecting them all together to a single tree. There is no way to overcome this and the algorithm fails. But in general it is an easily implemented approach that does not require any training data, manual annotation or pattern construction.
28

Chapter 4: Evaluation Methods
Evaluating this kind of information extraction is not straightforward, even with a good test set. Simple measures like precision and recall are important but do not give all the information needed. Aside from the amount of correct results we would also like to know where they are positioned in the ranking, how that set differs from those returned by the other versions of the system etc. Therefore we propose various measures that can be calculated for each of the result sets, giving a thorough overview of the sets properties and differences.
4.1 Basic measuresNumber of retrieved results The total number of results returned by the system. This value can be expected to increase when synonyms are introduced, because the constructed query matches a larger number of sentences.
Relevant items retrieved The number of retrieved results that belong to the gold standard. Increasing this value shows that our system is finding new unseen sentences. The inclusion of synonyms can be expected to help return at least some relevant items that weren't present in the set acquired by the baseline system.
Precision Shows the portion of retrieved items that belong to the gold standard. This value can be expected to decrease since the expanded query is less specific and will return more irrelevant documents.
Precision=Relevant items retrieved Items retrieved
Recall Shows the portion of all relevant items that were actually retrieved by the system. This will usually increase since the use of synonyms will help return results that could not be found with the old query.
Recall=Relevant items retrieved All relevant items
F measure A harmonic mean of precision and recall, providing a single measure that combines them both. The balanced F measure weighs precision and recall equally.
F =1
2 ⋅ Precision ⋅ Recall
2⋅ Precision Recall
F =1=2⋅ Precision ⋅ Recall Precision Recall
29

4.2 PrecisionRecall curvePlotting the precision at different recall values gives the precisionrecall curve. A larger area under the curve means high precision at high recall values and is therefore an indication of a good set of results and a good system configuration.
Precision is calculated at recall points with set intervals. The number of points can be configured but has been set to 101 for these evaluations. This means recall points with values
r0=0.0 , r1=0.05 , r2=0.1 , r3=0.15, r4=0.2, . .. . . r21=1.0
At points where precision can't be directly calculated, interpolation is used.
P ir j={max r jrr j1Pi R=r if P iR=r existsPi r j1 otherwise }
Where r j is the jth recall value and P ir j is the precision at that point.
4.3 MAP (Mean average precision)MAP (Mean average precision) is a single measure that holds important information about the precisionrecall curve and can be represented in a single value, making it more straightforward to compare results. It correlates with the area size under the curve, therefore larger values mean more preferable results.
MAP= 1N∑j=1
N1Q j
∑i=1
Q j
P doci
Where Q j is the number of relevant documents for query j , N is the number of queries and P doc j is the precision at ith relevant document. It essentially gives the average precision over different portions of the result set.
30

4.4 Precision, recall and Fmeasure curvesPlotting precision, recall and Fmeasure at every retrieved document gives an idea of how these values change over the result collection. These can be compared to other queries, illustrating the difference.
4.5 Lexical varianceOne purpose of expanding the query is to introduce variance for the user. Similar results could then be identified and clustered together. An option for evaluating this variance is to measure the occurrence of the selected words and their synonyms in the results.
IQV (Index of Qualitative Variation) is a measure of qualitative variation (Gibbs et al., 1975) and was used to evaluate the lexical variance in these experiments.
IQV=K
K−1 1−∑i=1
K
f iN 2
Where K is the number of classes, f i is the number of occurrences for category i and N is the total number of occurrences.
IQV has the following properties:
● IQV value is between 1 and 0.
● IQV is 0 if and only if all cases belong to a single category.
● IQV is 1 if and only if cases are evenly divided across all categories.
Therefore IQV is a suitable measure to show whether greater lexical variance has been
31
Figure 15: Recall curves of two different systems that return different number of results
0 20 40 60 80 100 120 140 160 180 200
0
0.1
0.2
0.3
0.4
0.5
0.6
0.7
0.8
0.9
1
Recall-CurrentRecall-Mphil

successfully introduced compared to the original query.
An example: For the synonym set {“express”, “overexpress”, “coexpress”} K=3 and f 2 would be the number of times “overexpress” occurs in the set of results. Variance
is calculated separately for each selected word (including its synonyms) and then averaged over all selected words.
In addition to the lexical variance of the selected words, the lexical variance of connected words can be measured. Connected words are words that are connected to any of the selected words through a direct relation. IQV is used to calculate the variance of these words for each selected word and the average is used. This measure should theoretically show if, by introducing greater lexical variance in the selected words, we have also increased the lexical variance of words that are either heads or dependents to the selected words and not directly included in the query.
4.6 Number of new resultsWe can calculate how many of the sentences in the result set are not represented in the set returned by the baseline system. These are sentences that have only become available using the enhancements. Doing this calculation at every returned sentence will provide a graph showing if the previously unseen sentences are evenly distributed or get clustered to either the top or the bottom of the ranks.
32
Figure 16: The number of new results over all returned sentences. Showing a system that tends to push new results away from the top ranks.
0 50 100 150 200 250
0
10
20
30
40
50
60
70
Count

4.7 Spearman's rank correlationSpearman's rank correlation coefficient is a nonparametric measure of correlation (Spearman, 1904). It can be used to show how two sets of rankings correlate with eachother.
=1−6⋅∑ di
2
nn2−1
Where d i=xi−y i , the difference between ranks of the same element in both sets and n is the number of elements in both sets. The value of will be between 1 and 1: Value 1 if both rankings are identical, 1 if they are negatively correlated and 0 if they are uncorrelated.
Spearman's correlation only works on sets that contain the exact same elements. It can not handle one set having an element that is not present in the other one, as is the case during some of our tests. Therefore, for our purposes, when calculating this measure over n elements, it means looking at elements that are present in the first n elements of both sets.
33

Chapter 5: Experiments
5.1 Gold standardTo thoroughly evaluate the proposed methods, a test set is needed – a large collection of queries and manually checked correct answers for each of them. Since no suitable test set is available, the construction of such queries and the manual annotation needed to find all the answers would require much work by a group of domain experts. It was not possible to construct such a set as part of this MPhil project, therefore development and testing was done using randomly selected single queries that were annotated by the author. Such evaluation does not provide generalisation over a larger set of queries but is meant as a proofofconcept.
In these tests the evaluation is done on the sentence level – if the returned sentence contains the kind of information the user was looking for, it is classified as correct.
For initial results and development, the query of “expressAdh” was used. This imitates finding the sentence
Adh is not expressed in the developing embryo , and we find no difference in the hatching times among our four different transformant types ( Tables 1 and 2 ) .
and selecting lemmas Adh and expressed. In the set of grammatical relations for this sentence, these lemmas are connected by a relation
[24, express, Adh, 0, -1]
To classify a sentence as correct, it would have to contain information about the expression of Adh. The application MphilGoldFinder was written and used to manually decide for each sentence, whether it is a correct answer or not. The program executes a manually constructed query and displays all the matching sentences one by one, letting the user decide if a sentence is correct. The sentence IDs are saved into separate files based on their classification.
For this set, the query was constructed so that it would return any sentence containing a form of express or Adh, including their synonyms. Since this means manually classifying only a subset of all the sentences in the database, it can be assumed that it is not a fully complete set – for that, all the 5000 papers would have had to be read and that was not done due to time constraints. But the set contains all the results returned by any version of the system so it can be used to compare them and show improvement.
34

Examples of sentences classified as incorrect:
The levels of nucleotide and protein variation in the Adh region are sufficient for detection of significant linkage disequilibrium .
However , in these previous studies , the association between expression level and tolerance was established without consideration of genotype , so that the effects of genetic background , catalytic differences among Adh genotypes , and differences in expression level were not separated in their analyses .
Examples of sentences found to be correct:
The sequence analysis of the 5 9 flanking region of the Adh gene indicates a single promoter and shows stretches of high similarity with cis acting elements responsible for the expression of Adh in Drosophila melanogaster .
We have already used the short MSSP 2 promoter fragment for the expression of the Drosophila alcohol dehydrogenase ( ADH ; J etΒειννΑ ΑΤτ al. 1983 ) in the med y .
Total of 246 results were manually classified for this set, out of which 145 were classified as correct and 101 as incorrect answers to the query.
The evaluation task is somewhat different and was proposed by a domain specialist as a realworld problem that this system could help solve. Drosophilia Melanogaster genes each have IDs in the form of CGXXXXX where the Xs are a sequence of 4 or 5 numbers. Using computer prediction, genes are entered into the FlyBase database and given these IDs even before they are discovered in the real world. Researchers who do find these genes are free to give them an alternative name; for example CG6736 is also known as insulinlike peptide 4 (Ilp4). The goal of the evaluation task is to find cases where a gene is named and a CG identifier is associated with another gene name. This could be of great help to annotators or automated systems that are putting together databases of gene synonyms.
To assemble a gold standard, all the qualifying sentences from the 5000 papers have to be located. The only requirement for a sentence naming a CG gene is that it contains a CG identifier. Unfortunately, the number of these sentences was very large and subsets had to be chosen for manual annotation. Those subsets were selected so that certain keywords or conditions had to be present in the sentences. For example requiring namingrelated keywords like “name” or “refer” to also be present reduced the number of sentences and increased precision. The returned sentences were manually annotated by the author as either correct or incorrect.
35

Examples of sentences found to be correct answers to the query:
For this reason we have named CG8806 prelilike ( prel ) .
The CG9506 gene ( which we call slam for slowas molasses ) encodes a novel gene with no previously characterized homologs or welldefined structural mo tifs ( see below ) .
Incorrect sentence examples:
A second CG15605 gene segment was identified in a dot plot analysis and appears to be a pseudogene that we designate CG15605w ( Figure 1 ) .
The probe corresponding to the predicted gene CG13620 was generated from a PCR product consisting of bases 1357 to 2508 of the mld cDNA corresponding to part of the third exon .
In total, 601 sentences were manually classified for the evaluation set, which includes 225 correct and 376 incorrect sentences.
A well known problem in automatically processing medical papers is hedging – authors making uncertain claims, usually by adding appropriate adjectives or adverbs. An example of a hedged claim in the evaluation set would be:
Several pieces of evidence indicate that Hmr corresponds to the MADFcontaining gene CG1619 .
The sentence implies that the relation exists but leaves room for doubt. Results of this kind can be handled in different ways – if the system is used by annotators, they would only want to see definite results without hedging, whereas researches trying to find information on a topic are also interested in theories and unproven claims. This is an ongoing research issue (Medlock, 2008) and is not tackled in this project. For the gold standard hedged sentences were classified as correct.
36

5.2 ResultsExperiments were run with 7 different configurations:
1. Baseline
2. Synonym expansion (Syn)
3. Pattern scoring (Patt)
4. Distance scoring (Dist)
5. Synonym expansion with pattern scoring (Syn+Patt)
6. Synonym expansion with distance scoring (Syn+Dist)
7. Synonym expansion, pattern scoring and distance scoring (Hybrid)
The tests were run on both development and evaluation queries using the gold standards described in 4.1. Next, we present results for each technique.
5.2.1 BaselineThe baseline system uses a simple query and rescores the results using a simple algorithm, looking for exactly the same relations that were specified in the query.
Table 2 shows that for the development query, the baseline system achieves relatively high precision and recall. This is because the query specifies the lemmas express and Adh which are used more frequently than their synonyms. In addition, the relation express-Adh comes up very often in the data, allowing the baseline system to perform well without any intricate scoring methods. The F measure and MAP also point to a system that gives reasonably good results.
37
Table 2: Basic statistics for the baseline system
Devel EvalPrecision 0.7434 0.5854Recall 0.7847 0.2133Fmeasure 0.7635 0.3127MAP 0.7346 0.1163

Precision over all results (Figure 17) shows that the first 50 results returned by the baseline system are correct. Recall also increases steadily throughout the whole set. This means a positive experience for the user where they are not forced to sort through false positive results. In total it returns 152 sentences out of which 113 are correct. Figure 18 shows the precisionrecall curve for the query.
38
Figure 17: Precision, recall and F measure over all results for the development query on the baseline system
0 20 40 60 80 100 120 140 160
0
0.2
0.4
0.6
0.8
1
1.2
PrecisionRecallF measure
Figure 18: Precisionrecall curve for the development query on the baseline system
0 0.1 0.2 0.3 0.4 0.5 0.6 0.7 0.8 0.9 1
0
0.2
0.4
0.6
0.8
1
1.2
Baseline

For the evaluation data the baseline system looks for name-CGID relations from the text. The system does less well compared to development data, which was expected since the query is much more complicated. There are various ways of naming a gene and authors of scientific papers often use long and complicated sentence structures which cannot be recognised by this system. Also, in contrast to the development query, there are many different keywords that are equally popular for indicating a naming process and sometimes no keywords are needed at all.
Precision is still relatively high because of a very specific query but the baseline system returns only a small subset which means low recall values. The precision graph over all results (Figure 19) shows that some relevant results are clustered towards the top ranks but precision drops fast after that. Recall increases steadily over all results but peaks at a very low value. For the evaluation task the system returns 82 sentences from which 48
39
Figure 19: Precision, recall and F measure over all results for evaluation query on the baseline system
0 10 20 30 40 50 60 70 80 90
0
0.2
0.4
0.6
0.8
1
1.2
PrecisionRecallF measure
Figure 20: Precisionrecall curve for the evaluation query on the baseline system
0 0.1 0.2 0.3 0.4 0.5 0.6 0.7 0.8 0.9 1
0
0.2
0.4
0.6
0.8
1
1.2
Baseline

are correct.
This baseline system is used for comparison to all the other results.
5.2.2 Synonym expansionThis version of the system uses synonyms to expand the query with relevant keywords. A preassembled database of genomicsrelated synonyms was used to find words that have a close meaning to the ones used in the query. In these experiments only verbs and gene names were used when doing the expansion. The results returned by the Lucene engine are then rescored using a simple algorithm that only looks for direct relations that were specified in the query and are present in the candidate sentence. This algorithm is the same as in the baseline system but was modified to account for the use of synonyms.
The benefit of the synonym expansion is that it find sentences that use a variation of words to convey the same meaning. For example the following sentence could not have been located using the baseline system:
CG31201 has been identified as an essential glutamate receptor subunit at the Drosophila NMJ (Qin et al., 2005)and is now referred to as GluRIIE.
The total number of items returned by the system (shown in Table 3) increases greatly and even more important is the increase in recall for both development and evaluation queries. For the evaluation query, the introduction of synonyms increases the recall value 4 times.
During synonym expansion, the lemma name in the query was successfully replaced with the lemma refer and the sentence was returned by the search. These kind of sentences still get a low position in the ranking since the rescoring algorithm is relatively simple and cannot reward complex relations. Any score it gets is only from the lemma matches – the sentence does contain a CG identifier and the lemma refer.
40
Table 3: Basic statistics for the synonym expansion system
Baseline SynonymsDevel Eval Devel Eval
Items retrieved 152 82 213 481Relevant items retrieved 113 48 140 193Precision 0.7434 0.5854 0.66 0.4012Recall 0.7847 0.2133 0.97 0.8578F measure 0.7635 0.3127 0.78 0.5467MAP 0.7346 0.1163 0.85 0.4612

Consistent increases in MAP and F measure when using synonym expansion are good indications that the technique is beneficial and the system in general performs better than the baseline. The only value that drops is precision, which was to be expected – expanding the query with new words based on similarity is bound to introduce certain levels of unwanted noise and this is reflected in the precision drop. But the increase in recall is greater than the drop in precision for both cases.
The precisionrecall curves (Figure 21) show that there are some points where the precision of the baseline system is higher but the area under the curve is much larger with the synonym extension, for both the development and the evaluation query.
Figures 22 and 23 show the number of results that were not returned by the baseline
41
Figure 22: New results introduced for the development query with synonym expansion
Figure 23: New results introduced for the evaluation query with synonym expansion
0 100 200 300 400 500 600
0
50
100
150
200
250
300
350
400
450
Eval
Figure 21: Precisionrecall curves for the synonym expansion system
0 50 100 150 200 250
0
10
20
30
40
50
60
70
Devel
0 0.1 0.2 0.3 0.4 0.5 0.6 0.7 0.8 0.9 1
0
0.2
0.4
0.6
0.8
1
1.2
Deve l-base lineDeve l-synonymsEval-base lineEval-synonyms

system but are found when using synonyms. Ideally, these new sentences would be distributed uniformly among all results. In the case of the development query the graph illustrates how only a few new results are introduced in the first 70 rankings and most of them are clustered at the bottom. The evaluation query shows a much more preferable outcome where the sentences are almost equally represented at all rankings. This is due to the nature of the queries: a great majority of sentences describing the expression of Adh actually contain the lemma express and a direct relation to the gene, therefore they are scored highly by the simple rescoring technique and take up most of the top rankings. In contrast, sentences where genes are being named tend to have more complicated structures and this is not very well captured by the current rescoring. That means only very few sentences actually benefit from the rescoring and most ranking is done based on the presence of lemmas, which gives equal chances to all the sentences.
Ideally we want the system to also introduce some level of lexical variability – instead of hundreds of identical sentences they would be visibly different while still being correct answers to the query. This would provide a more interesting experience for the user and also creates a base for future extensions where similar sentences can be clustered together.
To measure lexical variance, IQV (explained in 4.2.5) was calculated over all returned sentences and also over only the ones that belong to the gold standard (correct sentences).
The results in Table 4 show a steady increase in all cases, indicating that lexical variance was indeed successfully introduced. Increasing IQV for the correct answers also shows that the larger variance is not due to noise and can be credited to useful sentences. The lexical variance of connected words was also calculated. These results showed consistent increases but since the values are are already very high for the baseline system (over 0.99) there was not much room for improvement.
42
Table 4: IQV values calculated for selected words
Baseline SynonymsAll Correct All Correct
IQV for express 0.053 0.053 0.358 0.179IQV for Adh 0.274 0.300 0.440 0.422Average IQV for devel 0.164 0.177 0.399 0.301IQV for name 0.175 0.233 0.825 0.900IQV for CGXXXX 0.997 0.989 0.999 0.997Average IQV for eval 0.586 0.611 0.912 0.948

5.2.3 Pattern scoringPattern scoring is the method for rescoring a set of results. Handconstructed patterns are used to find sentences that should receive a higher score. General precision, recall and lexical variance are identical to either the baseline or the synonym expansion system, depending on whether synonyms are used; only the ranking of sentences is being changed. For the development query patterns described in 3.3 were used. The following patterns were constructed for the evaluation query:
name -ncsubj-> TARGET (1)name -pcomp-> to -iobj-> TARGET (2)name -iobj-> to -ncmod-> TARGET (3)name -dobj-> TARGET (4)name -obj-> TARGET (5)CGID -brack-> GENE (6)GENE <-brack- CGID (7)
TARGET is defined for CG tokens in the same way as for the development query. Pattern 1 captures structures where a new gene name is a direct subject of the verb
[...] CG2086 ( which we have named draper ; drpr ) [...]
Patterns 2 and 3 find sentences where a gene is connected to the verb through a preposition
This factor has been called short Spenlike protein ( SSLP or DmSSp ) and is referred to as CG2910 in the annotated genome .
Patterns 4 and 5 score highly structures where a gene name is the object of the verb. Sentences that also match pattern 1 get an even higher score since they have both suitable subjects and objects for the verb.
[...] CG16982 , designated as dRbx1[...]
Finally, patterns 6 and 7 are for sentences where the naming is done using brackets instead of verbs or keywords, for example
On the basis of these findings and other PCR tests , we conclude that Df(4)M10162f is deleted or disrupted for the following genes : CG17245 ( plexB ) , CG2125 ( ci ) , CG2168 ( RpS3A ) , CG17964 ( pan ) , CG32008 ( Ank ) , CG1587 ( Crk ) , CG1629 ( yellow h ) , and CG1674 .
43

Precisionrecall graphs (Figures 24 and 25) show that the technique was beneficial. The precision level is the same or higher at every recall point for both the development and the evaluation query. Correct sentences that were previously sent to the bottom of the ranking are now brought up since they successfully match one or more of the patterns. Tests were also run using synonym expansion and pattern rescoring together. The results are similar and show a consistent improvement: MAP increased from 0.855 to 0.918 for the development query and from 0.461 to 0.551 for the evaluation query.
44
Figure 24: Precisionrecall curves for the system using pattern rescoring
Figure 25: Precisionrecall curves for the system using synonyms and pattern rescoring
0 0.1 0.2 0.3 0.4 0.5 0.6 0.7 0.8 0.9 1
0
0.2
0.4
0.6
0.8
1
1.2
Deve l-base lineDeve l-patternsEval-base lineEval-patterns
0 0.1 0.2 0.3 0.4 0.5 0.6 0.7 0.8 0.9 1
0
0.2
0.4
0.6
0.8
1
1.2
Deve l-synonymsDeve l-syn+pattEval-synonymsEval-syn+patt

To find out exactly how much the rescoring algorithm affects the rankings, Spearman correlation coefficient was calculated. It shows how well the ranks in two sets of elements correlate with each other.
The results in Table 5 show that after rescoring the sets are still correlated positively rather than negatively, meaning the sentences are largely in the same order as for the baseline system. Among the first 20 elements the correlation is especially high with all versions of the system. Such high correlation values can be explained by many sentences receiving identical scores from pattern matches the order between those results is decided based on lemma matching scores, which are the same in both cases. Correlation decreases by 5077% for the development query when synonyms are used, which indicates that some amount of variety was successfully introduced. The only negative correlation was found when looking at the first 50 elements returned by the evaluation query using patterns. As explained in 4.2.7, this measure does not take into account the results that are not present in the specified subset for either of the sets.
The placement of new results in the rankings (Figures 26 and 27) shows that there is not much change for the evaluation query – these sentences are still evenly distributed. For the development query these new results are heavily clustered towards the bottom, even more than using the baseline rescoring algorithm. This is not the preferred result since the user would have to go through most of the set to benefit from the synonym expansion, but otherwise the system performs very well, improving both recall and MAP.
45
Table 5: Spearman's correlation coefficient, calculated against the baseline
Patterns Syn + patternsDevel Eval Devel Eval
First 20 elements 1.00 1.00 0.50 1.00First 50 elements 0.91 -0.18 0.21 0.36First 80 elements 0.86 0.07 0.29 0.10
Figure 26: New results introduced with the development query and pattern rescoring
0 50 100 150 200 250
0
10
20
30
40
50
60
70
SynSyn+Patt
Figure 27: New results introduced with the evaluation query and pattern rescoring
0 100 200 300 400 500 600
0
50
100
150
200
250
300
350
400
450
SynSyn+Patt

5.2.4 Distance scoringThe distance scoring algorithm tries to achieve results similar to the pattern scoring technique but without any training data or the need for handconstructed patterns. Each sentence is assigned a score by locating certain relevant lemmas and finding shortest possible path between them using the set of binary grammatical relations from the parser. The system assumes that lemmas with the shortest distance (the least amount of links) separating them are more likely to be semantically connected and therefore should receive a higher score.
46
Figure 28: Precisionrecall curves for the system using distance scoring
Figure 29: Precisionrecall curve for the system using synonym expansion and distance scoring
0 0.1 0.2 0.3 0.4 0.5 0.6 0.7 0.8 0.9 1
0
0.2
0.4
0.6
0.8
1
1.2
Deve l-base lineDeve l-patternsDeve l-distanceEval-base lineEval-patternsEval-distance
0 0.1 0.2 0.3 0.4 0.5 0.6 0.7 0.8 0.9 1
0
0.2
0.4
0.6
0.8
1
1.2
Deve l-synonymsDeve l-syn+pattDeve l-syn+distEval-synonymsEval-syn+pattEval-syn+dist

The precisionrecall curves (Figures 28 and 29) show that the system generally performs better than the baseline but in most cases not as good as the pattern scoring. It does best on the development query with synonym expansion, achieving even slightly higher MAP than pattern scoring – 0.918 compared to 0.914 – but in other cases it receives lower values. This is mainly because the algorithm uses a heuristic approach that is not as specific and grammatically guided as the pattern scoring technique. Error analysis showed that it can rank very highly sentences that have nothing to do with the CG gene naming process but simply have the right lemmas very close together, for example
Notably , we detected six spatzlelike proteins or domains in Drosophila , namely Serrate and putative products CG9196 , CG9972 , CG14533 , CG14928 , and CG18318 ( unpublished data ) .
At the same time it will send some correct sentences to the bottom of the rank if no suitable relation has been found by the parser. This sentence was among one of the lowest ranked results for the evaluation query:
Among all potential ROS regulators in the Drosophila genome , only one annotated gene ( CG8913 ; named as immuneregulated catalase [ IRC ] in the present study ) has been identified as a DIRG ( De Gregorio et al. , 2001 ) .
Figures 30 and 31 show where the new results are placed in the ranking. For the development query, the distance scoring algorithm distributes these sentences differently – while many of them are still placed at low rankings, a portion of them get to be in the top 20. This means the user will see more variation in the set of results early on. Distance scoring is also able to slightly improve the already uniform distribution of the evaluation query.
47
Figure 30: Number of new results on the development query using distance scoring
Figure 31: Number of new results on the evaluation query using distance scoring
0 50 100 150 200 250
0
10
20
30
40
50
60
70
SynSynDist
0 100 200 300 400 500 600
0
50
100
150
200
250
300
350
400
450
SynSynDist

Spearman's correlation coefficient (shown in Table 6) shows how much the ranking is correlated to the ranking of the baseline system. These values seem to fluctuate very heavily from complete correlation to negative correlation. When plotting this for every possible subset, main trends can be visibly identified: large positive correlation in the top end; small or negative correlation in the middle; slowly climbing positive correlation overall. This is because a certain set of very easily identified sentences get ranked highly by all the algorithms, after which the variation gets larger and correlations decreases.
Since the pattern and distance scoring algorithms performed well compared to the baseline system, a final system was created that makes use of them both. This system uses all the techniques described here: synonyms are used to expand the query, pattern scoring is used to find sentences that contain certain grammatical structures, distance scoring is used to locate sentences where the selected lemmas are in a close relation with each other. Calculated scores for each sentence are added together to form the final score.
48
Table 6: Spearman's correlation coefficients calculated against baseline scoring systems
Patterns Syn + patternsDevel Eval Devel Eval
First 20 elements -0.024 0.600 1.000 1.000First 50 elements 0.478 0.018 0.362 -0.257First 80 elements 0.553 -0.311 0.447 0.347
Figure 32: Precisionrecall curve for the hybrid system using synonym expansion, pattern scoring and distance scoring
0 0.1 0.2 0.3 0.4 0.5 0.6 0.7 0.8 0.9 1
0
0.2
0.4
0.6
0.8
1
1.2
Deve l-synonymsDeve l-syn+pattDeve l-syn+distDeve l-hybridEval-synonymsEval-syn+pattEval-syn+distEval-hybrid

The precisionrecall graphs (Figure 32) show that the combination system performs equally well or even better. Although the precision is intersected by other systems in various recall points, the average level remains higher than for any other system. This is very well reflected in the MAP values where the combination system achieves 0.933 on the development query and 0.562 on the evaluation query – both higher than any other system configuration.
The strength of the new technique is that it uses information from multiple sources to assign scores for each result. Highly ranked sentences receive large scores from the distance scoring algorithm and also match one or more grammatical patterns. If one of the scoring techniques returns a zero score, the system will still fall back to the other solution, which allows for more sentences to receive an adequate rank.
49
Table 7: MAP for all systems
No synonyms SynonymsDevel Eval Devel Eval
Baseline 0.735 0.116 0.855 0.461Pattern scoring 0.758 0.162 0.914 0.552Distance scoring 0.741 0.146 0.918 0.512Pattern and distance scoring - - 0.933 0.562
Figure 33: Precision and recall over all results for the baseline and the hybrid system using synonym expansion, patterns scoring and distance scoring. Development query.
0 50 100 150 200 250
0
0.2
0.4
0.6
0.8
1
1.2
Prec-BaselinePrec-HybridRec-BaselineRec-Hybrid

Figures 33 and 34 compare the precision and recall of the final system to the baseline results. Looking at the development query, we can see that the curves extend further, showing more than 100 extra results. The first 50 results of both systems are correct but after that the precision of the baseline system starts to drop whereas the combination system keeps its precision for the first 90 results. The precision of both systems drops at roughly the same speed but the new system has higher corresponding values. The recall curve shows the same trends, with the hybrid system preforming equally well in the beginning and achieving around 0.1 higher values towards the end.
Looking at the evaluation query, the most noticeable difference is the number of returned results – 82 from the baseline compared to 481 from the hybrid system. The precision of the new system drops down to 0.5 during the first four results after which it climbs back up to 0.8 and starts decreasing gradually. This is in contrast with the baseline system, which has its highest precision after retrieving 5 results, then drops to 0.4 and starts climbing again from there. If the priority was to have very high precision in the first few results, then the baseline system would have the advantage. Error analysis revealed the reason for this – a few very long sentences or text fragments containing large numbers of relations get ranked very high with the new system. Because of their length, they are likely to contain more gene names and different relations between them, randomly matching several patterns and receiving high scores from the distance algorithm.
This is an example of such a sentence and it was ranked at number 2 by the combination system on the evaluation query:
To synthesize dsRNA , the following PCRprimers containing a 27 nucleotide long T7 RNA polymerase promoter sequence at their 5 \' ends were
50
Figure 34: Precision and recall over all results for the baseline and the hybrid system using synonym expansion, patterns scoring and distance scoring. Evaluation query.
0 100 200 300 400 500 600
0
0.2
0.4
0.6
0.8
1
1.2
Prec-BaselinePrec-HybridRec-BaselineRec-Hybrid

constructed : for CG8784 the sense primer 5 \' TAATA CGACTCACTATAGGGAGACCACCATTTGGCTGGCGGCCTT CC3 \' ( corresponding to nucleotide positions 693 to 712 of Fig. 1 ) and the antisense primer 5 \' TAATACGACTCACTATAGGGAGACC ACGCGTTGTTGTTTACACTGCA3 \' ( corresponding to nucleotide positions 1324 to 1343 of Fig. 1 ) , for CG8795 the sense primer 5 \' TAA TACGACTCACTATAGGGAGACCACCGGAAACGGCGGCCA ATGCG3 \' ( corresponding to nucleotide positions 428 to 447 of Fig. 2 ) and the antisense primer 5 \' TAATACGACTCACTATAGGGAG ACCACGGCAGATCCATTTAGCCCAG3 \' ( corresponding to nucleotide positions 1214 to 1233 of Fig. 2 ) .
It does not contain information about naming the CG gene and therefore we wouldn't want to present this to the user. But there are only a few single examples of such cases and this should not be a major problem for a researcher trying to find hundreds of sentences or documents containing a specific topic.
Figures 35 and 36 show that the hybrid system is not distributing the new results very well. There is not much difference for the evaluation query, which has a very good baseline already. For the development query the final system places most of the new systems at lower ranks, more than any previous system or even the baseline. But the results that do get ranked highly are mostly correct, resulting in a system that has the best MAP and a large area under the precisionrecall curve. Since the goal was to achieve good results on the whole set, not only the top ranking ones, this can still be viewed as the best performing configuration.
51
Figure 35: Number of new results using the hybrid system. The development query.
0 50 100 150 200 250
0
10
20
30
40
50
60
70
SynHybrid
Figure 36: Number of new results using the hybrid system. The evaluation query.
0 100 200 300 400 500 600
0
50
100
150
200
250
300
350
400
450
SynHybrid

Chapter 6: Conclusion and Future WorkInformation Extraction is a promising and important research area that can help us deal with the increasing amount of data available today and in the future. The ability of finding relevant information fast and efficiently can be of great help when solving nearly any task. In this dissertation we described an IE system that that does not need to be customized for every query but can execute them right as they are created by a nonspecialist user. A database of 5000 biomedical papers was used – the sentences had been parsed with a full parser, performing tokenisation of text, extracting lemmas and finding grammatical relations between them. Users could then indirectly specify the type of information they were looking for and the system would return sentences that match.
Several techniques and combinations were tried to improve the system performance, all of them having their strengths and weaknesses. Synonym expansion was used to find keywords similar to those specified by the user. This made the system return a larger number of sentences, reducing precision but increasing recall. Pattern scoring algorithm was used to score highly sentences that contain certain kinds of grammatical relations, derived from the original query, for example passive and nominalised forms. This reranked the sentences so that the set achieved higher MAP and a larger area under the precisionrecall curve. To use this approach, patterns had to be manually constructed and selected, which was the main weakness of the approach. As an alternative, distance scoring was proposed and tested – sentences were scored based on automatically found paths through the relation trees. Relevant lemmas that were connected through a fewer number of relations resulted in a higher score. This approach successfully distributed the new results across the ranks and gave an improvement over the baseline but did not reach the MAP values of the pattern scoring system.
For the final configuration, all approaches were used together. It achieved MAP values of 0.933 for the development query and 0.562 for the evaluation query, surpassing all individual techniques. It did not distribute the new results very well, mostly positioning them at middle or lower ranks. The approach still requires manual construction of patterns, which could be solved by developing an automated learning system.
For future work, the main goal is to integrate machine learning and pattern collection to make the process more flexible and automatic. Weakly supervised algorithms (Stevenson & Greenwood, 2005), which bootstrap from a small number of examples, could be used to construct the patterns based on user input. Distributional semantic clustering with space models (Pado & Lapata, 2003) can be used to cluster results so that the user would not have to go through large amounts of similar sentences. Further developments in the user interface would also help make the system more flexible and enable more complex queries in the future.
52

References
AlHalimi, R., Berwick, R. C., Burg, J. F. M., Chodorow, M., Fellbaum, C., Grabowski, J., Harabagiu, S., Hearst, M. A., Hirst, G., Jones, D. A., Kazman, R., Kohl, K. T., Landes, S., Leacock, C., Miller, G. A., Miller, K. J., Moldovan, D., Nomura, N., Priss, U., Resnik, P., StOnge, D., Tengi, R., van de Riet, R. P. & Voorhees, E. (1998). WordNet: An Electronic Lexical Database.
Briscoe, T., Buttery, P., Carroll, J., Medlock, B. & Watson, R. (2008). Text Processing and Services from iLexIR Ltd.
Briscoe, T., Carroll, J., Watson, R. (2006). The second release of the RASP system. In Proceedings of the Interactive Demo Session of COLING/ACL.
Bunescu, R., Ge, R., Kate, R. J., Marcotte, E. M., Mooney, R. J., Ramani, A. K. & Wong, Y. W. (2005). Comparative Experiments on Learning Information Extractors for Proteins and their Interactions. Artificial Intelligence in Medicine (special issue on Summarization and Information Extraction from Medical Documents). 33 (2). pp. 139155.
Cohen, A. M. & Hersh, W. R. (2004). A survey of current work in biomedical text mining. Briefings in Bioinformatics. Vol. 6, No I. pp. 5771.
Coles, P., Cox, T., Mackey, C. & Richardson, S. (2006). IBM Global Technology Services. www03.ibm.com/systems/resources/systems_storage_solutions_pdf_toxic_tb.pdf
Daraselia, N., Egorov, S., Yazhuk, A., Novichkova, S., Yuryev, A. & Mazo, I. (2004). Extracting Protein Function Information from MEDLINE Using a FullSentence Parser. In Proceedings of the Second European Workshop on Data Mining and Text Mining for Bioinformatics. pp. 1521.
Gibbs, J. P., Poston, Jr. & Dudley, L. (1975). The Division of Labor: Conceptualization and Related Measures. Social Forces, Vol. 53, No. 3. pp. 468476.
Goetz, B. (2000). The Lucene Search Engine: Powerful, Flexible and Free. http://www.javaworld.com/javaworld/jw092000/jw0915lucene.html
Gospodnetic, O. & Hatcher, E. (2005). Lucene in Action. Greenwich: Manning Publications Co.
53

Leroy, G. & Chen, H. (2002). Filling PrepositionBased Templates to Capture Information from Medical Abstracts. In Pacific Symposium on Biocomputing 7, pp. 350361.
Medlock, B. (2008). Exploring hedge identification in biomedical literature. Journal of Biomedical Informatics.
Pado, S., Lapata, M. (2003). Constructing Semantic Space Models from Parsed Corpora. In Proceedings of ACL03.
Raychaudhuri, S., Schutze, H. & Altman, R. B. (2002). Using text analysis to identify functionally coherent gene groups. Genome Research, vol 12(10), pp. 15821590.
Spearman, C. (1904). The proof and measurement of association between two things. The American journal of psychology. pp. 72–101.
Stevenson, M., Greenwood, M. A. (2005). A Semantic Approach to IE Pattern Induction. Proceedings of the 43rd Annual Meeting of the ACL. pp. 379386.
Tsujii, J. (2009). BioNLP'09 Shared Task. http://wwwtsujii.is.s.utokyo.ac.jp/GENIA/SharedTask/index.shtml
Tweedie, S., Ashburner, M., Falls, K., Leyland, P., McQuilton, P., Marygold, S., Millburn, G., OsumiSutherland, D., Schroeder, A., Seal, R., Zhang, H. & The FlyBase Consortium. (2009). FlyBase: enhancing Drosophila Gene Ontology annotations. Nucleic Acids Research.
Yakushiji, A., Miyao, Y., Tateisi, Y. & Tsujii, J. (2005). Biomedical Information Extraction with PredicateArgument Structure Patterns. In Proceedings of the First International Symposium on Semantic Mining in Biomedicine, pp. 6069.
Yakushiji, A., Tateisi, Y., Miyao, Y. & Tsujii, J. (2001). Event Extraction from Biomedical Papers Using a Full Parser. In Proceedings of the Pacific Rim Symposium on Biocomputing 6, pp. 408419.
54

Appendix A: ExpressGene patternsMost frequent patterns between the lemma express and a gene, denoted by the token [::GENE::]. These were collected and counted from the index of 5000 biomedical papers.
Rank Pattern Count
1 express ---> [::GENE::] 55988
2 express ---> of ---> [::GENE::] 10793
3 express <--- and ---> [::GENE::] 6341
4 express ---> and ---> [::GENE::] 5430
5 express ---> [::GENE::] ---> [::GENE::] 2561
6 express ---> of ---> and ---> [::GENE::] 2393
7 express ---> of ---> gene ---> [::GENE::] 1511
8 express ---> of ---> [::GENE::] ---> [::GENE::] 1478
9 express ---> in <--- [::GENE::] 1287
10 express ---> or ---> [::GENE::] 1199
11 express ---> protein ---> [::GENE::] 1040
12 express <--- or ---> [::GENE::] 996
13 express ---> gene ---> [::GENE::] 940
14 express <--- [::GENE::] 889
15 express <--- pattern ---> [::GENE::] 784
16 express ---> in ---> [::GENE::] 724
17 express ---> of ---> protein ---> [::GENE::] 712
18 express <--- domain ---> [::GENE::] 597
19 express <--- and ---> [::GENE::] ---> [::GENE::] 544
20 express <--- and ---> and ---> [::GENE::] 513
21 express <--- vector ---> [::GENE::] 507
22 express ---> in ---> and ---> [::GENE::] 477
23 express <--- pattern ---> of ---> [::GENE::] 440
24 express ---> transgen ---> [::GENE::] 421
25 express <--- induc ---> [::GENE::] 419
26 express ---> in ---> mutant ---> [::GENE::] 412
27 express ---> of ---> or ---> [::GENE::] 408
28 express ---> of ---> transgen ---> [::GENE::] 397
29 express ---> and ---> [::GENE::] ---> [::GENE::] 388
55

Appendix B: GeneCGID patternsMost frequent patterns between gene names and CGXXXXX ID tokens, denoted by [::GENE::] and [::CG-ID::] respectively. These were collected and counted from the index of 5000 biomedical papers. Compared to appendix A these are more difficult to collect and contain more noise (false patterns).
1 [::GENE::] <--- [::CG-ID::] ---> [::CG-ID::] 2421
2 [::GENE::] <--- and ---> [::CG-ID::] 1862
3 [::GENE::] <--- [::GENE::] ---> [::CG-ID::] 1681
4 [::GENE::] <--- 9 ---> [::CG-ID::] 1620
5 [::GENE::] ---> [::CG-ID::] 789
6 [::GENE::] <--- [::CG-ID::] 593
7 [::GENE::] <--- [::GENE::] <--- and ---> [::CG-ID::] 585
8 [::GENE::] <--- 82 ---> [::CG-ID::] 527
9 [::GENE::] <--- cnc* ---> [::CG-ID::] 396
10 [::GENE::] <--- 87 <--- clone <--- cg14734sivit ---> [::CG-ID::] 351
11 [::GENE::] <--- 87 ---> [::CG-ID::] 216
12 [::GENE::] <--- 1.9 ---> [::CG-ID::] 210
13 [::GENE::] <--- pointed-rc ---> [::GENE::] ---> [::CG-ID::] 208
14 [::GENE::] <--- vol. ---> [::CG-ID::] 208
15 [::GENE::] <--- 2 ---> [::CG-ID::] 197
16 [::GENE::] <--- [::GENE::] <--- pointed-rc ---> [::CG-ID::] 196
17 [::GENE::] <--- cg14734sivit ---> [::CG-ID::] 195
18 [::GENE::] <--- 1999 ---> bind ---> fig. ---> [::CG-ID::] 190
19 [::GENE::] <--- 6 ---> [::CG-ID::] 180
20 [::GENE::] <--- / ---> [::GENE::] ---> [::CG-ID::] 172
21 [::GENE::] <--- fig. ---> [::CG-ID::] 168
22 [::GENE::] <--- 2l ---> [::CG-ID::] 160
23 [::GENE::] <--- 1999 ---> [::CG-ID::] 152
24 [::GENE::] <--- overlap ---> [::CG-ID::] 140
25 [::GENE::] <--- and ---> [::GENE::] ---> [::CG-ID::] 130
26 [::GENE::] <--- a <--- [::GENE::] <--- [::CG-ID::] ---> [::CG-ID::] 125
27 [::GENE::] <--- [::CG-ID::] <--- and ---> [::CG-ID::] 122
28 [::GENE::] <--- cg14734sivit ---> clone ---> 87 ---> [::CG-ID::] 120
29 [::GENE::] <--- gene ---> [::CG-ID::] 104
30 [::GENE::] <--- and ---> and ---> [::CG-ID::] 92
56