Embed Size (px)
Citation preview
Adaptive Down-Scaling Techniques for JPEG-Based Low Bit-Rate Image Coding
Ana-Maria Sevcenco and Wu-Sheng Lu Dept. of Electrical and Computer Engineering
University of Victoria Victoria, BC, CANADA V8W 3P6
[email protected], [email protected]
Abstract – The DCT-based JPEG standard remains to be the most popular compression utility for digital images despite the emerging wavelet-based JPEG-2000 standard. A commonly recognized weak point of the DCT-based transform coding is its blocking effects which become increasingly visible when the bit-rate requirement goes deeper into the low bit-rate territory. There has been a great deal of research endeavors to deal with this problem. Motivated by a recent work of Bruckstein, Elad, and Kimmel (BEK), in this paper we propose two adaptive techniques that can be applied to a BEK type of transform coding system for further performance improvement at a cost of moderate increase in complexity. Here the adaptation is based on the input image’s local features and statistics, and goes in two ways: either adaptive in terms of the rate of the down-sampling or in terms of the quality factor of each image block. Simulation results are presented to demonstrate the effectiveness of the proposed techniques. Keywords – Image coding, adaptive down-sampling, local image features and statistics, quality factor of quantization matrix.
I. INTRODUCTION In spite of the emerging wavelet-based standard JPEG-2000 for still images [1], the DCT-based JPEG standard [2]-[4] remains to be the most commonly employed lossy compression utility due to its high effectiveness to encode image information and low computational complexity. Perhaps the most frequently mentioned weakness of the DCT-based image coding is the blocking artifacts it generates, which become especially visible in the low bit-rate territory. With a glance over the literature concerning DCT-based transform coding, one can sense that a great deal of efforts have been made in the past to deal with this problem. The work of particular interest and relevant to the methods described below are the algorithms recently proposed in [5][6] that are JPEG-based and incorporate an anti-aliasing filtering and down-sampling pre-processing step and an interpolative up-sampling post-processing step, which have demonstrated considerable performance improvement in terms of coding gain and reduced blocking effects. Studies of image coding problems employing similar frameworks can also be found in [7]-[10]. In this paper, two JPEG-based adaptive down-scaling techniques for low bit-rate image coding are proposed. The proposed techniques employ the same system framework as in [5], and incorporate some simple-to-implement adaptive
schemes into it for further performance enhancement at a cost of moderate increase in complexity relative to that of [5]. Roughly speaking, the process of down-scaling an input image is made adaptive in two ways, both of which are based on the knowledge of the image’s local features or statistics. In one way, the down-scaling rate is made adaptive to the image’s local features while in the other the down-scaling rate is fixed but each down-scaled 8 × 8 block is associated with a quality factor that is made adaptive to the image’s features in that block. In either adaptive framework, for a given bit budget, an increased number of bits is assigned to those blocks with rich features such as edges, while a reduced number of bits are given to those less dynamic blocks. It is intuitively clear that this kind of bit allocation will further ease off the blocking artifacts. Simulation results are presented to confirm this and, in addition, to demonstrate improved coding performance in terms of the peak signal-to-noise ratio (PSNR). The paper is organized as follows. Section II starts with a brief review of the method in [5], then presents two simple measures for local image features and statistics, and describes two adaptive down-scaling techniques for transform image coding. Simulation results and additional comments on the proposed methods are presented in Section III. Section IV concludes the paper with remarks on possible approaches to developing new algorithms for further performance improvement.
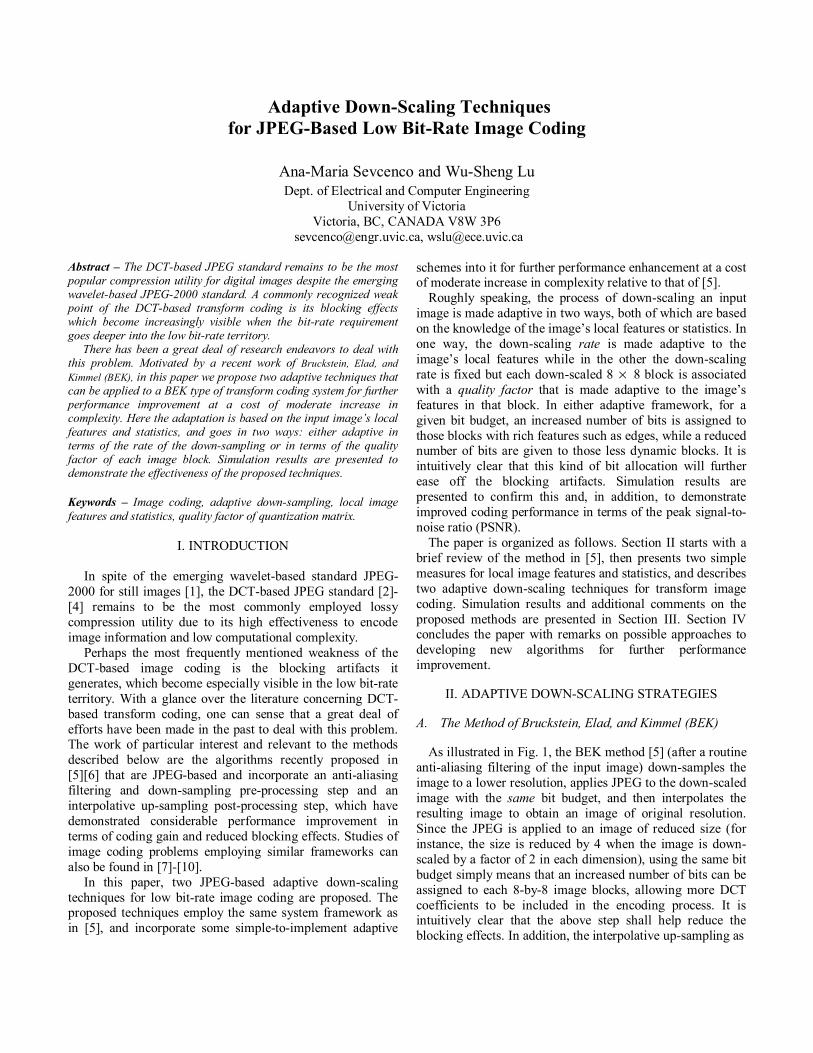
II. ADAPTIVE DOWN-SCALING STRATEGIES A. The Method of Bruckstein, Elad, and Kimmel (BEK) As illustrated in Fig. 1, the BEK method [5] (after a routine anti-aliasing filtering of the input image) down-samples the image to a lower resolution, applies JPEG to the down-scaled image with the same bit budget, and then interpolates the resulting image to obtain an image of original resolution. Since the JPEG is applied to an image of reduced size (for instance, the size is reduced by 4 when the image is down-scaled by a factor of 2 in each dimension), using the same bit budget simply means that an increased number of bits can be assigned to each 8-by-8 image blocks, allowing more DCT coefficients to be included in the encoding process. It is intuitively clear that the above step shall help reduce the blocking effects. In addition, the interpolative up-sampling as
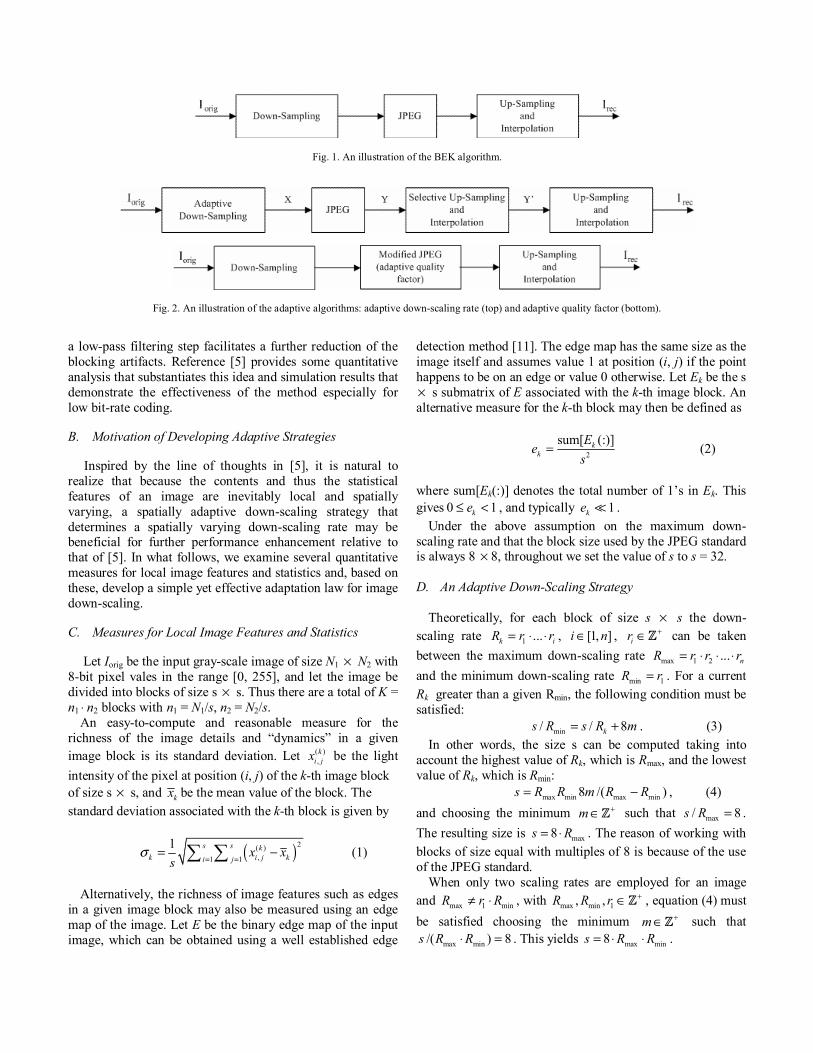
Fig. 1. An illustration of the BEK algorithm.
Fig. 2. An illustration of the adaptive algorithms: adaptive down-scaling rate (top) and adaptive quality factor (bottom). a low-pass filtering step facilitates a further reduction of the blocking artifacts. Reference [5] provides some quantitative analysis that substantiates this idea and simulation results that demonstrate the effectiveness of the method especially for low bit-rate coding. B. Motivation of Developing Adaptive Strategies Inspired by the line of thoughts in [5], it is natural to realize that because the contents and thus the statistical features of an image are inevitably local and spatially varying, a spatially adaptive down-scaling strategy that determines a spatially varying down-scaling rate may be beneficial for further performance enhancement relative to that of [5]. In what follows, we examine several quantitative measures for local image features and statistics and, based on these, develop a simple yet effective adaptation law for image down-scaling. C. Measures for Local Image Features and Statistics Let Iorig be the input gray-scale image of size N1 × N2 with 8-bit pixel vales in the range [0, 255], and let the image be divided into blocks of size s × s. Thus there are a total of K = n1 ⋅ n2 blocks with n1 = N1/s, n2 = N2/s. An easy-to-compute and reasonable measure for the richness of the image details and “dynamics” in a given image block is its standard deviation. Let ( )
,k
i jx be the light intensity of the pixel at position (i, j) of the k-th image block of size s × s, and kx be the mean value of the block. The standard deviation associated with the k-th block is given by
( )2( ),1 1
1 s s kk i j ki j
x xs
σ= =
= −∑ ∑ (1)
Alternatively, the richness of image features such as edges in a given image block may also be measured using an edge map of the image. Let E be the binary edge map of the input image, which can be obtained using a well established edge
detection method [11]. The edge map has the same size as the image itself and assumes value 1 at position (i, j) if the point happens to be on an edge or value 0 otherwise. Let Ek be the s × s submatrix of E associated with the k-th image block. An alternative measure for the k-th block may then be defined as
2
sum[ (:)]kk
Ee
s= (2)
where sum[Ek(:)] denotes the total number of 1’s in Ek. This gives 0 1ke≤ < , and typically 1ke . Under the above assumption on the maximum down-scaling rate and that the block size used by the JPEG standard is always 8 × 8, throughout we set the value of s to s = 32. D. An Adaptive Down-Scaling Strategy Theoretically, for each block of size s × s the down-scaling rate 1 ...k iR r r= ⋅ ⋅ , [1, ]i n∈ , ir
+∈Z can be taken between the maximum down-scaling rate max 1 2 ... nR r r r= ⋅ ⋅ ⋅ and the minimum down-scaling rate min 1R r= . For a current Rk greater than a given Rmin, the following condition must be satisfied: min/ / 8ks R s R m= + . (3) In other words, the size s can be computed taking into account the highest value of Rk, which is Rmax, and the lowest value of Rk, which is Rmin: max min max min8 /( )s R R m R R= − , (4) and choosing the minimum m +∈Z such that max/ 8s R = . The resulting size is max8s R= ⋅ . The reason of working with blocks of size equal with multiples of 8 is because of the use of the JPEG standard. When only two scaling rates are employed for an image and max 1 minR r R≠ ⋅ , with max min 1, ,R R r +∈Z , equation (4) must be satisfied choosing the minimum m +∈Z such that
max min/( ) 8s R R⋅ = . This yields max min8s R R= ⋅ ⋅ .
For the sake of description simplicity, throughout we assume that maximum and minimum down-scaling rates are
max 4R = and min 2R = , respectively, with 1 2 2r r= = . This gives s = 32. The down-scaling strategy we propose consists of three steps: (i) Divide the input image into K blocks of size 32 × 32 and compute their standard deviations as , 1,...,k k Kσ = . (ii) For k = 1, 2, …, K, down-sample the k-th block either by a factor of 2 or 4, depending on whether or not kσ exceeds a pre-calculated threshold δ . The use of a larger threshold δ yields more blocks to be down-sampled by 4. The value of δ may be determined as, for example, a certain fraction of the standard deviation of the entire input image. (iii) In case the k-th block is down-sampled by 2, then a block of size 16 × 16 is produced. In case it is down-sampled by 4, a block of size 8 × 8 is generated. This block is then embedded into the upper-left quarter of a block of size 16 × 16, where the pixel values in all other 3 quarters are set to constant 128. In this way, the size of the down-scaled image, denoted by X (see Fig. 2 (top) and Fig. 3 (b)), is always equal to N1/2 × N2/2. The reason to use a constant value of 128 in the second case is that in the subsequent application of JPEG compression, the down-scaled image will be divided into blocks of size 8 × 8 and each block will first be leveled off by subtracting 128 from its entries [11]. Consequently, a contant-128 block becomes an all-zero block, requiring a negligible number of bits to code.
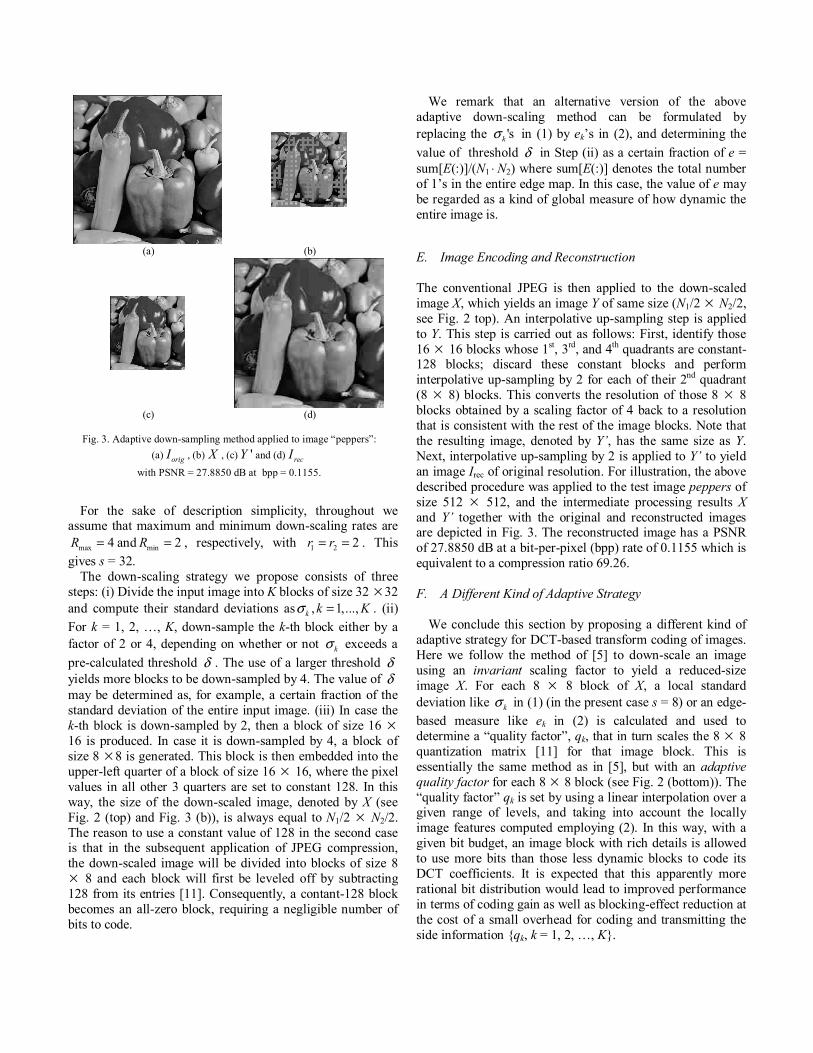
We remark that an alternative version of the above adaptive down-scaling method can be formulated by replacing the 'skσ in (1) by ek’s in (2), and determining the value of threshold δ in Step (ii) as a certain fraction of e = sum[E(:)]/(N1 ⋅ N2) where sum[E(:)] denotes the total number of 1’s in the entire edge map. In this case, the value of e may be regarded as a kind of global measure of how dynamic the entire image is. E. Image Encoding and Reconstruction The conventional JPEG is then applied to the down-scaled image X, which yields an image Y of same size (N1/2 × N2/2, see Fig. 2 top). An interpolative up-sampling step is applied to Y. This step is carried out as follows: First, identify those 16 × 16 blocks whose 1st, 3rd, and 4th quadrants are constant-128 blocks; discard these constant blocks and perform interpolative up-sampling by 2 for each of their 2nd quadrant (8 × 8) blocks. This converts the resolution of those 8 × 8 blocks obtained by a scaling factor of 4 back to a resolution that is consistent with the rest of the image blocks. Note that the resulting image, denoted by Y’, has the same size as Y. Next, interpolative up-sampling by 2 is applied to Y’ to yield an image Irec of original resolution. For illustration, the above described procedure was applied to the test image peppers of size 512 × 512, and the intermediate processing results X and Y’ together with the original and reconstructed images are depicted in Fig. 3. The reconstructed image has a PSNR of 27.8850 dB at a bit-per-pixel (bpp) rate of 0.1155 which is equivalent to a compression ratio 69.26. F. A Different Kind of Adaptive Strategy We conclude this section by proposing a different kind of adaptive strategy for DCT-based transform coding of images. Here we follow the method of [5] to down-scale an image using an invariant scaling factor to yield a reduced-size image X. For each 8 × 8 block of X, a local standard deviation like kσ in (1) (in the present case s = 8) or an edge-based measure like ek in (2) is calculated and used to determine a “quality factor”, qk, that in turn scales the 8 × 8 quantization matrix [11] for that image block. This is essentially the same method as in [5], but with an adaptive quality factor for each 8 × 8 block (see Fig. 2 (bottom)). The “quality factor” qk is set by using a linear interpolation over a given range of levels, and taking into account the locally image features computed employing (2). In this way, with a given bit budget, an image block with rich details is allowed to use more bits than those less dynamic blocks to code its DCT coefficients. It is expected that this apparently more rational bit distribution would lead to improved performance in terms of coding gain as well as blocking-effect reduction at the cost of a small overhead for coding and transmitting the side information {qk, k = 1, 2, …, K}.
(a) (b)
(c) (d)
Fig. 3. Adaptive down-sampling method applied to image “peppers”: (a) origI , (b) X , (c) 'Y and (d) recI
with PSNR = 27.8850 dB at bpp = 0.1155.
III. EXPERIMENTAL RESULTS In this section, we present simulation results obtained by applying the adaptive down-scaling techniques proposed in Section II to several natural images. For the sake of clarity, in what follows we refer the adaptive technique described in Sec. II.D and E to as Method 1, and refer the technique sketched in Sec. II.F to as Method 2. As will be seen below, Method 1 was found especially effective for large-size images while Method 2 turned out to work for both medium and large size images but with only moderate performance gain relative to that of Method 1. A. Simulation Results for Method 1 Method 1 was evaluated by applying it to six test images of size 1920 × 2592 which is considerably larger than the typical image size of 512 × 512. For all images, a separable
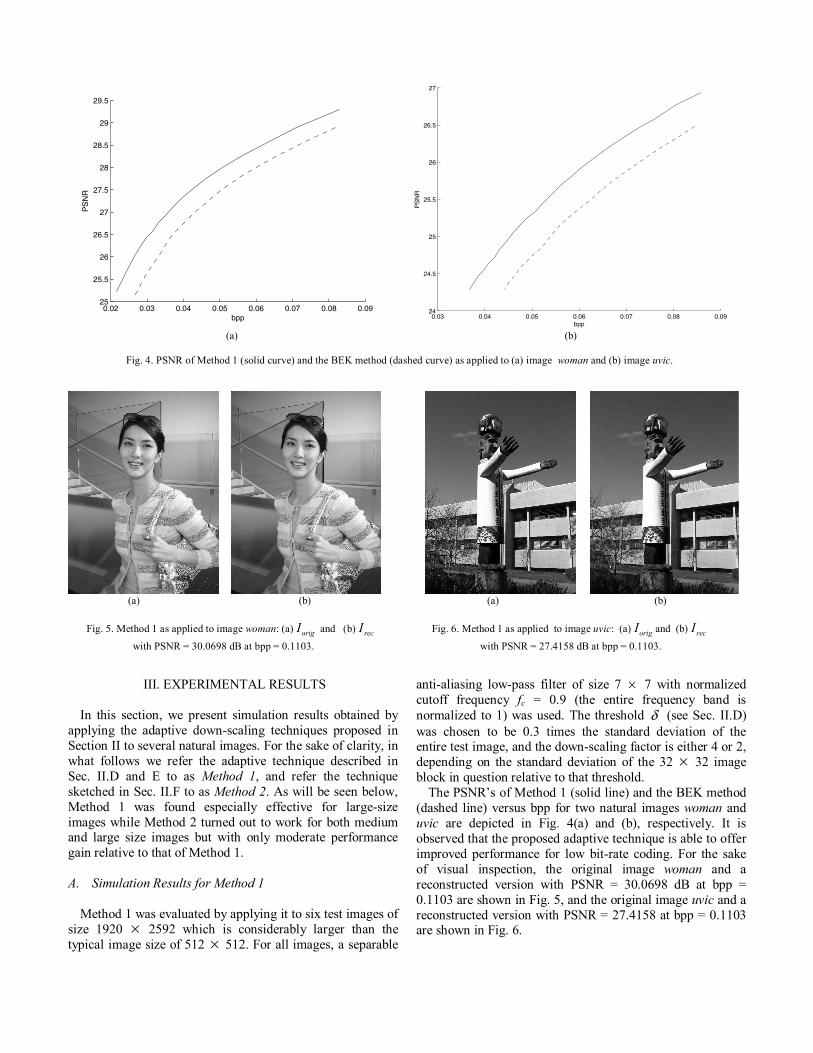
anti-aliasing low-pass filter of size 7 × 7 with normalized cutoff frequency fc = 0.9 (the entire frequency band is normalized to 1) was used. The threshold δ (see Sec. II.D) was chosen to be 0.3 times the standard deviation of the entire test image, and the down-scaling factor is either 4 or 2, depending on the standard deviation of the 32 × 32 image block in question relative to that threshold. The PSNR’s of Method 1 (solid line) and the BEK method (dashed line) versus bpp for two natural images woman and uvic are depicted in Fig. 4(a) and (b), respectively. It is observed that the proposed adaptive technique is able to offer improved performance for low bit-rate coding. For the sake of visual inspection, the original image woman and a reconstructed version with PSNR = 30.0698 dB at bpp = 0.1103 are shown in Fig. 5, and the original image uvic and a reconstructed version with PSNR = 27.4158 at bpp = 0.1103 are shown in Fig. 6.
0.02 0.03 0.04 0.05 0.06 0.07 0.08 0.0925
25.5
26
26.5
27
27.5
28
28.5
29
29.5
bpp
PS
NR
0.03 0.04 0.05 0.06 0.07 0.08 0.09
24
24.5
25
25.5
26
26.5
27
bpp
PS
NR
(a)
(b)
Fig. 4. PSNR of Method 1 (solid curve) and the BEK method (dashed curve) as applied to (a) image woman and (b) image uvic.
(a) (b) (a) (b)
Fig. 5. Method 1 as applied to image woman: (a) origI and (b) recI
with PSNR = 30.0698 dB at bpp = 0.1103.
Fig. 6. Method 1 as applied to image uvic: (a) origI and (b) recI
with PSNR = 27.4158 dB at bpp = 0.1103.
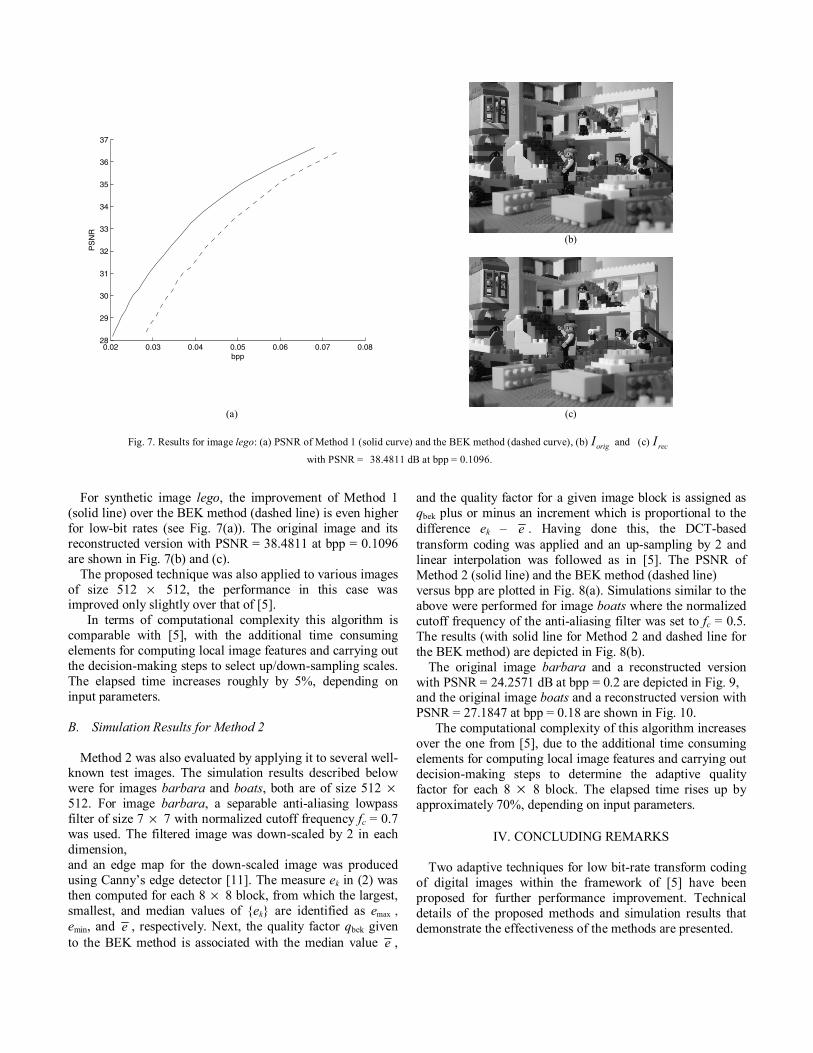
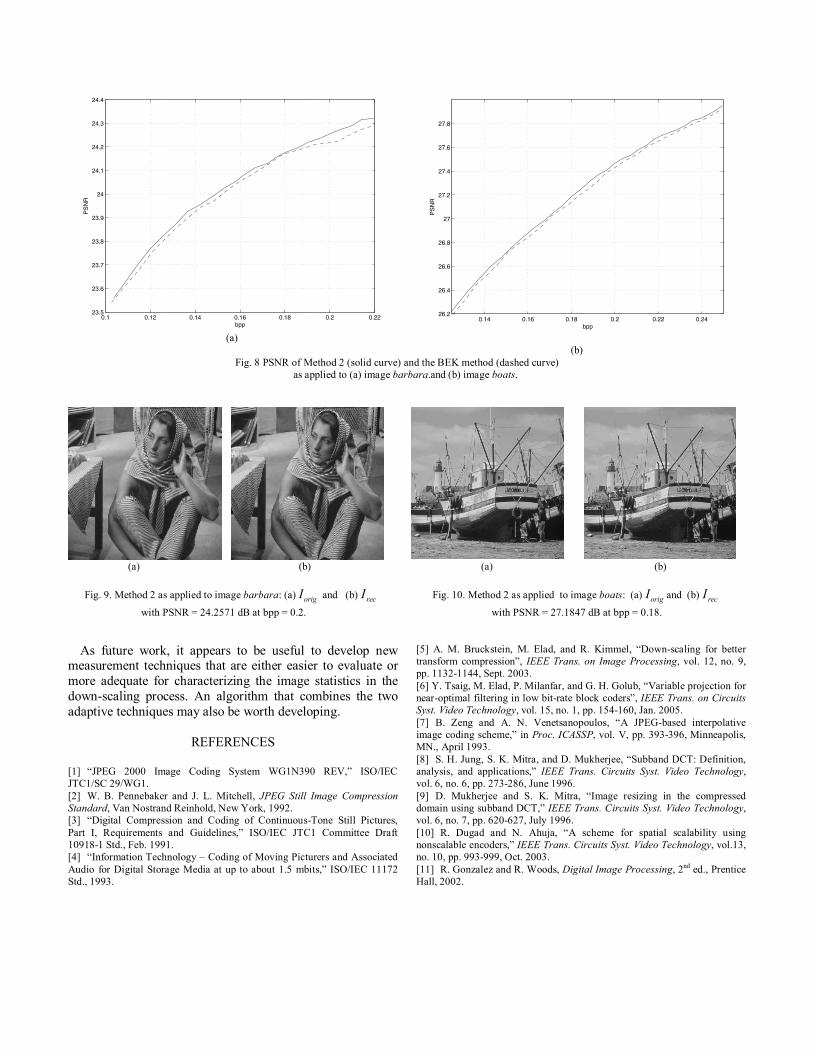
For synthetic image lego, the improvement of Method 1 (solid line) over the BEK method (dashed line) is even higher for low-bit rates (see Fig. 7(a)). The original image and its reconstructed version with PSNR = 38.4811 at bpp = 0.1096 are shown in Fig. 7(b) and (c). The proposed technique was also applied to various images of size 512 × 512, the performance in this case was improved only slightly over that of [5]. In terms of computational complexity this algorithm is comparable with [5], with the additional time consuming elements for computing local image features and carrying out the decision-making steps to select up/down-sampling scales. The elapsed time increases roughly by 5%, depending on input parameters. B. Simulation Results for Method 2 Method 2 was also evaluated by applying it to several well-known test images. The simulation results described below were for images barbara and boats, both are of size 512 × 512. For image barbara, a separable anti-aliasing lowpass filter of size 7 × 7 with normalized cutoff frequency fc = 0.7 was used. The filtered image was down-scaled by 2 in each dimension, and an edge map for the down-scaled image was produced using Canny’s edge detector [11]. The measure ek in (2) was then computed for each 8 × 8 block, from which the largest, smallest, and median values of {ek} are identified as emax , emin, and e , respectively. Next, the quality factor qbek given to the BEK method is associated with the median value e ,
and the quality factor for a given image block is assigned as qbek plus or minus an increment which is proportional to the difference ek – e . Having done this, the DCT-based transform coding was applied and an up-sampling by 2 and linear interpolation was followed as in [5]. The PSNR of Method 2 (solid line) and the BEK method (dashed line) versus bpp are plotted in Fig. 8(a). Simulations similar to the above were performed for image boats where the normalized cutoff frequency of the anti-aliasing filter was set to fc = 0.5. The results (with solid line for Method 2 and dashed line for the BEK method) are depicted in Fig. 8(b). The original image barbara and a reconstructed version with PSNR = 24.2571 dB at bpp = 0.2 are depicted in Fig. 9, and the original image boats and a reconstructed version with PSNR = 27.1847 at bpp = 0.18 are shown in Fig. 10. The computational complexity of this algorithm increases over the one from [5], due to the additional time consuming elements for computing local image features and carrying out decision-making steps to determine the adaptive quality factor for each 8 × 8 block. The elapsed time rises up by approximately 70%, depending on input parameters.
IV. CONCLUDING REMARKS
Two adaptive techniques for low bit-rate transform coding of digital images within the framework of [5] have been proposed for further performance improvement. Technical details of the proposed methods and simulation results that demonstrate the effectiveness of the methods are presented.
(b)
0.02 0.03 0.04 0.05 0.06 0.07 0.0828
29
30
31
32
33
34
35
36
37
bpp
PS
NR
(a)
(c)
Fig. 7. Results for image lego: (a) PSNR of Method 1 (solid curve) and the BEK method (dashed curve), (b) origI and (c) recI
with PSNR = 38.4811 dB at bpp = 0.1096.
As future work, it appears to be useful to develop new measurement techniques that are either easier to evaluate or more adequate for characterizing the image statistics in the down-scaling process. An algorithm that combines the two adaptive techniques may also be worth developing.
REFERENCES
[1] “JPEG 2000 Image Coding System WG1N390 REV,” ISO/IEC JTC1/SC 29/WG1. [2] W. B. Pennebaker and J. L. Mitchell, JPEG Still Image Compression Standard, Van Nostrand Reinhold, New York, 1992. [3] “Digital Compression and Coding of Continuous-Tone Still Pictures, Part I, Requirements and Guidelines,” ISO/IEC JTC1 Committee Draft 10918-1 Std., Feb. 1991. [4] “Information Technology – Coding of Moving Picturers and Associated Audio for Digital Storage Media at up to about 1.5 mbits,” ISO/IEC 11172 Std., 1993.
[5] A. M. Bruckstein, M. Elad, and R. Kimmel, “Down-scaling for better transform compression”, IEEE Trans. on Image Processing, vol. 12, no. 9, pp. 1132-1144, Sept. 2003. [6] Y. Tsaig, M. Elad, P. Milanfar, and G. H. Golub, “Variable projection for near-optimal filtering in low bit-rate block coders”, IEEE Trans. on Circuits Syst. Video Technology, vol. 15, no. 1, pp. 154-160, Jan. 2005. [7] B. Zeng and A. N. Venetsanopoulos, “A JPEG-based interpolative image coding scheme,” in Proc. ICASSP, vol. V, pp. 393-396, Minneapolis, MN., April 1993. [8] S. H. Jung, S. K. Mitra, and D. Mukherjee, “Subband DCT: Definition, analysis, and applications,” IEEE Trans. Circuits Syst. Video Technology, vol. 6, no. 6, pp. 273-286, June 1996. [9] D. Mukherjee and S. K. Mitra, “Image resizing in the compressed domain using subband DCT,” IEEE Trans. Circuits Syst. Video Technology, vol. 6, no. 7, pp. 620-627, July 1996. [10] R. Dugad and N. Ahuja, “A scheme for spatial scalability using nonscalable encoders,” IEEE Trans. Circuits Syst. Video Technology, vol.13, no. 10, pp. 993-999, Oct. 2003. [11] R. Gonzalez and R. Woods, Digital Image Processing, 2nd ed., Prentice Hall, 2002.
0.1 0.12 0.14 0.16 0.18 0.2 0.2223.5
23.6
23.7
23.8
23.9
24
24.1
24.2
24.3
24.4
bpp
PS
NR
0.14 0.16 0.18 0.2 0.22 0.2426.2
26.4
26.6
26.8
27
27.2
27.4
27.6
27.8
bpp
PS
NR
(a)
(b) Fig. 8 PSNR of Method 2 (solid curve) and the BEK method (dashed curve)
as applied to (a) image barbara.and (b) image boats.
(a) (b) (a) (b)
Fig. 9. Method 2 as applied to image barbara: (a) origI and (b) recI
with PSNR = 24.2571 dB at bpp = 0.2.
Fig. 10. Method 2 as applied to image boats: (a) origI and (b) recI
with PSNR = 27.1847 dB at bpp = 0.18.