Embed Size (px)
Citation preview

ADAPTATION TO SEA-LEVEL RISE IN NORTH CAROLINA
By Martina L. McPherson
Date:________________ Approved: _________________________ Dr. Patrick N. Halpin, Advisor
Masters project submitted in partial fulfillment of the requirements for the Master of Environmental Management degree in
the Nicholas School of the Environment of Duke University
2009

Adaptation to Sea-Level Rise in North Carolina i
ABSTRACT
Sea-level rise (SLR) predicted for the Mid-Atlantic U.S. is expected to be greater than
worldwide averages forecast by the Intergovernmental Panel on Climate Change (IPCC) in 2007.
In North Carolina, sea level is expected to rise between 0.3 and 1.1 meters within the next
century. SLR is anticipated to exacerbate erosion, storm surges, storm intensity, and more
directly, inundate land. North Carolina’s well-established coastal zone management program is
fully capable of developing a response strategy to SLR within the existing framework of the
local land use plan. This study examines the various coastal laws and policies affecting the North
Carolina coastal zone and takes a closer look at some of the current management challenges,
many of which will be aggravated by SLR. The study presents a potential starting point for local
adaptation to SLR by looking at a case study of the Town of Morehead City. The land use plan
for Morehead City was used as a framework for developing a flexible SLR response toolbox.
Although development of a SLR toolbox for communities at the local level will increase SLR
adaptation capacity, there are still obstacles to be overcome, including the weakened role of land
use plans, and the fragmented approach to SLR planning in North Carolina.

Adaptation to Sea-Level Rise in North Carolina ii
TABLE OF CONTENTS
ABSTRACT.................................................................................................................................... i LIST OF ACRONYMS ............................................................................................................... iv LIST OF FIGURES ..................................................................................................................... vi LIST OF TABLES ...................................................................................................................... vii INTRODUCTION......................................................................................................................... 1 CHAPTER 1: North Carolina Coastal Laws and Policies ........................................................ 3
1.1 Coastal Landscape in North Carolina......................................................................... 3 Natural Disturbance ............................................................................................................... 4 Natural Processes ................................................................................................................... 6
1.2 Federal Coastal Law ..................................................................................................... 7 Coastal Zone Management Act (1972) ................................................................................... 7
1.3 North Carolina Coastal Law and Policies .................................................................. 8 CAMA and the CRC ................................................................................................................ 8 Division of Coastal Management............................................................................................ 8 The Coastal Habitat Protection Plan ..................................................................................... 9 Beach and Inlet Management Plan....................................................................................... 10 Legislative Commission on Global Climate Change ............................................................ 10 Ocean Policy Steering Committee ........................................................................................ 11
1.4 CAMA Land Use Plans .............................................................................................. 11 1.5 Flood Insurance and Hazard Planning ..................................................................... 15 1.6 Sea-Level Rise Policy Development in North Carolina ........................................... 18
CHAPTER 2: Current Coastal Challenges in North Carolina .............................................. 20 2.1 Current Challenges in the North Carolina Coastal Zone ....................................... 20
Structure Loss on Barrier Islands......................................................................................... 20 Beach Plan ............................................................................................................................ 26 Dredging ............................................................................................................................... 27 Wetland Loss ......................................................................................................................... 29 Stormwater Runoff ................................................................................................................ 31
2.2 Sea-Level Rise.............................................................................................................. 33 Estimates ............................................................................................................................... 33 SLR in North Carolina .......................................................................................................... 35 SLR in the Estuaries.............................................................................................................. 36 Policy Responses................................................................................................................... 37
CHAPTER 3: Adaptation to Sea-Level Rise: A Case Study................................................... 40 3.1 Introduction to Morehead City, North Carolina ..................................................... 42
Historical Morehead City ..................................................................................................... 42 Morehead City Today ........................................................................................................... 44 Natural Features and Processes ........................................................................................... 47
3.2 First Steps in Adapting to Sea-Level Rise................................................................. 52 3.3 Methods........................................................................................................................ 53
Data....................................................................................................................................... 53 Analysis ................................................................................................................................. 57
3.4 Results .......................................................................................................................... 65

Adaptation to Sea-Level Rise in North Carolina iii
Overview of SLR Effects........................................................................................................ 65 SLR Response Toolbox.......................................................................................................... 70
3.5 Discussion..................................................................................................................... 77 3.6 Recommendations ....................................................................................................... 84
State Leadership.................................................................................................................... 84 Role of Local Land Use Plan ................................................................................................ 86 Flexible Planning Options .................................................................................................... 88 Funding ................................................................................................................................. 88
CHAPTER 4: Conclusions ......................................................................................................... 90 ACKNOWLEDGMENTS .......................................................................................................... 93 REFERENCES............................................................................................................................ 94 APPENDIX ................................................................................................................................ 106

Adaptation to Sea-Level Rise in North Carolina iv
LIST OF ACRONYMS
Acronym Full name
North Carolina Agencies, Committees, Organizations
AIWW Atlantic Intracoastal Waterway
BIMP Beach and Inlet Management Plan
CAMA Coastal Area Management Act
CAPAG Climate Change Action Plan Advisory Group
CELP Coastal and Estuarine Lands Conservation Program
CHPP Coastal Habitat Protection Plan
CRAC Coastal Resources Advisory Council
CRC Coastal Resources Commission
CWMTF Clean Water Management Trust Fund
DCM Division of Coastal Management
DEM Division of Emergency Management
DENR Department of Environment and Natural Resources
DMF Division of Marine Fisheries
DWQ Division of Water Quality
EMC Environmental Management Commission
EWG Estuarine Working Group
NCAC North Carolina Administrative Code
NCCF North Carolina Coastal Federation
NCCR North Carolina Coastal Reserve Program
NCFMP North Carolina Flood Mapping Program
NCIUA North Carolina Insurance underwriting Association
OPSC Ocean Policy Steering Committee
Federal
CBRA Coastal Barrier Resources Act
CCSP U.S. Climate Change Science Program
COE U.S. Army Corps of Engineers
CZMA Coastal Zone Management Act
EPA Environmental Protection Agency
FEMA Federal Emergency Management Agency
HMGP Hazard Mitigation Grant Program
NFIP National Flood Insurance Program
NOAA National Oceanic and Atmospheric Administration
NPS National Park Service
OMB Office of Management and Budget
Miscellaneous
AEC Area of Environmental Concern

Adaptation to Sea-Level Rise in North Carolina v
ATM Applied Technology and Management (Coastal Engineering Firm)
CRS Community Rating System
DEM Digital Elevation Model
ETJ Extraterritorial Jurisdiction
GIS Geographic Information System
HQW SA High Quality Shellfishing Waters
IPCC Intergovernmental Panel on Climate Change
ISCC International Scientific Congress on Climate Change
LID Low Impact Development
LIDAR Light Detection and Ranging
LUP Land use plan
MGD Million Gallons per Day
PCI Property Casualty Insurers Association of America
SLR Sea-level rise
TNC The Nature Conservancy

Adaptation to Sea-Level Rise in North Carolina vi
LIST OF FIGURES
Figure 1.1 Map of coastal North Carolina with the Northern and Southern geologic boundary marked Figure 1.2 Peatland fires burn along the North Carolina coast, June 2008. Figure 1.3 Components of local land use plans as laid out by the DCM 2002 Technical Manual for Coastal Land Use Planning Figure 2.1 Four years after being condemned, the town of North Topsail removes structures from the beach Figure 2.2a and 2.2b. Annual averages of the global mean sea level (mm) from IPCC (2007). Figure 2.3. North Carolina is one of seven states that experienced 26-30 disaster events 1980-2008 Figure 2.4 North Carolina coastal land inundation Figure 3.1 Study Area Figure 3.2a and 3.2b Population growth and predicted growth in Morehead City, ETJ, and Carteret County Figure 3.3 Study area Figure 3.5 Downtown Morehead City under six inundation scenarios. Figure 3.6 Morehead City: 0.16 m, 0.46 m, and 1.06 m inundation scenarios Figure 3.7 Morehead City Future Land Suitability Plan 1 Figure 3.8 Morehead City Future Land Suitability Plan 2 Figure 3.8 Morehead City Future Land Suitability Plan 3 Figure 3.10 Morehead City Vacant Land Parcels by Neighborhood Figure 3.11 Marsh planting as vegetation control (left) and one year later (right) Figure 3.12 View of a rubble mound sill (left) and a timber sheet pile sill (right) Figure 3.13 Sloped structures constructed from rock (left) and watertight cast concrete (right)
Adaptation to Sea-Level Rise in North Carolina vii
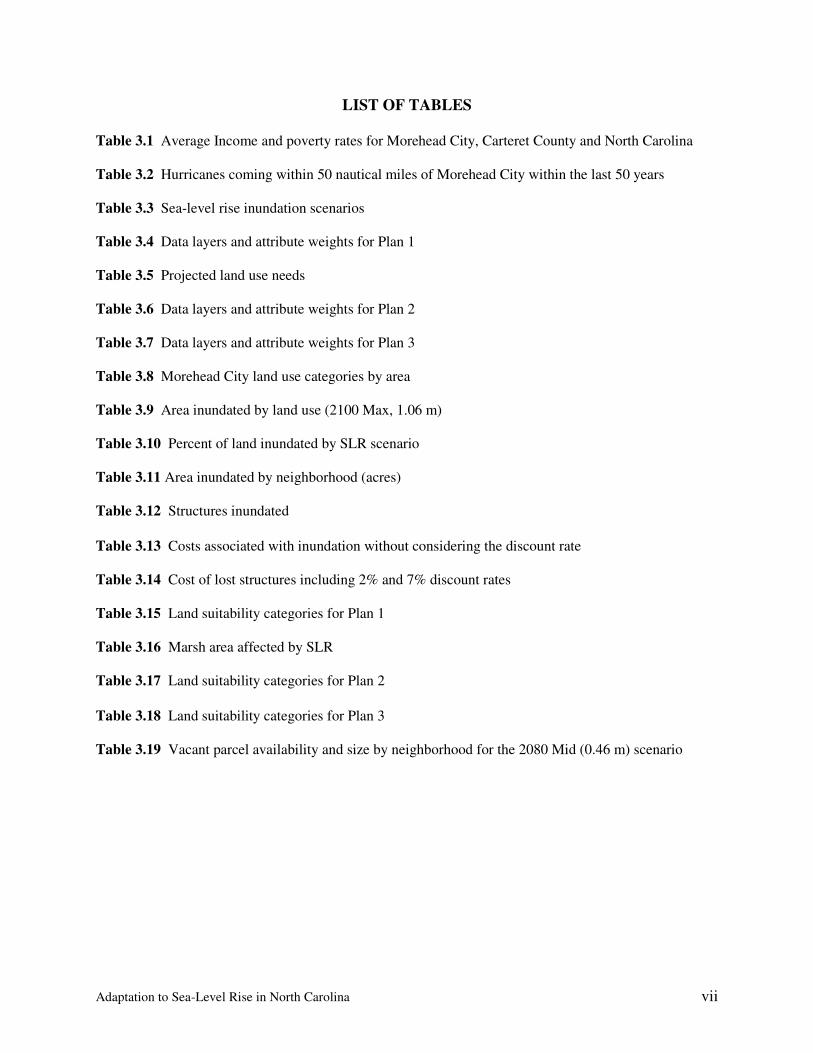
LIST OF TABLES
Table 3.1 Average Income and poverty rates for Morehead City, Carteret County and North Carolina Table 3.2 Hurricanes coming within 50 nautical miles of Morehead City within the last 50 years
Table 3.3 Sea-level rise inundation scenarios Table 3.4 Data layers and attribute weights for Plan 1 Table 3.5 Projected land use needs Table 3.6 Data layers and attribute weights for Plan 2 Table 3.7 Data layers and attribute weights for Plan 3 Table 3.8 Morehead City land use categories by area Table 3.9 Area inundated by land use (2100 Max, 1.06 m) Table 3.10 Percent of land inundated by SLR scenario Table 3.11 Area inundated by neighborhood (acres) Table 3.12 Structures inundated
Table 3.13 Costs associated with inundation without considering the discount rate Table 3.14 Cost of lost structures including 2% and 7% discount rates Table 3.15 Land suitability categories for Plan 1 Table 3.16 Marsh area affected by SLR Table 3.17 Land suitability categories for Plan 2
Table 3.18 Land suitability categories for Plan 3 Table 3.19 Vacant parcel availability and size by neighborhood for the 2080 Mid (0.46 m) scenario

Adaptation to Sea-Level Rise in North Carolina 1
INTRODUCTION
As adaptation and mitigation begin to share the spotlight as response strategies to climate
change, it will be prudent for policymakers, local and state governments, planners, and scientists
to start addressing adaptive management of sea-level rise in coastal communities. Sea-level rise
(SLR) in the next 20-50 years has the potential to affect over 50% of the United States
population. In addition to the threat on the built environment, SLR will affect natural systems in
the critical transitional zone between marine and terrestrial environments.
A recent EPA report (2009) suggests the Mid-Atlantic region will experience some of the
highest rates of SLR in the world. This and similar findings (Douglas and Peltier, 2002) present
an opportunity for Mid-Atlantic States to demonstrate to the country and the world how to
effectively adapt to SLR.
North Carolina in particular is poised to adopt SLR adaptation strategies (Poulter et al.,
2008). Over twenty years of state coastal policy banning hardened structures along the
oceanfront is currently being debated by the state legislature as the result of the growing number
of threatened structures and limited success of sandbagging and beach nourishment projects.
Meanwhile, estuarine shorelines face a different set of challenges related to hardened structures
squeezing out critical wetland habitats and the negative effects of stormwater.
Both estuarine and beach shorelines will face challenges with SLR and expanding
development. This study provides background information on current coastal policies and laws
in North Carolina, as well as information on the growing challenges in the coastal zone. The
Morehead City case study will reveal how a coastal community can take the first steps in
managing for SLR using the framework of the local land use plan.

Adaptation to Sea-Level Rise in North Carolina 2
Chapter 1 provides an overview of coastal policy and law in both the U.S. and North
Carolina. The chapter begins with an introduction to the North Carolina coastal landscape and
the natural processes occurring there. It continues with a brief review of federal coastal policy,
followed by a more detailed description of North Carolina coastal policy and law.
Chapter 2 addresses current coastal challenges facing North Carolina policymakers and
local communities, including endangered structures, habitat loss, and SLR.
Chapter 3 examines possible responses to the challenge of sea-level rise. A case study of
the Town of Morehead City, N.C. looks at potential policy responses at the local level. Using
SLR inundation scenarios provided by Benjamin Poulter (Potsdam Institute for Climate Impact
Research) and land use data from the Town of Morehead City, the foundation for a SLR
response toolbox was created. The chapter concludes with recommendations to ensure successful
implementation of the SLR toolbox into the local land use plan.
Chapter 4 summarizes the main points of the analysis and presents the conclusion.

Adaptation to Sea-Level Rise in North Carolina 3
CHAPTER 1
North Carolina Coastal Laws and Policies
Chapter 1 provides an overview of coastal policy and law in both the U.S. and North
Carolina. The chapter begins with an introduction to the North Carolina coastal landscape and
the natural features and processes shaping it. Following will be a detailed description of North
Carolina coastal policy and law. This section describes the agencies, reports, and rules relevant
to SLR and takes a closer look at the role land use planning and flood insurance plays along the
North Carolina coast. The chapter concludes with some of the challenges faced in developing a
SLR adaptation policy.
1.1 Coastal Landscape in North Carolina
North Carolina’s coastal plain is composed of a diverse array of ecosystems; swamps,
barrier islands, rivers, and estuaries occupy 325 miles of ocean shoreline and over 3,000 miles of
estuarine shoreline. The geology of the coast is divisible into two provinces, with the boundary
between North and South occurring at Cape Lookout (Riggs et al., 1995). Natural features in
these two provinces are shaped by different natural disturbances. The Northern Province,
composed of Quaternary geologic materials, is typified by gentle shore faces and long barrier
islands which help protect the second largest estuarine system in the U.S., the Albemarle-
Pamlico Estuary (Figure 1.1). The Southern Province is dominated by older Tertiary and
Cretaceous units and is characterized by short barrier islands, numerous inlets systems (eighteen
total), and a narrower sound between the estuarine shoreline and barrier islands (Riggs, et al.,
2008).

Adaptation to Sea-Level Rise in North Carolina 4
Figure 1.1 Map of coastal North Carolina and the boundary between the Northern and Southern geologic units Source: Riggs, 2008; Institute for Marine Remote Sensing of the College of Marine Science, University of South Florida.
Natural Disturbance
The two coastal zones are affected differently by disturbances. The Northern unit is hit
more frequently by nor-easters while the Southern unit bears the brunt of less frequent but higher
intensity hurricanes and tropical storms (Riggs et al., 2008). Since 1960, fourteen hurricanes
have made direct landfall along the North Carolina coast, and eleven of those storms were
category 3 or greater (NOAA, 2008). Although storms are destructive events for a developed
shoreline, they are responsible for many of the unique natural features found along the North
Carolina coast. Barrier islands formed approximately 3,500 years ago and have been
continuously altered by the opening and closing of inlets due to storms (Riggs et al., 2008).
Storm events are considered part of the barrier island life cycle and are responsible for creating
new inlets, overwashing sediment, and with larger storm events, completely washing out islands.

Adaptation to Sea-Level Rise in North Carolina 5
With extensive human settlement of the coast and barrier islands over the last few decades, the
natural environment’s response to hurricanes and storms has changed. Hardened structures, inlet
dredging, beach nourishment, beach scraping, and wetland destruction are all activities changing
the effects of storms on the coast. These activities will be discussed in greater detail in Chapter 2.
One of the most dangerous effects of hurricanes and large storm events is storm surges.
Storm surges occur when powerful winds push ocean water onto the shore. When storm surges
combine with high tides, water levels can reach 15 feet higher than normal sea level (National
Hurricane Center, 2007). In 1999, Hurricane Floyd produced a 10 ft storm surge along parts of
the North Carolina coast and dropped 15-20 inches of rain. More than half of the $6 billion in
damages caused by the storm is attributed to river flooding and storm surge (National Hurricane
Center, 2006).
Fire is another naturally occurring disturbance along the NC coast that is aggravated by
anthropogenic influences, mainly agricultural ditching. In June 2008, a peatland fire ignited by
lightning burned for weeks across three northeastern counties. Ditching in the area and prolonged
drought conditions aggravated the fire, and more than 40,000 acres were burned by August 2008
(Figure 1.2; National Geographic News, 2008).
Figure 1.2 Peatland fires burn along the North Carolina coast, June 2008.
Source: http://news.nationalgeographic.com/news/bigphotos/16364713.html

Adaptation to Sea-Level Rise in North Carolina 6
Natural Processes
Natural processes in the coastal zone shape the natural and built landscape differently
than disturbances. These processes occur daily and the effects are visible over longer timescales.
Wave action and wind strength affect erosion and accretion rates along ocean-side beaches.
Alongshore transport is also responsible for accretion of sand along the oceanfront. In the
estuaries, accretion requires sediment deposited from rivers or circulated through the inlets. The
estuarine shoreline experiences erosion, but is less vulnerable to wave and wind action as
compared with the oceanfront.
Daily tidal fluxes play a large role in inlet systems where tides act as pumps, circulating
water in and out of the sound. Inlet dynamics produce much of the erosion and accretion
experienced along barrier islands. As mentioned previously, tides can exacerbate storm surges
and lead to serious flooding during storm events.
Natural processes, like disturbances, are also aggravated by anthropogenic influences.
Water cycling in the estuaries and inlet dynamics are altered by dredging and sand mining.
Dredging by the U.S. Army Corps of Engineers keeps the Atlantic Intracoastal Waterway
(AIWW) navigable and ensures ports are accessible, including the port at Morehead City.
Mining of sand from inlets for beach nourishment projects can alter inlet dynamics and actually
increase erosion or accretion along adjacent shorelines. Hardened structures are banned along the
oceanfront in North Carolina, but a few exceptions (jetties at Pea Island and Fort Macon) have
created noticeable changes in the natural patterns of erosion and accretion in down shore areas.
The challenges in managing natural processes to protect structures and infrastructure will be
discussed further in Chapter 2.

Adaptation to Sea-Level Rise in North Carolina 7
1.2 Federal Coastal Law
Coastal Zone Management Act (1972)
Throughout the 1960s the federal government grew more aware of the mounting stress
placed on the natural resources of the nation’s coastal zone (Coastal Zone Management Act,
1972). The lack of coordination amongst federal, state, and local agencies made management and
planning in the coastal zone ineffective. By 1966, Congress passed the Marine Resources and
Engineering Development Act establishing what came to be known as the Stratton Commission.
The Stratton Commission determined the growing demand on marine resources required “a plan
for national action and for orderly development of the uses of the sea.” The Commission
believed “orderly development” would not be possible without a plan for the coastal zone. They
recommended federal legislation to encourage state agency efforts in creating comprehensive
coastal plans (Stratton Report, 1969). In response to the recommendation laid out by the Stratton
Commission, the Coastal Zone Management Act was enacted by Congress in 1972.
The Coastal Zone Management Act (CZMA) provides federal funding for states to create
and administer coastal zone programs, but the states are allowed flexibility and discretion in
creating and administering their programs (Kalo et al., 2007). As amended, the CZMA addresses
sea-level rise (SLR) in the first section, Section 302, Congressional Findings, where it states, “(l)
Because global warming may result in a substantial sea level rise with serious adverse effects in
the coastal zone, coastal states must anticipate and plan for such an occurrence.” (16 U.S.C. §
1451). Section 303 declares the national policy of
(2)(C) the management of coastal development to minimize the loss of life and property caused by improper development in flood-prone, storm surge, geological hazard, and erosion-prone areas and in areas likely to be affected by or vulnerable
to sea level rise, land subsidence, and saltwater intrusion, and by the destruction of natural protective features such as beaches, dunes, wetlands, and barrier islands…(emphasis added, 16 U.S.C. § 1452)
Adaptation to Sea-Level Rise in North Carolina 8
The CZMA acknowledges SLR as a coastal hazard and requires states to plan for it and to
manage development to minimize loss of property due to SLR.
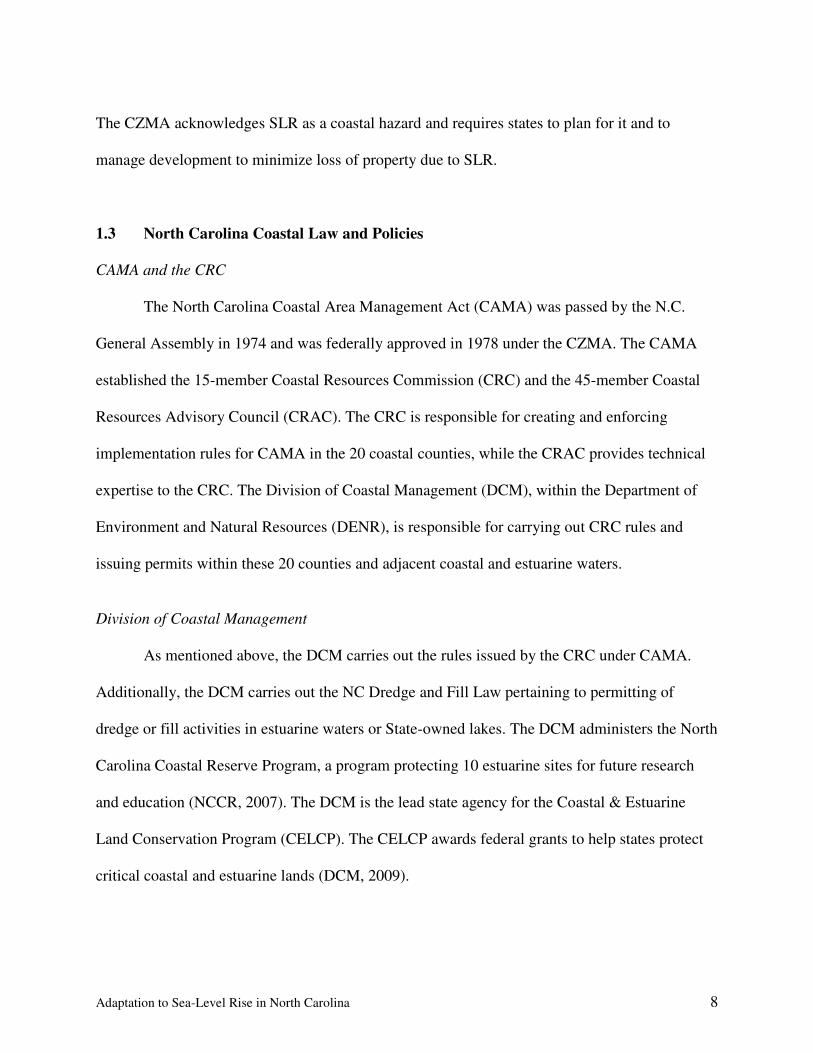
1.3 North Carolina Coastal Law and Policies
CAMA and the CRC
The North Carolina Coastal Area Management Act (CAMA) was passed by the N.C.
General Assembly in 1974 and was federally approved in 1978 under the CZMA. The CAMA
established the 15-member Coastal Resources Commission (CRC) and the 45-member Coastal
Resources Advisory Council (CRAC). The CRC is responsible for creating and enforcing
implementation rules for CAMA in the 20 coastal counties, while the CRAC provides technical
expertise to the CRC. The Division of Coastal Management (DCM), within the Department of
Environment and Natural Resources (DENR), is responsible for carrying out CRC rules and
issuing permits within these 20 counties and adjacent coastal and estuarine waters.
Division of Coastal Management
As mentioned above, the DCM carries out the rules issued by the CRC under CAMA.
Additionally, the DCM carries out the NC Dredge and Fill Law pertaining to permitting of
dredge or fill activities in estuarine waters or State-owned lakes. The DCM administers the North
Carolina Coastal Reserve Program, a program protecting 10 estuarine sites for future research
and education (NCCR, 2007). The DCM is the lead state agency for the Coastal & Estuarine
Land Conservation Program (CELCP). The CELCP awards federal grants to help states protect
critical coastal and estuarine lands (DCM, 2009).

Adaptation to Sea-Level Rise in North Carolina 9
Currently, the DCM is involved with sandbag removal efforts along oceanfront beaches.
The State of North Carolina has banned hardened structures along the ocean front for decades.
The ban was codified in 1985 (15A NCAC - 07H .0308 and - 07M .0201) and incorporated into
the State’s General Statutes in 2003 (S.L. 2003-427, Article 7, Part 3, § 113A-115.1). Sandbags
were allowed on the oceanfront to temporarily protect threatened structures from erosion for up
to five years, and an extension in 2000 allowed sandbags to remain in place in conjunction with
an active beach nourishment project. But due to the CRC granting variances through the years
and no enforcement mechanism, some property owners have had sandbags in front of their
properties for decades. The May 1, 2008 deadline for illegal sandbag removal has passed and not
a single sandbag has been removed.
The Coastal Habitat Protection Plan
The Fisheries Reform Act of 1997 included a provision requiring the CRC, along with
two other rulemaking commissions from the Division of Marine Fisheries and DENR, to create
and approve the Coastal Habitat Protection Plan (CHPP). The CHPP was designed to identify
and protect coastal habitat areas and improve the effectiveness of current programs protecting
fish habitats (Street et al., 2005). It identified SLR as a potential threat to wetlands, and
recommended identification of land for wetland migration:
Buyers and owners of coastal property should be aware of sea level rise and the potential for loss of wetlands and property. Updated and accurate coast-wide estuarine erosion rates are needed for the CRC and EMC to determine adequate development guidelines and rules along the coast (DCM 2002). Priorities for coastal wetland protection should also acknowledge sea level rise, and protect gently sloping areas upland of coastal wetlands to allow for landward migration of coastal wetlands with sea level rise (Street et al., 2005).

Adaptation to Sea-Level Rise in North Carolina 10
In 2000, the Estuarine Shoreline Stabilization Subcommittee was established by the CRC
to review the estuarine shoreline stabilization rule development process. Despite CRC rules
stating that “[w]here possible, sloping rip-rap, gabions, or vegetation shall be used rather than
vertical seawalls” (15A NCAC 07H .0208 (b)(7)(E)), “living shoreline” approaches are rarely
chosen by property owners to address erosion problems. Recommendations made by the
Biological and Physical Processes Work Group have only begun to be considered by the CRC,
who is taking steps towards more thoroughly addressing alternatives to stabilization structures
along the estuarine shore.
Beach and Inlet Management Plan
The CHPP and the Capital Improvements Appropriations Act of 2000 (N.C. H.B. 1840)
mandated the creation of a comprehensive beach and inlet management plan (BIMP) to address
some of the recommendations in the CHPP. The BIMP is a joint project between the Division of
Water Resources and the DCM. It will look at management strategies for inlets and beaches
including nourishment, dredging, storm recovery, and inlet relocation (NC DENR, 2008). The
BIMP is currently undergoing a second round of public meetings hosted by DENR. Many of the
public comments from the first round of meetings express concern over allowing hardened
structures on the oceanfront.
Legislative Commission on Global Climate Change
The N.C. General Assembly established the Legislative Commission on Global Climate
Change in 2005 to study issues related to global warming. It was mandated to study whether it
was necessary for the state to begin mitigation measures by creating a global warming pollutant
reduction goal (N.C. S.B. 1134). The Legislative Commission is not to be confused with the N.C.

Adaptation to Sea-Level Rise in North Carolina 11
Climate Change Action Plan Advisory Group, managed by the Division of Air Quality, within
DENR. The Advisory Group is tasked with making recommendations specific to mitigating
climate change (CAPAG, 2009). The Legislative Commission is addressing broader concerns,
including climate change impacts in the coastal zone (N.C. S.B. 1134, §5).
Ocean Policy Steering Committee
The Ocean Policy Steering Committee was formed in 2008 to evaluate coastal policies
and make recommendations for the future. The 13-member Committee reports to the CRC and
released a Final Draft Report for Public Comment in February 2009. The Final Draft Report
recommends developing strategies related to five emerging coastal issues: sand resource
management, ocean-based alternative energy development, ocean outfalls, marine aquaculture,
and comprehensive ocean management (OPSC, 2009). The report recommends incorporation of
a SLR component into CAMA land use plans as well as development of a coastal vulnerability
index to better assess and address emerging coastal challenges, including SLR (OPSC, 2009).
1.4 CAMA Land Use Plans
One of the CRC’s main duties is certification of local land-use plans (DCM, 2007).
CAMA requires the 20 coastal counties to submit Land Use Plans (LUPs) according to
guidelines laid out in North Carolina Administrative Code, Title 15A, Chapter 7. By 1999, each
of the 20 coastal counties had updated their plans four times, as had many municipalities.
Although not required, municipalities may opt out of the county land use plan as long as their
own land use plan is submitted and approved. Up to 85% of a county’s planning costs can be
funded through the DCM, whereas local governments are covered for up to 75% of their
planning costs (DCM, 2003).

Adaptation to Sea-Level Rise in North Carolina 12
The general objective of LUPs is to “[d]evelop policies that minimize threats to life,
property, and natural resources resulting from development located in or adjacent to hazard
areas, such as those subject to erosion, high winds, storm surge, flooding, or sea level rise”
(emphasis added; 15A NCAC 07B .0702). NCAC Chapter 7 addresses the establishment of
Areas of Environmental Concern (AECs) and refers to the N.C. General Assembly’s intentions
when passing CAMA. It indicates the importance of protecting estuarine regions and their
critical natural systems:
the coastal area, and in particular the estuaries, are among the most biologically productive regions of this state and of the nation...[it] has been subjected to increasing pressures which are the result of the often conflicting needs of society expanding in industrial development, in population, and in the recreational aspirations of its citizens. Unless these pressures are controlled by coordinated management, the very features of the coast which make it economically, aesthetically, and ecologically rich will be destroyed. (15A NCAC 07H .0102)
The land use plan is a series of policies and maps that guide a community’s growth and
natural system conservation (DCM, 2008). While the CRC is responsible for approving the
plans, the actual policies are decided on by the local community. Once the LUP is approved by
the CRC, the DCM uses the plan to guide permit decisions. In practice, LUPs have not played a
central role in ensuring the balance between conserving critical ecosystem functions while
allowing for continued development. In 2002, revisions to 15A NCAC 7B required LUPs to
include more in-depth analysis of natural systems and land suitability, as well as more extensive
policy analysis for each Management Topic (DCM, 2002). The new guidelines stressed the
importance of maintaining or enhancing water quality and added a new requirement for a land
suitability analysis which would identify land suitable for development by considering natural
system constraints (DCM, 2002).

Adaptation to Sea-Level Rise in North Carolina 13
When creating or revising a LUP, local governments or counties look to the DCM
Technical Manual (2002) for guidance. Even before applying for funds from DENR to create or
update a local land use plan, local governments must complete a scoping process involving
government officials, DCM staff, and the local governing board. If a local government receives
“CAMA funds” they must include a formal public participation plan. The citizen participation
process is directly tied into the final LUP through a “Community Concerns and Aspirations”
chapter where citizen comments on issues and concerns for each of the six Management Topics
are listed. The six Management Topics are required to be addressed within the portion of the
LUP dedicated to planning for the future. The six topics are: Public Access, Land Use
Compatibility, Infrastructure Carrying Capacity, Natural Hazard Areas, Water Quality, and
Areas of Local Concern (Figure 1.3; DCM, 2002).
Figure 1.3 Components of local land use plans as laid out by the DCM 2002 Technical Manual for Coastal Land Use Planning

Adaptation to Sea-Level Rise in North Carolina 14
Following the “Community Concerns and Aspiration” section, a LUP must contain: an
Analysis of Existing and Emerging Conditions, a Natural Systems Analysis, an Analysis of Land
Use and Development, an Analysis of Community Facilities, a Land Suitability Analysis, a
Review of Current CAMA Land Use Plan, and a Plan for the Future (Figure 1.3; DCM, 2002).
Policies on adapting to SLR would be an appropriate topic to be covered in the Plan for the
Future section. Unfortunately, LUPs rarely mention SLR as a hazard.
Although LUP guidelines have been updated to remove ambiguity and impose stricter
language, a constant complaint from stakeholders is the plans do not include enforceable policies
(J. Thayer, Manager of Planning, DCM; personal communication). For example, land use classes
in LUPs do not have operational definitions, leaving land uses like “conservation” actually
available for development. This hesitancy to solidify planning policies is reflected in the practice
of fitting LUPs to comply with town ordinances rather than using LUPs as a foundation for local
ordinance development. On a related side note, there is statutory language within the NCAC
supporting sea-level rise as a hazard to be addressed when managing the coastal zone, but there
is no reference to it in the LUP Technical Manual (DCM, 2002). Because counties and
municipalities rely on the Technical Manual for LUP creation, SLR ends up not being addressed
at the local level.
While revised funding guidelines are supposed to serve as an incentive for local
communities to implement plans, many communities do not view the LUP as a binding
document and therefore adopting a LUP does not necessarily mean the community will enforce
the contents. The First Section of Morehead City’s LUP contains a disclaimer regarding the plan
and its contents: “It should be noted, however, that the Land Use Plan is one of a variety of
guides in making a public policy decision. The Plan should be viewed as a tool to aid in decision

Adaptation to Sea-Level Rise in North Carolina 15
making and not as the final decision” (The Wooten Company, 2007). More recently LUP
funding has been reduced and a NOAA program evaluation completed in 2006 found that
“[w]ithout implementation funds and tools, the land use plans have reduced effectiveness in
shaping the local landscape in the way envisioned by the local community, especially in
communities without planning staff” (NOAA, 2006).
1.5 Flood Insurance and Hazard Planning
Improperly priced insurance along the North Carolina coast is viewed as on of the great
enablers of unsustainable development. The following section is a review of federal flood hazard
mitigation policies and how they apply to the North Carolina coast.
The Federal Insurance and Mitigation Administration (FIMA) administers the National
Flood Insurance Program (NFIP). NFIP was created in 1968 in response to major riverine flood
disasters throughout the 1920s and 1930s in the Midwest. The federal government realized the
private insurance industry could not provide flood insurance to property owners due to the low
occurrences of flood events but the high level of damage.
There are three components of the NFIP: (1) Flood insurance; (2) Floodplain
management; and (3) Flood hazard mapping (FEMA, 2002). If communities choose to
participate in NFIP, they must enforce floodplain management criteria such as establishing a
Base Flood Elevation (BFE), enforcing building elevation requirements, and requiring permits
for floodplain development (NC DEM, 2008). The goals of NFIP are: (1) require new buildings
to be protected from flooding, (2)guide development away from flood zones, and (3) transfer the
costs of flood losses onto floodplain property owners via premiums (NC DEM, 2007).

Adaptation to Sea-Level Rise in North Carolina 16
In 1994, a Community Rating System (CRS) was codified and reduced premiums for
communities that implement activities to decrease the risk of flooding (preservation of open
space, preparation of flood maps, maintaining drainage systems) (NC DEM, 2008). A 2000
FEMA study evaluated the performance of CRS activities in North Carolina communities post-
Hurricane Floyd. The study found that preserving open space in floodplains saved several
flooded communities millions of dollars. The calculated average savings to property owners who
retrofitted their homes (elevation, floodproofing, etc.) was $9,900. The study then concluded that
acquisition and relocation of floodprone properties was “more effective at reducing flood losses
than any other approach” (The Hazard Mitigation Technical Assistance Partnership, Inc., 2000).
The Robert T. Stafford Disaster Relief and Emergency Assistance Act (the Stafford Act)
was enacted in 1988 and governs the federal response to catastrophic and major disasters. The
act helps state and local governments respond to emergency situations such as hurricanes and
drought, and provide grants for mitigation activities. The Hazard Mitigation Grant Program
(HMGP) falls under Section 404 of the Stafford Act and in North Carolina it is administered by
the N.C. Department of Emergency Management (DEM). The HMGP will provide up to 75% of
funding for communities implementing long-term mitigation projects (42 U.S.C. 5170c).
Mitigation activities within § 404 have been the focus of several amendments to the
Stafford Act within the last decade. It was amended to expand the scope of mitigation activities
to include “Property Acquisition and Relocation for Open Space” (42 U.S.C. 5170c, 1999). In
addition, the Disaster Mitigation Act of 2000, another amendment to the Stafford Act, created
new state mitigation plan requirements (44 C.F.R. Part 201, 2000). A state can opt to pursue an
“enhanced” state plan to increase the amount of available funding.

Adaptation to Sea-Level Rise in North Carolina 17
North Carolina’s State Natural Hazards Mitigation Plan was accepted by FEMA in 2004.
Eleven municipalities and counties applied for HMGP funds in 1996, post-Hurricane Fran,
including the coastal counties of Carteret, Craven, New Hanover, and Pender (NC DEM, 2008).
Approximately 90 counties and municipalities are in the process of developing or updating
natural hazard mitigation plans (NC DEM, 2007). The state is hoping to incorporate the majority
of local hazard mitigation plans into the State Plan in time for the 2010 update.
In North Carolina, the Beach Plan (North Carolina Insurance Underwriting Association)
was established in 1969 as an insurer of last resort for property owners who couldn’t find
coverage from traditional private insurers. All property and casualty insurance companies
operating in North Carolina fund the Plan and share the profits or losses. In 1998, the Beach Plan
expanded coverage to 18 coastal counties for wind and hail insurance and by 2003, it was
authorized to cover homeowner policies (NCIUA, 2008).
Unfortunately, the program has become the first choice for coastal homeowners and it
currently insures 170,000 coastal properties valued at $72 billion, up from $3.6 billion in 1995
(Property Casualty Insurers Association of America [PCI], 2009). A 2008 PCI study (Milliman,
Inc., 2008) determined the Beach Plan was overstretched and would not be able to handle claims
associated with a major storm. Rate and deductible hikes have recently been approved by the
legislature to address the issue and will be imposed May 1, 2009. In addition, maximum
coverage per property under the Beach Plan will be cut in half, from $1.5 million to $750,000.
The Beach Plan will be discussed in greater detail in Chapter 2.
In 1999, coastal North Carolina suffered extensive damage during Hurricane Floyd
revealing large inaccuracies in the state’s flood maps. In 2000, with a $70 million investment, the
state began an extensive remapping program using Lidar technology. Today, all coastal counties

Adaptation to Sea-Level Rise in North Carolina 18
have been mapped and access to data has been made available online through the North Carolina
Flood Mapping Program (NCFMP). The high-resolution Lidar data has allowed more accurate
SLR inundation modeling and geospatial analysis.
Conclusion
Laws and policies pertaining to the coastal zone in North Carolina were established with
the intentions of balancing the desire for future development with the important natural features
that made and continue to make the coast a desirable place to live and visit. Overall, decision-
makers and state agencies seem to be aware of SLR, given its inclusion in several codes, reports
and committee recommendations, but there is no active enforcement of SLR-specific rules. An
example of how a local community can take a more proactive approach to SLR will be
demonstrated in Chapter 3.
1.6 Sea-Level Rise Policy Development in North Carolina
Until recently, policy-making for SLR has not been a major concern for coastal states or
the federal government. Like many other natural processes affecting the coast, SLR is only a
concern because coastal areas have become densely developed over the last few decades.
Sea-level rise faces the challenge of being a “creeping hazard” (Glantz, 1988); a long-term,
gradual process, whose affects are linked with other coastal processes such as erosion and
flooding (Moser, 2005). Much of the coastal citizenry in North Carolina believes structures are
falling into the water due to storm damage, rather than consistent erosion and sea-level rise.
Generally, human systems respond to extreme events before responding to gradual
changes in the mean (Yohe and Tol, 2002). There are coping ranges for systems in terms of their
ability to withstand change and variability due to existing resilience. For example, as will be seen

Adaptation to Sea-Level Rise in North Carolina 19
in Chapter 3, Morehead City’s establishment of a floodplain land use will allow them some
breathing room when adapting to SLR. But as Yohe and Tol (2002) point out, it is important to
understand a system’s coping range as well as understand how a coping strategy can be
expanded. For the Morehead City case study, this means expansion of the LUP to include SLR
response strategies.
Several policy windows in North Carolina opened in the late 1980s and 1990s due to
Hurricanes Hugo (1989), Bertha (1996), and Fran (1996), major coastal conferences, and
program reviews (Moser, 2005). Coastal management practitioners interviewed by Moser (2005)
suggested concerns over water quality, post-hurricane recovery, and property rights battles all
ended up outweighing SLR concerns.
North Carolina coastal policy and planning is approaching an important crossroads
(Poulter et al., 2009). Increasing concern over SLR, in particular in the Mid-Atlantic region
(Titus et al., 2009), combined with a growing movement to overturn a 20-year coastal policy of
no oceanfront hardening (Island Gazette, 2009), means the state will have to make some critical
decisions in the next few years.
Adapting to SLR, however, is not as intimidating as state and local planners would like to
believe. Adaptation will not require massive revamping of coastal management laws and policies
in North Carolina since existing statutory language and newly published reports mandate
planning for SLR. The management strategy for SLR will be similar to the planning strategies
used to address natural processes/disturbances like erosion and flooding, with the majority of
land use decisions falling onto county and municipal governments. If SLR planning is to focus
on land use decisions, it makes sense to consider the local LUP as the proper vehicle for SLR
planning.

Adaptation to Sea-Level Rise in North Carolina 20
CHAPTER 2
Current Coastal Challenges in North Carolina
After reviewing the policies and laws shaping coastal management practices in North
Carolina, Chapter 2 follows with a snapshot of the current challenges created within this
framework. North Carolina is currently facing a myriad of controversial coastal management
issues, the majority of which stem from barrier island development. Estuarine communities are
able to avoid some of the barrier island disputes related to hardened structures, but there is
nevertheless ongoing debate over what type of shore protection is best for estuary shorelines.
Additionally, development pressure is relevant to all coastal communities, estuarine and
oceanfront. Sea-level rise (SLR) is an impending challenge associated with climate change
predicted to exacerbate other challenges, such as erosion and flooding; issues both estuarine and
oceanfront communities will have to address. The challenges associated with SLR will be looked
at in greater detail at the end of this chapter.
2.1 Current Challenges in the North Carolina Coastal Zone
Structure Loss on Barrier Islands
Recent headlines from state and local news sources indicate mounting tension over
barrier island management issues in North Carolina. The dynamic nature of barrier islands does
not bode well for permanent structures and the dichotomy is the root problem for several issues
being debated within the N.C. General Assembly, CRC meetings, local town meetings,
conferences, and classrooms:
� beach nourishment/re-nourishment
� sandbags
� structure removal
� hard armoring

Adaptation to Sea-Level Rise in North Carolina 21
Beach Nourishment
Beach nourishment has occurred along the North Carolina oceanfront since the 1940s.
Prior to the hurricanes of the 1990s, only 12 miles of public beach received federally funded
nourishment. Today more than 122 miles of ocean beaches are nourished and the federal
government has pulled out of funding any new projects (although it continues to pay 50% of re-
nourishment projects) (NOAA, 2006; Riggs et al., 2008; OMB, 2007).
Beach nourishment is allowed as a shoreline protection strategy as laid forth in 15A
NCAC 07M.0202(c) along with “preferred” response measures including land use planning,
establishment of building setback lines, building relocation, subdivision regulations, and
management of vegetation (15A NCAC 07M.0202(b)). In North Carolina, beach nourishment is
an accepted strategy to preserve public beaches and protect oceanfront structures even though it
is extremely costly to the public and private property owners.
Beach nourishment projects are rarely single, isolated projects. For example, Carolina
Beach has completed 28 nourishment projects 1955-2006 and has placed approximately 18.55
million cubic yards of sand on the beach (Program for the Study of Developed Shorelines
Database, 2006). This averages out to about 1 nourishment project every 1.75 years (Riggs et al.,
2008) indicating nourishment is far from a permanent solution to erosion. The constant re-
nourishment of beaches becomes extremely expensive; consider mobilization of a dredge alone
costs upwards of $1 million. In 2004-2005, there were seven federal beach re-nourishment
projects along the North Carolina coast and only one project totaled less than $1.5 million
(Program for the Study of Developed Shorelines Database, 2006). To add to the difficulty of
keeping the costly new sand on the beach, some communities mine sand from the ebb-tide delta
of adjacent inlets, a process that often increases erosion along the island tip (Riggs et al., 2008).

Adaptation to Sea-Level Rise in North Carolina 22
As the Final Draft Report from the OPSC (2009) suggests, sand resources in North
Carolina are in need of better management strategies due to the growing number of nourishment
projects and the finite nature of the resource. The limited availability of beach-quality sand along
the North Carolina coast led the OPSC to dedicate an entire section in the Report to Sand
Resource Management. The Final Draft Report acknowledges the importance of developing a
sand resource management plan to avoid the current “first come, first served” protocol.
Alternative solutions have begun to be considered, including allowing hardened structures,
relocation of threatened structures, and inlet relocation. With predicted SLR, demand for
nourishment projects along the ocean front will likely increase. Depending on how seriously the
recommendations of the Estuarine Shoreline Stabilization Subcommittee are implemented (see
Chapter 1), beach nourishment could become a larger issue within estuarine policy as well.
Putting the resource availability and costs aside, there have been concerns raised by the
scientific community about the damage to habitat that accompanies beach nourishment projects.
In a groundbreaking decision, an administrative law judge in Florida issued a ruling on March 2,
2009 against a beach nourishment project because it posed a threat to the health of the offshore
reef ecosystem (Recommended Order, Surfrider Foundation v. Town of Palm Beach, FL; Case
No. 08-1511). The court recognized the potential negative environmental effects of the proposed
nourishment project and conceded the modeling system used by many coastal engineers and the
U.S. Army Corps of Engineers (COE) to predict sand distribution was flawed. While many
environmental groups hail the decision as a victory, some scientists are concerned it will only
push communities to rely more on sea walls and other hard structures (New York Times, 2009).
Given the current state of the economy and the tightening of the state budget, the N.C.
General Assembly will have some trouble justifying million dollar requests from small coastal
Adaptation to Sea-Level Rise in North Carolina 23
communities to add sand to beaches. The OMB recently removed $85 million from the U.S.
Army COE budget originally set aside for beach nourishment projects (Island Gazette, 2009). As
these communities look to fund projects themselves, the number of projects will certainly
decrease (Topsail Voice, 2009) while the pressure to allow soft and hard stabilization structures
will increase.
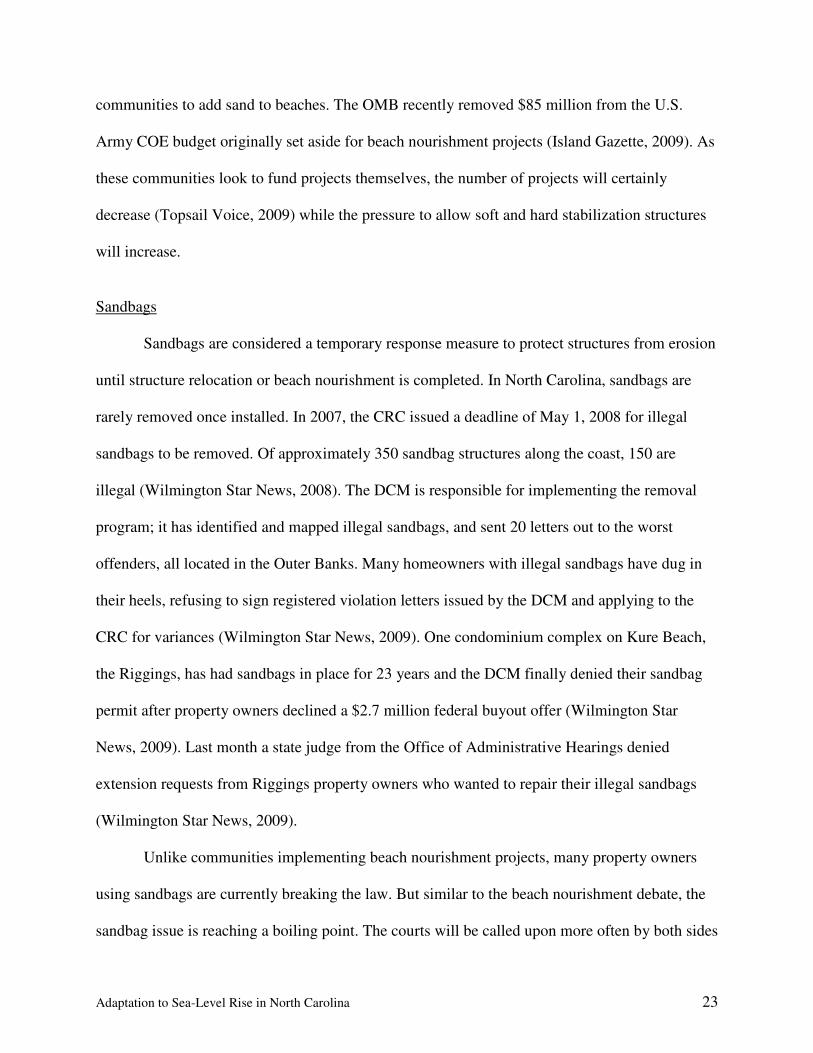
Sandbags
Sandbags are considered a temporary response measure to protect structures from erosion
until structure relocation or beach nourishment is completed. In North Carolina, sandbags are
rarely removed once installed. In 2007, the CRC issued a deadline of May 1, 2008 for illegal
sandbags to be removed. Of approximately 350 sandbag structures along the coast, 150 are
illegal (Wilmington Star News, 2008). The DCM is responsible for implementing the removal
program; it has identified and mapped illegal sandbags, and sent 20 letters out to the worst
offenders, all located in the Outer Banks. Many homeowners with illegal sandbags have dug in
their heels, refusing to sign registered violation letters issued by the DCM and applying to the
CRC for variances (Wilmington Star News, 2009). One condominium complex on Kure Beach,
the Riggings, has had sandbags in place for 23 years and the DCM finally denied their sandbag
permit after property owners declined a $2.7 million federal buyout offer (Wilmington Star
News, 2009). Last month a state judge from the Office of Administrative Hearings denied
extension requests from Riggings property owners who wanted to repair their illegal sandbags
(Wilmington Star News, 2009).
Unlike communities implementing beach nourishment projects, many property owners
using sandbags are currently breaking the law. But similar to the beach nourishment debate, the
sandbag issue is reaching a boiling point. The courts will be called upon more often by both sides

Adaptation to Sea-Level Rise in North Carolina 24
in the near future. Regardless of outcomes, the growing tension will inevitably intensify with
SLR and increased rates of erosion.
Structure Removal
Due to the dynamic nature of barrier islands, in particular the portions adjacent to inlets,
North Carolina coastal communities find themselves with condemned structures standing in
public trust waters. Even with the current popularity of beach nourishment projects and
sandbagging efforts of individual homeowners, structures are still being lost to natural coastal
processes. Barrier island communities are constantly debating who will remove condemned
structures from the oceanfront. Property owners wait to see if they can collect insurance pay-outs
once the structure is destroyed by a storm, but local governments continue to push back,
claiming the structures are interfering with the public’s enjoyment of the beach. North Topsail
Beach is one of several barrier island communities with condemned houses in public trust
waters. The town recently announced an agreement had been reached with homeowners of six
condemned duplex houses for $1.6 million, plus an additional $43,600 to demolish the structures
(Topsail Voice, 2009; Figure 2.1).
Figure 2.1 Four years after being condemned, the town of North Topsail removes structures from the beach. Photo Source: Connie Pletl, http://carolinacoastonline.com/articles/2009/03/04/topsail_voice/news/doc49ae92cf94719645792078.prt)

Adaptation to Sea-Level Rise in North Carolina 25
Armoring
As mentioned in Chapter 1, hardened structures are allowed along the estuarine shoreline
but not along the oceanfront in North Carolina. Many advocates for overturning North Carolina’s
ban on oceanfront hardened structures believe a solution to the challenges over beach
nourishment, sandbags, and structure removal, is allowing hardened structures along the
oceanfront. The mascot for overturning the ban in North Carolina has become the terminal groin.
Over the last few years, property owners from Figure Eight Island have attempted to overturn the
state ban on hardened structures in order to protect the northern tip of the private barrier island.
Their lobbying efforts in 2008 resulted in introduction of Senate Bill 599, which proposed
allowing a pilot study on a terminal groin; a type of hardened structure placed perpendicular to
the shore. The bill died in committee before it could be voted on in the House, but a new bill
(S.B. 832) was re-introduced in March 2009. The new bill contains fewer restrictions than the
original in order to allow other communities to construct groins in addition to Figure Eight
Island. Communities that stand to benefit from a new hardened structure policy have provided
financial support for lobbying activities (The Brunswick Beacon, 2008).
The estuarine shoreline faces a different set of challenges compared with the oceanfront
when considering armoring. Even though armoring is allowed along the estuarine shore it is only
supposed to be used if less intrusive options are not possible (15A NCAC 07H .0208 (b)(7)(E)).
The “living shoreline” approach is an erosion control strategy that substitutes planted vegetation
for hardened structures. The popularity of living shorelines has grown over the last few years and
there are projects throughout Maryland, Virginia, and North Carolina. Often living shoreline
projects involve combining grass plantings with stone or oyster shell sills to absorb wave energy
(MD DNR, 2004; NCCF, 2004).

Adaptation to Sea-Level Rise in North Carolina 26
Living shoreline proponents believe the approach reduces costs to property owners (as
compared to traditional stabilization structures), and improves habitat quality, water quality, and
aesthetics (Burke, 2004). The North Carolina Coastal Federation, through grant support from
NOAA, Restore America’s Estuaries, and N.C. Clean Water Management Trust Fund, has
provided cost share funds for 19 living shoreline projects for a variety of clients, including
private property owners and educational institutions (NCCF, 2004). Because living shorelines
reduce erosion and stabilize shorelines, the EPA lists the approach as a “soft” adaptation option
to protect estuarine shorelines from rising seas (EPA, 2009).
Beach Plan
As mentioned in Chapter 1, the Beach Plan is a state-backed insurer for 170,000 coastal
properties in North Carolina. Unlike private insurance companies, The Beach Plan is not
required to maintain reserves to cover damages from a 100-year storm. The Property Casualty
Insurers Association of America (PCI) commissioned the Milliman Report (2008) to investigate
the deficit the Beach Plan would run if a hurricane were to strike the North Carolina coast. The
Report concluded the Beach plan would have the capacity to pay out $1.5 billion to cover
hurricane losses, only after it has assessed $600 million from insurance companies (Milliman,
Inc., 2008). The study found the Beach Plan would run a deficit from a small storm (1-in-50
year) of $1.4 billion up to $6.2 billion for a large storm (1-in-250 years).
The study raised many concerns now being addressed by the Joint Select Study
Committee on the Potential Impact of Major Hurricanes on the North Carolina Insurance
Industry. Many inland policy holders fear insurance companies will be forced to make up the
deficit caused by undercharging coastal property owners by increasing premiums for all policy
holders, essentially leaving inland property owners to subsidize coastal property owners. By

Adaptation to Sea-Level Rise in North Carolina 27
increasing the assessments on the insurance companies to cover deficits, the Beach Plan could
drive companies out of the state. Farmer’s Insurance, the third largest writer of homeowners
insurance in the country, opted to stop writing policies in North Carolina due to the potential
Beach Plan assessments (Milliman, Inc, 2008). Insurance hikes recently approved by the North
Carolina rate bureau would result in a statewide average increase of 4.05 percent. Along the
coast in Carteret County, rates would go up as much as about 30 percent, with inland residents
bearing the brunt of the hike (Carteret County News-Times, 2009).
Coastal insurance has been criticized for not passing the true cost of living at the coast
onto coastal property owners. Godschalk et al. (1999) comment on how the federal role in
disaster assistance has led to a sense of entitlement amongst local and state governments after a
disaster has struck their community, regardless of the level of effort to mitigate risk. Perhaps
with the latest rate hike, North Carolina is beginning to understand the importance of coastal
property owners paying for the risk of owning a house on the water. But after decades of
undervaluing risk along the coast, the state will surely be in for a fight. Several counties and
municipalities have already filed suit in order to push the state to reconsider the rate increase
(Island Gazette, 2009).
Dredging
As mentioned in the first chapter, the North Carolina coast is an incredibly large,
dynamic system. Inlets (openings between barrier islands) allow water to flush in and out of the
sound. Naturally, inlets are ever-changing; they migrate, they fill up with sand, new ones form
during storms. But along the heavily engineered North Carolina coast, inlets are the only way in
and out of the sound for boats and ships. Therefore certain inlets are artificially kept in place
with jetties and dredged to remain navigable.

Adaptation to Sea-Level Rise in North Carolina 28
Dredging is underwater excavation performed frequently by the U.S. Army COE along
the North Carolina coast. The removal of underwater sediment helps keep waterways navigable,
and sometimes can provide a source of sand for beach nourishment projects. For the 2008 Fiscal
Year, the Army COE dredged a total of 2.7 million cubic yards of sand in North Carolina (U.S.
Army COE, 2008). The majority of this work was maintenance of channels in inlets. The
Atlantic Intracoastal Waterway (AIWW) functions as an arterial waterway for businesses and
recreational boaters in the sound and requires constant maintenance dredging. If dredging ceased
today, the average depth of the AIWW would rise to 4 ft, as compared to the 7-12 feet
maintained by dredging (Dumas et al., 2007).
While dredging has become commonplace along the North Carolina coast, there are
issues of concern to a variety of stakeholders. One issue is reduced federal funding for dredging
activities (OMB, 2007). Reduced funding will put pressure on the state and local governments to
continue dredging of the AIWW and inlets considered critical to recreational boaters and
maritime industries. Other issues include dredge spoil disposal and the ecological effects of
dredging. There is concern over the effects of dredging on benthic communities when spoil is
disposed offshore. In the past, dredge spoil would often be dumped in nearby marshes, a practice
since abandoned in favor of creating dredge spoil islands which are capable of providing habitat
for birds (NPS, 2004). If the spoil is placed on a beach, there is potential for habitat to be
destroyed, especially if the sand is not compatible with existing sand. Several barrier island
communities have experienced the difficulty in receiving non-compatible beach sand (NCCF,
2002). Dredging activity also removes shallow water habitats and increases water turbidity
which can kill fish (Ross and Lancaster, 1996). Dredging in the AIWW has been critiqued for

Adaptation to Sea-Level Rise in North Carolina 29
exacerbating erosion of estuary shorelines, including salt marshes (NPS, 2004). Sand mining in
inlets is another dredging activity that is criticized for intensifying erosion of barrier islands
Dredging has become a lucrative business along the North Carolina coast. In addition to
the 2.7 million cubic yards the Corps dredged in 2008, 4.5 million cubic yards was dredged by
outside contractors whose six contracts totaled $28 million (U.S. Army COE, 2008). The
contracted projects were mainly for harbor and AIWW maintenance. In the future, if funding
continues to be slashed, dredging projects will need to be scaled back and prioritized. With SLR,
dredging, like nourishment, would have to occur more frequently; a situation taxpayers may not
be willing or capable of supporting. The Mason Inlet relocation was a project proposed by
private property owners in Wrightsville Beach who opted to build a large condominium complex
within a designated high-risk area (CBRA Zone). The funds (approximately $10 million) were
fronted by New Hanover County, and later assessed to property owners (New Hanover County,
2003; ATM, 2002). Despite property owners initiating and supporting the project, their pledge to
pay for it waivered once the tax assessments started. The county government has so far taken a
hard line and rejected the property owner’s requests for using some of the county’s room
occupancy tax to pay for the project (Wilmington Star News, 2007). The Mason Inlet Relocation
project gives some indication that private property owners will most likely not be able to support
costly dredging and nourishment projects without the aid of state and federal dollars.
Wetland Loss
Carbon sequestration, flood buffering, fish and bird habitat, and water filtration are only a
few of the critical ecosystem services wetlands provide. North Carolina has lost 50% of its
original 11.1 million acres of wetlands and the majority of remaining wetlands are coastal
(approximately 3 million acres) (Dorney et al., 2004; Street et al., 2005). With continued

Adaptation to Sea-Level Rise in North Carolina 30
development along the 3,000 miles of estuarine shoreline, combined with rising seas, the amount
of wetlands lost is likely to increase. Annual salt marsh loss due to erosion has been estimated at
802 acres per year in North Carolina (Riggs and Ames, 2003).
Over 90% of North Carolina’s commercial fisheries landings and 60% of recreational
landings are comprised of estuarine-dependent species (Street et al., 2005). The Albemarle-
Pamlico Sound is North Carolina’s key resource for commercial fishing, recreational fishing, and
tourism. The Sound’s highly productive waters and wetlands allow it to support these activities.
More than 75 species of fish and shellfish rely on the wetlands for protection and food (Stedman
and Hanson, 1997).
Coastal wetlands in North Carolina are being destroyed by dredge-and-fill activities,
natural disturbances, pollution, and SLR. Nutrients and other pollutants in stormwater runoff are
leading to serious degradation of water quality. Wetlands in the Albemarle-Pamlico Peninsula
have been extensively ditched and drained to support agricultural land development. The area
has become the most productive cropland in the state (Street et al., 2005). Recent research by
Poulter et al. (2008) indicates vulnerability of coastal landscapes to SLR is heightened by the
existence of drainage ditches and channels. The ditches allow for increased levels of flooding
and salt water intrusion.
The Nature Conservancy (TNC) is a national non-profit that has already started
addressing SLR and its effects on coastal marshes. Along with the U.S. Fish and Wildlife
Service, TNC has begun implementing SLR adaptation methods in the Alligator River National
Wildlife Refuge, a refuge composed of formerly ditched agricultural land in Dare County, North
Carolina (Charlotte Observer, 2009). In more developed parts of the North Carolina coast,
marshes will be unable to migrate with rising seas due to upland development. State agencies and

Adaptation to Sea-Level Rise in North Carolina 31
local communities will need to seriously consider recommendations laid out in the CHPP (2005)
if they hope to preserve some of the critical services wetlands provide along the entire North
Carolina coast.
Stormwater Runoff
Stormwater is the result of precipitation running off of impervious surfaces like roads,
roofs, and parking lots, as well as runoff from agricultural fields and lawns. The runoff from
these surfaces contains pollutants which can lead to serious water quality issues in receiving
water bodies. Stormwater can also infiltrate wastewater systems leading to overflow during
storm events.
In coastal North Carolina, stormwater has become a particularly large problem due to
continued increases in impervious surfaces, and the dependence of local coastal economies on
shellfishing. Shellfish are affected by a variety of factors including low dissolved oxygen,
increased nutrients, temperature, and turbidity, pH, and water movement (Street et al., 2005).
Bacteria from polluted stormwater has been cited as the cause for the majority of shellfish
closures in North Carolina waters (Mallin et al. 2000, 2001; Duda and Cromartie, 1982).
When North Carolina adopted Clean Water Act “Phase II” rules in 2006, only two coastal
counties were required to implement more stringent stormwater controls. In 2005, the
Environmental Management Commission (EMC) began the process of revising coast-specific
stormwater rules that had been in place for the 20 coastal counties since 1985 but had not
successfully protected water quality.
In July 2008, new stormwater rules for the EMC were passed into law (S.B. 1967 & H.B.
2138). The new rules reduce low density development thresholds, require stormwater controls to
account for larger rainfall events, prohibit inclusion of wetlands in impervious surface

Adaptation to Sea-Level Rise in North Carolina 32
calculations, and extend the vegetative setback requirement. There are stricter standards if the
activity or development is within ½ mile of shellfish waters (NC DWQ, 2008). Non-profits and
educational institutions like the North Carolina Coastal Federation have already begun
addressing coastal stormwater reduction through stormwater best management practice (BMP)
projects. With support from the Clean Water Management Trust Fund, they have installed
bioretention features in schools and parking lots in several coastal communities. NCCF has held
instructional workshops in managing stormwater using low-impact development (LID) strategies
as well as consulted with county governments on developing LID ordinances.
Conclusion
The growing mass of law suits and court decisions related to many of the challenges
discussed here should be an indication of a need for statutory clarification of current practices
along the North Carolina coast. The reliance of state agencies and local communities on short-
term solutions without serious long-term planning is a dangerous combination. Hardened
structures have been proposed as an option for shoreline stabilization due to the ineffective short-
term strategies of beach nourishment and sandbagging. With rising seas, hardened structures are
not necessarily the best option either, but the lack of long term, comprehensive planning along
the coast currently leaves no alternatives.
Without even considering the potential threat of SLR, there are a myriad of coastal
management issues related to both natural and man-made systems that will need to be addressed
in the next few years. It would be unwise however, for decision-makers and coastal managers to
go forward trying to solve these problems, without acknowledging future hazards. They may find
that solutions to future hazards, like adapting to SLR, will help solve existing challenges as well.

Adaptation to Sea-Level Rise in North Carolina 33
2.2 Sea-Level Rise
Estimates
Sea-level rise adaptation has become the focus of many coastal management agencies
within the last few years, including the DCM in North Carolina. This interest can be partly
attributed to the Intergovernmental Panel on Climate Change’s 2007 report. The IPCC (2007)
predicted global sea-levels to rise between 0.18 and 0.59 m over the next century without
considering the impacts of melting ice sheets (Figures 2.2a and 2.2b). During the March 2009
International Scientific Congress on Climate Change (ISCCC) meeting in Copenhagen, new
research was presented predicting the upper range of SLR to be 1 m or more by 2100 while the
lower end of the range will be at least 0.50 m due to the rates of melting ice sheets contributing
more and faster than predicted (University of Copenhagen, 2009).
Figure 2.2a (above) and 2.2b (right). Annual averages of the global mean sea level (mm) from IPCC (2007). The red curve shows reconstructed sea level fields since 1870 (updated from Church and White, 2006); the blue curve shows coastal tide gauge measurements since 1950 (from Holgate and Woodworth, 2004) and the black curve is based on satellite altimetry (Leuliette et al., 2004). The red and blue curves are deviations from their averages for 1961 to 1990, and the black curve is the deviation from the average of the red curve for the period 1993 to 2001. Error bars show 90% confidence intervals.
Source: IPCC, 2007

Adaptation to Sea-Level Rise in North Carolina 34
As ice sheets begin to melt, the collapse of the proglacial forebulge will lead to the Mid-
Atlantic coast experiencing rates of SLR twice as great as global rates (Douglas and Peltier,
2002). In North Carolina, due to land subsidence, sea level is expected to rise between 0.3 and
1.1 m within the same time span. Given the predicted rates of SLR for the Mid-Atlantic as well
as the region’s susceptibility to natural disturbances, North Carolina will continue to be prone to
billion-dollar weather and climate-related disasters (National Climatic Data Center, 2008; Figure
2.3). Coastal managers will face tremendous obstacles in addressing SLR (as well as the
predicted increases in storm intensity, erosion, and flooding) without a formal strategy.
Figure 2.3. North Carolina is one of seven states that experienced 26-30 disaster events 1980-2008. Source: National Climatic Data Center, NOAA

Adaptation to Sea-Level Rise in North Carolina 35
SLR in North Carolina
As mentioned in Chapter 1, North Carolina’s coast can be divided into two geologic
units. A study by Titus and Richman (2001) found North Carolina had the third largest amount
of coastal land (5800 km2) sitting below the 1.5 meter elevation contour out of all the Atlantic
and Gulf states. A later study completed by Poulter and Halpin (2008) using high-resolution
Lidar data found 5300 km2 of land at or below the 1.1 m contour. The majority of this land is in
the Albemarle-Pamlico Sound region, within the Northern geologic unit.
The Albemarle Region of the northern coastal plain is an area predicted to be highly
susceptible to even the smallest increases in sea level. Pearsall and Poulter (2005) predict forty
inches (1 m) of SLR could inundate approximately one million acres of land in the region. If
present day rates do not increase, the inundation will take 200 years, but if the rate increases
from 4.3 mm a year to 13 mm per year, the area will be inundated within 65 years. Some adverse
effects of SLR for this area include increased erosion, saltwater intrusion, and rapid
decomposition of peat-based soils (Pearsall and Poulter, 2005). The Chapter 3 case study area
(Morehead City) is located along the southern fringe of the Albemarle Region (Figure 2.4).
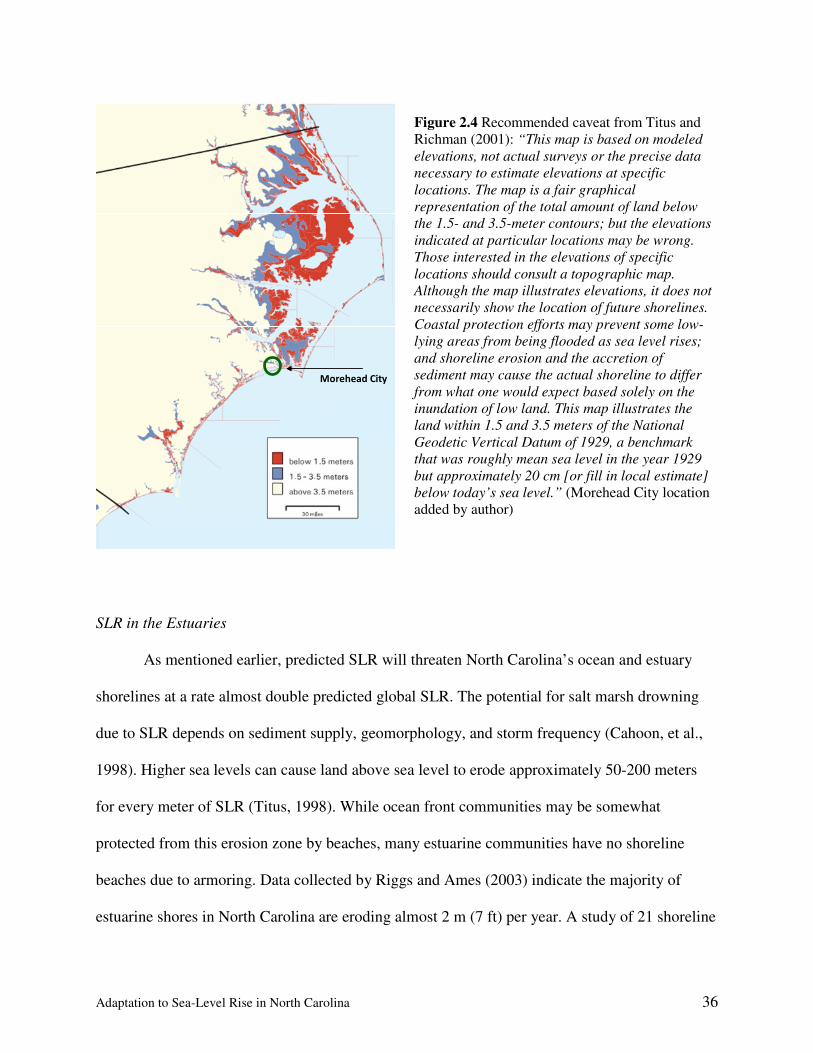
Adaptation to Sea-Level Rise in North Carolina 36
Morehead City
Figure 2.4 Recommended caveat from Titus and Richman (2001): “This map is based on modeled
elevations, not actual surveys or the precise data
necessary to estimate elevations at specific
locations. The map is a fair graphical
representation of the total amount of land below
the 1.5- and 3.5-meter contours; but the elevations
indicated at particular locations may be wrong.
Those interested in the elevations of specific
locations should consult a topographic map.
Although the map illustrates elevations, it does not
necessarily show the location of future shorelines.
Coastal protection efforts may prevent some low-
lying areas from being flooded as sea level rises;
and shoreline erosion and the accretion of
sediment may cause the actual shoreline to differ
from what one would expect based solely on the
inundation of low land. This map illustrates the
land within 1.5 and 3.5 meters of the National
Geodetic Vertical Datum of 1929, a benchmark
that was roughly mean sea level in the year 1929
but approximately 20 cm [or fill in local estimate]
below today’s sea level.” (Morehead City location added by author)
SLR in the Estuaries
As mentioned earlier, predicted SLR will threaten North Carolina’s ocean and estuary
shorelines at a rate almost double predicted global SLR. The potential for salt marsh drowning
due to SLR depends on sediment supply, geomorphology, and storm frequency (Cahoon, et al.,
1998). Higher sea levels can cause land above sea level to erode approximately 50-200 meters
for every meter of SLR (Titus, 1998). While ocean front communities may be somewhat
protected from this erosion zone by beaches, many estuarine communities have no shoreline
beaches due to armoring. Data collected by Riggs and Ames (2003) indicate the majority of
estuarine shores in North Carolina are eroding almost 2 m (7 ft) per year. A study of 21 shoreline

Adaptation to Sea-Level Rise in North Carolina 37
sites estimated the rate of retreat is reducing wetland area in brackish marsh zones by 800 acres a
year and is the result of both wave action and SLR (Riggs and Ames, 2003).
If conditions are appropriate, coastal marshes are able to build vertically at a rate
equivalent to SLR. Accretion occurs in North Carolina coastal wetlands either by inorganic
sediment accumulation or biogenic deposition (Moorehead and Brinson, 1995). In both
instances, vegetation plays an important role in trapping mineral sediment and producing organic
material (Kirwan and Murray, 2007). If the rate of SLR increases significantly, marsh vegetation
will not be able to replace itself upland and low marshes in particular, will be susceptible to
drowning (Donnelly and Bertness, 2001).
Human effects have been acknowledged as having a large, if not larger role in the loss of
coastal wetlands: dredge-and-fill activities for land development, excessive nutrients from
agriculture, altered hydrology and runoff, contaminants from runoff, prescribed fire
management, subsidence from groundwater pumping, and invasive species introduction
(Cahoon, 2007). Most relevant to this study is the impact of armoring the shore, which acts as a
barrier to wetland migration. Upland development can also prevent wetlands from migrating in
response to rising seas; up to 21% of Mid-Atlantic coastal wetlands are at risk for inundation
from SLR by 2100, mostly due to this “coastal squeeze” phenomenon (IPCC, 2007).
Policy Responses
Statutory language formally acknowledges sea-level rise as a hazard in the North
Carolina Administrative Code, the NC Coastal Area Management Act, and the Federal Coastal
Zone Management Act. It has been listed as a concern by the NC Legislative Commission on
Global Climate Change, the OPSC Final Draft Report, and the Coastal Habitat Protection Plan.

Adaptation to Sea-Level Rise in North Carolina 38
The framework exists for coastal North Carolina to begin to adapt to SLR, yet no action beyond
studies and recommendations have been made. The hesitancy on the part of regulators and
decision-makers may stem from the perceptions of what managing for SLR entails.
In the past, there have been three adaptation responses considered for SLR: retreat,
accommodation, and protection (IPCC, 1990). Retreat has been practiced sporadically along the
North Carolina coast; the most famous example was the relocation of the Cape Hatteras
lighthouse (NPS, 1997). Accommodation implies people continue to use the land regardless of
the risk, for example, converting coastal wetlands to aquaculture and building houses higher off
the ground. This has also been partially practiced in North Carolina, as building codes have been
updated to try and create homes capable of surviving large storms intact. The last scenario,
protection, translates to armoring the coast to protect structures from rising water. As mentioned
in Chapter 1, hard armoring has only been allowed along the estuarine shoreline in North
Carolina and soft armoring (using sandbags) has been allowed as a temporary measure along the
oceanfront.
Due to the uncertainty still surrounding SLR, the best management approach will be one
that encompasses as many options as possible. Successful adaptation to SLR will require
increasing flexibility in the three previously mentioned response strategies. For example, the
“protection” response strategy can be interpreted rigidly to mean a hardened structure. The
protection option has been practiced rigidly for years in states like New Jersey, often to the
detriment of the beach or wetland on the other side of the seawall. But a different interpretation
of the protection option has been growing in popularity in Maryland, Virginia, and North
Carolina. The “living shoreline” approach has been gaining in popularity as an option that not
only prevents erosion, but restores natural system functions. As mentioned earlier in the chapter,

Adaptation to Sea-Level Rise in North Carolina 39
TNC is gearing up to implement the first SLR adaptation strategy in the state using a “living
shorelines” approach. They are planning to plant marsh grasses and build oyster reef sills to
protect the Alligator River National Refuge from rising seas (Charlotte Observer, 2009). TNC
will also be installing devices to manage the flow of water into former agricultural ditches to try
and restore the natural hydrology of the area.
The “living shoreline” stabilization strategy is a variation of the protection strategy and
provides a way to address erosion of both wetlands and developed land along estuarine shores,
an issue predicted to be exacerbated by SLR. It is a great example of a solution that is not only
flexible in nature, but is capable of addressing multiple challenges at once.
The challenges facing the North Carolina coast may seem daunting, especially when
considering future SLR. If the state and local communities are able to integrate resources and
strategies in order to develop flexible solutions, the North Carolina coast will have a better
chance of adapting to SLR as well as successfully addressing current challenges.

Adaptation to Sea-Level Rise in North Carolina 40
CHAPTER 3
Adaptation to Sea-Level Rise: A Case Study
Chapter 3 examines possible management responses to sea-level rise in North Carolina
using a local case study. An analysis of geospatial data provided by the Town of Morehead City
is used to create three potential land planning responses to SLR as an example of how the town
can begin to develop a SLR response toolbox. The purpose of this analysis is to enhance
Morehead City’s Land Use Plan (LUP) and to prepare it for active management of SLR. The
study shows how a flexible approach to SLR management can fit into the existing LUP
framework, fully conform to the CAMA LUP guidelines, and provide options in the face of
uncertainty.
While flood zones and other single-event risk predictions filter into land use planning,
they are rarely seriously considered in planning decisions. SLR will have to be approached in a
different, more deliberate manner. SLR inundation modeling results can be overwhelming to
planners and managers who watch an entire floodplain disappear with a 1 meter rise in sea level.
The good news is managers and planners can make choices today that can significantly change
what their community will look like in the future. The case study on Morehead City shows how
local communities can begin the journey to managing SLR with existing information and an
already established framework.
Morehead City is an urbanized peninsula found just south of the dividing line between
the North and South coastal plain geologic units (Riggs et al., 1995). Although Morehead City is
not located along the more vulnerable ocean side, its growth is constrained by natural boundaries
and it will face many of the same challenges barrier island communities will face with rising
seas. It is a good representation of conditions moderately urbanized coastal towns and cities in
North Carolina will encounter over the next century. Because the peninsula is not as low-lying as

Adaptation to Sea-Level Rise in North Carolina 41
some areas in the Albemarle-Pamlico region, a case study of Morehead City will present a
moderate example of SLR possibilities, which may be a more effective path to communicating
SLR scenarios to the public (Galloway, 2008; Figure 3.1).
The case study will provide background on Morehead City’s history, demographics, and
natural systems. The effect of SLR on the community will be examined using several SLR
inundation scenarios. The scenarios will then be used as a foundation to develop a SLR response
toolbox within the local land use plan. The toolbox will be composed of three potential response
options to SLR, each including a land suitability map, written component, and tables of
information relevant to implementation of the option. Lastly, recommendations will be made on
how to make SLR planning a reality in North Carolina.
Figure 3.1 Study Area

Adaptation to Sea-Level Rise in North Carolina 42
3.1 Introduction to Morehead City, North Carolina
Historical Morehead City
John Motely Morehead and Silas Webb arrived at Shepard’s Point in the early 1850’s and
described the future site of Morehead City as “thickly wooded and famed for its beauty of
scenery.” The two men, similar to Shepard’s Point founder David Shepard, believed the area had
potential for “a brilliant future” and immediately purchased several hundreds of acres of land
from the Arendell family. John Morehead’s stock in the Atlantic and North Carolina Railroads
led to Morehead City becoming the terminal stop for both lines in 1857, thereby allowing
establishment of the port and harbor facilities. As president of the Shepard’s Point Land
Company, John Morehead was poised to begin development of the area and the sale of Morehead
City lots began in 1857.
The initial 100 lots created on the peninsula were sold to local people, mostly from
Carteret County, and land speculators. Morehead, as “Architect and Builder of Public Works,”
laid out the town in squares of 16 lots with alleys bisecting each square in the form of an “H.”
The downtown remains in the same gridded pattern today. The railroad was built down the
principal street (modern-day US-70/Arendell St.) and terminated at the eastern tip of the
peninsula, where Pier 1 (precursor to the Port of Morehead City) was built. By 1858, the railroad
was up and running and the town experienced a boom in growth over the next two years. Due to
the tremendous success of the railroad and port, a municipal government was established in
1860, and Morehead City was incorporated in 1861. After only 15 months, the municipal
government was overthrown by federal forces declaring martial during the early stages of the
Civil War.

Adaptation to Sea-Level Rise in North Carolina 43
The Civil War was a crippling interruption to the burgeoning town of Morehead City.
Growth was stagnant for the next three years, and municipal record keeping did not resume until
16 years after the war had ended. Shipping from Morehead City did not begin again until 1880
and was cut short by the railroad extension into Beaufort which temporarily made the
neighboring town the new terminus. Infrastructure projects exploded after the turn of the century,
with the introduction of electric power in 1905, followed by the construction of a roads system,
waterworks, and sewer. The fishing industry became well-established during the same time (as
the whaling industry declined). The construction of a cement seawall along the waterfront
encouraged the founding of boat building workshops and menhaden fish houses.
Not until 1934, with the aid of a Public Works Administration loan, was the port revived
and a new terminal constructed. Spurred by WW II, the North Carolina Port Authority was
created in 1945 to produce adequate deep water ports through the sale of revenue bonds. The
Authority officially took over supervision of the Port at Morehead City by 1949 and it has been
run as a state port ever since.
Between 1960 and 1980, thousands of residents moved out of Morehead City and into
newly developed “suburbs.” The migration caused one of the few periods of decreasing
population in Morehead City’s history. The rise of neighborhoods outside the town boundaries
led to heavy commercial and industrial development along the US-70 corridor. To take
advantage of the booming growth surrounding the old town boundaries, Morehead City began an
active annexation policy in 1999. Morehead City’s Extraterritorial Jurisdiction (ETJ) is currently
three times the size of the original town’s limits, with plans for future expansion.

Adaptation to Sea-Level Rise in North Carolina 44
Morehead City Today
Demographics
The overall trend in population in both Morehead City and its ETJ has been upward even
with the dip in population between 1960 and 1980 (Figures 3.2a and 3.2b). Although Carteret
County was the 6th fastest growing coastal county in North Carolina 1970-2003, growth in
Morehead City has leveled off, due to loss of jobs from the area, lack of year round housing, land
availability, and transportation deficiencies (The Wooten Company, 2007). Average income has
continued to rise in both Morehead City and Carteret County, although Morehead City’s average
in below both the state and county averages (Table 3.1). Poverty continues to decrease in
Morehead City.
Figure 3.2a and 3.2b Population growth and predicted growth in Morehead City, ETJ, and Carteret County
Source: Morehead City Land Use Plan, 2007
Table 3.1 Average Income and poverty rates
Year Percent change
1980 1990 2000 1980-1990 1990-2000 1980-2000
Morehead City $5,457.00 $11,410.00 $19,138.00 109.1% 67.7% 250.7%
Carteret County $6,146.00 $13,227.00 $21,260.00 115.2% 60.7% 245.9%
North Carolina $6,133.00 $12,885.00 $20,307.00 110.1% 57.6% 231.1%
Families in Poverty (MC) 17.5% 15.5% 12.3% -11.7% -20.4% -29.7%
Owner-occupied housing units account for 55.5% of all housing stock in Morehead City
as compared with 77% of housing units in Carteret County. The number of seasonal units has

Adaptation to Sea-Level Rise in North Carolina 45
increased over 700% since 1980, a reflection of the growing tourism industry along the entire
coast (The Wooten Company, 2007). The seasonal population in 2006 was 6,527, approximately
31% of the total peak population in the ETJ. Even with the large influx of seasonal residents,
Morehead City continues to be a functional urban area year-round. Hospitals, universities, and
commercial centers operate throughout the year, unlike other coastal and island communities.
The largest employment sectors in the town are education, health, and social services; evidence
of the well-established nature of institutions and businesses in the area.
The availability of amenities in the off-season is a contributing factor to the large increase
in the town’s population aged 50-59 over the last decade (The Wooten Company, 2007). The
demographics reveal a potential for future demand in medical care, in-home services,
institutional care, transportation, and housing tailored for the elderly. The population trends can
also explain the decreasing average household size which at 2.06, is lower than the county and
state averages.
Critical Infrastructure
Before Morehead City begins to plan for future development, there are pressing concerns
over existing wastewater and stormwater infrastructure that need to be addressed. According to
the LUP, the town’s water supply system is fed by five wells capable of providing 2.55 million
gallons per day (MGD). In 2002, the average daily demand was 1.18 MGD (46% of available
supply), predicted to rise to 1.97 MGD (63% of available supply) by 2030 (The Wooten
Company, 2007). The water supply system appears poised to accommodate the growing
population. The LUP, however, does not consider the potential for saltwater intrusion associated
with SLR or potential alternative sources of freshwater.

Adaptation to Sea-Level Rise in North Carolina 46
The town’s wastewater and stormwater systems are not as stable as the water supply
system. Morehead City established its sewer system in 1917 and expanded 75 miles of sewer
lines throughout its ETJ over the last few decades (Morehead City, 2008). Due to large amounts
of stormwater infiltrating into the system, several load violations occurred and the town was put
under a sewer moratorium beginning in 1999 (15A NCAC 02H .0223). The moratorium
prohibited the town from any additional sewer hook-ups or sewer lines expansion. In attempts to
raise the moratorium, a $3 million sewer rehabilitation project upgraded the system to reduce the
inflow of rainwater and other extraneous infiltration. In 2007, Morehead City received $91,000
from the Clean Water Management Trust Fund for a wastewater reuse system (NC CWMTF,
2007) and in late 2008, the town was awarded a $500,000 grant from the N.C. Rural Economic
Development Center to improve two wastewater pump stations (NC Rural Center, 2008). During
2008, a new Reuse Quality Tertiary Wastewater Treatment Plant came online and increased
wastewater treatment capacity to 2.5 MGD from 1.7 MGD. The old wastewater system exceeded
capacity 8 out of 12 months in 2003 (The Wooten Company, 2007) and the new system did not
exceed discharge limitations once during 2008 (The Wooten Company, 2008).
Morehead City has a Municipal Separate Storm Sewer System (MS4) consisting of 22.8
miles of piping. Increased development over the last two decades has led to overflow discharges
into surrounding waterbodies during precipitation events (The Wooten Company, 2007). A
retrofitted stormwater system in Morehead City includes ditches, pipes, catch basins and swales,
but there is no guiding stormwater management document. In 2000, a 30-ft. buffer rule for new
development along all navigable waterways in N.C., excluding the oceanfront, was created to
address concerns over non-point source pollution. Unfortunately, there were so many
applications for variances that the CRC’s function was severely hindered and the rule had little

Adaptation to Sea-Level Rise in North Carolina 47
impact on reducing stormwater pollution (NOAA, 2006). Hopefully, the new stormwater rules
passed in July of 2008 will have a greater impact on the area.
Demographic statistics and land use patterns seem to suggest the town of Morehead City,
like much of the North Carolina coast, will need to be increasingly deliberate in planning future
development. Population statistics indicate population growth has slowed in the area due to a
lack of year-round housing and an increase in seasonal rental units. As the average age of
residents in Morehead City continues to increase, the town as a retirement community will face
specific pressures associated with this demographic shift. Retirees place a high value on location
amenities and recreational possibilities. The existence of conservation areas, green space, and
waterfront access will all be valued by older populations.
But the demographic trends cannot be considered in isolation. Stormwater and sewer line
issues continue to hamper Morehead City. The sewer moratorium has only recently been lifted
but the town continues to struggle with stormwater and wastewater overflows impairing
surrounding waterbodies. Water quality and other effects of the built environment on the natural
systems will be discussed in greater detail in the next section.
Natural Features and Processes
Geography
Morehead City is an estuarine community tucked behind developed barrier island Bogue
Banks and less than 15 miles northwest of Cape Lookout National Seashore. The town occupies
a peninsula surrounded by the Newport River to the far north, Calico Creek and Calico Bay to
the north of downtown, and Bogue Sound and the Atlantic Intracoastal Waterway to the south
(Figure 3.3). The northern portion of the Morehead City ETJ contains extensive natural and
drained salt/brackish marshes, the majority of which are owned by the North Carolina Coastal

Adaptation to Sea-Level Rise in North Carolina 48
Land Trust. The Trust is also responsible for conserving approximately 100 acres of marsh
islands in Calico Bay called the Haystack Marshes. In total, over 600 acres of conservation land
are owned by the Coastal Land Trust in Morehead City. Additionally, the North Carolina Coastal
Federation and Morehead City worked together to secure funding to purchase 47-acre Sugarloaf
Island, a dredge spoil island visible from the Morehead City waterfront. Over the years the island
has become important habitat to shorebirds and submerged aquatic vegetation (NC CWMTF,
2002). Waters around Morehead City are considered part of the Albemarle-Pamlico Estuary, the
second largest estuary in the United States (Albemarle-Pamlico NEP, 2009).
Figure 3.3 Study area

Adaptation to Sea-Level Rise in North Carolina 49
Areas of Environmental Concern (AEC)
Designated Estuarine and Ocean System Areas of Environmental Concern (AEC) are
found throughout the Morehead City ETJ. The Estuarine and Ocean System AEC has four sub-
classes present in Morehead City: Public Trust Areas, Estuarine Waters, Coastal Shorelines, and
Coastal Wetlands. The following are abridged descriptions of the Estuarine and Ocean System
AEC categories (The Wooten Company, 2007):
� Public Trust Areas: All water and land underneath from the normal high water mark on
shore to three miles offshore. Public trust areas often overlap with Estuarine Waters.
� Estuarine Waters: Sounds, tidal rivers, tributaries and other bodies of water that link to
the estuarine system which includes public trust areas, coastal shorelines, and coastal
wetlands.
� Coastal Shorelines: All lands within 75 feet of the normal high water level of estuarine
waters. Wetlands in this zone tend to buffer against flooding and decrease erosion.
� Coastal Wetlands: Any marsh in the 20 coastal counties regularly flooded by lunar or
wind tides and contains one or more of the 10 designated plant species.
Areas along the Newport River, Calico Creek, and Crab Point Bay, as well as Phillips Island,
Annex Island, portions of Sugarloaf Island and the Newport Marshes are areas of Coastal
Wetlands (Figure 3.3; The Wooten Company, 2007).
Water Quality
Morehead City is located within a sub-basin of the White Oak River basin and the
majority of waters surrounding the ETJ are designated HQW SA (Shellfishing High Quality
Waters) by the Department of Water Quality, except for Calico Creek and waters surrounding
the State Port. Calico Creek, Crab Point Bay and portions of the Newport River are all
designated Primary Nursery Areas; shallow marsh areas with soft muddy bottoms ideal for
young fish and shellfish (NCDMF, 2009). Calico Creek is also home to the Morehead City

Adaptation to Sea-Level Rise in North Carolina 50
municipal wastewater treatment (WWTP) plant which discharges directly into the creek, severely
impairing water quality. In 2002, approximately 25% of waters in Morehead City were closed to
shellfishing (The Wooten Company, 2007). The LUP cites increasing urbanization as a cause of
the impairment, but acknowledges the wastewater treatment plant (prior to 2008 upgrades) had
exceeded discharge limits twice in 2000 and several times in 2002-2003.
Soils
Morehead City contains 30 different soil types and 88.5% are classified as being severely
limited for septic systems (The Wooten Company, 2007). In combination with the lack of sewer
lines in many portions of the ETJ, and the unlikely expansion of the sewer lines until the system
completes serious upgrades, high-density development in the future will be restricted to areas
already served by existing sewer lines or areas of appropriate soil quality.
Disturbance
Development pressures in Morehead City are amplified by natural disturbances. The
town is vulnerable to flooding from the Newport River and sound, and will be vulnerable to SLR
in the future. Erosion, especially with increasing sea level, will be a concern for the northern
shore of the peninsula. The majority of the shore is lined with salt marsh wetlands designated as
“floodplain.” As will be seen later in the chapter, the northern marshes will bear the brunt of
predicted SLR inundation.
Similar to many of the other southern-facing coastal communities in North Carolina,
Morehead City experiences hurricanes and tropical storms. In 2007, Carteret County was named
as the coastal county with the highest probability of hurricane force winds in 2007 by a
University of Florida study (Appendix 3.1). The study considered hurricane paths over the last

Adaptation to Sea-Level Rise in North Carolina 51
155 years as well as current climate conditions. There have been 15 hurricanes passing within 50
miles of Morehead City within the last 50 years i.e. on average the area is affected by hurricanes
every 3 years (Table 3.2).
Table 3.2 Hurricanes coming within 50 nautical miles of Morehead City within the last 50 years (NOAA Historical Hurricane Tracks)
Name Year Category
Carol 1954 2
Connie 1955 2
Ione 1955 2
Helene 1958 4
Donna 1960 2
Isbell 1964 1
Gladys 1968 1
Ginger 1971 1
Charley 1986 1
Bonnie 1998 2
Floyd 1999 2
Irene 1999 1
Isabel 2003 2
Alex 2004 2
Ophelia 2005 1
If the Town of Morehead City is to effectively address SLR going forward, it will need to
focus on integrating demographic trends, infrastructure capacity, natural system capacity, and
SLR predictions into its LUP. To some extent, the town will have to allow predictions of SLR
and increased storm intensity to drive development and planning choices going forward. Without
the consideration of natural impacts, the town will experience extensive damage to life, property,
and infrastructure in the upcoming decades.

Adaptation to Sea-Level Rise in North Carolina 52
3.2 First Steps in Adapting to Sea-Level Rise
Morehead City and other coastal communities can be evaluated on their SLR adaptive
capacity using the framework provided by Nicholls et al. (2007). The 2009 OPSC Final Draft
Report recommends completing an exercise like this for the entire North Carolina coast. To
determine whether there are hotspots of social vulnerability in a coastal zone, or even within a
coastal community, the following criteria can be used:
Is Morehead City
� A coastal area where there are substantial barriers to adaptation (economic, institutional,
environmental, technical, etc.)?
� A coastal area subject to multiple natural and human-induced stresses, such as subsidence
or declining natural defenses?
� A coastal area already experiencing adverse effects of temperature rise?
� A coastal area with significant flood-plain populations that are exposed to significant
storm surge hazards?
� A coastal area where freshwater resources are likely to be reduced by climate change?
� A coastal area with tourist-based economies where major adverse effects on tourism are
likely?
� A coastal area containing highly sensitive coastal systems where the scope of inland
migration is limited?
By examining the above-mentioned criteria, Morehead City will better understand its particular
level of vulnerability to SLR.
It will be important for Morehead City to assess its level of vulnerability to SLR, but an
assessment is not required in order for the town to begin to actively manage the SLR threat. So
far, Morehead City has done nothing in terms of adaptation to SLR even though it has the
potential to experience serious inundation in the next 80 years. In the Morehead City LUP, SLR
is only addressed once, in a Hazard Mitigation Plan Matrix attached as Appendix L. It includes a

Adaptation to Sea-Level Rise in North Carolina 53
brief analysis of what the town has done to address SLR and designates the effectiveness of
mitigating the hazard as “Low” (The Wooten Company, 2007):
The Town supports continued state research into the problems associated with sea level rise and will consider the development of policies to address sea level rise as more data concerning problem definition and alternative solutions are made available.
Morehead City, employing the cautionary principle, is looking to the state to take the lead
in addressing SLR and will only begin to address it as a concern once data is conclusive. But
local communities will place the state in a better position to act if they determine their barriers to
adaptation now, rather than wait for the state to codify recommendation by the OPSC or any
other Committees organized to address coastal zone management.
3.3 Methods
The level of vulnerability determined for each coastal community will guide the choices
they make in adapting to SLR. Some communities may choose more reactive approaches to
responding to SLR while others will actively manage for it. Given the nature of SLR (and
associated effects), all communities will benefit from having flexibility in choosing the
appropriate strategy. This study hopes to show how a local community can begin to develop a
flexible approach to managing SLR within the existing local land use plan framework.
Data
The majority of data layers used for the analysis were provided by the Morehead City
Planning Department. Land use, future land use, neighborhood, zoning, and parcel shapefiles as
well as sewer and water polyline data, and an orthorectified high resolution (2 ft) photograph of
Carteret County were prepared for analysis by being projected into North Carolina State Plane

Adaptation to Sea-Level Rise in North Carolina 54
Feet and removing errors, including gaps in land use data. To update the land use shapefile, the
high-resolution photograph (taken in 2004) and a Google Earth image from 2006, were used for
comparison of parcel and road boundaries.
Wetlands data was obtained from the National Wetlands Inventory which has been
gathering wetlands information since 1994. The wetland data does not take ownership or other
parcel data into account when mapping wetland types. The majority of wetlands in the Morehead
City area are natural and drained salt/brackish marsh.
Flood zone data was created by the National Flood Insurance Program (NFIP), created by
the Federal Emergency Management Agency (FEMA). The Town of Morehead City contains
three flood zone designations within its ETJ:
1. VE Zone: A coastal high hazard area where wave heights are expected to be 3 feet or
more.
2. AE Zone: Area subject to flooding by the base or 1% annual chance (100-year) flood,
and waves less than 3 feet high.
3. Shaded X Zone: Area subject to flooding by the 0.2% annual chance (500-year) flood.
Sea-level rise inundation results were provided by Benjamin Poulter (Potsdam Institute
for Climate Impact Research). The six scenarios were based on projection data from the IPCC
Fourth Assessment Report (2007) for 2030 and 2080. The IPCC projections can be considered
conservative because they neglect ice sheet contributions and consider only the eustatic
component averaged across the entire globe (IPCC, 2007). To gather a more accurate picture of
sea-level rise in North Carolina, an isostatic adjustment was added to the IPCC scenarios (Bin et
al., 2007). Adjustments to ice sheet contributions were not made, although emerging research
indicates a maximum scenario of 2 m of SLR by 2100 (Pfeffer, 2008). A seventh scenario

Adaptation to Sea-Level Rise in North Carolina 55
created from 2001 IPCC projections for 2100 was included as a maximum inundation scenario,
again without including possible ice sheet contributions (Table 3.3).
Table 3.3 Sea-level rise inundation scenarios
Year Scenario Projected sea level, including
both eustatic and isostatic
components (m)
Low 0.11
Mid 0.16
2030
High 0.21
Low 0.26
Mid 0.46
2080
High 0.81
2100 Max 1.06
A digital elevation model (DEM) was derived from Lidar data gathered by the North
Carolina Floodplain Mapping Program (NCFMP, 2004). The DEM has a horizontal elevation of
15 meters (50 ft) and vertical accuracy of 25 centimeters. Poulter and Halpin (2007) identified
continuing obstacles with raster modeling of sea-level rise even with higher resolution elevation
data (6m and 15m). Despite higher resolution data, SLR study results still contain uncertainty
due to error ranges greater than actual projected SLR amounts.
The DEM used to generate the SLR inundation results used in this study does not include
portions of Calico Bay and Bogue Sound, including the Haystack Marshes, Sugarloaf Island, and
a small dredge spoil island off the northern shore of the State Port. These areas were masked out
for the study. It should be noted that the study area was reduced further for the creation of the
SLR toolbox land suitability maps by excluding the designated State Port area because it is
designated “Port Mixed Use” in the existing LUP and is under control of the state. Across the
channel, Radio Island includes 150 acres already approved for marine terminal development (NC
Ports, 2009). The exclusion of the port facility does not mean it will not be susceptible to future
SLR or future development. This decision was made to allow the SLR toolbox to be consistent

Adaptation to Sea-Level Rise in North Carolina 56
with the current LUP format. Undeniably, the Port will face issues associated with SLR similar
to the rest of downtown Morehead City.
The inundation grids go beyond traditional ‘bathtub’ (or ‘zero-side rule’) model studies
of SLR which simply consider elevation irrespective of surface connectivity (Moorhead and
Brinson 1995; Titus and Richman, 2001; Poulter and Halpin, 2007). These models tend to create
ponding in interior areas where elevations fall below the SLR level even if these areas are
unconnected to coastal or estuarine waterbodies that would actually be affected by SLR (Poulter
and Halpin, 2007). More recent studies have incorporated connectivity of cells to more
accurately model characteristics of flooding (Poulter and Halpin, 2008; Bin et al., 2007). In this
study, the results were created using an eight-sided rule in which grid cells were inundated if
they were connected by way of cardinal and diagonal directions to a cell determined to be
flooded based on elevation. The eight-sided rule can potentially overestimate inundation extent
whereas an alternative four-sided rule (inundating cells only in cardinal directions) has the
potential to underestimate inundation extent. Given the conservative nature of the SLR scenarios
used for this study (due to the exclusion of ice sheet effects), the eight-sided rule creates a more
moderate representation of potential SLR inundation.
There are additional factors that will influence shoreline location over the next 100 years
in Morehead City. It should be noted these factors were not incorporated into the SLR model
results. Wetland accretion rates, erosion rates, storm influences, dredging activity, agricultural
ditching, and tidal rates are all factors with the potential to affect the location of the town’s
shoreline as well as the speed and extent of inundation.

Adaptation to Sea-Level Rise in North Carolina 57
Analysis
Overview
An overview of SLR effects in Morehead City will serve as an introduction to the SLR
response toolbox within the LUP. The overview will contain information on how SLR is most
likely to affect Morehead City. It will provide information on land uses and neighborhoods
affected by SLR, as well as information on structure and parcel inundation. For the development
of the SLR toolbox, three SLR scenarios were selected: the 0.16 (2030 Mid), 0.46 (2080 Mid),
and 1.06 m (2100 Max) (Table 3.3).
All shapefiles were converted to grids in order to extract inundation values from the
inundation grids. To get a general sense of the possible effects of SLR, all seven scenarios were
overlaid with the current land use plan and areas of inundation were tabulated. In addition, areas
of inundation were calculated for future land uses, which closely align with current land uses.
Since the Morehead City LUP (2007) divides the ETJ into neighborhoods, inundation results
were also used to calculate inundated areas by neighborhood.
Inundation of parcels was determined by using the centroid of each parcel (Bin et al.,
2007; Michael, 2007). If the centroid was inundated, the parcel was designated inundated. This
method yields some parcels that are almost completely inundated except the centroid designated
as “not inundated.” There are instances where the majority of the parcel is not inundated but the
centroid is covered. For this study, these over- and under-estimates were assumed to balance
each other out. In the future, higher-resolution data will eliminate some of the error.
Vacant parcels were isolated by selecting by the “structure value” attribute, assuming the
parcel is vacant if the structure value equals zero. The use of the isolated vacant parcels for the
three response strategies in the SLR toolbox is most likely an overestimation of future vacant

Adaptation to Sea-Level Rise in North Carolina 58
land availability because it assumes within the next 20-90 years vacant parcels will remain the
same. Especially given the current economic climate, it is hard to say what percent of vacant
parcels will still exist in 2030, 2080 or 2100. There were some parcels removed from the vacant
parcel layer because they represented boat slips, or other features where structures would not be
feasible.
A basic economic analysis was performed for the 0.16 m (2030 Mid) inundation result to
provide the town with a general sense of potential tax revenue losses. The study calculated the
value of land lost by adding up the tax values lost and discounting at a rate of 2% (Bin et al,
2007; Michael, 2007) and 7% (Bin et al., 2007).
As noted by Yohe (1991) the tax records provided by Morehead City may not accurately
reflect the market value, especially given the current instability of the housing market.
Appreciation rates associated with a newly acquired shorefront status or depreciation rates from
general aging and increases in risk for damage have not been included. Values of coastal
wetlands are “unlikely to be captured in the assessed property values” (Bin et al., 2007) and the
study did not consider the potential for increases in episodic flooding from SLR causing more
damage than inundation over a much greater area (Michael, 2007).
Sea-Level Rise Management Toolbox
The SLR Toolbox will include three response plans. In the future, Morehead City would
use these plans as a foundation for creating a variety of sub-options in order to populate the
toolbox with as many SLR response options as possible. Each response plan will contain a land
suitability map, relevant calculations to aid in implementation of the plan, and a written
component. The written component contains a summary of the strategy, the implication for
future development, the implications for natural systems, and an implementation strategy.

Adaptation to Sea-Level Rise in North Carolina 59
Response Plan 1: Case-by-Case/Reactive
The goal of Plan 1 is to identify areas suitable for development over the next 20 years
giving minimal consideration to SLR predictions. Plan 1 is a reactive approach, meaning it
would not have a formal protocol in place to address SLR damage. This is similar to the
informal, unplanned way barrier island communities currently address condemned structures. To
address future land development potential, a land suitability map was created using weights and
categories similar to the existing land suitability map in the Morehead City LUP (The Wooten
Company, 2007; Figure 3.4). The existing Morehead City land suitability map was used as the
model for all three land suitability maps within the SLR toolbox.
Figure 3.4 Morehead City Land Use Plan Land Suitability Map displaying land suitable for development over the next 20 years (2007)
Although areas of possible inundation from SLR were not explicitly masked from the
overlay, vacant parcels that could be inundated by 2030 Mid scenario (0.16 m) were given lower
weights than other inland vacant parcels. Unlike the land suitability map in the current LUP, this

Adaptation to Sea-Level Rise in North Carolina 60
analysis considered vacant parcel availability but did not consider soils, Natural Heritage Areas,
hazardous substance disposal sites, and other infrastructure-related factors (The Wooten
Company, 2007). Similar to the LUP land suitability analysis, Plan 1 included flood zones as
defined by the National Flood Insurance Program. These are areas recommended to be kept as
open space (NC DEM, 2008), but can still be developed. Each grid was reclassed on a scale 0-3,
0 representing least suitable, 3 representing most suitable. Once data layers were reclassed, they
were combined and thresholds were set to reclassify each suitability category. The following
grids were used to create the land suitability map:
� Wetlands: All wetlands were classified as “least suitable”.
� Vacant parcels, reclassed to consider 2030 Mid inundation: The vacant parcels within
the “General Industrial” and “High Density Residential” future land use categories were
weighted as less suitable compared to the other land use categories (Low Density
Residential, Institutional, Downtown Mixed-Use, etc.). Vacant parcels predicted to be
inundated by 2030 were excluded.
� NFIP flood zones: Coastal areas are highly susceptible to flooding but development
occurs in flood zones regardless of designation, therefore the flood zones were not given
weights of zero since this would affect over 5 square miles of Morehead City located
within a designated flood zone.
� Buffered sewer lines: Due to past difficulties with sewer infrastructure in Morehead
City, areas within a quarter-mile of existing sewer lines were given a “highly suitable”
rating.
� Buffered waterlines: Same criteria as sewer lines.
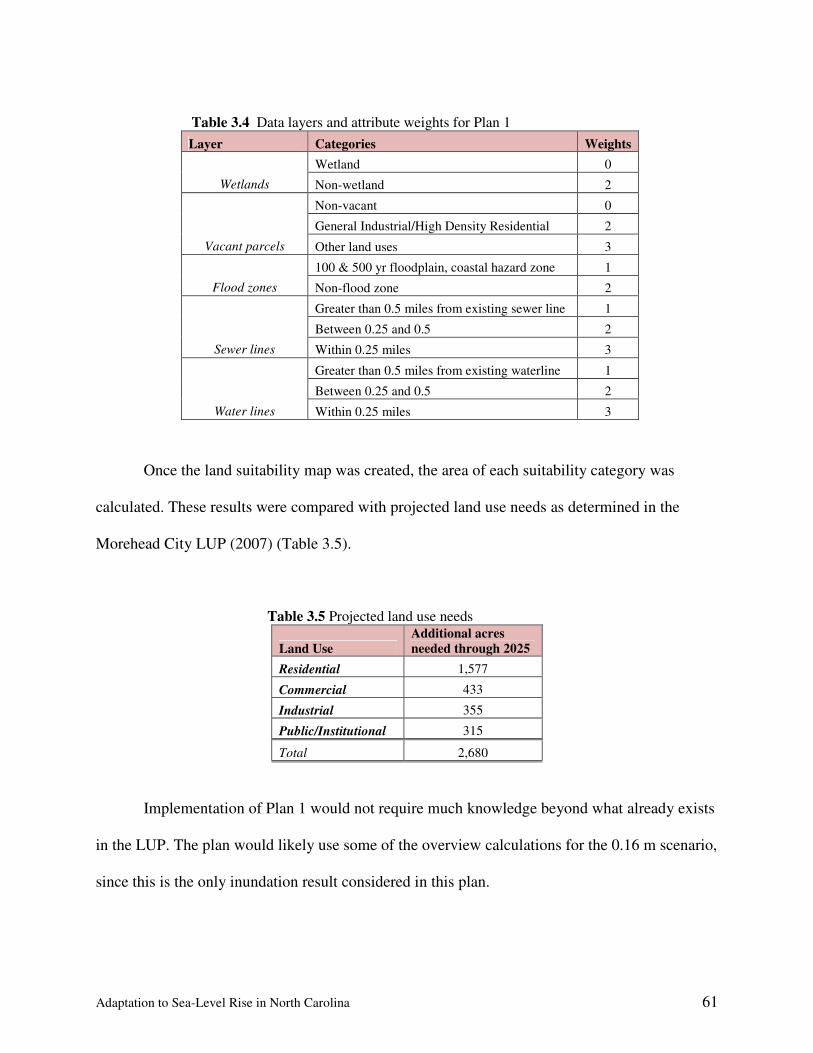
Adaptation to Sea-Level Rise in North Carolina 61
Table 3.4 Data layers and attribute weights for Plan 1
Once the land suitability map was created, the area of each suitability category was
calculated. These results were compared with projected land use needs as determined in the
Morehead City LUP (2007) (Table 3.5).
Table 3.5 Projected land use needs
Land Use
Additional acres
needed through 2025
Residential 1,577
Commercial 433
Industrial 355
Public/Institutional 315
Total 2,680
Implementation of Plan 1 would not require much knowledge beyond what already exists
in the LUP. The plan would likely use some of the overview calculations for the 0.16 m scenario,
since this is the only inundation result considered in this plan.
Layer Categories Weights
Wetland 0
Wetlands Non-wetland 2
Non-vacant 0
General Industrial/High Density Residential 2
Vacant parcels Other land uses 3
100 & 500 yr floodplain, coastal hazard zone 1
Flood zones Non-flood zone 2
Greater than 0.5 miles from existing sewer line 1
Between 0.25 and 0.5 2
Sewer lines Within 0.25 miles 3
Greater than 0.5 miles from existing waterline 1
Between 0.25 and 0.5 2
Water lines Within 0.25 miles 3

Adaptation to Sea-Level Rise in North Carolina 62
Response Plan 2: Armored Shoreline
The goal of Plan 2 is to identify areas suitable for development over the next 20 years
considering future SLR and a shoreline hardening strategy. Plan 2 assumes Morehead City opts
to respond to SLR by building a seawall along the entire shore. A good portion of the shoreline
along Bogue Sound is already armored to protect residential property, but there are gaps serving
as public access points. The town may consider filling in these gaps to create a continuous
armored shoreline, or use a combination of hardened/natural shoreline protection strategies. Plan
2 may seem extreme, but it will serve as a baseline for the development of other options related
to a policy of armoring (partial hard armoring, soft armoring, hard armoring of the downtown).
To simulate a shoreline armoring policy, a 3ft-contour was created using the DEM to
represent a seawall. Isolating the 3-ft contour (0.9 meters) resulted in some interior pockets of
low elevation. These areas were removed, assuming they would be filled and developed if a
seawall was built. Portions of the contour line were smoothed to better emulate wall
construction. The resulting shapefile was then used as a clip for a new land suitability plan. The
construction of a seawall would hypothetically remove the threat of flooding from adjacent
waterbodies and therefore flood and wetland layers were removed (Table 3.6). This policy option
did not consider the potential affects of a rising water table associated with SLR.
Table 3.6 Data layers and attribute weights for Plan 2
Layer Categories Weights
Vacant parcels Non-vacant 0
Vacant 3
Sewer lines Greater than 0.5 miles 1
Between 0.25 and 0.5 2
Within 0.25 miles 3
Water lines Greater than 0.5 miles 1
Between 0.25 and 0.5 2
Within 0.25 miles 3

Adaptation to Sea-Level Rise in North Carolina 63
Calculations relevant to implementation of the plan include amount and location of land
suitability categories, as well as the total amount of wetlands lost (potential mitigation
requirements). Once the DCM has completed mapping of hardened structures along the estuarine
shore, calculations of the amount of additional seawall required can me made, as well as
estimated costs.
Response Plan 3: Relocation/Migration
The goal of Plan 3 is to identify areas suitable for development over the next 20-90 years
considering future SLR and a policy of structure relocation and wetland migration. In this plan,
Morehead City would preempt damage from SLR by relocating threatened structures/parcels
inland and allowing wetlands to migrate upland.
Salt marshes were the focus of the wetland migration portion of the plan because they are
the dominant wetland type in Morehead City. The salt marsh areas were used to develop a salt
marsh vacant parcel layer to add to the land suitability map. Wetland accretion and migration
rates have been estimated for SLR and are dependent on slope angle, available upland, sediment
availability, and erosion rates (Moorehead and Brinson, 1995). For simplicity’s sake, this study
did not attempt to calculate potential wetland accretion offsets of SLR because the inundation
results consider connectivity of cells, not simply land elevation.
A land suitability map was created similar to the one created for Plan 1, but with some
variation in weights and the addition of several new layers. Each grid was reclassed on a scale 0-
3, 0 representing least suitable, 3 representing most suitable. The following grids were used to
create the land suitability map:
� Wetlands: weighted as they were in Plan 1, with all wetland areas considered “least
suitable” for development.

Adaptation to Sea-Level Rise in North Carolina 64
� 2080 Mid (0.46 m) inundation: The inundation results for the 2080 Mid scenario (0.46
m) with areas of projected inundation weighted as “least suitable.”
� 2100 (1.06 m) vacant: Inundation results from the 2100 Max scenario (1.06 m) were not
directly weighted and used in the overlay because it would have included much of the
same information as the 2080 Mid layer. Instead, vacant parcels were isolated using the
1.06 m inundation scenario and weighted. The vacant parcel layer represents areas
available for development and not at risk from SLR.
� Salt Marsh migration parcels: To try and provide some guidance as to conservation
areas, vacant parcels adjacent to drained and natural salt marshes were identified
(Appendix 4).
� NFIP flood zones: Plan 3 is intended to place greater emphasis on SLR. With increases
in SLR flood zones will inevitably expand. Because there was no data available related to
future flood zones given specific SLR levels, flood zones were simply re-weighted so that
all flood zones were given “least suitable” ratings. This is consistent with NC Department
of Emergency Management recommendations (2008).
� Buffered sewer lines: weighted the same as they were in Plan 1 and Plan 2.
� Buffered water lines: weighted the same as they were in Plan 1 and Plan 2.
Table 3.7 Data layers and attribute weights for Plan 3
Layer Categories Weights
Wetland 0
Wetlands Non-wetland 2
Inundated 0
2080 Inundation Not inundated 2
Non-vacant 0
2100 Vacant Vacant & above 1.06m 3
Existing marsh + adjacent vacant parcels 0
Salt Marsh migration parcels Other 2
100 & 500 yr floodplain 0
Flood zones Other 2
Greater than 0.5 miles 1
Between 0.25 and 0.5 2
Sewer lines Within 0.25 miles 3
Greater than 0.5 miles 1
Between 0.25 and 0.5 2
Water lines Within 0.25 miles 3

Adaptation to Sea-Level Rise in North Carolina 65
Calculations relevant to implementation of Plan 3 include the amount and location of
land suitability categories, vacant land parcels, and average parcel size by neighborhood. Vacant
parcel analysis was performed by neighborhood to allow a relocation plan to match inundated
parcels with interior parcels within the same neighborhood.
3.4 Results
Overview of SLR Effects
The majority of land in the 16.6 square mile Morehead City ETJ is designated residential
(58.06%) with streets and commercial land use categories a distant second and third (9.78% and
8.21%) (Table 3.8).
Table 3.8 Morehead City land use categories by area
Land Use Acres Sq. Miles Percentage
Commercial 867 1.4 8.21%
Floodplain 688 1.1 6.52%
Industrial 734 1.1 6.95%
Institutional 477 0.7 4.52%
Planned Dev. 629 1.0 5.96%
Residential 6,129 9.6 58.06%
Streets 1,032 1.6 9.78%
Total 10,556 16.5 100.00%
To provide Morehead City with an overview of which areas are susceptible to SLR, land
uses for all seven SLR scenarios were tabulated. Residential and floodplain land uses make up
the greatest percentage of the inundated area for all seven SLR scenarios (Appendix 2). Street
and planned development land uses make up the smallest percentage of inundated area for all the
scenarios except the 2100 Max (1.06 m). The percent of the floodplain land use category
inundated ranged from 13.5% for the lowest level of inundation to 99% for the maximum
inundation scenario (Table 3.9). Considering inundation by acreage, the residential land use was

Adaptation to Sea-Level Rise in North Carolina 66
the greatest area affected, ranging between 260 acres for the lowest level scenario up through
1,230 acres for the maximum inundation scenario (Table 3.9).
Table 3.9 Area inundated by land use (2100 Max, 1.06 m)
2100 Max (1.06 m)
Land Use Acres Sq. Miles
% of
inundated
area
% of total land
use class
Floodplain 687.7 1.074 32.08% 99.92%
Residential 1230.4 1.923 57.40% 20.08%
Institutional 41.3 0.064 1.93% 8.65%
Planned Dev. 66.2 0.103 3.09% 10.51%
Street 31.1 0.049 1.45% 3.01%
Industrial 61.0 0.095 2.85% 8.32%
Commercial 25.9 0.040 1.21% 2.98%
Total 2143.6 3.349 100.00%
The three 2030 scenarios (0.11, 0.16, and 0.21 m) inundated approximately 4-5% of the
total Morehead City ETJ, the 2080 scenarios (0.26, 0.46, and 0.81 m) inundated 5-17% of the
total land area, and the 2100 scenario (1.06 m) inundated one-fifth of the total area (Table 3.10).
Table 3.10 Percent of land inundated by SLR scenario
Scenario
Percent of total land
inundated
2030 Low 4.00%
2030 Mid 4.38%
2030 High 4.85%
2080 Low 5.53%
2080 Mid 11.15%
2080 High 17.26%
2100 Max 20.31%
The land use calculations will assist Morehead City in determining future land use
assuming some level of SLR and allow the town to better understand how much total land will
be lost to inundation. The results also confirm the important role the floodplain plays in the area.

Adaptation to Sea-Level Rise in North Carolina 67
Figure 3.5 Downtown Morehead City under six inundation scenarios.
One of the central planning units utilized in the Morehead City LUP is the
“neighborhood” (The Wooten Company, 2007; Appendix 3). The amount of land inundated by
each SLR scenario varied greatly across neighborhoods. The majority of the floodplain consists
of undeveloped wetlands in the northern portion of the Morehead City ETJ, and this was the area
experiencing the most inundation under each scenario. The three neighborhoods bordering the
Newport River (Neighborhoods 5, 7, and 8; Appendix 3) contained the largest amount of
inundated land for all seven scenarios (Table 3.11). The neighborhoods along Bogue Sound
(Neighborhoods 1-4, 6, 9, and 10) experienced far less inundation than the northern

Adaptation to Sea-Level Rise in North Carolina 68
neighborhoods under all seven scenarios. The downtown area (Figure 3.5) experienced minor
land loss along the northern shoreline.
Table 3.11 Area inundated by neighborhood (acres)
Sea-level rise
scenario (m)
Nbhd
1
Nbhd
2
Nbhd
3
Nbhd
4
Nbhd
5
Nbhd
6
Nbhd
7
Nbhd
8
Nbhd
9
Nbhd
10 Streets
2030 Low (0.11) 21 4 15 8 120 24 69 103 30 11 8
2030 Mid (0.16) 22 4 17 8 133 24 78 115 31 11 9
2030 High (0.21) 23 4 18 8 156 25 86 128 32 11 9
2080 Low (0.26) 24 4 20 9 194 26 97 146 34 11 9
2080 Mid (0.46) 29 5 29 10 584 28 133 283 38 12 12
2080 High (0.81) 39 6 39 13 803 35 221 571 46 15 19
2100 Max (1.06) 62 8 43 15 833 46 342 668 55 20 37
The greater part of the wetlands in the Morehead City ETJ (not including the Haystack
Marshes in Calico Bay), are located in Neighborhoods 5, 7, and 8. These wetlands are
salt/brackish marshes and make up 71-83% of the total wetlands inundated under the 0.16, 0.46,
and 1.06 m scenarios (Appendix 7).
The SLR toolbox will focus on the three inundation scenarios mentioned earlier, the 0.16,
0.46, and 1.06 m results. These results can be displayed in an introductory map for the SLR
toolbox in the LUP (Figure 3.6). As part of the general overview to SLR, calculations were
completed related to the number of structures inundated and the potential tax value lost (Tables
3.12 and 3.13). Wetlands data was also tallied for each of the three inundation scenarios to better
understand which type of wetlands would be lost and to what extent (Appendix 7).
Table 3.12 Structures inundated
Scenario
Structures
inundated
Additional
structures
inundated
2030 Mid (0.16 m) 23 --
2080 Mid (0.46 m) 38 15
2100 Max (1.06 m) 162 124
Total 223

Adaptation to Sea-Level Rise in North Carolina 69
The structure inundation data (Table 3.12) displays the non-linear nature of SLR effects.
There are 15 additional structures inundated between the 0.16 and 0.46 m scenarios, and 124
structures inundated between the 0.46 and 1.06 m scenarios. The sea level increase between the
0.46 and 1.06 m scenario is double the increase between 0.16 and 0.46 m, but the amount of
structures inundated is eight times larger.
Without considering a discount rate, the lost tax value (parcel and structure) reaches 5%
of the total tax base with a 1.06 m rise in sea level (Table 3.13). Total values of lost parcels and
structures for the 2030 Mid (0.16 m) scenario range between $4.5 million (at 7% discount) and
$18.7 million (no discounting) (Table 3.14).

Adaptation to Sea-Level Rise in North Carolina 70
Table 3.13 Costs associated with inundation without considering the discount rate
Scenario
Total Value (Tax
Value)
Percentage of
Tax Value lost
2030 Mid (0.16 m) $18,695,126.00 0.55%
2080 Mid (0.46 m) $26,500,591.00 0.78%
2100 Max (1.06 m) $180,481,846.00 5.31%
Table 3.14 Cost of lost structures including 2% and 7% discount rates
Scenario Total Land Value
Total Structure
Value Other Value
Total Value (Tax
Value)
Percentage of
tax value lost
2030 Mid (0.16m) $11,807,173 $5,046,596 $1,841,357 $18,695,126
2% discounting $7,790,087 $3,329,622 $1,214,883 $12,334,592
7% discounting $2,851,587 $1,218,819 $444,712 $4,515,118 0.55%
SLR Response Toolbox
Three response plans were created to provide a range of options to the Morehead City
Planning Department. For each response strategy a land suitability map was created to determine
areas best suited for development, and calculations relevant to implementation of the plan were
completed.
I. Case-by-case response to SLR
If Morehead City opts to respond to SLR in an ad hoc manner, it will address the hazard
once the first structure becomes threatened. Assuming the 2030 Mid scenario occurs, and
residents and business owners choose not to relocate structures or armor the shore, the first
structures will be threatened around Calico Creek, including the northern shore of the downtown
area. By 2080 (assuming the 0.46 m scenario) structures bordering the northern salt marshes will
begin to experience open-water views (Figure 3.6). The 2100 Max scenario (1.06 m) is projected
to inundate 162 structures (Table 3.12).
For Plan 1, a land suitability map was generated using the previously mentioned grids
(Figure 3.7). Consideration of SLR was kept to a minimum when creating the land suitability
plan. A greater focus was placed on existing infrastructure, and established flood zones.

Adaptation to Sea-Level Rise in North Carolina 71
Table 3.15 Land suitability categories for Plan 1
Suitability Level Acres Sq. miles
Least suitable 1,500 2.3
Low suitability 2,952 4.6
Medium suitability 4,156 6.5
High suitability 1,585 2.5
Total 10,193 15.9
The land suitability map proposes the majority of land will be of medium suitability and
will be located in the current downtown area and along the Route 70 corridor (Table 3.15; Figure
3.7). There would not be enough land rated as highly suitable to cover the projected 2,680 acres
of development predicted for 2025 (Table 3.5). Morehead City currently allows low density
development in flood zones and it can be assumed that future development will not be deterred

Adaptation to Sea-Level Rise in North Carolina 72
by a designation of medium or low suitability. This could mean development continuing to
encroach into the northern salt marshes; an area designated as floodplain that will serve an
important role with increases in sea level (Figure 3.6).
II. Armoring response
The armoring plan will result in a different land suitability map as compared with Plan 1
because no area is considered “least suitable” (Figure 3.8). The threat of flooding is assumed to
be removed and all land can be developed to a certain extent. This means the majority of
projected future development (2,680 acres) will occur in land designated as highly suitable
(Table 3.17). Due to poor soil quality, and potential for a rise in the water table from SLR,
proximity to sewer and water lines is still considered critical for a high or medium rating. Plan 2
does not consider the consequences of storm or flooding events breaching the wall.
An armoring response is another option for Morehead City’s management of SLR. If the
entire shoreline was armored at the 3 foot elevation contour, the total area of the ETJ would be
reduced by approximately 2,000 acres. A little less than 1,400 of the lost 2,000 acres are salt
marshes (Table 3.16). Wetlands within the wall would be filled and used for development, and
wetlands on the other side of the wall would eventually be completely inundated with a 1.06 m
rise in sea level.
Table 3.16 Marsh area affected by SLR
Current 2030 Mid (0.16 m) 2080 Mid (0.46 m) 2100 (1.06 m)
Marsh type Acres Sq. mi Acres Sq. mi. Acres Sq. mi. Acres Sq. mi.
Salt/Brackish Marsh 651 1.02 115 0.18 454 0.71 632 0.99
Drained Salt/Brackish Marsh 720 1.12 97 0.15 364 0.57 717 1.12
Total marsh 1,371 2.14 212 0.33 819 1.28 1,348 2.11

Adaptation to Sea-Level Rise in North Carolina 73
Table 3.17 Land suitability categories for Plan 2
Suitability Level Acres Sq. miles
Low suitability 1,362 2.1
Medium suitability 4,845 7.6
High suitability 2,149 3.4
Total 8,356 13.1
III. Relocation/Migration response
For the third strategy, a land suitability map was created incorporating SLR projections in
several of the weighted layer components. Projected levels of inundation for 2080 were included,
as were vacant parcels above the 2100 inundation level. Wetland migration was factored into the
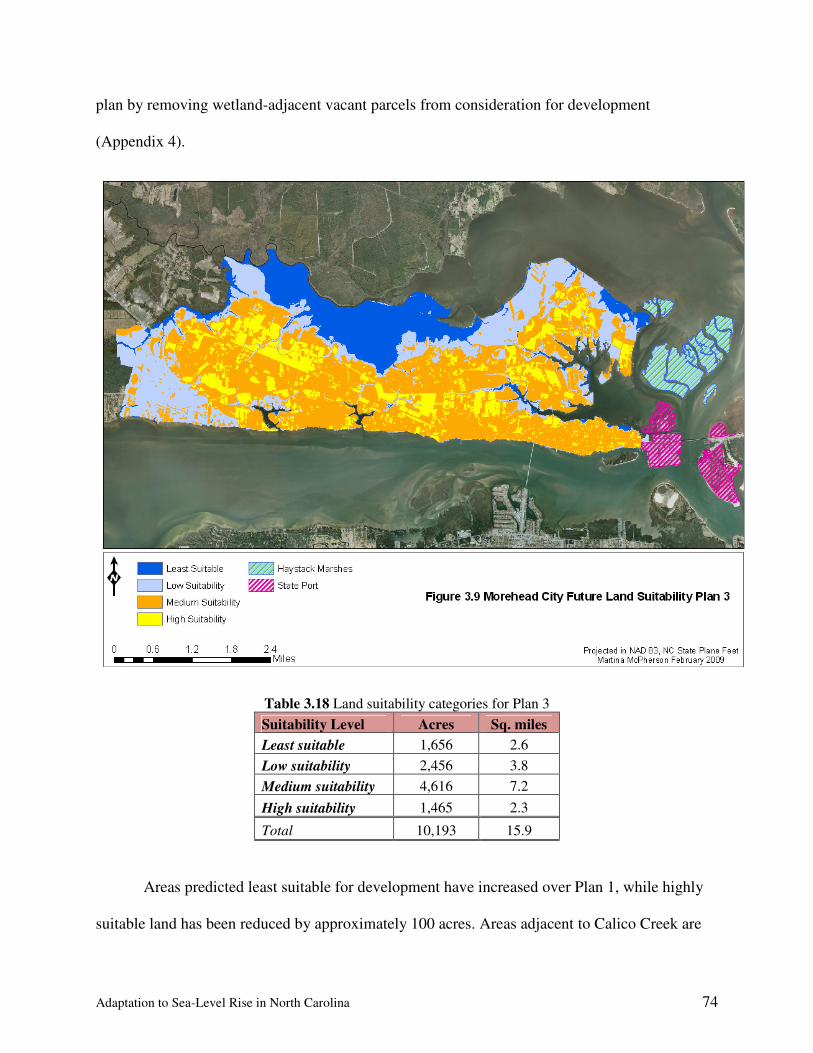
Adaptation to Sea-Level Rise in North Carolina 74
plan by removing wetland-adjacent vacant parcels from consideration for development
(Appendix 4).
Table 3.18 Land suitability categories for Plan 3
Suitability Level Acres Sq. miles
Least suitable 1,656 2.6
Low suitability 2,456 3.8
Medium suitability 4,616 7.2
High suitability 1,465 2.3
Total 10,193 15.9
Areas predicted least suitable for development have increased over Plan 1, while highly
suitable land has been reduced by approximately 100 acres. Areas adjacent to Calico Creek are

Adaptation to Sea-Level Rise in North Carolina 75
considered less suitable in this scenario as compared to Plan 1. Much of the northern shoreline
has been categorized as least suitable or low suitability.
Plan 3 considers vacant parcels for potential relocation of inundated structures in addition
to planning for wetland migration (Figure 3.10).
If Morehead City opts to require soon-to-be-condemned structures to relocate, vacant
parcels will need to be located, preferably near the original location. Generally, there are enough
inland vacant parcels to accommodate all the inundated parcels for all three scenarios (Table
3.19, Appendix 5, and Appendix 6). When adding the projected need for 2,680 acres for future
development by 2025, there is still sufficient vacant land to accommodate inundated parcels in
2030. Vacant land becomes scarcer by 2080 and 2100 (assuming same vacant parcel availability

Adaptation to Sea-Level Rise in North Carolina 76
and future needs). The calculations do not consider the large amount of vacant land designated
as wetlands or the vacant land that is salt marsh adjacent. The vacant marsh land and vacant land
adjacent to the salt marshes would have the greatest effects on the vacancy levels of northern
Neighborhoods 5, 7, and 8.
Neighborhoods 1, 2, 3, 5, and 8 all have vacant inland parcels available for all three
scenarios, but the average size of the parcels is smaller than the average size of the inundated
parcels (Table 3.19, Appendix 5, and Appendix 6). The discrepancy in average parcel size can
partially be attributed to the larger, vacant, low-lying land being inundated before the smaller,
inland parcels in more developed areas. For example, in Neighborhood 5 for the 0.46 m scenario,
8 of the 11 predicted-to-be-inundated parcels are actually vacant and the majority of the inland
vacant parcels are in more heavily developed areas around Route 70.
Table 3.19 Vacant parcel availability and size by neighborhood for the 2080 Mid (0.46 m) scenario
2080 Mid (0.46 m)
Neighborhood
# Vacant
inland
parcels
Avg. size of
vacant inland
parcels (s.f.)
Vacant inland
parcels total
area (acres)
Parcels
inundated
Avg. size
inundated
parcel (s.f.)
Inundated
parcels total
area (acres)
Neighborhood 1 168 8,470 33 32 16,471 12
Neighborhood 2 80 7,668 14 5 13,383 2
Neighborhood 3 114 28,547 75 5 40,873 5
Neighborhood 4 187 47,278 203 1 13,636 0
Neighborhood 5 277 88,273 561 28 1,011,273 650
Neighborhood 6 186 54,854 234 7 17,469 3
Neighborhood 7 495 83,892 953 13 69,931 21
Neighborhood 8 169 291,202 1,130 12 712,274 196
Neighborhood 9 317 63,714 464 6 26,299 4
Neighborhood 10 176 86,633 350 4 31,715 1
Total 2,169 -- 4,017 113 -- 894
Adaptation to Sea-Level Rise in North Carolina 77
3.5 Discussion
Coastal communities in North Carolina will become increasingly at risk for loss of
property and ecosystem health with rising seas. Luckily, SLR will occur at a slow enough pace to
allow for development of a host of adaptation responses. The flip side of the SLR planning coin
is, due to the pace of inundation, town managers and planners will feel little pressure to respond
(Moser, 2005). In the end, SLR could end up being planned for on an ad hoc basis, similar to
how the effects of erosion and development are being addressed along the barrier islands of
North Carolina. Each time a structure becomes threatened by the sea, there is a controversy
surrounding what should have happened, what the response will be, who will pay for it, and what
future policies should entail. As discussed in Chapter 2, this reactive approach is highly
inefficient, and oftentimes neglects natural resource preservation. In planning for SLR, North
Carolina has an opportunity to implement a strategy to avoid the confusion and costs associated
with treating property loss on a case-by-case basis.
As can be seen from the Morehead City case study, SLR inundation results can be
examined at a local level and used for land use planning purposes as simply as a flood zone or
land use designation is used. When communities increase the effectiveness of shoreline
management for non-climate change hazards, they will enhance their ability to respond to sea-
level rise and climate change (Nicholls and Klein, 2005). But given the fact that SLR is listed in
the LUP guidelines as a natural hazard, and North Carolina has been gaining increasing national
attention due to the state’s vulnerability to SLR (Titus et al., 2009; NOAA, 2007; House Report
110-862, 2008), it makes sense to address SLR separately in LUPs rather than assume flood zone
planning will cover anticipated effects.

Adaptation to Sea-Level Rise in North Carolina 78
This study offered three possibilities for addressing SLR within the framework of the
Morehead City LUP. Land suitability maps were created for the three policy approaches, and
various calculations to help in implementation of the approach were also completed. Within each
basic approach are numerous sub-options to be developed by Morehead City in the future (e.g.
easements for wetland migration rather than vacant land purchase, partial armoring along the
more threatened northern shore).
If Morehead City were to develop a SLR toolbox within the LUP, it could specify the
criteria for analyzing/ranking the available options. In order to assist in the ranking would be the
written component discussed earlier. The written component would contain information on
where future development would occur, what would happened to natural systems, what are
advantages and disadvantages to the approach, and how could the approach be implemented.
Plan 1: Case-by-case/reactive
Future development: The location of future development in this scenario can occur wherever
local zoning will allow it. With minimal consideration of SLR potential, there could be an
increase in development along the northern floodplain as well as along the eastern shore of
Neighborhood 7. New development within the northern portions of Neighborhoods 5, 7, and 8
would have to rely on septic systems due to flooding hazards and soil characteristics. Low-
impact development strategies may aid in lessening additional stormwater impacts. Increasing
building elevation requirements within the town ordinances may also lessen the potential damage
associated with flooding and other natural hazards. There is infill potential along the Arendell
Street/US-70 corridor, including the core downtown area.

Adaptation to Sea-Level Rise in North Carolina 79
Natural environment: No additional efforts will be made to protect natural resources in this
scenario even though conserving land for wetland migration will protect the town from greater
storm surges, a natural hazard that Morehead City already acknowledges and includes in the
LUP. The N.C. Coastal Land Trust owns hundreds of acres in the floodplain, but much of the
wetland appears to be under private ownership and could therefore be developed. The primary
nursery areas located in the shallow marshes will become open water with SLR. If appropriate
conditions exist, wetlands may migrate onto adjacent land parcels. This will depend on sediment
availability, slope, and whether property owners encourage or discourage migration. Continuing
development along the northern part of the peninsula will worsen water quality conditions.
Advantages/Disadvantages: This approach will most likely be the least expensive in the short
term, but could get increasingly expensive if the town is left to fund the demolition of structures
in the public trust. It will also face great challenges after destructive storm events when damage
is on a wider scale. Many of the advantages and disadvantages of this approach can be seen in
current barrier island management efforts.
Implementation strategy: Morehead City may opt to go forward with its existing LUP (2007) and
existing ordinances, only addressing SLR as it becomes a threat to property and infrastructure.
Based on the experience of some barrier island communities who have in the past addressed
structure loss on a case-by-case basis, it will make sense lay out standards within the town
ordinances for what kind of activities will be allowed when structures and/or parcels are
threatened by rising sea level. The town could require new shorefront deeds to have demolition
agreements attached and may want to consider implementing height limitations for seawalls, or
other armoring structures. Existing development along the shore will eventually need to be

Adaptation to Sea-Level Rise in North Carolina 80
protected, relocated, or demolished and even if Morehead City chooses not to take a
comprehensive approach to planning for SLR, it still should have a rough idea of what protocol
should be.
Plan 2: Armoring
Future development: The armoring of the entire Morehead City shoreline would be a large
undertaking and require coordination with adjacent communities. A wall like the one displayed
in Plan 2 at the 3-ft contour would be 52 miles long and theoretically protect 8,300 acres of land.
While the wall will protect property from surface water inundation, there is a good possibility
that properties at the shore will become inundated from rising water tables. Impact fees or a tax
assessment may be considered for future development in order to compensate property owners
whose land ends up on the water-side of the wall. Adding the wall may be considered a taking by
property owners like the N.C. Coastal Land Trust who own the majority of the wetlands on the
other side of the wall along the northern shore.
Natural environment: The wall would protect all existing development from SLR inundation but
leave all coastal wetlands susceptible to coastal squeeze and eventual drowning. Loss of coastal
wetlands will likely decrease water quality and productivity of coastal waters which will
inevitably affect the local economy. A hardened shoreline, unless combined with a beach
nourishment project, will lead to loss of the already rare estuarine beaches along Bogue Sound.
Advantages/Disadvantages: Three disadvantages of armoring (Turner et al., 1990): (1) tends to
encourage economic development because armored area is considered safe from natural hazards;
(2) it causes ecological damage and interferes with natural processes; and (3) is inflexible and

Adaptation to Sea-Level Rise in North Carolina 81
hard to remove. An advantage of armoring is it can stabilize the shoreline and prevent further
erosion. In addition, there are several varieties of soft and hard armoring choices:
Figure 3.11 Marsh planting as vegetation control (left) and one year later (right) (Bendell et al., 2006).
Figure 3.12 View of a rubble mound sill (left) and a timber sheet pile sill (right) (Bendell et al., 2006).
Figure 3.13 Sloped structures constructed from rock (left) and watertight cast concrete
(right) (Bendell et al., 2006).
Implementation strategy: The town will need to decide on its level of involvement. It can either
take the lead, using public funds, or allow property owners to coordinate amongst themselves
within parameters laid out in the town ordinances or LUP. There is potential for conflict amongst
property owners regarding types of armoring strategies (soft v. hard), and the town may have to
formalize its desired armoring policy through an ordinance. The town may have to develop a
strategy to mitigate the wetland loss due to hard armoring.

Adaptation to Sea-Level Rise in North Carolina 82
Plan 3: Relocation/Migration
Future development: The third scenario will focus on relocating property rights and/or actual
structures from the inundated shore to inland parcels. An inland parcel matching system could be
required for new shoreline purchases, as well as for existing threatened parcels. A vacant parcel
analysis will be useful to rank parcels based on proximity to the original parcel or proximity to
water, depending on what the owner is interested in. Future development should focus on infill
development along Arendell Street and in the core downtown.
Natural environment: The migration of coastal marshes will be allowed to occur naturally
upland. The surrounding migration buffer will have to be studied to judge whether the marsh will
be able to migrate naturally or will require man-made alterations (plantings, grading of slopes,
seawall removal). With the growing amount of development around the Newport Marshes in the
northern part of the peninsula, vacant land dedicated solely to conservation will be harder to
acquire. The town may find it more prudent to focus on acquiring conservation easements rather
than entire parcels (Wynia, 2007). Man-made ditches in marshes will be filled to prevent salt-
water intrusion and slow SLR inundation.
Advantages/Disadvantages: There are several disadvantages associated with this approach: (1)
higher perceived costs of relocating structures (as compared with hardening); (2) stricter town
ordinances related to development may discourage future development; and (3) public resistance
to idea of “retreat” (Burby and Nelson, 1991; Turner et al. 1990). Some advantages include
maintaining ecosystem integrity (and the associated economic benefits) and lessening the risk of
damage from natural hazards.
Adaptation to Sea-Level Rise in North Carolina 83
Implementation strategy: Stringent standards on parcel/structure relocation will have to be
incorporated into the town ordinances, including clarification on when a structure or parcel must
be relocated. There will also need to be a mechanism in place if a homeowner refuses to move.
Data on vacant parcels will have to be consistently updated by the Planning Department. The
town will have to decide what to do with existing seawalls. It may be effective to partner with
local conservation groups to manage the wetland migration projects, including the filling of
ditches and potential grass plantings. The town could consider encouraging a system where
wetland mitigation banks can purchase vacant land for wetland migration. The LUP may be a
better vehicle for an adaptive management approach but not without an ordinance strengthening
the LUPs influence.
These brief written components, paired with the land suitability maps, and relevant
implementation data are only the beginning of what could potentially be a robust toolbox for
Morehead City’s adaptation to SLR. As each response scenario is fleshed out, communities can
begin to pull together aspects of each strategy that will best suit their needs.
The inclusion of a SLR toolbox within the local land use plan may be helpful to guide
development, but there is no mechanism in place that demands the land suitability maps be
followed. While the creation of a SLR toolbox will undoubtedly advance the town’s planning
capacity, it will make no difference unless the LUP’s level of influence changes. As discussed in
Chapter 1, Morehead City’s LUP contains a disclaimer “that the Land Use Plan is one of a
variety of guides in making a public policy decision. The Plan should be viewed as a tool to aid
in decision making and not as the final decision.” (emphasis added; The Wooten Company,

Adaptation to Sea-Level Rise in North Carolina 84
2007). Investing the time and money into the creation of a SLR toolbox does not make sense
without a mechanism ensuring some degree of enforcement.
3.6 Recommendations
There are undoubtedly many uncertainties attached to coastal zone planning, but as
discussed, the cautionary principle does not have to apply. There is inherent uncertainty with all
natural events and processes threatening coastal communities on an annual and daily basis, and
this has not prevented planners from considering these threats when planning development or
opting to preserve land.
In order for local coastal communities in North Carolina to successfully begin planning
for SLR the state needs to take on a stronger role guiding adaptation strategies, local LUPs need
to become the guiding document in development decisions, and the SLR toolbox needs to
provide as much flexibility as possible.
State Leadership
The state’s role is addressing SLR will be important on two levels. First, it should be the
leader in integrating all the committees, commission, reports, and agencies involved with SLR
planning. Second, it needs to provide guidance and support to local communities.
I. Integrated Planning
The State of Maryland created a Climate Commission in 2007 that was tasked with
preparing for the “likely consequences and impacts of climate change…and to establish firm
benchmarks and timetables for implementing the Plan of Action” (Exec. Order 01.01.2007.07).

Adaptation to Sea-Level Rise in North Carolina 85
The Maryland Climate Commission’s Final Report, released in August, 2008, acknowledged a
fragmented approach to SLR will be ineffective and lists “integrated planning” as the first
priority policy recommendation for the reduction of SLR impact to existing and future growth
and development (MD Climate Action Plan, 2008).
The State of North Carolina needs to replace its fragmented approach to SLR with a
clear, integrated system. FEMA granted $5 million to the North Carolina DEM to complete a
statewide risk assessment for sea level rise (FEMA, 2009). The study will identify and evaluate
short-term mitigation strategies and long-term adaptation strategies to reduce vulnerability to
SLR (NC DEM, 2009). The study will present an opportunity to plan out integration of the
multiple commissions and agencies beginning to address SLR. Unfortunately, the proposed
membership roster for the Study’s Advisory Committee is missing representatives from several
critical NC agencies, such as the DCM, DWQ, and DMF. The State of North Carolina cannot
effectively address SLR if it continues to allow coastal zone management agencies to study and
address SLR separately from emergency and hazard management groups.
In addition to the fragmented approach to SLR management, the coastal zone is divided
even further between ocean and estuarine management policies. Both the Ocean Policy Steering
Committee and the Beach and Inlet Management Plan are addressing future coastal issues, but
neither is taking a hard look at the estuarine shoreline. In 2004, within a NOAA review of North
Carolina’s Coastal Management Program, a suggestion was made to the DCM to “continue to
increase its focus on estuarine planning and management” and in the next review, in 2006,
NOAA found little progress in the area besides DCM’s participation in NOAA’s “Ecological
Effects of SLR” program (NOAA, 2006).The Coastal Habitat Protection Plan (2005) may be a
better vehicle to address SLR because it includes all waters flowing into coastal waters and the

Adaptation to Sea-Level Rise in North Carolina 86
watersheds they drain (Street et al., 2005). Recommendations in the CHPP have led to the
creation of plans or committees addressing both oceanfront and estuarine concerns.
II. Guidance and Support
While coastal communities in North Carolina have been allowed to develop and
implement LUPs themselves, as Maryland’s Climate Commission concluded, addressing SLR
will require guidance from the state level. Local communities can begin to adapt to SLR
themselves, but not every community has the resources or incentives to begin examining the
issue. In Maryland, the state has initiated several studies on economics, erosion, SLR modeling,
and mapping in order to provide adaptation tools for local communities (Johnson, 2008).
In addition to providing tools for local communities, the state will have to translate SLR
planning strategies into regulatory programs and local communities will have to adopt town
ordinances to the same effect (MD Climate Action Plan, 2008). The importance of SLR planning
being codified may be better addressed locally by strengthening LUPs both in terms of its
content, as well as its influence on development decisions.
Role of Local Land Use Plan
Local LUPs in North Carolina have been criticized for not being enforceable documents.
While incorporating SLR into the LUP is important, it is critical for Morehead City to adopt an
ordinance addressing SLR. To improve the overall effectiveness of LUPs, the state may have to
revise LUP guidelines, similar to what occurred when stricter language was implemented as a
result of the 2002 guideline revisions. The OPSC’s Final Draft Report makes a similar
recommendation (2009).

Adaptation to Sea-Level Rise in North Carolina 87
It is difficult to enforce LUP recommendations when communities are hesitant to restrict
development and therefore allow local ordinances to shape the LUP rather than allowing the
LUP to drive the content of the ordinances. For example, the land suitability map in the
Morehead City LUP (Figure 3.4) designates the majority of the northern marshes as “least
suitable” and the entire area is a NFIP flood zone (AE). The zoning map delineates the same area
as a “Floodplain District.” In the Morehead City town ordinance, the floodplain district is
acknowledged as land that is “environmentally sensitive,” however it can be developed once a
special use permit is issued. The ordinance defines “special use” as a use not generally
appropriate for the zoning designation, but when “controlled as to number, area, location, ore
relation to the neighborhood, would promote the public health, safety, morals, or the general
welfare” (Unified Development Ordinance, 2001). In other words, the community allows
development under the special use permit in the flood zone, even though the LUP designates the
land “least suitable” for development. This is one of many examples where the LUP seems to
have minimal influence on the content and objective of the ordinance.
Besides the state taking regulatory action to make LUPs binding, or local communities
instituting ordinance language that either addresses SLR directly, or defers to the LUP for
development policy guidance, another option is a regional planning approach. Regional planning
often takes the form of special overlay zones that cover several jurisdictions within a coastal
zone (Davis, 2004). Regional planning organization can aid local communities in implementing
relevant ordinance or bylaw language. In Cape Cod, Massachusetts, a regional planning
organization provides bylaw language for local towns including language for a Floodplain
Overlay District where no development or redevelopment is allowed in the FEMA V-zone (Cape

Adaptation to Sea-Level Rise in North Carolina 88
Cod Commission, 2009). This type of guidance is a step removed from direct state mandates, and
would allow the local governments to be unified around their particular coastal interests.
Flexible Planning Options
Due to the uncertainty surrounding SLR effects and the public’s hesitancy in discussing
it, Morehead City should approach planning for SLR with the initial goal of examining as many
policy responses as possible. Once potential policies are acknowledged, the tools needed to
address these policies must be identified and developed, preferably with help from the state.
Similar to what the Maryland Climate Commission suggested, the state must take on some
responsibility in developing tools for local communities to use (MD Climate Action Plan, 2008).
In a recent meeting regarding the development of the NC Beach and Inlet Management Plan,
Director of the Division of Coastal Management, Steve Underwood, commented on coastal
management methods and responding to new challenges like SLR: "People want more tools in
their toolbox. Trust me - there's no silver bullet out there." (The Virginian-Pilot, 2009). In
addition to coastal managers and planners, the general public will feel more comfortable
knowing options are available. Poulter et al. (2009) recommend that as the newest SLR policy
window begins to open in North Carolina, alternatives must be made available.
Funding
Availability of funding will greatly influence the extent to which these recommendations
can be addressed. With growing interest on the part of the federal government in studying
adaptation strategies for SLR, there may be increasing opportunities to gain funding directly
from FEMA or NOAA budgets, similar to the $5 million in funding DEM received in the FEMA

Adaptation to Sea-Level Rise in North Carolina 89
2009 budget. Local governments will also need to locate funding to revise LUPs and incorporate
SLR plans. North Carolina has several trust funds available for coastal planning projects
including the Parks and Recreation Trust Fund, Natural Heritage Trust Fund, and the Clean
Water Management Trust Fund which allocated $100 million in grants in 2007 (Wynia, 2007).
Nonprofit or private partnerships are possible sources of funding; organizations like the Doris
Duke Foundation, Pew Charitable Trust, or the Rockefeller Family Trust (Wynia, 2007). Local
communities could also apply for FEMA Hazard Mitigation Grants to aid in developing Hazard
Mitigation plans. Other revenue streams such as occupancy taxes, meal taxes, licenses, impact
fees, and property taxes can also be considered.
The above recommendations should be considered as a starting point for effective
adaptation to SLR in the State of North Carolina. Over the next few years the state can take the
lead in bringing together the various stakeholders involved in coastal zone management to create
an integrated SLR response framework.

Adaptation to Sea-Level Rise in North Carolina 90
CHAPTER 4
Conclusion
This study assembled several SLR response options and transformed them into land use
planning tools for eventual use in a local land use plan SLR toolbox. By examining selected
North Carolina laws, policies, reports, and guidelines related to coastal zone management as well
as by looking at a cross-section of current and future coastal challenges, recommendations were
made on how to make SLR adaptation a reality. Although the State of North Carolina is years
away from providing extensive support to local communities planning for SLR, the results
provided here should prove adaptation can be implemented at the local level with a great deal of
flexibility using data already available through local planning departments.
The review of coastal policy and current coastal challenges in North Carolina revealed
growing conflicts over management decisions along both the oceanfront and estuarine shoreline.
In anticipation of potential challenges in the coastal zone, the federal government issued the
Coastal Zone Management Act (1972) from which the North Carolina Coastal Area Management
Act (1974) followed. Within the last decade there has been an increase in legislative and
regulatory activity surrounding coastal management issues, in particular concerns over
deteriorating ecological conditions due to development and shoreline stabilization strategies.
Although SLR was mentioned in early coastal zone legislation, there was no effort by the
state or local governments to study or plan for it. The lack of active planning could be attributed
to the general less-developed nature of the coast at the time of the CZMA and CAMA. The
incredible amount of growth along the coast from the 1970s through today has forced coastal
managers to try and manage the effects of natural processes that have always occurred, but are
only noticed when structures are damaged. SLR has been neglected as a policy issue for decades,

Adaptation to Sea-Level Rise in North Carolina 91
because damage to coastal structures was generally chalked up to large storm events, and there
was less concern over protecting coastal ecosystem integrity.
In the last decade, scientific studies and private interests have begun to challenge
traditional coastal policies in the State of North Carolina. State and local decision-makers are
starting to weigh traditional management policies along both the estuarine and ocean shorelines
against new options. As discussed in Chapter 2, there are a myriad of issues concerning coastal
zone management that will need to be addressed within the next few years, mainly because it
will no longer be prudent for local and state governments to stay the same course (beach
nourishment, Beach Plan, armoring, etc). Many of these issues will only be exacerbated by rising
seas.
In the last two years, there has been a more pro-active effort by North Carolina decision-
makers and state agencies to address mounting coastal challenges. The formation of the OPSC
(2008), the drafting of the BIMP (2008), and the burgeoning N.C. SLR Risk Assessment Study
(2009) are indicative of this trend. In a memorandum presented to the N.C. Legislative
Commission on Climate Change at the beginning on 2009, the Nicholas Institute for
Environmental Policy Solutions outlined options for policy makers in planning for climate
change, including planning for SLR and intense storms (Holman, 2009). The OPSC in their Final
Draft Report (2008) stress the importance of addressing coastal vulnerability in order to allow for
better community responses to SLR. The OPSC also encouraged adoption of a SLR component
into CAMA land use plan guidelines. Given the growing momentum behind addressing SLR in
North Carolina, developing a SLR management toolbox could help communities go beyond
discussing the threat and towards actively taking some degree of control over it.

Adaptation to Sea-Level Rise in North Carolina 92
In order to try and develop a SLR toolbox, a North Carolina coastal community was
selected for study. The Town of Morehead City case study resulted in the creation of three
prototype SLR response strategies. The development of these options did not require much data
beyond what is presently available at the local planning level. Even the inundation results, which
were provided by an outside source, could be crudely replicated by isolating elevation contours
corresponding to projected sea levels. The three response strategies developed for Morehead City
are only the beginning of a possible toolbox full of variations or completely novel response
strategies to SLR. This is a new approach that allows for options beyond the traditional three
response scenarios (IPCC, 1990), allowing a community the ability to adaptively manage SLR.
Several lessons were gleaned from the development of the prototype response strategies
and land suitability maps for Morehead City. A stronger state role, a more stringent or
enforceable LUP, and management flexibility were all determined to be critical to successfully
developing a SLR toolbox. Once the scaffolding for the SLR toolbox is in place, the state can
begin to identify existing and desired technical tools (inundation modeling for all coastal
counties, revised NFIP flood zones, wetland migration models, prioritization of lands for
conservation easements).
The State of North Carolina is poised to begin adapting to SLR and local coastal
communities will be important players in the SLR planning game. With the right tools, coastal
communities will minimize threats and damage to property, and ensure the continued function of
natural systems.

Adaptation to Sea-Level Rise in North Carolina 93
ACKNOWLEDGMENTS
I would like to thank several individuals who have made this project possible. Sandi
Watkins at the Morehead City Planning Department and Benjamin Poulter at the Potsdam
Institute for Climate Impact Research provided the majority of the geospatial data used in the
Morehead City case study. Many thanks to my incredibly patient and calm advisor, Dr. Pat
Halpin. Pat was an invaluable source of knowledge and insight throughout my time at the
Nicholas School. Thanks also to Dr. Michael Orbach, at the Duke Marine Lab, who helped shape
my project during its infancy. Jim Stephenson of the North Carolina Coastal Federation deserves
many thanks for allowing me so many incredible opportunities while working with him as a
Stanback Intern. My experience with the Coastal Federation was the heart of this project.
I will never be able to thank my family enough for their support throughout this project
and my time here at Duke. My father and stepmother, Roy and Luci, always gave me the
encouragement and advice I needed at exactly the right time. My sister, Maia, managed to
consistently bring laughter and joy to my life throughout this journey. Lastly, this project was
completed in memory of my mother, Jasenka, who taught me the beauty of balancing the built
and natural environment; your insight and love continues to guide me everyday.

Adaptation to Sea-Level Rise in North Carolina 94
REFERENCES
An Act to Extend the Legislative Commission on Global Climate Change (2008). North Carolina
S.L. 2008-81 (H.B. 2539). An Act to Provide for Improvements in the Management of Stormwater in the Coastal Counties
(2008). North Carolina S.L. 2008-211 (S.B. 1967). AIR Worldwide Corporation. 2008. The Coastline at Risk: 2008 Update to the Estimated Insured
Value of U.S. Coastal Properties. Boston, MA: AIR Worldwide Corporation. Albemarle-Pamlico National Estuary Program. 2009. An Estuary of National Significance.
[online]. Available from: http://www.apnep.org/pages/about-ap.html . Accessed 2009 March 6.
Appalachian State University. 2007 June 23. North Carolina Coastal Economy Vulnerable To
Sea Level Rise. ScienceDaily. Available from: http://www.sciencedaily.com /releases/2007/06/070622184644.htm. Accessed 2008 August 22.
Applied Technology and Management (ATM). 2002. Mason Inlet Relocation, Wrightsville
Beach, North Carolina. [online].Available from: http://www.appliedtm.com/projects/coastal/mason-inlet.htm. Accessed 2009 March 5.
Beach, D. 2002. Coastal sprawl: the effects of urban design on aquatic ecosystems in the United
States. Arlington, VA: Pew Oceans Commission. Available from: http://www.pewtrusts.org/our_work_report_detail.aspx?id=30037. Accessed 2009 February 8.
Bendell, B.M. et al. 2006. Recommendation for Appropriate Shoreline Stabilization Methods for
the Different North Carolina Estuarine Shoreline Types. Morehead City, NC: North Carolina Department of Environment and Natural Resources, Coastal Resources Commission Estuarine Shoreline Stabilization Subcommittee.
Berke, P.R., Godschalk, D.R., and Kaiser, E.J. 2006. Urban land use planning (5th edition).
Urbana, Illinois: University of Illinois Press. Bin, O., Dumas, C., Poulter, B., and Whitehead, J. 2007. Measuring the Impacts of Climate
Change on North Carolina Resources. Washington DC: National Commission on Energy Policy.
Burby, R.J. and Nelson, A.C. 1991. Local government and public adaptation to sea-level rise.
Journal of Urban Planning and Development; 117(4): 140-153. Butcher, B. 2007 Aug 22. Plan to use tax for Mason Inlet opposed. Wilmington Star News,
Available from: http://www.starnewsonline.com/article/20070822/NEWS/708220461/-1/XML. Accessed 2008 August 22.

Adaptation to Sea-Level Rise in North Carolina 95
Burke, D. 2004. Living Shorelines Stewardship Initiative. Annapolis, MD: Burke Environmental
Associates, LLC. Available from: http://www.campbellfoundation.org/html/documents/LivingShorelinesFinal.pdf. Accessed 2009 March 6.
Cahoon, D.R., Day, J.W., Young, R.S. and Reed, D.J. 1998. Global climate change and sea-level
rise: estimating the potential for submergence of coastal wetlands. In Vulnerability of Coastal Wetlands in the Southeastern United States: Ch. 3. Lafayette, LA: USGS.
Cahoon, D.R. 2007. Factors affecting coastal wetland loss and restoration: synthesis of U.S.
Geological Survey science for the Chesapeake Bay ecosystem and implications for environmental management. USGS Circular 1316: Chapter 12.
Cape Cod Commission. 2009. Cape Cod Commission Model Bylaws and Regulations. [online].
Available from: http://www.capecodcommission.org/bylaws/. Accessed 2009 March 27. Center for Sponsored Coastal Ocean Research (CSCOR). 2007. Planning for the Impacts of Sea
Level Rise and Climate Change: Workshop Summary (2007 February 1). Silver Spring, MD: NOAA.
Coastal Zone Management Act (CZMA) of 1972. 16 U.S.C. § 1451 and § 1452: Congressional
Findings (Section 302), Congressional declaration of policy (Section 303). Commission on Marine Science, Engineering and Resources. 1969. Our Nation and the Sea: A
Plan for National Action (Stratton Report). Washington DC: United States Government Printing Office. Available from: http://www.lib.noaa.gov/noaainfo/heritage/stratton/title.html. Accessed 2009 March 9.
Community Improvement Committee of Morehead City Woman’s Club. 1982. A pictorial
history of Morehead City, 1714-1981. Greenville, NC: Highland Press. Davis, B.C. 2004. Regional planning in the US coastal zone: a comparative analysis of 15 special
area plans. Ocean & Coastal Management; 47: 79-94. Dean, C. 2009 March 8. Surfers Deal a Blow to a Beach Dredging Project. New York Times.
Available from: http://www.nytimes.com/2009/03/09/science/earth/09surfers.html?_r=2&emc=. Accessed 2009 March 11.
Donnelly, J.P. and Bertness, M.D. 2001. Rapid shoreward encroachment of salt marsh cordgrass
in response to accelerated sea-level rise. Proceedings of the National Academy of Sciences of the United States of America 2001; 98(25):14218-23.
Dorney, J., Hugget, D., and Ferrell, R. 2004. State Wetland Programs: North Carolina.
Windham, ME: Association of State Wetland Managers. [online]. Available from

Adaptation to Sea-Level Rise in North Carolina 96
http://www.aswm.org/swp/northcarolina9.htm. Accessed 2009 March 11. Douglas, B.C. and Peltier, E.R. 2002. The puzzle of global sea level rise. Physics Today; 55: 35-
40. Duda, A.M. and Cromartie, K.D. 1982. Coastal Pollution from Septic Tank Drainfields. Journal
of the Environmental Engineering Division, American Society of Civil Engineers; 108(6):1265-1279.
Dumas, C., Herstine, J. and Whitehead, J. 2007. The Economic Effects of a Dredging and
Maintenance Program for the AIWW in NC: Presentation at Appalachian State University. Available from: www.appstate.edu/~whiteheadjc/research/presentations/cnrep2007.pdf. Accessed 2009 March 13.
Drye, W. 2008 June 13. Vast Peat Fire May Burn for Months in North Carolina. National
Geographic News. Available from: http://news.nationalgeographic.com/news/2008/06/080613-wildfire-peat.html. Accessed 2009 March 14.
Environmental Protection Agency. 2009. Climate Ready Estuaries, Coastal Toolkit: EPA
Climate Change. [online] Available from: http://www.epa.gov/climatereadyestuaries/shorelinessoft.html. Accessed 2009 February 9.
Erickson, K.M., Kraus N.C., and Carr, E.E. 2003. Circulation change and ebb shoal development
following relocation of Mason Inlet, North Carolina. Proceedings Coastal Sediments’03: 2003.
Executive Order 01.01.2007.07 establishing Commission on Climate Change (2007). State of
Maryland Governor Martin O’Malley. Federal Emergency Management Agency. 2009 Feb 24. FEMA Grants $5 Million For Sea Level
Rise Study In North Carolina. FEMA Press Release. Available from: http://www.fema.gov/news/newsrelease.fema?id=47583. Accessed 2009 March 12.
Federal Emergency Management Agency. 2002. National Flood Insurance Program: Program
Description. [online]. Available from: http://www.fema.gov/library/viewRecord.do?id=1480. Accessed 2009 March 13.
Federal Emergency Management Agency. 2007. Hazard Mitigation Assistance (HMA)
Guidance: Mitigation Project Application Guidance. [online]. Available from: http:// www.semo.state.ny.us/uploads/FY_09_HMA_Guidance.pdf. Accessed 2009 March 12.

Adaptation to Sea-Level Rise in North Carolina 97
FitzGerald, D.M., Fenster, M.S., Argow, B.A., and Buynevich, I.V. 2008. Coastal impacts due to Sea-level rise. Annual Review Earth Planetary Science; 36:601.
Frolking, S. and Roulet, N.T. 2007. Holocene radiative forcing impact of northern peatland
carbon accumulation and methane emissions. Global Change Biology; 13: 1079-1088. Fuller, J. and McGill, K. 2005. How Important is Tourism in North Carolina? – Tourism Satellite
Account. Available from: http://www.nccommerce.com/en/TourismServices/PromoteTravelAndTourismIndustry/TourismResearch/EconomicImpactTourismNC/tourismSatelliteAccount.htm. Accessed 2009 February 20.
Galloway, G. 2008 Oct 17. Risk Communication and Sea Level Rise: Presentation at the Impacts
of Climate Change on an Evolving North Carolina Coast Symposium. UNC-Chapel Hill. Glantz, M.H. (ed.). 1988. Societal Responses to Regional Climate Change: Forecasting by
Analogy. Boulder, CO: Westview Press. Godschalk, D.R. 1998. Coastal Hazards Mitigation: Public Notification, Expenditure
Limitations, and Hazard Area Acquisition. Chapel Hill, NC: University of North Carolina Center for Urban and Regional Studies.
Godschalk, D.R., et al. 1999. Natural hazard mitigation: Recasting disaster policy and planning.
Washington DC: Island Press. The Hazard Mitigation Technical Assistance Partnership, Inc. 2000. Evaluation of CRS Credited
Activities During Hurricane Floyd. Washington DC: Federal Emergency Management Agency.
Henderson, B. 2009 March 3. Duke set to give N.C. coast $1 million. Charlotte Observer.
Available from: http://www.charlotteobserver.com/breaking/story/572910.html. Accessed 2009 March 11.
Hibbs, M. 2009 Feb 6. Job cuts, cargo down at state port. Carteret County News-Times.
Available from: http://www.topsailvoice.com/articles/2009/02/06/news-times/news/doc498c70b9cd621501906682.txt. Accessed 2009 Feb 10.
Holman, B. 2009. Options for Planning and Adapting to Impacts of Global Climate Change
in North Carolina: Memorandum to Members of the Legislative Commission on Global Climate Change.
Ingram, S.S. 2009 March 9. Holden Beach gets $1.6 in FEMA funds for beach restoration.
Brunswick Beacon. Available from: http://www.brunswickbeacon.com/cgi-bin/c2printstory.cgi?048+article+sectionname+200903032111340485. Accessed 2009 March 15.

Adaptation to Sea-Level Rise in North Carolina 98
Intergovernmental Panel on Climate Change (IPCC). 1990. Strategies for adaptation to sea level rise: Report of the Intergovernmental Panel On Climate Change Response Strategies Working Group, Coastal Zone Management Subgroup. Available from: http://www.epa.gov/climatechange/effects/downloads/adaption.pdf. Accessed 2009 January 15.
IPCC. 2007. Summary for policymakers: Contribution of working group I to the fourth
assessment report of the Intergovernmental Panel on Climate Change. Available from: http://www.ipcc.ch/SPM2feb07.pdf. Accessed 2009 January 15.
Jacewicz, K. 2008 Dec 9. Ocean Isle contributes money for lobbyist to help pass bill allowing
terminal groins. Brunswick Beacon. Available from: http://www.brunswickbeacon.com/cgi-bin/c2.cgi?048+article+News+20081209125516048049020. Accessed 2009 February 11.
Johnson, Z.P. 2000. A Sea Level Rise Response Strategy for the State of Maryland. Annapolis,
MD: Maryland Department of Natural Resources Coastal Zone Management Division. Johnson, Z.P. 2008 Oct 17. Adaptation and Response Planning in Maryland: Presentation at the
Impacts of Climate Change on an Evolving North Carolina Coast Symposium. UNC-Chapel Hill.
Kalo, J.J., Hildreth, R.G., Riesler, A. and Christie, D.R. 2007. Coastal and Ocean Law (3rd
Edition). St. Paul, MN: Thomson West. Killough, W.H. 2009 April 1. White House Pulls Beach Renourishment Projects Off Federal
Stimulus List. Island Gazette. Available from: http://www.islandgazette.net/content/index.php?option=com_frontpage&Itemid=1. Accessed 2009 April 3.
Killough, W.H. 2009 March 25. Judge rules State reconsider coastal insurance Beach Plan
increases. Island Gazette. Available from: http://www.islandgazette.net/content/index.php?option=com_frontpage&Itemid=1. Accessed 2009 April 3.
Killough, W.H. 2009 Feb 4. Carolina Beach To Join Consortium Seeking Allowance For
Terminal Groins. Island Gazette. Available from: http://www.islandgazette.net/content/index.php?option=com_frontpage&Itemid=1. Accessed 2009 February 27.
Kirwan, M.L. and Murray, A.B. 2007. A coupled geomorphic and ecological model of tidal
marsh evolution. Proceedings of the National Academy of Sciences; 104 (April 10, 2007): 6118-6122.

Adaptation to Sea-Level Rise in North Carolina 99
Kozak, C. 2009 March 12. N.C. official: Coast management needs collaboration. The Virginian-Pilot. Available from: http://hamptonroads.com/2009/03/nc-official-coast-management-needs-collaboration. Accessed 2009 March 17.
Kozak, C. 2009 Feb 8. Sandbag removal in N.C. coming, but not soon. The Virginian-Pilot.
Available from: http://hamptonroads.com/2009/02/sandbag-removal-nc-coming-not-soon. Accessed 2009 February 13.
Mallin, M.A., Ensign, S.H., McIver, M.R., Shank, G.C. and Fowler, P.K. 2001. Demographic,
landscape, and meteorological factors controlling the microbial pollution of coastal waters. Hydrobiologia; 460:185-193.
Mallin, M.A., Williams, K.E., Esham, E.C. and Lowe, R.P. 2000. Effect of human development
on bacteriological water quality in coastal watersheds. Ecological Applications; 10(4):1047-1056.
Maryland Commission on Climate Change. 2008. Climate Action Plan Final Report: Chapter 5,
Comprehensive Strategy for Reducing Maryland’s Vulnerability to Climate Change. Maryland Department of Natural Resources. 2006. Living Shorelines. [online]. Available from:
http://shorelines.dnr.state.md.us/living.asp. Accessed 2009 March 6. McGrath, G. 2009 Feb 26. Proposed coastal fund would pay to remove threatened oceanfront
structures. Wilmington Star News. Available from: http://www.starnewsonline.com/article/20090226/ARTICLES/902260287. Accessed 2009 March 3.
McGrath, G. 2009 Feb 2. State wins round in sandbag struggle. Wilmington Star News.
Available from: http://www.starnewsonline.com/article/20090202/articles/902020310. Accessed 2009 Feb 13.
McGrath, G. 2009 Jan 6. Judge gives Riggings' sandbags a stay of execution. Wilmington Star
News. Available from: http://www.starnewsonline.com/article/20090106/ARTICLES/901060266/1118/NEWS01?Title=Judge_gives_Riggings__sandbags_a_stay_of_execution. Accessed 2009 February 13.
McGrath, G. 2008 Sept 19. First letters regarding exposed sandbags mailed this week.
Wilmington Star News. Available from: http://www.starnewsonline.com/apps/pbcs.dll/article?AID=/20080919/ARTICLES/809190233. Accessed 2009 February 13.
Michael, J.A. 2007. Episodic flooding and the cost of sea-level rise. Environmental Economics;
63: 149-159.

Adaptation to Sea-Level Rise in North Carolina 100
Milliman, Inc. 2008. Milliman Report: An Analysis of the North Carolina Beach Plan and the Future of the State’s Property Insurance System. Des Plaines, IL: Property Casualty Insurers Association of America (PCI).
Moorehead, K.K. and Brinson, M.M. 1995. Response of wetlands to rising sea level in the lower
coastal plain of North Carolina. Ecological Applications; 5(1): 261-271. Moser, S.C. 2005. Impact assessments and policy responses to sea-level rise in three US states:
An exploration of human-dimension uncertainties. Global Environmental Change; 15(2005): 355-369.
National Climatic Data Center. 2008. Billion Dollar Climate & Weather Disasters: 1980-2008.
[online]. Available from: http://www.ncdc.noaa.gov/oa/reports/billionz.html#narrative. Accessed 2009 March 12.
National Hurricane Center. 2006. Hurricane Preparedness: Hurricane History. [online] Available
from: http://www.nhc.noaa.gov/HAW2/english/history.shtml, Accessed 2009 March 12. National Hurricane Center. 2007. Hurricane Preparedness: Storm Surge. [online] Available from:
http://www.nhc.noaa.gov/HAW2/english/storm_surge.shtml#historic. Accessed 2009 March 12.
National Oceanic & Atmospheric Administration. 2006. Evaluation Findings: North Carolina
Coastal Management Program, April 2003 – February 2006. Available from: http://coastalmanagement.noaa.gov/mystate/docs/NorthCarolinaCMP2006.pdf. Accessed 2009 January 20.
National Oceanic & Atmospheric Administration, Coastal Services Center. 2008. Historical
Hurricane Tracks. Available from: http://maps.csc.noaa.gov/hurricanes/viewer.html. Accessed 2009 March 10.
National Park Service. 1997. Saving the Cape Hatteras Lighthouse From the Sea. [online].
Available from: http://www.nps.gov/archive/caha/1997update.htm. Accessed 2009 March 12.
National Park Service. 2004. Barrier Island Ecology of Cape Lookout National Seashore and
Vicinity, North Carolina. NPS Scientific Monograph; No. 9. Available from: http://www.nps.gov/history/history/online_books/science/. Accessed 2009 March 12.
New Hanover County. 2003. Mason Inlet 2003 Assessment. New Hanover County, NC. [online].
Available from: http://www.nhcgov.com/AgnAndDpt/Finc/Pages/MasonInletAssessment.aspx Accessed 2009 March 5.

Adaptation to Sea-Level Rise in North Carolina 101
Nicholls, R.J. and Klein, R.J.T. 2005. Climate change and coastal management on Europe’s coast (Managing European Coasts: Past, Present, and Future). Berlin, Germany: Springer Environmental Science Monograph Series.
Nicholls, R.J. et al. 2007. Coastal systems and low-lying areas. Climate Change 2007 Impacts,
Adaptation and Vulnerability: Contribution of Working Group II to the Fourth Assessment Report of the Intergovernmental Panel on Climate Change. Cambridge, UK: Cambridge University Press.
North Carolina Clean Water Management Trust Fund. 2007. Funded Projects by Applicant Type.
[online]. Available from: http://www.cwmtf.net/. Accessed 2009 February 12. North Carolina Climate Change Advisory Group. 2008. CAPAG Final Report. Available from:
http://www.ncclimatechange.us/capag.cfm. Accessed 2009 March 5. North Carolina Coastal Area Management Act (CAMA) of 1974. North Carolina G.S. 113A-100. North Carolina Coastal Federation. 2002 Sept 19. Bogue Banks' Beaches Almost Lifeless After
Renourishment: Emerald Isle Next. [online]. Available from: http://www.nccoast.org/news/pr_2002/pr_boguebanks02 Accessed 2009 March 5.
North Carolina Coastal Federation. 2004. Living Shorelines Project. [online]. Available from:
http://www.nccoast.org/Restoration/LivShore Accessed 2009 March 6. North Carolina Coastal Reserve & National Estuarine Research Reserve. 2007. [online].
Available from: http://www.nccoastalreserve.net/. Accessed 2009 March 6. North Carolina Department of Environment & Natural Resources and Moffat & Nichol. 2008.
Beach and Inlet Management Plan Presentation, Region 2c. Available from: http://dcm2.enr.state.nc.us/bimp_meetings.html. Accessed 2009 March 12.
North Carolina Department of Marine Fisheries. 2009. North Carolina’s Nursery System.
[online]. Available from: http://www.ncfisheries.net/habitat/pna.htm. Accessed 2009 February 27.
North Carolina Division of Coastal Management. 2002. Technical Manual for Coastal Land Use
Planning. Raleigh, NC: Department of Environment and Natural Resources. Available from: http:// dcm2.enr.state.nc.us/planning/techmanual.pdf. Accessed 2009 February 27.
North Carolina Division of Coastal Management. 2008. CAMA Land-Use Planning. [online].
Available from: http://dcm2.enr.state.nc.us/Planning/LUPabout.html. Accessed 2009 February 27.
North Carolina Division of Coastal Management. 2009. Coastal and Estuarine Land
Conservation Program (CELCP). [online]. Available from: http://dcm2.enr.state.nc.us/celcp.htm. Accessed 2009 February 26.

Adaptation to Sea-Level Rise in North Carolina 102
North Carolina Division of Emergency Management. 2008. North Carolina Floodplain
Management: 2008 Quick Guide. Available from: http://www.nccrimecontrol.org/index2.cfm?a=000003,000010,000176,000832. Accessed 2009 March 12.
North Carolina Division of Water Quality. 2007. North Carolina Water Quality Assessment and
Impaired Waters List (2006 Integrated 305(b) and 303(d) Report). Raleigh, NC: NC Department of Environment and Natural Resources.
North Carolina Division of Water Quality. 2008. Comparison Chart for 2008 Changes to Coastal
Stormwater Rule. Available from: http://h2o.enr.state.nc.us/su/coastal.htm. Accessed 2009 April 2.
North Carolina Insurance Underwriting Association. 2008. About NCIUA – Beach Plan.
[online]. Available from: http://www.ncjua-nciua.org/html/about-nciua.htm. Accessed 2009 February-March.
North Carolina Ports. 2008. Port of Morehead City. [online]. Available from:
http://www.ncports.com/port_of_morehead_city.htm. Accessed 2009 February 27. North Carolina Rural Economic Development Center. 2008 Dec 16. $43 Million in grants to
boost rural communities. Available at: http://www.ncruralcenter.org/news/pr.asp?ReleaseID=160. Accessed 2009 February 12.
North Carolina S.B. 1134 Global Warming/Climate Change. North Carolina S.L. 2005-442. Ocean Policy Steering Committee. 2009. Developing a Management Strategy for North
Carolina’s Coastal Ocean: Draft Report for Public Comment. Morehead City, NC: North Carolina Division of Coastal Management.
Office of Management and Budget (OMB). 2007. Fiscal 2008 Budget. Available from:
http://georgewbush-whitehouse.archives.gov/omb/budget/fy2008/budget.html. Accessed 2009 April 1.
Pearsall, S. and Poulter, B. 2005. Adapting coastal lowlands to rising seas: A Case Study in
Principles of Conservation Biology (3rd Edition). Sunderland, MA: Sinauer Press. Pfeffer, W.T. 2008. Kinematic Constraints on Glacier Contributions to 21st-Century Sea-Level
Rise. Science; 321, 1340. Pletl, C. 2009 March 4. NTB [North Topsail Beach] homes removed, dunes to be repaired.
Topsail Voice. Available from: http://carolinacoastonline.com/articles/2009/03/04/topsail_voice/news/doc49ae92cf94719645792078.prt. Accessed 2009 March 3.
Adaptation to Sea-Level Rise in North Carolina 103
Poulter, B. et al. 2009. Sea Level Rise Research and Dialogue in North Carolina: Creating Windows for Policy Change. Ocean and Coastal Management; 52(3-4):147-153.
Poulter, B., Goodall, J.L., Halpin, P.N. 2008. Applications of network analysis for adaptive
management of artificial drainage systems in landscapes vulnerable to sea level rise. Journal of Hydrology; 357: 207-217.
Poulter, B. and Halpin, P.N. 2007. Raster modeling of coastal flooding from sea-level rise.
International Journal of Geographical Information Science; 22(2): 167-182. Program for the Study of Developed Shorelines. 2006. Program for the Study of Developed
Shorelines Beach Nourishment Database (Western Carolina University). Available from: http://psds.wcu.edu/1038.asp. Accessed 2009 April 4.
Property Casualty Insurers Association of America. 2009. Hot Topics. [online]. Available from:
http://www.pciaa.net/web/sitehome.nsf/lcpublic/395?opendocument. Accessed 2009 March 2.
Riggs, S.R., Cleary, W.J., and Snyder, S.W. 1995. Influence of inherited geologic framework on
barrier shoreface morphology and dynamics. Marine Geology; 126: 213-234. Riggs, S.R. and D.V. Ames, 2003: Drowning the North Carolina Coast: Sea-level Rise and
Estuarine Dynamics (Publication number UNC-SG-03-04.). Raleigh, NC: North Carolina Sea Grant.
Riggs, S.R. et al. 2008. North Carolina’s Coasts in Crisis: A Vision for the Future. Greenville,
NC: Institute for Coastal Science and Policy, East Carolina University, Riggs, S.R., and Ames, D.V. 2007. Effect of Storms on Barrier Island Dynamics, Core Banks,
Cape Lookout National Seashore, North Carolina, 1960-2001. U.S. Geological Survey Scientific Investigations Report 2006-5309; 78.
Robert T. Stafford Disaster Relief and Emergency Assistance Act. 2007. Public Law 93-288, as
amended, 42 U.S.C. 5121-5207. Ross, S.W. and Lancaster, J.E. 1996. Movements of juvenile fishes using surf zone nursery
habitats and the relationship of movements to beach nourishment along a North Carolina beach: pilot project. Wilmington, NC: North Carolina National Estuarine Research Reserve.
Stedman, S. and Hanson, J. 1997. Habitat Connections: Wetlands, Fisheries and Economics.
National Marine Fisheries Service, Silver Spring, MD. Available from: http://www.nmfs.noaa.gov/habitat/habitatconservation/publications/habitatconections/num2.htm. Accessed 2009 March 6.
Adaptation to Sea-Level Rise in North Carolina 104
Street, M.W., Deaton, A.S., Chappell, W.S. and Mooreside, P.D. 2005. North Carolina Coastal Habitat Protection Plan. Morehead City, NC: North Carolina Department of Environment and Natural Resources, Division of Marine Fisheries.
The Sun News. 2009 Feb 27. Holden beach gets federal money for repairs. The Sun News.
Available from: http://www.thesunnews.com/news/breaking_news/story/800780.html. Accessed 2009 April 3.
Surfrider Foundation v. Town of Palm Beach, FL. 2009. Recommended Order by Judge Robert
E. Meale, Case No. 08-1511, Division of Administrative Hearings, Tallahassee, FL. Titus, J.G. and Richman, C. 2001. Maps of land vulnerable to sea level rise: modeled elevations
along the U.S. Atlantic and Gulf Coasts. Climate Research 18 (November 2, 2001); 205-228.
Titus, J.G. (ed.) 1988. Greenhouse effect, sea level rise, and coastal wetlands (EPA 230-05-86-
013). Washington, DC: U.S. Environmental Protection Agency. Titus, J.G., et al. 2009. Coastal Sensitivity to Sea-Level Rise: A Focus on the Mid-Atlantic
Region. A report by the U.S. Climate Change Science Program and the Subcommittee on Global Change Research. Washington, DC: U.S. Environmental Protection Agency.
Town of Morehead City. 2008. Sewage Collection and Wastewater Treatment Report for 2008.
[online]. Available from: http://www.townofmorehead.com/2007%20wastewater%20collection%20report.html. Accessed 2009 April 4.
Town of Morehead City. 2001. Town of Morehead City Unified Development Ordinance: Code
of Ordinances. [online]. Available from: http://www.municode.com/resources/gateway.asp?pid=10015&sid=33
Turner, R.K., Kelly, P.M. and Kay, R.C. 1990. Cities at Risk. Norwich, U.K.: School of
Environmental Sciences, University of East Anglia. Ulbrich, S. 2009 March 9. North Topsail beach nourishment on hold. Jacksonville Daily News.
Available from: http://www.jdnews.com/news/beach_62904___article.html/nourishment_topsail.html. Accessed 2009 March 12.
University of Central Florida. 2007 May 24. Ten Counties In Florida, Eight In N.C. Among Top
20 At Risk For Storms And Hurricanes, Experts Say. ScienceDaily. Available from: http://www.sciencedaily.com /releases/2007/05/070523095948.htm. Accessed 2009 February 22.
University of Copenhagen. 2009 March 10. Rising sea levels set to have major impacts around
the world. Press Release International Scientific Congress on Climate Change, University
Adaptation to Sea-Level Rise in North Carolina 105
of Copenhagen. Available from: http://climatecongress.ku.dk/newsroom/rising_sealevels/. Accessed 2009 March 22.
U.S. Army Corps of Engineers. 2008. FY 2008 Corps Dredge Schedule. Available from:
http://www.iwr.usace.army.mil/NDC/dredge/dredge.htm. Accessed 2009 March 11. U.S. House Report 110-862. 2008 Sept 18. Department of Homeland Security Appropriations
Bill, FEMA Management and Administration. Weisbart, S.N. 2008 July 21. The Challenges of Insuring Coastal Properties: Presentation to
2008 Insurance Symposium. The Brantley Risk and Insurance Center, Appalachian State University, Boone.
The Wooten Company. 2007. Town of Morehead City North Carolina: 2005 Land Use Plan
Update. Available from: http://www.townofmorehead.com/Plan%20&%20Insp.html Wynia, E. 2007. Funding Mechanisms for Land Acquisition: Presentation for the N.C.
Waterfront Access Committee. Available from: http://www.nccoastallaw.org/publications.htm. Accessed 2009 February 27.
Wynn, L. 2009 Feb 6. Insurance rate hike bills filed. Carteret County News-Times. Available
from: http://carolinacoastonline.com/articles/2009/02/06/newstimes/news/doc498c717ce6a77978495541.prt. Accessed 2009 Feb 10.
Yohe, G. 1991. The cost of not holding back the sea – Economic vulnerability. Ocean and
Shoreline Management; 15:233-255. Yohe, G. and R.S Tol. 2002. Indicators for social and economic coping capacity. Global
Environmental Change; 12:25-40.
Data Sources National Wetlands Inventory. Available from:
http://www.fws.gov/wetlands/Data/DataDownload.html. Downloaded 2008 October. North Carolina Flood Mapping Program. Available from: http://www.ncfloodmaps.com/.
Downloaded 2008 October. Poulter, B. Potsdam Institute for Climate Impact Research, Potsdam, Germany. Downloaded
December 2008. Watkins, S. Morehead City Planning Department, Morehead City, NC. Received 2008 October.

Adaptation to Sea-Level Rise in North Carolina 106
APPENDIX
Appendix 1. Probability of Carteret County experiencing hurricane force winds
Appendix 2. Tables calculating percent of land use inundated by six inundation scenarios
2030 Low (0.11 m)
Land Use Acres Sq. Miles
% of
inundated
area
% of total
land use class
Floodplain 93.0 0.145 22.02% 13.51%
Residential 259.5 0.406 61.47% 4.23%
Institutional 13.4 0.021 3.18% 2.81%
Planned Dev. 3.0 0.005 0.72% 0.48%
Street 8.7 0.014 2.05% 0.84%
Industrial 32.5 0.051 7.69% 4.43%
Commercial 12.1 0.019 2.87% 1.40%
Total 422.2 0.660 100.00%
2080 Low (0.26 m)
Land Use Acres Sq. Miles
% of
inundated
area
% of total
land use class
Floodplain 160.2 0.250 27.45% 23.27%
Residential 347.8 0.543 59.59% 5.68%
Institutional 16.5 0.026 2.82% 3.45%
Planned Dev. 3.3 0.005 0.56% 0.52%
Street 9.0 0.014 1.53% 0.87%
Industrial 33.9 0.053 5.80% 4.62%
Commercial 13.1 0.020 2.24% 1.51%
Total 583.6 0.912 100.00% 2030 Mid (0.16 m)
Land Use Acres Sq. Miles
% of
inundated
area
% of total
land use class
Floodplain 104.3 0.163 22.57% 15.15%
Residential 286.6 0.448 62.02% 4.68%
Institutional 14.0 0.022 3.03% 2.93%
Planned Dev. 3.0 0.005 0.66% 0.48%
Street 8.8 0.014 1.90% 0.85%
Industrial 32.8 0.051 7.11% 4.48%
Commercial 12.5 0.020 2.71% 1.44%
Total 462.0 0.722 100.00%
2080 Mid (0.46 m)
Land Use Acres Sq. Miles
% of
inundated
area
% of total
land use class
Floodplain 500.0 0.781 42.48% 72.65%
Residential 587.5 0.918 49.91% 9.59%
Institutional 25.0 0.039 2.12% 5.23%
Planned Dev. 3.8 0.006 0.32% 0.60%
Street 9.7 0.015 0.82% 0.94%
Industrial 36.6 0.057 3.11% 4.99%
Commercial 14.6 0.023 1.24% 1.68%
Total 1177.1 1.839 100.00%

Adaptation to Sea-Level Rise in North Carolina 107
2030 High (0.21 m)
Land Use Acres Sq. Miles
% of
inundated
area
% of total
land use class
Floodplain 125.7 0.196 24.55% 18.26%
Residential 312.6 0.488 61.06% 5.10%
Institutional 15.3 0.024 2.99% 3.21%
Planned Dev. 3.1 0.005 0.61% 0.49%
Street 8.9 0.014 1.74% 0.86%
Industrial 33.3 0.052 6.51% 4.55%
Commercial 13.0 0.020 2.53% 1.50%
Total 511.9 0.800 100.00%
2080 High (0.81)
Land Use Acres Sq. Miles
% of
inundated
area
% of total land
use class
Floodplain 677.5 1.059 37.20% 98.44%
Residential 1004.3 1.569 55.13% 16.39%
Institutional 35.2 0.055 1.93% 7.38%
Planned Dev. 25.3 0.040 1.39% 4.02%
Street 15.8 0.025 0.87% 1.53%
Industrial 44.7 0.070 2.45% 6.09%
Commercial 18.6 0.029 1.02% 2.14%
Total 1821.5 2.846 100.00%
Appendix 3. Neighborhood and future land use data layers
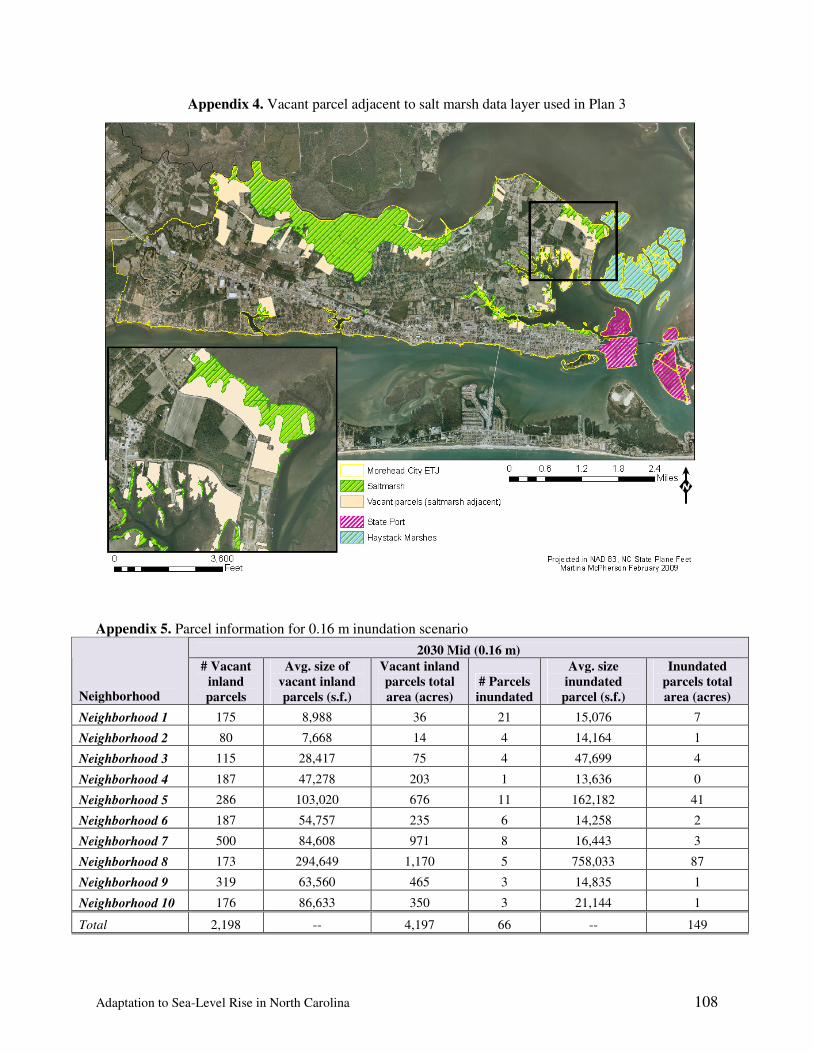
Adaptation to Sea-Level Rise in North Carolina 108
Appendix 4. Vacant parcel adjacent to salt marsh data layer used in Plan 3
Appendix 5. Parcel information for 0.16 m inundation scenario
2030 Mid (0.16 m)
Neighborhood
# Vacant
inland
parcels
Avg. size of
vacant inland
parcels (s.f.)
Vacant inland
parcels total
area (acres)
# Parcels
inundated
Avg. size
inundated
parcel (s.f.)
Inundated
parcels total
area (acres)
Neighborhood 1 175 8,988 36 21 15,076 7
Neighborhood 2 80 7,668 14 4 14,164 1
Neighborhood 3 115 28,417 75 4 47,699 4
Neighborhood 4 187 47,278 203 1 13,636 0
Neighborhood 5 286 103,020 676 11 162,182 41
Neighborhood 6 187 54,757 235 6 14,258 2
Neighborhood 7 500 84,608 971 8 16,443 3
Neighborhood 8 173 294,649 1,170 5 758,033 87
Neighborhood 9 319 63,560 465 3 14,835 1
Neighborhood 10 176 86,633 350 3 21,144 1
Total 2,198 -- 4,197 66 -- 149

Adaptation to Sea-Level Rise in North Carolina 109
Appendix 6. Parcel information for 1.06 m inundation scenario
2100 Max (1.06 m)
Neighborhood
# Vacant
inland
parcels
Avg. size of
vacant inland
parcels (s.f.)
Vacant inland
parcels total
area (acres)
Parcels
inundated
Avg. size
inundated
parcel (s.f.)
Inundated
parcels total
area (acres)
Neighborhood 1 154 8,392 30 96 11,827 26
Neighborhood 2 80 7,668 14 11 10,172 3
Neighborhood 3 110 28,319 72 14 150,957 49
Neighborhood 4 185 47,243 201 3 38,182 3
Neighborhood 5 266 81,291 496 60 568,109 783
Neighborhood 6 179 56,095 231 29 15,707 10
Neighborhood 7 452 70,512 732 82 159,173 300
Neighborhood 8 162 206,705 769 19 1,298,278 566
Neighborhood 9 311 64,568 461 15 22,865 8
Neighborhood 10 175 86,916 349 6 16,754 2
Total 2,074 3,353 335 1,749
Appendix 7. Wetland inundation calculations
2030 Mid inundation (0.16) 2080 Mid inundation (0.46) 2100 inundation (1.06)
Wetland type Acres
Sq.
miles
% of
total Acres
Sq.
miles % Acres Sq. mi. %
Salt/Brackish Marsh 115 0.18 38.3% 454 0.71 47.1% 632 0.99 38.7%
Drained Salt/Brackish Marsh 97 0.15 32.5% 364 0.57 37.8% 717 1.12 43.9%
Riverine Swamp Forest 31 0.05 10.5% 60 0.09 6.2% 84 0.13 5.1%
Hardwood Flat 6 0.01 1.9% 6 0.01 0.7% 9 0.01 0.6%
Managed Pineland 8 0.01 2.8% 10 0.02 1.1% 31 0.05 1.9%
Estuarine Shrub/Scrub 5 0.01 1.7% 12 0.02 1.2% 32 0.05 1.9%
Headwater Swamp 10 0.02 3.4% 23 0.04 2.4% 59 0.09 3.6%
Cutover Estuarine Shrub/Scrub 0 0.00 0.1% 1 0.00 0.1% 3 0.00 0.2%
Cutover Headwater Swamp 1 0.00 0.4% 1 0.00 0.1% 4 0.01 0.2%
Cleared Headwater Swamp 0 0.00 0.0% 0 0.00 0.0% 0 0.00 0.0%
Pine Flat 6 0.01 2.2% 12 0.02 1.2% 30 0.05 1.8%
Depressional Swamp Forest 1 0.00 0.2% 1 0.00 0.1% 1 0.00 0.1%
Cutover Hardwood Flat 0 0.00 0.1% 1 0.00 0.1% 1 0.00 0.1%
Drained Bottomland Hardwood 10 0.01 3.2% 10 0.02 1.1% 16 0.02 1.0%
Cutover Pine Flat 0 0.00 0.0% 0 0.00 0.0% 1 0.00 0.0%
Cleared Hardwood Flat 0 0.00 0.0% 0 0.00 0.0% 0 0.00 0.0%
Human Impacted 2 0.00 0.6% 2 0.00 0.2% 3 0.00 0.2%
Cutover Bottomland Hardwood 1 0.00 0.3% 1 0.00 0.1% 3 0.00 0.2%
Cleared Bottomland Hardwood 0 0.00 0.2% 1 0.00 0.1% 1 0.00 0.1%
Cleared Pine Flat 0 0.00 0.0% 0 0.00 0.0% 1 0.00 0.0%
Bottomland Hardwood 4 0.01 1.2% 4 0.01 0.4% 6 0.01 0.3%
Drained Hardwood Flat 2 0.00 0.5% 2 0.00 0.2% 2 0.00 0.1%
Total 300 0.47 100.0% 964 1.51 100.0% 1634 2.55 100.0%

Adaptation to Sea-Level Rise in North Carolina 110
Appendix 8. Vacant parcel information by neighborhood
Neighborhood
Area
(acres)
Area (sq.
mi)
Vacant
parcels
Area Vacant
(acres)
Avg vacant
lot size (s.f.)
Avg. vacant
lot size (acres)
Neighborhood 1 137 0.21 207 45 9,571 0.2
Neighborhood 2 120 0.19 82 15 7,850 0.2
Neighborhood 3 252 0.39 115 70 26,484 0.6
Neighborhood 4 427 0.67 177 149 36,710 0.8
Neighborhood 5 2,123 3.32 242 536 96,489 2.2
Neighborhood 6 534 0.83 200 124 27,066 0.6
Neighborhood 7 1,865 2.91 491 943 83,647 1.9
Neighborhood 8 1,754 2.74 158 1,182 327,889 7.5
Neighborhood 9 1,201 1.88 335 406 52,840 1.2
Neighborhood 10 774 1.21 159 264 72,368 1.7
Streets 1,008 1.58 -- -- -- --
Total 10,194 15.93 2,166 3,735 -- --