Embed Size (px)
Citation preview

1
NILE BASIN INITIATIVE
This publication presents a quick and clear overview of the people and places vulnerable to water stress related to the impacts of climate change in the Nile Basin. Satellite and other images provide striking visual evidence of the environmental changes taking place in each of the vulnerable regions identified. Data and information from detailed research provide evidence for the assessment. The report also includes analysis derived from multi-dimensional tools used at various geographic and political levels, from sub-national, national, and sub-basin to the entire Nile Basin area. These include scientific tools, such as scenario analyses and modeling, to improve our understanding of the likely impacts of climate change on the Nile River’s water systems.
The report’s insights and information should enable countries and relevant stakeholders involved in managing the Nile River Basin to make evidence-based policy choices and decisions that ensure the sustainability of the Nile and its resources.
Ad
aptatio
n to
Clim
ate-chan
ge Ind
uced
Water S
tress in th
e Nile B
asin: A
Vu
lnerab
ility Assessm
ent R
epo
rt
Adaptation to Climate-change
Induced Water Stress in the
Nile BasiNA Vulnerability Assessment Report

2

3
Adaptation to Climate-change Induced Water Stress in the Nile BasinA Vulnerability Assessment Report
NILE BASIN INITIATIVE

4
© 2013, United Nations Environment ProgrammeISBN: 978-92-807-3328-0Job Number: DEW/1655/MAThis publication may be reproduced in whole or in part and in any form for educational or non-profit purposes without special permission from the copyright holder, provided acknowledgement of the source is made. UNEP and the authors would appreciate receiving a copy of any publication that uses this report as a source.
No use of this publication may be made for resale or for any other commercial purpose whatsoever without prior permission in writing from the United Nations Environment Programme.
United Nations Environment ProgrammePO Box 30552, Nairobi 00100, KenyaTel: +254 20 7621234Fax: +254 20 7623943/44http://www.unep.org
For bibliographic and reference purposes this publication should be referred to as:
UNEP. (2013). “Adaptation to Climate-change Induced Water Stress in the Nile Basin: A Vulnerability Assessment Report”. Division of Early Warning and Assessment (DEWA).United Nations Environment Programme (UNEP). Nairobi, Kenya.
This publication was produced in cooperation with the Nile Basin Initiative.
This book is available from Earthprint.com, http://www.earthprint.com.Printed by Progress Press Co Ltd., MaltaDistribution by SMI London

i
Production and editorial teams ........................................................................................................................................................................................................... iv Acronyms .......................................................................................................................................................................................................................................................v Foreword ..................................................................................................................................................................................................................................................... vii
Executive Summary .....................................................................................................1 Overview ....................................................................................................................................................................................................................................................... 1
Chapter 1: Introduction ..............................................................................................8 Overview of the Nile basin ..................................................................................................................................................................................................................... 8 How the River Nile was formed ..........................................................................................................................................................................................................15 The history of cooperation in the Nile basin .................................................................................................................................................................................16 Context of this report .............................................................................................................................................................................................................................19 References ..................................................................................................................................................................................................................................................20
Chapter 2: Land cover types and vegetation dynamics .........................................21 Introduction ..............................................................................................................................................................................................................................................21 Land cover types in the Nile basin ....................................................................................................................................................................................................21 Vegetation dynamics and land cover change in the Nile basin using MODIS ..................................................................................................................31 References ..................................................................................................................................................................................................................................................45
Chapter 3: Climate and hydrological overview .......................................................46 Introduction ..............................................................................................................................................................................................................................................46 Climate ........................................................................................................................................................................................................................................................46 Storage systems .......................................................................................................................................................................................................................................56 Hydrogeology ...........................................................................................................................................................................................................................................65 References ..................................................................................................................................................................................................................................................76
Chapter 4: Water availability and demand ..............................................................80 Introduction ..............................................................................................................................................................................................................................................80 Water availability .....................................................................................................................................................................................................................................80 Water demand and use .........................................................................................................................................................................................................................84 References ..................................................................................................................................................................................................................................................87
Chapter 5: Vulnerability and hotspots in the basin ................................................88 Climate scenarios in the Nile basin ...................................................................................................................................................................................................88 Vulnerability ..............................................................................................................................................................................................................................................91 Hotspots ......................................................................................................................................................................................................................................................92 References ................................................................................................................................................................................................................................................118
Chapter 6: Impacts of climate change ...................................................................120 Introduction to global climate change ..........................................................................................................................................................................................120 Future water stress in the Nile basin ...............................................................................................................................................................................................120 Climate futures in the Nile basin ......................................................................................................................................................................................................122 Implications and management options ........................................................................................................................................................................................135 Conclusions .............................................................................................................................................................................................................................................138 References ................................................................................................................................................................................................................................................140
Chapter 7: Adaptation to climate change ..............................................................142 What is adaptation? ..............................................................................................................................................................................................................................142 Importance of adaptation ..................................................................................................................................................................................................................142 Adaptation options and strategies .................................................................................................................................................................................................143 Pathways and policy implications ...................................................................................................................................................................................................146 Conclusion ...............................................................................................................................................................................................................................................147 References ................................................................................................................................................................................................................................................148
Annex 1: Methodology for calculating ET using remote sensing ........................149 Introduction ............................................................................................................................................................................................................................................149 References ................................................................................................................................................................................................................................................163
CONTENTS

ii
List of figures, tables and boxes
FiguresFigure 1.1: Countries of the Nile basin. .................................................................................... 9
Figure 1.2: Drainage system of the River Nile. .....................................................................11
Figure 1.3: Annual average real GDP growth rates (2000-2009) ..................................12
Figure 1.4: Proportion of urban and rural population in the basin countries. ........13
Figure 1.5: Under-5 mortality rates per 1 000 live births (1990-2009). ......................14
Figure 1.6: Trends in the proportion of the population with access to an improved water source: 1990, 2000 and 2008. ......................................15
Figure 2.1: Land cover of the Nile basin from GLOBCOVER 2009. ................................23
Figure 2.2: Land cover types in Burundi Nile basin from GLOBCOVER 2009. ...........24
Figure 2.3: DRC land cover types within the Nile basin from GLOBCOVER 2009. ..24
Figure 2.4: Eqypt land cover types in the Nile basin from GLOBCOVER 2009. ........25
Figure 2.5: Eritrea land cover types in the Nile basin from GLOBCOVER 2009. .......26
Figure 2.6: Ethiopia land cover types in the Nile basin from GLOBCOVER 2009. ...26
Figure 2.7: Kenya land cover types in the Nile basin from GLOBCOVER 2009. ........27
Figure 2.8: Rwanda land cover types in the Nile basin from GLOBCOVER 2009. ....27
Figure 2.9: South Sudan land cover types in the Nile basin from GLOBCOVER 2009. ..................................................................................................28
Figure 2.10: Sudan land cover types in the Nile basin from GLOBCOVER 2009. .....29
Figure 2.11: United Republic of Tanzania land cover types in the Nile basin from GLOBCOVER 2009. ...........................................................................29
Figure 2.12: Uganda land cover types in the Nile basin from GLOBCOVER 2009. .................................................................................................30
Figure 2.13: Distribution of land cover types in the Nile basin using MODIS in 2009. ......................................................................................................................32
Figure 2.14: Change in land cover types of the Nile basin. ............................................33
Figure 2.15: Land cover from MODIS (2001, 2009) in the Nile basin segment of Burundi. .............................................................................................34
Figure 2.16: Relative extent of land cover types in the Nile basin in Burundi. ........34
Figure 2.17: Land cover from MODIS (2001, 2009) of the Nile basin segment of DRC. .......................................................................................................................35
Figure 2.18: Relative extent of land cover types in the Nile basin in DRC. ................35
Figure 2.19: Land cover from MODIS (2001, 2009) in the Nile basin segment of Egypt. ....................................................................................................................36
Figure 2.20: Relative extent of land cover types in the Nile basin in Egypt. .............36
Figure 2.21: Land cover from MODIS (2001, 2009) in the Nile basin segment of Eritrea. ...................................................................................................................37
Figure 2.22: Relative extent of land cover types in the Nile basin in Eritrea. ...........37
Figure 2.23: Land cover from MODIS (2001, 2009) in Nile basin segment of Ethiopia. ...............................................................................................................38
Figure 2.24: Relative extent of land cover types in the Nile basin in Ethiopia. ........38
Figure 2.25: Land cover from MODIS (2001, 2009) in the Nile basin segment of Kenya. ....................................................................................................................39
Figure 2.26: Relative extent of land cover types in the Nile basin in Kenya. ............39
Figure 2.27: Land cover from MODIS (2001, 2009) in Nile basin segment of Rwanda. ................................................................................................................40
Figure 2.28: Relative extent of land cover types in the Nile basin in Rwanda. ........40
Figure 2.29: Land cover from MODIS (2001, 2009) in the Nile basin segment of South Sudan. ......................................................................................................41
Figure 2.30: Relative extents of land cover types in the Nile basin in South Sudan. ...........................................................................................................41
Figure 2.31: Land cover from MODIS (2001, 2009) in the Nile basin segment of Sudan. ..................................................................................................................42
Figure 2.32: Relative extent of land cover types in the Nile basin in Sudan. ...........42
Figure 2.33: Land cover from MODIS (2001, 2009) in the Nile basin segment of the United Republic of Tanzania. ...............................................................43
Figure 2.34: Relative extent of land cover types in the Nile basin in the United Republic of Tanzania. ............................................................................43
Figure 2.35: Land cover from MODIS (2001, 2009) in the Nile basin segment of Uganda. ...............................................................................................................44
Figure 2.36: Relative extent of land cover types in the Nile basin in Uganda. ........44
Figure 3.1: Rainfall regimes over the Nile basin (base period is 1961 to 1990). ......47
Figure 3.2: The main sub-basins of the Nile basin region. ..............................................48
Figure 3.3: Annual terrestrial evapotranspiration (ET) in the Nile basin, 2001, 2005 and 2010. ............................................................................................51
Figure 3.4: Mean annual rainfall map of the Nile basin between 2001-2010. .........52
Figure 3.5: Mean annual ET from different biomes in the Nile basin, 2001-2009. .................................................................................................................53
Figure 3.6: Annual variability of total terrestrial ET from the Nile basin. ...................53
Figure 3.7: Annual variability of terrestrial ET in the Nile basin countries. ...............53
Figure 3.8: Total annual ET from Nile basin lakes and reservoirs and the contribution of each of the major water bodies to the total, 2001-2010. .................................................................................................................54
Figure 3.9: Annual ET and total volumes of major lakes that contribute the most ET to the Nile basin. ............................................................................54
Figure 3.10: Relationship between lakes’ SAV ratio, volumes and evapotranspiration...............................................................................................54
Figure 3.11: Average annual ET from the major Nile basin lakes, 2001-2010. .........55
Figure 3.12: Total annual terrestrial ET from land surfaces and total ET from terrestrial surfaces, lakes and reservoirs in the Nile basin. ....................55
Figure 3.13: Lake Victoria drainage basin. ............................................................................57
Figure 3.14: Historical water elevations in Lake Victoria. ................................................57
Figure 3.15: Outflow and lake level at Lake Tana (1975–2006). ....................................57
Figure 3.16: The swamps of South Sudan. ............................................................................59
Figure 3.17: Location of major dams along the River Nile. .............................................61
Figure 3.18: Average monthly flow of the Nile at Aswan before and after the construction of the Aswan High Dam. ..........................................................62
Figure 3.19: Annual flow pattern of the Nile River. ............................................................64
Figure 3.20: Groundwater storage and recharge in the Nile River Basin. ..................65
Figure 3.21: Idealized hydrostratigraphic column in the Nile basin part of Egypt. ..........................................................................................................65
Figure 3.22: Tectonic setting. .....................................................................................................66
Figure 3.23: Groundwater flow in the Nubian aquifer. .....................................................66
Figure 3.24: Thickness of the Nubian aquifer system. ......................................................67
Figure 3.25: W-E hydrostratigraphic cross-section in central Egypt. ...........................67
Figure 3.26: Three dimensional section representation of hydrostratigraphic units in the northern part of the Nile basin. ...............................................67
Figure 3.27: Aquifer type in Nile delta....................................................................................68
Figure 3.28: W-E hydrogeological cross-section close to the White and Blue Nile Rivers. .....................................................................................................70
Figure 3.29: Groundwater basins in Sudan. .........................................................................70
Figure 3.30: W-E Hydrogeological cross-section in Uganda. .........................................74
Figure 4.1: The blue-green water model. ..............................................................................80
Figure 4.2: Precipitation, green water and blue water flows in the Nile countries (1995). ......................................................................................................81
Figure 4.3: GDP per capita (at constant 2000 prices) in 2009. .......................................82
Figure 4.4: Access to water and sanitation in the Nile basin against per capita internal water resources. ......................................................................................82
Figure 4.5: Water availability in the Nile basin. ...................................................................83
Figure 4.6 Actual versus internal renewable water resources in the Nile basin countries. ........................................................................................................84
Figure 4.7: Gradient along the Nile offering opportunities for hydropower development. .................................................................................85

iii
Figure 5.1: Regional Climate Model (RegCM3) projection results for 2071–2100. Key: (A2-RF; 20 km resolution); (left) temperature, (right) rainfall. ...........................................................................................................88
Figure 5.2: Impact of climate change on Nile basin runoff, precipitation (ppt) and potential evapotranspiration (PET) (per cent change from 2000 values). ..................................................................................................90
Figure 5.3: Different order climate change effects on water resources. ....................91
Figure 5.4: Population growth in Khartoum metropolitan area. ..................................95
Figure 6.1: Current vulnerabilities of freshwater resources and water stress map. .............................................................................................................. 121
Figure 6.2: Generic scenario approach to determining climate change impacts and water stress as well as adaptation strategies. .................. 122
Figure 6.3: Global CO2 business-as-usual-emissions scenario - (a) CO2 emissions; (b) CO2 concentrations. ................................................................ 123
Figure 6.4: The ‘living shoreline’ approach involves rehabilitating shoreline habitats with plants, rocks, sand or other structural or organic materials to enhance the natural connections between the uplands and marine areas. ........................................................................ 125
Figure 6.5: Scenarios showing the impacts of different SLR (0, +1, +2, +4, +6 and +20m) scenarios on the Nile delta. ...................................................... 126
Figure 6.6: Projected flow of the Blue Nile across 17 statistically downscaled scenarios. ....................................................................................... 129
Figure 6.7: Spatial distribution of average annual changes in climate variables and runoff under weighted scenario for the 2050s: (a) precipitation, (b) temperature, (c) potential evapotranspiration, and (d) runoff. .............................................................. 130
Figure 6.8: Spatial distribution of percentage changes in flow statistics under the weighted runoff scenario for the 2050s. ................................. 131
Figure 6.9: Projections of temperature variations over Lake Victoria in the 21st century.................................................................................................... 131
Figure 6.10: Expected and measured temperatures for the north and south of Lake Victoria (ten year average, 1990-2000 and 2040-2050). ........................................................................................................... 132
Figure 6.11: Expected and measured annual temperature differences over the north and south of Lake Victoria, 2000-2050 Water Balance: basin Flows. ............................................................................ 132
Figure 6.12: Thirty-year lake levels and levels with changes in rainfall and PE in Lake Victoria. .................................................................................... 133
Figure 6.13: Projected trends in rainfall, evaporation, runoff and net basin supply (NBS) in Lake Victoria under A2 and B2 emissions scenarios. .......................................................................................... 133
Figure 6.14: Statistically downscaled projections of the total flow at Dongola using 6 transient scenarios. .......................................................... 133
Figure 6.15: Simulated annual flow series at Dongola from B2 experiments. ..... 134
Figure 6.16: Architecture of water availability and policy assessment (WAPA) model. ..................................................................................................... 136
Figure 7.1: Adaptation as a pathway from development to climate protection................................................................................................ 146
Figure 7.2: Climate compatible development. ................................................................ 147
TablesTable 1.1: Vital statistics of the countries that share the Nile basin. ............................. 8
Table 1.2: Temporal and spatial variation in Nile basin international water agreements ...................................................................................................16
Table 1.3: Timeline of the cooperation efforts over the Nile. .........................................19
Table 2.1: Original land cover classes and descriptions for GLOBCOVER 2009. .....22
Table 2.2: GLOBCOVER (2009) land cover types in the Nile basin. ...............................22
Table 2.3: Area and percentage of Burundi land cover types in the Nile basin. .....24
Table 2.4: Area and percentage of DRC land cover types in the Nile basin. .............24
Table 2.5: Area and percentage of Egypt land cover types in the Nile basin. .........25
Table 2.6: Area and percentage of Eritrea land cover types in the Nile basin. ........26
Table 2.7: Area and percentage of Ethiopia land cover types in the Nile basin. .....26
Table 2.8: Area and percentage of Kenya land cover types in the Nile basin. .........27
Table 2.9: Area and percentage of Rwanda land cover types in the Nile basin. .....27
Table 2.10: Area and percentage of South Sudan land cover types in the Nile basin. .................................................................................................................28
Table 2.11: Area and percentage of Sudan land cover types in the Nile basin. ......29
Table 2.12: Area and percentage of the United Republic of Tanzania land cover types in the Nile basin. ....................................................................29
Table 2.13: Area and percentage of Uganda land cover types in the Nile basin. ...30
Table 2.14: IGBP land cover classes with their structural characteristics. .................31
Table 3.1: Average annual rainfall over key catchments in the Nile basin. ...............49
Table 3.2: Average Annual rainfall in each Nile basin country and in each country’s portion of the Nile basin. .....................................................................50
Table 3.3: Key facts about the major lakes in the Nile basin ..........................................56
Table 3.4: Key facts about the reservoirs in the Nile River Basin. .................................61
Table 3.5: Variations in discharges on the Nile ....................................................................64
Table 3.6: Groundwater availability in different aquifers of Egypt. .............................68
Table 3.7: Groundwater availability in different basins of Sudan. ...............................71
Table 3.8: Groundwater availability in Blue Nile part of Ethiopia. ................................72
Table 3.9: Groundwater availability in the Gash basin of Eritrea. .................................72
Table 3.10: Groundwater availability in the Nile basin part of Uganda. ....................74
Table 3.11: Groundwater availability in the Nile basin part of Kenya. ........................74
Table 3.12: Groundwater availability in the Nile basin part of the DRC. ....................74
Table 3.13 : Groundwater availability in the Nile basin part of Burundi. ...................74
Table 3.14: Groundwater availability in the Nile basin part of Rwanda. ....................75
Table 3.15: Groundwater availability in the Nile basin part of the United Republic of Tanzania. ..........................................................................75
Table 4.1: Trends in rainfall and river flows, 1931-1960 and 1961-1990. ...................81
Table 4.2: Freshwater withdrawal by Nile basin country and sector. ..........................85
Table 4.3: The status of hydropower development in the countries of the Nile basin. ....................................................................................................................86
Table 5.1: Temperature and precipitation changes for the River Nile sources. .......89
Table 5.2: Changes in flows corresponding to uniform rainfall changes for different Nile sub-basins. .................................................................................90
Table 5.3: Results of ranking, showing hotspots (Ranking: 1=low; 2= medium; 3=high). .........................................................................................................................92
Table 6.1: Description of assumptions of the IPCC’s Special Emissions Scenarios. .................................................................................................................. 123
Table 6.2: Spatially averaged temperature anomalies over Egypt under A2 and B2 scenarios. .............................................................................................. 124
Table 6.3: Spatially averaged evapotranspiration anomalies (%) over Egypt. ...... 124
Table 6.4: Vulnerable sectors prioritized by each Nile basin country. ..................... 138
Table 7.1: Summary of adaptation strategies to climate change in the River Nile basin countries. .................................................................................... 144
BoxesBox 1.1: Population trends in the Lake Victoria basin. .....................................................13
Box 1.2: Stages in the formation of the Nile. .......................................................................15
Box 1.3: Some of the early bilateral arrangements (before 1998) between the Nile basin countries. ............................................................................................16
Box 1.4: Objectives of the Nile River Basin Strategic Action Programme ..................18
Box 3.1: Threats to wetlands in the Nile basin.....................................................................58
iv
Production and editorial teams
Strategic Advisory TeamIbrahim ThiawPeter GilruthMounkaila GoumandakoyeWael KhairyTeferra Beyene AsfawKeith AlversonDesta Mabretu
Technical CoordinationUNEPAshbindu Singh Charles Sebukeera Musonda MumbaFrank R. TuryatungaPatrick L. M’mayiArshia Chander (UNEP GRID Sioux Falls, USA)Felice VanderPlaatBetty Muragori (Consultant, UNEP)Wanjiro Gathira (Consultant, UNEP)
Production TeamCoordinating Lead AuthorsAlfred Opere (University of Nairobi, Kenya)Francis M. Mutua (University of Nairobi, Kenya)Tamiru A. Abiye (University of the Witwatersrand, South Africa)
AuthorsAline G. Uwonkunda (Visiting Scientist, UNEP GRID Sioux Falls, USA)Anil Hooda (Consultant, UNEP GRID Sioux Falls, USA)Bhanuprakash Nagaraju (Visiting Scientist, UNEP GRID Sioux Falls, USA)Dipendra Giri (Visiting Scientist, UNEP GRID Sioux Falls, USA)Eugene Apindi Ochieng (Consultant, UNEP, Kenya)Henok Alemu (Consultant, UNEP GRID Sioux Falls, USA)Mary Goreti Kitutu (NEMA, Uganda)Washington Ochola (RUFORUM, Makerere University, Kampala, Uganda)
Principal EditorElizabeth Kironde Gowa (Consultant, UNEP)
EditorsArshia Chander (UNEP GRID Sioux Falls, USA)Charles Sebukeera (UNEP)Jane Barr (Consultant, UNEP GRID Sioux Falls, USA)
Design and LayoutKim Giese (UNEP GRID Sioux Falls, USA)
Illustrations and Satellite Image AnalysisEugene Apindi Ochieng (Consultant, UNEP, Kenya)Dipendra Giri (Visiting Scientist, UNEP GRID Sioux Falls, USA)
ReviewersDessie Nedaw Habtemariam (Mekelle University, Ethiopia)Gabriel Senay (USGS, USA)Gamal Abdo (University of Khartoum, Sudan)Hurn Warui (Ministry of Environment, Kenya)Khaled M. AbuZeid (CEDARE, Egypt)Magdy A. Hefny (Ministry of Water Resources and Irrigation, Egypt)Mohamed A.S. Abdel-Monem (UNEP, Kenya)Mohamed H. Elrawady (CEDARE, Egypt)Mona El-Agizy (EEAA / UNDP, Egypt)Muna Mirghani (Nile IWRM-Net, Sudan)Musonda Mumba (UNEP/ DEPI, Kenya)Omar Elbadawy (CEDARE, Egypt)Osman Mirghani Mohamed Ali (University of Khartoum, Sudan)Phoebe Aber Luwum (Global Water Partnership, Uganda)Richard Munang (UNEP, Kenya)Simon Thuo (GWP Eastern Africa, Uganda)Wael M. Khairy (Nile Basin Initiative Secretariat, Uganda)
Other ContributorsAmr Abdel-Megeed (CEDARE, Egypt)Bruce W. Pengra (ARTS, USA)Evans Kituyi (Climate Change Adaptation in Africa, Kenya)Lindsey M. Harriman (ERT, USA)Michael Brian Butts (DHI, Denmark)Naga Manohar Velpuri (Consultant, UNEP GRID Sioux Falls, USA)Nermin Mamdouh Riad (CEDARE, Egypt)Oluf Z. Jessen (DHI, Denmark)Patricia Siage (CEDARE, Egypt)Ramesh K. Singh (ARTS,USA)Sahar Ezz El Arab (CEDARE, Egypt)Tamer H. El-Hakim (CEDARE, Egypt)Tom Okurut (NEMA, Uganda)

v
AcronymsBCM Billion Cubic MetresCDM Clean Development MechanismCIDA Canadian International Development Agency.CRU Climate Research Unit DEPI Department of Environment Policy ImplementationDHI Danish Hydrological InstituteDRC Democratic Republic of the CongoENSO El Niño Southern OscillationET Evapotranspiration ETV Evapotranspiration to Lake Volume ratio FAO Food and Agricultural Organization of the United Nations GCM General Circulation ModelsGDP Gross Domestic ProductGNI Gross National IncomeGWh Gigawatt hourGWP Global Water Partnership HYDROMET Hydro-meteorological Survey of the Equatorial LakesIGBP International Geosphere Biosphere IPCC Inter-governmental Panel on Climate ChangeITCZ Inter-Tropical Convergence Zone MCM Million Cubic MetresMDGs Millennium Development GoalsMODIS Moderate Resolution Imaging SpectroradiometerMW MegawattNAPA National Adaptation Programmes of ActionNBI Nile Basin InitiativeNDVI Normalized Difference Vegetation Index Nile-COM Nile Council of MinistersNile-Sec Nile Basin Initiative SecretariatNile-TAC Nile Technical Advisory CommitteePET Potential EvapotranspirationPJTC Permanent Joint Technical Commission for Nile WatersRCM Regional Climate ModelsREDD Reducing Emissions through Deforestation and Forest Degradation.SAP Subsidiary Action Programmes SAV Surface Area to Volume SLR Sea Level RiseSRES Special Report on Emission ScenariosSVP Shared Vision ProgrammeTECCONILE Technical Co-operation for the Promotion of the Development and Environmental Protection of the Nile BasinUN United NationsUNEP United Nations Environment Programme UNESCO United Nations Educational, Scientific and Cultural OrganizationUNFCCC United Nation’s Framework Convention on Climate ChangeUNLCCS United Nations Land Cover Classification System

vi
Sunset on the Blue Nile.
vi
jayd
oubl
eyou
gee
/ Fot
er /
CC B
Y-N
C-SA

vii
ForewordThe Nile River Basin’s rich ecological resources are vital to the 238 million people living in the region. The basin’s natural environment is the ultimate source of its economic activities (production and consumption) and the sink for disposing of all its waste. At the same time, the Nile Basin’s human resources are also crucial assets, providing the labour and markets for goods that drive the regional economy. This report illustrates these links between people, the economy and the environment. For example, we learn that the Nile Delta and the wider Mediterranean coast account for 30-40 per cent of Egypt’s agricultural production and more than half of its tourism and industrial base. Water is central to all these activities and processes and must be available in sufficient quantities to meet environmental, consumption and social needs.
Climate change is a reality, however, and the people and environments of the Nile Basin are already feeling its impacts. Its major effect is on water availability in the region, as is abundantly evident from this Vulnerability Assessment. Examples include rising temperatures; increased flood and drought frequency; sea-level rise; and changes in natural ecosystems, such as shoreline accretion or erosion, salt-water intrusion into the Nile delta’s freshwater aquifers, and glacial recession in the Ruwenzori Mountains. All of these changes are inextricably linked to the health, social, and economic well-being of the Nile Basin’s people. At the local level, we see that some communities or places are more vulnerable than others to the impacts of climate change. Thus, the region’s vulnerable sectors and ecosystems need
encouragement and options in adopting ways to adapt to climate change and develop resilience in the face of these changes.
This report is one in a series of actions intended to help vulnerable peoples and places build strategies for climate-change adaptation and resilience. It is produced under the UNEP-led project ‘Adapting to Climate-change Induced Water Stress in the Nile River Basin’. It aims to improve regional knowledge and information about climate change impacts in the region to trigger debate and form the basis for critical thinking and decision-making. In turn, informed decisions about adaptation strategies and transformative policies will complement and strengthen on-going efforts to manage the Nile River Basin’s shared resources.
In producing this document, with support from the Swedish Government, UNEP has partnered with multinational corporations, regional organisations including the Nile Basin Initiative (NBI) and the governments of the Nile Basin. It has been exciting to see diverse communities of scientists, public servants and politicians work cooperatively to bring together scientific data and socio-economic evidence of best practices to inform and advance policy discussions and decisions.
I am sure that the options and strategies proposed in this report can help the people in the Nile Basin most vulnerable to the effects of our changing climate to increase the resilience of both their communities and the ecosystems in which they live.
Mr. Achim Steiner Executive Director of UNEP

viii
Lights of the Nile River delta as seen from the International Space Station.
viii

1
Executive SummaryOverviewThis report is an output of the UNEP project Adapting to Climate-change Induced Water Stress in the Nile River Basin and was produced in collaboration with the Nile Basin Initiative, the Nile Basin Partner States, the UNEP-DHI Centre for Water and Environment and the Global Water Partnership (GWP). This publication makes use of satellite data (past and present), maps, photographs and other illustrations to highlight areas of environmental change in the Nile basin. These visual elements are accompanied by a narrative that describes, analyses and demonstrates how climate change is aff ecting the water resources of the Nile Basin. The compilation of this information culled from a variety of sources, provides a rich synthesis of qualitative and quantitative policy and scientifi c data in one place.
Policy makers in the Nile Basin region are increasingly faced with the challenges that climate change is presenting. They frequently grapple with questions such as: What are the potential future impacts of climate change on our water systems? What are the hotspot areas that are especially vulnerable to these changes? What can be done to manage or avert the eff ects of climate change? What are the implications for policy and future water management? This Assessment Report attempts to answer these questions through seven chapters which are summarized in the sections that follow.
Unless otherwise indicated, data and/or information pertaining to Sudan may also include data and/or information for the current independent state of South Sudan. Data sources specifi c to South Sudan are scarce considering its independence was recently obtained in 2011.
NA
SA
1

2
Chapter 1: IntroductionThe opening chapter presents an overview of the Nile River Basin – the people, the economy and the environment. About 238 million people live in the basin area and water, specifically from the Nile River, plays a central role in lives and livelihoods. For instance Egypt, Ethiopia and Sudan do not have significant water resources within their borders outside of the Nile and its tributaries. On the whole, the quality of life in the region is improving. Poverty rates are on the decline, literacy rates are improving with more children going to school and in most countries the health and sanitation indicators are on an upward trend. Despite this positive outlook, the report highlights wide disparities between the countries. The per capita income in Egypt is US $2 070 as compared to Burundi with US $150. Population growth rates in the basin are rapidly increasing and with it pollution, environmental degradation and the demand for water. Indeed water stress is already a concern yet the annual discharge of the Nile is not increasing.
Six million years ago geological and climatological factors played a key role in the formation of the Nile River; and these factors still impact the Nile as we know it today. Ancient civilizations were quick to realize the importance of the water resources and initiated water use agreements to that end. Some of the cooperative agreements that have defined the region since the early 1920s to the present are discussed in the report. These agreements were developed under specific political-economic contexts with the focal issues ranging from water allocation and development to environmental sustainability. The Nile Basin Initiative (NBI) is the latest such initiative. It aims to encourage regional development through the equitable use of the Nile and its resources.
Chapter 2: Land Cover Types and Vegetation Dynamics
Changes in land cover can have impacts on the water balance of the catchment (through evaporation and evapotranspiration (ET)) and have been associated with increasing soil erosion and possible changes in surface hydrology and drainage, disturbances to the aquatic biodiversity and increased sedimentation. Over the past decades the impact of human activities on the land in the Nile Basin has increased significantly due to population explosion and associated demands.
Chapter 2 uses land cover mapping to track the changes in the landscape. Two classification systems - GLOBCOVER and MODIS (Moderate Resolution Imaging Spectroradiometer) were used to provide an overview of the land cover types in the region; and the changes in land cover between 2001 and 2009 respectively. According to GLOBCOVER 2009, land cover in the basin is dominated by barren land at 32 per cent followed by forest 21.9, cropland 11.9, mosaic vegetation 11.4, and shrubland 11.5 per cent. A country by country analysis highlights further differences at that level.
The next section of the chapter brings to light land cover changes between 2001 and 2009 using MODIS land cover change maps, first at basin and then at country level. At basin level the most significant changes that occurred between 2001 and 2009 were an increase in grasslands (from 11.7 to 14.3 per cent) and a decrease in built-up or barren lands (from 34 to 31.8 per cent) over the same time period. Cropland and natural vegetation mosaic decreased by 1.2 per cent, while the remaining land cover types (forests, shrubland, savannas wetlands and crops) changed by less than 1 per cent.
Irrigated agriculture means that farmers are less dependent on rainfall for high yields.
2 Trav
el A
ficio
nado
/ Fl
ickr
/ CC
BY-
NC
2.0

3
Chapter 3: Climate and Hydrological Review
The third chapter attempts to tie together the elements of climate, (rainfall and temperature) and aspects of hydrology (river flows, lakes and underground water storage) and human-landscape features (land cover or land use change) all of which have sensitive interactions that ultimately affect the availability of water.
The discussion indicates that the Nile River is extremely sensitive to changes in precipitation and temperature. Precipitation has impacts on lake levels and river discharges; while increases in temperature have been found to affect the rates of evaporation and evapotranspiration influencing the water balance of the basin.
Land cover and land use change are important because different vegetation types have different evapotranspiration (ET) values. Heavily vegetated areas tend to have higher rates of evapotranspiration than areas of sparse vegetation. For instance in the Nile Basin, forests have the highest mean ET (1 258 mm/yr) while grasslands have the lowest (536 mm/yr). Evaporation data from the major lakes and reservoirs is also presented. MODIS maps are used to highlight evaporation and evapotranspiration data at basin level over three years: 2001, 2005 and 2010. Then the analysis is broken down for the different sub-basins and land cover types for the time period 2001 to 2010.
The next section of the chapter is a discussion on the water storage systems of the Nile Basin. Five types of water storage
Lake Victoria near the source of the Nile.
Gre
ener
y / F
oter
.com
/ CC
BY-
NC-
ND

4
systems are discussed in this chapter – lakes, wetlands, reservoirs, rivers, and underground aquifers. Open water covers about 90 000 km2 or 3 per cent of the basin’s total area. Each of these are discussed highlighting their areal extent and other key information such as total catchment area, total surface area of the water body, rainfall over the water body, runoff and annual evaporation rate.
The chapter concludes with a detailed presentation on the groundwater resources in the basin. Groundwater occurs in the transboundary aquifers, local tectonic basins and wide hydrogeological basins throughout the Nile basin. It is a strategic resource that can and is already being used to supplement scarce surface water resources. Seventy per cent of the basin population depend on groundwater. This percentage varies by country. In Sudan, it is as high as 80 per cent. Details of groundwater storage and abstraction, recharge and discharge for each country are provided.
Generally speaking there is a dearth of data on groundwater. This situation needs to be addressed if the resource is to be sustainably managed and utilized. The clear recommendation from this section is the need for detailed monitoring information in future so as to manage the resources based on sound hydrogeological knowledge especially as groundwater has potential to support adaptation options.
Fincha Lake, Horro, Ethiopia.
4
ILRI
/ Fl
ickr
/ CC
BY-
NC-
SA 2
.0
The ecosystems of the Nile basin are habitat to a wide variety of birds.
Rob
Gip
man
/ Fl
ickr
/ CC
BY-
NC
2.0

5
Villager in the Nile Basin drinking from a hand pump used to extract groundwater.
Chapter 4: Water Availability and DemandThis chapter recognizes that water is central to the wellbeing of human society. As such it must be available in sufficient quantities to meet consumption and social needs. The chapter starts with a discussion on the ‘blue and green water’ concept. In the downstream countries where precipitation is high green water is most important, in the upstream countries especially Egypt and the northern part of Sudan where precipitation is low, blue water assumes greater significance. Mean annual precipitation over the Nile Basin is estimated at only 1 660 BCM per year of which merely 84 BCM per year translates into river flow (blue water) in the Nile.
The availability of water or the actual per capita renewable water resources is on the decline influenced by variations in precipitation, the hydropolitics of the region and pressures from the rapidly growing population, among others. Together, the countries of the Nile Basin use almost 90 per cent of the region’s renewable water resources. Egypt and Sudan, which need water from outside their borders, account for the largest Nile water withdrawals at 57 and 31 per cent of the total renewable water withdrawals, respectively. Per capita withdrawals for these two countries are almost 10 to 15 times the amounts withdrawn by other countries in the basin.
Countries, such as Egypt, that have effectively and efficiently utilized the waters of the Nile have shown great economic and social progress. Per capita GDP in Egypt is three times higher
than that of Sudan, the country with the second highest GDP in the region and 18 times higher than that of the DRC which has the lowest. The upshot now is that individual basin countries are increasingly eager to make greater use of the river, so that they, too, can approach the same levels of development.
Three main water uses are discussed in this chapter: agriculture, energy generation and transport. Agriculture accounts for more than 80 per cent of water withdrawals in the region. In the upstream countries, agriculture is mostly rain fed whereas in the downstream countries agriculture relies solely on the Nile river water. In Egypt alone, about 30 per cent of the water abstracted from the Nile is devoted to irrigation.
There is tremendous potential for hydroelectric power development especially where the gradient is high. Despite this potential, the sector is underdeveloped, expensive and unreliable. Some countries have prioritized hydropower development to close this unmet need. Ethiopia, for instance, is developing the 6 000 MW Renaissance Dam on the Blue Nile; and Rwanda is developing the 80 MW Regional Rusumo Falls Hydroelectric project.
The role that the Nile plays in providing transport routes is also highlighted. This is especially important in the Sudds in South Sudan during the rainy season when roads become impassable. The Nile however is not wholly navigable due to the cataracts that occur along its course.
Wat
er.o
rg /
Flic
kr /
CC B
Y-N
C-SA
2.0
5

66
Chapter 5: Vulnerability and Hotspots in the BasinThis chapter briefl y reviews how key climate parameters – temperature, precipitation, evaporation and evapotranspiration – will react under various future climate scenarios. It discusses how changes in those parameters may impact the fl ow of the Nile waters and thus freshwater availability in the basin. All climate scenarios indicate negative impacts on the Nile fl ows and wider catchment area. These changes may predispose the local communities to a host of attendant hazards aff ecting their ability to cope. This vulnerability is of concern as the ability or inability to cope will have eff ects on social, ecological and economic systems.
Against that background, the chapter employs a hotspot methodology to identify key ecosystems or regions that may be especially vulnerable to climate change. The main aim being to draw attention to these hotspots as places that may require special attention from the research, local and development communities to ensure healthy environmental dynamics are maintained or restored. The hotspots were identifi ed using 10 selection criteria: water shortages, availability of surface water sources, groundwater shortages, environmental degradation, population dependency, ecosystem dependency, groundwater regime, mean annual rainfall, socioeconomic benefi t and contribution to the sustainability of the Nile Basin. Six hotspot areas identifi ed as a result of this exercise—the Nile delta, Nile Valley, Ethiopian plateau, Nile confl uence, the Sudd wetlands and Mt. Ruwenzori.
The last section of the chapter is a visual evaluation of the hotspots using time series satellite imagery over a series of years to show evidence of environmental change. Some of the issues discussed include the expansion of urban areas, glacial recession,
formation of new lakes and drying of others, sinking deltas and salt water intrusion, agricultural expansion and hydroelectric power generation.
Chapter 6: Impacts of Climate ChangeThe discussion in this chapter focuses on the impacts of climate change using the results of various climate scenarios. The scenario analysis tracked hydrological regimes in three hotspots – the Nile delta, Nile Valley and the Ethiopian plateau, chosen because of their extreme sensitivity to climate change and their importance in the overall sustainability of the Nile Basin.
The analysis indicates that under a scenario where the temperature rises, the heavily populated, low lying Nile delta is likely to experience shoreline accretion or erosion, sea level rise and salt water intrusion into freshwater aquifers. It is already retreating at 100 m per year aff ecting an area of about 24 900 km2 with potential risks to large cities, industry, agriculture and tourism. The Nile delta and wider Mediterranean coast account for 30-40 per cent of Egypt’s agricultural production and more than half of Egypt’s tourism and industrial base.
Future changes to the Nile Valley aquifer will be based on how climate change and water resource development and abstraction projects aff ect the recharge capacity of the shallow aquifer. Changes in the Nile Valley in Egypt have been linked to upstream changes in the Ruwenzori mountains, the Ethiopian plateau, the Nile confl uence in Sudan and fl ows in both the Blue and White Nile. These climate change impacts in those areas will determine the recharge of the Nile Valley’s crystalline and volcanic aquifers.
6

777 Ada
m F
owle
r / F
lickr
/ CC
BY-
NC-
ND
2.0
The analysis on the Ethiopian plateau, focused on how water stress and related human activities would change under diff erent climate futures. Changes in temperature and rainfall would aff ect the fl ow of the Blue Nile mainly through runoff variability and changing upstream demand. Recent developments, such as the proposed construction of two dams (Karadobi and Border), by the Ethiopian government is thought to add to this uncertainty.
Other water stress indicators that were assessed include water availability, water use by sector, hydropower generation and land use change. Future changes and uncertainties in the allocation of Nile
Implications and management options for policy are then discussed under two main scenario options—one which sees an increase in the Nile fl ows and the other a decrease in fl ows.
Chapter 7: Adaptation to climate changeThe foregoing chapters provide evidence that the Nile Basin is characterized by a number of economic, social and environmental issues that together combine to heighten the vulnerability of the region. This fi nal chapter proposes options and strategies that may assist in reducing vulnerability. The most robust policies for adaptation to climate change are those that target all tiers of society and that occur within a framework that embraces socio-economic, environmental and political considerations. Thus the report recommends a policy framework that could include the use of tools for climate change data analysis, improving communication and networking, multilevel institutional involvement, creative approaches to fi nancing adaptation and the involvement of varied stakeholders from the local to the regional level.
Specifi c recommendations are listed below:
• Integrate climate change adaptation into the development agenda across all sectors and levels of government. These issues should also be mainstreamed into transboundary water resources management to ensure the sustainable, equitable and eff ective utilization of the shared Nile waters.
• Employ climate compatible development strategies that promote economic growth while reducing risks to the environment. There are lessons to be learned from some countries in the Nile Basin such as Kenya that are already using a low carbon approach to development. The benefi ts include a reduction on carbon intensity, lower energy costs and general improvements to the environment among others.
• Invest in the groundwater resources through building capacity to gain a full understanding of the local and transboundary aquifers. Implement groundwater management plans and monitoring programmes to ensure sustainable utilization of the resource. To ensure transparency and knowledge-based decisions, appropriate groundwater management training should be tailored for the diff erent stakeholders.
• Enact eff ective climate change adaptation plans that employ climate compatible strategies that promote green growth. Such strategies will reduce vulnerability while making the most of the variety of development opportunities presented by a low emission, more resilient development.

8
Chapter 1INTRODUCTION
Overview of the Nile basinThe environmentThe 11 countries that make up the Nile basin cover a total area of 3 135 224 km2. The River Nile is the longest river in the world with a total length of about 6 700 km, traversing an extremely wide area from -40S to 310N and 240E to 400E (NBI 2010a). The riparian countries are: Burundi, Democratic Republic of the Congo (DRC), Egypt, Eritrea, Ethiopia, Kenya, Rwanda, South Sudan, Sudan, Uganda and the United Republic of Tanzania as shown in fi gure 1.1.
The countries do not all, in their entirety, fall within the Nile basin. For example, only 0.4 per cent of Eritrea’s land mass, and
0.8 per cent of Kenya’s falls within the Nile basin. The extent to which the countries depend on the water resources of the Nile also varies. Burundi and Rwanda derive all of their water resources from within their borders and Uganda produces half of its water internally. Egypt, on the other hand, is totally reliant on the Nile, with 97 per cent of its water originating outside of its territory (ESS 2012). Ethiopia, through the Blue Nile and Rivers Atbara and Sobat contributes about 85 per cent of the annual natural fl ow; while the White Nile contributes the balance (Fahmy 2006). Table 1.1 presents an overview of the key statistics of the countries.
The White Nile and the Blue Nile are the two hydrological systems that feed the main Nile. The former originates in the Equatorial Lakes Plateau (Burundi, Rwanda, the United Republic of Tanzania, Kenya, Democratic Republic of the Congo and Uganda)
Country Area (km²) Area (%)Mean
annual rainTotal populati on
(million)GNP/capita
(US $)Water/capita
(m3/p/yr)
total of basin in country of basin (mm) 2007 2025 2007 2007 2025
Burundi 27 830 13 260 47.6 0.4 1 110 8.5 15.0 72 442 269
DRC 2 344 860 22 140 0.9 0.7 1 245 62.6 107.5 94 20 973 10 500
Egypt 1 001 450 326 750 32.6 10.5 15 73.4 95.9 973 759 630
Eritrea 121 890 24 920 0.4 0.8 520 4.9 7.7 144 1 338 851
Ethiopia 1 100 000 365 120 33.2 11.7 1 125 77.1 108.7 130 1 355 842
Kenya 580 370 46 230 0.8 1.5 1 260 36.9 51.3 418 839 235
Rwanda 26 340 19 880 75.5 0.6 1 105 9.3 14.6 180 551 351
Sudan 858 715 283 376 33 11.4 100 30.6* 48.3 500* 900* 700
South Sudan 647 095 543 560 84 52 954 8.26* 15.0 1 546* 1 500* 1 200
United Republic of Tanzania
945 090 84 200 8.9 2.7 1 015 38.7 57.4 350 2 291 1 554
Uganda 235 880 231 370 98.1 7.4 1 140 28.5 55.9 210 2 133 1 087
Table 1.1: Vital statistics of the countries that share the Nile basin.
* indicates the given fi gure is estimated considering South Sudan became independent state in 2011. Source: ESS 2012, NBI 2012, World Bank 2012
P
eter
Row
ley
/ Flic
kr /
CC B
Y

9
Figure 1.1: Countries of the Nile basin.
0 300 600Kilometres
National boundary
City
Lake
Nile River Basin
Nile Basin Country
Legend
EGYPTLIBYA
SUDAN
SOUTH SUDANETHIOPIA
CHAD
CENTRAL AFRICANREPUBLIC
DEMOCRATIC REPUBLIC
OF
THE CONGO
UGANDAKENYA
ERITREA
UNITED REPUBLIC
OF TANZANIA
ANGOLA
MALAWIMOZAMBIQUEZAMBIA
REPUBLIC OF CONGO
GABON
CAMEROON
NIGERIA
NIGER
RWANDA
BURUNDI
DJIBOUTI
SOMALIA
Lake Victoria
N I L E
R I V E R
B A S I N
N I L E
R I V E R
B A S I N
I N D I A N
O C E A N
Re
d
Se
a
AdministrativeBoundary
AdministrativeBoundary
Mogadishu
Mombasa
Nairobi
Addis Ababa
Djibouti
Asmara
Bur Sudan
Aswan
Wadi Halfa
Cairo
Kisangani
Kigali
Bujumbura
Kampala
Khartoum
El Obeid
Dodoma
Kigoma
Luanda
Bangui
Kinshasa
Alexandria
Murzuq
N’Djamena
Mbandaka
Lubumbashi
N
Juba
Source: World Bank 2000

10
and is fed by substantial flow from the Baro-Akobo-Sobat river system that originates in the foothills of southwest Ethiopia. The Blue Nile has its sources in the Ethiopian highlands. The Tekeze-Setit-Atbara river system contributes to the flow further downstream of Khartoum. The region is also blessed with underground water resources that are already being used to supplement the surface water resources. Figure 1.2 shows the drainage system of the Nile River.
The basin extends over five climatic zones — mediterranean, arid, semiarid, subtropical and tropical (Karyabwite 2000). Its landscapes range from mountains, grasslands, forests and woodlands, wetlands, lakes and desert to a wave dominated delta. This combination results in an array of ecosystems that are home to a rich biodiversity that provide a multitude of benefits to the population through cultural and ecological services, trade, tourism, food, medicines and other products. The Congo-Nile divide in Rwanda, the Fayoum lakes in the Egyptian desert, the Sudd wetlands in Sudan and the Albertine Rift on the border of the DRC with Uganda are some of the areas with a unique or rich biodiversity.
There are challenges facing the environment of the region. Population is the main driver behind the ever-increasing demand for water and the chief factor responsible for land degradation and environmental pollution. The pressures exerted by the growing population leads to increasing demands for resources leading to loss of forests and wetlands, land degradation, desertification,
Blue Nile Falls, Ethiopia.
moi
/ Fl
ickr
/ CC
BY-
NC
2.0
A young girl carrying water back to camp, South Sudan.
Alu
n M
cDon
ald
/ Oxf
am /
CC B
Y-N
C-N
D 2
.0

11
N
EGYPTLIBYA
SUDAN
SOUTH SUDAN
ETHIOPIA
CHAD
DEMOCRATIC
REPUBLIC
OF
THE CONGO
UGANDA
KENYA
ERITREA
CENTRALAFRICANREPUBLIC
RWANDA
BURUNDI
SOMALIA
UNITED REPUBLIC
OF TANZANIA
City
0 300 600Kilometres
National boundary
Lake
River
Wetland
Nile River Basin
Legend
N I L E
R I V E R
B A S I N
N I L E
R I V E R
B A S I N
Lake Victoria
Lake Turkana
Lake Edward
Lake Albert
Lake Kivu
Lake Tanganyika
Lake Tana
Lake Nasser
Lake Kyoga
Nile
Riv
er
Mombasa
Nairobi
Addis Ababa
Asmara
Bur Sudan
DJIBOUTI
Aswan
Wadi Halfa
Cairo
Kisangani
KigaliBujumbura
Kampala
Khartoum
El Obeid
Juba
Whi
te N
ile
Bl u
e N
ile
Atbar a
Sudd
AdministrativeBoundary
AdministrativeBoundary
I N D I A N
O C E A N
Re
d
Se
a
Source: World Bank 2000
Figure 1.2: Drainage system of the River Nile.

12
alien invasive species, overfi shing and water pollution (NBI 2012). Many of the basin’s countries are already in a state of water stress or water scarcity, which is defi ned as less than 1 700 and 1 000 m3/person/year, respectively, of available water, based on long-term average runoff .
Economic developmentThere are huge disparities in the socio-economic conditions amongst the basin countries. According to the World Bank (2011) classifi cation of economies, Sudan and Egypt (GNI per capita of between US$ 996 and 3 945 respectively) are lower middle income countries, with the rest falling into the low income group (GNI per capita of less than US$ 995). Egypt has the highest per capita income of US$ 2 070, almost 14 times larger than Burundi which has the lowest at US $150. Between 2000 and 2009, national economies grew slowly. Ethiopia had the highest real GDP growth rates at 8.5 per cent as shown in fi gure 1.3.
According to World Bank (2011), the proportion of people living on less than US$ 1.25 per day between 1990 and 2009 declined in most countries. For instance in the United Republic of Tanzania poverty rates decreased from 72.6 per cent in 1992 to 67.9 per cent in 2007. In Uganda poverty rates declined from 64.4
to 28.7 per cent between 1996 and 2009 respectively. In Egypt by 2005, less than 6 per cent of people were living in poverty (World Bank 2011). In order to achieve the Millennium Development Goal on poverty, the United Nations Economic Commission for Africa ventures that GDP needs to grow at an average rate of at least 7 per cent per annum. Of the 11 countries, only Ethiopia, Sudan, Rwanda, the United Republic of Tanzania and Uganda managed to record average annual real GDP growth rates of more than this (World Bank 2011).
J Moh
r / U
N P
hoto
Cotton production from the Gezira Irrigation Scheme in Sudan, one of the largest in the world. Migrant workers havesting cotton in the region circa 1978.
0
2
4
6
8
Burundi DRC Egypt Eritrea Ethiopia Kenya Rwanda Sudan UnitedRepublic
of Tanzania
Uganda
US
$
3
5.24.9
0.2
8.5
4.4
7.67.3 7.1
7.8
Figure 1.3: Annual average real GDP growth rates (2000-2009).
Source: World Bank 2011

13
The populationThe total population in the 11 countries in 2012 was 437 million of which about 238 million actually reside in the Nile basin itself. Around 72 per cent of the basin population is rural (NBI 2012). According to UN Habitat (2008), by 2010, 5 cities (Addis Ababa, Alexandria, Cairo, Kampala and Khartoum) had populations greater than 1 million people. Cairo, with a population of over 10 million, is classifi ed as a megacity. Cairo and Alexandria, alone, account for 21 per cent of Egypt’s total population and almost 7 per cent of the total population in the Nile basin (UN Habitat 2008). Figure 1.4 depicts the proportion of urban and rural populations in the riparian countries.
Population density is uneven across the region. The highest population densities are found in Rwanda and Burundi with 405 and 323 people per km2 respectively, while the lowest occurs in the DRC with 29.1 people per km2. The population density in Egypt is 83.4 people per km2 but most of these live along the River Nile or along the coast (World Bank 2011). Apart from the cities, the Nile delta region, Ethiopian highlands and Lake Victoria basin are amongst the most densely populated areas in the basin.
Box 1.1 presents a case study on population explosion around Lake Victoria.
Natural growth, cultural norms, confl icts and natural disasters (that lead to displacement of people) are some of the root causes of the rapid population growth. The average annual population growth rates between 2001 and 2007 were 2.8 per cent in Burundi, 2.7 in DRC, 1.8 in Egypt, 2.9 in Eritrea, 2.6 in Ethiopia, 2.6 in Kenya, 2.8 in Rwanda, 2.2 in Sudan and 2.9 per cent in the United Republic of Tanzania. Uganda has the highest population growth rate (3.3 per cent) in the basin. Some cities within the basin are also
Box 1.1: Population trends in the Lake Victoria basin.
Lake Victoria catchment covers an area of 184 200 km2 and supports about 35 million people. This number is expected to double by 2020. Population densities are high with fi gures ranging from 100 to over 1 200 people per km2 (Lubovich 2009). The largest population concentrations are along the lake edge and within the River Kagera basin. Although most of the basin’s population is rural, there are a few large towns such as Mwanza in the United Republic of Tanzania, Kisumu in Kenya and Jinja in Uganda, among others. The population growth rate throughout the basin is about 3-4 per cent, while in the urban areas in the basin, it ranges between 5-10 per cent (Lubovich 2009).
About 21 million people depend on subsistence agriculture, pastoralism and agro-pastoralism for a living.
Poverty is rife with average earnings ranging between US$ 90 and 270 per year (GIWA 2006).
There are a number of environmental pressures precipitated by the burgeoning population. These include municipal and industrial pollution, soil erosion, deforestation and overfi shing. The spiral nature of environmental degradation implies that failure to address these issues is likely to threaten the ecological integrity of the lake, food security, livelihoods and the economies of the region.
11
35.2
42.8
21.617.6
22.218.9
45.2
26.4
13.3
89
64.8
57.2
78.482.4
77.881.1
54.8
73.6
86.7
Urban Rural
0
20
40
60
80
100
Burundi DRC Egypt Eritrea Ethiopia Kenya Rwanda Sudan Uganda
Per
cent
UnitedRepublic
of Tanzania
Figure 1.4: Proportion of urban and rural population in the basin countries.
Source: UN Habitat 2008
Source: UNEP 2006
Trend in population density surrounding Lake Victoria, 1960-2010
Per
cent
3
1.31.1
0
1
2
3
Lake Victoria basin
Sub Saharan Africa
Africa
Comparison of population growthrates between the Lake Victoriabasin and Africa.

14
growing at rates even higher than the national average. Kampala, for instance, has a city population growth rate of 4.77 per cent (UN Habitat 2008).
Population projections indicate continued growth in the basin, which will increase the demand for natural resources in the basin countries. The fl ipside is that this large population also presents an opportunity in terms of a workforce for economic development and a vibrant market for the diverse goods and services.
Some social indicators illustrate positive trends as shown in fi gure 1.5. For example, mortality rates are falling and more children are getting an education. By 2009, 52.4 per cent of children in Burundi were completing primary school up from 24.6 in 2000; 47.8 up from 36.4 in Eritrea, 55.2 up from 23.0 in Ethiopia and 57.2 up from 35.8 in Sudan. However, there is still a gender discrepancy in education with more boys than girls enrolled in primary and secondary school. Literacy rates of adults, age 15 and older, ranges from 66.6 per cent in Burundi and Eritrea, to 87 per cent in Kenya (World Bank 2011).
The level of access to an improved water source is defi ned by the World Health Organization as the percentage of the population with access to a safe water source, and is cited as a major health
Looking over the Nile River, Cairo, Egypt.
Z
eina
b M
oham
ed /
Flic
kr /
CC B
Y-N
C-SA
2.0
0
50
100
150
200
250
1990 2000 2009
Mor
talit
y pe
r 1 0
00 li
ve b
irth
s
Burundi
DRC
Egypt
Eritrea
Ethiopia
Kenya
Rwanda
Sudan
Uganda
UnitedRepublicof Tanzania
Source: World Bank 2011
Figure 1.5: Under-5 mortality rates per 1 000 live births (1990-2009).

15
Source: World Bank 2011
and economic indicator. The proportion of population with access to an improved water source varies from country to country as shown in fi gure 1.6. It ranges from 99 per cent in Egypt to a low 38 per cent in Ethiopia (World Bank 2011). As a sign of health and sanitation, the extremely low level of access to improved water source in Ethiopia provides evidence that the overall health level of the population remains low despite recent upward trends in GDP growth.
How the River Nile was formedThe story of the Nile begun about 6 million years ago with the evaporation of the Mediterranean Sea (UNESCO 1981). It is a narrative of powerful interactions between geological and climatologic factors. Scientists have since determined that the Nile went through fi ve stages during its formative years as listed in box 1.2.
The drying of the Mediterranean Sea was prompted by tectonic activity that led to the closure of the Straits of Gibraltar. The temporary closure from the Atlantic Ocean meant that more water was evaporating from the Mediterranean than was being
supplied by the rivers that fl owed into it. Originally the defi cit was made up by sea fl ows from the Atlantic. However when the collision between Africa and Europe closed the Straits of Gibraltar, the fl ow of Atlantic sea water stopped. This, combined with the high global temperatures at that time caused the Mediterranean Sea to gradually dry up leaving behind a huge expanse of salt. This was called the Messinian Salinity crisis (Salama 1997, Williams and Williams 1980). The drying up of the Mediterranean had a profound eff ect on the streams that fl owed into it. In time, the barrier at Gibraltar ruptured and the Mediterranean basin was refi lled (Salama 1987, Williams and Williams 1980).
Further tectonic activity in the centre of Africa led to the formation of the Great Rift Valley that stretches about 3 000 km from Ethiopia and the Red Sea down towards Mozambique. The gradual uplifting and tilting elevated the headwaters of the Nile and, consequently, the waters were directed northwards, away from the Congo basin and the Indian Ocean. The rifting was also responsible for the formation of the large equatorial lakes of Kyoga, Victoria, George, Albert and Edward (Wendorf and Tchild 1976, Said 1981, Salama 1987, Salama 1997, Dumont 2009).
The volcanic activity that led to the formation of the Ethiopian highlands further enhanced the river’s fl ow northwards. Over the years the heavy rains over the Ethiopian plateau during
Burundi DRC Egypt Eritrea Ethiopia Kenya Rwanda Sudan Uganda0
20
40
60
80
100
Prop
ortio
n1990 2000 2008
UnitedRepublic
of Tanzania
Figure 1.6: Trends in the proportion of the population with access to an improved water source: 1990, 2000 and 2008.
Box 1.2: Stages in the formation of the Nile.
1. Eonile (6 million years ago) – formed in response to the Messinian Salinity crisis. As the levels of the Mediterranean dropped, the Eonile formed as streams started to cut channels deep into the underlying rocks extending the headwaters deeper upstream. This led to the development of the Eonile canyon.
2. Paleonile (1.8-4 million years ago) – drainage basin smaller than the current Nile and was probably restricted to Egypt. Drier conditions set in and Paleonile became a seasonal river.
3. Protonile (1.5 million years ago) – arid conditions led to a harsh desert being established in North Africa. The Nile stopped fl owing north. Torrential rains would occasionally fi ll the dry channels. This phase was confi ned to Egypt as there
was no fl ow from south of the Nubian Swell. If the Blue Nile existed at this time, it probably fl owed east to the Red Sea.
4. Prenile (200 000-700 000 years ago) – wetter climatic conditions between 600 000 and 125 000 years ago resulted in new river fl ow from the Ethiopian highlands (and it is thought the Sudd) to the Mediterranean sea. This was later stopped between 125 000 and 80 000 years ago due to the uplift of the Nubian Swell and arid conditions.
5. Neonile (120 000 years ago) – fl ow of Nile reestablished in Egypt. White Nile and Blue Nile connected between 70,000 and 80,000 years ago. Contributions from the White Nile grew especially with the formation of Lakes Victoria, Albert and Tana about 12 000 years ago. Recent uplift also directed stream fl ow including that from Lake Victoria northward.
Source: Salama 1997, UNESCO 1981, Dumont 2009

16
the monsoon season provided the additional water that eventually, through erosion and flooding, led to the connection of the White Nile and the Blue Nile. These rains are what cause the annual Nile flood. They also give the upstream Nile, the strength to surmount topographical barriers such as the Nubian Swell and Bayuda uplift and reach the Mediterranean Sea in the north, forming the Nile as we know it today.
The history of cooperation in the Nile basinTransboundary watercourses traversing different states present a challenge in terms of management as each country has differing interests as per their national and local needs. This sets the stage for potential disagreements pointing to the need for cooperation between countries and even lower levels. International law provides a basis for negotiation of rules to govern transboundary waters. The agreements governing the Nile have developed over time and in specific political-economic contexts. The issues driving the various agreements are many and range from the need for allocation and development of water to environmental sustainability (Lautze and others 2005, Awiti 2010).
Bilateral cooperation Cooperation in the Nile basin started in the form of bilateral agreements with two countries (or colonial power on behalf of the colony) coalescing around a single theme or technical issue and
usually with the establishment of an institutional framework to manage its implementation. Most agreements signed during the colonial times were bilateral. The main focus of the agreements at this time was water development and allocation (Lautze and others 2005). The bilateral agreements gradually progressed to multi-lateral agreements with more countries and broader issues, such as the desire for joint management and environmental sustainability, becoming the main focus (Lautze and others 2005). Table 1.2 attempts to classify some of the reasons behind the establishment of the Nile basin water agreements between 1995 and 2003. A number of the earliest bilateral arrangements are listed in box 1.3, some of which are discussed in the sections that follow.
The Permanent Joint Technical Commission for Nile Waters (PJTC) was established to enable the implementation of the 1959 Nile Water Agreement between Sudan and Egypt. The principal issue of this agreement was to gain full control and
Box 1.3: Some of the early bilateral arrangements (before 1998) between the Nile basin countries.
1. Protocol between Britain and Italy in 1891;
2. Treaty between Britain and Ethiopia in 1902;
3. Agreement between Britain and Congo in 1906 (Modifying the Agreement of Brussels signed in 1894);
4. Agreement between Britain, Italy and Ethiopia in 1906;
5. Exchange of notes between Britain and Italy in 1925;
6. Nile water agreement in 1929;
7. Convention between Britain and Belgium in 1934;
8. Exchange of memoranda between Egypt and Great Britain (on behalf of Uganda) in 1949 – 1953;
9. Egypt and the Sudan Nile Agreement in 1959 for full control of and utilization of the Nile waters;
10. Exchange of memoranda between Egypt and Uganda in 1991;
11. Framework for General Cooperation between Egypt and Ethiopia in 1993; and
12. Agreement between Egypt and Uganda for controlling water hyacinth in 1998.
1925-1960 1977-2003
Number of Agreements 9 6
Porti on of the Nile to which agreement applies
100 % downstream
83 % upstream
Creates or assumes joint management structure
22 % 83 %
Provision for water development 89 % 33 %
Environmental sustainability 0 % 50 %
Water sharing/division 44 % 0 %Source: Lautze and others 2005
Table 1.2: Temporal and spatial variation in Nile basin international water agreements.
The Roseires dam in Sudan, on the Blue Nile just upstream of the town of Er Roseires.
Sim
onch
illy
/ Wik
i Com
mon
s / C
C BY
-SA
3.0

17
utilization of the annual Nile flow. Indeed the total average annual flow was shared only between Sudan and Egypt in the ratio 18.5 to 55.5 billion cubic metres respectively. Under this agreement the Aswan Dam (Egypt) and Rosaries Dam (Sudan) were built to help regulate the Nile flow. The PJTC also acted as a vehicle for international negotiations and collaboration with organizations dealing with administrative and legal issues concerning international waters (PJTC 1983).
Other examples of bilateral cooperation include:
Egypt’s grant to Kenya to excavate groundwater wells in arid and semi-arid zones in 1996. Under this arrangement, a grant of US$ 4.2 million was given to Kenya in 1996 to excavate 100 ground wells in the arid and semi-arid areas of the country.
Agreement between Egypt and Uganda to control the water hyacinth: In March 1998, Egypt gave Uganda a grant of US $13.9 million to help combat and control the invasive aquatic weed - the Water hyacinth. Activities included purchase and delivery of equipment and machinery to clear the water weed from Lakes Victoria, Kyoga, Albert and sections of the River Nile.
The International Post-graduate Diploma on shared water resources is run by the Department of Irrigation and Hydraulics of the Faculty of Engineering at Cairo University. Courses in water resources management are run for nationals from the Nile basin countries. The main objective is to develop a cadre of professionals trained in the development and management of international rivers and their basins. It includes engineering, political, geographical, socio-economic, and environmental aspects.
Regional cooperationThe HYDROMET Project (Hydro-meteorological Survey of the Equatorial Lakes) is taken to be the first multilateral institutional mechanism to promote cooperation in the Nile basin. Set up in 1963, its focus was technical - to evaluate the water balance of the Lake Victoria catchments in order to assist in control and regulation of the lake level as well as the flow of water down the Nile. It was prompted by a disastrous flooding of the Sudd caused by increased rainfall in the Equatorial Lakes region in 1961-1962 (Mekonnen 2010). The participating countries were Egypt, Kenya,
Sudan, the United Republic of Tanzania, and Uganda. Burundi, DRC and Rwanda eventually joined in 1967, and the survey area was broadened to include the portion of Lake Victoria in Rwanda and Burundi and Lake Albert in the DRC. Ethiopia acquired observer status in 1971. Some of the main achievements were collection of hydro-meteorological data and the creation of a cadre of water experts (Mekonnen 2010).
Agreements to manage the Kagera River basin: Two agreements regarding the establishment of the Kagera River Basin Organization, an organization to manage and develop the Kagera River basin, were signed in 1977 and 1981. The first was by Burundi, Rwanda and the United Republic of Tanzania; and the second, an amendment to allow the accession of Uganda to the agreement. River Kagera is the main source of water for Lake Victoria and the White Nile. Fertile soils and high rainfall ideal for agriculture have fuelled a high population density in the area (REMA 2009). Population growth is a key driver of environmental change in the Kagera river basin. The need for sustainable management of the catchment resources thus led to the establishment of the organization. At present, however, a lack of finance is constraining the activities of this organization.
Agreements to manage Lake Victoria: A number of agreements to manage the Lake Victoria catchment were signed by Kenya, Uganda and the United Republic of Tanzania between 1994 and 2003. All these focused on environmental sustainability; and included:
• 1994 Convention for the Establishment of The Lake Victoria Fisheries Organization;
• 1994 Agreement on the preparation of a tripartite environmental management programme for Lake Victoria;
• 1998 Amendments to the Convention for the Establishment of the Lake Victoria Fisheries Organisation
• 2003 Protocol for Sustainable Development of Lake Victoria Basin to the Treaty for the establishment of the East African Community.
A Lake Victoria Basin Commission was established in 2001 and currently administers the management and development of the lake and its resources.
A section of the Nile in Uganda.
US
Arm
y A
fric
a / F
lickr
/ CC
BY
2.0

18
Arrangements to manage the River Nile: Significant attempts at basin-wide management of the Nile started with the establishment of TECCONILE (Technical Co-operation for the Promotion of the Development and Environmental Protection of the Nile Basin) in 1993. Participating countries included Egypt, Rwanda, Sudan, the United Republic of Tanzania, Uganda and Zaire (now DRC). Burundi, Eritrea, Ethiopia and Eritrea were observers. TECCONILE was designed as a 3-year transient outfit that would lead the countries towards a more enduring institution to guide on Nile issues. Its main objective was to enable sustainable development of the Nile waters through basin-wide cooperation and equitable use of water (Abrams 2001). One of its outputs included the Nile River Basin Action Plan (Wolf and Newton 2008). While TECCONILE was successful at many levels, some downstream riparian states did not participate fully. TECCONILE eventually culminated in the formation of the Nile Basin Initiative in 1999.
Current legal and institutional framework The Nile Basin Initiative (NBI) was established by the Council of Ministers of Water Affairs (Nile-COM) of all the basin countries on January 22, 1999. Its vision is “to achieve sustainable socioeconomic development through the equitable utilization of, and benefit from, the common Nile Basin water resources” (NBI 2010a). Over the years, the reality is that the numerous agreements and collaborative arrangements over the use of the Nile resources have been laden with suspicion and a lack of political will. To that end, it is the objective of the NBI to build capacity, encourage sharing of information and to implement joint projects with the involvement of all stakeholders so as to foster trust and build the confidence of the riparian countries in each other. It is yet another transitional establishment until all the foundation issues underpinning the renegotiation of the Nile Waters Agreement of 1929 are completed.
The NBI is managed using a three-tier approach. The Nile Council of Ministers (Nile-COM) is the top policy making organ and is advised on technical issues by the Nile Technical Advisory Committee (Nile-TAC). The Secretariat (Nile-SEC) is responsible for facilitating the day-to-day activities. To achieve its vision, the NBI is guided by a Strategic Action Programme made up of two complementary programmes: the Shared Vision Programme (SVP) and the Subsidiary Action Programme (SAP). Box 1.4 highlights the specific objectives of the Nile basin strategic action programme.
The SVP and SAP encapsulate the NBI’s strategic approach to implementation. The SVP which seeks to encourage cooperation and catalyze development focuses on education, capacity building of key personnel and partnerships. The SAP, on the other hand, seeks to promote development through tangible activities at sub-basin level to mitigate poverty, stimulate economic growth
Box 1.4: Objectives of the Nile River Basin Strategic Action Programme.
• Develop the water resources of the Nile basin in a sustainable and equitable way to ensure prosperity, security and peace for all its peoples;
• Ensure efficient water management and the optimal use of water resources;
• Ensure cooperation and joint action between the riparian countries through win-win solutions;
• Target poverty eradication and promote economic integration; and
• Ensure that the programme results in a move from planning to action.
Source: NBI 2010b
Aswan Dam, Egypt.
Rém
ih /
Wik
i Com
mon
s / C
C BY
-SA
3.0

19
1920 Nile Projects Commission formed, off ers allocati on scheme for Nile riparians. Findings were not acted upon.
1920Century Storage Scheme put forward, emphasizing upstream, relati vely small-scale projects. Plan is criti cized by Egypt.
1925 New Water Commission is named.
7 May 1929 Commission study leads to Nile Waters Agreement between Egypt and Sudan.
1952 Aswan High Dam proposed by Egypt. Promise of additi onal water necessitates new agreement.
Sep-Dec 1954 First round of negoti ati ons between Egypt and Sudan . Negoti ati ons end inconclusively.
1956 Sudan gains independence. Egypt is more conciliatory with government aft er 1958 coup.
8 Nov 1959 Agreement for the Full Uti lizati on of the Nile Waters (Nile Waters Treaty) signed between Egypt and Sudan.
1967-1992 Launch of HYDROMET regional project for collecti on and sharing of hydro-meteorological data, supported by UNDP.
1993Formati on of TECCONILE (Technical Cooperati on Committ ee for the Promoti on of the Development and Environmental Protecti on of the Nile Basin) to address development agenda for the Nile basin.
1993First of ten Nile 2002 Conferences for dialogue and discussions between riparians and internati onal community, supported by CIDA (Canadian Internati onal Development Agency.)
1995 Nile River basin acti on plan created within TECCONILE framework, supported by CIDA.
1997-2000Nile riparians create offi cial forum for legal and insti tuti onal dialogue with UNDP support. Three representati ves from each country (legal and water resource experts) and a panel of experts draft a "Cooperati ve Framework” in 2000.
1997 Formati on of Nile-COM, a Council of the Ministers of Water from each of the riparian nati ons of the Nile basin.
1998 First meeti ng of the Nile Technical Advisory Committ ee (Nile-TAC).
May 1999Nile basin Initi ati ve established as a cooperati ve framework between all riparians (excluding Eritrea) for the sustainable development and management of the Nile.
May 2004NBI starts to implement 7 basin-wide Shared Vision Projects:- 3 themati c, 4 facilitati ve, 1 coordinati on project and 1 sub-basin projects
2008 Insti tuti onal strengthening project established
Year Cooperati on Eff ort
and reverse environmental degradation. International experience confirms that it is often visible development activities that provide the incentives for transboundary cooperation and sustainable political commitment. To that end the Nile basin has been divided into two investment regions: The Eastern Nile (Egypt, Ethiopia and Sudan) and the Nile Equatorial Lakes regions (Burundi, Democratic Republic of the Congo, Egypt, Kenya, Rwanda, Sudan, the United Republic of Tanzania and Uganda).
Table 1.3 provides a timeline of the cooperative efforts in the basin.
Context of this reportWater in the Nile basin has traditionally been used for domestic, transport, leisure, food security, wildlife and many other activities. According to NBI (2010a), the main consumptive use of the Nile waters is for agriculture. Lately, however, the evidence shows that water availability is decreasing; and this water scarcity is expected to increase even further. In fact as highlighted earlier the projected water available per capita in all the Nile basin countries, between 2007 and 2025, is on a downward trend. The underlying causes of this are many but include climate change and variability, population growth and a general degradation of the environment.
The United Nations Environment Programme (UNEP) is assisting the Nile basin countries to adapt to some of these
challenges under the sponsorship of a UNEP-led project titled ‘Adaptation to Climate-change Induced Water Stress in the Nile River Basin’. Other partners in the project include the NBI Secretariat (and all the partner states), the UNEP-DHI Centre for Water and Environment and the Global Water Partnership (GWP).
The implementation approach involves using climate change adaptation methods, such as building resilience of vulnerable sectors and ecosystems in the region. One method of building resilience is through extending the knowledge and information base to aid critical thinking and decision making; and it is against that background that this report was produced. It is part of a knowledge-based policy intervention that aims to complement and strengthen the on-going efforts to address the challenges of managing the water resources. As part of the analysis, ‘hot spots’ have been identified as pilot areas where the identified adaptation methods can commence.
To that end, this document traces a history of the River Nile; reviews the environmental characteristics of the basin including land use and vegetation dynamics, hydrology and the water availability and demand. Various climate scenarios are discussed based on the interactions between these issues and the probable impacts in the identified vulnerable hotspots. The report concludes by proposing options and strategies for adaptation to climate change.
Source: Wolf and Newton 2008, Mitchell 2012
Table 1.3: Timeline of the cooperation efforts over the Nile.

20
ReferencesAbrams, L. (2001). Report of the Workshop on the Establishment of
an International Discourse on Development in the Nile Basin: Finding a Platform for Engagement. Gland, 10-12 January. http://nilebasin.com/documents/discourse.html. Accessed 26th November 2012.
Awiti, A.O. (2010). Framework Agreement on Utilization and Management of the Nile Basin Waters. Advancing Global Sustainability. http://www.envidevpolicy.org/2010/04/framework-agreement-on-utilization-and.html. Accessed on 26th November 2012.
Dumont, H.J. (2009). A Description of the Nile Basin, and a Synopsis of Its History, Ecology, Biogeography, Hydrology, and Natural Resources, In H. J. Dumont [ed.] The Nile: Origin, Environments, Limnology and Human Use. Monographiae Biologicae, Springer. Dordrecht. Vol. 89: 1–21.
ESS (1995-2012). Needs Assessment for and Conceptual Design of the Nile Basin Decision Support System. Environmental Software and Services (ESS) GmbH Austria. http://www.ess.co.at/WATERWARE/NILE/background.html. Accessed 26th November 2012.
Fahmy, A. (2006). The Identification of Hydrological Units in the Nile Basin. Data Availability. FRIEND/Nile (FN) UNESCO-Flanders Science. Trust Fund Project. The United Nations Education, Scientific And Culture Organization (UNESCO), Paris.
GIWA (2006). East African Rift Valley Lakes. GIWA Regional Assessment no. 47. http://www.giwa.net/areas/reports/r47/giwa_regional_assessment_47.pdf. Accessed 2nd Dec 2012.
Karyabwite, D.R. (2000). Water Sharing in the Nile River Valley. United Nations Environment Programme (UNEP). UNEP/DEWA/GRID, Geneva.
Lautze, J., Giordano, M and M. Borghese (2005). International workshop on ‘African Water Laws: Plural Legislative Frameworks for Rural Water Management in Africa’, 26-28 January 2005, Johannesburg, South Africa
Lubovich, K. (2009). Cooperation and Competition: Managing Transboundary Water Resources in the Lake Victoria Region. Working Paper No.5. Foundation for Environmental Security and Sustainability (FESS), Washington D.C. www.fess-global.org. Accessed 15th January 2013.
Mekonnen, D.Z. (2010). The Nile Basin Cooperative Framework Agreement Negotiations and the Adoption of a ‘Water Security’ Paradigm: Flight into Obscurity or a Logical Cul-de-sac? Eur J Int Law (2010) 21 (2): 421-440. doi: 10.1093/ejil/chq027. Accessed 20th December 2012.
Mitchell, R.B. (2002-2012). International Environmental Agreements Database Project (Version 2012.1). IEA Database Project, 2002-2012. University of Oregon, Oregon. http://iea.uoregon.edu/. Accessed on 20th December 2012. Accessed 20th December 2012.
NBI (2010a). Key facts about the Nile basin. Nile Basin Initiative (NBI), Entebbe. http://www.nilebasin.org/newsite/index.php?option=com_content&view=article&id=135%3Akey-facts-about-the-nile-basin&catid=75%3Astats&Itemid=68&lang=en. Accessed 19th December 2012..
NBI (2010b). About the NBI. Nile Basin Initiative (NBI), Entebbe. http://nilebasin.org/newsite/index.php?option=com_content&view=category&layout=blog&id=34&Itemid=74&lang=en
NBI (2012). State of River Nile Basin 2012. Nile Basin Initiative (NBI), Entebbe.
PTJC (1983). Permanent Joint Technical Commission for the Nile Waters (PJTC): Egypt-Sudan. United Nations, New York. pp158-164.
REMA (2009). State of the Environment and Outlook Report. Rwanda Environment Management Authority (REMA), Kigali.
Said, R. (1981). The geological evolution of the River Nile. Springer-verleg.
Salama, R.B. (1987). The evolution of the River Nile. The buried saline rift lakes in Sudan. J.African Earth Sciences 6 (6): 899-913. Doi: 10.1016/0899-5362(87)90049-2.
Salama, R.B. (1997). Rift basins of Sudan. African basins, Sedimentary basins of the World. 3. Edited by R.C. Selley (Series Editor K.J. Hsu) p105-149. Elsevier, Amsterdam.
UN Habitat (2008). Urban State of Cities Report. United Nations Human Settlements Programme (UN Habitat), Nairobi.
UNEP (2006). Lake Victoria: Falling Lake Levels Concern for Growing Population. United Nations Environment Programme (UNEP)/GRID-Sioux Falls. http://na.unep.net/atlas/africaLakes/downloads/posters/Lake_Victoria.pdf. Accessed 26th November 2012.
UNESCO (1981). General history of Africa. Methodology and African Prehistory. By International Scientific Committee for the Drafting of a General History of Africa, UNESCO. University of California Press, California. http://books.google.co.ke/books?id=VgmE8bf134YC&pg=PA370&lpg=PA370&dq=paleonile&source=bl&ots=H7bep8r6kP&sig=X1ZGJKzmnv3keuqdfKMz339KMew&hl=sw&sa=X&ei=63vVUNyjG4mGhQfNs4HwBQ&ved=0CGMQ6AEwCA#v=onepage&q=paleonile&f=false. Accessed 22nd December 2012.
Wendorf and Tchild (1976). Prehistory of the Nile Valley. Academic Press, New York.
Williams, M.A.J. and F. Williams (1980). Evolution of the Nile Basin. In M.A.J. Williams and H. Faure (eds). The Sahara and the Nile. Balkema, Rotterdam.
Wolf, A.T. and J.T. Newton (2008). Case Study of Transboundary Dispute Resolution: the Nile waters Agreement. Oregon State University, Oregon. http://www.transboundarywaters.orst.edu/research/case_studies/Nile_New.htm. Accessed 22nd December 2012.
World Bank (2011). Africa Development Indicators 2011. The World Bank, Washington D.C.
World Bank (2012). Africa Development Indicators 2012. The World Bank, Washington D.C.

21
Chapter 2LAND COVER TYPES AND VEGETATION DYNAMICS
To
m L
owen
thal
/ Fl
ickr
/ CC
BY-
NC-
ND
2.0
IntroductionLand cover can be described as the features (man-made or natural) that are recognizable on the ground. Land use, on the other hand, are those activities that people carry out on the land, usually within a certain land cover type. Land can be used for many things including sustenance, livelihood and survival. These various approaches to using and managing land inevitably lead to some form of alteration. The extent and type of land use has implications, either benefi cial or detrimental, for the land resource, in particular, and the environment in general.
Over the past decades the impact of human activities on the land in the Nile basin has increased signifi cantly due to population explosion and associated increasing demands. The result has been modifi cations with insidious impacts on the physical, biological and functional aspects of the land resource. When land cover changes, human health, the economy and the environment are all aff ected. For instance, land cover changes that involve deforestation of an entire landscape can have impacts that aff ect
the hydrological cycle ultimately contributing to global climate change. At the local level, the impacts from land use or land cover change may seemingly be negligible, but cumulatively they have the propensity to pose signifi cant threats especially over a long time. This chapter highlights the main land cover types and land cover changes in the Nile basin as a whole, and then breaks the analysis down by country.
Land cover types in the Nile basinLand cover mappingLand cover types can be mapped and are used to track changes in the landscape so as to monitor the land resource, collect information for environmental management and policy or to plan for disaster prevention among others. Field surveys have typically been used for land cover studies, but remote sensing from aircraft
Tea and wheat fi elds replacing forest, Burundi.
Jane
Bol
es /
Flic
kr /
CC B
Y-N
C-SA
2.0

22
or satellite is now the norm. Over the years, different classification systems have been developed, two of which are discussed in the sections that follow. These include the MODIS (Moderate Resolution Imaging Spectro-radiometer) and GLOBCOVER. The choice of which land cover system to use depends on the specific purpose, data types and scale requirements. However, either system can be used to provide an overview of the land cover types in the region.
Land cover of the Nile basin using GLOBCOVER 2009GLOBCOVER, an initiative of the European Space Agency with other partners, has 22 land cover classes defined using the United Nations Land Cover Classification System (UNLCCS), a spatial resolution of 300m and accuracy of 67.1 per cent (Fritz and others 2011). For purposes of this report, these have been condensed to nine general classes: cropland, mosaic vegetation, forest, grassland, shrubland, barren land, wetlands, urban/artificial and water as described in figure 2.1 and table 2.1.
The total area of the Nile basin is 3 135 224 km2 as calculated using the GLOBCOVER 2009 dataset and Lambert azimuthal equal-
area projection system. Land cover in the basin is dominated by barren land at 32 per cent followed by forest 21.9, cropland 11.9, mosaic vegetation 11.4, and shrubland 11.5 per cent. The main land cover types are highlighted in table 2.2.
Value Label
11 Post-fl ooding or irrigated croplands (or aquati c)
14 Rainfed croplands
20Mosaic cropland (50-70%) / vegetati on (grassland/shrubland/forest) (20-50%)
30Mosaic vegetati on (grassland/shrubland/forest) (50-70%) /cropland (20-50%)
40Closed to open (>15%) broadleaved evergreen or semi-deciduous forest (>5m)
50 Closed (>40%) broadleaved deciduous forest (>5m)
60 Open (15-40%) broadleaved deciduous forest/woodland (>5m)
70 Closed (>40%) needleleaved evergreen forest (>5m)
90 Open (15-40%) needleleaved deciduous or evergreen forest (>5m)
100Closed to open (>15%) mixed broadleaved and needleleaved forest (>5m)
110 Mosaic forest or shrubland (50-70%)/grassland (20-50%)
120 Mosaic grassland (50-70%) / forest or shrubland (20-50%)
130Closed to open (>15%) (broadleaved or needleleaved, evergreen or deciduous) shrubland (<5m)
140Closed to open (>15%) herbaceous vegetati on (grassland, savannas or lichens/mosses)
150 Sparse (<15%) vegetati on
160Closed to open (>15%) broadleaved forest regularly fl ooded (semi-permanently or temporarily) - Fresh or brackish water
170Closed (>40%) broadleaved forest or shrubland permanently fl ooded - Saline or brackish water
180Closed to open (>15%) grassland or woody vegetati on on regularly fl ooded or waterlogged soil - Fresh, brackish or saline water
190 Arti fi cial surfaces and associated areas (Urban areas >50%)
200 Bare areas
210 Water bodies
220 Permanent snow and ice
230 No data (burnt areas, clouds,…) Source: Bontemps and others 2010
Table 2.1: Original land cover classes and descriptions for GLOBCOVER 2009.
Classes 11, 14, and 20 were combined to create ‘cropland’. Class 30 is ‘mosaic vegetation’. Classes 40 through 110 were combined to create ‘forest’. Classes 120 and 140 were combined to create ‘grassland’. Class 130 is ‘shrubland’. Classes 160 through 180 were combined to create ‘wetlands’. Class 190 is ‘urban/artificial’ and classes 150 and 200 were combined to create ‘barren land’. Class 210 is ‘water’. Class 220 was not relevant to this study area.
Source of the Nile at Jinja, Uganda.
Land cover typeTotal area
(km2)%
1 Cropland 372 640 11.9
2 Mosaic vegetati on 358 225 11.4
3 Forest 685 182 21.9
4 Grassland 204 157 6.5
5 Shrubland 358 976 11.5
6 Wetland 49 536 1.6
7 Urban/Arti fi cial 4 642 0.2
8 Barren land 1 004 573 32.0
9 Water 97 293 3.1
Total 3 135 224 100
Table 2.2: GLOBCOVER (2009) land cover types in the Nile basin.
neilj
s / F
lickr
/ CC
BY
2.0

23
N
EGYPTLIBYA
SUDAN
SOUTH SUDAN
ETHIOPIA
CHAD
DEMOCRATIC
REPUBLIC
OF
THE CONGO
UGANDA
KENYA
ERITREA
CENTRALAFRICANREPUBLIC
RWANDA
BURUNDIUNITED REPUBLIC
OF TANZANIA
SOMALIA
0 300 600Kilometres
National boundary
Cropland
Mosaic vegetation
Forest
Grassland
Shrubland
Wetland
Urban/Artificial
Barren land
Water
Legend
Nile
Riv
er
AdministrativeBoundary
AdministrativeBoundary
I N D I A N
O C E A N
Re
d
Se
a
LakeVictoria
DJIBOUTI
Figure 2.1: Land cover of the Nile basin from GLOBCOVER 2009.

24
Burundi
The Nile basin portion of Burundi is dominated by mosaic vegetation (56.4 per cent) followed by forest (27.7 per cent), and shrubland (13.4 per cent). Water accounts for 1.3 per cent of the land which is the southern portion of Lake Rweru. Forest cover is primarily located on the eastern side of the basin and shrubland is most dense in the south (fi gure 2.3).
N
UNITED REPUBLICOF TANZANIA
RWANDA
BURUNDI
0 15 30Kilometres
National boundary
Cropland
Mosaic vegetationForest
Grassland
Shrubland
Urban/ArtificialWater
Legend
Table 2.3: Area and percentage of Burundi land cover types in the Nile basin.Figure 2.2: Land cover types in Burundi Nile basin from GLOBCOVER 2009.
Land Cover TypeArea(km2)
%
Cropland 72 0.5
Mosaic vegetati on 7 549 56.4
Forest 3 706 27.7
Grassland 73 0.6
Shrubland 1 799 13.4
Wetland ---- ----
Urban/Arti fi cial 21 0.2
Barren land ---- ----
Water 172 1.3
Total 13 392 100 Xavi
er D
amm
an /
Flic
kr /
CC B
Y-N
C-N
D 2
.0
Democratic Republic of the Congo (DRC)
Land cover types of the Nile basin in the DRC according to GLOBCOVER data are primarily mosaic vegetation which covers an area of 8 296 km2, followed by forest 6 442 and water 3 825 km2. The main water bodies in this country are Lake Albert in the north and Lake Edward in the south. Other major types of land cover are cropland, shrubland and wetlands (fi gure 2.3 and table 2.4).
N
DEMOCRATIC
REPUBLIC
OF
THE CONGO
UGANDA
UNITED REPUBLIC OF TANZANIA
RWANDA0 35 70
Kilometres
National boundary
Cropland
Mosaic vegetationForest
Grassland
Shrubland
Wetland
Barren land
Water
Legend
Lake Edward
Lake Albert
Table 2.4: Area and percentage of DRC land cover types in the Nile basin.Figure 2.3: DRC land cover types within the Nile basin from GLOBCOVER 2009.
Wen
dkun
i / F
lickr
/ CC
BY-
NC-
SA 2
.0
Land cover types by country calculated from GLOBCOVER 2009
Land cover typeArea (km2)
%
Cropland 1 285 6.1
Mosaic vegetati on 8 296 39.5
Forest 6 442 30.7
Grassland 183 0.8
Shrubland 558 2.7
Wetland 393 1.9
Urban/Arti fi cial ---- ----
Barren land 17 0.1
Water 3 825 18.2
Total 21 000 100

25
Egypt
The Nile basin winds through the east coast of Egypt forming a narrow corridor that extends from Lake Nasser in the southeast corner, all the way to the Mediterranean Sea in the northeast corner. Most of the area surrounding the Nile basin in Egypt is barren land (83.3 per cent) followed by cropland (12 per cent), and water (3.1 per cent). The remaining land cover types cover less than 1 per cent of the land (fi gure 2.4 and table 2.5).
Land Cover TypeArea(km2)
%
Cropland 33 379 12.0
Mosaic vegetati on 2 011 0.7
Forest ---- ----
Grassland ---- ----
Shrubland 600 0.2
Wetland 228 0.1
Urban/Arti fi cial 1 796 0.6
Barren land 232 250 83.3
Water 8 565 3.1
Total 278 830 100
N
0 80 160Kilometres
National boundary
Cropland
Mosaic vegetationShrublandWetland
Urban/Artificial
Barren land
Water
Legend
R e d
S e a
M e d i t e r r a n e a n S e a
EGYPT
AdministrativeBoundary
Table 2.5: Area and percentage of Egypt land cover types in the Nile basin.Figure 2.4: Eqypt land cover types in the Nile basin from GLOBCOVER 2009.
Mal
colm
/ Fl
ickr
/ CC
BY-
NC
2.0
Morning on the Nile.
dore
na-w
m /
Fote
r.com
/ CC
BY-
ND
25

26
Ethiopia
Major land cover types in the Ethiopian part of the Nile basin include forest (31.4 per cent), cropland (30.6 per cent), shrubland (20.6 per cent), and mosaic vegetation (14.6 per cent). The remaining land cover types (grasslands, wetlands, barren land and water) make up less than 2 per cent of the land. These are shown in fi gure 2.6 and table 2.7.
Land Cover TypeArea(km2)
%
Cropland 111 930 30.6
Mosaic vegetati on 53 479 14.6
Forest 114 739 31.4
Grassland 1 784 0.5
Shrubland 75 242 20.6
Wetland 49 0.01
Urban/Arti fi cial ---- ----
Barren land 4 792 1.3
Water 3 414 0.9
Total 365 428 100
N
0 80 120Kilometres
National boundary
Cropland
Mosaic vegetationForest
Grassland
Shrubland
WetlandBarren land
Water
Legend
SUDAN
SOUTH SUDAN
ETHIOPIA
ERITREA
Lake Tana
Table 2.7: Area and percentage of Ethiopia land cover types in the Nile basin.Figure 2.6: Ethiopia land cover types in the Nile basin from GLOBCOVER 2009.
Tree
s fo
r the
Fut
ure
/ Flic
kr /
CC B
Y 2.
0
Eritrea
The dominant land cover type in the Nile basin portion of Eritrea is forest at 37.2 per cent. Barren land covers about a quarter of the land (25.8 per cent) followed by mosaic vegetation (22.6 per cent) and cropland (11.5 per cent) as highlighted in table 2.6 and fi gure 2.5. Other land cover types include grassland, shrubland and urban or artifi cial.
Land cover typeArea
( km2)%
Cropland 2 846 11.5
Mosaic vegetati on 5 591 22.6
Forest 9 215 37.2
Grassland 575 2.3
Shrubland 104 0.4
Wetland ---- ----
Urban/Arti fi cial 35 0.1
Barren land 6 388 25.8
Water ---- ----
Total 24 755 100
N
0 25 50Kilometres
National boundary
Cropland
Mosaic vegetationForest
Grassland
Shrubland
Urban/Artificial
Barren land
Legend
SUDAN
ETHIOPIA
ERITREA
Table 2.6: Area and percentage of Eritrea land cover types in the Nile basin.Figure 2.5: Eritrea land cover types in the Nile basin from GLOBCOVER 2009.
Dav
id S
tanl
ey /
Flic
kr /
CC B
Y 2.
0

27
Kenya
Land cover in the Nile basin part of Kenya is generally dominated by cropland in the north (40.6 per cent) and mosaic vegetation in the south (33 per cent). Other major land cover types are forest (10.9 per cent), grassland (4.3 per cent), and shrubland (3.2 per cent). Table 2.8 shows that water accounts for 7.9 per cent of the land. A small section in the northeastern part of Lake Victoria lies in Kenya as shown in fi gure 2.7 representing about 22 per cent of the total catchment area of Lake Victoria basin (Kayombo and Jorgensen 2006).
N
UGANDA
KENYA
UNITED REPUBLICOF TANZANIA
0 30 60Kilometres
National boundary
Cropland
Mosaic vegetationForest
Grassland
Shrubland
Urban/Artificial
Barren land
Water
Legend
Table 2.8: Area and percentage of Kenya land cover types in the Nile basin.Figure 2.7: Kenya land cover types in the Nile basin from GLOBCOVER 2009.
Petr
Kos
ina/
CIM
MYT
/ CC
BY-
NC-
SA 2
.0
Rwanda
The top four land cover types in the Rwandan Nile basin are mosaic vegetation (62.5 per cent), forest (20.8 per cent), shrubland (8 per cent), and cropland (4 per cent) (table 2.9). Forest is generally concentrated in the western portion of the basin while mosaic vegetation is found all over (fi gure 2.8). Other land cover types include water (2.2 per cent), grassland (2.1 per cent), and urban/artifi cial (0.3 per cent).
NDEMOCRATIC
REPUBLIC
OF
THE CONGO
UGANDA
UNITED REPUBLICOF TANZANIA
RWANDA
BURUNDI 0 16 32Kilometres
National boundary
Cropland
Mosaic vegetationForest
Grassland
Shrubland
Wetland
Urban/ArtificialWater
Legend
Table 2.9: Area and percentage of Rwanda land cover types in the Nile basin.Figure 2.8: Rwanda land cover types in the Nile basin from GLOBCOVER 2009.
Joac
him
Hub
er /
Flic
kr /
CC B
Y-SA
2.0
Land Cover TypeArea(km2)
%
Cropland 20 253 40.6
Mosaic vegetati on 16 480 33.0
Forest 5 449 10.9
Grassland 2 163 4.3
Shrubland 1 598 3.2
Wetland ---- ----
Urban/Arti fi cial 48 0.1
Barren land 12 0.02
Water 3 916 7.9
Total 49 921 100
Land Cover TypeArea(km2)
%
Cropland 839 4.0
Mosaic vegetati on 13 185 62.5
Forest 4 397 20.8
Grassland 451 2.1
Shrubland 1 680 8.0
Wetland 2 0.01
Urban/Arti fi cial 70 0.3
Barren land ---- ----
Water 472 2.2
Total 21 098 100

28
South Sudan
The main land cover types of South Sudan in the Nile basin are forest (42.5 per cent), shrubland (33.7 per cent) and cropland (11.8 per cent). Mosaic vegetation covers 2.9 per cent of the land while grassland covers 1.5 per cent as shown in fi gure 2.9 and table 2.10. Wetlands account for 7.2 per cent of the land which is part of the Sudd swamp, one of the largest swamps. Its area varies between 8 000 km2 in the dry season to as much as 40 000 km2 in the wet season (Lamberts 2009, Ahmad 2008).
Land Cover TypeArea (km2)
%
Cropland 72 957 11.8
Mosaic vegetati on 17 746 2.9
Forest 264 011 42.5
Grassland 8 982 1.5
Shrubland 208 936 33.7
Wetland 44 618 7.2
Urban/Arti fi cial 91 0.01
Barren land 1 952 0.3
Water 1 331 0.2
Total 620 624 100
N
0 85 170Kilometres
National boundary
Cropland
Mosaic vegetationForest
Grassland
ShrublandWetland
Urban/Artificial
Barren land
Water
Legend
SUDAN
SOUTH SUDAN
ETHIOPIA
DEMOCRATIC REPUBLIC
OF THE CONGOUGANDA
KENYA
CENTRALAFRICANREPUBLIC
AdministrativeBoundary
Table 2.10: Area and percentage of South Sudan land cover types in the Nile basin.
Figure 2.9: South Sudan land cover types in the Nile basin from GLOBCOVER 2009.
Ars
enie
Cos
eac
/ Flic
kr /
CC B
Y-N
D 2
.0
Children gathering water in South Sudan.
Uni
ted
Nat
ions
Pho
to /
Fote
r.com
/ CC
BY-
NC-
ND
28

29
Sudan
Much of Sudan is arid and there is high scarcity of water that limits development of the country, therefore water resources are considered a high priority for the nation (NBI 2010). More than half, 55.3 per cent, of the land is classifi ed as barren. Forest (14.9 per cent), grassland (12.8 per cent), mosaic vegetation (8.3 per cent) and cropland (6 per cent) mostly make up the other half (fi gure 2.10 and table 2.11). Shrubland accounts for a marginal amount of land - just 2.4 per cent. Although only 0.2 per cent of the land is classifi ed as water, Sudan is where the White and Blue Nile’s meet before fl owing into the main Nile.
Land Cover TypeArea(km2)
%
Cropland 96 183 6.0
Mosaic vegetati on 116 293 8.3
Forest 268 458 14.9
Grassland 174 857 12.8
Shrubland 63 026 2.4
Wetland 836 0.1
Urban/Arti fi cial 2 307 0.2
Barren land 757 664 55.3
Water 3 101 0.2
Total 1 482 725 100
NAdministrative
Boundary
0 110 220Kilometres
National boundary
Cropland
Mosaic vegetationForest
Grassland
ShrublandWetland
Urban/Artificial
Barren land
Water
LegendEGYPT
SUDAN
SOUTH SUDAN
ETHIOPIA
ERITREA
Table 2.11: Area and percentage of Sudan land cover types in the Nile basin.Figure 2.10: Sudan land cover types in the Nile basin from GLOBCOVER 2009.
Scot
t D. H
addo
w /
Flic
kr /
CC B
Y-N
C-SA
2.0
United Republic of Tanzania
About half of Lake Victoria lies inside the United Republic of Tanzania which explains why 29.2 per cent of this part of the basin is classifi ed as water. Most of the actual land is classifi ed mosaic vegetation (35.6 per cent) and forest (13.5 per cent) (see fi gure 2.11 and table 2.12). Other land cover types include grassland (11.4 per cent), shrubland (7.8 per cent) and wetlands (1.2 per cent).
Land Cover TypeArea(km2)
%
Cropland 1 461 1.2
Mosaic vegetati on 43 000 35.6
Forest 16 239 13.5
Grassland 13 808 11.4
Shrubland 9 394 7.8
Wetland 1 471 1.2
Urban/Arti fi cial 65 0.1
Barren land 16 0.01
Water 35 235 29.2
Total 120 690 100
N
Lake Victoria
KENYA
UNITED REPUBLIC OF TANZANIA
RWANDA
UGANDA
0 50 100Kilometres
National boundary
Cropland
Mosaic vegetationForest
Grassland
Shrubland
Barren land
Wetland
Urban/ArtificialWater
Legend
Table 2.12: Area and percentage of the United Republic of Tanzania land cover types in the Nile basin.
Figure 2.11: United Republic of Tanzania land cover types in the Nile basin from GLOBCOVER 2009.
Rona
ld W
oan
/ Flic
kr /
CC B
Y-N
C 2.
0

30
Uganda
A large part of the area of Uganda is occupied by lakes including a portion of Lake Victoria. Water, therefore, accounts for 15.6 per cent of the land in this part of the Nile basin. Due to fertile soil and regular rainfall, agriculture is the largest source of industry in Uganda (NBI 2012) with cropland covering 18.4 per cent of the land. Figure 2.12 and table 2.13 show that the remaining land cover types include: mosaic vegetation (32.4 per cent), forest (21.5 per cent), and shrubland (10.1 per cent).
NSOUTH SUDAN
DEMOCRATIC
REPUBLIC
OF
THE CONGO
UGANDA
KENYA
RWANDA
0 55 110Kilometres
National boundary
Cropland
Mosaic vegetationForest
Grassland
ShrublandWetland
Urban/Artificial
Barren land
Water
Legend
Lake Victoria
Lake Edward
Lake Albert
Lake Kyoga
UNITED REPUBLIC
OF TANZANIA
Table 2.13: Area and percentage of Uganda land cover types in the Nile basin.
Figure 2.12: Uganda land cover types in the Nile basin from GLOBCOVER 2009.
gigi
4791
/ Fl
ickr
/ CC
BY-
NC-
SA 2
.0
Gat
es F
ound
atio
n / F
oter
.com
/ CC
BY-
NC-
ND
30
A rice farmer in Uganda.
Land Cover TypeArea(km2)
%
Cropland 43 733 18.4
Mosaic vegetati on 77 135 32.4
Forest 51 156 21.5
Grassland 1 291 0.5
Shrubland 24 099 10.1
Wetland 1 986 0.8
Urban/Arti fi cial 217 0.1
Barren land 1 482 0.6
Water 37 262 15.6
Total 238 361 100

31
Vegetation dynamics and land cover change in the Nile basin using MODISChanges in Nile basin land cover type from 2001 to 2009
To identify changes in natural vegetation and human land use activities in the Nile basin from 2001 to 2009, an analysis of imagery collected by Aqua and Terra satellites using the MODIS sensor was conducted. The MODIS sensor captures the view of the entire Earth’s surface every 1-2 days. The data helps to improve the knowledge about our planet and the changes taking place. The data can also be used in developing models to predict global change that will help governments to make sound decisions in protecting the environment (NASA undated). The MODIS global land cover map represents yearly land cover properties (2001 and 2009) with a spatial resolution of 500 m and an overall global accuracy of 75 per cent (Friedl and others 2010).
Table 2.14: IGBP land cover classes with their structural characteristics.
Class Class name Descripti on
1Evergreen needleleaf forests
Lands dominated by trees with a per cent canopy cover >60% and height exceeding 2 metres. Almost all trees remain green all year. Canopy is never without green foliage.
2Evergreen broadleaf forests
Lands dominated by trees with a per cent canopy cover >60% and height exceeding 2 metres. Almost all trees remain green all year. Canopy is never without green foliage.
3Deciduous needleleaf forests
Lands dominated by trees with a per cent canopy cover >60% and height exceeding 2 metres. Consists of seasonal needleleaf tree communiti es with an annual cycle of leaf-on and leaf-off periods.
4Deciduous broadleaf forests
Lands dominated by trees with a per cent canopy cover >60% and height exceeding 2 metres. Consists of seasonal broadleaf tree communiti es with an annual cycle of leaf-on and leaf-off periods.
5 Mixed forests Lands dominated by trees with a per cent canopy cover >60% and height.
6 Closed shrublands Lands with woody vegetati on less than 2 metres tall and with shrub canopy cover is >60%.
7 Open shrublandsLands with woody vegetati on less than 2 metres tall and with shrub canopy cover is between 10-60%. The shrub foliage can be either evergreen or deciduous.
8 Woody savannasLands with herbaceous and other understorey systems, and with forest canopy cover between 30-60%.The forest cover height exceeds 2 metres.
9 Savannas
Lands with herbaceous and other understorey systems, and with forest canopy cover between 10-30%.The forest cover height exceeding 2 metres. Consists of tree communiti es with interspersed mixtures or mosaics of the other four forest cover types. None of the forest types exceeds 60% of landscape exceeds 2 metres.
10 Grasslands Lands with herbaceous types of cover. Tree and shrub cover is less than 10%.
11 Permanent wetlandsLands with a permanent mixture of water and herbaceous or woody vegetati on that cover extensive areas. The vegetati on can be present in either salt, brackish, or fresh water.
12 CroplandLands covered with temporary crops followed by harvest and a bare soil period (e.g., single and multi ple cropping systems). Note that perennial woody crops will be classifi ed as the appropriate forest or shrubland cover type.
13 Urban and Built-upLand covered by buildings and other man-made structures. Note that this class will not be mapped from the AVHRR imagery but will be developed from the populated places layer that is part of the Digital Chart of the World.
14Cropland/natural vegetati on mosaics
Lands with a mosaic of croplands, forest, shrublands, and grasslands in which no one component comprises more than 60% of the landscape.
15 Snow and ice Lands under snow and/or ice cover throughout the year.
16 BarrenLands exposed soil, sand, rocks, or snow and never has more than 10% vegetated cover during any ti me of the year.
17 Water bodies Oceans, seas, lakes, reservoirs, and rivers. Can be either fresh or salt water bodies
Ethiopia Bahir Dar Blue Nile Gorge.
opal
pete
rliu
/ Fot
er.c
om /
CC B
Y-N
C-N
D
Source: Thomlinson and others 1999
For the purposes of this report, classes 1 through 5 were combined to create the ‘Forest’ class; classes 6 and 7 were combined to create ‘Shrubland’; and classes 13 and 16 were combined to create ‘Built-up or Barren lands’. Class 15 was not relevant to this region.

32
N
EGYPTLIBYA
SUDAN
SOUTH SUDAN
ETHIOPIA
CHAD
DEMOCRATIC
REPUBLIC
OF
THE CONGO
UGANDA
KENYA
ERITREA
CENTRALAFRICAN REPUBLIC
RWANDA
BURUNDI
SOMALIA
UNITED REPUBLIC
OF TANZANIA
Water
Forest
Shrubland
Woody Savannas
Savannas
Grasslands
Wetlands
CropsCropland and Natural Vegetation MosaicBuilt-up or barren lands
0 240 480Kilometres
National boundary
Legend
AdministrativeBoundary
AdministrativeBoundary
DJIBOUTI
Figure 2.13: Distribution of land cover types in the Nile basin using MODIS in 2009.

33
Figure 2.13 identifi es the land cover types for the year 2009 in the Nile basin; while fi gure 2.14 shows the change in land cover types between 2001 and 2009. The most signifi cant changes that occurred between 2001 and 2009 were an increase in grasslands and a decrease in built-up or barren lands. Grasslands increased from 11.7 per cent cover in 2001 to 14.3 per cent in 2009. Built-up or barren lands decreased from 34 per cent in 2001 to 31.8 per cent cover by 2009. Cropland and natural vegetation mosaic decreased overall by 1.2 per cent from 4.6 per cent in 2001 to 3.4 per cent in 2009. The remaining land cover types changed by less than 1 per cent. The marginal increase in cropland may explain part of the decrease in built-up or barren lands.
Decadal changes in seasonal vegetation dynamics
Satellite images are very useful in mapping and monitoring changes in land use over time, in terms of both seasonal and longer-term changes (Huete and others 2002). The Normalized Diff erence Vegetation Index (NDVI), a satellite-based time-series vegetation index, is the most widely used indicator of vegetation health. It captures the contrast between red and near-infrared refl ections off vegetated surfaces and can be used to identify areas with vegetation and its condition (Zhou and others 2001). Consequently, it can be used to identify hotspot areas of vegetation change and could indicate how the vegetation responds to diff erent impacts, including a changing climate.
In northern Egypt, the browning in the central part of the Nile Delta area signifi es loss; while there is greening (gains in vegetation) on the peripheries. The Ethiopian highlands reveal contiguous browning throughout the plateau, except for regions of greening in the south-western lowlands that extend into South Sudan. The Equatorial Lakes region around Lake Victoria also shows a declining trend in vegetation during the study period. There are additional patches of green in the Equatorial Lakes region, South Sudan, throughout Sudan and up following the corridors of the Nile and into northern Sudan and Egypt.
Flying over the Nile delta.
Chris
toph
er R
ose
/ Flic
kr /
CC B
Y-N
C 2.
0
0% 10% 20% 30% 40% 50% 60% 70% 80% 90% 100%
2001
2009
2001
2009
2001
2009
2001
2009
2001
2009
2001
2009
2001
2009
2001
2009
Shrubland
Forest
Wetlands
Cropland + NaturalVegetation Mosaic
Savannas
Grasslands
Crops
Built-up orBarren Lands
Figure 2.14: Change in land cover types of the Nile basin.
Note: The ‘Savannas’ classifi cation includes the ‘Woody Savannas’ classifi cation as well.

34
Land cover changes by countryBurundi
Lying at the extreme southwestern end of the Nile basin, Burundi makes up only about 0.4 per cent of the Nile basin even though almost half of the country (47.6 per cent) lies within the basin (FAO 1997). The Burundi Lake Victoria basin drains into Lake Victoria via the River Kagera and provides around 7 per cent of the catchment area of Lake Victoria (Kayombo and Jorgensen 2006).
There is a paucity of data on land-use change in Burundi indeed the literature indicates 1976 was the last time a national forest inventory was carried out (Nduwamungu 2011). Forest cover during colonial times was estimated at 40 per cent of the country, but this declined due to human pressures mainly for woodfuel and agriculture. During the 1990s, it was thought that the country suff ered deforestation at a rate of 9 per cent, the world’s highest (Athman and others 2006). In 2010, USAID reported estimates of total forest cover that ranged between 4.6 to 7.4 per cent of the country (Beck and others 2010). Some sources such as FRA (2010) estimate loss of forest cover between 1990 and 2010 at 40.5 per cent. Considering that approximately 90 per cent of Burundians rely on subsistence agriculture and the country has the second highest population density in Africa, it is logical to expect a substantial loss of land to cropland (Athman and others 2006).
NDVI-based satellite imagery has helped to reveal land-use cover and change in the Nile basin section of Burundi. As shown in fi gure 2.15, the land cover types in this basin in 2009 are dominated by woody savanna (28.4 per cent) and cropland/vegetation (23 per cent). Savannas cover 11 per cent, built-up or barren lands 11, crops 10, wetlands 8, grasslands 7 and forest
and shrublands 1 per cent each. Figure 2.16 shows that between 2001 and 2009 the area under woody savanna increased, while there was a large decrease in the cropland and natural vegetation mosaic and land under forests. There was a 2.6 per cent decrease in shrublands and an 11.7 per cent decrease in built-up or barren lands. The data also reveals a 5.5 per cent decrease in forest cover on both the western and eastern sides of the basin area with only 0.8 per cent forest cover remaining in 2009. The land has been replaced with woody savanna or cropland and natural vegetation.
However, this data needs to be verifi ed on the ground to confi rm exactly which areas are simply in an inter-growing period, possibly due to the recent increase in agro-forestry over the past decade and which areas have been converted to agriculture.
0% 10% 20% 30% 40% 50% 60% 70% 80% 90% 100%
2001
2009
2001
2009
2001
2009
2001
2009
2001
2009
2001
2009
2001
2009
2001
2009
2001
2009
Shrublands
Cropland + NaturalVegetation Mosaic
Forest
Savannas
Wetlands
Woody Savannas
Grasslands
Crops
Built-up orBarren Lands
Figure 2.16: Relative extent of land cover types in the Nile basin in Burundi.
UNITED REPUBLICOF TANZANIA
RWANDA
BURUNDI
UNITED REPUBLICOF TANZANIA
RWANDA
BURUNDI
MODIS LANDCOVER 2001 MODIS LANDCOVER 2009
Water
Forest
Shrubland
Woody Savannas
Savannas
Grasslands
Wetlands
CropsCropland and Natural Vegetation Mosaic
Built-up orBarren Lands
0 15 30Kilometres
National boundary
Legend N
Figure 2.15: Land cover from MODIS (2001, 2009) in the Nile basin segment of Burundi.

35
Democratic Republic of the Congo (DRC)
Only 0.9 per cent of the total area of the DRC is in the Nile basin (NBI 2012). This strip of land includes Lakes Albert and Edward which are shared with Uganda. The land cover types as revealed by MODIS imaging in 2009 are dominated by forest (38.1 per cent) and cropland/vegetation (22.8 per cent) as shown in fi gure 2.17. Forest cover decreased by 1.4 per cent between 2001 and 2009; and cropland/vegetation increased by 0.3 per cent. There was a 2 per cent increase in woody savannas from 8.3 to 10.3 per cent between 2001 and 2009 respectively. There was no change in built-up or barren lands (7 per cent), crops (4.4 per cent), and savannas (4 per cent). The remaining land cover types declined minimally: grasslands by 0.3 per cent, shrublands by 0.4 per cent and wetlands by 0.1 per cent.These are highlighted in fi gure 2.18.
Cropland + NaturalVegetation Mosaic
Wetlands
Savannas
Forest
0% 10% 20% 30% 40% 50% 60% 70% 80% 90% 100%
2001
2009
2001
2009
2001
2009
2001
2009
2001
2009
2001
2009
2001
2009
2001
2009
2001
2009
Shrublands
Woody Savannas
Grasslands
Crops
Built-up orBarren Lands
Figure 2.18: Relative extent of land cover types in the Nile basin in DRC.
Figure 2.17: Land cover from MODIS (2001, 2009) of the Nile basin segment of DRC.
MODIS LANDCOVER 2001 MODIS LANDCOVER 2009
Water
Forest
Shrubland
Woody Savannas
Savannas
Grasslands
Wetlands
CropsCropland and Natural Vegetation Mosaic
Built-up orBarren Lands
0 40 80Kilometres
National boundary
Legend N
RWANDA
UGANDA
UNITED REPUBLICOF TANZANIA
DEMOCRATIC REPUBLICOF
THE CONGO
Lake Edward
Lake Albert
RWANDA
UGANDA
UNITED REPUBLICOF TANZANIA
DEMOCRATIC REPUBLICOF
THE CONGO
Lake Edward
Lake Albert
Sunset over Lake Edward.
Dun
can
Wrig
ht /
Wik
i Com
mon
s / C
C-BY
-SA
-3.0
-MIG
RATE
D

36
Egypt
The Egyptian part of the Nile basin forms a narrow corridor that contains the River Nile all the way up to the Mediterranean Sea, ending in the Nile Delta. Its areal extent is about 10.5 per cent of the total area of the Nile basin (FAO 1997). The land cover types as shown in fi gure 2.19, in both 2001 and 2009, were predominantly the built-up or barren lands class and crops. Between 2001 and 2009, the amount of built-up or barren land increased by 0.3 per cent . The cropland and natural vegetation mosaic decreased by 0.2 per cent, while the amount of land covered by shrubland decreased from 1.7 to 1.1 per cent over the same period. Forest, woody savannas, savannas, and grasslands cover only a marginal amount of land — less than 1 per cent — but each experienced a slight decrease of 0.2 per cent or less. Wetlands remained unchanged, continuing to cover 1.1 per cent of land (fi gure 2.20).
Both sides of the delta exhibited an increased amount of vegetation in the form of cropland (about 1 per cent) in 2009 compared to 2001. These higher NDVI values are most likely
attributable to increased crop cultivation and irrigation. However, some areas on the fringes of the delta and in the southwestern part of the basin show a browning trend.
Cropland + NaturalVegetation Mosaic
Wetlands
Savannas
Forest
0% 10% 20% 30% 40% 50% 60% 70% 80% 90% 100%
2001
2009
2001
2009
2001
2009
2001
2009
2001
2009
2001
2009
2001
2009
2001
2009
2001
2009
Shrublands
Woody Savannas
Grasslands
Crops
Built-up orBarren Lands
Figure 2.20: Relative extent of land cover types in the Nile basin in Egypt.
MODIS LANDCOVER 2001 MODIS LANDCOVER 2009
Water
Forest
Shrubland
Woody Savannas
Savannas
Grasslands
Wetlands
CropsCropland and Natural Vegetation Mosaic
Built-up orBarren Lands
0 75 150Kilometres
National boundary
Legend NEGYPT
AdministrativeBoundary
SUDAN SUDAN
EGYPT
Figure 2.19: Land cover from MODIS (2001, 2009) in the Nile basin segment of Egypt.
A farmer working in his fi eld, Egypt.
Chris
toph
er R
ose
/ Flic
kr /
CC B
Y-N
C 2.
0

37
Eritrea
The Eritrean section of the Nile basin only makes up about 0.8 per cent of the entire Nile basin (NBI 2012). This area, about 24 921 km2, is dominated by grasslands representing 35.5 per cent of the area almost double the 2001 fi gure of 15.4 per cent. The amount of shrublands also increased from 31.6 to 36.7 per cent between 2001 and 2009 respectively. The remaining land cover types declined over the study period. These include savannas (-4.2 per cent), woody savannas (-4.3 per cent), crops (-2.2 per cent), cropland/natural vegetation (-7.5 per cent), built-up or barren lands (-5.1 per cent) and wetlands (-1.8 per cent). Forest cover was not detected by the MODIS imagery in either 2001 or 2009. As fi gure 2.21 shows most of this loss occurred in the western part and while the cause for this has not been ascertained, it may be due to consecutive droughts in past years. Figure 2.22 highlights the changes in the diff erent land cover types.
Cropland + NaturalVegetation Mosaic
Wetlands
Savannas
Forest
0% 10% 20% 30% 40% 50% 60% 70% 80% 90% 100%
2001
2009
2001
2009
2001
2009
2001
2009
2001
2009
2001
2009
2001
2009
2001
2009
2001
2009
Shrublands
Woody Savannas
Grasslands
Crops
Built-up orBarren Lands
Figure 2.22: Relative extent of land cover types in the Nile basin in Eritrea.
MODIS LANDCOVER 2001 MODIS LANDCOVER 2009
Water
Forest
Shrubland
Woody Savannas
Savannas
Grasslands
Wetlands
CropsCropland and Natural Vegetation Mosaic
Built-up orBarren Lands
0 25 50Kilometres
National boundary
Legend NETHIOPIA
ERITREA
ETHIOPIA
ERITREA
Figure 2.21: Land cover from MODIS (2001, 2009) in the Nile basin segment of Eritrea.
Spectacular landscape between Keren and Agordat, in Gash Barka Province of western Eritrea.
Char
les
Roff e
y / F
lickr
/ CC
BY-
NC-
SA 2
.0

38
Ethiopia
Between 2001 and 2009, land cover types remained fairly stable in Ethiopia as illustrated in fi gures 2.23 and 2.24. Woody savannas declined by 2.2 per cent to 39.7 per cent between 2001 and 2009 and savannas increased by 1.6 per cent to 25.8 per cent over the same time frame. Forest cover in the southeastern part of the basin decreased slightly from 6.1 per cent in 2001 to 5.5 per cent in 2009. Between 2001 and 2009 there was a 1.8 per cent increase in crops to 7.1 per cent; and a 1.7 per cent decrease in croplands and natural vegetation to 1.6 per cent over the same period in the western and northwestern part of the basin. Grasslands and wetlands covered about 6 per cent in 2009, up 1 per cent each from 2001. Shrublands remained almost constant (4.9 per cent in 2001 and 5.4 per cent in 2009). But it is evident from fi gure 2.23 that distribution of this land cover type changed and becoming denser in the northeastern part of the region and less dense in other areas. The amount of built-up or barren land decreased from 3.9 per cent in 2001 to 2.2 per cent in 2009, appearing to have been partially replaced by cropland.
MODIS LANDCOVER 2001 MODIS LANDCOVER 2009
Water
Forest
Shrubland
Woody Savannas
Savannas
Grasslands
Wetlands
CropsCropland and Natural Vegetation Mosaic
Built-up orBarren Lands
0 72 144Kilometres
National boundary
Legend N
SUDAN
SOUTH SUDAN
ETHIOPIA
ERITREA
Lake Tana
SUDAN
SOUTH SUDAN
ETHIOPIA
ERITREA
Lake Tana
Cropland + NaturalVegetation Mosaic
Wetlands
Savannas
Forest
0% 10% 20% 30% 40% 50% 60% 70% 80% 90% 100%
2001
2009
2001
2009
2001
2009
2001
2009
2001
2009
2001
2009
2001
2009
2001
2009
2001
2009
Shrublands
Woody Savannas
Grasslands
Crops
Built-up orBarren Lands
Figure 2.24: Relative extent of land cover types in the Nile basin in Ethiopia.
Figure 2.23: Land cover from MODIS (2001, 2009) in Nile basin segment of Ethiopia.
Near Bahir Dar, Ethiopia.
opal
pete
rliu
/ Flic
kr /
CC B
Y-N
C-N
D 2
.0

39
Kenya
Cropland and natural vegetation dominate the land cover in this area and remained stable at 29.1 per cent between 2001 to 2009 (fi gures 2.25 and 2.26). Savannas and woody savannas also covered a considerable part of the terrain at 18.6 per cent and 13.8 per cent, respectively, in 2009. These percentages refl ect an increase from 2001 of 4.6 per cent for savannas and 2.8 per cent for woody savannas. The remaining land cover types decreased from 2001 to 2009: shrublands (-0.5 per cent), forest (-1.9 per cent), grasslands (-2.5 per cent), wetlands (-0.9 per cent), crops (-0.6 per cent) and built-up or barren lands (-0.9 per cent). Despite a decline in forest cover, forests in protected areas, for instance the Kakamega-Nandi, the Tinderet Reserve, Southwestern Mau and Eastern Mau Reserves, appear to have been kept mostly intact.
Cropland + NaturalVegetation Mosaic
Wetlands
Savannas
Forest
0% 10% 20% 30% 40% 50% 60% 70% 80% 90% 100%
2001
2009
2001
2009
2001
2009
2001
2009
2001
2009
2001
2009
2001
2009
2001
2009
2001
2009
Shrublands
Woody Savannas
Grasslands
Crops
Built-up orBarren Lands
Figure 2.26: Relative extent of land cover types in the Nile basin in Kenya.
Figure 2.25: Land cover from MODIS (2001, 2009) in the Nile basin segment of Kenya.
See Schaab and others (2010) for higher resolution satellite mapping of the forest reserves and land cover in the area.
MODIS LANDCOVER 2001 MODIS LANDCOVER 2009
Water
Forest
Shrubland
Woody Savannas
Savannas
Grasslands
Wetlands
CropsCropland and Natural Vegetation Mosaic
Built-up orBarren Lands
0 30 60Kilometres
National boundary
Legend N
UGANDA
KENYA
UNITED REPUBLICOF TANZANIA
Lake Victoria
UGANDA
KENYA
UNITED REPUBLICOF TANZANIA
Lake Victoria
Rusinga Island, Lake Victoria, Kenya.
Ryan
Har
vey
/ Flic
kr /
CC B
Y-SA
2.0

40
Rwanda
As shown in fi gure 2.28, between 2001 and 2009, there was a 14.6 per cent decline in forest cover in the part of Rwanda that occupies the Nile basin. The Rwandan forest department notes that between 1960 and 2007, Rwanda lost about 64 per cent of its forests (REMA 2009). However, agroforestry has been introduced to the country as part of eff orts to off set the growing demand for fuelwood (Ndayambaye and Mohren 2011). As a result, forest cover can appear to fl uctuate, refl ecting instances of fi rewood harvest. Over the study period, cropland and natural vegetation experienced a 5 per cent decline, but crops increased by 8.3 per cent from 10.2 in 2001 to 18.5 per cent in 2009, so some of the loss in vegetation was ultimately off set (fi gure 2.27). Shrublands also declined: from 3.4 per cent in 2001 to 1.8 per cent in 2009. There were increases in some of the other land classes: built-up or barren lands (4.5 per cent), woody savannas (4.8 per cent), savannas (3.5 per cent) and wetlands (1.2 per cent). Grasslands marginally decreased from 5.4 per cent in 2001 to 5.3 per cent by 2009.
Cropland + NaturalVegetation Mosaic
Wetlands
Savannas
Forest
0% 10% 20% 30% 40% 50% 60% 70% 80% 90% 100%
2001
2009
2001
2009
2001
2009
2001
2009
2001
2009
2001
2009
2001
2009
2001
2009
2001
2009
Shrublands
Woody Savannas
Grasslands
Crops
Built-up orBarren Lands
Figure 2.28: Relative extent of land cover types in the Nile basin in Rwanda.
Figure 2.27: Land cover from MODIS (2001, 2009) in Nile basin segment of Rwanda.
MODIS LANDCOVER 2001 MODIS LANDCOVER 2009
Water
Forest
Shrubland
Woody Savannas
Savannas
Grasslands
Wetlands
CropsCropland and Natural Vegetation Mosaic
Built-up orBarren Lands
0 15 30Kilometres
National boundary
Legend N
DEMOCRATIC
REPUBLIC
OF
THE CONGO
UGANDA
UNITED REPUBLICOF TANZANIA
RWANDA
BURUNDI
DEMOCRATIC
REPUBLIC
OF
THE CONGO
UGANDA UNITED REPUBLICOF TANZANIA
RWANDA
BURUNDI
UNITED REPUBLICOF TANZANIA
Farmers throwing fertilizer onto their rice on a misty morning near Rugina, Rwanda.
Tigg
y Ri
dley
/ D
FID
- U
K D
epar
tmen
t for
Inte
rnat
iona
l Dev
elop
men
t / F
lickr
/ CC
BY-
NC-
ND
2.0

41
South Sudan
Most of the land in the basin area of South Sudan is covered with woody savannas and savannas, albeit with some changes from year to year (fi gure 2.30). Savannas covered about 46 per cent of the land in both 2001 and 2009, but woody savannas declined by 1.6 per cent over the same period (fi gure 2.29). Grasslands increased to 4.7 per cent from 2.5 per cent in 2001. Forests, crops, cropland and natural vegetation, and built-up or barren lands each covered 1 per cent or less of the land. Each of these land classes decreased by 0.7 per cent or less between 2001 and 2009. Shrublands and wetlands each experienced a small increase (0.2 and 0.5 per cent, respectively) over the same timeframe. Overall, however, the major land cover types remained largely unchanged.
Cropland + NaturalVegetation Mosaic
Wetlands
Savannas
Forest
0% 10% 20% 30% 40% 50% 60% 70% 80% 90% 100%
2001
2009
2001
2009
2001
2009
2001
2009
2001
2009
2001
2009
2001
2009
2001
2009
2001
2009
Shrublands
Woody Savannas
Grasslands
Crops
Built-up orBarren Lands
Figure 2.30: Relative extents of land cover types in the Nile basin in South Sudan.
Figure 2.29: Land cover from MODIS (2001, 2009) in the Nile basin segment of South Sudan.
MODIS LANDCOVER 2001 MODIS LANDCOVER 2009
Water
Forest
ShrublandWoody SavannasSavannas
Grasslands
Wetlands
CropsCropland and Natural Vegetation Mosaic
Built-up orBarren Lands
0 90 180Kilometres
National boundary
Legend N
SUDAN
SOUTH SUDAN
ETHIOPIA
DEMOCRATIC
REPUBLIC
OF
THE CONGOUGANDA
KENYA
CENTRALAFRICANREPUBLIC
SUDAN
SOUTH SUDAN
ETHIOPIA
DEMOCRATIC
REPUBLIC
OF
THE CONGO UGANDA
CENTRALAFRICANREPUBLIC
A man walking down the main road between Juba and Bor, South Sudan.
BBC
Wor
ld S
ervi
ce /
Flic
kr /
CC B
Y-N
C 2.
0
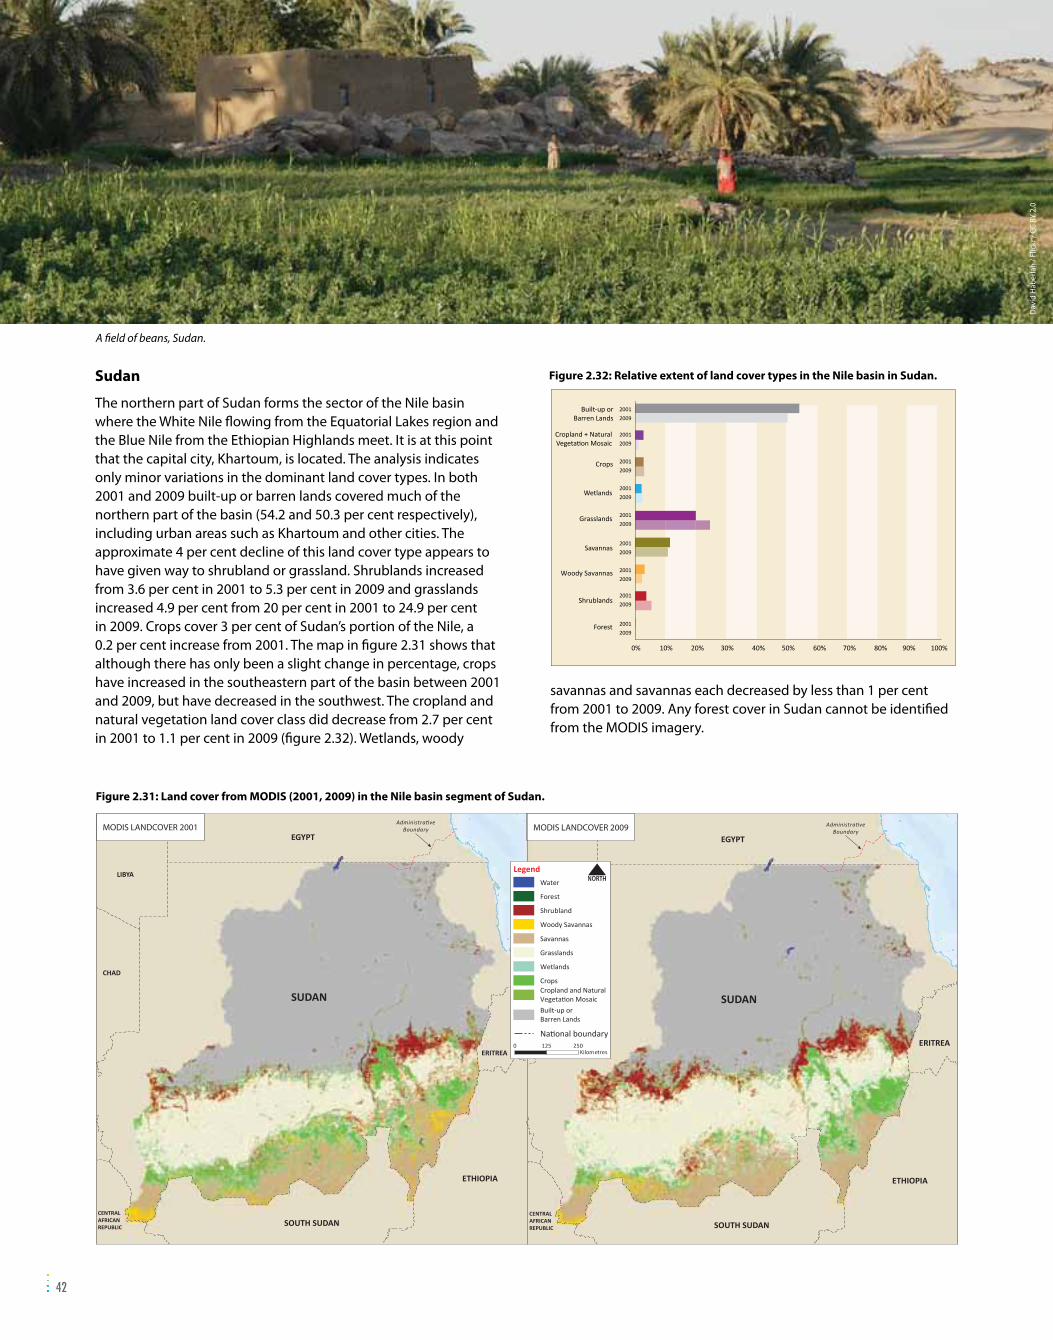
42
Sudan
The northern part of Sudan forms the sector of the Nile basin where the White Nile fl owing from the Equatorial Lakes region and the Blue Nile from the Ethiopian Highlands meet. It is at this point that the capital city, Khartoum, is located. The analysis indicates only minor variations in the dominant land cover types. In both 2001 and 2009 built-up or barren lands covered much of the northern part of the basin (54.2 and 50.3 per cent respectively), including urban areas such as Khartoum and other cities. The approximate 4 per cent decline of this land cover type appears to have given way to shrubland or grassland. Shrublands increased from 3.6 per cent in 2001 to 5.3 per cent in 2009 and grasslands increased 4.9 per cent from 20 per cent in 2001 to 24.9 per cent in 2009. Crops cover 3 per cent of Sudan’s portion of the Nile, a 0.2 per cent increase from 2001. The map in fi gure 2.31 shows that although there has only been a slight change in percentage, crops have increased in the southeastern part of the basin between 2001 and 2009, but have decreased in the southwest. The cropland and natural vegetation land cover class did decrease from 2.7 per cent in 2001 to 1.1 per cent in 2009 (fi gure 2.32). Wetlands, woody
savannas and savannas each decreased by less than 1 per cent from 2001 to 2009. Any forest cover in Sudan cannot be identifi ed from the MODIS imagery.
Figure 2.31: Land cover from MODIS (2001, 2009) in the Nile basin segment of Sudan.
Cropland + NaturalVegetation Mosaic
Wetlands
Savannas
Forest
0% 10% 20% 30% 40% 50% 60% 70% 80% 90% 100%
2001
2009
2001
2009
2001
2009
2001
2009
2001
2009
2001
2009
2001
2009
2001
2009
2001
2009
Shrublands
Woody Savannas
Grasslands
Crops
Built-up orBarren Lands
Figure 2.32: Relative extent of land cover types in the Nile basin in Sudan.
MODIS LANDCOVER 2001 MODIS LANDCOVER 2009
Water
Forest
Shrubland
Woody Savannas
Savannas
Grasslands
Wetlands
CropsCropland and Natural Vegetation Mosaic
Built-up orBarren Lands
0 125 250Kilometres
National boundary
Legend N
EGYPT
SUDAN
SOUTH SUDAN
CHAD
ERITREA
CENTRALAFRICANREPUBLIC
ETHIOPIA
AdministrativeBoundary
LIBYA
EGYPT
SUDAN
SOUTH SUDAN
ERITREA
CENTRALAFRICANREPUBLIC
ETHIOPIA
AdministrativeBoundary
A fi eld of beans, Sudan.
Dav
id H
aber
lah
/ Flic
kr /
CC B
Y 2.
0

43
United Republic of Tanzania
The United Republic of Tanzania is the southernmost country of the Nile basin. Noticeable changes in land cover from 2001 to 2009 include a 15.7 per cent increase in savannas from 34.5 to 50.2 per cent, respectively, and an 8.8 per cent reduction in grasslands from 22.4 to 13.6 per cent (fi gure 2.33). The remaining land cover types only changed slightly, with most in decline: forest (-0.6 per cent), shrublands (-1.1 per cent), wetlands (-1.1 per cent), crops (-1 per cent), cropland and natural vegetation (-2.2 per cent), built-up or barren lands (-1.6 per cent), and woody savanna (+0.7 per cent) (fi gure 2.34).
Figure 2.33: Land cover from MODIS (2001, 2009) in the Nile basin segment of the United Republic of Tanzania.
Cropland + NaturalVegetation Mosaic
Wetlands
Savannas
Forest
0% 10% 20% 30% 40% 50% 60% 70% 80% 90% 100%
2001
2009
2001
2009
2001
2009
2001
2009
2001
2009
2001
2009
2001
2009
2001
2009
2001
2009
Shrublands
Woody Savannas
Grasslands
Crops
Built-up or Barren Lands
Figure 2.34: Relative extent of land cover types in the Nile basin in the United Republic of Tanzania.
MODIS LANDCOVER 2001 MODIS LANDCOVER 2009
Water
Forest
Shrubland
Woody Savannas
Savannas
Grasslands
Wetlands
CropsCropland and Natural Vegetation Mosaic
Built-up orBarren Lands
0 45 90Kilometres
National boundary
Legend N
UGANDAKENYA
UNITED REPUBLICOF TANZANIA
RWANDA
BURUNDI
Lake Victoria
UGANDAKENYA
UNITED REPUBLICOF TANZANIA
RWANDA
BURUNDI
Lake Victoria
Ngorongoro Crater, United Republic of Tanzania.
A misty day on the Serengeti, Tanzania.
al_g
reen
/ Fl
ickr
/ CC
BY-
NC-
ND
2.0
geof
ther
ef /
Fote
r.com
/ CC
BY-
NC-
ND

44
Uganda
Uganda hosts the major lakes in the basin: Lakes Albert, George and Edward to the west, the Lake Kyoga complex in the central area of the country and Lake Victoria in the southeast. Forty fi ve per cent of the surface area of Lake Victoria occurs in Uganda. There is a natural fringe of woody savannas along the northern edges of these water bodies; while crops and cropland/natural vegetation mosaic form a border along the southern edges of the lakes (fi gure 2.35). Woody savannas exhibited a 5.3 per cent increase between 2001 and 2009. Crops and cropland/natural vegetation both increased slightly over the same period. Crops increased by 0.9 per cent to 10.1 per cent while cropland and natural vegetation increased by 1.4 per cent. Savannas decreased slightly from 11.4 per cent in 2001 to 11 per cent in 2009. In 2009 grasslands and wetlands each made up about 5 per cent of the land cover, a 1 per cent decrease from 2001. Forests covered 6 per cent of the land in 2009, down 2 per cent from 2001 despite the existence of protected forest reserves such as Budongo, Mabira, Mount Elgon, Queen Elizabeth National Park, Bwindi, Ruwenzori Mountains, Kibale and Toro-Semliki reserves.
Built-up or barren land cover also decreased by 2 per cent from 10 per cent in 2001 to 8 per cent in 2009. Shrublands cover only 2 per cent of the Ugandan Nile basin, a 1 per cent reduction from 2001 (fi gure 2.36).
Figure 2.35: Land cover from MODIS (2001, 2009) in the Nile basin segment of Uganda.
Cropland + NaturalVegetation Mosaic
Wetlands
Savannas
Forest
0% 10% 20% 30% 40% 50% 60% 70% 80% 90% 100%
2001
2009
2001
2009
2001
2009
2001
2009
2001
2009
2001
2009
2001
2009
2001
2009
2001
2009
Shrublands
Woody Savannas
Grasslands
Crops
Built-up orBarren Lands
Figure 2.36: Relative extent of land cover types in the Nile basin in Uganda.
MODIS LANDCOVER 2001 MODIS LANDCOVER 2009
Water
Forest
Shrubland
Woody Savannas
Savannas
Grasslands
Wetlands
CropsCropland and Natural Vegetation Mosaic
Built-up orBarren Lands
0 45 90Kilometres
National boundary
Legend N
UGANDA
KENYA
UNITED REPUBLICOF TANZANIA
RWANDA
Lake Victoria
Lake Edward
Lake Albert
l a k e Kyoga
UGANDA
KENYA
UNITED REPUBLICOF TANZANIA
Lake Victoria
Lake Edward
Lake Albert
l a k e Kyoga
SOUTH SUDAN SOUTH SUDAN
DEMOCRATICREPUBLIC
OFTHE CONGO
sara
hem
cc /
Flic
kr /
CC B
Y 2.
0
Tea plantations cover the rolling landscape of the crater lake district near Fort Portal and Kibale Forest National Park.

45
ReferencesAhmad, A.M. (2008). Post-Jonglei planning in southern Sudan:
combining environment with development. Environment and Urbanization. 2008 20:575. Sage Publications on behalf of International Institute for Environment and Development (IIED). http://eau.sagepub.com/content/20/2/575.full.pdf+html. Accessed 6th Marcy 2013.
Athman, C., Evenden, J. and M. Chaveas (2006). Technical assistance to the US Government Mission in Burundi on natural resource management and land use policy. United States Forest Service (USFS) International Programs, Department of Agriculture, Washington D.C.
Beck, J., Citegetse, G., Ko, J., and S. Sieber (2010). Burundi Environmental Threats and Opportunities Assessment. United States Agency for International Development (USAID), Bujumbura.
Bontemps, S., Defourney, P., Van Bogaert, E., Kalogirou, V. and O. Arino. (2010). GLOBCOVER 2009: Products description and validation report. ESA GLOBCOVER project. http://ionia1.esrin.esa.int/. Accessed 6th March 2013.
FAO (1997). Irrigation potential in Africa. A basin approach. In: FAO Food and Water Bulletin. Food and Agriculture Organisation of the United Nations (FAO), Rome. http://www.fao.org/docrep/W4347E/w4347e0k.htm. Accessed 6th March 2013.
FRA (2010). Global Forest Resources Assessment 2010. Country Report Burundi. FRA2010/033. Forest Resources Assessment (FRA) Programme, Forestry Department. Food and Agriculture Organization of the United Nations. Rome.
Friedl M.A., D. Sulla-Menasha, B. Tan, A. Schneider, N. Ramankath, A. Sibley and X.M. Huang (2010). MODIS Collection 5 Global land Cover: Algorithm refinements and characterization of new data sets. Remote Sensing Of Environment, 115(2), 392-403.
Fritz, S., See, L., McCallum, I., Schill, C., Obersteiner, M., van der Velde, M., Boettcher, H., Havlík, P. and F. Achard (2011). Highlighting continued uncertainty in global land cover maps for the user community. Environ. Res. Lett. 6 044005. http://iopscience.iop.org/1748-9326/6/4/044005/fulltext/. Accessed 24th December 2012.
Kayombo, S. and S.E. Jorgensen (2006). Lake Victoria: experience and lessons learned brief. International Lake Environment Committee, Lake Basin Management Initiative, Pp. 431-446. Kusatsu, Japan.
Lamberts, E. (2009). The effects of Jonglei Canal operation scenarios on the Sudd swamps in Southern Sudan. MS Thesis. University of Twente, Netherlands. http://essay.utwente.nl/59163/. Accessed 6th March 2013.
NASA (undated). About MODIS. National Aeronautics and Space Administration (NASA), Washington D.C. http://modis.gsfc.nasa.gov/about/ Accessed 6th March 2013.
NBI (2010). Country Profiles: Sudan. Nile Basin Initiative (NBI), Entebbe. http://www.nilebasin.org/newsite/index.php?option=com_content&view=article&id=137%3Acountry-profiles&catid=35%3Anbi-country-profiles&Itemid=67&lang=en. Accessed 6th March 2013.
NBI (2012). State of the Nile Basin Report. Nile Basin Initiative (NBI), Entebbe.
Ndayambaje, J.D. and G.M.J. Mohren (2011). Fuelwood demand and supply in Rwanda and the role of agroforestry. Agroforest Syst DOI 10.1007/s10457-011-9391-6.
Nduwamungu, J. (2011). Forest Plantations and Woodlots In Burundi. Volume 1. Issue 11, 2011. African Forest Forum, Nairobi.
REMA (2009). State of the Environment and Outlook Report. Rwanda Environment Management Authority (REMA), Kigali.
Schaab, G., Lübker, T, Lung, T. and S.M. Nthuni (2010). Applications
of object-based image analysis results for the farmland surrounding Kakamega Forest in western Kenya. Faculty of Geomatics, Karlsruhe University of Applied Sciences.
Schaaf, C.B., Gao, F., Strahler, A.H., Lucht, W., Li, X., Tsang, T., Strugnell, N. C., Zhang, X., Jin, Y., Muller, J.P., Lewis, P., Barnsley, M., Hobson, P., Disney, M., Roberts, G., Dunderdale, M., Doll, C., D’entremont, R.P., Hu, B., Liang, S., Privette, J. L. and D. Roy (2002). First Operational BRDF, Albedo Nadir Reflectance Products From MODIS.
Thomlinson, J.R., Bolstad, P.V. and W.B. Cohen (1999). Coordinating Methodologies for Scaling Landcover Classifications from Site-Specific to Global: Steps toward Validating Global Map Products. Remote Sens. Environ. 70:16–28 (1999)
Zhou, L., Tucker, C.J., Kaufmann, R.K., Slayback, D., Shabanov, N.V. and R.B. Miyeni (2001). Variations in Norhern Vegetation Activity inferred from satellite data of vegetation index during 1981 to 1999. Journal of Geophysical Research. Vol 106 (D17) 20-69. Doi:10.1029/2000JD000115.

46
Chapter 3CLIMATE AND HYDROLOGICAL OVERVIEW
O
xfam
Inte
rnat
iona
l / F
lickr
/ CC
BY-
NC-
ND
2.0
IntroductionThe elements of climate (rainfall and temperature) and aspects of hydrology (river fl ows, lakes and underground water storage), coupled with human-landscape features (such as land cover or land use change) have sensitive interactions that ultimately aff ect the availability of water within a basin. The River Nile is extremely sensitive to changes in precipitation with variations impacting lake levels and river discharges. Increases in temperature can also aff ect the rates of evaporation and evapotranspiration infl uencing the water balance of the basin. Given the centrality of the fresh water resources to economic and social development of the Nile basin region, it is important to have a good understanding of these variables. This chapter presents an overview of these elements and the interactions therein.
ClimateThere are fi ve broad climatic regions within the Nile basin region: Mediterranean, arid, semiarid, subtropical and tropical. The areas around the Equatorial lakes, south-western Ethiopia and the southern parts of Sudan have a tropical climate characterized by well-distributed rainfall and little variation in mean temperature depending on the locality and altitude. The climate gradually changes as one goes northwards progressing through subtropical, semiarid to a desert-type climate in northern Sudan and Egypt. The arid climate is characterized by a dry atmosphere and signifi cant seasonal and diurnal temperature variations (Karyabwite 2000).
RainfallRainfall is a major hydrological feature of the Nile basin and exhibits spatial and temporal variation at both the basin and country level. The Inter-Tropical Convergence Zone (ITCZ), which fl uctuates seasonally, drives the region’s rainfall regime and infl uences the hydrology of the Nile (Camberlin 2009, Sutcliff e and Parks 1999). Precipitation generally increases from north to south and with elevation (Beyene and others 2007).
The total amount of precipitation over the Nile basin countries is 7 000 BCM/yr, of which 1 660 BCM/yr falls in the Nile basin proper. The mean for the entire Nile basin is 615 mm/yr (Ribbe and Ahmed 2006). About 28 per cent of the basin receives less than 100 mm of rain annually, part of it experiences hyper-arid conditions and another substantial area (about 34 per cent) has sub-humid conditions and receives between 700 and 1 300 mm of rain. Only the southwestern part of South Sudan, the Lake Victoria basin region and the Ethiopian highlands receive over 1 000 mm of rainfall a year (Camberlin 2009).
Chris
tine
Vauf
rey
/ Flic
kr /
CC B
Y 2.
0
Banana trees in a storm, Burundi.

47
A detailed assessment by Camberlin (2009) categorizes the region into nine rainfall classes as shown in fi gure 3.1. The northern coastline of Egypt that makes up regime 1 receives light rains in December and January. The southern-most part of Egypt and into northern Sudan makes up regime 2 which is dry throughout the year. Regime 3 begins at around 18°N, with light rainfall that peaks in August, the wettest month. This trend is maintained, but the rainy season lengthens progressively for each of the next four regimes.
The equatorial climates of regimes 8 and 9 are typifi ed by two rainy and two dry seasons each, although rainfall is relatively high throughout the year. In most of Uganda and the western part of Kenya, the driest months are centered in December-February, while the main rainy season is centered in April. The Lake Victoria catchment area in the United Republic of Tanzania, Rwanda and Burundi comprise regime 9, where the driest season occurs in the months of June-August (Camberlin 2009).
Figure 3.1: Rainfall regimes over the Nile basin (base period is 1961 to 1990).
250200150100
500
250200150100
500
250200150100
500
250200150100
500
250200150100
500
250200150100
500
250200150100
500
250200150100
500
250200150100
500
1
2
3
4
5
6
7
8
9
mm
mm
mm
mm
mm
mm
mm
mm
mm
J F M A M J J A S O N D
206
162
301
183
169
92
27
3
11
N
EGYPTLIBYA
SUDAN
SOUTH SUDAN
ETHIOPIA
CHAD
DEMOCRATIC
REPUBLIC
OF
THE CONGO
UGANDA
KENYA
ERITREA
CENTRALAFRICANREPUBLIC
RWANDA
BURUNDI
SOMALIA
UNITED REPUBLIC
OF TANZANIA
City0 240 480
Kilometres
National boundary
Lake
River
Rainfall Regime
Nile River Basin Countries
Legend
Mogadishu
Mombasa
Nairobi
Addis Ababa
Djibouti
Asmara
Bur Sudan
DJIBOUTI
Aswan
Wadi Halfa
Cairo
Kisangani
KigaliBujumbura
Kampala
Khartoum
El Obeid
AdministrativeBoundary
AdministrativeBoundary
1
2
3
4
5
6
7
8
9
Re d S
e a
I N D I A N
O C E A N
6
Juba
Ars
enie
Cos
eac
/ Flic
kr /
CC B
Y-N
D 2
.0
Children playing outside after heavy rains, South Sudan.
Souce: Camberlin 2009

48
Figure 3.2: The main sub-basins of the Nile basin region.
N
EGYPTLIBYA
SUDAN
SOUTH SUDANETHIOPIA
CHAD
DEMOCRATIC
REPUBLIC
OF
THE CONGO
UGANDA
KENYA
ERITREA
TANZANIA
CENTRALAFRICANREPUBLIC
RWANDA
BURUNDI
SOMALIA
City0 240 480
Kilometres
National boundary
Lake
River
Nile Basin
Nile Sub Basin
Nile River Basin Country
Legend
Mombasa
Nairobi
Addis Ababa
Asmara
Bur Sudan
DJIBOUTI
Aswan
Wadi Halfa
Cairo
Kisangani
KigaliBujumbura
Kampala
Khartoum
El Obeid
AdministrativeBoundary
AdministrativeBoundary
Re
d S
ea
I N D I A N
O C E A N
Juba
Main NileDownstream of theAtbara confluence
Main NileDownstream of theAtbara confluence
Main NileDownstream of the
Khartoum confluence
Main NileDownstream of the
Khartoum confluence
Bahr El ArabBahr El ArabWhite NileWhite Nile
AtbaraAtbara
Blue NileBlue Nile
Bahr El GhazalBahr El Ghazal
Bame El Jabel SuddBame El Jabel Sudd
Pibor - Akabo - SobatPibor - Akabo - Sobat
Lake Kyoga - Lake Albert - Aswa
Lake Kyoga - Lake Albert - Aswa
LakeVictoria
LakeVictoria
UNITED REPUBLIC OF
Souce: FAO 2011

49
Rainfall within the basin is modified by the presence of the different water bodies and therefore varies in different sub-basins (figure 3.2). For example, in the Blue Nile basin of Ethiopia, the mean annual rainfall ranges from 1 000 mm in the northeast to 2 000 mm in the southeast (Ribbe and Ahmed 2006). In the Equatorial lakes region, it varies between 950 mm and 2 450 mm. South of the Blue Nile River Basin, precipitation reaches over 2 400 mm in the Baro River basin, recharging the Baro River, which joins the White Nile before Khartoum (Conway 2000). Table 3.1 shows the rainfall distributions for selected catchments in the Nile basin using data from different sources.
Rainfall by country
Egypt is the country with the least rainfall averaging 200 mm per year. The capital city, Cairo, receives about 25 mm per year. Ninety per cent of the country receives rain only once every couple of years.
About 30 per cent of the northern part of Sudan is desert, where drought is common. Rainfall here averages about 254 mm per year. This area borders a semi-arid Sahelian region of low mountains in the central area of the Sudan, giving way to a swamp-covered south which receives approximately 1 015 mm of rain a year.
Note: *Rainfall average up to 1972 for the stations available, the periods of record vary (Source: Sutcliffe and Parks 1999)**CRU CL 2.0: Climate Research Unit Climatology data base version 2
Basin areaSutcliff e and Parks
Up to 1972(mm/yr)*
CRU CL. 2.0 1960-1991(mm/yr)**
Lake Victoria basin (excluding the lake)
1 186 1 196
Lake Kyoga basin 1 276 1 224
Lake Albert basin 1 214 1 175
Lake Albert to Mongalla 1 180 1 154
Mongalla to Lake No 871 961
Bahr el Ghazel basin 1 169 1 105
River Baro basin 1 503 1 555
Ethiopian Nile catchment 1 227 1 184
Main Nile downstream of Atbara confl uence
36 46
Water body: Lake Victoria 1 650-1 858 1 326
Table 3.1: Average annual rainfall over key catchments in the Nile basin.
Source: New and others 2002
Adam
Cohn
/ Fo
ter.c
om /
CC B
Y-N
C-N
D
Storm clouds over Lake Mutanda, Uganda.

50
Rainfall in Ethiopia ranges from 510 mm up to 1 525 mm in the rainy season from mid June to September. In absolute terms, there is an overall large amount of rainfall in Ethiopia, but the effects vary widely, and are often not beneficial. For example, heavy downpours in the rainy season cause severe erosion leading to losses in soil fertility and productivity; while the rest of the year is extremely dry, making farming almost impossible without irrigation. Precipitation is generally higher in the upstream countries. The climate in Burundi is tropical and moderated by its altitude. The average annual rainfall ranges from 1 000 mm to
1 500 mm. Rainfall in the DRC falls throughout the year and ranges from 1 524 mm in the north, to 1 270 mm in the south. Twenty per cent of Uganda is covered by open water and precipitation is between 1 000 mm and 1 500 mm a year.
In some of the countries, the amount of precipitation received in their portion of the Nile basin exceeds the national average as highlighted in table 3.2. This fact is important for policy and decision making especially in countries where there is a lack of additional water resources. Examples include Egypt, Sudan and Ethiopia which do not have significant water resources within their borders outside of the Nile and its tributaries.
Temperature
As with rainfall, temperature exhibits temporal and spatial differences over the basin. There are larger variations in temperature in the arid regions of northern Sudan and most of Egypt, with smaller deviations around the equator (Mohammed 2006).
Bates and others (2008) indicate that since the 1960s, temperatures over Africa have been increasing. And while this is the general trend, there are variations across the Nile basin. For instance, in Ethiopia, minimum temperatures have increased slightly faster than maximum or mean temperatures (Conway and others 2004); while temperatures near the Great Lakes region in eastern Africa seem to be decreasing (King’uyu and others 2000). In the Lake Victoria basin countries, temperatures reach a maximum in February just before the March equinox and reach its lowest records in July after the June equinox maximum with ranges between 28.6-28.7° C. The minimum temperature varies from 14.7 to 18.2° C. Comparison of temperature records for the period 1950-2000 and 2001-2005 show that maximum temperatures have increased by an average of 1° C (LVBC 2007).
Rising temperatures have implications for evaporation and evapotranspiration with impacts on water availability.
A view over fields, houses and desert, Egypt.
Bonn
ie A
nn C
ain-
Woo
d / F
lickr
/ CC
BY
2.0
* For the Kenyan land area of the Lake Victoria basin** excluding the Lake Victoria surface area
CountryAverage country
rainfall (mm/yr)
Average Nile rainfall
(mm/yr)
Burundi 1 245 1 202
Dem. Rep. of the Congo
1 541 1 146
Egypt 24 19
Eritrea 278 435
Ethiopia 845 1 184
Kenya 722 1 449*
Rwanda 1 208 1 137
Sudan 419 487
United Rep. of Tanzania
1 007 1 043**
Uganda 1 229 1 193**Source: FAO 2011
Table 3.2: Average Annual rainfall in each Nile basin country and in each country’s portion of the Nile basin.

51
Evapotranspiration and evaporation
Evapotranspiration (ET), the sum of evaporation and transpiration, is one of the parameters required to determine the water balance of a river basin. It represents a certain amount of water lost from the catchment area. By understanding how much water is available after such losses, it is possible to plan for effi cient and eff ective usage of the existing resource, especially where water scarcity and drought are important issues. Evapotranspiration is also an indicator of climatic trends, as in periods of depressed rainfall there will be a tendency towards lower evapotranspiration values.
Evapotranspiration from terrestrial ecosystems
Evapotranspiration is infl uenced by the biophysical characteristics of land cover, climatic factors (such as the availability of rainfall, relative humidity and temperature) and latitude. Regions closer to the equator tend to evaporate more water than those further away. For instance, evapotranspiration from barren lands, such as the desert in Egypt and along the northern border of Sudan, is very small because annual precipitation is also low. Figures 3.3 and 3.4 (next page) show the annual evapotranspiration and precipitation along the Nile.
N
20 00010
Evapotranspiration (mm/year)
City
0 300 600Kilometres
National boundary
Lake
Nile River Basin Country
Legend
2001 2005 2010
EGYPT
SUDAN
SOUTH SUDAN ETHIOPIA
CHAD
DEMOCRATIC
REPUBLIC
OF
THE CONGO
UGANDA
KENYA
ERITREA
TANZANIA
CENTRALAFRICANREPUBLIC
RWANDA
BURUNDI
SOMALIA
DJIBOUTI
LIBYAEGYPT
SUDAN
SOUTH SUDAN ETHIOPIA
CHAD
DEMOCRATIC
REPUBLIC
OF
THE CONGO
UGANDA
KENYA
ERITREA
TANZANIA
CENTRALAFRICANREPUBLIC
RWANDA
BURUNDI
SOMALIA
DJIBOUTI
LIBYAEGYPT
SUDAN
SOUTH SUDAN ETHIOPIA
CHAD
DEMOCRATIC
REPUBLIC
OF
THE CONGO
UGANDA
KENYA
ERITREA
TANZANIA
CENTRALAFRICANREPUBLIC
RWANDA
BURUNDI
SOMALIA
DJIBOUTI
UNITED REPUBLIC OF UNITED REPUBLIC OF UNITED REPUBLIC OF
Figure 3.3: Annual terrestrial evapotranspiration (ET) in the Nile basin, 2001, 2005 and 2010.
Konso watershed restoration project, Ethiopia.
Bonn
ie A
nn C
ain-
Woo
d / F
lickr
/ CC
BY
2.0
Source: Mu and others 2011
51

52
Figure 3.4: Mean annual rainfall map of the Nile basin between 2001-2010.
N
EGYPTLIBYA
SUDAN
SOUTH SUDANETHIOPIA
CHAD
DEMOCRATIC
REPUBLIC
OF
THE CONGO
UGANDA
KENYA
ERITREA
TANZANIA
CENTRALAFRICANREPUBLIC
RWANDA
BURUNDI
SOMALIA
City
0 240 480Kilometres
National boundary
Lake
River
Nile River Basin Country
Legend
Mombasa
Nairobi
Addis Ababa
Asmara
Bur Sudan
DJIBOUTI
Aswan
Wadi Halfa
Cairo
Kisangani
KigaliBujumbura
Kampala
Khartoum
El Obeid
AdministrativeBoundary
AdministrativeBoundary
Re
d S
ea
I N D I A N
O C E A N
Juba
Mean AnnualRainfall (mm)0 3 100
UNITED REPUBLIC OF
Data: TRMM

53
Diff erent land cover or vegetative types have diff erent evapotranspiration values. However, the mean annual values for each biome of the basin do not vary much over the years, as shown in fi gure 3.5. The slight variations are in response to rainfall fl uctuations and land cover changes. Heavily vegetated areas tend to have higher rates of evapotranspiration than areas of sparse vegetation. An analysis of the Nile delta area indicates that forests have the highest mean evapotranspiration (1 258 mm/yr) of all the vegetated land cover types.
The evapotranspiration for other major land cover types between 2001 and 2009 was as follows: cropland and natural vegetation mosaics 946 mm/yr; woody savanna 908 mm/yr; savannas 726 mm/yr; wetlands 651 mm/yr; crops, 626 mm/yr;
shrublands 521 mm/yr; and grasslands 536 mm/yr. This pattern appears to be generally replicated in the diff erent sub-basins.
Total annual terrestrial evapotranspiration for the entire basin shows only moderate changes from year to year. However the amounts contributed by each country contrasts greatly depending on the areal extent of the country in the Nile basin as well as the surface moisture availability either from rainfall or from surface fl ows and irrigation (such as from the Sudd swamp in South Sudan and the Nile delta in Egypt) (fi gures 3.6 and 3.7). Between 2001 and 2009, South Sudan contributed the most in terms of terrestrial ET, while Burundi contributed the least.
400
600
800
1 000
1 200
1 400
2001 2002 2003 2004 2005 2006 2007 2008 2009
Mea
n A
nnua
l ET
(mm
) by
Land
Cov
er C
lass
GrasslandsShrublandsCropsSavanaWetlandsWoody SavanaCropland + Natural VegetationForest
Figure 3.5: Mean annual ET from diff erent biomes in the Nile basin, 2001-2009.
A.D
avey
/ Fo
ter.c
om /
CC B
Y
A local farmer tending his fi elds, Ethiopia.
Figure 3.7: Annual variability of terrestrial ET in the Nile basin countries.
0 100 200 300 400 500 600
S.Sudan
Sudan
Ethiopia
Uganda
UR. Tanzania
Kenya
Egypt
DR.Congo
Rwanda
Eritrea
Burundi
Total Annual ET in Billion Cubic Metres
2009 2008 2007 2006 2005 2004 2003 2002 2001
Source: AbuZeid 2012
Source: AbuZeid 2012Note: Excludes ET from lakes and reservoirs, and barren/urban lands.
2001 2002 2003 2004 2005 2006 2007 2008 2009
1 500
1 600
1 300
1 400
1 700
1 800
TOta
l ET
(bill
ion
cubi
c m
etre
s)
Figure 3.6: Annual variability of total terrestrial ET from the Nile basin.

54
Evaporation from lakes and reservoirs
The total amount of water lost due to evaporation from open water bodies such as lakes and reservoirs between 2001 and 2010 was about 137.4 BCM. From year to year this amount is fairly constant. Lake Victoria contributed an average of 76 per cent of this total, followed by Lake Nasser (7 per cent), Lake Albert (6 per cent), Lake Kyoga (4 per cent), Lake Tana (3 per cent), Lake Edward (2 per cent) and others (2 per cent). Figure 3.8 shows total annual ET from lakes and reservoirs in the basin, along with their proportional contribution to the total ET between 2001 and 2010.
The amount of solar radiation and other climatic factors that aff ect the water’s surface, such as wind and humidity, are the major factors infl uencing rates of evaporation from lakes and reservoirs. A lake’s surface area and depth, however, are also important factors. A higher surface area to volume (SAV) ratio means increased exposure to evaporation. As fi gures 3.9 and 3.10 show, although Lake Victoria loses a signifi cantly higher volume of ET (104.6 BCM) than any of the other lakes in the basin, it only accounts for 3.8 per cent of its total volume. On the other hand, Lake Nasser loses up to 6 per cent of its total lake volume through ET.
Of the region’s six big lakes Lake Kyoga is the shallowest (between 3 and 5 m deep) and has the highest SAV ratio; and thus the highest lake ET to lake volume ratio (ETV). Its overall ET
0
20
40
60
80
100
120
140
160
2001 2002 2003 2004 2005 2006 2007 2008 2009 2010
Tota
l Ann
ual E
T (B
illio
n Cu
bic
Met
res)
Lake Victoria Lake Nasser Lake Albert Kyoga Lake Complex Lake Tana Lake Edward Others
Figure 3.8: Total annual ET from Nile basin lakes and reservoirs and the contribution of each of the major water bodies to the total, 2001-2010.
Figure 3.10: Relationship between lakes’ SAV ratio, volumes and evapotranspiration.
0%
10%
20%
30%
40%
50%
60%
70%
80%
90%
100%
Lake Victoria
Lake Nasser
Lake Albert
Kyoga LakeComplex
Lake Tana
Lake Edward
Lake
ET
to L
ake
Volu
me
Prop
orti
on
Lake Volume (Billion Cubic Metres) Lake ET Volume (BCM/yr)
2760.0 162.3 280.0 13.6 28.4 39.5
104.6 9.67.6
5.2 4.2 2.9
Figure 3.9: Annual ET and total volumes of major lakes that contribute the most ET to the Nile basin.
0
50
100
150
200
250
300
350
Lake Victoria Lake Nasser Lake Albert Kyoga LakeComplex
Lake Tana Lake Edward
3.85.9
2.7
38.6
14.8
7.3
76
76
4
3
2
Surf
ace
Are
a : V
olum
e Ra
tio
(SAV
)
Contribution to Nile Basin Lakes' ET (%)
Lake ET : Lake Volume Ratio -TAV (%)
Surface Area : Lake Volume Ratio - SAV
Orthodox priest in a papyrus boat on his way to one of the monasteries , Lake Tana, Ethiopia.
Lan
drov
ing
Ling
uist
/ W
iki C
omm
ons
/ CC
BY-S
A 3
.0

55
contribution to the total Nile lakes/reservoirs ET, however, is only 4 per cent. Lake Victoria’s mean depth is about 40 m and it has a surface area of 68 800 km2 (ILEC 2012) so its SAV and ETV ratios are low. From 2001 to 2010, the average annual ET from the major lakes remained more-or-less constant (fi gure 3.11).
The land surfaces in the Nile basin provide about 92 per cent of the total moisture in the air as shown in fi gure 3.12 (AbuZeid 2012). The rest comes from evaporation from lakes and reservoirs. Monitoring trends in the total amount of water
Figure 3.11: Average annual ET from the major Nile basin lakes, 2001-2010.
Figure 3.12: Total annual terrestrial ET from land surfaces and total ET from terrestrial surfaces, lakes and reservoirs in the Nile basin.
1 300
1 400
1 500
1 600
1 700
1 800
1 900
2 000
2001 2002 2003 2004 2005 2006 2007 2008 2009
Tota
l Ann
ual E
T fr
om N
ile B
asin
(B
illio
n Cu
bic
Met
res)
Total ET from Land Surfaces Total ET from Land Surfaces, Lakes and Reservoirs
1 563
1 532
1 7271 743
1 618
1 7321 717
1 801
1 731
1 603
1 693 1 667
1 867
1 756
1 8751 851
1 937
1 869
Ferry crossing, Lake Kyoga, Uganda.
Jacq
ui19
48 /
Flic
kr /
CC B
Y-SA
2.0
2001 2002 2003 2004 2005 2006 2007 2008 2009
1 800
1 600
1 400
1 200
1 000
800
Ave
rage
ann
ual E
T (m
m/y
r)
Lake Victoria Lake Nasser Lake Albert Kyoga Lake Complex
Lake Tana Lake Edward Others
Note: The GDAS ET estimates around the barren deserts in Egypt may be underestimated.

56
lost through evaporation from all types of geographic surfaces is key in hydrological modeling, meteorology, agricultural water management and other fields where evapotranspiration is an issue.
Storage SystemsThe River Nile basin has numerous lakes, ponds and water bodies, including some of the biggest freshwater lakes and artificial reservoirs in the world. Although the total area of open water in the Nile basin is vast, about 90 000 km2, it represents less than 3 per cent of the basin’s total area (NIS 2013). Five types of water storage systems are discussed in this chapter — lakes, wetlands, reservoirs, rivers, and underground aquifers.
Major lakesThe major lakes of the basin are found in the equatorial region, apart from Lake Tana which is to be found in the Ethiopian highlands. Table 3.3 summarizes the key characteristics of these lakes.
Enjoying the day along Lake Victoria’s shoreline, Uganda.
neilj
s / W
iki C
omm
ons
/ CC
BY 2
.0
Table 3.3: Key facts about the major lakes in the Nile basin
LakeSurface
area(km2)
Volume (km3)
Maximum depth
(m)
Mean depth
(m)
Shoreline length
(m)
Catchment area (km2)
Alti tude (m)
Country locati on
Victoria 68 800 2 750 84 40 3 440 184 000 1 134Kenya, United Republic of Tanzania, Uganda
Kyoga 1 720 5.7 75 000 914 Uganda
George 250 0.8 4.5 2.4 9 705 914 Uganda
Albert 5 300 58 615 DRC, Uganda
Edward 2 325 39.52 112 17 12 096 912 DRC, Uganda
Tana 3 600 28 14 9 385 10 000 1 788 EthiopiaSource: ILEC 1999

57
Lake Victoria
Lake Victoria, the largest lake in the Nile basin, is shared by Kenya, Uganda and the United Republic of Tanzania; although Burundi and Rwanda are also part of its catchment area which covers 184 000 km2 (ILEC 1999). Annual average rainfall on the lake is 1 500 mm, which represents about 85 per cent of the water entering the lake; the balance comes from the rivers that drain the catchment. The annual evaporation rate from the lake surface is about 1 260 mm (Fahmy 2006). The main outlet for Lake Victoria is the White Nile at Jinja linking to Lake Kyoga.
The levels of this lake are very sensitive to precipitation rising during periods of heavy rain and declining during times of suppressed precipitation. UNEP (2006) notes that the current water levels are below normal and the lowest they have been since 1961. Figure 3.13 shows the Lake Victoria drainage basin while fi gure 3.14 shows the historical fl uctuations in lake levels.
Lake Kyoga
This shallow lake has an area of 1 720 km2 and is surrounded by a huge swamp of 4 510 km2 (ILEC 1999, Fahmy 2006). Annual rainfall over the lake is about 1 290 mm and evapotranspiration is 2 230 mm/yr. Average annual discharge from Lake Kyoga is 22.5 BCM implying
a net water loss of about 1 BCM yearly, based on what it receives from Lake Victoria (Fahmy 2006). The Kyoga Nile is the outfl ow joining this lake to Lake Albert.
Lake Albert
Lake Albert lies along the shared border of Uganda and the DRC. It is about 160 km long and 30 km wide, with a maximum depth of 58 m and a surface elevation of 615 masl (ILEC 1999). Evaporation over the lake is estimated at 1 200 mm per annum and rainfall is 710 mm (Fahmy 2006).
Lake George and Lake Edward
Lake George has a surface area of 250 km2 and a catchment area of 9 705 km2. Lake Edward has a surface area of 2 325 km2 and its catchment’s basin area is 12 906 km2 (ILEC 1999). Lake George empties into Lake Edward via the Kazinga Channel. Queen Elizabeth National Park in Uganda extends from the eastern shores of Lake George and together with the adjacent Virunga National
Park in the DRC completely surrounds Lake Edward. River Semliki receives fl ows from these two lakes and with runoff from its own catchment sends about 4 BCM of water to Lake Albert every year (Fahmy 2006).
Lake Tana
Lake Tana, found in the Amhara region in the north-western Ethiopian highlands, is the largest freshwater lake in Ethiopia. It is sited in a wide depression and has a surface area ranging between 3 000 and 3 600 km² depending on the season. It is about 84 km in length and 66 km wide, with a maximum depth of 14 m and an elevation of 1 788 m (Wale 2008, ILEC 1999). Lake Tana is fed by four main rivers: the Gilgel Abay, Ribb, Gumara and Magech; and discharges at Bahir Dar through the Blue Nile. The four infl owing rivers contribute 93 per cent of the lake’s infl ow (Anbah and Siccardi 1991). The average fl ow from Lake Tana was estimated at 3.8 BCM/year swelling to 54 BCM by the time it reaches Khartoum as a result of contributions from the Rivers Dinder and Rahed (Fahmy 2006). A water regulation weir constructed in 1996 at the point where the lake discharges into the Blue Nile helps to control the lake levels for the downstream hydropower plant. However this has since led to a subsidence in lake levels as shown in fi gure 3.15. The mean annual rainfall is estimated at 1 248 mm/yr while the mean annual evaporation is approximated at 1 690 mm/yr (Wale 2008). The fl ow of the Blue Nile can be described as torrential; it also carries a very heavy load of silt.
320
480
0
160
640
800
240
400
80
560
720
Rive
r Dis
char
ge (m
³/s)
11/02/75 09/02/79 07/03/83 05/03/87 03/03/91 01/01/95 11/01/98 09/01/02 07/02/06
1 789
1 788
1 787
1 786
1 785
1 784
Obs
erve
d La
ke L
evel
s (m
am
sl)
Weir
operation
begins
Out flow
Lake level
Average lake level
Figure 3.15: Outfl ow and lake level at Lake Tana (1975–2006).
Source: Wale 2008
Figure 3.14: Historical water elevations in Lake Victoria.
Source: USDA 2005
Figure 3.13: Lake Victoria drainage basin.
LakeVictoria
LakeAlbert
LakeEdward
LakeKivu
LakeTanganyika
LakeEyasi
LakeManyara
LakeNatron
LakeMagadi
LakeNaivasha
LakeNakuru
LakeBaringo
LakeKyoga
Winam Gulf
Nyando
So ndu
Yala Nzoia
Vi ctoria Nile
Katonga
Ak age r a
Nya
baro
n go
A
kanya
r u
R uvuvu
S Imiyu
Mba l ag etiGurumeti
Mara
Mig ori
Kisumu
Kakamega
Eldoret
Kisii
Musoma
Mwanza
Geita
Sengerema
Bukoba
KIGALI
Mbarara
Masaka
KAMPALA
Jinja
SESE ISLANDS
UNITED REPUBLIC
OF TANZANIA
KENYA
UGANDA
BURUNDI
RWANDA
DEMOCRATIC
REPUBLIC
OF
THE CONGO
Source: Kayombo and Jorgensen 2006.

58
Wetlands Wetlands cover about 100 000 km2 or 3 per cent of the Nile basin area (NBI 2012). They include swamps, marshes, seasonally inundated grasslands, swamp forests, floodplains and riparian wetlands (at the edges of lakes and rivers). These wetlands have critical ecosystem functions: they provide a buffer protecting against the impacts of the strong seasonal variations in rainfall patterns, store floodwaters and help to maintain river flows even during dry spells. They also trap sediments and purify agricultural, industrial and urban wastewater and they can influence local microclimates especially when very large as in the case of the Sudd.
Wetlands are amongst the most biologically productive ecosystems and because of this they are under great pressure. Some such as the Sudd in South Sudan, Lake Burullus in Egypt and Lake George in Uganda have been protected under the RAMSAR Convention as wetlands of regional and international importance. Box 3.1 highlights some of the threats facing wetlands.
Box 3.1: Threats to wetlands in the Nile basin.
• Pollution from human activities reduces their ability to provide ecosystem services such as absorption of water or natural purification functions
• Conversion to other land uses such as agriculture or settlement or by climate change
• Wetlands degradation leading to a decrease in water quality and availability
• Loss of habitat for plants and animal species• Alien invasive species that upset the natural balance of
the ecosystem• Overfishing leads to increased pressure on natural fish
populations
A Saddle-billed stork in a swamp, Uganda.
Gip
Gip
ukan
/ Fl
ickr
/ CC
BY-
NC
2.0

59
The Sudd in South Sudan
Once in South Sudan, the White Nile breaks up to form the Bahr el-Jabal and Bahr az-Zaraf rivers. These rivers spread over a broad flat plain and expand into a vast wetland - the Sudd swamp. The Sudd in South Sudan is the largest wetland in Africa covering a dry season area of 8 000 km2 and between 30 000-40 000 km2 during the wet season (Fahmy 2006). It includes the Bahr el Ghazal swamps and the Machar marshes as shown in figure 3.18.
The Bahr el Ghazal basin has the highest rainfall in South Sudan, most of which is absorbed by the swamps and as such there is hardly any runoff to the White Nile. In fact it is estimated that the outflow from the Sudd is only about 50 per cent the inflow due to losses to evapotranspiration (Sutcliffe and Peterson 2007, UNEP 2010). Despite this, outflows from the Sudd are fairly constant with little seasonal variation. According to Fahmy (2006), the total discharge from the Sudd to the White Nile at Malakal comes to 15.5 BCM per year.
Figure 3.16: The swamps of South Sudan.
Uni
ted
Nat
ions
Env
ironm
ent P
rogr
amm
e
High rainfall woodland savanna with a small seasonal wetland in Wau district, Western Bahr el Ghazal.
59
Wau
Juba
Nimule
Mongolla
Jonglei
Boh
BAHR EL GHAZALSYSTEM
Malakal
BAHR ELJEBEL
SYSTEMSOBAT - BARO -
PIBORSYSTEM
MacharMarshes
Bahr el Jebelfloodplain begins
S U D D

60
Mara wetland in the United Republic of Tanzania
The Mara wetland is a riverine floodplain situated near where the River Mara discharges its waters into Lake Victoria. In the upstream river catchment, there are numerous economic activities and significant land-use changes. There are also changes occurring in the rivers hydrological regime with impacts on water quality and the ecological status of both Lake Victoria and the Mara wetlands.
The Nile delta in Egypt
The northern coastal wetlands of the Nile delta in Egypt are also significant wetlands in the Nile river system. This 20 000 km2 delta includes lakes, freshwater and saline wetlands, and intertidal areas, as well as large agricultural areas and towns (UNEP 2006). The wetlands are shallow, brackish lagoons surrounded by thick vegetation and include small islands. North of Cairo at the Delta barrage, the Nile branches off into the Damietta and Rosetta rivers, which flow into the Mediterranean sea. A complex system of irrigation canals provides water for intensive agriculture in the delta. Narrow canals join the wetlands to the sea. Their depth varies from 0.7 to 2.4 m (Azab 2011). Mean annual evaporation at the apex of the delta is 1 500 mm/yr (Fahmy 2006).
Over time, increasing human pressures have led to the degradation of the wetland ecosystem through pollution and land use change. For instance, drainage from irrigated fields and poorly treated urban and industrial waste water pollutes the delta threatening aquatic biodiversity (UNEP 2006). Egypt’s main cities are on the coast and groundwater has been overexploited to serve
them, leading to saltwater contamination of the coastal aquifers. Furthermore the fertility of the Nile delta which depends on the silt carried down the river is also under threat. When the Aswan High Dam was built in the 1960s, it prevented the annual flooding of the delta and the deposition of sediment. The upshot is that the delta is slowly eroding (NBI 2012). This is also discussed in chapter 5.
The Ethiopian wetlands
Ethiopia has many wetland ecosystems. These include alpine, riverine, lacustrine and floodplain wetlands and they are found in both the highlands and lowlands. They occur most commonly in the north-western and western highlands, the Rift Valley and the eastern highlands (Abebe and Geheb 2003).
Wetlands in Rwanda
Rwanda has 7 types of swamps, classified on the basis of relief, altitude, soil type, vegetation, slope of the watershed, population density, hydrology and size of the swamp (REMA 2009). They are mainly seasonal with flood plains of less than 200 m overall. Rugezi and Kamiranzovu are high altitude wetlands, while most of the others are low altitude. Four wetlands have been classified as critical: Kamiranzovu wetland in western province, Rweru-Mugesera wetland in Eastern province, Rugezi-Ruhondo wetland shared by Musanze and Gicumbi in Northern provinces, and Akagera wetland shared by Kibungo and Umutara in Eastern province.
Boat in a wetland, Rwanda.
60
John
and
Mel
anie
(Illi
ngw
orth
) Kot
sopo
ulos
/ Fl
ickr
/ CC
BY-
NC-
ND
2.0

61
ReservoirsDams are generally constructed for specifi c reasons. For example to hold back water for the specifi c purpose of managing or preventing the fl ow of surplus water into certain areas. As an outcome of dam construction, reservoirs or man-made lakes are usually created. These may be single or multi-use reservoirs for any combination of water supply, irrigation, fl ood control, hydropower generation, navigation, fi shing, recreation or environmental management (Siyam 2005).
Despite these obvious benefi ts, dams and reservoirs do have signifi cant environmental
impacts, including the interruption of natural fl ow regimes, deposition of sediment and erosion of riverbeds and banks, inundation of lands requiring resettlement of people and declining water quality (Siyam 2005).
The major reservoirs on the Nile River Basin — the Rosaries, Sennar and Khashm El Girba in Sudan and the Aswan High Dam in Egypt — are important for irrigation purposes. In the delta, there are four main barrages: the Delta barrage (actually consisting of two separate dams), the Zifta barrage and Farascour Dam in the Damietta and the Edfi na barrage in the Rosetta. A barrage is an artifi cial barrier used to increase depth or sustain a separation between fresh and salt water. Figure 3.17 shows the location of some of these dams on the Nile while table 3.4 gives some basic facts about them.
The Aswan High Dam and Lake Nasser, Egypt
Located in the lower Nile River Basin, Lake Nasser is situated on the border between Egypt and northern Sudan. The lake was created following the construction of the Aswan High Dam in 1963 to provide a multi-purpose storage reservoir for water supply, hydropower, irrigation and improved navigation. This artifi cial lake extends from southern Egypt to northern Sudan, has a surface area of 5 248 km2 and a total volume capacity of 162.3 km3 (ILEC 1999, Elsawwaf and Willems 2012). This capacity varies depending on the extent of the annual fl ood upstream. Although approximately 84 BCM fl ow each year to Lake Nasser in Egypt, heavy use of the lake’s waters means that only about 0.4 BCM actually reaches the Mediterranean Sea (Shema 2009). It is situated in a hot, dry area and therefore annual losses to evaporation can be quite high — ranging from up to 10 per cent when full to about 3 per cent when at minimum capacity (Mutua and others 2011).
N
EGYPTLIBYA
SUDAN
SOUTH SUDAN
ETHIOPIA
CHAD
DEMOCRATIC
REPUBLIC
OF
THE CONGO
UGANDA
KENYA
ERITREA
CENTRALAFRICANREPUBLIC
RWANDA
BURUNDI
SOMALIA
City
Dam
0 240 480Kilometres
National boundary
Lake
River
Nile River Basin
Legend
1. Delta barrage2. Assyut dam3. Aswan Dam4. Aswan High Dam5. Jabal al-Aulia dam6. Khashm El Girba dam7. Sinnar dam8. Roseires dam9. Owen Falls dam
Lake Victoria
Lake Turkana
Lake Edward
Lake Albert
Lake Kivu
Lake Tanganyika
Lake Tana
Lake Nasser
Lake Kyoga
Mombasa
Nairobi
Addis Ababa
Asmara
Bur Sudan
DJIBOUTI
Wadi Halfa
Cairo
Kisangani
KigaliBunjumbura
Kampala
Khartoum
El Obeid
Nile
R
iver
Whi
te N
ile
Bl u
e N
ile
Atbara
AdministrativeBoundary
AdministrativeBoundary
1
2
34
5 6
7
8
9
Re
d S
ea
I N D I A N
O C E A N
Juba
UNITED REPUBLIC
OF TANZANIA
Figure 3.17: Location of major dams along the River Nile.
Lake Nasser in Egypt.
cliff
.hel
lis /
Fote
r / C
C BY
-NC-
ND
Table 3.4: Key facts about the reservoirs in the Nile River Basin.
Reservoir/dam CountryConstructi on
yearRiver
Storage volume (km3)
Original Present
Owen Falls Uganda 1954 Victoria Nile - -
Jebel Aulia Sudan 1937 White Nile 3.22 2.54
Sinnar Sudan 1925 Blue Nile 0.93 0.37
Roseires Sudan 1966 Blue Nile 3.35 2.23
Khashim Al Girba Sudan 1964 Atbara 1.3 0.56
Aswan High Dam Egypt 1970 Main Nile 169 -
Merowe Sudan 2000 Main Nile 0.0161 -
Tekeze Ethiopia 2008 Tekeze 9.3 9.3
Renaissance Dam EthiopiaUnder
constructi onBlue Nile 63 -
Source: UNEP 2000

62
The Aswan High Dam has had a large impact on the river’s fl ow regime downstream of the dam (fi gure 3.18). This reservoir fully controls the Nile’s water fl ows by eliminating the normally high fl ows during August and September and limiting maximum discharges to 270 MCM/day, or less than one-third of the earlier peak values (Sutcliff e and Parks 1999). One side eff ect has been a gross reduction in the deposition of the silt that used to annually renew the fertility of Egypt’s agricultural lands.
Tekeze dam and the planned Renaissance Reservoir in Ethiopia
The River Tekeze in northern Ethiopia is a tributary of the Atbara River, which joins the main course of the Nile 300 km north of Khartoum. The Tekeze dam was completed in early 2009 primarily to produce hydropower and is expected to produce 300 MW of hydropower when fully operational. There are concerns about the dam’s environmental impacts. In 2008, a large landslide necessitated the addition of massive retaining walls to keep the slopes from eroding (UNEP 2006).
In the spring of 2012, work began on Ethiopia’s Grand Renaissance Dam, also called the Millennium Dam, which has become the key project in the nation’s plan to increase its electricity supply fi vefold by 2015. It will have a capacity of more than 5 000 MW and a reservoir capacity (63 BCM) two times that of Lake Tana. The dam will span a part of the Blue Nile in the region of Benishangul-Gumuz and when fi nished, will be Africa’s largest hydroelectric power plant. There are also plans to build four additional dams on the Blue Nile.
The Sinnar, Jebel Aulia and Khashm El Girba dams in Sudan
According to the World Commission on Dams (WCD 2000), the Sinnar dam is the oldest in Sudan. It was built on the Blue Nile some 300 km south of Khartoum in 1926 to irrigate the Gezira Scheme, one of the world’s largest irrigation projects. It is thus crucial to Sudan’s economy.
About 50 km southwest of Khartoum is the Jebel Aulia Dam, which was built in 1937 to support the Aswan Dam in southern Egypt. It was only in 1977 that Sudan gained control of the Jebel Aulia Dam. The lake formed by the dam has a thriving fi sh population from which about 15 000 tonnes of fi sh is harvested annually.
The Khashm El Girba dam on the Atbara River some 200 km downstream of the Ethiopian border was built in 1964 to irrigate the Khashm El Girba agricultural scheme and later the New Halfa scheme. Later on, it began to produce hydropower. The reservoir lost 50 per cent of its capacity within 40 years due to siltation, with that proportion rising to 60 per cent over time. This concurrently impacted the amount of water available for irrigation and also aff ected hydropower production, which is now limited to only the fl ood season. The reservoir is fl ushed occasionally to remove sediment (Siyam 2005).
0
100
200
300
400
500
600
700
800
Jan Feb March April May June July Aug Sept Oct Nov Dec
Mon
thly
dis
char
ge (M
CM
/day
)
Before
After
Figure 3.18: Average monthly fl ow of the Nile at Aswan before and after the construction of the Aswan High Dam.
Tekeze dam under contruction in 2007, Ethiopia.
62
Inte
rnat
iona
l Riv
ers
/ Flic
kr /
CC B
Y-N
C-SA
2.0

63
Roseires and Merowe reservoirs in Sudan
The Roseires dam on the Blue Nile was built for flood retention, irrigation and hydropower purposes. Since its commissioning in 1966, the reservoir’s capacity has declined by about 30 per cent due to sedimentation. It now generates a fraction of the potential hydropower available during the rainy season because the turbine intakes are frequently blocked by sediment. Dredging to remove sediment is conducted frequently (Siyam 2005).
Merowe multi-purpose dam, one of Africa’s largest hydroelectric projects was completed in 2009. It is located in north-central Sudan near the Nile’s fourth cataract. It was designed to generate about 6 000 GWh of electricity per year and to irrigate approximately 400 000 ha of crops. However despite the expected economic benefits, there have also been some negative social, environmental and archaeological costs, including significant loss of land for agriculture and human settlement.
Owen Falls dam in Uganda
The Owen Falls dam, now known as the Nalubaale dam, is located near Jinja in Uganda. It was built in 1954 to generate hydroelectricity for Uganda and Kenya. The dam controls the upstream discharge from Lake Victoria and was Uganda’s largest power station. In 1999, the Kiira Power Station extension was built about 1 km from Nalubaale, which allowed more water to be released and increased the hydropower capacity. This fact, along with a protracted drought in 2003, is thought to have contributed to the lowering of the lake to an unsustainable level (USDA 2005).
Rivers and streams: Discharge and surface flowsRivers and streams, originating from different drainage basins, form the main conduits interconnecting the various water reservoirs of the Nile Basin. There are nine sub-basins altogether: the Lake Victoria basin; the East African Lakes below Lake Victoria; the Bahr el Jebel and the Sudd; the Bahr el Ghaal basin; the Sobat basin and the Machar Marshes; the White Nile below Malakal; the Blue Nile and its tributaries; the Atbara and main Nile to Wadi Halfa; and the main Nile in Egypt (Sutcliffe and Parks 1999). These were highlighted in figure 3.2.
From Lake Victoria to the White Nile
The 23.5 BCM of water draining out of Lake Victoria comes mainly from the inflowing rivers particularly River Kagera (Fahmy 2006). From Lake Victoria, water flows into Lake Kyoga via the Victoria Nile and then into Lake Albert, where rainfall and inflow from small streams, especially the River Semliki, more than compensate for water loss by evaporation.
Outflow to the Bahr el-Jabal River from Lake Albert is about 26 BCM (Fahmy 2006). The tributaries of the Bahr el Jabal contribute considerably to the flow, supplying nearly 20 per cent of its water. The expansive swamps help to regulate the discharge and as a result it hardly differs over the year. Seepage and evaporation account for about 50 per cent of the water lost during this phase, but it is nearly made up for by inflows from the Sobat
A view over Bujagali dam in Jinja town, Uganda.
Nalubaale Power Station, often known by its old name, Owen Falls Dam, is a hydroelectric power station across the White Nile near to its source at Lake Victoria in Uganda.
Fred
rick
Ony
ango
/ W
iki C
omm
ons
/ CC
BY 2
.0
©M
ax B
ilbow
/ w
ww
.max
bilb
ow.c
om

64
River just upstream of Malakal (Willems and others 2009). Table 3.5 shows the variation in discharges at diff erent exits of the Nile.
The White Nile
The White Nile provides a regular supply of water to the Nile throughout the year, providing more than 80 per cent of its water during April and May, when the main stream’s level is the lowest. There are two main water sources for the White Nile, which supply it in equal amounts: rainfall on the East African plateau, and the Sobat River, which drains water from southwestern Ethiopia. Summer rains in Ethiopia lead to annual fl ooding of the Sobat. It is this annual fl ooding that causes the slight variations in the levels of the White Nile (Mutua and others 2011).
The Blue Nile
The Blue Nile is the outlet of Lake Tana and is the most important of the Nile’s three great Ethiopian water sources, since it brings the crucial Nile fl oods to Egypt. The tributaries Rahad and Dinder, which originate in Ethiopia, fl ow into the Nile in Sudan.
The monsoon seasons have a major infl uence on contributions to the river’s average annual fl ow, with the annual fl oods forming a major hydrological element. Since wetlands and lake-storage eff ects are not present to attenuate fl ooding in the
Blue Nile at Khartoum there is a greater potential for fl ood peaks than in the White Nile (Sutcliff e and Parks 1999). The river usually begins to rise in May in northern Sudan reaching its maximum level in August (Karyabwite 2000). It then declines to reach the lowest levels from January to May. Although the fl ood is a regular phenomenon, it varies in both its volume and in its date of onset. The fl ood is caused by the Blue Nile and Atbara rivers, but the Atbara is not a perennial river (Mutua and others 2011). During the season when the river’s water level is low, the White Nile becomes the most important stream. Figure 3.19 shows the annual fl ow patterns of the River Nile. The mean annual discharge of the Blue Nile where it joins the White Nile at Khartoum is about 54 BCM (Fahmy 2006).
The Main Nile
This starts from the point where the White and Blue Nile meet at Khartoum up to the Mediterranean Sea. It is estimated that on an annual basis 84 BCM of water fl ows to Lake Aswan in Egypt, although only 0.4 BCM are released into the sea through the Rosetta, Damietta, and other main branches along the 40-km wide delta (Fahmy 2006, Willems and others 2009).
64
The Blue Nile outlet of Lake Tana.
Ond
řej Ž
váče
k / W
iki C
omm
ons
/ CC
BY-S
A 3
.0
Locati onAverage annual discharge in km3
1961-1970 1948-1970 1912-1982
Lake Victoria exit 41.6 29.4 27.2
Lake Kyoga exit 44.1 30.1 26.4
Lake Albert exit 48.8 33.7 31.4
Mongalla (White Nile) 52.6 36.8 33.1
Malakal (White Nile) 37.8 31.6 29.6
Khartoum (Blue Nile) 45.9 49.8 50.1
Mouth of the Atbara 10.9 12.1 10.6
Dongola (Nile) 86.2 86.2 82.7
Table 3.5: Variations in discharges on the Nile
Source: Karyabwite 2000
300
400
0
200
100
500
600
700
May Jun Jul Aug Sep Oct Nov Dec Jan Feb Mar Apr
Flow
(mill
ions
of c
ubic
met
res
per
day)
BLUE NILE
RIVER ATBARA
WHITE NILE
Figure 3.19: Annual fl ow pattern of the Nile River.
Source: http://www.mbarron.net/Nile/fl owrate.jpg

65
HydrogeologyOverview of the groundwater resourcesGroundwater occurs in the transboundary aquifers, local tectonic basins and wide hydrogeological basins throughout the Nile basin. It is a strategic resource that can be used to supplement scarce surface water resources (lakes, rivers, streams, reservoirs and ponds). It is widely available in diff erent geological formations and has traditionally been used for human consumption as it is a clean and safe source.
However, there is a dearth of knowledge surrounding the groundwater resource in this region. This needs to be plugged if the resource is to be sustainably managed and utilized. For instance, the data indicates that demand and abstraction levels fl uctuate with the expansion of irrigation, industry and urban areas and is also dependant on various climatic factors. However
detailed monitoring information is required so as to manage the resources based on sound hydrogeological knowledge. Figure 3.20 shows the available groundwater storage, recharge and abstraction for the countries in the Nile basin.
Hydrogeology of the northern sectorThe northern part of the Nile basin, represented by Egypt, is characterized by a hyper arid and desert environment. The main aquifers here are the Nile delta, Nile valley, the post Nubian Carbonate aquifer and deep lying Nubian sandstone. The hydrostratigraphic arrangement commences with Nubian sandstone aquifer at depth and depending on the geographical point of emergence ends up either with Nile valley aquifer or Nile delta aquifer (fi gure 3.21).
NILE VALLEY AQUIFER NILE DELTA AQUIFER
FRACTURED CARBONATE AQUIFER
NUBIAN SANDSTONE AQUIFER
Figure 3.21: Idealized hydrostratigraphic column in the Nile basin part of Egypt.
Egyptian women carrying plastic barrels on their way to take water from the canal, Al-Borollos, Egypt.
Ond
řej Ž
váče
k / W
iki C
omm
ons
/ CC
BY-S
A 3
.0
Nas
ser N
ouri
/ Flic
kr /
CC B
Y-N
C-SA
2.0
Figure 3.20: Groundwater storage and recharge in the Nile River Basin.
0.001
0.01
0.1
1
10
100
1 000
10 000
100 000
1 000 000
10 000 000
Egypt Sudan EritreaS.Sudan Ethiopia DR.Congo Rwanda BurundiUganda Kenya
Gro
undw
ater
sto
rage
and
gro
undw
ater
rech
arge
Recharge (BCM/yr) Storage (BCM/yr) Abstraction (MCM/yr)
U.R. ofTanzania
Note: Storage is in BCM while recharge and abstractions are in MCM.

66
Nubian aquifer system
The geological setting and the hydrogeology of the Nubian sandstone aquifer system are discussed in detail in Ambroggi (1966), Klitzsch and others (1979), Klitzsch and Lejal-Nicol (1984), Klitzsch and Squyres (1990), Thorweihe (1990), Meissner and Wycisk (1993) and CEDARE (2001) among others. It is a complex aquifer system that provides water to artesian wells and springs over a large part of Egypt. The aquifer system consists of a thick sequence of coarse clastic sediments of sandstone, sandy clay interbedded with shale and clay beds (Elewa 2006). The groundwater in the Nubian aquifer occurs under confined to semi-confined conditions in most localities where the upper layers of the Nubian formation consist mainly of confining layers of shale and clay. This system encompasses the area of the western desert and passes underneath the Nile valley into the eastern desert. In a large part of Egypt the Nubian aquifer is capped by a thick cover of Upper Cretaceous-Eocene shale and carbonate complex that confines the system (Idris and Nour 1990). The question of whether or not recent recharge is taking place across the Nubian aquifer system remains controversial, though there is general agreement that no recent large scale recharge is taking place and if so, then only locally.
The 14C dating for the Nubian groundwater ranges from 10 000 to 44 000 years (Shata and others 1962, El Kashouty and Abdel-Lattif 2010, Kehinde and Loehnert 1989). In southern Egypt, the interconnection of the Nile River and the Nubian aquifer is marked by Lake Nasser, which has resulted in a substantial rise in groundwater levels in the adjacent Nubian aquifer (Lloyd 1990). Prior to the construction of the Aswan High Dam, it was estimated that about 5 x 10⁶ m3/yr of river water was seeping into the aquifer (Abdel Moneim 2005). Since its completion in 1968 the lake levels have been regulated at between 165 and 178 masl. Consequently, the seepage into the Nubian aquifer is occurring at a greater rate
(Abdel Moneim 2005). It has been estimated for both sides of the lake, to be in the order of 1.5 x 10⁹ m3/yr of which about 50 per cent is directed to the eastern bank. Stable isotope evidence indicates modern Nile River water influences do not exceed 15 km away from the river (Lloyd 1990).
Environmental isotopes and hydrochemical techniques revealed that the main bulk of water is ‘fossil’ and that contributions from recent recharge are insignificant (Robinson and others 2007) which shows that the Nubian basin has not received, at least in the part of Egypt, appreciable recharge for the last 4 000 years, and the system since then has been under unsteady conditions where groundwater flows from areas of high potentiometric levels to areas where natural or artificial outflows occur. The stable isotope results indicate that recent recharge to the groundwater aquifer is limited to wells near to the Aswan High Dam lake and up to a maximum distance of about 10 km (Aly and others 1993). The groundwater flow from Libya to Egypt is about 3.782 x 10⁶ m3/yr (El Kashouty and Abdel-Lattif 2010).
The area occupied by Lake Nasser is dominated by faulting which acts as a conduit for groundwater recharge and circulation from the lake water (figure 3.22). Faults and joints are the main passage for artesian springs and mound-springs in the depression areas (Lamoreaux and others 1985).
The direction of groundwater flow in the Nubian aquifer is generally SW-NE (figure 3.23) but is locally distorted at faults and fracture zones (Nour 1996). The groundwater velocity through the Nubian sandstone is in the order of 15 m/yr (Robinson and others 2007) with a gradient of 0.5 m/km (El Tahlawi and others 2008). The natural discharge from the Nubian aquifer takes place on a larger scale, primarily through deep-seated fault systems that act as pathways for ascending groundwater into relatively thick alluvial aquifers proximal to the fault complex that defines the
Figure 3.22: Tectonic setting.
Source: Elewa 2006
Figure 3.23: Groundwater flow in the Nubian aquifer.
EGYPTLIBYA
SUDAN
CHAD
1000 200Kilometres
Nm e d i t e r r a n e a n s e a
Source: Thorweihe and Heinl 2002

67
Nile River (Sturchio and others 1996, Sultan and others 2007). The thickness of the aquifer varies between 500 m close to Lake Nasser to 2 km in the Nile valley (figure 3.24) (Thorweihe and Heinl 2002).
The NW–SE and N–S faults define horst and graben structures beside synclinal deformation of rocks that could play a significant role in the occurrence and circulation of groundwater in this part of Egypt. This could indicate potential recharge into these local tectonic depressions takes place from the high rising Red Sea hills in the Eastern Desert. The understanding from the reviewed geological and hydrogeological papers is that the lithological architecture is tectonically controlled as portrayed in figures 3.25 and 3.26.
Carbonate aquifer system (Post Nubian)
The carbonate aquifer system (Eocene-Upper Cretaceous) covers a large part of Egypt extending from the Western Desert into the Eastern Desert overlying the Nubian sandstone aquifer and underlying the Nile valley aquifer system. The thickness of the carbonate aquifer varies from 200 m (at Farafra oasis) to about 900 m (at Siwa oasis) and the depth to groundwater ranges between 5 and 95 m and decreases in the direction of the Nile valley floodplain (Heleika and Niesner 2008). The system is recharged mainly through upward leakage from the underlying
Nubian sandstone aquifer; groundwater flow from adjacent formations such as Moghra; and infiltration from surface sources like irrigation and rainfall (Abdel Moneim 2005, Khater 2002, Dawoud 2004).
The fractured limestone aquifers are mainly represented by the thick extensive multi-horizon succession of carbonate rock facies, sandstones, shale and clays located within the Nile basin. The analysis of pumping test data indicates that the hydraulic conductivity, the storativity and the transmissivity of the Middle Miocene aquifers are 4.31 m/day, 1.2 x 10⁻³, and 70 m2/day respectively (Abdel Moneim 2005). The outcrop of the top portion of the fractured limestone is dotted by at least 200 springs which have a total flow of about 200 000 m3/day (El Tahlawi and others 2008). The presence of potential recharge areas shows that the productivity in the carbonate aquifer is a renewable resource.
The Nile valley system
The Nile valley aquifer system is made of alluvial deposits located south of the Nile delta. It has two layers with distinct hydraulic properties. The upper layer, covering 70 per cent of the floor of the valley, is formed of a clay-silt member. It extends laterally, having greater thickness near the river channel and disappearing towards the edges (Idris and Nour 1990). Recharge to the aquifer comes from two sources: mainly through infiltration of the rainwater in the drainage basins of the Wadis and also from upward leakage from the underlying deep aquifer. The water
Figure 3.25: W-E hydrostratigraphic cross-section in central Egypt.
Source: Adapted from IHP-UNESCO 2001 model
Figure 3.26: Three dimensional section representation of hydrostratigraphic units in the northern part of the Nile basin.
Nile Valley
HYDROGRAPHIC BASIN
HYDROGEOLOGICAL BASINRed Sea Hills
Kharga
W
E
500 m.b.s.l
0 m.a.s.l
500 m.a.s.l
1 000 m.a.s.l
2 000 m.b.s.l
1 500 m.b.s.l
1 000 m.b.s.l
40Kilometres
800Carbonate aquifer system
Nubian aquifer system
Basement complex
Alluvial aquifer
Shale
Source: Section modified from RIGW 1992
Figure 3.24: Thickness of the Nubian aquifer system.
3 000 2 00
0
3 500
3 00
0
2 50
0
5001 000
1 500
2 000
1 500
1 50
0
1 00
050
0
2 000
1 00
0
500
EGYPT
SUDAN Kilometres0 100 200
200
Saline/freshwaterinterface
Thickness inmetres
Basement
Legend
Source: Thorweihe and Heinl 2002

68
exchange between the two aquifer segments influences the recharge-discharge relationship as well as the water quality (Abdel Moneim 2005).
Since the construction of the Aswan High Dam, recharge to the alluvial aquifer takes place by vertical percolation of irrigation water and canal loss. As with the Nile delta aquifer, the groundwater level in Upper Egypt has risen due to the introduction of perennial irrigation. The head has risen even further with the construction of the Aswan High Dam reaching 2 m or more in some places leading to water logging and salinity problems in several parts. The Nile valley aquifer is bounded by normal faults that generate a graben structure for the deposition of alluvial sediments. These faults are mainly represented by a number of major NW–SE faults together with a few NE–SW faults (Heleika and Niesner 2008). The maximum thickness of the floodplain aquifer occurs in the central part of the valley which varies between 250 and 300 m (Lennaerts and others 1988). The average horizontal hydraulic conductivity of the aquifer is about 70 m/day (Attia 1985). The
transmissivity of the aquifer is as high as 18 000 m2/day in the central part of the valley (Dawoud and others 2006).
The Nile delta aquifer system
The main aquifer in the Nile delta is an alluvial aquifer which is located in the floodplain, along the coastal and the rolling plains. The alluvial aquifer is of two types: leaky aquifer to the south and semiconfined to the north (figure 3.27). The saturated section of fresh water attains a mean thickness of 300 m and an area of
LakeIdku
Lake Burullus
Lake Manzalla
Leaky water in Holocene deltaic sands,underlain by semi-confined water in EarlyPleistocene deltaic sand and gravel
Semi-confined water in Early Pleistocene sands and gravel
Legend
0 20 40
N
Medit e r ranean Sea
EGYPT
Kilometres
Figure 3.27: Aquifer type in Nile delta.
Table 3.6: Groundwater availability in different aquifers of Egypt.
AquiferGroundwater recharge
(m3/yr)Groundwater discharge
(m3/yr)Groundwater storage (m3)
Groundwater abstracti on (m3/yr)
Nubian aquifer
Insignifi cant =0.43 – 0.95 x 106 = 258 x 1012 Limited
Carbonate aquifer
• From the underlying Nubian system• Occasional rainfall• Percolati on from runoff
=73 x 106
(El Tahlawi and others 2008)
=25 x 1012 Not known
Nile valley aquifer
=1.34 x 10⁹
(Shahin 1987)=4.7-17.7 x 10⁶ (Gheith and Sultan 2002)
=1.33-2.67 x 10⁹ (Shahin 1985)=2-2.5 x 10⁹
(Shahin 1987)
=1 210 x 1012 =1.3 x 10⁹ (Idris and Nour 1990)
Nile delta aquifer
=6.4 x 10⁹ (El Kashef 1983)=3.8 x 10⁹ (Shahin 1983)=35 x 109 (Shahin 1985)
• Into Mediterranean sea• Through wells into drainage system• Evapotranspirati on from groundwater
=3.6 x 10¹²
(Allawa and others 2002)
= 1.6 x 10⁹ (Idris and Nour 1990)
Source: RIGW 1992

69
12 000 km2 (Shahin 1987, Dawoud 2004, El Tahlawi and others 2008, Elewa and El Nahry 2009).
This aquifer covers the whole Nile delta with a great thickness ranging between about 200 m in the southern part to 1 000 m in the northern parts, while the depth to groundwater head is about 0-5 m.
Present recharge to the delta aquifer system is mainly through infiltration from the irrigation canals and by excess irrigation in traditionally cultivated lowlands and reclaimed desert areas (Idris and Nour 1990, Geirnaert and Laeven 1992). Discharge of groundwater takes place through four processes: outflow into the drainage system, direct abstraction, evapotranspiration and inter-aquifer flow of groundwater as shown in table 3.6.
Hydrogeology of the central sectorThe central part of the Nile basin (Sudan, Ethiopia and Eritrea) has an important hydrogeological role through regional recharge from the Ethiopian plateau (one of the Nile basin water towers)
and discharge in vast lowlands of Sudan. The aquifers are primarily composed of crystalline basement rocks, sedimentary rocks, volcanic rocks and alluvial sediments.
Groundwater in Sudan
A large part of Sudan is dependent on groundwater for domestic, industrial and agricultural use. According to Omer (2002), 80 per cent of the population relies on groundwater resources for various activities. Hydrogeologically, the important basins in Sudan are rift bounded along the Nile such as the Nubian in the White Nile rift, the Gezira and Soba in the Blue Nile rift, the Atbara and Gash in the Atbara rift and the Sudd in Bahr El Arab rift in South Sudan. The 14C dating for groundwater from deep wells in Khartoum and the surroundings suggest the groundwater age is between 20 000 to 45 000 years indicating it was formed during the late Pleistocene time (Mabrook and Abdel Shafi 1977, El Tohami 1978, Adamson and others 1980, Thorweihe 1982, Kheir 1986, Vrbka 1996, Abdalla 2009a). The main aquifers are represented by the Nubian sandstone aquifer, Omdurman formation and Umm Ruwaba formation (Hussein and Awad 2006).
Alb
ert G
onza
lez
Farr
an /
UN
Pho
to /
CC B
Y-N
C-N
D 2
.0
A woman uses a Water Roller for easily and efficiently carrying water.
69

70
The sediments of the Umm Ruwaba formation lie unconformably over the Basement Complex and the Omdurman formation (Hussein and Awad 2006) as shown in figure 3.28.
The aquifer system is composed of two parts. The upper one which is partially confined includes mainly the Upper Gezira formation, the upper most part of the Omdurman formation and the alluvial deposits. The lower one, which is mostly confined, is developed mainly in the lower Gezira formation and the lower part of the Omdurman formation. The thickness of the upper aquifer increases southwards up to 120 m, whereas that of the lower one varies between 150 and 500 m (Farah and others 1997). The depth to the top of the lower aquifer exceeds 300 m, except in the northern part where it is less than 50 m (Farah 1999). The transmissivity and the hydraulic conductivity of Gezira and Omdurman aquifers are 368.7 m2/day and 34.03 m/day; and 407.2 m2/ day and 43.17 m/day respectively (Elkrail and others 2004).
The extent of the groundwater basin is determined by the geological structures (faults, joints, dikes) and the architectural setup of lithological units. In Sudan, most are rift controlled (structurally controlled) rather than lithologically controlled and are very wide. There are eight major groundwater basins (figure 3.29). These are the Sahara Nile, Nuhui, Atbara River, Sudd, Western Kordofan, Baggara, Gedaref basin (Basaltic Aquifer) and the Blue Nile groundwater basins.
Sahara Nile basin
This basin covers the northern part of northern Kordofan state and extends from north of Khartoum to the Egyptian border. The areal extent is about 273 980 km2. The groundwater fluctuations, together with the environmental isotopes, indicate that the main source of recharge is from the Nile River, together with the underflow from the Blue Nile basins. The amount of water recharged annually is estimated to be 136 x106 m3 (Omer 2002). The outflow from this basin is at the northern border of Sudan and is estimated to be about 7.3 x 10⁶ m3 (Omer 2002).
Nuhui basin
The Nuhui basin covers an area of 6 798 km2 in the central part of northern Kordofan state. The annual recharge is estimated to be 15.4 x 10⁶
m3. The depths of water levels range from 75 to 120 m (Omer 2002). The wells, with an average discharge of 20 l/s each, tap a deep semiconfined to confined aquifer of fluvial silisiclastics deposited in the Tertiary-Pleistocene. A total of 35 x 106 m3/yr can be extracted from the deep aquifer to supply El Obeid city (Abdalla 2009b). The total thickness of the shallow aquifer varies between more than 100 m in the northwest to around 50 m in the southeast with an average thickness of about 70 m. The aquifer represents a closed system where groundwater flows from the west and
Figure 3.28: W-E hydrogeological cross-section close to the White and Blue Nile Rivers.
Nubian aquifer Basement complex Umm Ruwaba aquifer Ondurman aquifer 0 157.5Kilometres
White Nile river Blue Nile river
100 m.a.s.l
200 m.a.s.l
300 m.a.s.l
400 m.a.s.l
Source: Hussein and Awad 2006
NEGYPT
LIBYA
SUDAN
SOUTH SUDAN ETHIOPIA
CHAD
DEMOCRATIC REPUBLIC
OF THE CONGO UGANDAKENYA
ERITREA
CENTRALAFRICANREPUBLIC
AdministrativeBoundary
A
B
E
F
D
G
H C
0 150 300Kilometres
F
National boundary
Lake
River
Groundwater basin
LegendAdministrative
Boundary
A - Sahara Nile BasinB - Nuhui BasinC - Atbara River BasinD - Sudd Basin (South Sudan)E - Western Kordofan BasinsF - Baggara BasinG - Blue Nile BasinH - Gedaref Basin
Figure 3.29: Groundwater basins in Sudan.
Source: Adapted from Omer 2002

71
northwest to the east under a hydraulic gradient of 8 x 10⁻⁴ and is discharged through the process of evapotranspiration (Abdalla 2009b).
Atbara River basin
It extends north to the Abu Haraf water divide up to the Atbara River, covering an area of 23 896 km2, and is bounded by the Nile in the west and the basement to the east. In the Gash River basin of Sudan, the annual sustainable abstraction rate as groundwater pumpage should not exceed 156 x 106 m3 (Elkrail and Ibrahim 2008).
Sudd basins
This is the largest basin in southern Sudan. It covers an area of 365 268 km2, extending from south of Bahr El Arab in a south-easterly direction down to Juba, and north-east up to Renk. Two major basins are connected to this aquifer and their outflow recharges the Baggara basin from the western part of Sudan and the eastern Kordofan basin from the central part of Sudan.
The main geological unit which forms this basin is the Umm Ruwaba, which consists of fine sediments. The Sudd and most of the White Nile basins contain saline groundwater rendering them unfit for human use. The importance of the Umm Ruwaba sedimentary basin, stems from the fact that it extends along the rich Savanna belt. The groundwater in the Sudd basin is in a closed basin. The water levels are near the surface and range from 10 to 25 m. The groundwater movement is towards the central part of the basin. The annual recharge is 341 x 106 m3, the amount of water under permanent storage is 11x109 m3, and the extraction rate is 1.8 x 10⁶ m3/yr (Omer 2002).
Western Kordofan basin
The western Kordofan basin covers the central part of northern Kordofan state from north of El Obeid, extending in a south-easterly direction down to the White Nile. The surface area of the basin is 68 392 km2. The geological formation is represented mainly by Umm Ruwaba, which is covered by sand dunes. The water levels range from 50 to 75 m in the northern part of the trough. The main recharge is from the White Nile, and also from the surface flow during the rainy season. The annual recharge is about 15 x 106 m3, and the basin storage is 1 730 x 106 m3 (Omer 2002).
Baggara basin
This basin covers nearly the whole area of southern Darfur state and the western part of southern Kordofan state. The area is about 141 316 km2. The water levels range from 10 to 75 m, and the deepest water levels are in the central part of the aquifer. Groundwater moves from the north, east and west towards the central part of the aquifer. The annual recharge is 155x106 m3. The basin storage is 7 110 x 106 m3 whereas the extraction rate is 11.9 x 10⁶ m3/yr (Omer 2002).
Blue Nile basin
The Blue Nile basin covers areas between the River Rahad and the Blue Nile in the Blue Nile state, extending over an area of 75 808 km2. The
water levels range from a few metres near the rivers to a maximum of 50 m away from the stream. The basin storage is 2 270 x 106 m3, and the annual recharge is 70.9 x 10⁶ m3 (Omer 2002). In Sudan, groundwater occurs in the Blue Nile basin in two main water-bearing layers, a lower semi-confined to confined aquifer, the Nubian sandstone formation and an upper unconfined to leaky aquifer, the Al-Atshan Formation. Groundwater occurs at an average depth of 22-30 m from the ground surface (Hussein 2004). The Blue Nile River is a losing river in the territory of Sudan by recharging the nearby aquifers.
Gedaref basin (Basaltic Aquifer)
The basin covers the central part of Kessala state, extending over an area of 28 016 km2. The basin is formed mainly of Nubian sandstone formation and basalts. The water levels range from 50 to 75 m and the groundwater circulation is in a north-westerly direction. The basin storage is about 700x106 m3. The annual recharge is 41.7 x 10⁶ m3, and the extraction rate is 1.2 x 10⁶ m3/yr. The saturated thickness of the aquifer varies between 200-500 m. The recharge is mainly from the water seeping into the mudstone formation from the River Setit (branch of River Atbara). The basin receives some underflow (about 12 x 106 m3/yr) from an adjacent basin (Omer 2002). With the exception of recharge from the Nile to about 30 km in Sudan, groundwater in the Nubian aquifer is fossil water (Kheir 1986, Haggaz and Kheirallah 1988, Vrbka 1996, Abdalla 2000, Abdalla 2008). Based on hydraulic properties of aquifers, the maximum distance from which the Nile would be capable of recharging the neighbouring aquifers in Sudan is 30 km. However, Haggaz and Khairallah (1988) suggested a maximum distance of 13 km at the confluence of the Niles (Abdalla 2008). A summary of groundwater availability in the different basins in shown in table 3.7.
Table 3.7: Groundwater availability in different basins of Sudan.
AquiferGroundwater
recharge (m3/yr)
Groundwater discharge
(m3/yr)
Groundwater storage
(m3)
Groundwater abstracti on
(m3/yr)
Sahara Nile groundwater zone
=136 x 106 Into Egypt = 7.3 x 106
=82 x 1012 7.3 x 10⁶
Nuhui groundwater zone
=15.4 x 10⁶ Boreholes =1 220 x 109 1.6 x 10⁶
River Atbara groundwater zone
=1.50 x 10⁸ Basefl ow =2 990 x 109 2.3 x 10⁶
Sudd groundwater zone
=341 x 106 WetlandsBasefl ow
=100 x 1012
=11 x 109 1.8 x 10⁶
Western Kordofan groundwater zone
=15 x 106 Boreholes=22 500 x 109
=1.73 x 10⁹ 1.76 x 10⁶
Baggara groundwater zone
=155 x 106 Boreholes=46 000 x 109
=7.11 x 10⁹ 11.9 x 10⁶
Blue Nile groundwater zone
=70.9 x 10⁶ BoreholesBasefl ow
=2.5 x 109
=2.27 x 10⁹ 10.2 x 10⁶
Gedaref groundwater zone
=41.7 x 10⁶ (Omer 2002)-From adjacent basin=12 x 106
Boreholes=7 700 x 109
=700 x 106 1.2 x 10⁶
Gezira groundwater zone
=100 x 109 Evapor-tanspirati on loss-wells
=5 162 x 109
=38 000 x 109 =5 x 10⁹
Gash groundwater zone
=560 x 106
=0.38 x 109
=19.8 x 106
=355 x 106 =250 x 109
=502 x 106
=132 x 106
=365.98 x 10⁶
Umm Ruwaba 582 x 109 22 000 x 109 40 x 109

72
Ethiopia
The part of Ethiopia that drains towards Sudan is represented by three different sub-basins: the Blue Nile, Tekeze and Baro-Akobo River basins. The Blue Nile basin, with an aerial extent of 199 800 km2, is located in the north-western Ethiopian plateau where the annual rainfall varies between 1 000 and 2 000 mm. The Tekeze River basin, with an area of 63 376 km2, is located in the northern part of the Blue Nile basin. It joins the Atbara River, the last tributary of the Nile, in Sudan. The Baro-Akobo River basin has an area of 75 910 km2. It is located south of the Blue Nile basin, flows into Sudan and forms the River Sobat which later joins the White Nile.
The lithological architecture due to tectonic fracturing and deformation have resulted in favourable conditions for the groundwater circulation from the Blue Nile basin to flow southward into the main Ethiopian Rift which eventually reduces the storage of the groundwater basin of the Blue Nile. The main feature of aquifers in the Blue Nile basin is compartmentalization due to Pliocene-Quaternary faulting and dike swarms (basaltic and acidic) that intersect different lithologies in the area. In general, high rainfall on the shield volcanoes and the large lateral extent of the aquifers on the plateau favours shallow groundwater storage (Abiye and Kebede 2011). The main aquifers are made up of highly fractured basaltic rocks with multi-layer aquifer system and alluvial sediments on the low lands and the Lake Tana graben. The main aquifer localities on the eastern and northern side of Lake Tana include Dembia plain, thick Tertiary and Quaternary sequence of Gilgel Abbay catchment, among others. The thickness of the alluvial sediments is estimated to be over 50 m (Abiye and Kebede 2011). Even if rainfall is high in the highlands, high groundwater storage areas are found in the lowland terrains due to fast groundwater circulation within the volcanic rocks.
Deep wells in the basin tap groundwater from transboundary aquifers made of sedimentary and volcanic rocks due to intensive fracturing, weathering and the availability of summer recharge from the northwest Ethiopian highlands. The rivers that cross the Ethiopia-Sudan border are characterized by very high discharge during the wet season and very low discharge during the dry season. In general, the presence of high discharge rivers and rainfall in the area sustains the groundwater recharge into the transboundary aquifers of the border area (Abiye 2010).
The well depth in the basaltic plateau ranges from 30 m -120 m where the aquifer thickness varies between 200 and 250 m. Pump test results show that the transmissivity is highly variable ranging from 1 to 700 m2/day. The Quaternary basalts surrounding Lake Tana are characterized by high transmissivity (100-200 m2/day) compared to the basalts of the trap series. Quaternary alluvial sediments have the highest transmissivity (in places more than 700 m2/day). The metamorphic rocks in the western lowland have the lowest transmissivity (as low as 1 m2/ day) (BCEOM 1999). The wide range of stable isotope composition in the groundwater of the Blue Nile River Basins and their low salinity is the result of lack of appreciable mixing between the different aquifers.
The groundwater in the basin is characterized by shallow depth and rapid circulation. Such characteristics are also favoured by intensive summer rainfall that generates surface runoff than recharge.
The depletion of stable isotopes compared with the weighted average of the summer rainfalls shows that selective recharge by heavy rainfalls of July and August is the principal source of groundwater replenishment (Kebede and others 2005, Abiye and Kebede 2011). Groundwater availability in the Blue Nile part of Ethiopia is shown in table 3.8.
Eritrea
The water supply of Eritrea is almost all dependent on groundwater resources. The western part of Eritrea that falls in the Nile River Basin has an aerial extent of about 24 920 km2 and is drained by the River Gash which is located on crystalline basement rocks. The most important river course is the Tekeze-Setit, at the border with Ethiopia, with more than 90 per cent of its catchment situated inside Ethiopia. Estimates of mean annual flow of the Setit at the border with Sudan varies between 6 x 10⁹ and 8 x 10⁹ m3/ yr (FAO 1995). The region receives rainfall of 200-500 mm/yr and evapotranspiration is close to 1 900 mm/yr (Zera 1996).
The yield in the different rock systems is: 105 L/min in the basalts, 81.5 in the foliated metamorphic rocks, 75 in the alluvium, 70 in the granitoids and 32 L/min in the nonfoliated metamorphic rocks (Solomon and Quiel 2006). The primary porosity due to columnar, sheet jointing and vesicles is what contributes to the high yield in the basalts. An analysis of the metamorphic rocks shows that the foliated varieties are more permeable than the non-foliated ones due to foliation planes, which enhance permeability (Solomon and Quiel 2006). According to Vasudevu (2009) there are about 22 boreholes in the Gash basin (table 3.9) with depth
Table 3.9: Groundwater availability in the Gash basin of Eritrea.
AquiferGroundwater
recharge(m3/yr)
Groundwaterdischarge
(m3/yr)
Groundwaterstorage
(m3)
Groundwater abstracti on
(m3/yr)
Gash aquifer =553.6 x 10⁶ - Boreholes =249 x 109 =2.4 x 10⁹
Cars
ten
ten
Brin
k / F
lickr
/ CC
BY-
NC-
ND
2.0
Women gathering water from a well, Eritrea.
Table 3.8: Groundwater availability in Blue Nile part of Ethiopia.
AquiferGroundwater
recharge(m3/yr)
Groundwaterdischarge
(m3/yr)
Groundwaterstorage
(m3)
Groundwater abstracti on
(m3/yr)
Blue Nile aquifers
=3.15 x 109 =2 x 109 =3.45 x 109 =4.25 x 1012 =50 x 106
Baro/Akobo aquifers
=3 x 10⁹ -Wetland-Basefl ow
=5.7 x 1012 = 3 153.6 - 31 536
Tekeze basin = 1.6 x 10⁹ Springs =950 x 106 Not knownNote: The current abstraction in the Baro-Akobo basin is for rural water supply. There is no major abstraction in that basin.

73
that varies between 20 and 104 m and yields 0.1 to 17 L/s (mean 3.5 L/s) of groundwater. The main aquifers are alluvial sediments and fractured granites. Due to the remoteness of the area, the groundwater resource is not well developed.
Hydrogeology of the Equatorial Lakes region The parts of the Equatorial Lake region countries (Burundi, DRC, Kenya, Rwanda, the United Republic of Tanzania and Uganda) which fall within the Nile basin are primarily covered by crystalline basement rocks. In most cases, local communities tap groundwater from shallow wells except where boreholes have been drilled to depths of more than 100 m. Where there is a thick weathered zone above the hard rocks, the regolith may store considerable volumes of groundwater, due to its high porosity. The majority of groundwater occurs either within fractures in the hard rock or within the weathering profile.
This region is one of the water towers of the Nile basin. Due to high base flow, the flow of the White Nile is maintained even during the dry season. The natural headwater reservoir in the Equatorial lakes region is Lake Victoria, fed primarily by River Kagera which has its catchment in Burundi, Rwanda, Uganda and the United Republic of Tanzania in addition to runoff from
south-western Kenya. Most importantly, the perennial flow of the Nile is guaranteed by the storage in Lakes Tana and Victoria. Given the importance of Lake Victoria to the River Nile and in light of its transboundary nature, the need to adopt a regional approach to its management and sustainability is a major developmental challenge.
Uganda
Despite Uganda’s significant water resources, their spatial and temporal variability often renders many parts of the country water stressed over long periods of the year. The country encompasses both humid and semi-arid areas and there are not only significant differences between wet and dry years, but also considerable variations in the onset of the rainy seasons (Tindimugaya 2010). The main aquifers in Uganda are the weathered aquifer, fractured-bedrock aquifer and alluvial aquifer that cover 90 per cent of the country. The hydrogeology is characterized by fluvial sediment aquifers along river channels and weathered-fractured bedrock aquifers. The weathered aquifer is unconfined whereas the fractured-bedrock aquifers are leaky in nature. The alluvial aquifers along river valleys are unconfined, highly permeable and relatively homogeneous. Aquifers in Uganda have low transmissivity and storativity values ranging between 14 and 34 m2/day and 0.014 and 0.21 respectively. Groundwater movement in the
wew
anna
/ Fl
ickr
/ CC
BY-
NC-
ND
2.0
Gathering water from a newly installed water pump, Uganda.

74
crystalline rocks takes place within joints and fractures, the matrix being essentially impermeable (while the flow in the massive basement aquifers is entirely due to secondary permeability in the form of fractures (Howard and others 1992). Borehole yields in Uganda range between 0.1 and 50 m3/hr and are low in areas underlain by weathered and fractured bedrock aquifers and high in areas underlain by fluvial sediments in palaeochannels (Tindimugaya 2010).
Taylor and Howard (1996) determined annual groundwater recharge in the Aroca catchment of the Victoria Nile, in central Uganda, to be 200 mm/yr, using a soil moisture balance model and isotope data. The overlying unconsolidated material is the product of deep, in-situ weathering. Sand-sized clasts predominate at the base and form an aquifer that is in order of magnitude more transmissive (5-20 m2/day) than underlying bedrock fractures (about 1 m2/day) (Howard and others 1992). The weathered mantle, overlying fractured bed-rock, has a regular thickness of about 30 m (Taylor and Howard 2000). Figure 3.30 demonstrates the presence of dominantly shallow groundwater circulation within the weathered upper part of basement complex rocks. Groundwater availability in the Nile basin part of Uganda is shown in table 3.10.
Kenya
The Lake Victoria basin within Kenya has an areal extent of 46 230 km2, mean annual rainfall of 1 260 mm with an annual basin runoff volume of 13.8 x 10⁹ m3 (NBI 2005 , Olet and others 2006). This basin includes the area west of the Rift Valley draining into Lake Victoria and Lake Kyoga through numerous perennial rivers. The Lake Victoria basin in Kenya covers only 8.5 per cent of the total surface area but it contains over 50 per cent of the national water resources (FAO 2003). Rivers discharging directly into Lake Victoria include Nzoia, Yala, Nyando, Sondu-Miriu and Gucha-Migori. The Mara River crosses the boundary of Kenya and discharges into Lake Victoria through the United Republic of Tanzania. The main aquifers in the Lake Victoria basin are Tertiary volcanic on the upstream side and fractured granites and weathered basement rocks close to the lake. The groundwater recharge has been extrapolated from neighbouring Uganda with the same tectonic (200 mm/yr and 30 m saturated thickness for the
weathered aquifer). Groundwater availability in the Nile basin part of Kenya is shown in table 3.11
Democratic Republic of the Congo (DRC)
The areal extent of the Nile basin in the DRC is about 22 143 km2. This basin is bounded to the north by the watershed of River Oubangui, in the east by the mountain ridge, which marks the edge of the African Rift, in the south and southeast by the Kasai and Shaba plateaus and in the west by the Mayumbe hills. Groundwater recharge is assumed similar to Uganda at 200 mm/ yr and saturated thickness of 30 m for the weathered basement aquifer. Groundwater availability in the Nile basin part of DRC is shown in table 3.12
Burundi
The landscape of the Nile basin in Burundi is characterized by hills and mountain chains with wetlands, lakes and springs distributed along valleys. The areal extent of Burundi that falls in the Nile River Basin is about 13 260 km2. Groundwater exploitation is limited especially since Burundi’s aquifer has only a modest yield. In some areas such as Bugesera there is a serious lack of potable water. Here the population relies heavily on groundwater resources which are tapped through hand-dug wells. Groundwater discharge is through base flows as springs into rivers, swamps and lakes. (table 3.13).
Figure 3.30: W-E Hydrogeological cross-section in Uganda.
1 000
1 400
1 800
2 200
2 600
3 000
Met
res
abov
e se
a le
vel (
m) DRC
Western Rift
Ruwenzori
UGANDA
L. Victoria
Basement complex
WeatheredBasement complex
KENYA
Eastern Rift
Volcanics
Table 3.11: Groundwater availability in the Nile basin part of Kenya.
AquiferGroundwater
recharge(m3/yr)
Groundwaterdischarge
(m3/yr)
Groundwater storage
(m3)
Groundwaterabstracti on
(m3/yr)
Volcanic and weathered crystalline aquifer
=9.2 x 10⁹
- Basefl ow- Springs- Wetlands- Lake
=1.4 x 10¹² Not known
Table 3.12: Groundwater availability in the Nile basin part of the DRC.
AquiferGroundwater
recharge(m3/yr)
Groundwaterdischarge
(m3/yr)
Groundwaterstorage
(m3)
Groundwater abstracti on
(m3/yr)
Weathered basement aquifer
= 4.43 x 10⁹
- Springs- Wetlands- Lakes- Boreholes
=664.3 x 10⁹ Not known
Table 3.13 : Groundwater availability in the Nile basin part of Burundi.
AquiferGroundwater
recharge(m3/yr)
Groundwaterdischarge
(m3/yr)
Groundwaterstorage
(m3)
Groundwater abstracti on
(m3/yr)
Weathered basement aquifer
=3.1 x 10⁹
- Springs- Wetlands- Lakes- Boreholes
=331.5 X 10⁹ 7.74 x 10⁹
(whole country)
Table 3.10: Groundwater availability in the Nile basin part of Uganda.
AquiferGroundwater
recharge(m3/yr)
Groundwaterdischarge
(m3/yr)
Groundwaterstorage
(m3)
Groundwater abstracti on
(m3/yr)
Weathered crystalline and alluvial system
=46 x 109
- into lakes- wetlands- basefl ow- Springs
=6.9 x 1012 =2.7 x 10⁹

75
Rwanda
The hydrology of Rwanda is characterized by a dense network of small lakes, rivers and wetlands falling into two major drainage basins — the Nile River Basin in east (67 per cent) and the River Congo basin to west (33 per cent) (Harding 2009). The Rwandan Nile basin landscape is characterized by hills and mountain chains with wetlands, lakes and springs distributed along valleys. The main rivers in the Nile basin portion of Rwanda are: Mwogo, Rukarara, Mukungwa, Base, Nyabarongo and the Akanyaru (which is drained by River Nyabarongo eventually becoming River Kagera at the outlet of Lake Rweru). The impermeable nature of the crystalline rocks favours the occurrence of surface water bodies through the reduction in effective recharge into the aquifer. The main aquifers are weathered crystalline rocks which limit groundwater circulation to the shallow zone. The available groundwater information estimates that the discharge for the available resource is 66 m3/s. In that discharge, there are 22 000 recognised sources, which have a discharge of 9.0 m3/s, of which the population consumes only 10 per cent (NBI 2005). Groundwater availability in the Nile basin part of Rwanda is shown in table 3.14.
United Republic of Tanzania
The areal extent of the United Republic of Tanzania that falls in the Nile basin is about 84 200 km2. Groundwater occurrence in basement complex rocks is largely limited to secondary structures such as weathered zones, joints, fractures and faults. The transboundary aquifer type in the basement complex is metasediments aquifers that are dominant in the west of the United Republic of Tanzania. This type of aquifer crosses the border into Burundi, Rwanda and parts of northern DRC (Mapanda 2002). The groundwater recharge in the Singida region of northern United Republic of Tanzania is between 10-50 mm/yr (MacDonald and others 2009). Groundwater availability in the Nile basin part of the United Republic of Tanzania is shown in table 3.15.
Table 3.14: Groundwater availability in the Nile basin part of Rwanda.
AquiferGroundwater
recharge(m3/yr)
Groundwaterdischarge
(m3/yr)
Groundwaterstorage
(m3)
Groundwater abstracti on
(m3/yr)
Weathered basement aquifer
=3.98 x 10⁹
- Springs- Wetlands- Lakes- Boreholes
=596 X 109 Not known
Table 3.15: Groundwater availability in the Nile basin part of the United Republic of Tanzania.
AquiferGroundwater
recharge(m3/yr)
Groundwaterdischarge
(m3/yr)
Groundwaterstorage
(m3)
Groundwater abstracti on
(m3 /yr)
Metasedimentary aquifer
=4.2 x 10⁹ - Boreholes =2.5 X1012 =0.22 x to 0.365 x 10⁶
Adam
Jone
s / F
lickr
/ CC
BY-
SA 2
.0
Nyabarongo River scene outside Kigali, Rwanda.

76
ReferencesAbdalla, O. (2009a). , Groundwater modeling in semi-arid Central
Sudan: adequacy and long term abstraction. Arabian Journal of Geosciences (Springer), 2(4)321-335. DOI: 10.1007/s12517-009-0042-4.
Abdalla O. (2009b). GW recharge/discharge in semi-arid regions interpreted from isotope and chloride concentrations in the White Nile Rift, Sudan. Hydrogeology J., 17; 679-692.
Abdalla, O.A.E. (2000). Groundwater Hydrology of the west-central Sudan, Verlag Dr. Koster, Berlin, Germany, ISBN 3-89574-364-X
Abdalla, A. H. A. (2008). Efficient and sustainable water policies for the Nile River in Egypt. Las Cruces, New Mexico: New Mexico State University. http://agecon.nmsu.edu/fward/water/Sustainable%20Water%20Management%2
Abdel Moneim A. A. (2005). Overview of the geomorphological and hydrogeological characteristics of the Eastern Desert of Egypt. Hydrogeology Journal, 13:416–425
Abebe, Y. D. and K. Geheb [Eds] (2003). Wetlands of Ethiopia. Proceedings of a seminar on the resources and status of Ethiopia’s wetlands. vi + 116pp. The World Conservation Union (IUCN), Nairobi.
Abiye T.A. (2010). An overview of the transboundary aquifers in East Africa. J.Afr Earth Sci., 58(4):8
Abiye, T.A. and S. Kebede (2011). The role of geodiversity on the groundwater resource potential in the upper Blue Nile River Basin, Ethiopia. Environmental Earth Sciences Journal DOI: 10.1007/s12665-011-0946-7.
AbuZeid, M.A. and F. Z. El-Shibini (1997). Egypt’s High Aswan Dam. Water Resources Development, Vol. 13, No. 2, pp. 209±217. http://www.ci.uri.edu/CIIP/fallclass/Docs_2006/UrbanWaterfronts/Abu-Zeid%20and%20El-Shibini.pdf. Accessed 3rd May 2013.
AbuZeid, K. (2012). Towards wider consensus on International frameworks of shared waters. 6th World Water Forum, Marseille, France
Adamson, D.A., Gasse, F., Street, F.A. and M.A.J. Williams (1980). Late quaternary history of the Nile. Nature. 288, 50–55.
Aly, A.I.M., Froehlich, K., Nada, A., Awad, M., Harnza, M. and W.M. Salem (1993). Study of environmental isotope distribution in the Aswan High Dam Lake (Egypt) for estimation of evaporation of lake water and its recharge to adjacent groundwater. Environmental Geochemistry and Health 15(1): 37-49.
Ambroggi, R.P. (1966). Water under the Sahara. Scientific American. 214, 21-29, New York.
Azab, A. (2011). Hydrological and Environmental aspects of wetlands. Analytical tools for wetland management. Wetlands Research group, GIS and Modeling Research Cluster, Nile Basin Capacity Building Network, Cairo.
Anbah, K. and F. Siccardi (1991). Prediction of hydrometeorological extremes in Sudanese Nile region: A need for international co-operation. In: IAHS Publ. No. 201 Ed. Hydrology for the Water Management of large River- Basins. Vienna Symposium.
Attia, F.A.R. (1985). Management of water system in Upper Egypt. Ph.D. Thesis. Faculty of Engineering, Cairo University, Cairo.
Bates, B.C., Kundzewicz, Z.W., Wu, S. and J.P. Palutikof [Eds] (2008). Climate and Water Change. Intergovernmental Panel on Climate Change (IPCC) Secretariat, Geneva. http://www.ipcc.ch/publications_and_data/publications_and_data_technical_papers.shtml#.UN9MqOTFX5s (accessed on 05th February 2013).
BCEOM (1999). Abay River Basin Integrated Master Plan. Main Report. Ministry of Water Resources, Addis Ababa, 71-83.
Beyene T., Lettenmaier D.P. and P. Kabat (2007). Hydrologic impacts of climate change on the Nile River Basin: implications of the 2007 IPCC Climate Scenarios. Cockrell School of Engineering, University of Texas at Austin. http://www.ce.utexas.edu/prof/mckinney/ce397/Topics/Nile/Beyene_etal_2007.pdf (accessed on 05th February 2013)
Camberlin, P. (2009). Nile Basin Climates. In “The Nile: Origin, Environments, Limnology and Human Use”
CEDARE (2001). Regional strategy for the Utilisation of the Nubian Sandstone Aquifer System. Volume III: Ground Water Model. Centre for Environment and Development for the Arab Region and Europe (CEDARE), Cairo.
Conway, D. (2000). The climate and hydrology of the Upper Blue Nile, Ethiopia. Geographical Journal 166, 49–62.
Conway, D., Mould, C. and W. Bewket (2004). Over one century of rainfall and temperature observations in Addis Ababa, Ethiopia. Int. J. Climatol. 24, 77–91.
Dahab, K.A., 1993, Hydrogeological evolution of the Nile Delta after the high damconstruction. Ph.D dissertation, Geology Dept., Faculty of Science, Menofia University, Shibin El-Kom, Egypt. 256 pp.
Dawoud, M.A. (2004). Design of national groundwater quality monitoring Network in Egypt, Environ. Monit. Assess, 96: 99-118. Environ Monit Assess. 2004 Aug-Sep;96(1-3):99-118.
Dawoud M.A., Allam, A.R., El Shewey, M.A. and S.M. Soliman (2006). Using renewable energy sources for water production in arid regions: GCC countries case study”, in Arid Land Hydrogeology, Search of a Solution to a Threatened Resource, Proceedings of the 3rd UAE Japan Symposium on Sustainable GCC Environment and Water Resources EWR
Dumont, H.J. (2009). A Description of the Nile Basin, and a Synopsis of Its History, Ecology, Biogeography, Hydrology, and Natural Resources, In H. J. Dumont (ed.), The Nile: Origin, Environments, Limnology and Human Use, Monographiae Biologicae. Springer. Dordrecht. Vol. 89: 1–21.
El Kashouty, M. and A. Abdel-Lattif (2010). Multivariate statistical analyses of the groundwater system in Darb El-Arbaein, Southwestern Desert, Egypt. Arab J Geosci. DOI 10.1007/s12517-010-0123-4

77
El-Kashef, A.I. (1983) Salt water intrusion in the Nile Delta. J. Groundwater no.2, 160-167.
El Tahlawi, M.R., Farrag, A.A., and S.S. Ahmed (2008). Groundwater of Egypt: An Environmental Overview. Environ Geol. 55:639–652. DOI 10.1007/s00254-007-1014-1.
El Tohami, M.S. (1978). Geology and hydrogeology of Baggara Basin, Sudan. Ph.D. thesis. Department of Geology, London University, London, United Kingdom.
Elewa, H.H. (2006). Water resources and geomorphological characteristics of Toshka and west of Lake Nasser, Egypt. Hydrogeology Journal, p. 942-954.
Elewa, H.H., and A.H. El Nahry (2009). Hydro-environmental status and soil moisture management of the River Nile Delta, Egypt. Environmental Geology. Vol. 57. p. 759 – 774.
El-Gunidy, S. (1989). Quality of drainage water in the Nile Delta. In: Amer, M.H., de Ridder, N.A (Eds.), Land Drainage in Egypt, Drainage Research Institute. pp. 189±206.
Elkrail, A.B. and Abdalla E. Ibrahim (2008). Regional Groundwater Flow Modelling of Gash River Basin, Sudan. Journal of Applied Sciences in Environmental Sanitation. 3 (3): 157-167.
Elkrail, A.B., Kheir, O., Shu, L., and H. Zhenchun (2004). Hydrogeology of the Northern Gezira Area, Central Sudan. Journal of Spatial Hydrology. Vol 4, No 2 (2004). http://www.spatialhydrology.net/index.php/JOSH/article/view/32
Elsawwaf, M. and P. Willems (2011). Analysis of the climate variability on Lake Nasser evaporation based on the Bowen ratio energy budget method. J. Environ. Biol. 33, 475-485 (2012). https://lirias.kuleuven.be/bitstream/123456789/324662/2/Mohamed+(JEB+2012).pdf Accessed 2nd December 2012.
Fahmy, A. (2006). The Identification of Hydrological Unites in the Nile Basin. Data Availability. FRIEND/Nile (FN) UNESCO-Flanders Science. Trust Fund Project. The United Nations Education, Scientific And Culture Organization (UNESCO), Paris.
FAO (1995). Irrigation in Africa in figures. Food and Agriculture Organisation of the United Nations (FAO), Rome. http://www.fao.org/docrep/V8260B/V8260B0r.htm
FAO (2003). Strategy of Agricultural Development in Egypt up to 2017. Ministry of Agriculture (MOA), Cairo (In Arabic).
FAO (2011). FAO-Nile Synthesis report. Information Products for Nile Basin Water Resources Management. FAO-Nile Basin Project GCP/INT/945/ITA 2004 to 2009. Food and Agricultural Organization (FAO) of the United Nations, Rome. http://www.fao.org/nr/water/faonile/products/Docs/Reports/Synthesis.pdf. Accessed 30th December 2012.
Farah, E.A. (1999). Groundwater Resources of Khartoum, Sudan: A Quantitative and Qualitative evaluation. Ph.D. Dissertation. Dept. of Geosciences, Osaka City University.
Farah, E.A., Abdullatif, O.M., Kheir, O.M., and N. Barazi (1997). Groundwater resources in semi-arid areas, a case study from central Sudan. Journal of African Earth Sciences v.25 pp. 453 – 466.
Geirnaert, W., Laeven, M.P. (1992). Composition and history of groundwater in the western Nile Delta. Journal of Hydrology. 138: 169-189
Gheith, H. and M. Sultan (2002). Construction of a hydrologic model for estimating Wadi runoff and groundwater recharge in the Eastern Desert, Egypt. Journal of Hydrology. 263 (2002) 36-55.
Haggaz, Y.A.S. and M.K. Kheirallah (1988). Paleohydrology of the Nubian Aquifer North East of the Blue Nile, near Khartoum, Sudan. J. Hydrology. 99: 117-125.
Harding, C. (2009). Extension of the Water Dependent Ecosystem Risk Assessment Framework to the South East NRM Region. Department for Water, Land & Biodiversity Conservation, Unpublished report, Mount Gambier.
Heleika, M.A. and E. Niesner (2008). Configuration of the limestone aquifers in the central part of Egypt using electrical measurements. Hydrogeology Journal. DOI 10.1007/s10040-008-0360-8.
Howard, K.W.F., Hughes, M., Charlesworth, D.L. and G. Ngobi (1992). Hydrogeologic evaluation of fracture permeability in crystalline basement aquifers of Uganda. J. Appl. Hydrogeol. 1: 55-65.
Hussein, M. T. (2004). Hydrochemical evaluation of groundwater in the Blue Nile Basin, eastern Sudan, using conventional and multivariate techniques. Hydrogeol. J. 12 144-158.
Hussein, M.T. and H.S. Awad (2006). Delineation of groundwater zones using lithology and electric tomography in the Khartoum basin, central Sudan. Comptes Rendus Geoscience. 338, 1213-1218
Idris, H. and S.Nour (1990). Present Groundwater Status in Egypt. Environ Geol Water Sci Vol.16, No.3 171-177. http://link.springer.com/article/10.1007%2FBF01706041#page-1
IHP/UNESCO (2001). Internationally Shared (Transboundary) Aquifer Resources Management. A Framework Document. IHP-VI, Series on Groundwater No. 1. International Hydrological Programme (IHP)/United Nations Educational, Scientific and Cultural Organisation (UNESCO), Paris.
ILEC (1999). World Lakes Database. International Lake Environment Committee Foundation (ILEC) , Shiga, Japan. http://www.ilec.or.jp (accessed on 05th Feb 2013)
ILEC (2012). World Lakes Database. International Lake Environment Committee (ILEC) Foundation. http://wldb.ilec.or.jp/ Accessed 3rd January 2013.
Karyabwite, D.R. (2000). Water Sharing in the Nile River Valley. United Nations Environment Programme (UNEP). UNEP/DEWA/GRID, Geneva.
78
Kayombo S. and S.E. Jorgensen (2006). Lake Victoria: experience and lessons learned brief. International Lake Environment Committee, Lake Basin Management Initiative, Pp. 431-446. Kusatsu, Japan.
Kebede, S., Travi, Y., Alemayehu, T. and T. Ayenew (2005). Groundwater recharge, circulation and geochemical evolution in the source region of the Blue Nile River, Ethiopia. Applied Geochemistry. 20, 1658-1676.
Kehinde, M. and E. Loehnert (1989). Review of African groundwater resources. J. Afr. Earth Sci. 9 1., 179-185.
Khater, A.M. (2002). Effect of sex ratio on reproductive performance of Nile tilapia (Oreochromis niloticus) and Blue tilapia (Oreochromis aureus). Egypt. J. Agric. Res., 80 (1): 377-386.
Kheir, O.M. (1986). Hydrogeology of Dongola area, Northern Sudan. Berl. Geowiss. Abh. (A), 74, 81
King’uyu, S.M., Ogallo, L.A. and E.K. Anyamba (2000). Recent trends of minimum and maximum surface temperatures over Eastern Africa. Journal of Climate 13: 2876-2886.
Klitzsch E. and A. Lejal-Nicol (1984). Flora and fauna from strata in southern Egypt and northern Sudan (Nubia and surrounding areas). Berliner geowiss. Abh. (A) 50, p.47-79.
Klitzsch, E., Harms, J.C., Lejal-Nicol, A. and F.K. List (1979). Major subdivisions and depositional environments of Nubia Strata, southwestern Egypt. American Association of Petroleum Geologists Bulletin. 63 : 967-974.
Klitzsch, E.H. and C.H. Squyres (1990). Paleozoic and Mesozoic Geological History of Northeastern Africa Based Upon New Interpretation of Nubian Strata. AAPG Bulletin, v. 74, p. 1203-1211.
Lahmeyer International (2004). Merowe Dam. Lahmeyer International. Bad Vilbel, Germany. http://198.170.85.29/Lahmeyer-Merowe-Sudan-project-sheet.pdf. Accessed 3rd May 2013.
Lamoreaux, P.E., Memon, B.A. and H. Idris. (1985). Groundwater development, Kharga Oases, Western Desert of Egypt: A long-term environmental concern. Environmental Geology and Water Sciences 7, no. 2: 129-149.
Lennaerts, A.B.M., Attia, F.A.R., and S.J. de Jong (1988). Forecasting the suitability of pumped groundwater for irrigation in the Nile valley. Agricultural Water Management. 14: 525-535
Lloyd, J.W. (1990). Groundwater resources development in the Eastern Sahara. J. Hydrol. 119: 71-87.
LVBC (2007). Regional Transboundary Diagnostic Analysis of the Lake Victoria Basin. Lake Victoria Basin Commission (LVBC), Kisumu, Kenya. http://iwlearn.net/iw-projects/2405/reports/regional-transboundary-diagnostic-analysis-of-the-lake-victoria-basin (accessed on 18th Feb 2013)
Mabrook, B. and M.Sh. Abdel Shafi (1977). Hydrological and environmental isotope studies of Bara Basin, Central Sudan, in Syrnposiurn on trace elements in drinking water, agriculture and human life. Middle East Radioisotope Centre and Goethe Inst, Cairo. p 123-149.
MacDonald, A.M., Calow, R.C., MacDonald, D.M., Darling, W.G. and B.E.O Dochartaigh (2009). What impact will climate change have on rural groundwater supplies in Africa? Hydrological Sciences Journal. 54:4, 690-703.
Mapanda S. (2002). Transboundary aquifers of Tanzania. Proceedings of the International Workshop. [Eds]: Bo Applegren. Tripoli, Libya, 2– 4 June 2002. United Nations Educational, Scientific and Cultural Organisation (UNESCO).
Meissner B., Wycisk P. (Eds) (1993). Geopotential and Ecology: Analysis of a desert region. CATENA Supplement 26, 200 S., 6 Karten; Cremlingen.
Mohammed, E.A.M.E. (2006). Improvement of the Hydrological Performance of Land Surface Parameterization: An Application to The Nile basin. Imperial College of Science, Technology and Medicine, University of London, London. http://www3.imperial.ac.uk/pls/portallive/docs/1/7253931.PDF. Accessed 29th December 2012.
Mutua, F., Di Baldassare, G., Elshamy, M., Soliman, E., Kigobe, M., Ndomba, P., Mutemi, J., Moge, S. and Y. Xuan (2011). Future Hydrology and climate in the River Nile basin. Hydrological Science Journal. 56(2), 199-211.
NBI (2005). National Nile Basin Water Quality Monitoring Baseline Report for Rwanda. Nile Basin Initiative (NBI). Transboundary Environmental Action Project, Kigali.
NBI (2012). State of the Nile basin report. Nile Basin Initiative (NBI), Entebbe.
New, M., Lister, D., Hulme, M., and I. Makin (2002). A high- resolution data set of surface climate over global land areas, Climate Research, 21:1-25.
NIS (2013). Rivers and Lakes Environment. Nile Information System (NIS). Nile Basin Initiative, Entebbe. http://nileis.nilebasin.org/content/rivers-and-lakes-environment
Nour, S. (1996) Groundwater potential for irrigation in the east Oweinat area, Western Desert, Egypt. Environ. Geol. 27.
Olet, I.E., Koen, R., Mansfeld, M., Smit, R. and P. Walsum (2006). Baseline Assessment Report for the Nile River Basin. Report of the NeWater project. New Approaches to Adaptive Water Management under Uncertainty www.newater.info.
Omer A.M. (2002). Focus on groundwater in Sudan. Int. J. Geosci. Environ. Geol. 41(8): 972-976.
REMA (2009). State of the Environment and Outlook report. Rwanda Environment Management Authority (REMA), Kigali.
RIGW (1993). The effect of the new Nag Hammadi Barrage on ground water. El Kanater el Khariya Research institute for Ground Water (RIGW), Ministry of Public Works, Cairo.
RIGW (1992). Hydrogeological map of Egypt. El Kanater el Khariya Research institute for Ground Water (RIGW), Ministry of Public Works, Cairo.
Ribbe, L., and S. Ahmed (2006). Transboundary water management in the Nile River Basin. Technology, Resource Management and Development. 4: 13-27 http:// www.tt.fh-koeln.de/publications/ittpub%20303101_03.pdf Accessed 05th Feb 2013.

79
Robinson, C.A., Werwer, A., El-Baz, F., El-Shazly M., Fritch, T. and T. Kusky (2007). The Nubian Aquifer in Southwest Egypt. Hydrogeology Journal. 15: 33–45.
Senay, G.B., Asante, K. and G. Artan (2009). Water balance dynamics in the Nile basin. Hydrol. Process. Vol.23,3675-3681
Shahin, M. (1987). Groundwater Resources in Egypt: Potentials and Limitation. Water for the Future: Hydrology in Perspective. Proceedings of the Rome Symposium, April. IASH. 164. International Association of Scientific Hydrology. 179-92.
Shahin, M. (1983) Groundwater in the Nile Delta and Valley. Tech. Report on TOKTEN Assignment, Ministry of Irrigation, Acad, of Sci. and UNDP, Cairo.
Shahin, M. (1985) Hydrology of the Nile Basln. Dev. Wat. Sci. 21. Elsevier Science Publishing Company, New York.
Shata, A.A., Pavlov, M. and K.F. Saad (1962). Preliminary report on geology, hydrogeology and groundwater hydrology of Wadi El-Natrun and adjacent areas. Internal report Desert Institute, Cairo, Egypt, p 159.
Shema, N. (2009). The failings and future of Nile basin management. Political science honors thesis, Oregon State University, Ohio.
Siyam, A.M. (2005). Assessment of the current state of the Nile Basin reservoir sedimentation problems. Nile Basin Capacity Building Network (NBCBN). River Morphology research cluster group 1.
Solomon S. and F. Quiel (2006). Groundwater study using remote sensing and geographic information systems (GIS) in the central highlands of Eritrea. Hydrogeol. J. 14 729-741.
Sturchio N., Sultan, M., Arehart, G. B., Sano. Y., Abo Kamar, Y. and M. Sayed (1996). Composition and origin of thermal waters in the Gulf of Suez area, Egypt. Applied Geochemistry. 11, 471-479
Sultan, M., Yan, E., Sturchio, N., Wagdy, A., Abdel Gelil. K., Becker, R., Manocha, N. and A. Milewski (2007). Natural discharge: A key to sustainable utilization of fossil groundwater. Journal of Hydrology. 335, 25-36.
Sutcliffe, J.V. and G. Petersen (2007). Lake Victoria: derivation of a corrected natural water level series Hydrol. Sci. J. 52 1316–21
Sutcliffe, J. and Y.P. Parks (1999). The Hydrology of the Nile. IAHS Special Publication No. 5. International Association of Hydrological Science (IAHS), Oxfordshire, UK.
Taylor, R.G. and K.W.F. Howard (1996). Groundwater recharge in the Victoria Nile basin of East Africa: support for the soil moisture balance approach using stable isotope tracers and flow modelling. Journal of Hydrology 180, 31–53.
Taylor, R.G. and K.W.F. Howard (2000). A tectonic geomorphic model of the hydrogeology of deeply weathered crystalline rock: evidence from Uganda. Hydrogeology Journal, 8, 279-294.
Thorweihe U. (1982). Hydrologie des Dakha Beckens (agypten). Berliner Geowis Abh. (A), 38, 1-53, Berlin
Thorweihe, U. (1990). Nubian aquifer system. In: The Geology of Egypt. [Ed]: R. Said, pp. 601–614, A. A. Balkema, Brookfield, Vt.
Thorweihe U. and M. Heinl (2002). Groundwater Resources of the Nubian Aquifer System, NE-Africa. Technical University of Berlin, Berlin. 24p.
Tindimugaya, C. (2010). Groundwater resources assessment and its use in the Nile basin of Uganda and Lake Victoria. Report prepared for the International Water Management Institute (IWMI). P43 Kampala, Uganda
UNEP (2000). Water sharing in the Nile river valley. Project GNV011, United Nations Environment Programme (UNEP)/Division of Early Warning and Assessment (DEWA)/Global Resource Information Database (GRID) Report, Geneva.
UNEP (2006). Africa Environment Outlook 2. Our Environment Our Wealth. United Nations Environment Programme (UNEP), Nairobi.
UNEP (2010): Africa Water Atlas, Nairobi, Kenya, United Nations Environment Programme, p326
USDA (2005). Low Water Levels Observed on Lake Victoria. Production Estimates and Crop Assessment Division Foreign Agricultural Service. http://www.fas.usda.gov/pecad/highlights/2005/09/uganda_26sep2005/index.htm.
Vasudevu, K. (2009). Development and management of groundwater in Eritrea, N-E Africa. Indian J.Sci. Technol. Vol.2 No 1.
Vrbka, P. (1996). Hydrogeologische und Isotopenhydrogeolische Untersuchungen zur regionalen Problemen der GW-Neubildung, der GW-Zirkulation und des Wasserhaushaltes im Nordsudan. Berl. Geowiss. Abh. (A), 186, 158 p., Berlin, Germany
Wale, A. (2008). Hydrological Balance of Lake Tana. Upper Blue Nile Basin, Ethiopia. MSc. Thesis. ITC, The Netherlands. http://www.itc.nl/library/papers_2008/msc/wrem/wale.pdf. Accessed 3rd May 2013.
WCD (2000). Dams and Development: A New Framework for Dams, 2000. World Commission on Dams (WCD). EarthScan Publications Limited, London and Sterling, V.A.
Willems, P., Ogiramoa, N.P., Mutua, F.M., Abdo, G., Kabubi, J., Fahmi, A.M., Sonbol, M., Lotfy, A., Kimaro, T.A., Mkhandi S., Opere, A.O., Ibrahim, Y.A., Kizza, Michael, Tadeze, L., Abdel, M., Farid, S., Zaki, A. and R. Al-Weshah (2009): ‘Regional Flood Frequency Analysis for the River Nile Basin’. Medelingen der Kolinklijke Academie voor Overzeese Wetenschappen (Bull. Seanc. Acad. R. Sci. Outre-Mer/ Meded. Zitt. K. Acad. Overzeese Wet.), 55(4), 555-570.
World Bank (2011). Africa Development Indicators 2011. World Bank, Washington D.C.
Zerai, H. (1996). Groundwater and Geothermal Resources of Eritrea with the emphasis on their chemical quality. Journal of African Earth Sciences. Vol. 22, No. 4, pp. 415.421.

80
Chapter 4WATER AVAILABILITY AND DEMAND
pow
erdo
n / F
lickr
/ C
C BY
-NC-
ND
2.0
IntroductionWater is central to the wellbeing of human society. It is used in all aspects of life — for economic, political, social and cultural use. Water is thus a crucial element in the quest for development. This means that it must be available in suffi cient quantities to meet consumption and social needs. The supply must be reliable even during diffi cult seasons and it must also be easily accessible. Although the per capita availability of water in the Nile basin varies from country to country, the human needs and rights to access to water remain the same. Population in the basin is rapidly increasing and with it the demand for water. Water stress is already a concern and yet the annual discharge of the Nile is not increasing. Agriculture is the main water use, utilizing up to 80 per cent of the Nile’s water.
This chapter presents an overview of the availability of water and the demand for it in light of the current and projected population. It also highlights the uses that water is put to in the basin.
Water AvailabilityThe ‘blue and green water’ concept Water scientists’ partition freshwater into an array of diff erent colours also known as the ‘blue and green water’ concept (Falkenmark 1995). These include blue, green, white, grey and black water, among others. Blue water is the portion of rainwater that forms surface water (rivers, streams and irrigation) and recharges groundwater aquifers. Green water, on the other hand, is rainwater that is stored in soil as soil moisture and used by green plants. It returns to the atmosphere through transpiration and is a crucial component of rain-fed agriculture. Water vapour in the
air is classifi ed as white water; while the wastewater that accrues from the various usages forms grey water which is re-usable as it is much less polluted than black water. White water and black water are in forms that are unusable by humans. These types of water are all interlinked in the hydrological cycle. In fact green water is transformed daily into blue water by the eff ects of continuous urbanization or deforestation practices in vegetation-covered lands as shown in fi gure 4.1 (AbuZeid 2001).
The annual global volume of green water is about 60 000 BCM compared with only 40 000 BCM of blue water (AbuZeid 2008). Green water is of utmost importance as 60 per cent of global food production comes from it (Cosgrove and Rijsberman 2000).
Figure 4.1: The blue-green water model.
Rainfall
Green water flow
Green ET flow
Green ET flow
Blue
to g
reen
ET
flow
Blue water resource
Green water resourceBlue water flow
Blue water resource
Satu
rate
dzo
neU
nsat
urat
edzo
ne
Source: Falkenmark and Rockström 2006

81
Blue and green water in the Nile basinWithin the Nile basin, precipitation is high in the upstream countries of Burundi, Kenya, Eritrea, Ethiopia, the United Republic of Tanzania, Rwanda, South Sudan and Uganda. Green water is thus an important upstream form of water. In the downstream countries especially Egypt and the northern part of Sudan where precipitation is low, blue water is more signifi cant.
The total annual precipitation over all the basin countries combined can reach a maximum of 7 375 BCM per year during years of extreme rainfall. However, the mean annual precipitation over the area of the Nile basin alone is estimated at only 1 660 BCM per year of which merely 84 BCM per year translates into river fl ow (blue water) in the Nile (AbuZeid 2001). Figure 4.2 shows the renewable water resources and the green and blue water fl ows in each of the Nile countries.
Water availability in the Nile basinThe availability of water or the actual per capita renewable water resources in this basin is on the decline. It is infl uenced by several
factors including variations in precipitation, the hydropolitics of the region and pressures from the rapidly growing population.
Precipitation is the primary avenue by which surface water is replenished. Once it reaches the earth’s surface, it is dispersed or lost through a number of avenues including evaporation, river-fl ow, seepage and the environmental integrity of the watershed which may aff ect the runoff characteristics thus impacting its availability. Across the Nile basin, there is great spatial and temporal variability in rainfall. This fact, coupled with the natural cyclic occurrence of the ENSO (El Niño Southern Oscillation) also aff ects the reliability of the water resource (Indeje and others 2000). These variations are highlighted in table 4.1 which provides data on rainfall and river-fl ows between 1931-60 and 1961-90 in selected locations of the basin.
Hydro-politics also plays a central role in the availability of water. The transboundary nature of the Nile means that water supply, allocation, control and use are being juggled against a backdrop of diff ering national needs, domestic challenges and changing lifestyles. The basin countries all have a responsibility to ensure quality of life, livelihoods and economic achievement. Countries, such as Egypt, that have eff ectively and effi ciently
Figure 4.2: Precipitation, green water and blue water fl ows in the Nile countries (1995).
EgyptSudan EritreaS.SudanEthiopiaDRC RwandaBurundiUgandaKenya0
500
1 000
1 500
2 000
2 500
3 000
3 500
4 000Precipitation, BCM Green Water Flow, BCM Blue Water Flow, BCM
Prec
ipit
ation
, G
reen
Wat
er F
low
and
Blu
e W
ater
Flo
w (B
CM)
UnitedRepublic
of Tanzania
Table 4.1: Trends in rainfall and river fl ows, 1931-1960 and 1961-1990.
CV: coeffi cient of variation; RC: runoff coeffi cient.Owen Falls represents the Equatorial Lakes, the diff erence between White Nile river fl ows measured at Owen Falls and downstream at MongallaSource: AbuZeid 2012
Source: AbuZeid 2012
1931-1960 1961-1990Percentage
change
Rainfall (mm)
CV%River Flow
(m3/s)CV% RC%
Rainfall (mm)
CV%River Flow
(m3/s)CV% RC% Rainfall
River Flow
Nyaka ferry
1 058 9 412 18 42 1 084 9 662 21 63 +2 +61
Owen Falls
1 129 12 672 15 7 1 222 12 1 190 17 12 +8 +77
Owen Falls
1 147 9 105 67 1 1 167 12 372 21 3 +2 +254
Hillet Doleib
1 039 11 408 14 5 974 21 448 21 6 -6 +10
El Deim 1 070 10 1 626 13 25 1 010 10 1 454 20 23 -6 -11

82
utilized the waters of the Nile have shown great economic and social progress. Per capita GDP in Egypt is three times higher than that of Sudan, the country with the second highest GDP in the region and 18 times higher than that of the DRC which has the lowest (see fi gure 4.3). The upshot now is that individual basin countries are increasingly eager to make greater use of the river, so that they, too, can approach the same levels of development. However, there is a hurdle in that some past agreements do not give the upstream countries access to a fair share of the Nile. For instance the 1929 and 1959 Water Agreements allocated 55.5 and 18.5 BCM out of a total fl ow of 84 BCM to Egypt and Sudan respectively (Karyabwite 2000). In addition they allow Egypt to veto any projects that may aff ect the volume of fl ow to the Mediterranean.
Where opportunities for further developing the waters of the Nile are complicated, it means that the countries have to rely on other sources of water such as precipitation. The drawback is that many of the upstream countries already experience recurrent droughts caused by inadequate rainfall, deforestation and soil
erosion. This uncertainty presents strong motives for investing in huge projects such as irrigation and dam development. However these remain contentious. So the ability of those countries to increase access to clean water (fi gure 4.4) for the various domestic, agricultural, industrial and environmental uses will still remain a challenge.
Human activities such as those that result in wastage of water, pollution and mass consumption are all putting pressure on the existing water resource. Water experts believe that there is not enough water in the river to meet the varied and growing uses. The annual renewable water resource has remained the same against a background of continued population growth and demand for water implying a decline in the average amount of water available per person. Indeed as fi gure 4.5 shows, in all countries apart from the DRC, the water available per capita is already less than the recommended annual water security threshold of 1 700 m3 (Brown and Matlock 2011).
Figure 4.3: GDP per capita (at constant 2000 prices) in 2009.
0
200
400
600
800
1 000
1 200
1 400
1 600
1 800
2 000
Burundi DRC Egypt Eritrea Ethiopia Kenya Rwanda Sudan Uganda
US
$
112 97
1 836
113
201
452
334
537
426336
UnitedRepublic
of Tanzania
82 upye
rnoz
/ W
iki C
omm
ons
/ CC
BY 2
.0
The Dakhla oasis, part of the “new valley” project”, is a project in which Egypt is diverting Nile water from Lake Nasser into the western desert to make it habitable and relieve population pressures on the crowded Nile valley.
Figure 4.4: Access to water and sanitation in the Nile basin against per capita internal water resources.
0
2 000
4 000
6 000
8 000
10 000
12 000
14 000
16 000
0
20
40
60
80
100
Burundi DRC Egypt Eritrea Ethiopia Kenya Rwanda Sudan Uganda
% P
opul
ation
Per
capi
ta w
ater
reso
urce
s (m
³)
Access to improved water source
Access to improved sanitation source
Internal renewable water resources
UnitedRepublic
of Tanzania
Source: World Bank 2011

83
Figure 4.5: ≠
EGYPTLIBYA
SUDAN
SOUTH SUDAN
ETHIOPIA
CHAD
DEMOCRATIC
REPUBLIC
OF
THE CONGO
UGANDA
KENYA
ERITREA
UNITED REPUBLICOF TANZANIA
CENTRALAFRICANREPUBLIC
RWANDA
BURUNDI
SOMALIA
<1 000m³ per person and year:Chronic water scarcity
1 000 - 1 700m³ per person and year:Water stress
>1 700m³ per person and year:Relative water sufficiency
0 240 480Kilometres
National boundary
Lake
River
Legend
Natural flow in km³ per yearkm³/yr
N
Mombasa
Nairobi
Addis Ababa
Asmara
Bur Sudan
DJIBOUTI
Aswan
Wadi Halfa
Cairo
Kisangani
KigaliBujumbura
Kampala
Khartoum
El Obeid
Sudd
AdministrativeBoundary
AdministrativeBoundary
84 km³/yr
25 km³/yr
14 km³/yr
25 km³/yr
25 km³/yr
Juba
Re
d S
e a
I N D I A N
O C E A N
Source: Timmerman 2005

84
Water demand and useThe water required for a specifi c purpose is known as water demand. Water use is simply the amount of water used by a country or other lower entity such as a household. Some of the varied uses include hydro-electricity generation, drinking and domestic supply, agriculture, fi shing, irrigation, industry, leisure, transport, tourism and waste disposal. One inevitable outcome of water use is the generation of waste water.
Water use and water demand are intensifi ed by population and economic growth and there are backwards and forward linkages to each. A large population translates into a large market
which triggers the domestic sector. Improvements in infrastructure such as electricity support industrial and economic growth which sparks off large increases in water withdrawals in the domestic sector (Alcamo and others 2003).
Together, the countries of the Nile basin use almost 90 per cent of the region’s renewable water resources. Egypt and Sudan, which need water from outside their borders, account for the largest water withdrawals at 57 and 31 per cent of the total renewable water withdrawals, respectively (fi gure 4.6). Per capita withdrawals for these two countries are almost 10 to 15 times the amounts withdrawn by other countries in the basin (FAO Aquastat 2005). Recent research supports this fact indicating that the stream fl ow of the Nile is fully allocated - used for industrial, domestic, agricultural and ecological water supply, almost exclusively by Egypt and the Sudan (FAO 2011a, NBI 2012). Each year, less than 10 km3 reaches the Mediterranean, which is considered the minimum requirement for environmental purposes (FAO 2011a).
Water use by sectorAgriculture
Overall, agriculture dominates all other water uses in the basin, accounting for more than 80 per cent of water withdrawals (Timmerman 2005, Karyabwite 2000, FAO 2011b). In the upstream countries, agriculture is mainly subsistence and dependent on rainwater. For example, Rwanda uses 52 per cent of its annual rain volume for cultivation practices (FAO 2011a). The overdependence on the rain leaves the countries extremely vulnerable to droughts, fl oods or other periods of extreme weather. This has in the past
Cattle on the Nile.
dore
na-w
m /
Fote
r.com
/ CC
BY-
ND
0
20
40
60
80
100
120
Burundi DRC Egypt Eritrea Ethiopia Kenya Rwanda Uganda
BCM
Internal renewable water resourcesActual annual renewable water resources
UnitedRepublic
of Tanzania
Sudan
Figure 4.6 Actual versus internal renewable water resources in the Nile basin countries.
Source: NBI 2012

85
led to massive agricultural losses and food insecurity and is now eliciting a move towards urgent investment in water storage capacity to counteract the uncertainty caused by the climate. Ethiopia, for example, has prioritized investments in large scale hydrologic infrastructure for electricity and storage (FAO 2011a).
In the arid and semi-arid downstream regions, the Nile is the sole source of water for agriculture. For instance both Egypt and Sudan use almost as much water for irrigation as the total of their annual renewable water resources. In Egypt alone, about 30 per cent of the water abstracted from the Nile is devoted to irrigation (Timmerman 2005). All countries in the Nile basin boost their agricultural production through irrigation, to some extent and the opportunities for expansion are immense. About 5.6 million hectares of land in the basin is currently under irrigation or equipped with irrigation facilities (NBI 2012). Most of this land
(97 per cent) is located in Egypt and Sudan, with the balance distributed among the upstream countries (NBI 2012). Table 4.2 provides some data on water withdrawals by country and sector.
Hydropower development
There is tremendous potential for hydroelectric power development especially where the gradient is high (figure 4.7). Excluding the DRC, the potential for hydropower development is over 200 000 GWh per annum (ECA 2009). Despite this potential, the sector is underdeveloped, expensive and unreliable. Indeed many of the countries are experiencing energy crises. For instance on average, the DRC, Eritrea and Kenya suffer 21.8, 3 and 6.8 power outages respectively in a typical month (World Bank 2011). Some of the reasons for this are environmental, social, institutional and financial. It has been estimated that investments in the region of
Table 4.2: Freshwater withdrawal by Nile basin country and sector.
Figure 4.7: Gradient along the Nile offering opportunities for hydropower development.
DU - Domestic Use; IU - Industrial Use; AU - Agricultural Use
Luvironza R.
Kagera R
.
Semliki R.
R. B
aro
Blue Nile
R. Sobat
R. Atbara
L. EdwardL. Victoria
L. Kyoga
L. Albert
L. Tana
RosaeiresDam Sennar
DamNimule
MongallaBor
Malakal
White Nile
Jebel AuliaDam L. Nubia/Nasser
Aswan High Dam
Sixth FifthFourth
ThirdSecond
Cairo RosettaKhartoum
SUDD
Khashm el GirbaDam
1 000 2 000 3 000 4 000 5 000 6 000
CATARACTS
km
m
WHITE NILE MAIN NILE Sea
BLUE NILE
2 000
1 800
1 500
1 200
900
600
300
Country
Total freshwater withdrawal
(km3/yr)
Per capita withdrawal (m3/p/yr)
DU (%)
IU (%)
AU (%)
DU (m3/p/yr)
IU (m3/p/yr)
AU (m3/p/yr)
Total renewable
water (km3/yr)
Dependency rati o
Burundi 0.29 38 17 6 77 6 2 30 12.5 19.8
DRC 0.36 6 53 17 31 3 1 2 1 282 29.9
Egypt 68.30 923 8 6 86 70 55 793 56 96.9
Eritrea 0.30 68 3 0 97 2 0 66 6.2 55.6
Ethiopia 5.56 72 6 0 94 4 0 67 120 0
Kenya 1.58 46 30 6 64 14 3 29 30.2 32
Rwanda 0.15 17 24 8 68 4 1 11 9.5 0
Sudan 37.32 1 030 3 1 97 27 7 996 62.5 76.9
United Republic of Tanzania
5.18 135 10 0 89 14 0 120 92.3 40.9
Uganda 0.30 10 43 17 40 4 2 4 66 12.7
Total 119.37 7 3 90Source: World Bank 2009

86
tens of billions of dollars are required to meet the region’s power demand (NBI 2012). Regardless, there is a trend to utilize more of the waters to generate electricity. Ethiopia, for instance, is going ahead to develop the 6 000 MW Renaissance Dam on the Blue Nile; and Rwanda is developing the 80 MW Regional Rusumo Falls
Hydroelectric Project. Table 4.3 shows the status of hydropower development in the countries.
Navigation
People living and working along the Nile have always used the waters as a vital mode of transporting both goods and people. This is especially the case in South Sudan during the flood season when road transport is not feasible. Steamers ply the Nile and its tributaries for some 3 800 km in Sudan. Only parts of the Nile are navigable due to the presence of natural barriers such as the cataracts. In Sudan, the river can be navigated in three stretches because of the cataracts north of Khartoum: from the border with Egypt to the southern end of Lake Nasser; between the third and fourth cataracts; and southwards from Khartoum to Juba. In Egypt, sailing boats and shallow-draft steamers can navigate the Nile as far as Aswan in the south (Karyabwite 2000). Services in other parts are seasonal as these stretches can only be navigated seasonally. These include the Dunqulah expanse of the main Nile, on the Blue Nile, up the Sobat to Gambela in Ethiopia, and up the River Al-Ghazal River. The Blue Nile is only negotiable as far as Ar-Rusayris and when water levels are high (Karyabwite 2000).
Nile ferry in Murchson Falls, Uganda.
Ano
ther
Day
in P
arad
ise
/ Flic
kr /
CC B
Y-N
C-SA
2.0
Table 4.3: The status of hydropower development in the countries of the Nile basin.
CountryPotenti al
GWhInstalled
Under Constructi on
Committ ed
Burundi 1 700 - - -
DRC 100 000 2 570 - -
Egypt >50 000 2 842 - -
Ethiopia 45 000 1 534 2 087 3 016
Kenya 1 422 761 - 63
Rwanda 400 55 43.2 37
Sudan - 1 343 1 250 -
United Republic of Tanzania
4 700 561 0 0
Uganda >2 000 >380 310Source: NBI 2009

87
ReferencesAbuZeid, K. (2001). International Water Law from Helsinki Rules
to the United Nations Convention on the Law of the Non-Navigational Uses of International Watercourses. IMPACT Water Journal, American Water Resources Association.
AbuZeid, K. (2008). Green Water and Effective Legislation for Transboundary Water Management, Water in the Mediterranean. IEMed Dossier 2008.
AbuZeid, K. (2012). Towards a Wider Consensus on International Legal Frameworks of Shared Waters. 6th World Water Forum, Marseilles, France.
Alcamo, J., Petra Döll, P., Henrichs, T., Kaspar, F., Lehner, B., Rösch, T. and S. Siebert (2003). Global estimates of water withdrawals and availability under current and future ‘business-as-usual’ conditions. Hydrological Sciences–Journal–des Sciences Hydrologiques, 48(3) June 2003 http://www.usf.uni-kassel.de/watclim/pdf/hydr-sci-paper2.pdf . Accessed 2nd December 2012.
Brown, A. and M.D. Matlock (2011). A Review of Water Scarcity Indices and Methodologies. White Paper No. 106. April 2011. The Sustainability Consortium. University of Arkansas, USA. http://www.sustainabilityconsortium.org/wp-content/themes/sustainability/assets/pdf/whitepapers/2011_Brown_Matlock_Water-Availability-Assessment-Indices-and-Methodologies-Lit-Review.pdf Accessed 2nd February 2013.
Cosgrove, W. and F. Rijsberman (2000). World Water Vision: Making Water Everybody’s Business. Earthscan Publications Ltd., London.
Falkenmark, M. (1995). Coping with water scarcity under rapid population growth. Conference of SADC Ministers, Pretoria 23-24 November 1995.
Falkenmark, M. and J. Rockström (2006). The new blue and green water paradigm: Breaking new ground for water resources planning and management. Journal of Water Resources planning and Management. ASCE.
FAO (2011a). FAO-Nile Synthesis report. Information Products for Nile Basin Water Resources Management. FAO-Nile Basin Project GCP/INT/945/ITA 2004 to 2009. Food and Agricultural Organization (FAO) of the United Nations, Rome. http://www.fao.org/nr/water/faonile/products/Docs/Reports/Synthesis.pdf. Accessed 30th December 2012.
FAO (2011b). Food for thought. Information Products for Nile Basin Water Resources Management. Food and Agricultural Organization of the United Nations (FAO), Rome.
FAO Aquastat (2005). Aquastat database. http://www.fao.org/nr/water/aquastat/data/query/index.html. Accessed on 2nd Dec 2012
Indeje, M., Semazzi, F.H.M. and L.J. Ogallo (2000). ENSO Signals In East African Rainfall Seasons. Int. J. Climatol. 20: 19–46 (2000). http://portal.iri.columbia.edu/~alesall/vacs-tma/indeje_intjclim2000.pdf Accessed 7th January 2013.
Karyabwite, D.R. (2000). Water Sharing in the Nile River Valley. United Nations Environment Programme (UNEP). UNEP/DEWA/GRID, Geneva
NBI (2009). The Potential of Regional Power sector integration-Transmission and Trading. A case study by Economic Consulting Associates (ECA), UK for the Nile Basin Initiative (NBI).
NBI (2012). State of River Nile Basin. Nile Basin Initiative (NBI), Entebbe.
Timmerman, J.G. (2005). Transboundary river basin management regimes: the Nile basin case study. RIZA - Institute for Inland Water Management and Waste Water Treatment. http://www.citg.tudelft.nl/live/pagina.jsp?id=9229ebc0-66d0-47ca-9d25-5ab2184c85f4&lang=en. Accessed 7th January 2013.
World Bank (2009). The Nile Basin Initiative. Building a Cooperative Future. Water Week 2009. The World Bank, Washington D.C. http://www.citg.tudelft.nl/live/pagina.jsp?id=9229ebc0-66d0-47ca-9d25-5ab2184c85f4&lang=en. Accessed 2nd February 2013.
World Bank (2011). Africa Development Indicators 2011. World Bank, Washington D.C.

88
Chapter 5VULNERABILITY AND HOTSPOTS IN THE BASIN
O
xfam
Inte
rnat
iona
l / F
lickr
/ CC
BY-
NC-
ND
2.0
Climate scenarios in the Nile basinTemperature and precipitationLake Victoria basin
Although climate projections based on global climate models can provide a valuable general assessment of regional climate change over the Lake Victoria basin, their scale (200 x 200 km boxes) tends to limit spatial detail, particularly over regions such as Eastern
Africa where there are large variations in terrain types and altitude. In the past two decades, ‘regional climate models’ with smaller scales (20 km grid), have been developed to overcome part of this problem. Since the climate over a specifi c region is also infl uenced by what is happening over the rest of the world, regional models must still also use information from the global model.
North Carolina State University’s regional climate change modeling (Anyah and others 2006, Anyah and Semazzi 2006) shows results for East Africa. They suggest that altitude could be an important factor in shaping the evolution of climate change
JF A2 - Ref Temperature (K) MAM A2 - Ref Temperature (K)
JJAS A2 - Ref Temperature (K) ONDA2 - Ref Temperature (K)
5N
3N
1N
EQ
1S
3S
5S
5N
3N
1N
EQ
1S
3S
5N
3N
1N
EQ
1S
3S
5S
5N
3N
1N
EQ
1S
3S
5N
3N
1N
EQ
1S
3S
5S
5N
3N
1N
EQ
1S
3S
5S
5N
3N
1N
EQ
1S
3S
5S
5N
3N
1N
EQ
1S
3S
5S
28E 30E 32E 34E 36E 38E 40E 42E 28E 30E 32E 34E 36E 38E 40E 42E 28E 30E 32E 34E 36E 38E 40E 42E
28E 30E 32E 34E 36E 38E 40E 42E 28E 30E 32E 34E 36E 38E 40E 42E
28E 30E 32E 34E 36E 38E 40E 42E
28E 30E 32E 34E 36E 38E 40E 42E 28E 30E 32E 34E 36E 38E 40E 42E
0 1 2 3 4 5 6 -500 -400 -300 -200 -100 -50 50 100 200 300 400 500
JF A2 - Ref Precipitation (mm) MAM A2 - Ref Precipitation (mm)
JJAS A2 - Ref Precipitation (mm) OND A2 - Ref Precipitation (mm)
Figure 5.1: Regional Climate Model (RegCM3) projection results for 2071–2100. Key: (A2-RF; 20 km resolution); (left) temperature, (right) rainfall.
Source: Downing and others 2008

89
in Kenya, for example. Figure 5.1 from this model indicates the average difference in temperature and rainfall for the time period 2071–2100 compared to the baseline average of 1961–1990. Results for temperature show that the entire basin warms up by between 1-5oC. The warming pattern is similar for the long rains March-April-May (MAM) and the dry season June-July-August-September (JJAS). There is also a similar pattern for temperature for the short rains October-November-December (OND) and the dry season January-February (JF). During the long rains, the entire basin will experience a significant increase in rainfall (figure 5.1-D). During the short rains, the increase in rainfall is confined to the districts to the west of the Rift Valley where major rivers such as Nyando and Sondu Miriu that feed Lake Victoria originate (figure 5.1-H).
These results contrast with the IPCC’s Fourth Assessment Report global model projections where almost all the models show wetter conditions during the short rains. Although the regional model shown here is the result of the most substantial modeling effort yet for East Africa, it is difficult to compare the results directly with the global models. These features are consistent with the observed rainfall changes during previous decades (1992-2001 average minus 1979-1988 average). Schreck and Semazzi (2004)
and Bowden and Semazzi (2007) have postulated that this pattern could be a fingerprint of climate change over the region.
Egypt
Egypt is mainly a desert country and relies primarily on irrigated agriculture, thus precipitation is important in as much as it replenishes the Nile’s water sources. Any change in precipitation patterns is likely to impact the availability of the water resources. Models predict that temperature changes in the Nile basin should be similar, yet precipitation changes vary as seen from table 5.1. According to all climate models, Egypt will experience a steady increase in temperatures, with somewhat more warming occurring in summer than in winter. They further estimate that annual precipitation should decrease, with declines in winter cancelling out summer increases. Statistically significant declines in precipitation are projected for December, January and February.
Sensitivity of the Nile’s flows to changes in temperature and precipitation
Nawaz and others (2010) carried out a simulation of the Nile basin’s sensitivity to a changing climate. The scenarios were simulated for different patterns of rainfall and different initial soil conditions in the Nile catchment area. The study revealed that the Nile is indeed very sensitive to any changes in rainfall patterns. If climate change decreases rainfall patterns by 25 per cent below average, inflow volume in Egypt will decrease by 56 and 63 per cent based on assumptions of dry and wet soil conditions, respectively. On the other hand, if rainfall increases by 25 per cent above average, the flow volume expected in Egypt will increase by 75-90 per cent.
Sayed (2004) reported that a 10 per cent increase in rainfall would result in a 5.7 per cent increase in Lake Victoria outflows. On the other hand, a 10 per cent increase in rainfall over the upper Blue Nile and Atbara sub-basins would cause increases of 34 and 32 per cent, respectively, indicating that these sub-basins are
Tim
Daw
son
/ Flic
kr /
CC B
Y-N
C-N
D 2
.0
Farming the banks of the Nile.
89
Table 5.1: Temperature and precipitation changes for the River Nile sources.
YearTemperature change (°C) mean (standard deviati on)
Precipitati on change (%) mean (standard deviati on)
Annual DJF JJA Annual DJF JJA
20301.0
(0.19)1.0
(0.22)1.0
(0.23)1.5
(2.37)16.6
(18.75)-0.5
(9.47)
20501.4
(0.27)1.5
(0.32)1.5
(0.33)2.1
(3.43)24.0
(27.09)-0.7
(13.69)
21002.5
(0.47)2.5
(0.56)2.6
(0.57)3.7
(5.97)41.7
(47.17)-1.2
(23.83)Source: Agrawala and others 2004

90
much more sensitive to climatic changes than the Lake Victoria sub-basin. A rainfall reduction of 10 per cent would result in outfl ow reductions of 24 per cent each for the Atbara and Blue Nile sub-basins and 4.3 per cent for the Lake Victoria sub-basin. The balance of these changes at Dongola results in changes of 30 per cent (-25 per cent) in mean annual fl ow for a 10 per cent increase (reduction) of rainfall over the whole Nile basin because of the dominance of the Ethiopian plateau fl ows (through Atbara and Blue Nile). Much larger sensitivities for the fl ows at Dongola to uniform rainfall changes over the whole Nile basin are expected, that is +40 per cent and -30 per cent for a 10 per cent increase and reduction, respectively (Elshamy and others 2008).
To illustrate the meaning of such large changes in Nile fl ows, it is worth looking at the annual natural fl ow records (1871–2006). Bearing in mind that these studies are only indicative, it is clear that the changes in rainfall due to global warming will not be uniform over the basin. The sensitivity of diff erent Nile sub-basins to uniform rainfall changes is summarized in table 5.2.
Sayed (2004) suggested a positive relationship between rainfall and temperature in the Blue Nile basin based on a comparison of temperature and mean areal precipitation between 1977 and 2003. In the White Nile region, this relation was weak. Using the results from four General Circulation Models (GCMs), the study expects rainfall in the Blue Nile would change from between 2 and 11 per cent for 2030, while rainfall in the White Nile would increase between 1 and 10 per cent for the same year. The associated changes in infl ow to Lake Nasser (derived using the Nile
Forecast System—a hydrologic distributed rainfall runoff model of the Nile basin as measured at Dongola) would range between -14 and 32 per cent.
Evaporation and evapotranspirationIncreased temperatures will cause evaporation and evapotranspiration to rise. In a modeling exercise of potential evapotranspiration (PET), Conway and Hulme (1996) showed that a 4 per cent increase in potential evapotranspiration would result in an 8 per cent and 11 per cent reduction in Blue Nile and Lake Victoria outfl ows, respectively. They assumed that the 4 per cent increase in PET results from a temperature increase of 1°C, an assumption that needs validation because temperature is not the only driver of PET. However, these results indicate that fl ows in both regions are more sensitive to temperature changes.
Because of high temperatures, every year a vast amount of the Nile’s waters stored in Lake Nasser and in the Sudd is already lost to evaporation. Figure 5.2 shows that evaporation is likely to increase in every scenario of the IPCCs AR4 regional models for Africa. OECD (2004) in Martens (2011) indicates that ‘a rise in temperature of just 1°C, assuming a 4 per cent increase in evaporation per degree centigrade rise in temperature, would lead to large increases in losses to evaporation which would signifi cantly reduce Nile fl ows. Sterman (2009) also says ‘it is clear that the increased evaporation due to rising temperatures will result in greater water stress.’
A farmer who uses water harvesting structure for homegardening, Ethiopia.
ILRI
/ Fo
ter.c
om /
CC B
Y-N
C-SA
90
Table 5.2: Changes in fl ows corresponding to uniform rainfall changes for diff erent Nile sub-basins.
Change in rainfall (%)
-50 -25 -10 10 25 50
Atbara at Atbara -93 -60 -24 34 84 187
Blue Nile at Diem -92 -62 -24 32 78 165
Blue Nile at Khartoum -98 -77 -31 36 89 149
Lake Victoria at Jinja -20 -11 -4 6 14 33
White Nile at Malakal -41 -28 -11 19 48 63
Nile at Dongola -85 -63 -25 30 74 130 Source: Sayed 2004
Figure 5.2: Impact of climate change on Nile basin runoff , precipitation (ppt) and potential evapotranspiration (PET) (per cent change from 2000 values).
5.0
10.0
0.0
-5.0
-10.0
-15.0
-20.0
2030A1FI 2030A2a 2030B1a 2030B2a
Per cent change from 2000Potential
Precipitation ET Runoff2030A1FI 2.0 2.0 -18.42030A2a 4.1 1.9 -5.22030B1a 1.8 1.7 -9.72030B2a 5.2 1.9 -1.0
Precipitation
Potential ET
Runoff
Source: Martens 2011

91
VulnerabilityFreshwater systems are part of larger ecosystems which sustain life and all social and economic processes. The provision of freshwater is therefore an ecosystem service which, when disrupted, threatens both the health of ecological systems and human wellbeing, which are in complex interaction (MA and WRI 2005). Climate change thus infl uences the earth’s ecosystems, people’s livelihoods and general human well being since it aff ects the availability of water. Scientists within the IPCC expect that the present increase in greenhouse gas concentrations will have direct fi rst-order eff ects on the global hydrological cycle, with impacts on water availability and demand (Bates and others 2008). These changes will in turn create other higher order eff ects which are shown in fi gure 5.3. Overall at the global level, a net negative impact on water availability and on the health of freshwater ecosystems is foreseen (IPCC 2007) and thus a cascade of negative consequences is expected to aff ect social and ecological systems and their processes.
The International Strategy for Disaster Reduction (ISDR) defi nes vulnerability as the conditions determined by physical, social, economic and environmental factors or processes, which increase the susceptibility of a community to the impact of hazards. The IPCC (2007), on the other hand, defi nes vulnerability as ‘the degree to which a system is susceptible to, or unable to cope with, adverse eff ects of climate change, including climate variability and extremes. Vulnerability is thus a function of the character, magnitude, and rate of climate variation to which a system is exposed, its sensitivity, and its adaptive capacity’.
The three sub-basins of the Nile (Equatorial lakes, Ethiopian plateau and Bahr El Ghazal) each receive extremely variable amounts of precipitation according to the climate zones in which they are situated. Rainfall and river fl ow records show that the basin has had its share of droughts and fl oods. These natural events have seriously impacted on the livelihoods of many people and the environment. Precipitation on the Ethiopian plateau occurs in one season and lasting around 100 to 110 days from early June to mid-September. The sub-basin is marked with steep slopes which cause heavy storms to erode vast areas of land. In the Bahr El Ghazal sub-basin, land is fairly fl at and precipitation is spread over large swamps and marsh lands inhabited by wild animals and aquatic plantations. Although the Equatorial lakes plateau is fl at as well, the Nile’s route allows water to fl ow downstream inside a regular channel. Both the Bahr El Ghazal and Equatorial lakes sub-basins experience two rainy seasons, one of them is long (4-6 months) and the other is short (2-3 months).
Research on the Nile basin has proven that the river’s natural fl ow is very sensitive to precipitation which falls on the Ethiopian highlands. An increase of 20 per cent in rainfall may increase the Nile’s natural fl ow at Aswan by 80 per cent. Conversely, if precipitation is reduced by 20 per cent, the natural fl ow may fall to a mere 20 per cent of the usual average. To a lesser extent, natural fl ow is also sensitive to temperature variation, particularly in the Equatorial lakes and Bahr El Ghazal sub-basins. An increase of 2oC in temperature might cause the natural fl ow to fall to 50 per cent of the average in these two sub-basins.
These facts lead to the important conclusion that Egypt and Sudan are both extremely vulnerable to increased or decreased rainfall in the Nile basin as well as to increased temperature levels. Both increased and reduced fl ows have negative eff ects on the two countries. If the natural fl ow is considerably increased, the storage capacity of both water systems might not be suffi cient to accommodate these high fl ows which might cause destructive fl oods. Even if the storage capacity is adequate, as might be the case in Egypt, the conveyance and distribution network of canals and drains might not be suffi cient. If the opposite happens (natural fl ows are substantially reduced) the two countries will face intolerable droughts.
A study by Yates and Strzepek (1998) showed the sensitivity of the basin to climate fl uctuations. Signifi cantly larger fl ows were predicted in Equatorial Africa including the expansion of the Sudd swamps. However, there were a range of results for the Ethiopian highlands in the Blue Nile and Atbara basins depending on the GCM scenario. In the Lake Victoria basin, the resultant change in outfl ow showed a reduction of 2.6-4.2 per cent by the 2050s followed by an increase of between 6.3 and 9.7 per cent in the 2080s with respect to the 1961-90 baseline. These ranges are consistent with the various climate scenarios and the observed and modeled baselines that were used (Tate and others 2004). Temperature changes are not consistent over the basin, with higher temperature rises in the more arid regions of the northern part of the Nile basin and lower rises closer to the equator (Elshamy 2000). Although most of the analyzed experiments showed an increase in precipitation over the basin (of up to 18 per cent), some experiments showed a reduction (of up to 22 per cent), while one experiment showed no signifi cant change. Clearly, the diff erent sub-basins of the Nile are highly sensitive to any changes in rainfall; and these changes are also likely to translate into changes in the fl ow regime of the river.
Figure 5.3: Diff erent order climate change eff ects on water resources.
Increase in ambientair temperature;changes in evaporation,precipitation,streamflow; sealevel rise
Decrease in water supply; increased flooding and drought; effect on agriculture, fisheries, and forest composition; land use change; Effect on hydropower capability
Instability of food prices; Increase in diseases; increase in electricity prices; trade imbalance; housing problem
Migration, unemployment, economic development, national security
First Order Second Order Third Order Fourth Order
Source: Chaleki and Gleick (1999) in Gain and others 2012

92
HotspotsHotspots, or critical regions, in this context, can be defi ned as ecosystems or localities especially vulnerable to climate and other social and environmental factors. A critical region, according to Alcamo and Henrichs (2002) is ‘a region whose water resources have higher sensitivity to global change than other regions’. There are numerous places in the Nile basin which, through the combination of precarious environmental, economic and social conditions, become vulnerable to additional threats. These places require special attention from the research, local and development communities to ensure healthy environmental dynamics are maintained or restored.
Identifi cation of the hotspotsA selection criterion was applied to identify these vulnerable hotspots. One condition for selection included an increase in water stress at the watershed level due to increasing water withdrawals or decreasing availability of water related to global change processes. Other criteria included those related to the areal extent, the state of the environment and the component ecosystems, resource availability, socioeconomic factors and the climate. The socioeconomic factors include the quality of life of the basin’s population, incomes, job
creation and public health. Table 5.3 shows the rating system for each variable, based on specifi c conditions and also highlights the results. The results show that the Ruwenzori mountains,
Sinking Nile delta, EgyptImages from 1965 and 2008 show that the Damietta Promontory, formed by one of the two principle outlets of the Nile River, eroded 1.5 km between 1965 and 2008. Similarly, the Rosetta Promontory lost over 3 km to erosion between 1968 and 2009. One study has found that the delta is sinking by 5 mm per year and attributes the main causes of the sinking to the dams along
Table 5.3: Results of ranking, showing hotspots (Ranking: 1=low; 2= medium; 3=high).
A Water shortage 1 low 2 medium 3 high
B Available surface water source 1 low 2 medium 3 high
C Groundwater shortage 1 low 2 medium 3 high
D Environmental degradati on 1 low 2 medium 3 high
E Populati on dependency 1 low 2 medium 3 high
F Ecosystem dependency 1 low 2 medium 3 high
G Groundwater regime 1 other areas 3 recharge/discharge areas
H Mean annual rainfall 1: >1 000 mm 2: 500-1 000 mm < 500 mm
I Socioeconomic benefi t 1 low 2 medium 3 high
JContributi on to the Nile River basin sustainability
1 low 2 medium 3 high
Hotspot area A B C D E F G H I J Total
Nile delta 1 3 1 2 3 3 3 3 3 2 24
Nile valley 1 3 1 2 3 3 3 3 3 2 24
Ethiopian plateau 2 3 3 3 1 3 3 1 3 3 25
Nile confl uence 1 3 1 2 3 3 3 3 3 2 24
Sudd 1 3 2 1 1 3 3 2 2 3 21
Mt. Ruwenzori 2 3 3 2 2 3 3 1 3 3 25
LIBYA EGYPT
SUDAN
M e d i t e r r a n e a n S e a
Re d S e a
92

93
Ethiopian plateau, the Nile confl uence in Sudan, the Nile delta and Nile valley in Egypt suff er from a lack of freshwater resources and require attention since this shortage may be exacerbated by climate change.
Tracking environmental change in the hotspots The following section highlights case studies of the identifi ed hotspots in the Nile basin. Satellite and other images provide striking visual evidence of the environmental changes taking place in each of these vulnerable regions.
Fishing at the Nile confl uence, Sudan.
joep
yrek
/ Fo
ter.c
om /
CC B
Y-SA
the river that trapped river sediments, and rising sea levels due to global warming. Since the closing of the Aswan High Dam in 1964, the forces of erosion have outstripped the balancing eff ect of sediment deposition (Stanley and Warne 1993). Seawalls are constructed in some areas to stop the Nile delta being eroded by the sea and regulated irrigation and increased groundwater exploitation may also help to reduce the delta’s decline. On the other hand, the population is growing in the region, increasing pressure on the delta and making saving the delta a greater challenge (UNEP 2010, Bohannon 2010).
93

94
Population growth in Khartoum, Sudan
Khartoum, the capital of Sudan, has an estimated overall population of over fi ve million and is situated at the confl uence of the White and Blue Niles. It is a tripartite metropolis consisting of Khartoum proper; Khartoum North and Omdurman to the west. Bridges link the latter two to the main city.
The population of metropolitan Khartoum is growing rapidly. The key drivers of urbanization are forced displacement, including infl uxes of refugees and seasonal and economic migrants; and the pull forces caused by the concentration of wealth and services in Khartoum. The provision of sanitation services has not kept up with the burgeoning population (Ali 1999) and since there is no wastewater treatment, water quality of the Nile has declined (El-Khodari 2003). Figure 5.4 shows population growth
EGYPT
SUDAN
ETHIOPIA
ERITREA
SOUTH SUDAN
LIBYA
CHAD
CENTRALAFRICANREPUBLIC
Re
d S
ea

95
in Khartoum over four decades from 1973 to 2008. The same increase is obvious in the series of satellite images from 1965 to 2011.
Figure 5.4: Population growth in Khartoum metropolitan area.
Khartoum, Sudan.
Flic
krJu
nkie
/ Fo
ter.c
om /
CC B
Y-N
C-SA
1973 1983 1993 2008
748 300
1 340 646
2 919 773
5 274 321
Popu
lati
on (m
illio
ns)
5
6
4
3
2
1
0
Source: Mohammed 2007, Pantuliano and others 2011, UNEP 2010
Confl uence of the Blue and White Nile.

96
Tekeze Arch Dam, Ethiopia
The Tekeze Arch dam is built on one of the key tributaries of the River Nile - the Tekeze river. The 188 m dam is part of a US$ 365 million hydropower project that is expected to produce 300 MW of power when fully operational. It was completed in August 2009 and is Africa’s highest dam at an altitude of 1 145 m. A massive landslide occurred in April 2008 near the dam due to adverse geologic and topographic conditions requiring stabilizing interventions which increased the overall cost of the project by US$ 42 million (Patel 2009). Concerns have been raised about the environmental and social impacts of the dam. Satellite images from 2003 and 2013 show the river before and after the dam’s construction (UNEP 2010).
ETHIOPIA
ERITREA
SOUTHSUDAN
SOMALIA
SUDAN
G u l f o f A d e n
SOMALIAKENYA
DJIBOUTI

97
The Tekeze Arch Dam in Tigray region, northern Ethiopia. A birds eye view of the double-curvature Tekeze Arch Dam.
© D
igita
lGlo
be 2
013/
Goo
gleE
arth
Inte
rnat
iona
l Riv
ers
/ Fot
er /
CC B
Y-N
C-SA

98
Drying lakes in the Lake Toshka depression, Egypt
The Toshka depression, part of the seismically active Nubian Swell, lends its name to the newly formed Toshka lakes. They were formed from the overfl ow of Lake Nasser. The excess water was released through a spillway into the desert as part of the New Valley Project that aimed to open up new areas to settlement and agriculture and to promote economic development. By September 1998, the easternmost lake was visible with the westernmost lake apparent by late 2000 (UNEP 2008). However, a more recent analysis of the satellite imagery between 2002 and 2010 indicates that the lakes are
LIBYA EGYPT
SUDAN
M e d i t e r r a n e a n S e a
Re d S e a

99
drying up. This is attributed to the decline in Lake Nasser’s levels in 2001. Since then, the water levels in the Toshka lakes have been declining being lost mainly to evaporation and to a lesser extent infi ltration. It is estimated that the lakes are shrinking at a rate of about 2.5 m/yr (UNEP 2010, Sparavigna undated). Environmental concerns include increasing salinity of the soil, loss of biodiversity in and around the lakes, reduction in water supply and impacts on peoples’ livelihoods.
Sheikh Zayed canal of the New Valley project, Libyan desert, Egypt.
Rém
ih /
Wik
i Com
mon
s / C
C BY
-SA
3.0

100
The impacts of the Jonglei canal on the Sudd swamp, South Sudan
The Sudd swamp is the largest freshwater wetland in the Nile basin. The wetland contracts to approximately 8 000 km2 during the dry season, while in the wet season, it expands to about 40 000 km2 in size (Lamberts 2009, Ahmad 2008) as seen in the wet and dry season satellite images. The annual pattern of fl ooding is an essential feature of the regional ecosystem and is crucial in supporting the local fl ora and fauna and the way of life and livelihoods of the local people. More than 50 per cent of the Sudd infl ow is lost to evaporation as it crosses the Bahr el Jebel wetland, reducing the availability of water in the downstream areas. To ensure a continual water supply to areas in Egypt and Sudan downstream
SUDAN
ETHIOPIA
SOUTH SUDANCENTRALAFRICANREPUBLIC
DEMOCRATIC REPUBLIC OF THE CONGO
KENYA
UGANDA

101
of the Sudd, in the early part of the 20th century, hydrologists proposed the construction of a canal 360 km long, 50 m wide and 4 m deep, which would allow 20 million m3 of water per day to bypass the swamps. Work on the Jonglei Canal began in 1978, but political instability in Sudan after 1983 held up work. The project is now being reconsidered, especially since hostilities ended in 2005. However, should the project resume, scientists are concerned about the possible eff ects on the ecosystem, climate, groundwater recharge, water quality, fi sheries and local people (UNEP 2010).
Fringing swamps on the White Nile, Jonglei state.
UN
EP

102
Merowe dam, Sudan
Located near the fourth cataract in Sudan’s Nubian desert and 350 km northwest of Khartoum, the Merowe dam was built to generate hydroelectricity for industrial and agricultural development. The power station was commissioned in late 2010. On completion, the dam was expected to generate about 6 000 GWh of electricity annually and have the potential to irrigate 400 000 ha of crops. The 170 km reservoir and the fl ooded region displaced a number of local tribes. By 2009, 78 000 people had been resettled under the Sudanese government’s resettlement program (UNEP 2010). The 1998 and 2013 images shows the region before and after the fi lling of the reservoir.
EGYPT
SUDAN
ETHIOPIA
ERITREA
SOUTH SUDAN
LIBYA
CHAD
CENTRALAFRICANREPUBLIC
Re
d S
ea

103
© D
igita
lGlo
be 2
013/
Goo
gleE
arth
Satellite image of Merowe dam, Sudan.

104
Agricultural expansion in Korti, Sudan
One of the largest irrigation schemes in Africa is being built 200 km downstream of the Merowe dam in Sudan. It includes an extensive canal network to irrigate 90 000 ha of agricultural land. The satellite images show the change from barren land in 2002 to its conversion to agriculture and settlement in 2013. Approximately 122 km2 of land shown in these images is now under agricultural development (UNEP 2010).
EGYPT
SUDAN
ETHIOPIA
ERITREA
SOUTH SUDAN
LIBYA
CHAD
CENTRALAFRICANREPUBLIC
Re
d S
ea

105
Before it was cleared for mechanized agriculture, this land in Blue Nile state consisted of low rainfall savanna and rangeland.
UN
EP

106
Agricultural expansion near Ismailia, Egypt
Egypt initiated the Eastern Nile delta and North Sinai development project to improve the productivity of the area through sustainability of water supply. They planned to bring an additional 26 million ha of land under cultivation through the building of irrigation canals. A canal was installed under the Suez Canal to bring water to the Sinai desert on the eastern side of the Suez Canal. The increase in area under agriculture (shown by yellow arrows) is evident in the 2013 image compared to the 2001 image (Abou El-Hassan and others 2008).
LIBYA EGYPT
SUDAN
M e d i t e r r a n e a n S e a
Re d S e a

107
Crossing the Suez Canal at Ismailia.
Alla
n_G
rey
/ Fot
er.c
om /
CC B
Y-SA
Ismailia, Egypt.
Dig
ital G
lobe

108
New lake formed near Mer Awi, Ethiopia
The Koga Irrigation and Watershed Management Project, funded by the African Development Bank, uses water from an artifi cial lake or reservoir created by the newly-built Koga dam. Some 2 000 ha of grazing land and homestead areas were inundated as a result. The project which began in 2008 diverts water from the Koga River to the reservoir before releasing it into a canal network that irrigates farm plots. When fully operational, it will irrigate 7 000 ha of land and according to the Ethiopian Ministry of Water Resources benefi t 67 550 farmers. The 2010 image shows the newly-formed lake, which has an area of about 18 km2.
ETHIOPIA
ERITREA
SOUTHSUDAN
SOMALIA
SUDAN
G u l f o f A d e n
SOMALIAKENYA
DJIBOUTI

109
Koga dam’s irrigation channel.
@ Z
EF
Koga dam’s intake tower.
© Z
EF
Lake during dry season.
Dig
italG
lobe
201
2

110
Agriculture expansion in the Nile delta’s Natron Valley, Egypt
The Natron Valley in Egypt’s western desert, northwest of Cairo, is a natural depression of salt fl ats. Ancient Egyptians used Natron salt from the shallow lakes in their mummifi cation processes. This desert area was considered sacred for the desert peoples and monastic communities. Agricultural activities have been moving from the Nile Valley’s fertile soils to the Natron Valley in the west, where irrigation from the Nile’s waters is now being supplemented by groundwater irrigation for vegetable crops due to high water tables. Studies show that between 1984 and 1999, 28 per cent of barren land was converted to agriculture. Between 1999-2005 and 2005-2009, this percentage was 14 and 19 per cent respectively (El-Kawy and others 2011). Satellite imagery between 1987 and 2013 show the extent of this expansion.
LIBYA EGYPT
SUDAN
M e d i t e r r a n e a n S e a
Re d S e a

111
Wadi Natrun.
mgl
erup
/ Fo
ter.c
om /
CC B
Y-N
C-SA

112
Owen Falls, Kira and Bujagali dams, Uganda
Uganda has built three dams on the River Nile near its exit from Lake Victoria. The Owen falls dam (renamed Nalubaale dam), generates hydroelectricity for Uganda and Kenya and controls the discharge from Lake Victoria into the Nile basin. The Kira power station extension was built in 1999 to provide additional hydropower capacity (USDA 2005). It is thought that the release of water through the dams is responsible for a two-metre decline in water levels in Lake Victoria. A third dam, Bujagali dam, built about 10 km downstream, is expected to produce 250 MW electricity at full capacity. This pair of images from 1995 and 2012 shows the three dams before and after construction.
UGANDA
UNITED REPUBLICOF TANZANIA
KENYA
DEMOCRATICREPUBLIC
OFTHE CONGO
SOUTH SUDAN

113
A B
©D
igita
lGlo
be 2
013/
Goo
gleE
arth
©D
igita
lGlo
be 2
013/
Goo
gleE
arth

114
Recession of the Mt. Ruwenzori glaciers, Uganda
The Speke, Stanley, and Baker peaks of the Ruwenzori mountains lie on the equator between Uganda and Democratic Republic of the Congo in the Ruwenzori block mountains. They are important water sources for the lower plains. Satellite images taken in 1995 and 2012, show a decline in the extent of the glaciers on these mountain peaks. Scientifi c studies done in 2003 and 2006, record the rapid recession of these glaciers, which decreased by 50 per cent between 1987 and 2003, most likely because of higher air temperatures and reduced snow accumulation during the 20th century. It is also possible that decreasing cloud cover over the same time period contributed to vaporization of these glaciers. If they continue to recede, as they have since 1906, experts believe they will be gone within the next 20 years.
UGANDA
UNITED REPUBLICOF TANZANIA
KENYA
DEMOCRATICREPUBLIC
OFTHE CONGO
SOUTH SUDAN

115
Snow pack in the Ruwenzori Mountains.
Jorn
Erik
sson
/ Fo
ter.c
om /
CC B
Y

116
Agriculture expansion near Ad Douiem, Sudan
Built in 1925 and since then extended, the Gezira scheme distributes water from the Blue Nile though canals and ditches to tenant farms between the Blue and While Nile. By the early 1960s, it had the capacity to irrigate 882 000 ha. It accounts for about 42 per cent of Sudan’s established irrigation area. Approximately 209 km2 of what was barren land has been converted to agricultural land, as seen in the 2011 image compared to the 2008 image. In 2011, there was a severe drought in Sudan. This pair of satellite images shows the decline in the Nile’s water level between 2008 and 2011.
EGYPT
SUDAN
ETHIOPIA
ERITREA
SOUTH SUDAN
LIBYA
CHAD
CENTRALAFRICANREPUBLIC
Re d
Se
a

117
A narrow strip of irrigated land on either side of the main Nile in the desert regions supports up to three crops a year.
UN
EP

118
ReferencesAbou El-Hassan, W.H., Kitamura, Y., Inoue, M. and K. Shimizu
(2008). Water and Agricultural Assessment for Sustainable Development of Sinai, Egypt. Laboratory of Soil Physics & Soil Hydrology. University of Tokyo, Tokyo.
Agrawala, S., Moehner, A., El Raey, M., Conway, D., van Aalst, M., Hagenstad, M. and J. Smith (2004). Development and Climate Change in Egypt: Focus on Coastal Resources and the Nile. OECD Development and Climate Change Project. Organisation for Economic Co-operation and Development (OECD), Paris.
Ahmad, A.M. (2008). Post-Jonglei planning in southern Sudan: combining environment with development. Environment and Urbanization. 2008 20:575. Sage Publications on behalf of International Institute for Environment and Development (IIED). http://eau.sagepub.com/content/20/2/575.full.pdf+html Accessed 6th Marcy 2013.
Alcamo, J. and T. Henrichs (2002). Critical regions: A model-base estimation of world water resources sensitive to global changes. Aquat. Sci. 64, 352-362.
Ali, S. (1999). Greater Khartoum: The Horizontal Expansion and its Impact on the Development of Settlement (in Arabic). Unpublished MA Thesis, Geography Department, University of Khartoum, Khartoum.
Anyah, R. O. and F. H. M. Semazzi (2006). NCAR-AGCM ensemble simulations of the variability of the Greater Horn of Africa climate, Special Issue, Theoretical and Applied Climatology, 86, 39-62.
Anyah, R.O., Semazzi, F.H.M. and Lian Xie (2006). Simulated physical mechanisms associated with the climate variability over Lake Victoria Basin in East Africa. Monthly Weather Review, 134, 3588-3609
Bates, B.C., Z.W. Kundzewicz, S. Wu and J.P. Palutikof [Eds] (2008). Climate Change and Water. IPCC Technical Paper VI. Intergovernmental Panel on Climate Change (IPCC). IPCC Secretariat, Geneva. http://www.ipcc.ch/pdf/technical-papers/climate-change-water-en.pdf Accessed 12 January 2013.
Bowden, J. H., and F. H. M. Semazzi (2007). Empirical Analysis of the Intraseasonal Climate Variability for the Greater Horn of Africa. J. Climate Volume 20, Issue 23, 5715–5731.
Bohannon, J. (2010). The Nile Delta’s Sinking Future. Science 19 March 2010: Vol. 327. no. 5972, pp. 1444 – 1447.
Conway, D. and M. Hulme (1996). The impacts of climate variability and climate change in the Nile Basin on future water resources in Egypt, Water Resources Development 12(3), 277-296
Downing, C., Preston, F., Parusheva, D., Horrocks, L., Edberg, O., Samazzi, F., Washington, R., Muteti, M., Watkiss, P. and W. Nyangena (2008). Kenya: Climate Screening and Information Exchange. AEA/ED 05603/Issue 2. AEA Technology, UK. http://www.dewpoint.org.uk/Asset%20Library/DFID/Climate%20Risk%20Assessment%20Report%20-%20Kenya.pdf Accessed 12 January 2013.
El-Kawy, O.R., Rød, J.K., Ismail, H.A.,Suliman,A.S. (2011). Land use and land cover change detection in the western Nile delta of Egypt using remote sensing data. Applied Geography 31 (2011) 483-494.
El-Khodari, N. (2003). The Nile River: Challenges to sustainable development. Presentation to the River Symposium CEO, Nile Basin Society, Canada.
Elshamy, M.E.A.M. (2000). Impacts of climate change on Nile flows. Diploma of Imperial College Thesis, Imperial College London, London.
Elshamy, M.E., Seierstad, I.A. and A. Sorteberg (2008). Impacts of climate change on Blue Nile flows using bias-corrected GCM scenarios. Hydrol. Earth Syst. Sci. Discuss., 5, 1407–1439, 2008. http://hal.archives-ouvertes.fr/docs/00/29/89/55/PDF/hessd-5-1407-2008.pdf
Gain, A.K., Giupponi, C. and F.G. Renaud (2012). Climate Change Adaptation and Vulnerability Assessment of Water Resources Systems in Developing Countries: A Generalized Framework and a Feasibility Study in Bangladesh. Water 2012, 4, 345-366; doi:10.3390/w4020345. www.mdpi.com/journal/water
IPCC (2007). Climate Change 2007: Working Group II: Impacts, Adaptation and Vulnerability. IPCC Fourth Assessment Report. Intergovernmental Panel on Climate Change (IPCC), Geneva.
Lamberts, E. (2009). The effects of Jonglei Canal operation scenarios on the Sudd swamps in Southern Sudan. MS Thesis. University of Twente, Netherlands. http://essay.utwente.nl/59163/. Accessed 6th March 2013.
MA and WRI (2005). Millennium Assessment report. Ecosystems and Human Well-being: General Synthesis. Millenium Assessment (MA) and World Resources Institute (WRI), Washington D.C.
Martens, A.K. (2011). Impacts of Global Change on the Nile Basin. Options for Hydropolitical Reform in Egypt and Ethiopia. International Food Policy Research Institute (IFPRI), Washington D.C. www.ifpri.org/sites/default/files/publications/ifpridp01052.pdf Accessed 12 December 2012.
Mohammed, B. (2007). Changes of Water Quality along the River Nile. Linköping, Sweden. Master’s Thesis. Department of Water and Environmental Studies Linköpings Universitet.

119
Nour, S. (1996). Groundwater potential for irrigation in the East Oweinat area, Western Desert, Egypt. Environmental Geology 27:143-154
Pantuliano, S., Buchanan-Smith, M., Metcalfe, V., Pavanello, S., Martin, E. ( 2011). City limits: Urbanization and vulnerability in Sudan, Khartoum case study. Human and policy group, Overseas Development Institute, London.
Patel, S. (2009). Ethiopia Completes Construction of Africa’s Tallest Dam. Electric Power, Houston Tx, USA. http://www.powermag.com/renewables/hydro/2012.html Accessed on July 15, 2012.
Sayed. M.A.A (2004). Lake Nasser Management, Integration with Risks Posed by Floods and Droughts Hazards, for Achieving Food Security in Egypt. World Water Week, Stockholm Water Symposium, Stockholm, 15-21 August, 2004.
Schreck, C. J., and F. H. M. Semazzi (2004). Variability of the recent climate of eastern Africa. Int. J. Climatol., 24, 681-701.
Sterman, D. 2009. Climate change in Egypt: Rising sea level, dwindling water supplies. Climate Institute, Washington, D.C. http://www.climate.org/topics/international-action/egypt.html Accessed 13 December 2012.
Tate, E., Sutcliffe, J., Declan, C., and F. Farquharson (2004). Water Balance of Lake Victoria: Update to 2000 and Climate change Modeling to 2100. Hydrology and Earth System Sciences 49(4):563–574.
UNEP (2010). Ruwenzori Glaciers. Africa water Atlas Division of Early warning and Assessment. United Nations Environment Programme (UNEP), Nairobi. http://na.unep.net/atlas/webatlas.php?id=270 (accessed July 22, 2012).
USDA (2005). Low Water Levels Observed on Lake Victoria. Production Estimates and Crop Assessment Division
Foreign Agricultural Service. http://www.fas.usda.gov/pecad/highlights/2005/09/uganda_26sep2005/index.htm.
Yates, D. and Strzepek, K. (1998). Modelling the Nile Basin under Climatic Change. J. Hydrol. Engrg. 3(2), 98-108

120
Chapter 6IMPACTS OF CLIMATE CHANGE
Introduction to global climate changeIn the 1980s, a global body of climate scientists, the International Panel on Climate Change (IPCC) was formed to provide scientifi c advice to support international political negotiations over how to respond to climatic change. This body’s climate projections, based on diff ering scenarios of future greenhouse gas emissions as well as models with diff ering climate sensitivity, indicates that the average global surface temperature will likely rise a further 0.6 to 4°C with a likely range between 0.3 and 6.4°C during the 21st century (IPCC 2007). It also portends that precipitation will increase in high latitudes and decline in most subtropical regions. As a result of the rising global temperature, sea levels will rise, the intensity of extreme weather events is expected to increase and the amount and pattern of precipitation will alter. These changes will aff ect water resources and in turn have impacts on agricultural yields, trade routes, glacial retreat, species extinctions and water-related diseases, among others. The main scientifi c uncertainties include the impact of warming and related changes on water resources from region to region around the globe. Figure 6.1 shows the regions where water stress is currently most acute.
Future water stress in the Nile basinThe Nile basin is an internationally shared system of sub-basins, which provides vital water resources to highly vulnerable populations. The stresses the basin system already suff ers, including the ever increasing demand for water as populations continue to grow, will be exacerbated by the many uncertainties related to climate change impacts, which could stall enacting eff ective climate change adaptation plans.
The eleven countries that share the Nile basin need a clear understanding of the probable future trends in climate change, the socioeconomic and political drivers that contribute to it and the potential key river-basin responses so they can cooperate in promoting proactive policies to address potential water-use related confl icts. For example, the potential direction and magnitude of changes in rainfall and its variability as well as changes in river fl ows as a result of climate change will aff ect future water sharing regimes and other cooperative arrangements. In addition, the uncertainty is a signifi cant challenge to climate adaptation plans. Understanding the inherent implications for policy and water management and the choice of paths forward is critical to promoting water security, human well-being and adaptation needs in the wake of climate change.
Climate change scenario analysis and modeling can improve the understanding of the likely impacts of climate change on water systems. In order to provide these analyses, this chapter:
• models water stress and related risk factors as a function of regional climate patterns;
• provides hydrological data on specifi c hotspots and policy responses to a range of current and future variability’s and uncertainties; and
• generates predictive trends in key water resources parameters under a range of climate change scenarios using the ‘hotspot’ methodology.
The IPPC (2007) stresses that many African river and lake basins are hotspots for climate change, meaning they are particularly vulnerable to the projected impacts of a changing climate. Even the most optimistic scenarios, which predict only low or moderate climatic change, suggest that average temperatures will increase signifi cantly by the end of the century compared to changes over the last century. In the Nile basin, climate change impacts are likely to be severe and depending on the variables,
nood
lepi
e / F
oter
/ CC
BY-
NC

121
Multi-year droughts in USA and southern Canada
Land subsidenceand land slides inMexico City
Water supply a�ected byshrinking glaciers in Andes
Damage to riparian ecosystems due to �ood protection along Elbe river
Rural watersupply a�ected by extendeddry season inBenin
Area of LakeChad declining
Water supply reduced by erosion and sedimentation in reservoirs in north-east Brazil
Health problems due to arsenic and �uoride in groundwater in India
Flood disasters in Bangladesh (more than 70% of the country inundated in 1998)
Huanghe river has temporarily run dry due to precipitation decrease and irrigation
Damage to aquatic ecosystems due to decreased stream�ow and increased salinity in Murray-Darling basin
Water stress indicator: withdrawal to availability ratio
Water withdrawal: water used for irrigation, livestock, domestic and industrial purposes (2000)Water availability: average annual water availability based on the 30-year period 1961-90
No/low stress and per capita water availability <1 700m3/yr
0 0.1 0.2 0.4 0.8
no stress low stress mid stress high stress very high stress
Figure 6.1: Current vulnerabilities of freshwater resources and water stress map.
Source: IPCC 2007
specific places will be affected differently. Some locations such as the identified hotspots are especially sensitive to the impacts of change, whereas others are more resilient and thus able to cope with the effects of change.
Past studies documented in IPCC reports indicate that higher temperatures, disruption to groundwater recharge capacity, lower water availability and desertification processes are already occurring in the Nile basin. In North Africa, these are likely to reduce crop productivity by up to 23 per cent (Bontempo and others 2010). The projected higher temperatures are also likely to affect humans in the region in other ways. These will range from increasing mortality and morbidity due to changes in
vector-borne diseases to economic impacts due to a reduction in tourism if visitors are no longer attracted to the basin’s changing landscapes. The Nile delta in Egypt is particularly at risk from rising sea levels and flood hazards are high because of its densely populated coasts. Across the entire Nile basin system, higher temperatures are likely to stress energy production, including electricity provision. Climate change projections also indicate the possible negative impact of intense extreme events, such as floods and drought, on health, infrastructure and biodiversity. There are numerous studies providing evidence of the potential impacts of climate change on the water resources of the basin.
Although floods can be disastrous, they are part of nature’s renewal process bringing silt that provides the fertile soil so essential for agriculture.
121
Gre
gSan
ders
/ Fo
ter.c
om /
CC B
Y-N
C-SA
121

122
Climate futures in the Nile basinMethodologyThe purpose of this scenario exercise was to determine the plausible long-term changes and responses in addressing climate change induced water stress in the Nile basin using the hotspot methodology. The assessment is based on past scenarios that conducted analyses, modeling and foresight explorations based on the premise that in addition to affecting the environment, climate change will also have economic, health and social impacts that will influence the livelihoods and social well-being of the people of the region.
The hypothesis was that any comparative study of future climate change induced water stress on the basin must have developed both climate change and impact scenarios in order to allow the climate information to be extrapolated to water-resources impact and adaptation information. The process required the determination of some key points:
• The trajectory of water stress trends and priority climate change parameters (temperature, precipitation and evapotranspiration)
• Tracking and mapping future extremes, hotspots and proposing possible adaptation options
• Identifying response options for each scenario as well as trade-offs between scenarios and options.
The resulting synthesis of future scenarios is based primarily on rainfall, temperature, underground water parameters and evapotranspiration. In addition, the hotspot-level hydrological regimes were tracked to ascertain the impact of climate change. A review of statistical post-simulation processing was done after running both reference and future scenarios. In each scenario, the estimated changes in cumulative temporal water volume, recharge capacity, recharge and flow extremes are presented. Figure 6.2 below shows a scenario approach in determining climate change impacts and water stress and possible adaptation strategies.
Scenario descriptions and assumptionsA deliberate choice was made to track future expected ‘changes’ as well as some other water related indicators in three selected hotspots. These were identified on the basis of their critical role in helping to maintain resilience in the Nile basin systems and their importance to response and management options in the wake of climate change. The hotspots exhibit great sensitivity to climate
GCM scenarios
RCM scenarios Long term series
Agro-ecology scenarios
Temperature
{CO2}
Water Resources
Rainfall
Runoff
GW recharge
Storage
Trends in use
Rainfall
Adaptations Adaptations
Irrigation
Agro-economic Costs and Bene�ts
Production Income (Household
and commercial ) Food securityEto / Eta
Transition/Economic Development scenarios
Availability, streamflow
, withdraw
al, water
use - variability within years, across years
Figure 6.2: Generic scenario approach to determining climate change impacts and water stress as well as adaptation strategies.
Sources: Adapted from FAO 2011

123
Figure 6.3: Global CO2 business-as-usual-emissions scenario - (a) CO2 emissions; (b) CO2 concentrations.
change and their continued viability is relatively important for the overall sustainability of the Nile basin. This review adopted the IPCC scenarios (Special Report on Emission Scenarios - SRES) in combination with related socioeconomic scenarios. The assumptions for the SRES futures used in the analysis in this chapter are presented in table 6.1.
The SRES scenarios translate into six main greenhouse emission ‘marker’ scenarios: one each for the A2, B1, and B2 worlds, and three variants (a family) for the A1 world. The variations in
these markers depend on the primary energy source. The selected markers used in this scenario analysis and review process was run using one of the three selected global climate models (GCM) and regional climate models (RCM) to yield the future water stress parameters for Nile basin sub-regions, hotspots and selected issues. Global annual CO2 emissions under the six marker scenarios and cumulative eff ects on atmospheric CO2 levels, which were used as a baseline, are depicted in fi gure 6.3 based on an assessment by Houghton and others (2001).
The Nile delta scenario outlookDiff erent scenarios project that the Nile delta will experience diff erent degrees of change related to shoreline modifi cation (erosion and accretion) along the north coast as well as sea level rise (SLR) and other climate change impacts. These would require associated protection measures. Under the A1 scenario, the region would experience low SLR of up to 0.20 m; a medium SLR of 0.5 m would occur in A2; and a high SLR of about 0.90 m would
25
20
15
10
5
2000 2020 2040 2060 2080 2100
Year
2000 2020 2040 2060 2080 2100Year
CO2 e
mis
sion
s (G
t - C
per
yea
r)
1 300
1 100
900
700
500
1 200
1 000
800
600
400
300
CO2 c
once
ntra
tion
(ppm
)
ScenariosA1BA1TA1F1A2B1B2IS92a
ScenariosA1BA1TA1F1A2B1B2IS92a
Table 6.1: Description of assumptions of the IPCC’s Special Emissions Scenarios.
Scenario Descripti on
A1 very rapid economic growth; low populati on growth; rapid introducti on of new and more effi cient technology; economic and cultural convergence and capacity building; people pursue personal wealth rather than environmental quality
A2 strengthening regional cultural identi ti es; an emphasis on family values and local traditi ons; high populati on growth; less concern for rapid economic development
B1 rapid change in economic structures; ‘dematerializati on’ and introducti on of clean technologies; emphasis on global soluti ons to environmental and social sustainability; concerted eff orts for rapid technology development; dematerializati on of the economy
B2 emphasis on local soluti ons to economic, social, and environmental sustainability; a heterogeneous world with less rapid, and more diverse technological change; strong emphasis on community initi ati ves
Source: Houghton and others (2001)
John
Kan
nenb
erg
/ Fot
er /
CC B
Y-N
C-N
D
Rising sea levels threaten developments along the coast.

124
occur in B2. The SLR would be largely associated with decades of temperature anomalies towards 2050 over Egypt and globally (table 6.2 and 6.3). Sea-level rise would be accompanied by a rapid increase in salinity because salt water from the Mediterranean Sea would flow into the Delta’s soils and the high temperatures would negatively affect their organic matter content. Like other low lying and heavily populated coastlines, the Nile delta will suffer from ‘sediment starvation’, subsidence and other stresses that will accelerate inundation, shoreline recession, wetland deterioration and interior land loss (IPCC 2007). In particular, saltwater intrusion into freshwater aquifers remains a risk in high-SLR scenarios in the Nile delta (Sherif and Singh 1999).
The risks to large cities, industry, flourishing agriculture and tourism are dominant features of the Nile delta scenarios. The Nile delta and wider Mediterranean coast account for 30-40 per cent of Egypt’s agricultural production and more than half of Egypt’s tourism and industrial base. As a Low Elevation Coastal Zone (less than 10 m above sea level), the area would be seriously affected by sea level rise, saltwater intrusion and other potential social and economic impacts of climate change, which could be
devastating for the country’s future. The delta is already vulnerable to relative sea level rise and subsidence, and these trends will continue with climate change. The risks include exacerbating the reduced sediment flows that occurred with the construction of the Aswan Dam, thus weakening and potentially destroying the protective offshore sand belt. The results would include impaired water quality in the existing coastal freshwater lagoons due to accelerated seawater intrusion. Further inundation of beach facilities would affect tourism and millions of people would be displaced as more cropland is lost.
Following recent trends in the decline of per capita water availability in Africa, any degree of increase in global water temperatures will seriously affect the Nile basin’s water balance. The IPCC (2007) projects that by 2020, between 75 and 250 million people in Africa will suffer increased water stress due to climate change. The Nile region will experience a decrease of 75 per cent of per capita water availability by 2100 (UNEP 2006). An increase of over 2oC could destroy the water surplus that Egypt currently enjoys (annual water supply of 63.7 km3 against an estimated annual use of 61.7 km3). Aside from climate change,
Table 6.2: Spatially averaged temperature anomalies over Egypt under A2 and B2 scenarios.
Table 6.3: Spatially averaged evapotranspiration anomalies (%) over Egypt.
Sunset in the Nile delta, Egypt.
124 l.mis
sant
/ Fo
ter /
CC
BY-N
C
Source: Attia 2011
Source: Attia 2011
Climate model
A2 B2
2020s 2050s 2080s 2020s 2050s 2080s
CGCM2 1.38 2.70 4.19 1.32 2.14 2.91
ECHAM4 1.04 2.13 3.81 0.78 1.78 2.70
HadCM3 1.34 2.54 4.26 1.48 2.27 3.19
Climate model
A2 B2
2020s 2050s 2080s 2020s 2050s 2080s
CGCM2 6 9 14 7 8 10
ECHAM4 1 4 9 1 4 5
HadCM3 4 7 12 4 6 8

125
other drivers that will worsen the water balance and threaten water security include population increase in all the Nile basin countries. Both the Nile valley and delta are inherently sensitive to changes in the water balance occasioned by climate change; as water consumption rises due to high population growth rates, the impacts on total water supply will be heightened.
Coherent policies, regulations and actions will need to continue to reduce disaster risks in low-lying coastal areas. Such
risk reduction strategies should continue to be integrated into other land, water and national development plans. Regardless of the scenario, there is evidence that the continued adoption of the ‘living shorelines’ approach (figure 6.4) to protect against SLR effects alongside other ‘soft’ approaches will go a long way towards stabilizing banks and restoring habitats by reinforcing coastlines, reducing coastal erosion and maintaining important coastal ecosystems processes. Approaches that use techniques such as sand accretion and installing protection structures can help address destructive climate change impacts on water quality and physical infrastructure as well as other impacts within the Nile delta.
Sea level rise is already occurring and its impact is becoming increasingly apparent, especially within 20 km of the Nile delta coastline. The Arab Forum (2009) study provides detailed data on the impact of SLR on the Arab world including Egypt and shows that under the various SLR scenarios an increasing number of inhabitants and land area will be directly affected with greater and greater inundation of the coastal territories. The low lying Nile delta is already retreating at 100 m per year affecting an area of about 24 900 km2. This recession affects about 65 per cent of Egypt’s agricultural area. Under most scenarios explored by the Arab Forum (2009), much more of the Nile delta may be permanently lost. For instance, the study estimates that a sea level rise of only 1 metre would flood much of the Nile delta, inundating about 34 per cent of its land, placing important coastal cities such as Alexandria, Idku, Damietta and Port Said at a great risk and displacing about 8.5 per cent of Egypt’s population (about
Crashing waves, Alexandria, Egypt.
mad
.raf.d
in /
Fote
r / C
C BY
-NC-
ND
Figure 6.4: The ‘living shoreline’ approach involves rehabilitating shoreline habitats with plants, rocks, sand or other structural or organic materials to enhance the natural connections between the uplands and marine areas.
Coastal Shoreline Continuum Ideal and“Living Shorelines” Treatments
UPLAND BUFFER COASTAL WETLANDS AND BEACH STRAND
SUBTIDAL WATERS
TIDAL MARSH SAV LIVING BREAKWATER
Extreme High Tides and Storms
Mean High TideMean Low Tide
RiparianVegetation
ManagementBank Grading
Fibre Logs
Tidal MarshEnhancement
Tidal Marsh CreationBeach Nourishment and
Dune RestorationMarsh Toe Revetment
Marsh SillMarsh with Groins
Living BreakwaterOffshore Breakwater System
Oyster Reefs
Irregularly Flooded RegularlyFlooded
BANKFACE
Source: Burke Environmental Associates

126
P
P
P
P
P
P
P
P
P
P
P
P
P
P
P
P
P
P
P
P
P
P
P
P
N
Alexandria
El-Giza
CAIROSuez
Alexandria
El-Giza
CAIROSuez
Alexandria
El-Giza
CAIROSuez
Alexandria
El-Giza
CAIROSuez
Alexandria
El-Giza
CAIROSuez
Alexandria
El-Giza
CAIROSuez
Kilometres0 40 80
+0 m sea level rise +1 m sea level rise
+2 m sea level rise +4 m sea level rise
+6 m sea level rise +20 m sea level rise
M e d i t e r r a n e a n S e a
M e d i t e r r a n e a n S e a
M e d i t e r r a n e a n S e a
M e d i t e r r a n e a n S e a
M e d i t e r r a n e a n S e a
M e d i t e r r a n e a n S e a
Figure 6.5: Scenarios showing the impacts of diff erent SLR (0, +1, +2, +4, +6 and +20m) scenarios on the Nile delta.
Source: Simulated from the interactive map on relative levels of fl ooding on the Nile delta as a result of sea level rise, http://geology.com.

127
7 million people). Sea level rise higher than 4 m will threaten at least 10 major cities (among them Alexandria, Damanhur, Kafr-El-Sheikh, Damietta, Mansura and Port-Said). A mere 1-metre sea level rise would submerge the city of Alexandria. Figure 6.5 illustrates the simulated impact of different SLR scenarios on the Nile delta.
The Nile valley scenario outlookFuture changes to the Nile valley aquifer will be based on how climate change and water resource development and abstraction projects affect the recharge capacity of the shallow aquifer. The
hydrogeological regime throughout the upstream sections of the Nile basin depends on regional recharge from the Ethiopian plateau and the discharge zone of Sudan, which in turn are affected by climate. Climate change impacts on flow and runoff from the basins adjacent the Blue Nile will determine the recharge of the Nile valley’s crystalline and volcanic aquifers.
The effects of climate change on significant sections of the Equatorial Lakes region are also important in the status of water resources in the Nile valley. As the climate changes, so will human use of water, such as increased irrigation, heightened tapping of groundwater from shallow wells and other storage structures such as dams along the Nile basin; these activities may affect the Nile
The coast along the city of Alexandria, Egypt.
dung
odun
g / F
oter
.com
/ CC
BY-
SA

128
valley flow and condition of downstream aquifers. Future water-related stress factors and uncertainties remain largely linked to precipitation patterns and future patterns and quantities of surface and groundwater. Past scenario analyses have linked changes in the water resources of the Nile valley in Egypt to upstream changes in the Ruwenzori mountains and Ethiopian plateau, the Nile confluence in Sudan and flows in both the Blue and White Niles.
The Nile valley aquifer system, which is mainly composed of alluvial deposits, will invariably be affected by recharge capacities linked to climate regimes but there are a number of uncertainties regarding how this will occur. In all possible scenarios, runoff potential, evaporation and upstream water-use form the basis of rainwater infiltration into the drainage basins of the ‘wadis’ or river valleys. Other factors that influence how the climate affects the aquifer and Nile valley water systems include the possibility of upward leakage from the underlying deep aquifer. This source of recharge depends on surface water movements, which are affected by evapotranspiration. Other uncertainties include the stability of the Aswan High Dam, which also influences recharge to the alluvial aquifer through the vertical percolation of irrigation
water. Climate change will also affect the intensification of perennial irrigation in Upper Egypt and the rise in aquifer levels is expected to be over 2 m in some scenarios. In addition, the thickness of the valley’s flood plain will be affected, with likely variations of up to and over 300 m.
The Ethiopian plateau scenario outlookIn the Ethiopian plateau, the analysis focused on how water stress and related human activities would change under different climate futures. The main uncertainties explored include a substantial increase in water use from the Blue Nile and its tributaries and increased water infrastructure in the plateau. Changes in temperatures, variations in inter-annual average rainfall and total Nile flows are the main drivers of downstream and upstream water balance. The unique features of the Ethiopian plateau that help understand upstream changes in the Nile basin include its large area and diverse hydrological features, inter-annual and decadal changes in water discharge, variable groundwater capacity, a large span of different climate regions, variable topography, high runoff variability and high sensitivity to climatic change.
CDKN
etw
ork
/ Fot
er.c
om /
CC B
Y
Maize crop affected by drought, Uganda.
128

129
The impacts of climate change on the Ethiopian plateau’s hydrological regime will be mainly seen in the fl ow of the Blue Nile. Elshamy and others (2009) projected changes of between (-)60 to (+)45 per cent across 17 scenarios (which were statistically downscaled using the Bias Correction Method) as shown in fi gure 6.6.
Projected changes to sub-basin ecosystems, especially the lakes, illustrate the sensitivity of the Ethiopian plateau to future climates. Setegn and others (2011) investigated the sensitivity of water resources to climate change in the Lake Tana basin using GCM outputs (stream fl ow and hydrology) from daily temperature and precipitation data. The study found statistically signifi cant declines in annual stream fl ow for periods after 2050 for four out of the nine GCMs simulated under the A2 scenario.
Many scenarios that project future water resource balances in the Ethiopian plateau reveal that climate change will principally aff ect Blue Nile fl ows through runoff variability and changing upstream demand. Kim and Reichler (2008) used the outcomes of GCMs through weighted scenarios to demonstrate the impacts of
A farmer arrives to a fi eld day with his sheep, Ethiopia.
ILRI
/ Fo
ter.c
om /
CC B
Y-N
C-SA
0
2
4
6
8
10
12
14
16
18
20
22
Jan Feb Mar Apr May Jun Jul Aug Sep Oct Nov Dec
Flow
(BCM
)
Ensemble Mean 2081-98
Observed 1961-90
Figure 6.6: Projected fl ow of the Blue Nile across 17 statistically downscaled scenarios.
Source: Elshamy and others 2009

130
0 35 70
p(%)
0 to 5
5 to 10
10 to 15
15 to 20
N
0 35 70
T(⁰C)
2.25 to 2.30
2.30 to 2.35
2.35 to 2.40
N
0 35 70
PET(%)
10 to 15
15 to 20
20 to 25
N
0 35 70
Q(%)
10 to 15
15 to 20
20 to 25
0 to 5
5 to 10
10 to 15
15 to 20
20 to 25
N
(a) (b)
(c) (d)
km km
km km
Figure 6.7: Spatial distribution of average annual changes in climate variables and runoff under weighted scenario for the 2050s: (a) precipitation, (b) temperature, (c) potential evapotranspiration, and (d) runoff.
Source: Kim and others 2008
climate change on both the hydrology and water resources for the 2050s. Figures 6.7 and 6.8 illustrate the projected climate and flow parameters they generated.
The Ethiopian government’s proposed construction of two dams (Karadobi and Border) adds to the uncertainty of changes in precipitation, temperature, potential evapotranspiration, and runoff across the sub-basin. The lessons from the scenarios reviewed indicate that both hydropower generation and water-storage goals can be regulated in ways that do not affect downstream flow.
Tracking other water stress indicatorsRecent hydrological sensitivity studies indicate that small meteorological changes can result in relatively large changes in runoff and water availability (Beyene and others 2010, Booij and others 2011). Understanding the possible future impacts of climate change on runoff and water availability in the Nile basin is therefore important for any meaningful conception of adaptation plans and basin management that recognizes short and long term uncertainties. The key water stress indicators assessed include water availability, water use by sector, hydropower generation

131
and land use change. Future changes and uncertainties in the allocation of Nile water resources will certainly affect local and regional economies, agricultural production, energy availability and environmental quality (Beyene and others 2010, Conway 2005). Uncertainty associated with population growth and climate change will exacerbate natural variability. Uncertainties about future emissions will have direct implications for policy decisions and public responses. These trends will need to be relied upon to help water management solutions evolve in the Nile basin as well as to inform the basin’s economy, including social and environmental impacts.
Booij and others (2011) used the Nile Hydrological Simulation Model to transform rainfall to runoff data using an integrated model for flow-routing, flow-diversion, storage in reservoirs and lakes and abstraction for agricultural, domestic and industrial water use.
There have also been many studies on the potential impact of climate change on different catchments in the Nile basin over the past decade using outputs from GCMs (Taye and others 2010, Gleick 1991, Conway and Hulme 1993, Conway and Hulme 1996, Strzepek and Yates 1996, Conway 2005; Kim and others 2008, Beyene and others 2010). They have used the approach of translating stated changes in climatic inputs into changes in hydrological regimes. However there are limitations to this approach. Some of which stem from coarse spatial resolution in GCM (Beyene and others 2010) and other inadequacies such as limited evidence on the implications of using diverse hydrological models for specific climate change scenarios. Most recent
GCMs are also limited in their capacity to describe and predict extreme hydrological conditions in specific hotspots, which are of economic, social, political and ecological importance to the Nile basin region.
In a series of scenario studies, Elshamy and Wheater (2009) found that RCMs provide a viable downscaling methodology and confirm the uncertainty regarding the direction of change for rainfall and flow due to climate change. The study found that even with the RCM, the expected ranges for changes in rainfall, temperature, and potential evapotranspiration are smaller than in previous studies and noted possible changes in flows of -19 to +29 per cent for the Blue Nile (at Diem) and -8 to +10 per cent for the White Nile (at Malakal).
Past climate modeling and scenario work on the Nile basin have yielded different results for precipitation. However temperature projections are relatively consistent with potential evapotranspiration changes being even more reliable. A study by Nawaz and others (2010) confirmed these disparities and consistencies while many others indicate wetter conditions over the Blue Nile basin, for 2020, 2050 and 2080 (Nawaz and others 2010, Kebede and others 2006, Taye and others 2010, Beyene and others 2010, Kim and others 2008). Recent studies, however, have overlooked the implication of land use change, such as overgrazing, deforestation, and improper farming practices in the Ethiopian highlands. In the future, land use change and related practices will continue to influence stream flow, flooding and other hydrological changes. Temperature, a major driver of hydrological changes in the basin, is likely to increase (see, for example, projections in figure 6.9 over Lake Victoria).
1960 1980 2000 2200 2400 2600 2800 3000
320
310
300
290
Tem
pera
ture
(Kel
vin)
B2 scenarioA2 scenario
20
30
40
Tem
pera
ture⁰C
Figure 6.9: Projections of temperature variations over Lake Victoria in the 21st century.
Source: Adapted from Georgakakos and others 2005
Figure 6.8: Spatial distribution of percentage changes in flow statistics under the weighted runoff scenario for the 2050s.
0 35 70
Q10(%)
-15 to -10
-10 to -5
-5 to 0
0 to 5
5 to 10
10 to 15
15 to 20
N
0 35 70
Q50(%)
-15 to -10
-10 to -5
-5 to 0
0 to 5
5 to 10
10 to 15
15 to 20
N
0 35 70
Q90(%)
-25 to -10
-10 to 0
0 to 5
5 to 10
10 to 15
15 to 20
N(a) (b) (c)
km kmkm
Source: Kim and others 2008
Planting trees in Ethiopia to help control erosion and reduce climate change.
IIP S
tate
/ Fo
ter.c
om /
CC B
Y-N
D

132
Future changes in climate are bound to aff ect the lake ecosystems, since they are considered hotspots for environmental change. Key climate parameters, including average monthly temperature, evapotranspiration, average monthly precipitation, average monthly cloudiness and average monthly vapour pressure, will change. Using the HadAM3 model and assuming the IPCC’s A1 scenario at the 0.5° resolution, the expected trends in Lake Victoria’s temperature and precipitation are shown in Figures 6.10 and 6.11. Tate and others (2004) used the HadCM3 A2a and B2 emission scenarios to analyze the sensitivity of Lake’s Victoria’s water balance to climate change; they found that changes in
annual rainfall and evaporation could lead to declining water levels over the 2021–2050 period.
Climate change will aff ect Nile basin fl ows through fl uctuations of lake levels, such as those in Lakes Tana and Victoria, both of which control water fl ows in the Blue Nile and White Nile respectively. This will directly aff ect rainfall and runoff , the main contributors to lake infl ows. Climate change will aff ect rainfall, lake and wetland storage and stream fl ow in the Kagera basin, which feeds Lake Victoria. Diff erent scenarios of climate change project profound eff ects on the sensitive link between lake rainfall, infl ow and evaporation, which controls the complicated water
Jan Feb Mar Apr May Jun Jul Aug Sep Oct Nov Dec
21.5
22.0
22.5
23.0
23.5
24.0
24.5
25.0
25.5
Tem
pera
ture
(°C)
Lake Victoria north in 2000
Lake Victoria north in 2050
Lake Victoria south in 2000
Lake Victoria south in 2050
Figure 6.10: Expected and measured temperatures for the north and south of Lake Victoria (ten year average, 1990-2000 and 2040-2050).
Figure 6.11: Expected and measured annual temperature diff erences over the north and south of Lake Victoria, 2000-2050 Water Balance: basin Flows.
Jan Feb Mar Apr May Jun Jul Aug Sep Oct Nov Dec
1.8
2.0
2.2
2.4
2.6
2.8
3.0
Mon
thly
tem
pera
ture
diff
eren
ce 2
000
- 205
0
Lake Victoria north Lake Victoria south
The source of the Blue Nile at Ethiopia’s Lake Tana.
132
The source of the Blue Nile at Ethiopia’s Lake Tana.
132
Source: Based on modeling data from EAGLON undated
Source: Based on modeling data from EAGLON undated

133133
the
apos
trop
he /
Flic
kr /
CC B
Y-N
C-SA
2.0
133
0 1 2 3 4 5 6 7 8 9 10 11 12 13 14 15 16 17 18 19 20 21 22 23 24 25 26 27 28 29 30
13.5
13.0
12.5
12.0
11.5
11.0
10.5
Lake
leve
l (m
)
BaselineA 1961-902021-2050 A2a2021-2050 B2
2071-2090 B2
2071-2090 A2a
BaselineA 1961-902021-2050 A2a2021-2050 B2
2071-2090 B2
2071-2090 A2a
BaselineA 1961-90
BaselineB 1931-60
Year
Figure 6.12: Thirty-year lake levels and levels with changes in rainfall and PE in Lake Victoria.
Source: Adapted from Georgakakos and others 2005
balance in both lakes. This will dictate both infl ow and outfl ow to various degrees. Tate and others (2004) used the HadCM3 model to simulate annual rainfall and potential evaporation for 2021–2050, based on baseline data on water balance in Lake Victoria.
Figure 6.12 presents the simulation results based on A2 and B2 emissions scenarios. In both scenarios, temperature will be a key determinant of water balance since it increasingly aff ects evaporation as time progresses towards 2100. Based on these two scenarios, fi gure 6.13 shows the projected trends in rainfall, runoff , evaporation and net basin supply.
Separately, Elshamy and others (2009) studied the fl ood and drought situation in Lake Nasser using 6 transient scenarios (3 GCMs x 2 emission scenarios – A2 and B2) statistically downscaled using a spatio-temporal weather generator to show projected changes at Dongola from 2010-2100 (fi gure 6.14).
Figure 6.13: Projected trends in rainfall, evaporation, runoff and net basin supply (NBS) in Lake Victoria under A2 and B2 emissions scenarios.
2000 2200 2400 2600 2800 3000
0
150
125
100
75
50
25
Volu
me
(m³x
10⁹
per
year
)
Rainfall
Evaporation
Runoff
NBS
Source: Adapted from Georgakakos and others 2005
Figure 6.14: Statistically downscaled projections of the total fl ow at Dongola using 6 transient scenarios.
0
20
40
60
80
100
120
Base 2010s 2020s 2030s 2040s 2050s 2060s 2070s 2080s 2090s
Tota
l Ann
ual F
low
(BCM
)
HadCM3 A2 HadCM3 B2
CGCM2 A2 CGCM2 B2
ECHAM4 A2 ECHAM4 B2
OBS Base
Source: Elshamy and others 2009

134
Figure 6.15: Simulated annual fl ow series at Dongola from B2 experiments.
250
200
150
100
50
02010 2014 2018 2022 2026 2030 2034 2038 2042 2046 2050
Tota
l Ann
ual F
low
(BCM
)
A2 Base
250
200
150
100
50
02010 2014 2018 2022 2026 2030 2034 2038 2042 2046 2050
Tota
l Ann
ual F
low
(BCM
)
A2 Base
250
200
150
100
50
02010 2014 2018 2022 2026 2030 2034 2038 2042 2046 2050
Tota
l Ann
ual F
low
(BCM
)
A2 Base
250
200
150
100
50
02010 2014 2018 2022 2026 2030 2034 2038 2042 2046 2050
Tota
l Ann
ual F
low
(BCM
)
A2 Base
250
200
150
100
50
02010 2014 2018 2022 2026 2030 2034 2038 2042 2046 2050
Tota
l Ann
ual F
low
(BCM
)
A2 Base
250
200
150
100
50
02010 2014 2018 2022 2026 2030 2034 2038 2042 2046 2050
Tota
l Ann
ual F
low
(BCM
)
A2 Base
A2 B2
HadCM3 HadCM3
CGCM2 CGCM2
Source: Elshamy and others 2009

135
They further simulated the relative magnitude of uncertainties across emission scenarios (A2 and B2) using downscaling, and analyzed the change in Nile flows at Dongola using the results of 3 GCMs (CGCM2, ECHAM4, and HadCM3). Figure 6.15 presents the results from the statistically downscaled models. According to the study, ‘towards 2050 ECHAM4 predicts a steady increase in Nile flows while CGCM2 underestimates the flow in the base-period and the HadCM3 shows a slight increasing trend in flood season flows and for the base-period flow’.
Implications and management optionsTwo main scenarios capture possible changes in the Nile between 2030 and 2050. With increased temperature, decreased average rainfall and annual Nile flows, there is likely to be an increase in inter-annual variability. Conversely, increases in temperature, average rainfall and inter-annual flows would be associated with increased Nile flows. A number of changing situations would result in changes in current water use, including the failure to uphold the 1959 agreement (which unequally allocated the Nile’s river flow
between Egypt and Sudan), increased upstream withdrawal and increased water demand for irrigation and hydropower generation. The implications of these changes under A1, A2, B1 or B3 emissions scenarios would be specific to various sub-basins and hotspots where there would be unique water security, human wellbeing and adaptation needs and options.
If no significant changes occur and the Nile flow declines, water insecurity will prevail, with the worst case happening in the Ethiopian highlands. There may also be a reduction in hydropower potential, which will affect Uganda in particular. An increase in Nile flows with no significant change in water use, however, would result in more floods and erosion damage but improved hydropower potential for both Uganda and Sudan. Fisheries productivity is likely to increase under such a scenario, as would groundwater recharge potential across the basin. Egypt may not benefit much from the increased Nile flows under this scenario. With increased water use upstream and declining flows in the Nile, water insecurity will worsen in Egypt, with a potential for basin conflict. On the other hand, an increase in Nile flows with increased upstream water use may still result in improved water security upstream, and risk of flooding and more land degradation especially in the East Africa region of the basin.
Trav
el A
ficio
nado
/ Fo
ter.c
om /
CC B
Y-N
C
People crossing the Nile on a simple raft.

136
Although downscaling creates a level of uncertainty proportional to the base flow, the scenario results are important inputs for water management in the basin under various future climate scenarios. More specifically, ‘future flows’ have implications for water resources planning and management within the basin. These include mitigating possible future floods, the socioeconomic benefits of which will depend on viable infrastructure systems to manage the excess water. Such excess may be directed to irrigation activities, stored in aquifers or redirected for hydropower generation. The scenarios also show possible future droughts in the basin, which would require drought management strategies including early warning systems and technological innovation in water use efficiency. Under both Blue and White Nile climate scenarios, the flood season flows will also require additional protection in both Ethiopia and Sudan, through appropriate planning of conservation schemes in the upstream sub-basins in the Ethiopian and East African highlands. The management options could be designed on the basis of the water availability and policy assessment (WAPA) framework proposed in figure 6.16.
Given the influence of climate change on the water resources of the Nile basin, there is need for an integrated management approach. Both hydrologic models and downscaled scenarios offer insights for the management of irrigation projects and agricultural, industrial and other water withdrawal systems within the Nile basin that help focus on water availability and withdrawal regimes. Important consideration should be given to adequately addressing critical aspects such as downstream-upstream balances, transient stages of large-scale reservoirs, relevant flow retention policies and associated downstream ramifications; and the implications of a variable climate and climate change on water flow and riparian land use systems. The underlying climate change
scenarios, represented by different SRES emission levels as well as the frequency of El Niño and La Niña events (Elshamy and others 2009, Jeuland 2010, Kim and others 2008) reflect the potential for applying integrated management and cost-benefit analyses, as well as sensitivity or viability analysis of hydropower or irrigation projects. Even as this is done, a considerable degree of uncertainty has to be factored into the consideration of such scenarios if the hydrological and climatic base data are to be useful. In addition to varying climate conditions, other uncertainties include prospective future irrigation and hydropower development projects. Water resources planning and strategizing between countries (both
WAPA model architecture
Climate change
Natural water resources Water resources management system
rainfall, rivers,aquifers
infrastructure, demand,management rules
Water availability
Supply for ecosystems, urban,food, hydropower, tourism
Policy assessment
Supply management (allocation, reliability, restrictions,infrastructure)
Demand management (water rights, risk)Extreme events management
Figure 6.16: Architecture of water availability and policy assessment (WAPA) model.
Source: Iglesias and others 2011
Aswan High Dam, Egypt.
cliff
.hel
lis /
Fote
r.com
/ CC
BY-
NC-
ND
136

137
upstream and downstream) is pivotal to the success of such future projects as the balance between climate resilience, food production and industrialization is considered at the same time as climate responsive stream flow and water conservation.
Climate change will continue to pose major geopolitical, technological and ecosystem challenges for the Nile basin. For the most part, these challenges will revolve around over-consumption, technological and market inadequacies and threats to security (national, human and climate) (Adger 2010). The challenges will be worsened by potential risks and uncertainties over future water use and stress. The uncertainties most likely to play out include agreements over the maintenance of the 1959 Nile treaty, increases in population and water demand, and the potential for benefit sharing versus water sharing and implementation of the basin-wide cooperation framework agreement. Specifically, projections of run-off in sub-basins would be most affected by climate change and these uncertainties. Many global models have projected a small decrease in flow by 2050 (Aert and others 2006, Manabe and others 2004) while others project large increases between 2030 and 2050 (Milly and others 2005).
Thus, improved water stress management requires strategies to address risks related to flow regimes including floods and drought; and to health and poverty since they are linked to future water resource conditions. Water management measures must target the reduction of waste water, improved storage and the balance of green and blue water under various climate change induced water demand levels. Technological innovations and water use efficiency remain priorities, especially in land use planning, crop production technologies and other forms of
withdrawals. A strong emphasis should be put on information to support adaptation through forecasting, prediction and early warning, traditional knowledge and raising awareness. Improved water governance and cross-country and basin-wide cooperation will continue to be instrumental in addressing water use conflicts, policy support needs and equitable water and water benefit sharing and trade.
The interaction of climate change and other pressuresClimate change is one of the many conditions that together makes the future of water resources in the Nile basin uncertain. The transboundary nature of the Nile basin coupled with climatic variability, the spatial and temporal distribution of water resources and the complex social, political and economic condition create challenges to managing water resources sustainably in the basin. The latter include population growth coupled with widespread poverty, which are key drivers that increase pressure on water resources through demands for energy and irrigation. Coupled with increased climate variability, the impacts can include an increase in the frequency of floods and droughts and ecological consequences such as reduction in stream flows and riparian habitats. In the upstream countries, when forests are cut down and wetlands drained the result is eroded soils, reduced crop yields and unsustainable livelihoods. In addition, groundwater recharge is reduced and levels lowered, and river flows become ‘flashier’. Other stresses include high sediment loads, water quality changes, seawater intrusion and waterweed infestation.
Subsistence agriculture is practiced by 21 million people within the Nile basin.
UN
AM
ID P
hoto
/ Fo
ter.c
om /
CC B
Y-N
C-N
D

138
Land use change and climate change are concurrent processes. Hence, their separate impacts on the Nile water are mixed and can be difficult to detect accurately. Two field studies in 2005 analyzed the impact of changes in land use (related to population growth and agricultural practices) on runoff from the sources of the Nile in the Ethiopian Highlands (Hurni and others 2005, Bewket and Sterk 2005). The conclusions, however, seem contradictory, highlighting the difficulty in attributing changes in water ecosystems to how the surrounding land is being used. The impacts of land-use greatly depend on local conditions and the exact nature of the change in land use. This highlights the additional uncertainty when attempting to isolate the impacts of climate change on the Nile’s flow, since observations would mix signals from natural variability, human impacts due to land use change, and any climate change signal.
Socioeconomic implications of climate change impacts on water resourcesThe impacts of climate change on water resources supply, availability and demand will have direct and indirect effects on a wide range of institutional, economic and social factors. Society’s ability to adapt and the nature of these effects are not well understood because of the complicated and unpredictable nature of water resources. In addition, the impacts are nonlinear, and as discussed above, water resources are already stressed due to socioeconomic drivers, including population growth and competition for financial resources from other sectors, disputes, and water allocation priorities. Furthermore, present water systems are designed to operate under current climatic conditions, so are sensitive to changes in those conditions.
Operating rules need to be closely and precisely examined to see what adjustments can be made to fixed infrastructure and design to reduce the impacts of climate change. The impact of climate change on water availability in the Nile basin is likely to have significant economic implications. Strzepek and Yates (2000) used an equilibrium model to study the impacts on the
Egyptian economy. They concluded that under ‘wet’ climate scenarios, surplus water beyond 75 BCM remained unused, as the marginal value of water dropped to minimum and other resource constraints limited agricultural growth. For drier scenarios (below 75 BCM), water was a constraint to agricultural production into the 21st century, as resources were diverted to less water-demanding crops and to livestock and non-agricultural sectors. The reduced water scenarios showed agriculture declining in its total share of GDP, burdening the agricultural wage earner. Further studies are needed to address the impacts on the other economies in Eastern Nile countries.
Table 6.4 shows the vulnerable sectors prioritized by the Nile basin countries. Each country prioritized the sectors according to national circumstances, local geographical conditions or national development priorities. Examples include Ethiopia, which based its prioritization on the sector’s poverty reduction potential and how it adheres to sectoral plans, while Sudan prioritized vulnerable sectors according to the link between development challenges and vulnerability to climate change. For example, its agriculture sector is dominated by poor subsistence farmers dependent on rainfall and traditional agricultural practices that are thus highly vulnerable to climate change.
ConclusionsMany past scenario studies have projected the impact of climate change on the River Nile basin water system. All downscaling models indicate potential future increases in both temperature and evapotranspiration. Most scenarios also predict a reduction in precipitation during the main rainy seasons and with it reductions in annual runoff in the basin. On the other hand, there is limited literature supporting concrete future water resources management in the sub-basins. Overall water-resource planning and management of sub-basins and hotspots must rely on downscaled models aligned to specific emissions scenarios to help in decision making. The integration of water and climate scenarios
Table 6.4: Vulnerable sectors prioritized by each Nile basin country.
Vulnerable sectorNile basin country
DRC Egypt Ethiopia Eritrea KenyaUnited Republic
of TanzaniaUganda Rwanda Burundi Sudan
Agriculture X X X X X X X X X X
Water resources X X X X X X X X X X
Human health X X X X X X X X X X
Forestry X X X X X
Livestock X X X X X
Energy X X X
Physical infrastructure
X X X X X
Tourism X X X
Coastal zone management
X X X
Aquaculture and fi sheries
X X
Note: Data was summarized from the respecti ve country NAPA’s. South Sudan has not yet prepared its NAPA.

139
is important in addressing the potential impacts of a changing climate on water availability, withdrawal and development projects so as to manage the relationship between quantity and quality and upstream and downstream water stresses.
The Nile basin water system remains a legacy for the riparian countries. The combined effects of future climatic and non-climatic pressures are bound to alter water stress levels in the basin. The countries and regional bodies linked to Nile basin water management will continue to face difficult choices about necessary actions to avoid the risks of further negative impacts and how to restore any potential losses. Despite the numerous basin-wide models and scenario studies, more reliable climate change and impact information should be made available to sub-basins and hotspots to aid high resolution projections related to climate sensitive water resources. The associated spatial-temporal variations in water availability, withdrawal, flow and utilization (due to climate change and impact signals) present an opportunity
for basin-wide cooperation in climate adaptation and mitigation. Mainstreaming climate change adaptation and mitigation measures into transboundary water resources management will ensure the sustainable, equitable and effective utilization of the shared Nile waters.
The scenario assessment and selected models presented in this chapter show that climate change remains an important aspect of water stress adaptation policies, principles and practices. Due to the uncertainty inherent in looking into the future, adaptation to climate change should involve solutions that are low-regret, evidence-based and synergistic, and include responses to other pressures on water systems in the Nile basin ecosystems. The goal should be to implement measures and policies with multiple benefits across scales, borders, sub-basins and water system components, including groundwater aquifers, lakes, rivers, dams and deltas.
Viewpoint for the Blue Nile, Ethiopia.
Sara
h Br
amle
y / W
ater
.org
/ CC
BY-
NC-
SA 2
.0

140
ReferencesAdger, W.N. (2010). Addressing barriers and social challenges
of climate change Adaptation, In Stern, P.C. and Kasperson, R.E. (eds) Facilitating Climate Change Responses: Report on Knowledge from the Social and Behavioural Sciences. National Academies of Science, Washington DC, 79-84.
Aerts J., Renssen H., Ward P J., De Moel H., Odada E., Bouwer L M and H. Goosse (2006). Sensitivity of global river discharges under Holocene and future climate conditions. Geophys. Res. Lett. 33.
Attia, B.B.. (2011). Assessment of vulnerability and adaptation of water resources to climate change in Egypt. The Arab Water Council, Cairo. www.arabwatercouncil.org/administrator/Modules/Events/IWRA Egypt Paper.pdf. Accessed 27th February 2013.
Bewket W. and G. Sterk (2005). Dynamics in land cover and its effect on stream flow in the Chemoga watershed, Blue Nile basin, Ethiopia, Hydrological Process 19:445-58.
Beyene, T., Lettenmaier, D. P. and P. Kabat (2010). Hydrologic Impacts of Climate Change on the Nile River Basin: Implications of the 2007 IPCC Climate Scenarios. Climatic Change, 100 (3-4), 433-461. http://link.springer.com/article/10.1007%2Fs10584-009-9693-0?LI=true#page-1 Accesed 4th December 2012.
Booij, Martijn J. and Tollenaar, Daniel and Beek van, Eelco and Kwadijk, Jaap C.J. (2011) Simulating impacts of climate change on river discharges in the Nile basin. Physics and Chemistry of the Earth, Parts A/B/C, 36 (13). pp. 696-709. ISSN 1474-7065 http://doc.utwente.nl/78679/. Accessed 2nd February 2013.
Bontempo C., Lørup, J. K., Sanderson, M., Butts, M., Palin, E., McCarthy, R., Jones, R., Betts, R. and M. Antar (2010). The impact of uncertainties in climate impacts assessments: the case of the Nile basin. In Part V: Coping with Global Environmental Change: Climate Change, Soil and Desertification, Water Management, Food and Health, Hexagon Series on Human, Environmental Security and Peace, HESP (Ed. H. G. Brauch), Springer (In press). http://www.springer.com/series/8090. Accessed 2nd February 2013.
Conway, D. (2005). From headwater tributaries to international river basin: adaptation to climate variability and change in the River Nile basin, Global Environmental Change, 15, 99-114.
Conway, D. and M. Hulme (1993). Recent fluctuations in precipitation and runoff over the Nile sub-basins and their impact on main Nile discharge, Climatic Change 25, 127-151 Kluwer Academic Publishers, The Netherlands
Conway, D. and M. Hulme (1996). The impacts of climate variability and climate change in the Nile Basin on future water resources in Egypt, Water Resources Development 12(3), 277-296
EAGLON (undated). Modeling Data. East African Great Lakes Observatory Network (EAGLON). Available at: http://websibn78.seventyeight.axc.nl/index.php.
Elshamy and Wheater (2009). Performance assessment of a GCM land surface scheme using a fine-scale calibrated hydrological model: an evaluation of MOSES for the Nile Basin. Hydrological processes. 23, 1548-1564.
Elshamy, M. E., Seierstad, I. A., and A. Sorteberg (2009). Impacts of climate change on Blue Nile flows using bias-corrected GCM scenarios, Hydrol. Earth Syst. Sci., 13, 551–565
FAO (2011). Climate change, water and food security. Food and Agriculture Organisation of the United Nations (FAO), Rome. http://www.fao.org/docrep/014/i2096e/i2096e.pdf. Accessed 29th January 2013.
Georgakakos, A., Yao, H., Tidwell, A. (2005). Study on Water Management of Lake Victoria Technical Report 10 Climate Change Impact Assessment. Uganda Ministry of Energy and WREM International Inc.
Gleick, P.H. (1991). The vulnerability of runoff in the Nile basin to climatic changes, The Environmental Professional, 13, 66-73.
Houghton, J. T., Ding, Y., Griggs, D. J., Noguer, M., van der Linden, P. J., Dai, X., Maskell, K. and C.A. Johnson (2001). Climate change 2001: the scientific basis, Cambridge, UK: Cambridge University Press.
Hurni, H., Tato, K. and G. Zeleke (2005). The Implications of Changes in Population, Land Use, and Land Management for Surface Runoff in the Upper Nile Basin Area of Ethiopia. Mountain Research and Development. Vol 25 No.2 May 2005: 147-154. http://www.researchgate.net/publication/232679619_The_Implications_of_Changes_in_Population_Land_Use_and_Land_Management_for_Surface_Runoff_in_the_Upper_Nile_Basin_Area_of_Ethiopia. Accessed 2nd February 2013.
Iglesias, A., Quiroga, S. and A. Diz (2011). Looking into the future of agriculture in a changing climate. European Review of Agricultural Economics. 38(3), 427 –447. European Environment Agency, Copenhagen.
IPCC (2007). IPCC Fourth Assessment Report. Climate Change 2007: Working Group II: Impacts, Adaptation and Vulnerability. Intergovernmental Panel on Climate Change (IPCC), Geneva.
Jeuland, M. (2010). Economic implications of climate change for infrastructure planning in transboundary water systems: an example from the Blue Nile. Water Resources Research 46, W11556

141
Kebede, S., Travi, Y. Alemayehu, T., Marc V. (2006). Water balance of Lake Tana and its sensitivity to fluctuations in rainfall, Blue Nile basin, Ethiopia. Journal of Hydrology 316: 233–247.
Kim U., Kaluarachchi, J. and V. Smakhtin (2008). Climate change impacts on hydrology and water resources of the Upper Blue Nile River Basin, Ethiopia. International Water Management Institute, Colombo.
Kim J. and T. Reichler (2008). How well do coupled models simulate today’s climate? Bulletin for the American Meteorological Society, 89(3), 303-311
Manabe S., P.C.D. Milly and R. Wetherald (2004). Simulated long term changes in river discharge and soil moisture due to global warming, Hydrol. Sci. J., 49(4), 625-642.
Milly P., Dunne K, and A. Vecchia (2005). Global pattern of trends in streamflow and water availability in a changing climate. Nature 438, 347-350
Nawaz, N. R., Bellerby, T, Sayed, M. and Elshamy, M. (2010). Blue Nile Runoff Sensitivity to Climate Change, The Open Hydrology Journal, Bentham Open, 4, 1-15.
Setegn S., Rayner D. and A. Melesse (2011). Impact of climate change on the hydroclimatology of Lake Tana Basin, Ethiopia. Water Resources Research 47, W04511.
Sherif, M.M. and V.P. Singh (1999). Effect of Climate Change on Sea Water Intrusion in Coastal Aquifers, Hydrological Processes 13, 1277-1287.
Strzepek, K. and D. N. Yates (1996). Economic and Social Adaptations to Climate Change Impacts on Water Resources: A Case Study of Egypt, Water Resource Development 12, 229-224.
Strzepek, K. M. and D. N. Yates (2000). Responses and Thresholds of the Egyptian Economy to Climate Change Impacts on the Water Resources of the Nile River. Climatic Change 46(3), 339-356.
Tate E., Sutcliffe J, Conway D., Farquharson, F. (2004). Water balance of Lake Victoria: update to 2000 and climate change modelling to 2100. Hydrological Sciences–Journal–des Sciences Hydrologiques, 49(4) August 2004
Taye, M. T., V. Ntegeka, N. P. Ogiramoi, and P. Willems (2010). Assessment of climate change impact on hydrological extremes in two sourceregions of the Nile River Basin. Hydrol. Earth Syst. Sci. Discuss., 7, 5 441–5465
The Arab Forum (2009). Impact of Climate Change on the Arab Countries,. The Arab Forum AFED Report. http://www.afedonline.org/afedreport09/default.asp. Accessed 29th January 2013.
UNEP (2006). Africa Environment Outlook 2. Our Environment Our Wealth. United Nations Environment Programme (UNEP), Nairobi.
Yates, D. N. and K. M. Strzepek (1998). An Assessment of Integrated Climate Change Impacts on the Agricultural Economy of Egypt, Climatic Change 38(3), 261-287.

142
Chapter 7ADAPTATION TO CLIMATE CHANGE
What is adaptation?Adaptation, in this context, is what is done to manage or survive the eff ects of climate change. The eff ects could be things that are likely to occur, or that are already happening. The Intergovernmental Panel on Climate Change (IPCC) defi nes adaptation as the ‘adjustment in natural or human systems in response to actual or expected climatic stimuli or their eff ects, which moderates harm or exploits benefi cial opportunities’ (IPCC 2007). However to be relevant and sustainable it must occur within a certain development or policy context. For instance in the context of the Millennium Development Goals (MDGs), adaptation is defi ned as ‘changing existing policies and practices or adopting new policies and practices so as to secure the MDGs in the face of climate change and its associated impacts’ (UNDP undated). Generally, it refers to improving the capacity (resilience), and thereby reducing the vulnerability of individuals or states, to respond to climate change impacts.
Adaptation is often promoted through governance reforms that focus on building adaptive capacity. These can be at diff erent tiers of society from local, national to regional. However they all need to occur within a framework that embraces socio-economic and political considerations. Stern (2009) argues that since adaptation is basically ‘development in a hostile climate’ many adaptation strategies are also suitable for dealing with other aspects of environmental change. Thus considering adaptation as part and parcel of a national sustainable development strategy makes for effi cient and eff ective use of scarce government resources.
Importance of adaptationAdaptation is imperative because, as already determined climate change will infl uence current development mechanisms and the sustainability of development pathways. Development is designed to enhance the capacity of communities and countries to adapt to livelihood risk and disturbance. So anything that disrupts development such as climate change inexorably calls for attention. The IPCC (2007) further makes the case for adaptation by stating that no matter what actions are taken now, we are destined to experience some measure of climate change due to the level of greenhouse gases already in the atmosphere and those to be emitted in the near term. As climate change continues, there is a recognized need for actions to support adaptation before the impacts become uncontrollable and the social and economic costs escalate.
The Nile basin will be among the regions hit hard as it is characterized by a number of economic, social and environmental issues that together combine to amplify the vulnerability of the region. High levels of poverty, soaring population growth rates, low socio-economic indicators such as literacy levels and natural disasters such as fl oods and drought create a spiral eff ect of extreme vulnerability and low adaptive capacity. Furthermore, the Nile is a shared resource and the failure to adapt to climate change could lead to increased confl icts over its resources, degradation of its ecosystems and associated economic impacts (CCCD 2009).
A.D
avey
/ Fl
ickr
.com
/ CC
BY
2.0

143
Adaptation options and strategiesPolicy options for successful adaptationClimate matters to livelihoods and human wellbeing. As such, it is important that development options consider the role of climate. Addressing different scales of adaptation is important. The examples below highlight some useful policy options that would help to enhance successful adaptation:
• Developing and improving existing climate tools for climate change data analysis can enhance the provision of credible information. Reinforcing and sustaining climate observation networks is essential if the full potential of climate information is to be realized for individual sectors. The outputs will be most effective for livelihood decision-making when integrated into multi-disciplinary frameworks.
• Reinforcing local support networks and other such informal institutions can mediate livelihood stability and it is critical that new initiatives in any sector do not replace or challenge these systems. Although, it is possible to build adaptation options without high levels of community stability, these are unlikely to be resilient in the longer-term.
• Ensuring multi-level institutional involvement in adaptation initiatives will require investment in institutional capacity at all scales, but especially at the district or local level and participation by local communities. This will help to generate ‘networks of engagement’, which are critical to shaping human capacity, by incorporating local knowledge and empowering those most affected by the impacts of climate change. The establishment of new agricultural associations in South Africa and Mozambique illustrate how adaptation initiatives are, in a large part, due to multi-level institutional support (Ribiero and Chauque 2010)
• Building communication channels and forums can help to support social learning and the transfer of information and skills. Improved communication offers opportunities for
equitable pathways and decision making by poor people. However their success will depend on the formation of structured forums for sharing knowledge, technologies and skills, especially those that improve education and reinforce traditional networks.
• Acknowledging the importance of heterogeneity of stakeholders especially at local level where it is essential to capture ‘key brokers’ or entrepreneurs are crucial. This counters traditional aid approaches that target the most vulnerable. Equally, at the district and regional scale, it is important to create decision-making structures that bring together interdisciplinary stakeholders. Evidence suggests this helps to ensure reform is implemented in a particular sector (Lemos 2007).
• Developing innovative approaches to financing adaptation and building opportunities for resilient decision-making is important as there are many countries competing for limited funding. Examples of such approaches could include access to micro-credit options that support local collective adaptation. The funding of relief efforts to support stability and coping are best dealt with through the reform of existing disaster relief funds.
National Adaptation Programmes of Action (NAPAs)The National Adaptation Programmes of Action (NAPA) process under the United Nation’s Framework Convention on Climate Change (UNFCCC) aims at building adaptive capacity by serving as an avenue through which their priority adaptation needs may be financed. The countries of the Nile basin have prepared their NAPAs some of which have been integrated into the national development plans. Many NAPAs are also suitable for dealing with other environmental challenges such as health, urbanisation and desertification. Table 7.1 below provides a summary for some of the adaptation strategies in the basin countries. These mainly fall into the sectors of agriculture, water resources, climate information, health and forestry. Some of the statements are
Transporting people to and from the Ssese islands to the mainland on Lake Victoria.
Xevi
V /
Fote
r.com
/ CC
BY-
NC-
SA
143

Country Adaptati on measures Reference
Burundi • Reinforce the management of existi ng protected areas and expand them to include identi fi ed vulnerable ecosystems.• Implement forestry and woodlots management, reforestati on programmes and popularize drought resistant forest species.• Implement improved technologies for the use of woody and new renewable energy and increase the number of hydropower micro stati ons.• Control the river dynamics of watercourses and torrents in Mumirwa and Bujumbura.• Develop and promote drought-tolerant and early maturing plant varieti es and animal breeds.• Popularize rainwater harvesti ng techniques for agricultural or domesti c use.• Install erosion control mechanisms in sensiti ve areas, including strategic buff er zones in Lake Tanganyika fl oodplain and around the lakes of Bugesera.• Train decision makers and community stakeholders on climate adaptati on.• Improve seasonal early-warning climate forecasts.
MLMTE 2007
DRC • Improve the management of water resources and reservoirs.• Carry out rural and urban electrifi cati on projects.• Increase the producti vity of agricultural and pastoral systems.• Sett le rural communiti es, especially those by confl ict.• Improve communicati on networks for example through multi media channels.• Improve the management of forest resources, reduce erosion and land degradati on.• Increase the capacity of the meteorological service.• Protect coastal zones.
RDC 2006
Egypt •Implement Integrated Coastal Zone Management (creati on of wetlands in low lying lands; supporti ve protecti on structures (including dams); natural sand duning systems; management of coastal lakes; public and policy-maker awareness; use of aerial photographs and satellite images. • Implement improved agricultural approaches (choose high yielding crops; change crop varieti es and crop calendar; skip irrigati on at diff erent growth stages; change on-farm systems and ferti lizati on; develop special adaptati on fund for agriculture; improve scienti fi c capacity; increase public awareness on climate; improve the adapti ve capacity of rural communiti es; develop simple and low-cost technologies suitable for local contexts rather than import high-cost ones).• Improve water resources management (public awareness campaigns on water shortages or surpluses caused by climate change; develop Local Area Circulati on Models capable of predicti ng the impact of climate change on local (Egypt) and regional (Nile basin) water resources; increase the capacity of researchers in all fi elds of climate change and its impact on water systems; encourage exchange of data and informati on between Nile basin countries).
EEAA 2010
Eritrea • Breed drought- and disease-resistant high-yield crops to maintain or improve crop producti on levels.• Improve rangelands management through community based improvements in selected agro-ecological areas in the north western lowland rangelands.• Intensify existi ng livestock producti on models in the eastern lowlands through community based interventi ons and breed selecti on, especially sheep and goats.• Encourage aff orestati on and agroforestry through community forestry initi ati ves.• Enhance groundwater recharge for irrigati on wells to counter the decline in groundwater already being experienced in most parts of the country.
MLWE 2007
Ethiopia • Promote drought or crop insurance programs.• Strength drought and fl ood early warning systems.• Develop small scale irrigati on and water harvesti ng schemes in the dryland areas. • Improve rangeland resource management practi ces in the pastoral areas.• Implement community based sustainable wetlands use and management in selected parts.• Implement a capacity building program for climate change adaptati on.• Enhance food security through multi -purpose large scale water development project in Genale-Dawa basin.• Implement a Community Based Carbon Sequestrati on Project in the Rift Valley System of Ethiopia.• Establish a Nati onal Research and Development Center for Climate Change.• Strengthen the Malaria Containment Programme (MCP) in selected areas.• Promote on-farm and homestead forestry and agro-forestry in the dryland areas.
FDRE 2007
Kenya • Strength health services and response including new disease surveillance and health campaigns.• Improve agriculture through provision of downscaled weather informati on, farm inputs, soil and water conservati on technologies and crops resistant to drought, pests and diseases. • Encourage livelihood diversifi cati on such as apiary• Improve livestock management through breeding programmes and special livestock insurance schemes• Improve water quality, supply and effi cacy of use through constructi on of additi onal water storage faciliti es, municipal recycling faciliti es and capacity building.• Implement fi sheries management including a coastal and watershed-basin management approach linking land use practi ces to marine and fi sheries resources conservati on. • Develop an adaptati on strategy for the tourism and wildlife sector to promote Kenya as a ‘green’ desti nati on.• Climate proof physical infrastructure including road and telecommunicati on network and enhance disaster preparedness in urban areas.
GOK 2010
Rwanda • Reduce the vulnerability of regions aff ected by torrenti al rains, erosion and fl oods by addressing the issue at district level.• Enhance hydro-meteorological informati on and early warning systems for preventi on and management of climate-related hazards, including installati on and rehabilitati on of hydrological and meteorological stati ons. • Reduce dependence on rain-fed agriculture by establishing round irrigati on perimeters from water fl ows in vulnerable regions and implementi ng water storage and conservati on measures. • Increase the adapti ve capacity of villages in vulnerable regions through improvement of drinking water and sanitati on and alternati ve energy services and promoti on of non-agricultural acti viti es• Enhance food distributi on and health support in the face of extreme climate phenomena. • Implement a Nati onal Woody Combusti ble Substi tuti on Strategy to combat deforestati on, reverse erosion and reduce pressures from fuelwood demand.
MINIRENA 2006
Sudan • Enhance resilience to increasing rainfall variability through rangeland rehabilitati on and water harvesti ng in the Butana area of Gedarif State.• Reduce the vulnerability of communiti es in drought-prone areas of southern Darfur State through improved water harvesti ng practi ces.• Improve sustainable agricultural practi ces under increasing heat stress in the River Nile State.• Execute environmental conservati on and biodiversity restorati on in northern Kordofan State as a coping mechanism for rangeland protecti on under conditi ons of increasing climate variability.• Implement strategies to adapt to drought-induced water shortages in highly vulnerable areas in Central Equatorial State.
ROS 2007
United Republic of Tanzania
• Introduce alternati ve farming systems and improve the applicati on of irrigati on technologies to boost crop producti on in all areas.• Introduce water harvesti ng programmes for rural communiti es, parti cularly in dry lands.• Launch community-based water catchment management programmes.• Invest in alternati ve clean-energy sources including cogenerati on in the industrial sector.• Aff orest degraded lands, using more adapti ve and faster-growing tree species and develop community forest-fi re preventi on plans and programmes.• Establish and strengthen community health awareness programmes.• Implement sustainable tourism acti viti es.• Enhance wildlife resources management and extension services to rural communiti es.• Implement coastal zone and beach management systems .• Establish an improved land-tenure system and sustainable human sett lements.
URT 2007
Uganda • Promote on farm tree-growing, use trees to demarcate protected areas and the culti vati on of medicinal and edible forest plants like bamboo, outside protected areas.• Strengthen community sensiti zati on and advocacy on climate change-related issues.• Improve disseminati on of climate informati on by expanding the network of weather stati ons and promoti ng a multi media approach to disseminati on.• Scale-up safe water supply and sanitati on using appropriate technologies including sustainable water harvesti ng and promote collaborati ve water resource management.• Develop and promote drought-tolerant and early maturing plant varieti es and animal breeds.• Integrate climate change issues into the sectoral planning and implementati on.• Improve and expand health infrastructure.• Promote use of indigenous knowledge as a coping mechanism such as traditi onal food preservati on technologies.
EA and others 2007
Table 7.1: Summary of adaptation strategies to climate change in the River Nile basin countries.
144

145
extracted verbatim from the respective NAPAs. Kenya has not prepared a NAPA but has a climate change response strategy. The adaptation actions for Egypt are extracted from its second national communication to the UNFCCC.
Groundwater management as an adaptation strategyThe aquifers in the Nile basin have the potential to store enormous volumes of water. They could provide an opportunity to store excess surplus water, for instance, from the summer rains in the Ethiopian and Equatorial Lakes’ highland areas. Groundwater could be used to supply rural areas with water in addition to satisfying large-scale industrial, agricultural and municipal needs. Groundwater already plays a strategic role in supplying water for communities in the Nile basin that are far away from the Nile. With the exception of Egypt, Sudan and Uganda, groundwater management in the Nile basin is not well developed.
Groundwater and surface waters are integrated in nature through the hydrological cycle. Recharge depends on rainfall and the underground geology of the aquifer. As such any variation in climate has the potential to affect recharge, discharge and groundwater quality (World Bank 2010). Groundwater discharge, which can reduce the amount of water stored underground, is related to natural conditions such as base flows, as well as human activities such as pumping. In the Nile basin, groundwater pumping increases because of population growth, expansion of irrigation, industrial use and prolonged drought. During dry spells,
human demand on groundwater resources increases to alleviate water scarcity. When groundwater use exceeds recharge, the water accumulated over decades and centuries is drawn down. Historically, the main political stress related to water resources has focused on surface water — the Nile Rivers and associated lakes and tributaries. This could change should reliance on groundwater increase in the Nile basin.
There is a lack of awareness on the availability of groundwater in the basin, including aquifer extent, storage, recharge and discharge. More knowledge about it is needed and groundwater management plans need to be put in place if the resource is to be sustainably utilized. Adopting integrated adaptation strategies for groundwater could enable the sector play a paramount role in reducing the impact of extreme hydrological changes (low rainfall and high evapotranspiration). Furthermore, it could also help to assuage the debate on how to equitably share the Nile basin’s surface waters. However, in addition to human needs, management plans would have to consider the needs of groundwater-dependent ecosystems, such as riverine vegetation, wetlands and lakes. Any lowering of the groundwater table due to overexploitation could threaten the survival or integrity of these natural areas. The swamps and wetlands in the Equatorial lakes and Sudd regions are the most important groundwater-dependent ecosystems in the Nile basin. Their protection requires a planned and integrated approach since any degradation or loss would affect surface waters in wetlands, ponds, lakes and rivers, which could eventually dry up if the base flow that feeds them is threatened.
Kaj I
vers
ön /
Flic
kr /
CC B
Y-N
C-N
D 2
.0
Women gathering water from an improved water source, Uganda.
145

146
It is of utmost importance to understand and address the transboundary nature of Nile basin aquifers. Adaptive strategies for groundwater management should be based on thorough knowledge of groundwater recharge, discharge/abstraction, and storage. This requires a thorough study of their geo-hydrological parameters, cooperation among countries that share the resource and a superior adaptive capacity in monitoring and managing groundwater resources. It also requires the involvement and adaptive capacity of local users at the community level. Appropriate groundwater management training should be tailored to users, decision makers and non-professional water managers. Such training would improve stakeholder understanding of groundwater systems, the impacts of climate change and the risks of mismanagement.
Pathways and policy implicationsAdaptive capacity and adaptation pathwaysAdaptive capacity refers to capabilities, resources and institutions of a country or region to implement effective adaptation measures. Building adaptive capacity is hardly a new development approach but should be treated holistically. Interventions that consider climate risk can build on existing policies that consider risks to livelihoods and be embedded in existing delivery systems. Climate change adaptation should be grounded within a concern for vulnerability reduction, which brings multiple benefits. It is important to offer convincing demonstrations of on-the-ground livelihood activities, especially where single development pathways have been counter-productive to marginal livelihoods.
Decision makers follow various pathways to navigate the adaptation landscape. Of course there are many such paths, all local in some respect but sharing common features as well. The adaptation pathway can be viewed as a sequence of decision nodes. Decision making at each node is bounded by the stakeholder framing — including the choice of criteria, consideration for future conditions and decision nodes. Each node
consists of a combination of decisions and actions undertaken by several actors and influenced by several external factors.
In the case of adaptation pathways, several types of future nodes are worth noting:
• Social learning is a continuous process, even though future nodes look much like the present. This is implied in the figure 7.1.
• Current decisions might be designed to significantly expand the decision space for future decisions. This might involve gathering new kinds of information, entraining new actors, or changing decision criteria; all are substantial changes to the adaptation space.
• More options might be available in the future – often considered desirable, but only if certain decisions are taken in previous nodes. For instance, weather insurance requires a dense network of weather stations, and at least 10 years of data to establish the baseline risk.
• Pathways may ‘lock-in’ some choices, or lead to ‘dead ends’. Without knowing whether these are justified by present costs and benefits, many adaptation plans assume that flexibility is a key attribute of climate resilience. For instance, investment in major water reservoirs are a long-term commitment that may preclude other adaptive options (Lemos and others undated).
Low carbon growth One strategy of alleviating the high poverty rates prevalent in the region is to encourage economic growth. However development and economic growth have traditionally been associated with high carbon emissions. International pressure to reduce emissions is growing and although developing countries have not been among the main contributors, they are still expected to conform. So for developing countries to achieve growth in the context of climate change and the international climate policy regime will require a strategic approach that ensures climate resilient growth. In other words, being able to seize opportunities while reducing
Effective adaptation to additionalclimate change: coping with impacts inthe 2030s and beyond
Transition: building adaptivecapacity and reducingcurrent vulnerability; strongco-benefits withdevelopment
Development: steps that enable adaptive pathways
Transformation: capacityrequired to prepare for
additional impacts; strongco-benefits with current
climate risks
Figure 7.1: Adaptation as a pathway from development to climate protection.
Source: Downing 2011
146

147
risks within an environment in which climate change is occurring (Ellis and others 2009). One such strategy is to follow a low carbon growth pathway. Some countries in the region, such as Kenya, are already using a low carbon approach to development (DFID and SEI 2009). The benefits include a reduction in carbon intensity, lower energy costs and general improvements to the environment among others.
While mitigation has not historically been the focus for the Africa region, there is recognition that moving to a low carbon development approach could be beneficial for a developing country economy competing in the global context. There is a distinction between the two: Mitigation are the actions aimed at cutting emissions of greenhouse gases either by reducing their sources or by increasing their sinks, while low carbon development is about a policy mix that combines mitigation and adaptation strategies to reduce emissions while at the same time encouraging economic growth (Ellis and others 2009). Either way, the approach appropriate for the national context must be pursued and will also depend on local resources and capacity. Some of the opportunities that exist for low carbon development include:
• The REDD mechanism that offers an opportunity for rural communities in terms of cash flow as well as new technologies that can contribute to the reduction of deforestation and degradation. REDD stands for Reducing Emissions through Deforestation and Forest Degradation.
• The Technology mechanism that encourages the transfer and deployment of new and existing technologies thus providing an opportunity to access alternative mitigation technologies, introduce new markets as well as develop technical skills and capacity.
• The Clean Development Mechanism (CDM) that allows for north-south collaboration for knowledge sharing and technical capacity building through mitigation projects.
Climate compatible development for green growthClimate resilience, low carbon development, adaptation and mitigation come together in the concept of 'climate compatible development' as illustrated in figure 7.2. It encompasses development that reduces the harm caused by climate impacts, while making the most of the variety of development
opportunities presented by a low emission, more resilient outlook (Mitchell and Maxwell 2010). Climate compatible development eventually leads to green growth, an emerging concept, that recognises that environmental protection is a driver of global and national economic development. It refocuses society on achieving qualitative growth rather than simply increasing GDP. For example in green economies, the role of water in both maintaining biodiversity and ecosystem services and in providing water for human use is recognized, valued and paid for.
The United Republic of Tanzania is already a forerunner for climate compatible development, carrying out a range of low carbon projects in sectors such as energy and forestry (Jodoin 2011). For instance through the REDD+ mechanism, the country aims to improve production and use of biomass energy to safeguard forest resources. It also aims to reduce emissions through implementing a renewable energy strategy and an integrated approach to forestry including the agriculture and energy sectors. Rwanda too, through its national strategy on climate change and low carbon development has integrated aspects of climate into its national development and policy agenda (Low 2011). Harnessing new and renewable sources of energy such as geothermal, hydro, solar and wind could help mitigate the potential adverse effects of biomass energy depletion which is a major energy source in the region. Indeed in Uganda, the completion of the Bujagali hydropower project means that power blackouts and the need for expensive, polluting back-up generators will be reduced and to a certain extent the pressures on forests for wood fuel and charcoal.
ConclusionThe uncertainties related to the impacts of climate change in the Nile basin have been highlighted in this report. It is clear that such uncertainties can have a strong influence on rational water-resources planning and development in the future. However, these should not paralyze policy makers and water managers and prevent them from rethinking and re-evaluating current policies. Indeed the governments of the Nile basin countries are not sitting on their laurels, but have devised climate adaptation plans with clear actions in the water sector.
Climate is central to livelihood decisions and the recognition of subtle climate-led changes in livelihoods and common forms of response at the local level indicate the importance of providing development options that consider the role of climate. In the Nile basin, where the people are heavily dependent on agriculture, these should clearly be focused on the land, water and other natural resources sectors.
The complexity of issues involved in managing a large river basin entails the use of multi-dimensional tools to provide analyses at several levels from sub-national, national, sub-basin to the larger basin area. This report has employed a variety of scientific tools such as scenario analyses and modeling to improve the understanding of the likely impacts of climate change on the water systems of the Nile River. The insight and information provided should enable the countries and relevant stakeholders involved in its management to make evidence based policy choices and decisions to ensure the sustainability of the Nile and its resources.
Development
AdaptationMitigation
Climatecompatible
development
Low carbondevelopment
Climate resilientdevelopment
Climate resilientcarbon reduction
Figure 7.2: Climate compatible development.
Source: Mitchell and Maxwell 2010
147

148
ReferencesCCCD (2009). Progress Report III: January-June 2009. Commission
on Climate Change and Development (CCCD). Stockholm, Sweden. www.ccdcommission.org. Accessed 17th January 2013.
DFID and SEI (2009). An assessment of opportunities for low carbon growth in Kenya. Project Number CNTR 200707787. Submission to NCC ACC. November 2009 UK Department for International Development (DFID) and Stockholm Environment Institute (SEI), UK.
Downing, T.E (2011). Adaptation signatures-pathways of adapting well. University of Reading, UK. Speakers at the Walker Institute. http://www.walker-institute.ac.uk/events/seminars/index.htm Accessed 2nd December 2012.
EA, GEF and UNEP (2007). Uganda National Adaptation Programmes of Action. Environment Alert (EA), Global Environment Facility (GEF), United Nations Environment Programme (UNEP), Kampala.
EEAA (2010). Second national communication to the United Nations Framework Convention on Climate Change. Egyptian Environmental Affairs Agency (EEAA). Ministry of State for Environmental Affairs, Cairo.
Ellis, K., Baker, B. and A. Lemma (2009). Policies for Low Carbon Growth. Overseas Development Institute (ODI), London. www.odi.org.uk. Accessed 17th January 2013.
FDRE (2007). Climate Change National Adaptation Programme of Action (NAPA) of Ethiopia. The Federal Democratic Republic of Ethiopia (FDRE), Ministry Of Water Resources, National Meteorological Agency, Addis Ababa.
GOK (2010). National Climate Change Response Strategy. Ministry of Environment and Mineral Resources. Government of Kenya (GOK), Nairobi.
IPCC (2007). Climate Change 2007: Working Group II: Impacts, Adaptation and Vulnerability. IPCC Fourth Assessment Report. Intergovernmental Panel on Climate Change (IPCC), Geneva.
Jodoin, S. (2011). Working together for REDD+: Developing a national readiness strategy in Tanzania. INSIDE STORIES on climate compatible development. Climate and Development Knowledge Network (CDKN), UK. http://cdkn.org/wp-content/uploads/2011/12/Tanzania-InsideStory_cbc_LR.pdf Accessed 28th January 2013.
Lemos, M. C. (2007). Whose water is it anyway? Water management knowledge and equity in North East Brazil. Water and Equity: Fair practice in a portioning water among places and values, (Eds.Perry, R., Ingram, H. and Whiteley, J.). MIT press, Cambridge, M.A.
Lemos, M.C., Agrawal, A., Johns, O., Eakin, H., Nelson, D. and N. Engle (undated). Building Adaptive Capacity to Climate Change in Less Developed Countries. University of Michigan, USA.
Low, L.P. (2011). Green growth: implications for development planning. CDKN Guide. Climate and Development Knowledge Newtork (CDKN), UK.
MINIRENA (2006). National Adaptation Plan of Action to Climate Change. Ministry Of Lands, Environment, Forestry, Water And Mines (MINIRENA), Kigali
Mitchell and Maxwell (2010). Defining climate compatible development. CDKN ODI Policy Brief November 2010/A. Climate and Development Knowledge Network (CDKN), UK. http://cdkn.org/wp-content/uploads/2010/11/CDKN-CCD-DIGI-MASTER1.pdf. Accessed 28th January 2013.
MLMTE (2007). National Adaptation Plan of Action. Ministry for Land Management, Tourism and Environment (MLMTE), Bujumbura.
MLWE (2007). National Adaptation Plan of Action. Ministry of Lands, Water and Environment (MLWE). Department of Environment, Asmara.
RDC (2006). Programme d’Action National d’Adaptation au Changement Climatique de la République Démocratique du Congo. Ministere de l’Environnement, République Démocratique du Congo., Kinshasa.
Ribiero, N. and Chauque, A. (2010). Gender and climate change: Mozambique case study. Heinrich Boll Foundation, Capetown, South Africa.
ROS (2007). National Adaptation Programme of Action. Higher Council for Environment and Natural Resources, Ministry of Environment and Physical Development, Republic of the Sudan (ROS), Khartoum.
Stern, N. (2009). Low-carbon growth: the only sustainable way to overcome world poverty. Facing the Climate Challenge of the 21st Century. Climate Change Team of the Environment Department, World Bank, Washington D.C. http://blogs.worldbank.org/climatechange Accessed 2nd December 2012.
UNDP (2006). UNDP’s strategy for adaptation to climate change.United Nations Development Programme (UNDP), New York. https://www.undp-aap.org/sites/undp-aap.org/files/UNDP_Adaptation_Strategy.pdf Accessed 2nd December 2012.
URT (2007). National Adaptation Programme of Action. The United Republic of Tanzania (URT), Vice President’s Office, Division of Environment, Dar es Salaam.
World Bank (2010). Water and Climate Change: Impacts on Groundwater Resources and Adaptation Options. Water Working Notes No. 25, June 2010. World Bank, Washington D.C.

149
IntroductionWater is essential for survival of life on the planet. The continuous movement of water from the earth to atmosphere, and back to the earth keeps the water cycle going. The water cycle is also known as hydrologic cycle (figure 1). The hydrologic cycle is composed of the processes of precipitation, evaporation, transpiration, runoff, infiltration, percolation, and condensation.
Radiation from the sun heats up land and water surfaces. Heating results into water loss due to evaporation and transpiration. The evaporated water moves up into atmosphere and cools down resulting into condensation. The change of state from gaseous phase to liquid phase results into precipitation. A part of the precipitated water results as surface runoff, some infiltrates, some percolates, and some evaporates back to the atmosphere. This cycle continues and plays an important role in maintaining the life and ecosystems on the planet.
Global climate change is expected to cause intensification of the water cycle (Arnell et al., 2001; Huntington, 2006). This is based on theory that global warming will result in increase in evapotranspiration and thus precipitation leading to acceleration of the hydrologic cycle. However, quantifying the range of possible changes in hydrologic cycle is much harder as compared to changes in global mean temperature (Allen and Ingram, 2002). A study based on satellite observations reported that precipitation and evapotranspiration increased by 6% per kelvin of surface warming during 1997-2006 (Wentz et al., 2007). Another study by Jung et al (2010) suggests that global terrestrial evapotranspiration increased between 1982 and 1997 but since then declined, probably due to soil-moisture limitation.
Evapotranspiration is the combined process of evaporation and transpiration of water. Since these two processes occur simultaneously and are difficult to separate, they are generally referred to together as evapotranspiration (ET). Evaporation of water occurs from soil and wet vegetation surfaces, water bodies,
Annex 1: Methodology for calculating ET using remote sensing
Figure 1: Hydrologic Cycle.
Annex 1

150
and other surfaces in the form of water vapor to the atmosphere. Transpiration refers to the movement of water within the plant from the roots to the leaves and finally to the atmosphere. ET is essential to replenish the atmospheric moisture, which leads to the precipitation recycling. ET component out of total precipitation varies spatially and temporally depending upon the local climate, topography, land use/land cover, soil, human interference etc. Continental distribution of ET is shown below (figure 2). Generally, global precipitation should equal global ET for a long-term average.
ET is one of the most important components of the hydrologic cycle. Globally, about 60% of the land precipitation is returned back to the atmosphere through ET (Oki and Kanae, 2006). If the water lost due to ET is not compensated by precipitation, it may result into drought situation. ET is also connected to carbon uptake as plants tradeoff between water loss due to transpiration and carbon gain due to photosynthesis through regulation of stomatal conductance (Whitehead, 1998). ET involves the conversion of liquid water into water vapor thus requires an extensive amount of energy. Hence, ET also plays an important role
in the global energy budget (figure 3). About 50 % of the solar energy absorbed by the earth surface (161 W m-2) is consumed for the process of ET (80 W m-2) (Trenberth et al., 2009). ET affects local micro climate due to evaporative cooling (Bonfils and Lobell, 2007). AS ET is linked to land atmosphere interactions, any variation in long term ET pattern may be indicative of global climate change.
Figure 2 : Global distribution of precipitation, evaporation and runoff.
Figure 3: The Global annual mean Earth’s energy budget for the March 2000 to May 2004 period (W m-2)
Source: Trenberth and others 2009
Annex 1

151
Factors affecting Evapotranspiration
ET depends upon the availability of energy, soil moisture, and moisture holding capacity of the air. There are many factors which affect the ET process. Some of these factors can be grouped as follows:
1. Soil factors
a. Soil moisture content
b. Soil texture
c. Salinity
2. Plant factors
a. Variety
b. Plant density
c. Growth stage
d. Leaf area index
e. Canopy characteristics
f. Rooting depth
3. Weather factors
a. Temperature
b. Solar radiation
c. Relative humidity
d. Wind speed
4. Management factors
a. Tillage practice
b. Mulching
c. Irrigation practices
Methods for Evapotranspiration Estimation
Information on ET is vital for water management. However, ET is the most difficult component of the hydrologic cycle to measure. There are various methods available for ET measurement/estimation based on empirical equations, water balance, energy balance, or a combination. ET can be measured/estimated at leaf scale, canopy scale, field scale, landscape level, regional, continental, and global scale. If the reader is interested in knowing more details about different methods, they can refer to Verstraeten et al. (2008). Some of the ET estimation methods and approaches are below:
1. Empirical methods (Thornthwaite method, Turc method, Doorenbos & Pruitt method etc.)
Thronthwaite (1948) suggested following formula for computing ET based on field data collected in the United States.
Where
P = Monthly precipitation (inch)
ET = Monthly evapotranspiration (inch)
T = Mean monthly air temperature (°F)
Based on field data collected in the Western Europe, Turc (1961) developed an empirical formula for calculation of ET as a function of air temperature, relative humidity, and solar radiation.
Where
ET = Evapotranspiration (mm day-1)
T = Air temperature (°C)
Rs = Solar radiation (cal cm-2 day-1)
RH = Relative humidity (%)
Doorenbos and Pruitt (1977) recommended following formula for computing ET.
Where
ET = Evapotranspiration (mm day-1)
Δ = Slope of saturation vapor pressure temperature curve
(mbar °C-1)
γ = Psychrometric constant
Rs = Solar radiation (equivalent mm day-1)
a, b = Adjustment factors
b= -0.3 mm day-1
RH = Mean relative humidity (%)
Ud = Mean daytime wind speed (m s-1)
2. Penman- Monteith combination method
Where
λET = Latent heat flux i.e ET in energy term (W m-2)
Δ = Slope of saturation vapor pressure temperature curve (kPa °C-1)
γ = Psychrometric constant (kPa °C-1)
Rn = Net radiation (W m-2)
G = Soil heat flux (W m-2)
ρa = Air density (kg m-3)
cp = Specific heat of air at constant pressure (J kg-1 °C-1)
es = Saturation vapor pressure (kPa)
ea = Actual vapor pressure (kPa)
rs = Surface resistance (s m-1)
ra = Aerodynamic resistance (s m-1)
Annex 1

152
3. Evaporation Pan method
Evaporation pan is a simple technique for estimation of ET from the water surface. Class A pan is a standardized commonly used circular metallic container. The pan if filled with known quantity of water and the level of the water is recorded daily to compute water lost due to evaporation or increase in level due to rainfall. The pan if covered with a wire mesh to prevent birds’ drinking water. A coefficient is multiplied to pan evaporation to determine the ET.
4. Lysimeter
Lysimeter is a water balance based measuring device set up under a realistic environmental condition. All the incoming (precipitation
and irrigation) and outgoing (ET, percolation, runoff) water from the lysimeter are well accounted for. The amounts of water lost due to ET or gained due to precipitation are measured and total amount of ET is calculated accordingly. It is a very accurate measuring technique particularly for field crops. The top of the lysimeter is planted with the same crop as the surroundings. However, it is important to maintain the soil within the lysimeter to be representative of the surrounding soil column.
5. Tensiometer/Time domain reflectometer
Tensiometer and time domain reflectometer are point devices used to measure the soil water content. Water lost due to ET can be computed based on changes in soil moisture status. As these devices are point based measurements, these are not very accurate for scaling up at the field or regional scale.
6. Bowen ratio energy balance method
Bowen ratio energy balance method for measuring ET is based on the energy balance principle. The Bowen ratio (Ratio of sensible heat flux to the latent heat flux) is estimated based on temperature and vapor pressure gradients. Air temperature and humidity are measured at two different heights. It is assumed that the transfer coefficients of the heat and water vapor are the same and there are no horizontal gradients. ET is computed based on energy balance and it represents ET within its footprint. This technique has limitation particularly in advective condition.
Wik
iped
ia /
CC B
Y 3.
0
An evaporation pan.
ETH
Zur
ich
(ww
w.ia
c.et
hz.c
h)
A lysimeter used to test evaporation with realisitic environmental conditions.
Wik
iped
ia /
CC B
Y 3.
0A soil tensiometer.
Annex 1

153
7. Eddy covariance method
Eddy covariance/correlation flux method is another new technique for measuring ET. Eddy covariance system consisting of an ultrasonic anemometer and infrared gas analyzer measures the fluxes of CO2, methane, temperature, and water vapor (ET) transported by the eddies.
8. Sap flow sensor
Sap flow sensor is used to measure the transpiration component of the ET. It consists of heater and temperature probe which measure the rate at which sap ascends stems. Heat is used as a tracer of sap movement within the tree. An appropriate scaling method is used for computing water loss based on sap flow sensor.
9. Scintillometer
Scintillometer is a technique based on physical principle of the propagation of electromagnetic waves and their disturbance
caused by variations in atmospheric temperature, pressure and moisture. It consists of a light emitting transmitter and a receiver (detector) located at a given distance. Based on transmitter aperture size, wavelength, height of the scintillometer above the ground, ET is derived using energy balance.
10. Remote sensing
During the last few decades, considerable advances have been made in estimating ET using remotely sensed images. Various review papers have highlighted these advances and different approaches (Gowda et al., 2007; Kalma et al., 2008; Verstraeten et al., 2008). The Surface Energy Balance Algorithm for Land (SEBAL) model (Bastiaanssen et al., 1998) is one of the one-source models for estimating ET. This model requires minimal ground observation hence widely used in different agro-climatic conditions including data sparse region of the world.
Here is a step-by-step procedure for applying SEBAL model for estimating ET using Landsat images. The user should have basic understanding of soil-plant-water relationship and should be familiar (not necessary fluent) with remote sensing and GIS software.
Eddy covariance system consisting of an ultrasonic anemometer and infrared gas analyser (IRGA).
Wik
iped
ia /
CC B
Y 3.
0
A Large Aperture Scintillometer (transmitter) for measurement of the sensible heat flux over long distances.
Wik
iped
ia /
CC B
Y 3.
0
Annex 1

154
Downloading Landsat Images
Landsat images can be downloaded at no cost from the Earth-Explorer site (http://earthexplorer.usgs.gov/) (figure 4). The user should be registered and logged-in to download the images.
Once the user is logged-in, search criteria (address, path/row, coordinates, shapefile etc.) and date range can be entered. The selected example shows a search for path 37, row 37 images acquired during 2010 (figure 5).
Then select the Landsat Archive from the Data Sets menu and check in the relevant boxes (figure 6).
Select the appropriate options under the Additional Criteria menu. Make sure that the same criteria are selected for all the data sets under the drop down options of the Data Set. Generally one should prefer to use the “less than 10% cloud cover” for the Cloud Cover criteria (figure 7).
Figure 4: EarthExplorer home page.
Figure 5: Search criteria menu window of EarthExplorer.
Figure 6 : Selecting data sets.
Figure 7: Selection of Additional Criteria option.
Annex 1
Images from Landsat 7.
ERO
S/U
SGS
ERO
S/U
SGS
ERO
S/U
SGS

155
Selecting the Results menu shows all the available images for that particular path/row and acquisition dates.
User can explore different options (footprint, browse, down-load etc.) under each image. Selecting download option will display the following window.
Select the “Level 1 product” option and click Select Download Option and follow the subsequent option for download. Depend-ing upon data availability, data may be immediately saved to the disk or an order can be placed with the U.S. Geological Survey (USGS). If order is placed then user will receive an email whenever the data becomes available for download. The downloaded file should be unzipped.
Importing Landsat Images into Erdas Imagine
User can use any remote sensing and GIS software to process the Landsat images. The example shown here is based on the applica-tion of Erdas Imagine 2011 from the Intergraph Corporation.
Each of the seven bands should be imported one by one. Open Erdas Imagine 2011. Under the Manage Data menu select Import Data. Under the Format option, select GeoTIFF from the drop down menu. Select the downloaded file for the Input file. Select the output folder and enter a file name (it is a good practice to keep the same name with extension.img) and select OK. Accept the default and OK in the Import TIFF window that should pop up.
Stacking Layers of Image Files
On the menu bar select Raster, then Spectral, then the Layer Stack function. Input all seven layers (imported image file) one by one and add to the list. Give an output file name and select OK.
Annex 1
ERO
S/U
SGS
ERO
S/U
SGS
ERO
S/U
SGS
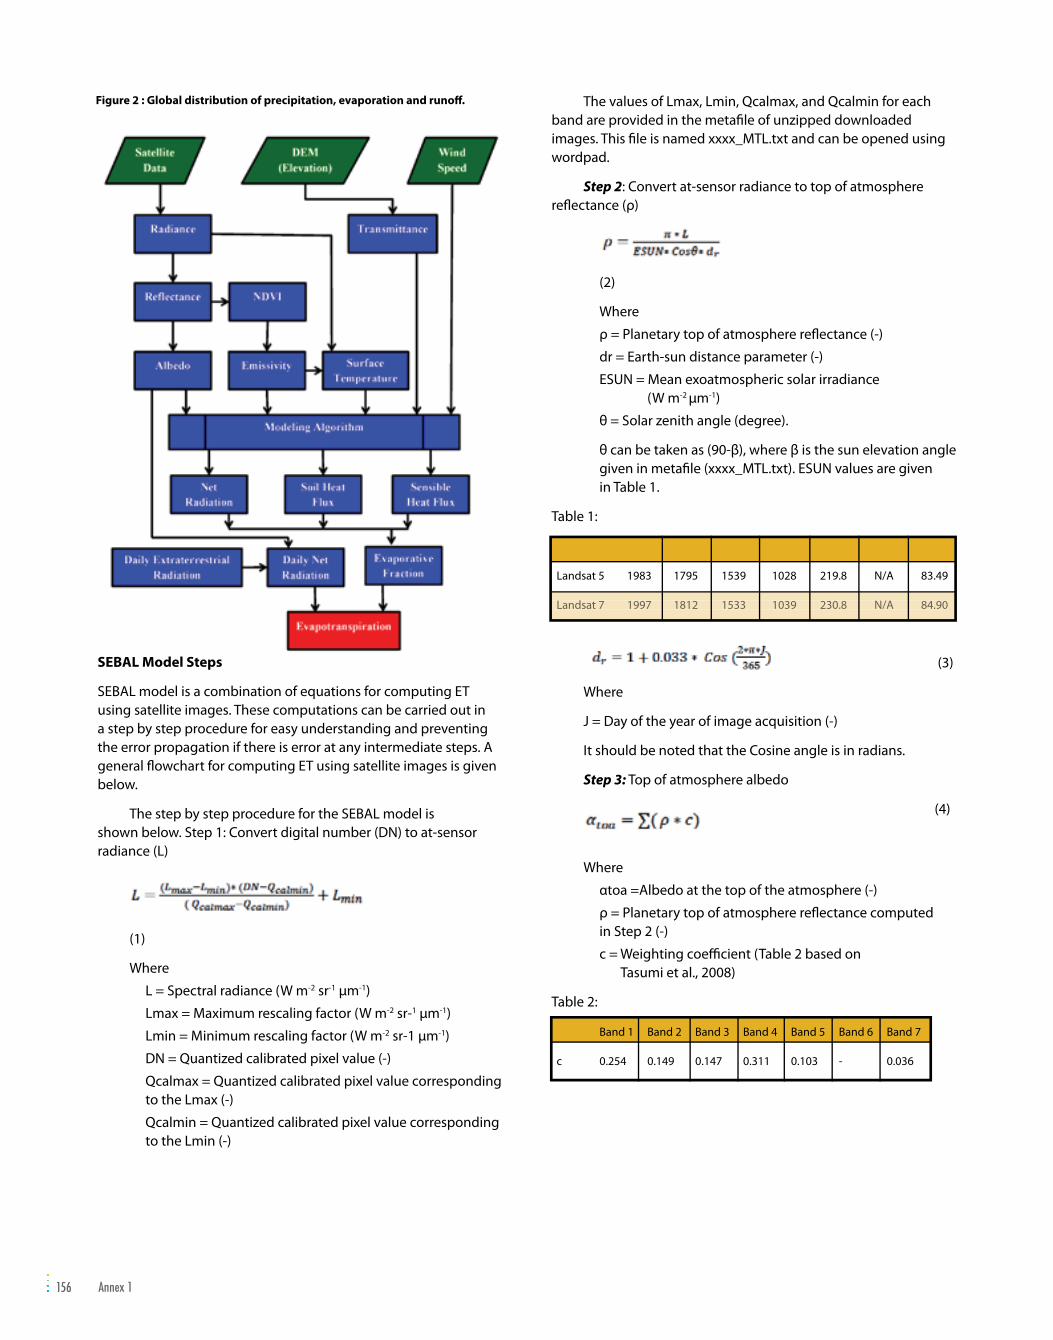
156
SEBAL Model Steps
SEBAL model is a combination of equations for computing ET using satellite images. These computations can be carried out in a step by step procedure for easy understanding and preventing the error propagation if there is error at any intermediate steps. A general fl owchart for computing ET using satellite images is given below.
The step by step procedure for the SEBAL model is shown below. Step 1: Convert digital number (DN) to at-sensor radiance (L)
(1)
Where
L = Spectral radiance (W m-2 sr-1 μm-1)
Lmax = Maximum rescaling factor (W m-2 sr-1 μm-1)
Lmin = Minimum rescaling factor (W m-2 sr-1 μm-1)
DN = Quantized calibrated pixel value (-)
Qcalmax = Quantized calibrated pixel value corresponding to the Lmax (-)
Qcalmin = Quantized calibrated pixel value corresponding to the Lmin (-)
The values of Lmax, Lmin, Qcalmax, and Qcalmin for each band are provided in the metafi le of unzipped downloaded images. This fi le is named xxxx_MTL.txt and can be opened using wordpad.
Step 2: Convert at-sensor radiance to top of atmosphere refl ectance (ρ)
(2)
Where
ρ = Planetary top of atmosphere refl ectance (-)
dr = Earth-sun distance parameter (-)
ESUN = Mean exoatmospheric solar irradiance (W m-2 μm-1)
θ = Solar zenith angle (degree).
θ can be taken as (90-β), where β is the sun elevation angle given in metafi le (xxxx_MTL.txt). ESUN values are given in Table 1.
Table 1:
Band 1 Band 2 Band 3 Band 4 Band 5 Band 6 Band 7
Landsat 5 1983 1795 1539 1028 219.8 N/A 83.49
Landsat 7 1997 1812 1533 1039 230.8 N/A 84.90
(3)
Where
J = Day of the year of image acquisition (-)
It should be noted that the Cosine angle is in radians.
Step 3: Top of atmosphere albedo
(4)
Where
αtoa =Albedo at the top of the atmosphere (-)
ρ = Planetary top of atmosphere refl ectance computed in Step 2 (-)
c = Weighting coeffi cient (Table 2 based on Tasumi et al., 2008)
Table 2:
Band 1 Band 2 Band 3 Band 4 Band 5 Band 6 Band 7
c 0.254 0.149 0.147 0.311 0.103 - 0.036
Landsat 7 1997 1812 1533 1039 230.8 N/A 84.90
Figure 2 : Global distribution of precipitation, evaporation and runoff .
Annex 1

157
Step 4: Computation of surface albedo (α)
(5)
(6)
Where
α = At surface albedo (-)
αtoa =Albedo at the top of the atmosphere computed in Step 3 (-)
αpath = Albedo path radiance ranging from 0.025 to 0.04 (-)
τsw = Transmittance as computed in Eq. (6)
z = Elevation above the mean sea level (m)
Step 5: Computation of Normalized Difference Vegetation Index (NDVI)
(7)
Where
ρ4 = Near infrared reflectance (Band 4)
ρ3 = Red reflectance (Band 3)
These variables are computed in Step 2 above.
Step 6: Computation of surface emissivity (ε)
(8)
(9)
Step 7: Computation of surface brightness temperature (Ts)
(10)
Where
Ts = Surface brightness temperature (K)
L6 = Spectral radiance of band 6 computed in Step 1
K1 & K2 = Calibration coefficients (table 3).
Table 3:
K1 K2
Landsat 5 607.76 1260.56
Landsat 7 666.09 1282.71
Digital elevation model (DEM) corrected surface temperature can be computed to account for the elevation effect on surface temperature based on lapse rate and elevation.
(11)
Where
Ts_DEM = DEM corrected surface temperature (K),
β = Temperature lapse rate (6° to 7° per 1000 m)
z = surface elevation (m)
z* is the representative elevation/weather station elevation (m)
Step 8: Computation of incoming shortwave radiation ( )
(12)
Where
=Incoming shortwave radiation (W m-2)
Gsc = Solar constant (1367 W m-2)
θ = Solar zenith angle (degree) from Step 2
dr = Earth-sun distance parameter (-) from Step 2
τsw = Transmittance as computed in Step 4
Step 9: Computation of incoming longwave radiation (Rl )
(13)
Where
= Incoming longwave radiation (W m-2)
τsw = Transmittance as computed in Step 4
σ = Stephan-Boltzmann constant (5.67 x 10⁻⁸ W m-2 K-4)
Ta = Air temperature (K; generally well water pixel or water temperature)
Step 10: Computation of outgoing longwave radiation ( )
(14)
Where
= Outgoing longwave radiation (W m-2)
σ = Stephan-Boltzmann constant (5.67 x 10⁻⁸ W m-2 K-4)
Ts = Surface brightness temperature (K) from Step 7
Annex 1

158
Step 11: Computation of net radiation (Rn)
(15)
Where
Rn = Net radiation (W m-2)
α = At surface albedo (-) from Step 4
Rsi =Incoming shortwave radiation (W m-2) from Step 8
Rli = Incoming longwave radiation (W m-2) from Step 9
ε = Surface emissivity (-) from Step 6
Rlh = Outgoing longwave radiation (W m-2) from Step 10
Step 12: Computation of soil heat flux (G)
(16)
(17)
Where
G = Soil heat flux (W m-2)
NDVI = Normalized Difference Vegetation Index (-) from Step 5
Rn = Net radiation (W m-2) from step 11
Step 13: Computation of surface roughness for momentum (Zom)
(18)
(19)
Where
Zom = Surface roughness length for momentum (m)
NDVI = Normalized Difference Vegetation Index (-) from Step 5
Step 14: Computation of friction velocity (u*)
(20)
Where
u* = Friction velocity (m s-1)
u = Wind speed (m s-1) measured at height zu (m)
k = Von Karman’s constant (0.41)
Zom = Surface roughness length for momentum (m) from Step 13
Wind velocity at 200 m height can be computed as
(21)
Where
u* = Friction velocity (m s-1) from Eq. 20
k = Von Karman’s constant (0.41)
Zom = Surface roughness length for momentum (m) from Step 13
Step 15: Computation of aerodynamic resistance to heat transport (rah)
(22)
Where
rah = Aerodynamic resistance to heat transport (s m-1)
u* = Friction velocity (m s-1) from Step 14
k = Von Karman’s constant (0.41)
Step 16: Selection of hot and cold pixels
It is hypothesized that all the available energy at the hot pixel is used for heating the air (sensible heat flux) whereas all the available energy is used for ET at the cold pixel (latent heat flux). A representative hot pixel should be selected from the bare soil surface. Surfaces such as built-up area, parking lot, road etc. should be avoided. The cold pixel should be selected from a well watered fully vegetated (NDVI >0.6) field or water body. The hot and cold anchor pixels should be close by so that they represent the same weather condition.
Step 17: Computation of differential temperature (dT)
(23)
(24)
Where
dTcold = Differential temperature (K) at the cold pixel
dThot = Differential temperature (K) at the hot pixel
rah = Aerodynamic resistance to heat transport (s m-1) from Step 15
ρa = Air density (kg m-3)
cp = Specific heat at constant pressure (1004 J kg-1 K-1)
Rn = Net radiation obtained in Step 11
G = Soil heat flux obtained in Step 12
Annex 1

159
A relationship is established between dT and Ts for all pixels as
(25)
where a and b are coefficients computed as
(26)
(27)
Where
dThot = Differential temperature (K) at the hot pixel
Ts hot = Surface brightness temperature (K) at the hot pixel from Step 7
Ts cold = Surface brightness temperature (K) at the cold pixel from Step 7
Step 18: Computation of air temperature (Ta)
(28)
Where
Ta = Air temperature (K)
Ts = Surface brightness temperature (K) from Step 7
dT = Differential temperature (K) from Step 17
Step 19: Computation of atmospheric pressure (P)
(29)
Where
P = Atmospheric pressure (k Pa) at elevation z (m)
Ta= Air temperature (K) from Step 18
Step 20: Computation of air density (ρa)
(30)
Where
ρa = Air density (kg m-3)
P = Atmospheric pressure (k Pa) at elevation z (m) from Step 19
R = Specific gas constant (287 J kg K-1)
Ta= Air temperature (K) from Step 18
Step 21: Computation of sensible heat flux (H)
(31)
Where
H = Sensible heat flux (W m-2)
ρa = Air density (kg m-3) from Step 20
cp = Specific heat at constant pressure (1004 J kg-1 K-1)
dT = Differential temperature (K) from Step 17
rah = Aerodynamic resistance to heat transport (s m-1) from Step 15
Step 22: Computation of Monin-Obukov length parameter (L)
(32)
(33)
where
g = Acceleration due to gravity (9.807 m s-2)
ρa = Air density (kg m-3) from Step 20
cp = Specific heat at constant pressure (1004 J kg-1 K-1)
Ts = Surface brightness temperature (K) from Step 7
k = Von Karman’s constant (0.41)
H = Sensible heat flux (W m-2) from Step 21
Step 23: Computation of stability correction factors
(34)
(35)
(36)
(37)
(38)
(39)
(40)
(41)
(42)
(43)
Annex 1

160
Step 24: Computation of corrected friction velocity (u*)
(44)
Step 25: Computation of corrected aerodynamic resistance (rah)
(45)
Step 17 to step 25 should be repeated for stability correction for hot and cold pixels using spreadsheet. This iterative process should be continued till values of a and b (Step 17) becomes stable (successive change not more than 10%). In general, this can be achieved in 6-10 iteration. Once a and b are stable, compute the final value of H as in step 21.
Step 26: Computation of instantaneous evaporative fraction (EF)
(46)
Step 27: Computation of latent heat of vaporization (λ)
(47)
Where
λ = Latent heat of vaporization (J kg-1)
Ts = Surface brightness temperature (K) from Step 7
Step 28: Computation of daily extraterrestrial radiation (Ra)
(48)
where
Ra = Extraterrestrial radiation (W m-2)
ωs = Sunset hour angle (radians)
ϕ = Latitude of the center of the image (radians)
δ = Solar declination (radians)
(49)
(50)
Step 29: Computation of daily net radiation (Rn24)
(51)
Step 30: Computation of daily ET (ET24)
(52)
where ET24 is daily evapotranspiration (mm d-1), and ρ is density of water (1000 kg m-3).
The above steps for ET computation can be coded using Model Maker of Erdas Imagine.
Annex 1

161
Coding SEBAL model using Erdas Imagine Model maker
Model for computation of radiance, reflectance, transmittance, and albedo is shown below.
In the next model we compute NDVI, surface roughness, emissivity, and surface temperature.
Annex 1

162
In the next model, net radiation and soil heat flux are computed.
Then coefficients a and b are computed using spreadsheet for stability correction. Once coefficients a and b are computed, sensible heat flux (H) can be computed using Model Maker in Erdas Imagine.
Annex 1

163
Finally, daily ET is computed using Model Maker in Erdas Imagine.
ReferencesAllen, M.R., Ingram, W.J., 2002. Constraints on future changes in
climate and the hydrologic cycle. Nature, 418, 224–232.
Arnell, N.W., Liu, C., Compagnucci, R., da Cunha, L., Hanaki, K., Howe, C., Mailu, G., Shiklomanov, I., Stakhiv, E., 2001. Hydrology and water resources. In: McCarthy, J.J., Canziani, O.F., Leary, N.A., Dokken, D.J., White, K.S. (Eds.), IPCC Climate Change 2001: Impacts, Adaptation & Vulnerability, The Third Assessment Report of Working Group II of the Intergovernmental Panel on Climate Change (IPCC), 1000. Cambridge University Press, Cambridge, UK, pp. 133–191 (1000 pages).
Bastiaanssen, W. G. M., Noordman, E. J. M., Pelgrum, H., Davids, G., Thoreson, B. P., Allen, R. G., 2005. SEBAL model with remotely sensed data to improve water-resources management under actual field conditions. Journal of Irrigation and Drainage Engineering, 131 (1), 85–93.
Bastiaanssen, W. G.M., Menenti, M., Feddes, R. A, Holtslag, A. A. M., 1998. A remote sensing surface energy balance algorithm for land. I. Formulation. Journal of Hydrology, 212/213, 198–212, doi:10.1016/S0022- 1694(98)00253-4.
Bonfils, C., Lobell, D., 2007. Empirical evidence for a recent slowdown in irrigation-induced cooling. Proceedings of the National Academy of Sciences of the United States of America, 104, 13582 – 13587.
Doorenbos J., Pruitt, W.O., 1977. CropWater Requirements. Irrigation and Drainage Paper 24, Food and Agriculture Organization of the United Nations: Rome, Italy; 144 pp.
Gowda, P. H., Chavez, J. L., Colaizzi, P.D., Evett, S. R., Howell, T.A., Tolk, J. A., 2007. Remote sensing based energy balance algorithms for mapping ET: current status and future challenges. Trans. Am. Soc. Agric. Biol. Engineers 50(5), 1639–1644.
Huntington, T. G., 2006. Evidence for intensification of the global water cycle: Review and synthesis. Journal of Hydrology, 319, 83 – 95.
Jung et al., 2010. Recent decline in the global land evapotranspiration trend due to limited moisture supply. Nature, 467, 951 – 954, doi:10.1038/nature09396.
Kalma, J. D., McVicar, T. R., McCabe, M. F., 2008. Estimating land surface evaporation: a review of methods using remotely sensed surface temperature data. Surveys in Geophysics, 29, 421–469.
Oki, T., Kanae, S., 2006. Global hydrological cycles and world water resources. Science, 313, 1068–1072.
Tasumi, M., Allen, R., Trezza, R., 2008. At-Surface Reflectance and Albedo from Satellite for Operational Calculation of Land Surface Energy Balance. Journal of Hydrologic Engineering, 13(2), 51–63, doi: 10.1061/(ASCE)1084-0699(2008)13:2(51).
Trenberth, K. E., Fasullo, J. T. Kiehl, J., 2009 Earth’s global energy budget. Bulletin of American Meteorological Society, 90, 311–323.
Turc, L., 1961. Estimation of irrigation water requirements, potential evapotranspiration: a simple climatic formula evolved up to date. Annals of Agronomy, 12, 13 – 49.
Verstraeten W. W, Veroustraete F., Feyen J., 2008. Assessment of evapotranspiration and soil moisture content across different scales of observation. Sensors, 8, 70–117.
Wentz, F. J., Ricciardulli, L., Hilburn, K., Mears, C., 2007. How much more rain will global warming bring? Science, 317, 233 – 235, DOI: 10.1126/science.1140746.
Whitehead, D., 1998 Regulation of stomatal conductance and transpiration in forest canopies. Tree Physiology, 18, 633 – 644.
Annex 1

164
NILE BASIN INITIATIVE
This publication presents a quick and clear overview of the people and places vulnerable to water stress related to the impacts of climate change in the Nile Basin. Satellite and other images provide striking visual evidence of the environmental changes taking place in each of the vulnerable regions identified. Data and information from detailed research provide evidence for the assessment. The report also includes analysis derived from multi-dimensional tools used at various geographic and political levels, from sub-national, national, and sub-basin to the entire Nile Basin area. These include scientific tools, such as scenario analyses and modeling, to improve our understanding of the likely impacts of climate change on the Nile River’s water systems.
The report’s insights and information should enable countries and relevant stakeholders involved in managing the Nile River Basin to make evidence-based policy choices and decisions that ensure the sustainability of the Nile and its resources.
Ad
aptatio
n to
Clim
ate-chan
ge Ind
uced
Water S
tress in th
e Nile B
asin: A
Vu
lnerab
ility Assessm
ent R
epo
rt
Adaptation to Climate-change
Induced Water Stress in the
Nile BasiNA Vulnerability Assessment Report