Embed Size (px)
Citation preview

Adaptation of Melbourne’s Metropolitan Rail Network in Response to Climate Change

Department of Climate Change and Energy Efficiency
30 August 2011
Adaptation of Melbourne’s Metropolitan Rail Network in Response to Climate Change
Adaptation of Melbourne’s Metropolitan Rail Network in Response to Climate Change
Prepared for
Department of Climate Change and Energy Efficiency
Prepared by
AECOM Australia Pty Ltd
Level 9, 8 Exhibition Street, Melbourne VIC 3000, Australia
T +61 3 9653 1234
F +61 3 9654 7117 www.aecom.com
ABN 20 093 846 925
30 August 2011
60100485
© AECOM Australia Pty Ltd (AECOM). All rights reserved.
AECOM has prepared this document for the sole use of the Client and for a specific purpose, each as expressly stated in the document. No other party should
rely on this document without the prior written consent of AECOM. AECOM undertakes no duty, nor accepts any responsibility, to any third party who may
rely upon or use this document. This document has been prepared based on the Client’s description of its requirements and AECOM’s experience, having
regard to assumptions that AECOM can reasonably be expected to make in accordance with sound professional principles. AECOM may also have relied
upon information provided by the Client and other third parties to prepare this document, some of which may not have been verified. Subject to the above
conditions, this document may be transmitted, reproduced or disseminated only in its entirety.
Adaptation of Melbourne’s Metropolitan Rail Network in Response to Climate Change
i
Table of Contents
At a Glance v
1.0 Introduction 1
1.1 Project objectives 1
1.2 Nature and benefits of analysis undertaken 1
1.3 Report outline 2
1.4 Acknowledgements 2
2.0 Background on Melbourne’s metropolitan rail network 3
2.1 Background 3
2.2 Performance 4
2.3 Climate Change 5
3.0 Projecting changes in climate 7
3.1 The greenhouse effect 7
3.2 Observed and projected changes 8
3.3 Greenhouse gas emission scenarios 8
3.4 Global Climate Models 10
4.0 Methodology 12
4.1 Scoping the study 12
4.2 Quantifying impacts of historic weather events 14
4.3 Quantifying future weather events 14
4.4 Modelling climate change without adaptation 15
4.5 Modelling climate change with adaptation 16
4.6 Reporting results on the modelling outputs 17
5.0 Modelling inputs for assessing climate change adaptation 18
5.1 Temperature thresholds 18
5.2 Average delay per event 19
5.3 Climate change projections 19
5.4 Public transport growth 21
5.5 Value of commuter time 22
5.6 Adaptation strategies 22

ii Adaptation of Melbourne’s Metropolitan Rail Network in Response to Climate Change
6.0 Potential adaptation strategies 24
6.1 Adaptation option 1: Concrete sleeper replacement 24
6.1.1 Description 24
6.1.2 Cost and benefits 24
6.1.3 Results 24
6.2 Adaptation option 2: Replace air conditioners in all rolling stock 25
6.2.1 Description 25
6.2.2 Cost and benefits 25
6.2.3 Results 25
6.3 Adaptation option 3: Regenerative breaking 26
6.3.1 Description 26
6.3.2 Cost and benefits 26
6.3.3 Results 26
6.4 Adaptation option 4: Change the cabling in the power lines and / or tensioning of the lines 26
6.4.1 Description 26
6.4.2 Cost and benefits 27
6.4.3 Results 27
6.5 Adaptation option 5: Protection of signalling equipment 27
6.5.1 Description 27
6.5.2 Cost and benefits 27
6.5.3 Results 27
6.6 Adaptation option 6: Heatwave behaviour change program 28
6.6.1 Description 28
6.6.2 Cost and benefits 28
6.6.3 Results 28
6.7 Summary of Cost Benefit Analysis Results 29
7.0 Sensitivity Analysis 30
7.1 Discount Rate 30
7.1.1 Discount Rate of 1.5% 30
7.1.2 Discount Rate of 6% 30
7.2 Value of Commuter Time 31
7.2.1 Value of commuter time = 45% of Wage Rate ($0.23 per minute) 31
7.2.2 Value of commuter time = 75% of Real Wage ($0.38 per minute) 31

Adaptation of Melbourne’s Metropolitan Rail Network in Response to Climate Change
iii
7.3 Timing of implementation of adaptation option 32
7.3.1 Implement in 20 years 32
7.3.2 Implement in 40 years 32
7.3.3 Implement in 60 years 33
8.0 Findings and outcomes 34
References 35
Acronyms AGO Australian Greenhouse Office
AGCM Atmospheric Global Circulation Models
AWAP Australian Water Availability Project
BoM Bureau of Meteorology
CBA Cost Benefit Analysis
CBD Central Business District
CoM City of Melbourne
CSIRO Commonwealth Scientific and Industrial Research Organisation
DCCEE Department of Climate Change and Energy Efficiency
DoT Department of Transport (Victorian Government)
DSE Department of Sustainability and Environment (Victorian Government)
GCM Global Climate Models
GHG Greenhouse gas
IPCC Intergovernmental Panel on Climate Change
LOS Level of Service
OGCM Oceanic Global Circulation Model
PV Present Value
PWDM Passenger Weighted Delayed Minutes
NPV Net Present Value
UHIE Urban Heat Island Effect
SRES Special Report on Emission Scenarios

iv Adaptation of Melbourne’s Metropolitan Rail Network in Response to Climate Change
Glossary
Adaptation
The process, or outcome of a process, that leads to a reduction in harm or risk of harm associated with climate
variability and climate change - UK Climate Impact Programme (UKCIP, 2003).
Economic benefits
A benefit to a person, business, or society that can be measured in financial terms.
Greenhouse gas emission scenarios
Estimations of the future quantity of greenhouse gases that may be released into the atmosphere, based on
global changes to society, economy, population and technology over time.
Net Present Value
Compares the value of a dollar today to the value of that same dollar in the future.
Passenger Weighted Delayed Minutes (PWDM)
The number of minutes delay multiplied by number of passengers affected by the delay. For example, 100
passengers delayed by 2 minutes implies 200 PWDM
Projections
Model-derived estimates of the future climate (IPCC, 2010).
Scenario
A plausible description of a possible future state of the world. A set of scenarios is often adopted to reflect the
range of uncertainty in projections (IPCC, 2010).
Urban Heat Island Effect
The increase in urban air temperature relative to surrounding rural temperatures is referred to as the urban
heat island effect (CSIRO, 2007).
Willingness to pay
The amount of money that individuals are prepared to pay to avoid the loss of a service.
Adaptation of Melbourne’s Metropolitan Rail Network in Response to Climate Change
v
At a Glance
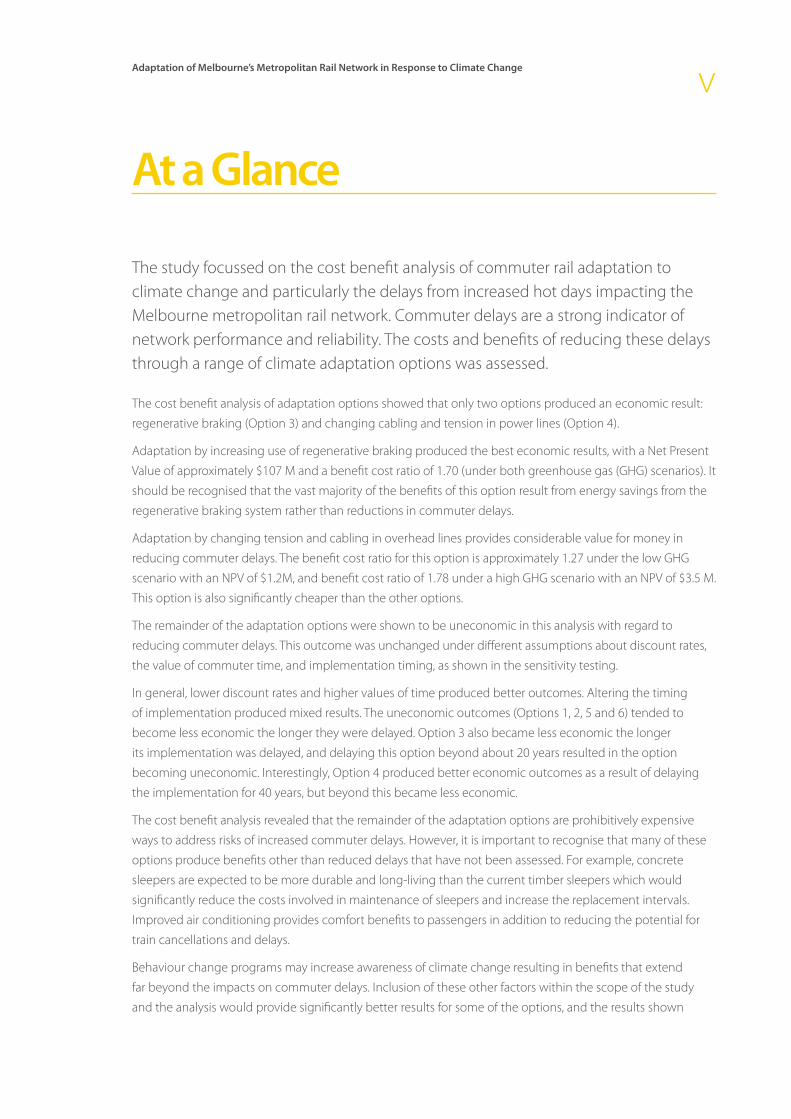
The study focussed on the cost benefit analysis of commuter rail adaptation to climate change and particularly the delays from increased hot days impacting the Melbourne metropolitan rail network. Commuter delays are a strong indicator of network performance and reliability. The costs and benefits of reducing these delays through a range of climate adaptation options was assessed.
The cost benefit analysis of adaptation options showed that only two options produced an economic result:
regenerative braking (Option 3) and changing cabling and tension in power lines (Option 4).
Adaptation by increasing use of regenerative braking produced the best economic results, with a Net Present
Value of approximately $107 M and a benefit cost ratio of 1.70 (under both greenhouse gas (GHG) scenarios). It
should be recognised that the vast majority of the benefits of this option result from energy savings from the
regenerative braking system rather than reductions in commuter delays.
Adaptation by changing tension and cabling in overhead lines provides considerable value for money in
reducing commuter delays. The benefit cost ratio for this option is approximately 1.27 under the low GHG
scenario with an NPV of $1.2M, and benefit cost ratio of 1.78 under a high GHG scenario with an NPV of $3.5 M.
This option is also significantly cheaper than the other options.
The remainder of the adaptation options were shown to be uneconomic in this analysis with regard to
reducing commuter delays. This outcome was unchanged under different assumptions about discount rates,
the value of commuter time, and implementation timing, as shown in the sensitivity testing.
In general, lower discount rates and higher values of time produced better outcomes. Altering the timing
of implementation produced mixed results. The uneconomic outcomes (Options 1, 2, 5 and 6) tended to
become less economic the longer they were delayed. Option 3 also became less economic the longer
its implementation was delayed, and delaying this option beyond about 20 years resulted in the option
becoming uneconomic. Interestingly, Option 4 produced better economic outcomes as a result of delaying
the implementation for 40 years, but beyond this became less economic.
The cost benefit analysis revealed that the remainder of the adaptation options are prohibitively expensive
ways to address risks of increased commuter delays. However, it is important to recognise that many of these
options produce benefits other than reduced delays that have not been assessed. For example, concrete
sleepers are expected to be more durable and long-living than the current timber sleepers which would
significantly reduce the costs involved in maintenance of sleepers and increase the replacement intervals.
Improved air conditioning provides comfort benefits to passengers in addition to reducing the potential for
train cancellations and delays.
Behaviour change programs may increase awareness of climate change resulting in benefits that extend
far beyond the impacts on commuter delays. Inclusion of these other factors within the scope of the study
and the analysis would provide significantly better results for some of the options, and the results shown

vi Adaptation of Melbourne’s Metropolitan Rail Network in Response to Climate Change
here should be viewed with this in mind. The take home message from the analysis here is that there are
adaptation measures that result in net benefits for the community and drive a range of other positive
outcomes. This analysis is likely true across other rail network systems in Australia and worldwide. There would
be value in seeing whether the lessons learned in this project can be applied more widely.
Summary of Benefit-Cost Analysis ResultsA summary of the Net Present Value and Benefit Cost Ratio of each adaptation option is presented in Table 14.
Table 1 Summary of BCA Results for all Adaptation Options
ADAPTATION OPTION LOW GHG SCENARIO (A1B) HIGH GHG SCENARIO (A1FI)
Net Present Value ($M)
Benefit Cost Ratio
Net Present Value ($M)
Benefit Cost Ratio
Option 1 - Concrete sleepers -$120 0.09 -$115 0.12
Option 2 - Replace air con. -$80 0.13 -$75 0.18
Option 3 - Regen. braking $107 1.70 $107 1.70
Option 4 - Cabling $1 1.27 $4 1.78
Option 5 - Protect equipment -$295 0.01 -$242 0.01
Option 6 - Behaviour change program -$29 0.04 -$28 0.05

Adaptation of Melbourne’s Metropolitan Rail Network in Response to Climate Change
1
1.0 Introduction
Infrastructure investors, owners, managers and governments need to understand the physical impacts of climate change. They also need information on adaptation options, to inform decision making on which to implement and when.
Effective adaptation will reduce the economic impacts to the community resulting from an increased risk of
infrastructure failure due to climate change. This is recognised by the Australian Government and is reflected
in adaptation being one of the three pillars of the Australian Government’s climate change strategy. To
appropriately guide adaptation, the Government needs to understand the:
• likely community impacts of climate change
• impediments for infrastructure owners to implement adaptation options
• optimal timing of this adaptation implementation
• costs and benefits of adaptation options.
AECOM was engaged by the Australian Department of Climate Change and Energy Efficiency (DCCEE) to
undertake a series of case studies analysing the economic case for adaptation in response to risks of climate
change impacts on infrastructure.
This case study analysed the benefits and costs of possible measures to adapt Melbourne’s metropolitan rail
network to climate change impacts. It did so in terms of the measures’ modelled impacts on the number
of minutes passengers would wait for the arrival of scheduled train services following delays as a result of
changed weather impacts.
This project will inform the Australian Government on policy responses to the risk that climate change might
increase infrastructure investment and maintenance costs.
1.1 Project objectives The objectives of this project were to:
• explore the optimal climate change adaptation options for maintaining the operational performance
of the metropolitan rail network
• determine the optimal timing for implementing adaptation options.
1.2 Nature and benefits of analysis undertaken Climate change is increasing severity and frequency of future weather and climate events. The uncertainty of
the timing of these increased impacts on infrastructure can be partially reduced through effective adaptation,
such as additional flood protection or increasing the tolerance of overhead structures to increased wind
speeds. However, even when an ostensibly effective adaptation option is identified, there is currently little

2 Adaptation of Melbourne’s Metropolitan Rail Network in Response to Climate Change
indication regarding the specific benefits it will deliver, when it should be built, or to what standard. This case
study responds to this concern by identifying viable adaptation options, costing these options and analysing
their benefits and the optimal timing for their implementation.
AECOM has used an expected benefit-cost methodology to rank and select preferred adaptation options for
Melbourne’s metropolitan rail network. Using this approach, economic benefits are estimated in terms of the
willingness of consumers or other beneficiaries to pay for a good or service. The use of a benefit-cost analysis
approach allows an assessment of the relative social merits of potential adaptation options in monetary terms.
Benefit-cost analysis is a methodology that enables the analysis of all costs and benefits in monetary units
that reflect our preferences for, and use of, resources. Its scope therefore encompasses the value placed by
society as a whole on the costs and benefits of a proposed course of action, rather than just using financial
or commercial values. Costs are measured as both losses and implementation costs, and benefits reflect the
willingness to pay of those who consume or otherwise benefit from an action or project.
1.3 Report outline This report is structured into seven chapters:
• Chapter 1 describes the objectives of the project, the nature of the analysis undertaken, and the
benefits of the approach adopted.
• Chapter 2 provides the background on Melbourne’s metropolitan rail network.
• Chapter 3 provides an overview of climate change and how future changes in weather events were
determined.
• Chapter 4 describes the methodology that was used for the case study.
• Chapter 5 presents the inputs developed for the economic model, including the value of time,
expected passenger delays and the projected change in climate.
• Chapter 6 discusses adaptation options to mitigate the impacts of climate change and presents the
modelling results for each adaptation option in terms of the benefits and costs.
• Chapter 7 describes the findings in terms of the preferred adaptation options and discusses lessons
learnt for adaptation of infrastructure and rail networks.
1.4 Acknowledgements AECOM received significant input into this study from the following organisations and individuals, and
acknowledges their support:
• Department of Transport (DoT)
• Metro Trains Melbourne (Metro)
• Commonwealth Scientific and Industrial Research Organisation (CSIRO)
• Bureau of Meteorology (BoM)
• Dr Leo Dobes, Crawford School of Economics and Government, Australian National University.
Adaptation of Melbourne’s Metropolitan Rail Network in Response to Climate Change
3
2.0 Background on Melbourne’s metropolitan rail network
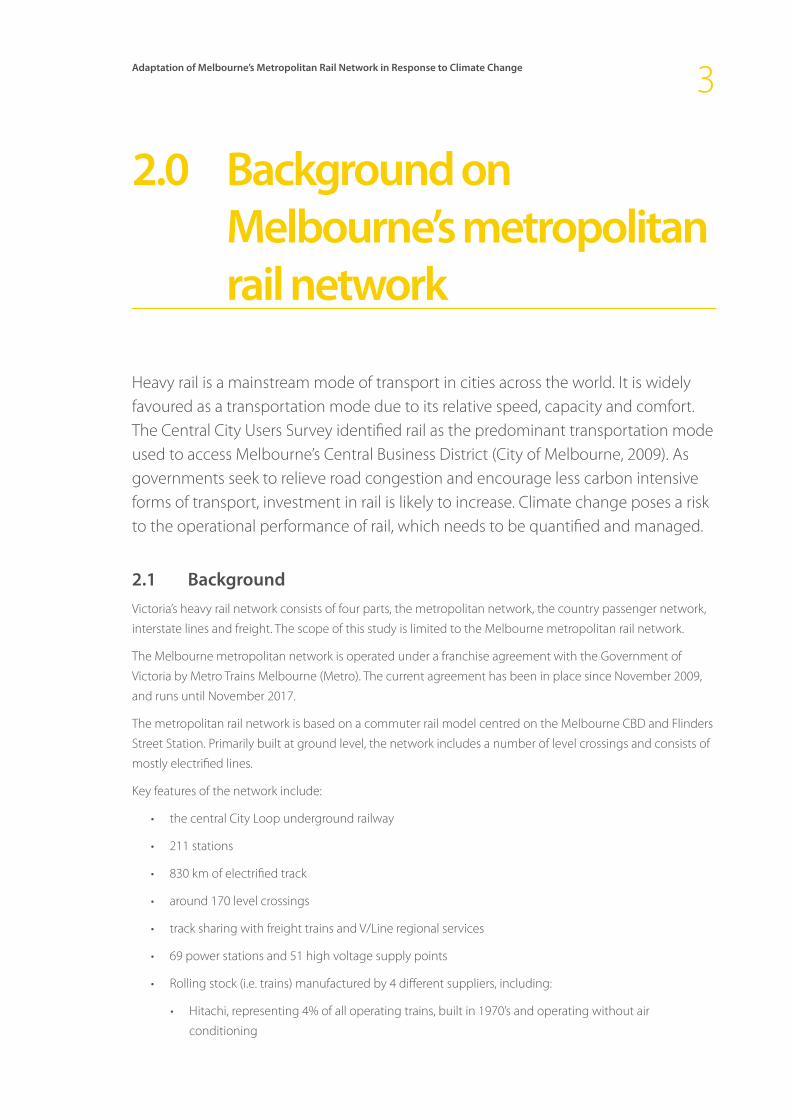
Heavy rail is a mainstream mode of transport in cities across the world. It is widely favoured as a transportation mode due to its relative speed, capacity and comfort. The Central City Users Survey identified rail as the predominant transportation mode used to access Melbourne’s Central Business District (City of Melbourne, 2009). As governments seek to relieve road congestion and encourage less carbon intensive forms of transport, investment in rail is likely to increase. Climate change poses a risk to the operational performance of rail, which needs to be quantified and managed.
2.1 Background Victoria’s heavy rail network consists of four parts, the metropolitan network, the country passenger network,
interstate lines and freight. The scope of this study is limited to the Melbourne metropolitan rail network.
The Melbourne metropolitan network is operated under a franchise agreement with the Government of
Victoria by Metro Trains Melbourne (Metro). The current agreement has been in place since November 2009,
and runs until November 2017.
The metropolitan rail network is based on a commuter rail model centred on the Melbourne CBD and Flinders
Street Station. Primarily built at ground level, the network includes a number of level crossings and consists of
mostly electrified lines.
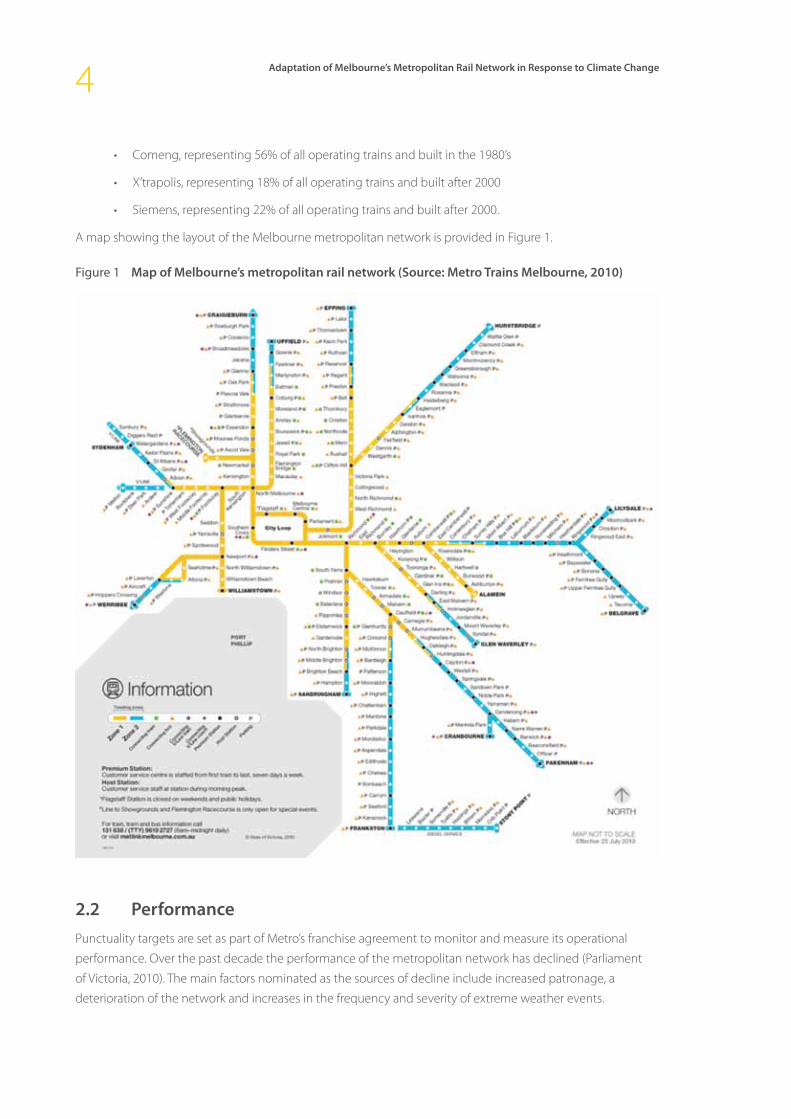
Key features of the network include:
• the central City Loop underground railway
• 211 stations
• 830 km of electrified track
• around 170 level crossings
• track sharing with freight trains and V/Line regional services
• 69 power stations and 51 high voltage supply points
• Rolling stock (i.e. trains) manufactured by 4 different suppliers, including:
• Hitachi, representing 4% of all operating trains, built in 1970’s and operating without air
conditioning
4 Adaptation of Melbourne’s Metropolitan Rail Network in Response to Climate Change
• Comeng, representing 56% of all operating trains and built in the 1980’s
• X’trapolis, representing 18% of all operating trains and built after 2000
• Siemens, representing 22% of all operating trains and built after 2000.
A map showing the layout of the Melbourne metropolitan network is provided in Figure 1.
Figure 1 Map of Melbourne’s metropolitan rail network (Source: Metro Trains Melbourne, 2010)
2.2 Performance Punctuality targets are set as part of Metro’s franchise agreement to monitor and measure its operational
performance. Over the past decade the performance of the metropolitan network has declined (Parliament
of Victoria, 2010). The main factors nominated as the sources of decline include increased patronage, a
deterioration of the network and increases in the frequency and severity of extreme weather events.
Adaptation of Melbourne’s Metropolitan Rail Network in Response to Climate Change
5
The Melbourne rail network has experienced an 80% increase in patronage since 1999 (Connex Melbourne,
2009). This has placed an unprecedented demand on the network which in turn has affected the reliability
and performance of services (Parliament of Victoria, 2010). Other service failures have been attributed to V/
Line trains’ use of the metropolitan network, signal failures, uncooperative passengers, network congestion
and a driver shortage (Connex Melbourne, 2009). Although it is recognised that these factors have significantly
affected the performance of the rail network, this study’s scope is limited to considering the impact of
extreme weather events.
A number of extreme temperature days in 2009 and 2010 highlighted problems with the performance of the
metropolitan network. For example, on 28 January 2009 the temperature in Melbourne reached 43°C, which
led to the cancellation of at least 58 train services due to a range of track and operational problems. Two days
later, the temperature exceeded 45°C, leading to 730 train cancellations (Parliament of Victoria, 2010).
Air conditioning on some trains becomes unreliable when the temperature rises to 35°C requiring these trains
to withdrawal from service. On 11 January 2010, when temperatures reached 43.6°C, approximately 40% of all
train cancellations were attributed to faulty air conditioners (Parliament of Victoria, 2010).
In March 2009, the Victorian Legislative Council appointed a Select Committee to investigate the causes of
the inadequate performance of the metropolitan train service (Parliament of Victoria, 2010). The investigation
found the main causes for cancellations and delays were train and infrastructure faults and issues regarding
passenger interchange (Parliament of Victoria, 2010). The committee found that the influence of weather
conditions on these causes included:
• extremely hot temperatures causing tracks built using wooden sleepers to buckle
• extremely hot temperatures causing signal and power failures
• extreme weather events causing network operations to fail – this impact has also been influenced by a
lack of network maintenance
• extreme weather conditions causing air conditioners on the Comeng train fleet to fail.
Based on the findings from the Select Committee, the Victorian Government is embarking on a program of
operational change and capital investment to improve the performance of the metropolitan rail network. To
enhance network reliability, Metro is currently:
• undertaking a program to replace all timber sleepers with concrete sleepers to reduce incidences of
track buckling (this should also reduce long term maintenance costs)
• replacing the air conditioning system on all trains manufactured by Comeng, so they are able to
operate in temperatures of up to 45ºC (DoT, 2009).
2.3 Climate Change Future climate change poses significant risks to the Melbourne metropolitan rail network, including:
• an increased number and extent of disruptions from extreme wind, heat, flash flooding, and intense
storms
• power failures from wind, heat and storms affecting operations (e.g. signalling)
• flooding of train tracks

6 Adaptation of Melbourne’s Metropolitan Rail Network in Response to Climate Change
• increased risk of derailment due to tracks buckling in intense heat, also causing trains to run slower
during these periods
• increased incidence of illness on public transport, resulting in service disruption, contributed to by
intense heat and congestion.
These expected impacts have been noted in various studies, including the City of Melbourne’s Climate
Change Risk Report (City of Melbourne, 2008) and those released by the Select Committee discussed above.
This study will explore climate change adaptation options for maintaining the operational performance of the
metropolitan rail network in the face of these anticipated impacts.

Adaptation of Melbourne’s Metropolitan Rail Network in Response to Climate Change
7
3.0 Projecting changes in climate
This chapter outlines why the climate is changing and describes currently observed and projected future climatic changes. The methods used to project these future changes are also discussed.
3.1 The greenhouse effectThe greenhouse effect is the natural process that maintains the Earth’s habitable temperature. Energy from
the sun passes through the atmosphere and hits the Earth’s surface. Some of this energy warms the land and
oceans, whilst most of it is radiated back into the atmosphere. A blanket of greenhouse gases then re-radiates
some of this energy back towards the Earth’s surface, whilst most escapes into space. Greenhouse gases (GHG)
include water vapour, carbon dioxide, methane and a range of other gases. The greenhouse effect keeps
the planet warm enough to sustain life, maintaining an average global temperature of approximately 15°C.
Without the greenhouse effect the average global surface temperature would be approximately -18°C
(Holper, 2002).
Human activity, mostly in the last 200 years, has increased the concentration of GHGs in the atmosphere,
with key contributors including the burning of fossils fuels (e.g. coal and oil) and the clearing of vegetation.
From 1800 to 2009, the atmospheric concentration of carbon dioxide has increased from 280 parts per million
(ppm) to 386 ppm – a 38% increase. This has caused more energy to be trapped in the atmosphere, creating
the enhanced greenhouse effect (see Figure 2).
Figure 2 The Natural Greenhouse Effect and Enhanced Greenhouse Effect (AGO, 2006)

8 Adaptation of Melbourne’s Metropolitan Rail Network in Response to Climate Change
3.2 Observed and projected changesIn 2007 the Intergovernmental Panel on Climate Change (IPCC) released their fourth assessment report,
concluding that:
• warming of the climate system is unequivocal
• humans are very likely to be causing most of the warming that has been experienced since 1950
• it is very likely that climatic changes will continue well into the future, and that they will be larger than
those seen in the recent past (IPCC, 2007).
The Earth’s average temperature increased by approximately 0.7°C over the past century (CSIRO, 2011), whilst
Australia’s average temperature increased by just under 1°C between 1910 and 2009 (CSIRO, 2011). Most of
this increase occurred after 1950 (approximately 0.7oC) and the past decade (2000 – 2009) was the warmest
on record (CSIRO, 2011). In Victoria the average temperature increased by just under 0.6ºC from 1950 to 2005
(CSIRO, 2007).
In the future, Victoria is expected to warm at a slightly faster rate than the global average (CSRIO, 2007).
Climate change projections prepared by CSIRO and BoM (2007) suggest that the future climate of Victoria is
likely to be characterised by:
• lower average rainfall
• more intense extreme rainfall events
• higher average temperatures
• a more frequent occurrence of extreme temperatures
• more frequent very high and extreme fire danger days
• higher storm surge events
• higher average sea levels.
The degree of climate change which we will experience, and the timeframe over which these changes occur,
will be significantly influenced by the volume and timing of future GHG emissions.
3.3 Greenhouse gas emission scenarios The IPCC has agreed to six GHG emission scenarios, which each provide a different estimate of the future
trajectory of GHG emissions. Each scenario has been built based on a range of different demographic,
economic and technological assumptions. For this study, GHG emission scenarios from the ‘A1’ family have
been adopted (refer to Box 1). This set of scenarios assume a future of rapid economic growth, a global
population that peaks in the middle of the 21st century, and the rapid introduction of new technologies.
The ‘A1’ family of GHG emission scenarios represent a ‘high emissions’ future. Selection of these scenarios for
this study therefore ensures that a cautious, conservative approach has been taken. Additionally, the current
global GHG emissions trajectory is tracking in line with this ‘high emissions’ future; choosing a set of scenarios
which represent a lower emissions future (such as the ‘B1’ family) would be unduly optimistic
(Rahmstorf et al,, 2007).

Adaptation of Melbourne’s Metropolitan Rail Network in Response to Climate Change
9
The following specific scenarios were used for this study:
• The A1FI scenario describes a future with the highest concentrations of GHGs, and therefore the
greatest climate change, of the IPCC’s emission scenarios.
• The A1B scenario describes a lower emissions future than the A1FI scenario, particularly in the latter
half of the 21st Century.
Box 1: Emission Scenarios Emission scenarios are estimates of the future quantity of greenhouse gases that may be released into the
atmosphere. These are based on assumptions about future demographic changes, and the implementation
and efficiency of energy policies.
The Intergovernmental Panel on Climate Change (IPCC) developed scenarios in 1990, 1992 and 2000 and
released a Special Report on Emission Scenarios (SRES). The SRES is used for input data for climate models.
To reflect the latest rapid changes in societies since 2000, new emission scenarios are currently under
development.
The IPCC emission scenarios are divided into four families: A1, A2, B1 and B2. A description of each scenario
is provided in Table 2. Potential future temperature changes associated with each of the two SRES that have
been modelled are presented in Figure 3, for low medium and high rates of global warming.
Table 2 SRES Scenarios (Nakićenović & Swart, 2000)
SRES SCENARIO DESCRIPTION OF SCENARIO
A1FI Rapid economic growth, a global
population that peaks mid 21st
century and rapid introduction of
new technologies
Intensive reliance on fossil fuel
energy resources
A1T Increased reliance on non-fossil
fuel energy resources
A1B Balance across all energy sources
A2 Very heterogeneous world with high population growth, slow
economic development and slow technological change
B1 Convergent world, same global population as A1 but with more rapid
changes in economic structures toward a service and information
economy
B2 Intermediate population and economic growth, emphasis on
development of solutions to economic, social and environmental
sustainability
The modelled GHG emission scenarios suggest the following potential future temperature changes:
• a 5.5oC increase in global average temperatures by 2100, compared with 1990 levels, for the A1FI GHG
emissions scenario
• a 2oC increase in global average temperatures by 2100, compared with 1990 levels, for the A1B GHG
emissions scenario.

10 Adaptation of Melbourne’s Metropolitan Rail Network in Response to Climate Change
Figure 3 Global-average temperature change for low (yellow), mid (red) and high (brown) rate of global warming for the two SRES emission scenarios used in this study (Source: SRES 2000 in CSIRO 2010).
3.4 Global Climate ModelsIn addition to the uncertainty regarding which GHG emission scenario will most accurately predict actual
future emissions, twenty-three different Global Climate Models (GCMs) have been developed by researchers,
to project the likely influence of these scenarios on the future climate. These GCMs use Atmospheric and
Oceanic Global Circulation Models (AGCMs and OGCMs), in addition to other modelling inputs, to develop
these climate change projections, and improve our understanding of climatological processes.
AGCMs and OGCMs rely on mathematical models of atmospheric and oceanic circulation to project changes
in climate variables (CSIRO, 2011). Although the results from individual climate models can differ significantly,
each one produces a plausible future climate for a given emissions scenario. Typically, projections are created
for individual climate variables, for selected years and emission scenarios.
For the purposes of this study, we needed to identify which GCMs would be most relevant and appropriate.
This task was done in consultation with CSIRO, in consideration of:
• our ability to access their outputs, in the format required for our study
• their anticipated accuracy for projecting changes to Melbourne’s climate.
Based on this process, all but six models were excluded. The following GCMs were used for the purposes of
this study:
• CSIRO-Mk3.0 (developed by CSIRO)
• CSIRO-Mk3.5 (developed by CSIRO)
• GFDL-CM2.0 (developed by the National Oceanic and Atmospheric Administration’s Geophysical Fluid
Dynamics Laboratory)
• GFDL-CM2.1 (developed by the National Oceanic and Atmospheric Administration’s Geophysical Fluid
Dynamics Laboratory)

Adaptation of Melbourne’s Metropolitan Rail Network in Response to Climate Change
11
• MIROC3.2(medres) (developed by the Center for Climate System Research at The University of Tokyo,
the Japanese National Institute for Environmental Studies, and the Frontier Research Center for
Global Change
• ECHAM5/MPI-OM (developed by the Max Planck Institute for Meteorology).
An overview of how these climate models have been used to generate climate change projections for this
study is provided in Section 4.

12 Adaptation of Melbourne’s Metropolitan Rail Network in Response to Climate Change
4.0 Methodology
This study developed a model that can be used by decision makers to evaluate climate change adaptation
options for Melbourne’s metropolitan rail network. To do this, we have assessed the projected socio-economic
costs from climatic changes and identified the optimal timing to implement a number of costed adaptation
solutions. The six stages involved in delivering this study are discussed below (Figure 4).
Figure 4 Methodology for the study
1. Scope the study
2. Quantify historic weather events
3. Quantify future weather events
4. Modelling climate change
without adaptation
5. Modelling climate change
with adaptation
6. Analysis and communicate
the findings
• A draft report was developed and issued to DCCEE for review
• Report was updated and finalised to incorporate DCCEE’s feedback
• Adaptation options were identified and prioritised
• Costs and benefits for the prioritised adaptation options were developed
• Benefits and costs were averaged across climate models for each climate scenario used
• The assumptions and economic parameters governing the model were established
• The model was designed, built and tested
• The relationship between economic costs and frequency of extreme temperature events
was determined
• The number of projected yearly events triggering thresholds were identified under the different
climate change scenarios
• Temperature thresholds causing delays were identified
• Historic dates when thresholds were exceeded, and their associated passenger delays,
were identified
• The relationship between a weather event and passenger delays was determined
• Project parameters were set
• The study boundary was established
• Modelling relationships were identified
Key outcomes from each stage
4.1 Scoping the studyAECOM identified and confirmed key project parameters in consultation with DCCEE, Metro and DoT, namely:
• the region under investigation (refer to Figure 1 for a map of the Melbourne metropolitan rail network)
• the climate variables to be initially considered for inclusion (extreme wind, extreme rainfall and
temperate)
Adaptation of Melbourne’s Metropolitan Rail Network in Response to Climate Change
13
• the greenhouse gas emission scenarios to be modelled (A1FI and A1B)
• the global climate models to be utilised (as discussed above)
• a measurement indicator of network performance
• historic weather events which affected the reliability of the metropolitan commuter rail network
• costs associated with the impacts of climate change
• adaptation options for the metropolitan network, including their associated costs
• projected changes in the number of extreme weather events as yearly time series, from 2011 to 2100
• the detailed economic model specifications.
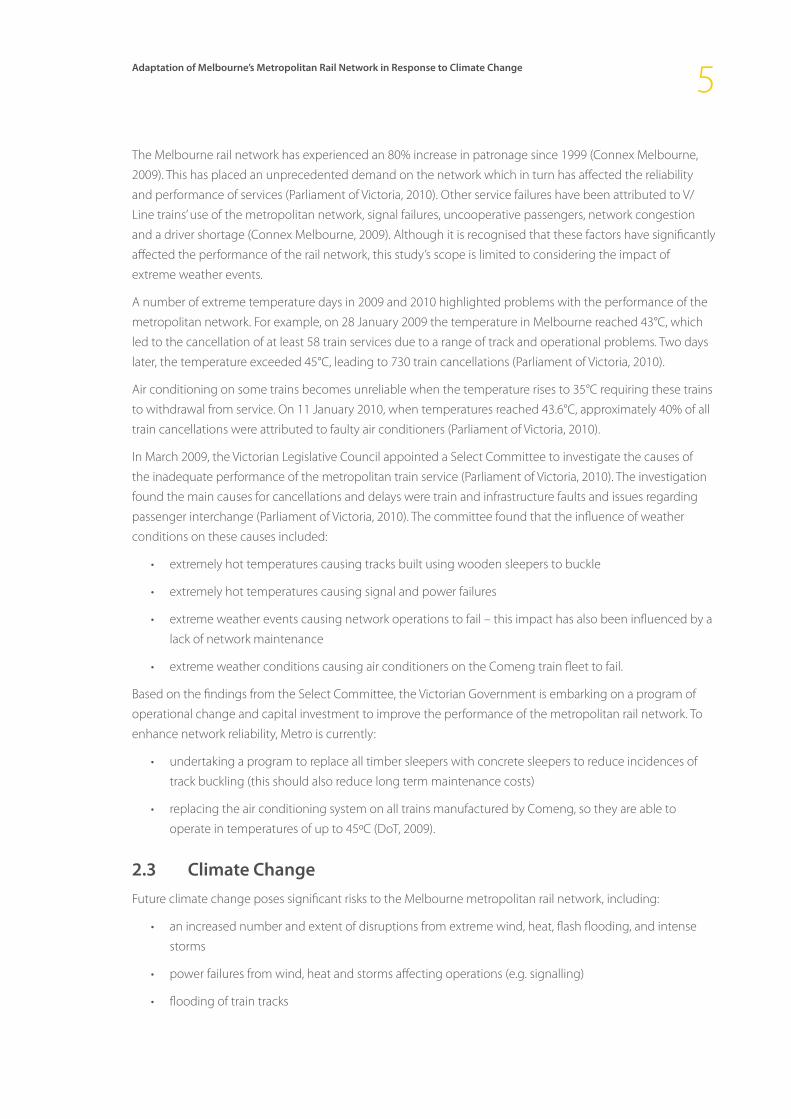
The way in which these project parameters were used in the study is outlined in Figure 5.
Figure 5 Process flow of the relationships for modelling the economic impact to rail network from climate change induced hot weather events
Historical rail incidents (Data from DoT)
Identify incidents with dates that coincide with high temperature days and sequences
Calculate average number of passengers
involved in each incident
Calculate average delays for each
“hot day” category
Identify incidents with dates that coincide with “normal” temperature days
(temperatures <34.5 degrees)
Calculate the average delay attributable to temperature (for each temperature category)
Calculate average Passenger Weighted Delayed Minutes (PWDM) attributable to extreme
temperatures
Project change in extreme temperature
(data from CSIRO)Projected number of
events for each year for 12 scenarios
(2 GHG emissions and 6 GCM)
Calculate average delays for each “normal day”
Project PWDM out to 2100
Assign Cost of Lost Travel Time to PWDM
Determine Net Present Value of impacts averaged across the GCMs for each GHG emission scenario
Historical weather incidents (Data from BoM)

14 Adaptation of Melbourne’s Metropolitan Rail Network in Response to Climate Change
4.2 Quantifying impacts of historic weather events AECOM worked with DoT to understand the possible relationships between historic weather events and the
performance of train services. One of the key purposes of this was to identify a performance indicator which
would enable the modelling of the likely impact of future weather events on the train network. This work
concluded that the most appropriate measure would be an existing performance measurement indicator,
given the access to robust and meaningful data. Passenger Weighted Delayed Minutes (PWDM) was the
chosen indicator for recorded network delays.
To determine PWDM for the Melbourne metropolitan train network, any service failures (such as delays or
cancellations) are recorded and rounded to the nearest minute. They are then weighted to account for the
number of people estimated to be travelling on that specific train during the measured time period, day of
week and direction of travel. The DoT provided AECOM with records of PWDM for the past 10 years from the
ToPS database, factoring in growth in passenger numbers over that period.
AECOM’s rail network specialists then identified the weather conditions which are likely to affect network
performance, in the form of specific thresholds being exceeded. AECOM identified the dates on which these
thresholds were exceeded by analysing historic weather data obtained from the BoM.
AECOM reviewed the PWDM for days in which these weather thresholds were exceeded. There was a clear
increase in PWMD for days that exceeded these weather event thresholds compared to the annual average
PWDM. The last 10 years of PWDM data was analysed to determine:
• The average PWDM for each category of weather thresholds exceeded (for example, the average
PWDM on a single day with temperatures reaching between 37 and 40 degrees was 1,139,482 minutes
delay across the network)
• The average PWDM for a ‘normal day’ (i.e. a day in which none of the temperature thresholds were
exceeded).
This ‘normal-day’ figure represents the average delay that would be expected to occur on any given day,
regardless of temperature. This normal-day PWDM was then deducted from the temperature related
PWDM for each of the threshold categories to estimate the average PWDM in each category attributable to
temperature.
The outputs of this process were then used as the basis for estimating expected delays (as measured by
PWDM) in the future on any given high-temperature day, or sequence of high-temperature days. By assessing
the number of such days expected in the future, the expected impacts of delay under climate change could
then be assessed.
4.3 Quantifying future weather events AECOM consulted CSIRO to establish the projected number of days when the thresholds established during
the previous project stage might be exceeded due to future climate change. All climate variables were
considered for this analysis. However, all variables except extreme temperature were excluded due to a lack of
appropriate, available data, or a lack of anticipated impact on the rail network.

Adaptation of Melbourne’s Metropolitan Rail Network in Response to Climate Change
15
Climate induced changes to average and extreme wind speed and rainfall could significantly affect the rail
network. However, both of these variables were not able to be assessed in this study due to a lack of yearly
data (i.e. data was available for time slices such as 2030 or 2050, but not for every year between 2020 and 2100,
as required by this study).
Other climate variables such as bushfires, hail, dust, sea level rise and storm surge are not considered
significant risks to the metropolitan rail network relative to extreme temperature.
To enable an analysis of the likely number of days exceeding extreme temperature thresholds within the rail
network, CSIRO generated projections for the probable annual number of days where the temperature is likely
to exceed 34.5°C, 37.0°C and 40.0°C, for each GHG emission scenario (i.e. A1FI and A1B), from 2020 to 2099. In
other words, CSIRO modelled how the right hand tail of the temperature duration curve might change under
different climate models. The Australian Water Availability Project was used to model these results. To provide a
baseline for comparison with this projected data, the historic period 1970 to 2009 was used.
4.4 Modelling climate change without adaptation During this project stage, we developed a model that would calculate the projected increase in PWDM
due to extreme temperature events as shown in the right hand tail of the temperature duration curve, for
each climate change scenario and GCM. This was done without consideration of the effect of any future
implementation of adaptation options.
All model inputs, excluding adaptation options, were developed and the model was tested. A key aspect of
this testing involved designing the model to analyse the relationships identified in Section 4.1, by drawing on
the modelling inputs developed in Section 4.2 and 4.3.
Assumptions
An assumption that was made for this stage was that the majority of PWDMs result from extreme temperature
events. While in reality there are a range of other factors that may contribute to passenger delays, for the
purposes of this study it is assumed that they are insignificant. Another critical assumption is that all network
parameters remain constant, while in reality the performance of the network will change over time.
For the three day sequences only the delay on the third day is considered; or longer sequences are considered
multiples of three day events. For example a four day sequence of high temperatures is classified as two
events, with the events occurring on the third and fourth day.
As the analysis has been undertaken at the Metro level, only the highest of each of the weather station
outputs for any one day has been used.
Economic parameters
The model we developed has been designed to be consistent with standard economic appraisal guidelines,
including the Australian Transport Council National Guidelines for Transportation System Management. The
economic parameters used in this study are based on those that have been established in previous case
studies, as outlined in Table 3.

16 Adaptation of Melbourne’s Metropolitan Rail Network in Response to Climate Change
Table 3 Economic parameters used in the model
PARAMETER VALuE COMMENT
Appraisal period 2011 to 2100 To align with previous case studies
Time series Yearly Projected increase in the number of hot days
has been determined for each year
Discount rate 3%, with sensitivity testing
of discount rates of 1.5%
and 6%
Refer to discussion below
Discount and base pricing periods
2011 To match the year the case study commences
Discounting is a standard method to add and compare costs and benefits that occur at different points in
time, allowing a comparison of future costs and benefits against today’s costs and benefits (Garnaut, 2010).
Discounting takes into account the time value of costs and benefits, and opportunity costs of diverting
current investment into something that may accrue benefits in the future but are worth less to society in
today’s terms.
The choice of discount rate for climate adaptation projects is important. Standard infrastructure projects use
a discount rate between 6% and 7%, the Victorian State Government typically uses 6.5%, while Infrastructure
Australia uses a 7% discount rate. However, it is common for projects with long term social and environmental
impacts, such as those relating to climate change, to adopt a lower discount rate. For example, in the Garnaut
Climate Change review, Garnaut argues for adoption of a social discount rate between 1.4% and 2.7%. The
Stern Review on the Economics of Climate Change (2006) adopted a discount rate of between 1.4% and 1.7%.
This study has utilised a ‘middle-ground’ discount rate of 3%, with sensitivity testing of results using 1.5% and
6% discount rates to assist decision making.
4.5 Modelling climate change with adaptation A set of adaptation options that might reduce the impact of projected changes in extreme temperature
events was identified in collaboration with DCCEE, DoT and Metro. A workshop was then held with key
stakeholders to establish a set of adaptation options and implementation pathways to determine the costs
and benefits of each option.
AECOM worked with DoT and Metro to collect data on the adaptation costs and possible benefits. This drew
from the capital and operational costs of measures that have been implemented in response to the 2009
heatwave. Once identified, this data was translated into economic modelling inputs and the model was run.
Economic model
The economic model developed for this project operates with a range of inputs in a Microsoft Excel
spreadsheet. The model simulates each climate change scenario and each adaptation option and considers
differing timing for implementation. This correlates to the year the NPV for an adaptation option is at its
maximum over the appraisal period (2011 to 2100).
For each time step in the appraisal period, the model:

Adaptation of Melbourne’s Metropolitan Rail Network in Response to Climate Change
17
1. determined the passenger delay due to the extreme temperature events (with and without adaptation
options) for each year between 2011 and 2100
2. determined the cost impact of these passenger delays on commuters (with and without adaptation
options).
Once the impacts and costs were generated for each extreme temperature event, the model:
1. discounted the extreme temperature event’s impact costs for each year of appraisal
2. discounted adaptation capital and ongoing operation and maintenance costs
3. summed all discounted costs across the entire appraisal period and recorded the results
4. averaged across all GCMs but not emission scenarios.
Sensitivity analysis was then undertaken to assess the impacts of altering the implementation timing, as well
as other key assumptions such as discount rates and value of delayed time.
4.6 Reporting results on the modelling outputsThe economic modelling results were then analysed to consider different timing for implementing adaptation
options for the metropolitan rail network. A report was then developed that captured and communicated
the findings, including reporting the NPV of the adaptation options and providing an evaluation of the
methodology used.

18 Adaptation of Melbourne’s Metropolitan Rail Network in Response to Climate Change
5.0 Modelling inputs for assessing climate change adaptation
This chapter presents the modelling inputs that were developed and used to assess the climate change adaptation options. The inputs that were developed include the critical temperature thresholds when network performance is likely to be affected, the average time delay incurred when these temperature thresholds are exceeded, the projected changes in the number of future events and the economic benefits of both time and adaptation options. This section provides a discussion of each of these modelling elements.
5.1 Temperature thresholdsAt certain temperature thresholds the operation of the metropolitan network will be affected. The type of
impact relates to the temperature and the component of the network that is under stress. Thresholds have
been identified for the key components of the metropolitan network including rail track, rolling stock and
signalling.
Rail tracks are designed for tension or ‘neutral stress’ at temperatures of 37ºC. This means that rail track neither
expands nor contracts at this temperature. When the temperatures exceeds 37ºC, the risk of the rail track not
performing to its required level of service or, in the worst case, failing, increases. The actual threshold or trigger
point for when the rail track starts buckling is unknown and depends on many other factors.
At certain temperatures some trains’ air conditioning units will fail, and the train cannot be used. The
temperature at which the failure occurs depends on the type of rolling stock:
• Comeng trains comprise over 50% of the rolling stock, and their air conditioning units are designed to
operate up to ambient temperatures of 34.5°C
• X’Trapolis and Siemens each comprise approximately 20% of the rolling stock, and their air
conditioning units are designed to operate up to ambient temperatures of 42°C.
Signalling faults can expect to double on high temperature days due to:
• sag in overhead lines
• overheating and unstable behaviour of electric components in trackside cabinets
• problems with insulated joints causing track circuit failures

Adaptation of Melbourne’s Metropolitan Rail Network in Response to Climate Change
19
• expansion of the blade rail that moves across the track transferring a train from one track to another
• loss of power supply leading to trains being unable to operate (Connex Melbourne, 2009).
As an input to the modelling, this information assisted in identifying the number of occasions temperature
thresholds are likely to be exceeded over the period of investigation (2010 to 2100). Operational performance
of the network may be further compromised on consecutive days of high temperatures. For example, if
residual heat is retained in the rail overnight and not dispersed by cooler temperatures, the rail will be
more prone to buckling (Connex Melbourne, 2009). As such, the impacts of three consecutive days at the
temperature thresholds were also investigated.
The temperature thresholds that were identified to enable this analysis were 34.5°C, 37°C and 40°C.
5.2 Average delay per event The historic PWDM for each high temperature event was assessed based on historic records of temperatures
in Melbourne, and PWDM records over the previous decade, after allowing for PWDM that would be expected
to occur on any given day regardless of temperature.
This exercise showed that PWDM increased significantly above the annual average PWDM as the temperature
thresholds were exceeded.
Climate change is likely to result in an even more significant increase in the number of events projected
to trigger the temperature thresholds. Two climate change scenarios are presented in Table 4 along with a
summary of the number of historical average delays per event and the average number of triggered events
per year for the scenarios discussed above.
Table 4 Historic PWDM per incident and average number of triggered events per year for a given scenario
TEMPERATuRE THRESHOLDS
PWDM per event
(minutes per day)
(historic)
AVERAGE NuMBER OF EVENTS PER yEAR FOR A
GIVEN SCENARIO
1970 - 2009
(historic)
2009
(historic)
2100 (A1FI
mpi_echam5)
2100
(A1B miroc3_
2_medres)
Single days >34.5ºC to <37ºC 91,702 7 14 48 27
>37ºC to <40ºC 277,313 3 7 33 16
>40ºC 490,092 0 4 20 7
Three
consecutive days
>34.5ºC to <37ºC 507,463 0 2 16 7
>37ºC to <40ºC 1,021,273 0 1 8 2
>40ºC 3,599,598 0 1 3 1
5.3 Climate change projections The probability of exceedence for a temperature event has been modelled by CSIRO, in consultation with
AECOM. Projections were run for the two identified GHG emission scenarios (A1FI and A1B), the six identified
GCMs and for single and consecutive day events for three temperature thresholds (34.5°C, 37°C and 40°C). This
represents 72 different combinations of weather events. What follows is a discussion of the projected changes
in the probability of exceedence of extreme temperature events.

20 Adaptation of Melbourne’s Metropolitan Rail Network in Response to Climate Change
The GHG emission scenarios projections for a single day event and a consecutive event show an upward
trend. The number of events under all scenarios increases over time in comparison to historic events. The
number of 37oC events is greater than the number of 40oC events.
CSIRO were not able to generate climate projections prior to 2020. Instead, it was assumed that for the years
2010 to 2019 the same number of extreme temperature days would be experienced as the years 2000 to 2009.
Observational data for the last 40 years (historic period 1970 to 2009) was used to generate the projections.
This historic data was used to replicate natural variability to the future projections. To calculate the full 80 years
of projections, 2020 to 2099, the last 40 years of variability was used twice.
Graphs of the number of single day events over 37oC per year for the historic, high and low scenarios are
provided in Figure 6. Graphs of the number of consecutive day events over 37oC per year for the historic,
high and low scenarios are provided in Figure 7. The modelling uses probability of exceedence rather than
projected numbers of events in any particular year. The benefit-cost modelling is linear in impacts within
particular bands, therefore Monte Carlo simulation is not required.
Figure 6 Historic and projected single day events over 37oC per year (1970 to 2100)
Figure 7 Historic and projected consecutive three day events over 37oC per year (1970 to 2100)
Adaptation of Melbourne’s Metropolitan Rail Network in Response to Climate Change
21
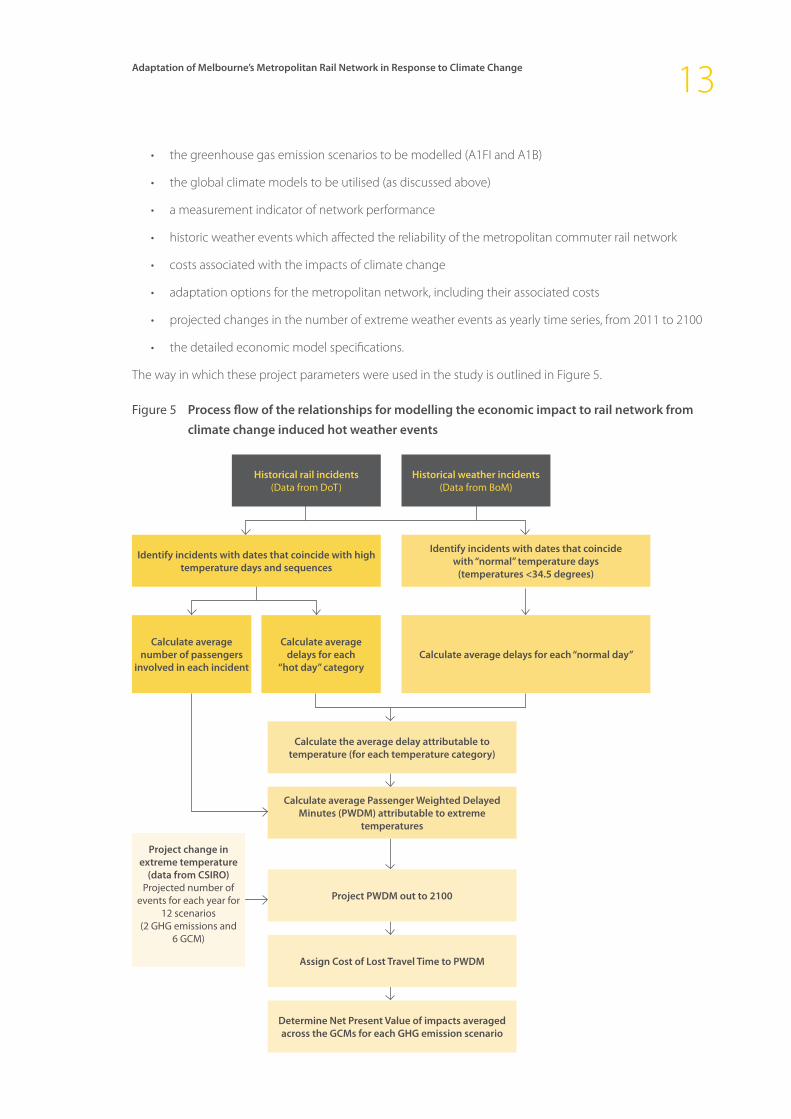
5.4 Public transport growth The number of passengers using the commuter rail network over the period 2000-2010 is presented in Table 5
(source: Department of Transport). These figures have been factored into the calculation of PWDM for the past
decade.
Table 5 Rail patronage over the period 2000-2010
yEAR MILLION OF PEOPLE ANNuAL CHANGE
2000-01 130.3 -
2001-02 131.8 1.2%
2002-03 133.8 1.5%
2003-04 134.9 0.8%
2004-05 145.1 7.6%
2005-06 159.1 9.6%
2006-07 178.6 12.3%
2007-08 201.2 12.7%
2008-09 213.9 6.3%
2009-10 219.3 2.5%
Forecasts for growth in patronage of rail transport are presented in Table 6.
Table 6 Patronage Growth Rate (Average Weekday AM Peak and Train Cordon), (source: pers comm. 16 March 2011)
yEAR ALL DAy AM PEAk AM PEAk AT CORDON (InBOunD)
2009/10 8.9% 8.6% 7.2%
2010/11* 10.5% 9.6% 6.9%
2011/12 8.1% 7.4% 6.6%
2012/13 7.8% 7.1% 6.1%
2013/14 7.6% 6.8% 5.7%
2014/15 7.4% 6.5% 5.5%
2015/16 7.2% 6.3% 5.3%
2016/17 7.5% 6.0% 5.1%
2017/18** 7.4% 5.8% 4.3%
2018/19 5.9% 4.2% 3.5%
2019/20 4.6% 3.4% 2.7%
2020/21 3.3% 2.7% 2.0%
2021+ 2.0% 2.0% 1.3%
Note: * reflects proposed carbon tax
**reflects movement towards a growth rate – marginally ahead of population growth
22 Adaptation of Melbourne’s Metropolitan Rail Network in Response to Climate Change
5.5 Value of commuter time A number of studies have identified the value of time lost due to unexpected delays. Hensher (1994) found
that the value of lost time due to delay ranged between 44% and 88% of the commuter’s wage rate for the
period of delay. Miller (1996) undertook a similar study, finding that commuter’s willingness to pay to avoid
unexpected delays ranged between 55% and 75% of the commuter’s wage rate for the period of delay.
Based on this, AECOM has assumed a value of 60% of the average wage rate. The average wage rate in Victoria
in 2010 was $62,748 (ABS, 2010). Based on a 40 hour week, this equates to a rate of approximately $0.50 per
minute.
The value of delayed time adopted for this study has therefore been assumed to be 60% of this value, or
approximately $0.30 per minute. Sensitivity testing has been undertaken in the cost benefit analysis at 45% of
the wage rate ($0.23 per minute) and 75% of wage rate ($0.38 per minute).
5.6 Adaptation strategies This study considered a range of adaptation responses, including infrastructural and non-infrastructural
options. The adaptation strategies explored include:
• concrete sleeper replacement;
• replacement of air conditioners in all rolling stock to ensure they operate up to at least 45oC;
• installation of regenerative braking;
• changing the cabling in the power lines and/or tensioning of the lines;
• signalling equipment replacement and installing backups for their electronics;
• behaviour change mechanisms to influence commuter travel behaviour (i.e. phone-based early-
warning systems);
• heatwave behaviour change program (i.e. messages, issuing water and providing shade);
• providing alternative modes of transport (i.e. buses).
Each adaptation strategy has a benefit and a cost. Benefits are derived from avoiding network delays, asset
failure and operational response cost. Costs will be incurred to implement the strategy and derive the benefits
from the preventative measures.
A summary of the selected adaptation strategies and the modelling inputs developed for each option is
provided in Table 7.
Following the table (in Section 6.0) is a discussion of the modelled adaptation options to determine the
costs and benefits for implementation to mitigate the likely impacts of climate change induced extreme
temperatures on the metropolitan rail network. As discussed in Section 4.5, these modelling inputs were
developed in consultation with DoT, MMT and DCCEE.

Adaptation of Melbourne’s Metropolitan Rail Network in Response to Climate Change
23
Table 7 Summary of the adaptation options and the modelling data inputs
ADAPTATION OPTION
LIFE OF
BENEFIT
(yEARS)
REDuCED
DELAyS (%?)
CAPITAL COST
($)
ADDITIONAL
OPERATIONAL
COST ($/yEAR)
TIME TO
IMPLEMENT
ADAPTATION
OPTION
(yEARS)
Concrete sleeper replacement 60 (100+) 20% $122.4M Some minor
reduction in
replacement of
timber sleepers
5
Replace air conditioners in all
rolling stock to 45oC
20 20% $23.2M $4M every 6 years 1
Regenerative braking 15 5% $65M $10M saving in
energy per year
6
Change the cabling in the
power lines and/or tensioning
of the lines
60 10% $1.2M $0.12M (cost to
inspect and keep
the pits clean
assumed to be
10% of capital)
4
Signalling equipment
protection of the electronics
30 5% $200M Nil 3
Heatwave behaviour change
program
Ongoing
program
Less than 5% Nil capital cost
yet requires
$1M annual
operational cost
$10,000 per event 1

24 Adaptation of Melbourne’s Metropolitan Rail Network in Response to Climate Change
6.0 Potential adaptation strategies
The results of the cost benefit analysis of each of the six adaptation options is presented in the subsequent
section. Results have been reported under low and high GHG scenarios (A1FI and A1B respectively), and are
averages of the results of the six climate models.
Note all assumptions relating to reduced delays under each of the options have been developed in
consultation with the DoT and DCCEE. All costs of adaptation options have been provided by DoT.
All results are based on a discount rate of 3%.
6.1 Adaptation Option 1: Concrete sleeper replacement
6.1.1 Description
Adaptation Option 1 assumes a full replacement across the entire network of wooden rail sleepers to concrete
rail sleepers. This option seeks to reduce rail buckling in extreme temperatures. By introducing concrete
sleepers the strength of the track is increased. The connection of the concrete sleepers to the steel rails holds
the track in place assisting to reduce heat related buckling.
The Victorian Government commenced a sleeper replacement program in 2010. This option assumes the
program is extended to a full replacement of all sleepers across the entire network and may take five years to
implement.
6.1.2 Cost and benefits
The key costs associated with this option are:
• implementing a concrete sleeper replacement program at a total capital cost of $122.4M
• There are significant GHG emissions associated with the production of concrete sleepers. This was not
quantified for this assessment.
Key benefits are:
• avoided passenger delays, based on an assumed 20% reduction in delays per triggered event
• a slight reduction in operating costs, although the value of this benefit has been taken as insignificant.
6.1.3 Results
The results of Adaptation Option 1 are presented in Table 8.

Adaptation of Melbourne’s Metropolitan Rail Network in Response to Climate Change
25
Table 8 Option 1 Cost Benefit Analysis Results
ITEM LOW GHG SCENARIO (A1B) (’000)
HIGH GHG SCENARIO (A1FI) (’000)
Cost of Delays $47,163 $65,683
Benefits (avoided delay) $11,336 $15,966
Adaptation Costs $131,140 $131,140
Net Present Value -$119,804 -$115,174
Benefit Cost Ratio 0.09 0.12
6.2 Adaptation Option 2: Replace air conditioners in all rolling stock
6.2.1 Description
Adaptation Option 2 assumes replacement of air conditioners in all rolling stock to ensure they operate up to
at least 45oC. This adaptation reduces the chance of air conditioner failure and the potential risks to passenger
health. This adaptation response is likely to increase energy demand by trains and increase the GHG emissions
of the metro rail network. The expected benefit has a life of 20 years while the duration to implement is 1 year.
6.2.2 Cost and benefits
The key costs associated with this option are:
• Capital cost of $23.2M
• Additional operational cost of $4M every 6 years.
Key benefits assessed are:
• 20% reduction in delays per event
6.2.3 Results
The results of Adaptation Option 2 are presented in Table 9.
Table 9 Option 2 Cost Benefit Analysis Results
ITEM LOW GHG SCENARIO (A1B) (‘000)
HIGH GHG SCENARIO (A1FI) (‘000)
Cost of Delays $46,867 $65,387
Benefits (avoided delay) $11,632 $16,262
Adaptation Costs $91,251 $91,251
Net Present Value -$79,619 -$74,989
Benefit Cost Ratio 0.13 0.18

26 Adaptation of Melbourne’s Metropolitan Rail Network in Response to Climate Change
6.3 Adaptation Option 3: Regenerative braking
6.3.1 Description
Adaptation Option 3 assumes the use of regenerative braking to convert friction generated during braking
into energy. High temperature events reduce the braking performance of existing brake mechanisms while
increasing the chance of brake failure. Regenerative braking will reduce brake wear and tear, and potential
failure. Trials will be required to validate and refine the most suitable technology, as such, implementation
could take six years or more. Most of the new current rolling stock already has regenerative braking
technology installed but not activated or utilised.
6.3.2 Cost and benefits
The key costs associated with this option are:
• implementing a regenerative braking program ($65M)
• avoiding passenger delays, which assumes avoiding a 5% reduction in delays per triggered event
• operational saving in energy of $10M per year.
6.3.3 Results
The results of Adaptation Option 3 are presented in Table 10.
Table 10 Option 3 Cost Benefit Analysis Results
ITEM LOW GHG SCENARIO (A1B) (‘000)
HIGH GHG SCENARIO (A1FI) (‘000)
Cost of Delays $54,611 $77,706
Benefits (avoided delays + energy savings)
$259,041 $259,095
Adaptation Costs $152,406 $152,406
Net Present Value $106,635 $106,689
Benefit Cost Ratio 1.70 1.70
6.4 Adaptation Option 4: Change the cabling in the power lines and/or tensioning of the lines
6.4.1 Description
Adaptation Option 4 assumes the replacement of the cabling in the power lines and/or tensioning of the lines
across the network. The existing tensioning mechanisms for most of the lines were not sufficiently designed
to operate at extreme temperatures. Improved materials would also be used in the power lines to increase
extreme tolerance and reduce potential sagging. The expected benefit has a life of 60 years while the duration
to implement is 4 years.

Adaptation of Melbourne’s Metropolitan Rail Network in Response to Climate Change
27
6.4.2 Cost and benefits
The key costs associated with this option are:
• Capital cost of $1.2M
• 10% reduction in delays per triggered event
• Operational cost of $0.12M based on assuming the cost to inspect and keep the pits clean is 10% of
capital
6.4.3 Results
The results of Adaptation Option 4 are presented in Table 11.
Table 11 Option 4 Cost Benefit Analysis Results
ITEM LOW GHG SCENARIO (A1B) (‘000)
HIGH GHG SCENARIO (A1FI) (‘000)
Cost of Delays $52,791 $73,626
Benefits (avoided delay) $5,708 $8,023
Adaptation Costs $4,503 $4,503
Net Present Value $1,205 $3,520
Benefit Cost Ratio 1.27 1.78
6.5 Adaptation Option 5: Protection of signalling equipment
6.5.1 Description
Adaptation Option 5 assumes increased temperature protection of heat exposed signalling equipment such
as in trackside cabinets. Overheating of the signalling equipment leads to temporary or permanent failure
of electric components. Failed or faulty signals can cause extensive train delays if the location of failure in
the circuit is not known. Protection measures include insulating equipment and cabling, providing shade
protection or relocating signalling equipment to less heat exposed areas (this may also have a co-benefit of
preventing flood damage).
This option assumes a signalling protection program may take three years to implement.
6.5.2 Cost and benefits
The key costs associated with this option are:
• implementing a signalling protection program ($200M)
• avoiding passenger delays, which assumes avoiding a 5% reduction in delays per triggered event
• no additional operating costs are incurred.
6.5.3 Results
The results of Adaptation Option 5 are presented in Table 12.

28 Adaptation of Melbourne’s Metropolitan Rail Network in Response to Climate Change
Table 12 Option 5 Cost Benefit Analysis Results
ITEM LOW GHG SCENARIO (A1B) (‘000)
HIGH GHG SCENARIO (A1FI) (‘000)
Cost of Delays $55,628 $77,620
Benefits (avoided delay) $2,871 $4,029
Adaptation Costs $298,271 $298,271
Net Present Value -$295,400 -$241,808
Benefit Cost Ratio 0.01 0.01
6.6 Adaptation option 6: Heatwave behaviour change program
6.6.1 Description
Adaptation Option 6 assumes development and ongoing delivery of a heatwave behaviour change program.
The program would be designed to target elderly or potentially sick passengers to influence behavior to
minimise potential health risks and to reduce train delays from ill passengers. Successful behaviour change
programs are structured with a range of communication campaigns, prompts, supportive infrastructure or
equipment (e.g. shade protection for station platforms, issuing water to passengers or have first aid support on
hand for stations with higher track record of health incidents), and aim to create a social/cultural expectation
around appropriate behaviour and actions during heat waves.
Behaviour change programs require continual renewal of messages, expectations and target audiences to
maintain effectiveness. The Transport Accident Commission or WorkSafe have a long history of effective and
relevant behaviour change programs to protect the community from health risks. There is an expected annual
benefit while the program is maintained. It is assumed that the program will be maintained up to 2100. The
duration to implement is 1 year.
6.6.2 Cost and benefits
The key costs associated with this option are:
• No capital cost but requires an annual operational cost to maintain effectiveness ($1M)
• Less than 5% reduction in delays per triggered event
• Additional operating cost of $10,000 per event.
6.6.3 Results
The results of Adaptation Option 6 are presented in Table 13.

Adaptation of Melbourne’s Metropolitan Rail Network in Response to Climate Change
29
Table 13 Option 6 Cost Benefit Analysis Results
ITEM LOW GHG SCENARIO (A1B) (‘000)
HIGH GHG SCENARIO (A1FI) (‘000)
Cost of Delays $57,336 $80,023
Benefits (avoided delay) $1,163 $1,626
Adaptation Costs $30,031 $30,031
Net Present Value -$28,868 -$28,405
Benefit Cost Ratio 0.04 0.05
6.7 Summary of Cost Benefit Analysis ResultsA summary of the Net Present Value and Benefit Cost Ratio of each of the Adaptation Options is presented in
Table 14. The results clearly indicate that Option 3 Regenerative braking and Option 4 Cabling have a benefit
to implement immediately.
Regenerative braking was the only option that had additional co-benefits applied to the assessment beyond
commuter delays from energy savings and reduced GHG emissions. There are other co-benefits for Options 1,
2, 4, 5 and 6 that are noted in this report but were not quantified for this assessment such as values of comfort,
loss of life and mode transfer as these benefits were not available at the time of the study. However, for this
assessment, Options 1, 2, 5 and 6 do not provide a net benefit to implement in 2011.
The sensitivity analysis in Section 7 indicates that Option 4 Cabling is significantly more beneficial to
implement later in the century, around 2050, as the increase in high temperature events increases
considerably from the changing climate. The sensitivity analysis for different discount rates also indicates that
the results do not change dramatically in terms of which options are considered beneficial. The cost benefit
analysis results would only change if co-benefits were appropriately identified and quantified to increase the
benefits or the cost of implementing adaptation was significantly reduced.
Table 14 Summary of CBA Results for all Adaptation Options
ADAPTATION OPTION
LOW GHG SCENARIO (A1B) HIGH GHG SCENARIO (A1FI)
Net Present Value ($M)
Benefit Cost Ratio
Net Present Value ($M)
Benefit Cost Ratio
Option 1 - Concrete sleepers -$120 0.09 -$115 0.12
Option 2 - Replace air con. -$80 0.13 -$75 0.18
Option 3 - Regen. braking $107 1.70 $107 1.70
Option 4 - Cabling $1 1.27 $4 1.78
Option 5 - Protect equipment -$295 0.01 -$242 0.01
Option 6 - Behaviour change program
-$29 0.04 -$28 0.05

30 Adaptation of Melbourne’s Metropolitan Rail Network in Response to Climate Change
7.0 Sensitivity Analysis
The sensitivity of results to the changes in the following assumptions and inputs has been tested:
• Discount rate.
• Value of time.
• Implementation timing.
These are presented below.
7.1 Discount RateAs discussed in Section 4.4, the appropriate discount rate is a matter of some debate when analysis is to be
undertaken over the length of periods necessary to evaluate climate change impacts. Sensitivity of results to
these assumptions has therefore been tested by applying lower (1.5%) and higher (6.0%) discount rates.
7.1.1 Discount Rate of 1.5%
The results of the CBA using a discount rate of 1.5% are presented in Table 15.
Table 15 CBA Results with discount rate at 1.5%
ADAPTATION OPTION
LOW GHG SCENARIO (A1B) HIGH GHG SCENARIO (A1FI)
Net Present Value (‘000)
Benefit Cost Ratio
Net Present Value (‘000)
Benefit Cost Ratio
Option 1 - Concrete sleepers -$139,287 0.16 -$127,117 0.23
Option 2 - Replace air con -$112,076 0.19 -$99,907 0.28
Option 3 - Regen. braking $213,756 1.94 $214,304 1.94
Option 4 - Cabling $6,016 1.87 $12,101 2.76
Option 5 - Protect equipment -$391,350 0.02 -$293,865 0.02
Option 6 - Behaviour change program
-$45,622 0.05 -$44,405 0.08
7.1.2 Discount Rate of 6.0%
The results of the CBA using a discount rate of 6.0% are presented in Table 15.

Adaptation of Melbourne’s Metropolitan Rail Network in Response to Climate Change
31
Table 16 CBA Results with discount rate at 6.0%
ADAPTATION OPTION
LOW GHG SCENARIO (A1B) HIGH GHG SCENARIO (A1FI)
Net Present Value (‘000)
Benefit Cost Ratio
Net Present Value (‘000)
Benefit Cost Ratio
Option 1 - Concrete sleepers -$102,830 0.03 -$101,914 0.04
Option 2 - Replace air con. -$50,846 0.07 -$49,931 0.08
Option 3 - Regen. braking $26,768 1.29 $26,669 1.29
Option 4 - Cabling -$890 0.66 -$433 0.84
Option 5 - Protect equipment -$213,743 0.00 -$190,990 0.01
Option 6 - Behaviour change program
-$15,267 0.02 -$15,176 0.03
7.2 Value of Commuter TimeAs discussed in Section 5.5, the value of commuter time used in the CBA was based on a number of studies
that quoted a range of values. The sensitivity of the CBA results to changes in this input to values at higher and
lower parts of the quoted ranges has been tested here.
7.2.1 Value of commuter time = 45% of Wage Rate ($0.23 per minute)
The results of the CBA using a lower value of commuter time of 45% of the wage rate ($0.23 per minute) are
presented in Table 17.
Table 17 CBA Results: value of time = $0.23 per minute
ADAPTATION OPTION
LOW GHG SCENARIO (A1B) HIGH GHG SCENARIO (A1FI)
Net Present Value (‘000)
Benefit Cost Ratio
Net Present Value (‘000)
Benefit Cost Ratio
Option 1 - Concrete sleepers -$122,638 0.06 -$119,166 0.09
Option 2 - Replace air con. -$82,528 0.10 -$79,056 0.13
Option 3 - Regen. braking $105,663 1.69 $105,704 1.69
Option 4 - Cabling -$222 0.95 $1,514 1.34
Option 5 - Protect equipment -$296,118 0.01 -$245,294 0.01
Option 6 - Behaviour change program
-$29,159 0.03 -$28,812 0.04
7.2.2 Value of commuter time = 75% of Real Wage ($0.38 per minute)
The results of the CBA using a higher value of commuter time of 75% of the wage rate ($0.38 per minute) are
presented in Table 18.

32 Adaptation of Melbourne’s Metropolitan Rail Network in Response to Climate Change
Table 18 CBA Results: value of time = $0.38 per minute
ADAPTATION OPTION
LOW GHG SCENARIO (A1B) HIGH GHG SCENARIO (A1FI)
Net Present Value (‘000)
Benefit Cost Ratio
Net Present Value (‘000)
Benefit Cost Ratio
Option 1 - Concrete sleepers -$116,970 0.11 -$111,182 0.15
Option 2 - Replace air con -$76,713 0.16 -$70,926 0.22
Option 3 - Regen. braking $107,607 1.71 $107,675 1.71
Option 4 - Cabling $2,632 1.58 $5,526 2.23
Option 5 - Protect equipment -$294,682 0.01 -$238,326 0.02
Option 6 - Behaviour change program
-$28,578 0.05 -$27,999 0.07
7.3 Timing of implementation of adaptation optionThe CBA undertaken thus far has assumed that all capital works programs begin immediately. The sensitivity
of results to changing this assumption has been tested here using periods of implementation beginning in 20
years, 40 years, and 60 years.
7.3.1 Implement in 20 years
The outcomes of the cost benefit analysis assuming implementation of options in 20 years is presented in
Table 19.
Table 19 CBA Results with implementation of options in 20 years
ADAPTATION OPTION LOW GHG SCENARIO (A1B) HIGH GHG SCENARIO (A1FI)
Net Present Value (‘000)
Benefit Cost Ratio
Net Present Value (‘000)
Benefit Cost Ratio
Option 1 - Concrete sleepers -$63,790 0.12 -$59,447 0.18
Option 2 - Replace air con. -$81,965 0.10 -$77,539 0.15
Option 3 - Regen. braking $2,211 1.02 $2,367 1.02
Option 4 - Cabling $2,067 1.87 $4,249 2.79
Option 5 - Protect equipment -$162,926 0.01 -$130,056 0.02
Option 6 - Behaviour change program
-$14,659 0.06 -$14,216 0.09
7.3.2 Implement in 40 years
The outcomes of the cost benefit analysis assuming implementation of options in 40 years is presented in
Table 20.
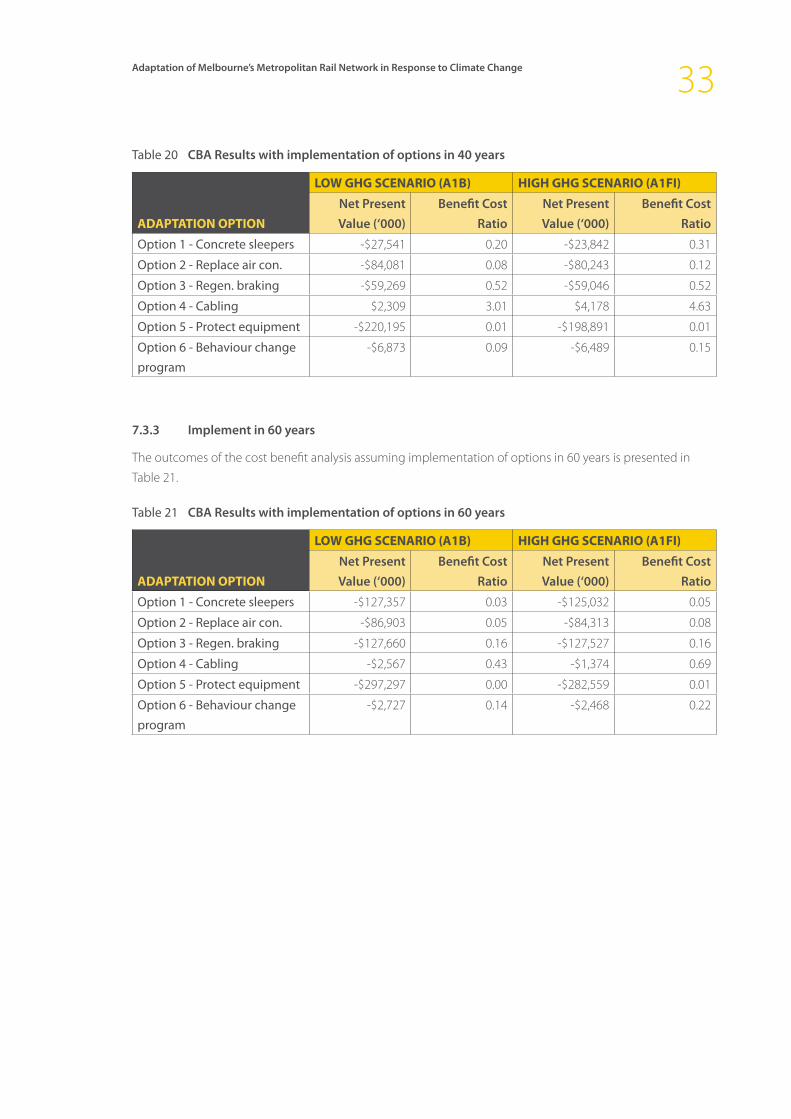
Adaptation of Melbourne’s Metropolitan Rail Network in Response to Climate Change
33
Table 20 CBA Results with implementation of options in 40 years
ADAPTATION OPTION
LOW GHG SCENARIO (A1B) HIGH GHG SCENARIO (A1FI)
Net Present Value (‘000)
Benefit Cost Ratio
Net Present Value (‘000)
Benefit Cost Ratio
Option 1 - Concrete sleepers -$27,541 0.20 -$23,842 0.31
Option 2 - Replace air con. -$84,081 0.08 -$80,243 0.12
Option 3 - Regen. braking -$59,269 0.52 -$59,046 0.52
Option 4 - Cabling $2,309 3.01 $4,178 4.63
Option 5 - Protect equipment -$220,195 0.01 -$198,891 0.01
Option 6 - Behaviour change program
-$6,873 0.09 -$6,489 0.15
7.3.3 Implement in 60 years
The outcomes of the cost benefit analysis assuming implementation of options in 60 years is presented in
Table 21.
Table 21 CBA Results with implementation of options in 60 years
ADAPTATION OPTION
LOW GHG SCENARIO (A1B) HIGH GHG SCENARIO (A1FI)
Net Present Value (‘000)
Benefit Cost Ratio
Net Present Value (‘000)
Benefit Cost Ratio
Option 1 - Concrete sleepers -$127,357 0.03 -$125,032 0.05
Option 2 - Replace air con. -$86,903 0.05 -$84,313 0.08
Option 3 - Regen. braking -$127,660 0.16 -$127,527 0.16
Option 4 - Cabling -$2,567 0.43 -$1,374 0.69
Option 5 - Protect equipment -$297,297 0.00 -$282,559 0.01
Option 6 - Behaviour change program
-$2,727 0.14 -$2,468 0.22

34 Adaptation of Melbourne’s Metropolitan Rail Network in Response to Climate Change
8.0 Findings and outcomes
This study has focussed on the impacts of commuter delays due to the increasing heat stresses that are
expected to be placed on the rail network on hot days due to climate change. It has also assessed the relative
benefits and costs of reducing these delays through a range of adaptation options.
The cost benefit analysis of adaptation options showed that only two options produced an economic result,
regenerative braking (Option 3) and changing cabling and tension in power lines (Option 4).
Regenerative braking (Option 3) produced the best economic results, with a Net Present Value of
approximately $107 M and a benefit cost ratio of 1.70 (under both GHG scenarios). The vast majority of the
benefits of this option result from energy savings from the regenerative braking system rather than reductions
in commuter delays.
Changing cabling and tension in power lines (Option 4) provides considerable value for money in reducing
commuter delays. The benefit cost ratio for this option is approximately 1.27 under the low GHG scenario with
an NPV of $1.2M, and a benefit cost ratio of 1.78 under a high GHG scenario with an NPV of $3.5 M. This option
is also significantly cheaper than the other options.
The remainder of the options were shown to be uneconomic in this analysis with regard to reducing
commuter delays. This outcome was unchanged under different assumptions about discount rates, the value
of commuter time, and implementation timing, as shown in the sensitivity testing.
In general, lower discount rates and higher values of time produced better outcomes. Altering the timing of
implementation produced mixed results. The uneconomic outcomes (Options 1, 2, 5 and 6) tended to become
even less economic the longer their implementation was delayed. Option 3 also became less economic the
longer its implementation was delayed, and delaying this option beyond approximately 20 years would result
in the option becoming uneconomic. Interestingly, Option 4 produced better economic outcomes as a result
of delaying the implementation for 40 years, but beyond this time it became less economic.
The cost benefit analysis revealed that the remainder of the adaptation options are prohibitively expensive
in reducing commuter delays. However, it is important to recognise that many of these options produce
benefits other than reduced delays that have not been assessed. For example, concrete sleepers are expected
to be more durable and long-living that the current timber sleepers which would significantly reduce the
costs involved in maintenance of sleepers and increase their replacement intervals. Improved air conditioning
provides comfort benefits to passengers in addition to reducing the potential for train cancellations and
delays. Behaviour change programs may increase awareness of climate change resulting in benefits that
extend far beyond the impacts on commuter delays. Inclusion of these other factors within the scope of the
study and the analysis would provide significantly better results for some of the options, and the results shown
here should be viewed with this in mind.

Adaptation of Melbourne’s Metropolitan Rail Network in Response to Climate Change
35
References
Commonwealth of Australia (2010), Science—facts and fiction, Department of Climate Change and Energy
Efficiency, http://www.climatechange.gov.au/climate-change/myths/science.aspx (date accessed 3 March
2011).
Connex Melbourne, 2009, Connex Melbourne Submission to the Select Committee on Train Services 15 July
2009, Melbourne, Victoria, viewed 2 July 2010, http://www.parliament.vic.gov.au/images/stories/documents/
council/Select_Committees/Trains/Submissions/SCTS_55.pdf
City of Melbourne, 2009a, City of Melbourne Climate Change Adaptation Strategy, http://www.melbourne.vic.
gov.au/AboutCouncil/PlansandPublications/strategies/Pages/Environmentalpolicies.aspx , date accessed 14
June 2011.
City of Melbourne, 2009b, Central City Users Survey, http://www.melbourne.vic.gov.au/AboutMelbourne/
Statistics/Pages/CityUsers.aspx, date accessed 14 June 2011.
CSIRO, 2011, Climate Change: Science and Solutions for Australia, CSIRO Publishing, Collingwood, VIC, Australia.
CSIRO, 2010, Climate Change Science, How OzClim works, https://wiki.csiro.au/confluence/pages/viewpage.
action?pageId=211681487 , accessed 9 June 2011.
CSIRO and BoM (2007). Climate change in Australia, technical report 2007. Canberra: CSIRO, 148 pages.
http://www.climatechangeinaustralia.gov.au/technical_report.php
Department of Sustainability and Environment (2008c), Climate Change in Victoria: 2008 Summary,
Viewed 20 August, 2010, <http://www.climatechange.vic.gov.au/Greenhouse/wcmn302.nsf/childdocs/-
0CC3BC22387CB40DCA2575BE0002E027-78F41BF9830E3829CA2576A200080BD0?open>.
Department of Transport (DoT), 2009, Melbourne metropolitan Train Franchise, viewed 21 September 2010
http://www3.transport.vic.gov.au/vtp/pdfs/factsheets/VTP_FS_TrainFranchise.pdf
Garnaut (2011), Garnaut Climate Change Review, Update Papers, http://www.garnautreview.org.au/
update-2011/update-papers/up1-weighing-costs-benefits-climate-change-action.html#_Toc283971069 (date
accessed 28 February, 2011).
Holper, P., (2002) ‘Greenhouse: Questions and Answers’, CSIRO Research.
IPCC (2007). Summary for Policymakers. Climate Change 2007: The Physical Science Basis. Contribution of
Working Group I to the Fourth Assessment Report of the Intergovernmental Panel on Climate Change. S.
Solomon, D. Qin, M. Manning, Z. Chen, M. Marquis, K.B. Averyt, M. Tignor and H.L. Miller (eds) (ed.), Cambridge
University Press, Cambridge, United Kingdom and New York, NY, USA.
IPCC, (2010), Definition of terms used within DDC, Viewed 19 December 2010, http://www.ipcc-data.org/
ddc_definitions.html
Metro Trains Melbourne (2010) Maps & Stations, http://www.metrotrains.com.au/Maps-Stations/Overview.
html (accessed August 2010)

36 Adaptation of Melbourne’s Metropolitan Rail Network in Response to Climate Change
Nakićenović N, Swart R (eds) (2000) Special Report on Emissions Scenarios. A Special Report of Working Group III of
the Intergovernmental Panel on Climate Change. (Cambridge University Press: Cambridge, United Kingdom and
New York, NY, USA).
Nicholls, N. and D. Collins, (2006): Observed change in Australia over the past century. Energy & Environment,
17, 1-12.
Parliament of Victoria, 2010, The Select Committee on Train Services, By Authority Government Printer for
the State of Victoria, http://www.parliament.vic.gov.au/images/stories/downloads/Committee_reports/
TrainServiceInterimReportJune2010.pdf, accessed 20 May 2011.
Rahmstorf, S, Cazenave, A., Church, J.A., Hansen, J.E., Keeling, R.F., Parker, D.E. and Somerville, R.C.J. (2007).
Recent climate observations compared to projections. Science, 316, 5825, 709.
Personal CommunicationCrowley, N. AECOM Principal Rail Engineer. Interviewed 21 September 2010 by S. Valeri.
Davis, K. AECOM Associate Director – Rail. Interviewed 16 July 2010 by S. Valeri.
Clarke. J., Project Manager, Tailored Projections Liaison, CSIRO Marine and Atmospheric Research, Aspendale
Victoria.
Todero, T., DoT, Patronage Growth Rate, email to Lisa Crowley dated 16 March 2011.