Embed Size (px)
Citation preview

AD-AI71 7 -79 UNDERSEA MEDICAL SOCIETY INC BETHESDA NO F/6 13/10ISOBARIC INERT GAS COUNTEROIFFUSION, CU)NOV A2 M B KENT NOOO4-79.C.0319
UNCLASSIFIED NL
3 f f f f f f f f f f f f

11111 112.
'111111..,, ,o 2.0I
125 1.4 III
'W
MICROCOPY RESOLUTION TEST CHART
NATIONAL PORIA1 Of TAN RLAND 1961 A

UMWS PUBLICATION NUMBER 54WS(IC)1-11-82
THE TWENTY-SECOND UNDERSEA MEDICAL SOCIETY WORKSHOP
t~. ISOBARIC INERT GAS COUNTERDIFFUSION
PHILADELPHIA, PENNSYLVANIA
13-14 NOVEMBER 1979
CO-CHAIRMEN
CHRISTIAN J. LAMBERTSEN
ROBERT C. BORNMANN
2 EDITORMARTHE BECKETT KENT
E~iT1~ ~ UNDERSEA MEDICAL SOCIETY, INC.FELEC79650 ROCKVILLE PIKEAPR 1982BETHESDA, MARYLAND 20814
U.S.A.
4. .128501b~~~~~~jJ wit - - _________

ISOBARIC INERT GAS COUNTERDIFFUSION
PHILADELPHIA, PENNSYLVANIA
13-14 NOVEMBER 1979
CO-CHAIRMEN
CHRISTIAN J. LAMBERTSEN
ROBERT C. BORNMANN
EDITOR V. -
MARTHE BECKETT KENT
THE TWENTY-SECOND UNDERSEA MEDICAL SOCIETY WORKSHOP
1982 ,
UNDERSEA MEDICAL SOCIETY, INC.9650 ROCKVILLE PIKE
BETHESDA, MARYLAND 20814U.S.A.

This Workshop was supported by the Office ofNaval Research under Contract No. N00014-74-C-0319.
Rep'wduction in whote o-'% in pa~.t Itted6o'r% any pw~po6e o6 the U.S. GoveAnment.
The opinon,6, conc&L6ion6, and 'Lecommejuation6containted in thiA tiepw'tt atJe not to be con.6tued a.Aoi~ciat o'r% necee~wity tce6tec.ti.ng the view6 o6 tieU.S. N~avy oxt the UndeLr~ea Medicat SociZety.
006..1

This is a "Preliminary Report" prepared tosatisfy the Office of Naval Research contractrequirements.
Inquiries concerning the Final Report shouldbe directed to Christian J. Lambertsen, M.D., orCapt. Robert C. Bornmann, MC,USN, co-Chairmen ofthe Workshop.
Acce~ssil on
DTIC TK- i1--
Datr
ISOBARIC INERT GAS COUNTERDIFFUSION
PARTICIPANTS
Co-Chairmen
Dr. Christian J. LambertsenDirectorInstitute for Environmental MedicineUniversity of Pennsylvania Medical CenterPhiladelphia, Pennsylvania 19174
Capt. Robert C. Bornmann, MC,USN11569 Woodhollow CourtReston, Virginia 22091
Dr. Andrew P. Beck Dr. Richard M. CowleyInstitute for Environmental Medicine Department of Family PracticeUniversity of Pennsylvania Medical Center Eastern Virginia Graduate SchoolPhiladelphia, Pennsylvania 19104 of Medicine
Norfolk, VirginiaDr. Larry E. BellInstitute for Environmental Medicine Dr. Brian D'AoustUniversity of Pennsylvania Medical Center Virginia Mason Research CenterPhiladelphia, Pennsylvania 19104 Seattle, Washington 98101
Dr. Peter B. Bennett Dr. Joseph C. Farmer, Jr.Director Department of OtolaryngologyF.G. Hall Environmental Research Duke University Medical CenterLaboratory Durham, North Carolina 27710
Duke University Medical CenterDurham, North Carolina 27710 Dr. Aron B. Fisher
Department of PhysiologyDr. Alfred A. Bove University of PennsylvaniaTemple University Health Science Center Medical CenterPhiladelphia, Pennsylvania 19140 Philadelphia, Pennsylvania 19104
andInstitute for Environmental Medicine Cdr. Edward T. Flynn, Jr., MCUSN
* .Philadelphia, Pennsylvania 19104 Hyperbaric Medicine and Physiology. now at Department
Mayo Clinic Naval Medical Research InstituteCardiology Division National Naval Medical CenterRochester, Minnesota 55901 Bethesda, Maryland 20814
Dr. James M. Clark Mr. Robert Gelfand, Associate DirectorInstitute for Environmental Medicine Institute for Environmental MedicineUniversity of Pennsylvania Medical Center University of Pennsylvania MedicalPhiladelphia, Pennsylvania 19104 Center
Philadelphia, Pennsylvania 19104
PhaephaEC nnsyO aii.a 10
- '.. . --I | ! I "" 'Ir ' ,i : .= .... ... . ... , k

Dr. David Graves Dr. Leonard M. LibberDepartment of Chemical Engineering Physiology ProgramSchool of Engineering and Applied Office of Naval ResearchScience Arlington, Virginia 22217
University of PennsylvaniaPhiladelphia, Pennsylvania 19104 Cdr. Calvin Miller
Navy Engineering CurriculumCdr. Kristopher M. Greene, MC,USN Navy Post Graduate SchoolNaval Medical Research Institute Monterey, California 93940
now atNaval Medical Research and Dr. Abraham NoordergraafDevelopment Command Bioengineering Department
National Naval Medical Center University of PennsylvaniaBethesda, Maryland 20814 Philadelphia, Pennsylvania 19104
Cdr. Claude A. Harvey, MC,USN Dr. John A. QuinnPearl Harbor, Hawaii School of Chemical EngineeringFPO San Francisco, California 96601 University of Pennsylvania
Philadelphia, Pennsylvania 19104Dr. H.V. HemplemanAdmiralty Marine Technology Dr. Ashok RanadaEstablishment Institute for Environmental Medicine
Physiological Laboratory University of Pennsylvania MedicalGosport, Hants CenterEngland Philadelphia, Pennsylvania 19104
Dr. Brian A. Hills Cdr. Albert J. Smith, USNWolfson Institute of Occupational Deep Submergence Systems DivisionHealth Office of Chief of Naval OperationsUniversity of Dundee, Scotland Navy Department
now at Washington, D.C. 20350The University of TexasHealth Science Center at Houston Dr. Robert TepperMedical School Center for Health SciencesHouston, Texas 77025 University of Wisconsin
Madison, Wisconsin 53705Dr. George KarremanBockus Research Institute Dr. Richard VannUniversity of Pennsylvania Department of AnesthesiologyPhiladelphia, Pennsylvania 19146 -Duke University Medical Center
Durham, North Carolina 27710Dr. Sukhamay LahiriInstitute for Environmental Medicine LCdr. Paul Weathersby, MC,USNUniversity of Pennsylvania Medical Center Naval Medical Research InstitutePhiladelphia, Pennsylvania 19104 National Naval Medical Center
Bethesda, Maryland 20814Dr. Edward H. Lanphier
Department of Preventive Medicine Dr. David E. YountBIOTRON Department of PhysicsUniversity of Wisconsin School of Medicine University of HawaiiMadison, Wisconsin 53706 Honolulu, Hawaii 96822
vi

CONTENTS
Page
Introductory RenarksR. C. Bornmann ......... ....................... ... ix
Session I. Experiments and Observations
R. C. Bornmann, Chairman
Historical Review, Demonstrated Forms of the CounterdiffusionSupersaturation Process, and Pathology and ExperimentalPathwaysC. J. Lambertsen ........ ..........................
Theoretical Bases of Transient Isobaric Supersaturation:Experimental SupportB. G. D'Aoust and C. Young ....... ................ ... 21
Contrast of Superficial Counterdiffusion in Skin and EyeJ. R. M. Cowley ........ ....................... ... 56
Inert Gas Exchange in the Middle EarA. Ranade ............ .......................... 67
General Discussion, Session I ...... ................ ... 69
Session II. Isobaric Inert Gas Counterdiffusion:
Hypothesis and Theory
C. J. Lambertsen, Chairman
Initial ConceptsD. J. Graves ......... ........................ ... 84
Multiple Inert Gas Bubble Disease: A Review of the TheoryD. E. Yount . . . . . . . . . . . . . . . . . . . . . . . . . 90
Theoretical ModelsR. Tepper ........... .......................... 126
Counter-Transport of Inert Gases: Effects of Steady-State andTransient GradientsB. A. Hills ......... ......................... ... 151
.' .i

Session III. Clarification of Terminology
C. J. Lambertsen, Chairman
Panel Discussion. .. .......... ........... .. 160
Session MV Implications for Open Sea and Chamber
Operations, Decompression and Therapy
R. C. Bornmann, Chairman
General Discussion................. .. ... . ... .. .. .. ... 170
V *i
INTRODUCTORY RMARKS
Capt. Robert C. Bornmann, MC, USN
Welcome to the twenty-second workshop of the Underseas Medical
Society. These workshops, which began in 1973, are intended to serve
several special purposes. First,. they are forums where workers in
rapidly expanding or developing research areas can discuss experimental
results and assimilate recent information. Second, these workshops
provide an opportunity to encourage research and to direct it i4o
promising channels. And finally, these meetings deliberately mix per-
sons who have backgrounds in a variety of scientific disciplines, to
promote a stimulating and provocative exchange of technical information.
This particular workshop will concentrate on the countercurrent
diffusion phenomenon. We will review the experimental data, examine
the explanatory hypotheses, and attempt to integrate the available in-
formation on countercurrent diffusion into a general scientific context.
We are also interested in relating this phenomenon to the practicalities
of modern diving-in general and of Navy diving in particular. For ex-
ample, will countercurrent diffusion present difficulties in future
diving operations? If so, how can we avoid them? Does this phenomenon
explain hitherto inexplicable occurrences? Has it perhaps obscured our
understanding of inert gas behavior?
It will be interesting to investigate whether'some of the things
that have occurred in Navy diving in the past can be attributed to
countercurrent diffusion, or whether Navy and commercial divers have in
fact been dealing adequately with this phenomenon all along, even though
they may have had no idea what they were actually contending with. I
ix
recently was looking through the old Navy diving manual I used in diving
school in 1960. The normal procedure in deep-sea helium diving with
heavy dress was to dive breathing a helium-oxygen mixture in semi-closed-
circuit flow, and then to switch- to oxygen at 50 feet. At this point
the suit was flushed for a time with a large volume of oxygen, to
eliminate the helium. There was-an alternate procedure for continuing
to the surface on helium-oxygen if it was not possible to switch to
oxygen. There was also a third alternative in case at any time the
diver lost his helium-oxygen supply and had to switch to air. The
schedule for coming to the surface was an old Navy treatment table
based on the idea that the diver would be completely saturated and would
have to be returned to the surface at the ascent rate for an air satu-
ration exposure. However, there was also a caution in the diving manual
that said, if the third of these situations occurs and the diver is
switched to air, do NOT follow the normal procedure, which is to venti-
late the suit with a large volume of gas to remove any residual helium.
In this situation, continue with a semi-closed breathing gas circulation.
The new gas, air. should simply be injected into the suit, and this
should continue all the way to the surface so that the diver is gradu-
* ally switched from helium-oxygen to a mixture of helium-oxygen and air;
and then to air. The manual noted that experience had shown that if
this procedure wasn't followed, the diver would become ill. I am not
certain, but it is possible that the diver's discomfort in this situa-
tion would be caused by isobaric counterdiffusion, although other
factors may also have contributed.
* The progra' of this v rkshop follows a planned sequence. The first
session will cove- ese.:ch observations and experiments, and the second
X

session today will focus on theories and hypotheses which have been
advanced to explain what has been observed. The first discussion on
the second day of the workshop will deal with the terminology used to
discuss the countercurrent diffusion phenomenon. Currently, different
researchers use different terms to refer to the same event.
The final workshop session will feature a panel discussion on the
implications of countercurrent diffusion for open-sea and chamber
diving operations, and for decompression and decompression sickness
therapy.
It is the hope of the organization sponsoring this workshop, the
U.S. Navy, that we will all leave this meeting with a better understanding
of isobaric inert gas counterdiffusion and its implications.
• Xi

Session I. Experiments and Observations.
Chairman: Capt. R. C. Bornmann
3

HISTORICAL REVIEW, DEMNSTRATED FORMS OF THECOUNTERDIFFUSION SUPERSATURATION PROCESS,AND PATHOLOGY AND EXPERDMNTAL PATHWAYS
C. J. Lambertsen, M.D.
Historical review
My task is to review the historical development of counter-
diffusion generally, rather than to present a specific set of
experiments or a particular point of view. The countercurrent
diffusion story goes back quite a long way, touches many people
in many different places in the world, and describes some of the
events that happen in animals or humans exposed to isobaric-
counterdiffusion processes. After this historical review, the
emphasis in this morning's session will be on measurement, while
the afternoon session will attempt to relate theory to measure-
ment.
First, with countercurrent diffusion we are dealing with a
phenomenon that is very old; everyone here remembers that, whether
the term isobaric counterdiffusion was used or not, individuals
thought in terms of counterdiffusion with no change in pressure,
*e and mention of this occurs occasionally in the literature. At
the first underwater physiology symposium (Washington, D.C., 1955),
the concept of facilitating inert gas transfer 6y alternating
inert gases was introduced. Before that, facilitating the trans-
fer of inert gas had been thought about but not thoroughly dis-
cussed. Keller and Buehlmann first used these concepts, even
---

though they didn't think in terms of the isobaric no-pressure.
chain but rather in terms of subsaturation and desaturating more
rapidly by alternating the gases breathed during decompression.
Things might have remained there, except that the group at
Duke was studying the respiratory effects of various inert gases
at a pressure of 200 fsw, by administering nitrogen or neon in
a chamber filled with helium. In the course of one such experi-
ment, a situation developed which no one at the time understood:
the subject developed skin lesions. They looked like skin-bends
to the team at Duke, but they had developed in an individual
who had not decompressed and who had been kept at a relatively
constant pressure of about 200 fsw for a long time during the
experiments. Dr. Aquadro, who was a member of the Duke-team,
called me to discuss what to do. The individual should have
been subsaturated because he had been given nitrogen or neon
after having breathed helium, so it didn't seem reasonable that
he should .have skin bends.. A decision was made to treat the
subject as though he had skin bends, and the lesions disappeared
during treatment. Later, the Duke research group developed the
concept of osmotic changes caused by inert gas dissolving in
body tissues to explain what had'occurred. The Experimental
Diving Unit repeated the Duke studies under the same conditions
and found nothing, after which many of us put the whole issue
aside, although we didn't quite forget about it.
Even before the Duke experiments, however, we began a series
of experiments at the Institute for Environmental Medicine called
-2-

"Predictive Studies." One of them, in 1970, involved saturating
individuals on nitrogen for a few weeks to study nitrogen effects
at touratmospheres and to investigate respiration and respiratory
reactivity by administering other gases. One of these gases was
helium, which was given to nitrogen-saturated individuals for an
hour, during which different amounts of carbon dioxide were*
administered. Before this study was initiated, the laboratory
undertook an intensive self-appraisal, because it looked as though
the planned experiment would crease a peculiar supersaturation
that might be hazardous. Such a supersaturation would have been
almost opposite to the subsaturation sought by Keller and Buehlmann.
We recognized this potential hazard even before isobaric super-
saturations of any significant degree were being considired.
Ultimately, we decided that the experiment would not be hazardous
because the increase in total inert gas pressure under experi-
mental conditions would not be greater than had been experienced
in true saturation decompression studies in the past, and so we
proceeded with the study. No symptoms were generated when nitrogen-
saturated subjects at 100 fsw were given helium.
There were, then, two conflicting pieces of evidence. On the
one hand, symptoms did not occui'when helium was given sequentially
to individuals saturated with nitrogen. On the other hand, there
was the confusing situation uncovered at Duke (which had not been
confirmed by Navy studies), in which, under saturation conditions,
subjects exposed to helium and administered another breathing gas
had developed symptoms. It was in this situation that we planned
-3-

our third predictive study, which was designed to compare helium,
neon, and nitrogen effects and would therefore require giving
gases in series. Once more, there was the possibility that
sequencing might cause subsaturations of.major degrees in some
situations and significant supersaturations in others, because
the alternating was to take place at many different pressures,
ranging from 100 to 300, and 400 to 1200 feet of seawater. Again,
we evaluated the potential hazard in advance and, because no
adverse effects of supersaturation at high pressure had ever been
demonstrated, we proceeded with the experiment.
What did in fact happen, beginning at about 200 fsw, was a
situation very much like the one at Duke: the subjects developed
skin lesions and severe itching. Only these two symptoms occurred;
there were no central nervous system effects, no signs of vestibular
derangement. And by severe, I mean intolerable: violent cutaneous
itching. Despite the itching, however, there were initially no
lesions such as had been observe4 at Duke. This marked the first
in a series 'of a dozen or more observations of symptoms in various
subjects surrounded by helium, breathing different gases, at a
variety of pressures. It was not until a pressure of 1200 fsw
was reached that true gas lesions -- visible, prominent, and capable
of being photographed -- and severe vestibular derangement,. incapac-
itating for as long as five days -- developed. 'At 1200 fsw, three
of our four subjects had vestibular symptoms; two were incapacitated,
unable to move their heads without nausea, vomiting, and violent
dizziness. Since it is always easier to interpret events in terms
-4-

of known causes thain to develop a theory to explain events,. we
thoroughly explored the possibility of viral infection before
concluding that a process involving subsaturation of deep tissues
must underlie both the dermal and vestibular effects experienced
by our divers.
We made an instinctive judgment that the process was related
to gas movement through the skin; at this stage, no theory was
involved -- only judgment. The approach we used to test this
judgment involved enclosing the subject almost entirely in a gas-
tight suit and allowing the same gas that the subject was breathing
to pass through the suit. Except on those areas of the skin, such
as the face and hands, that continued to be exposed externally to
helium, all the dermal lesions disappeared during this procedure,
confirming our feeling that gas movement in two directions,
between the capillaries and the environment, was involved.
The phenomena we have discussed so far today are not unitary
but complex.
They involve different events: in one case, different gases
are administered sequentially, and in the other, one gas is breathed
while another gas surrounds the dubject. Both the order of the
sequence and the relation of theexternal environment to the inter-
nal are important. With this general background in mind, I will
now discuss the circumstances in which these phenomena occur and
illustrate their effects.
Forms of the counterdiffusion supersaturation process
Figure 1 conceptualizes nitrogen saturation at high pressure
-5-

and the administration of helium, which comes in at a faster
rate than nitrogen is thrown off. This is not a new concept,
but some of its Implications are only beginning to be understood.
One of the more important may be the effect of the duration of
the probable excess saturation. As the figure shows, the times
are long, providing many hours during which bubble formation
can occur.
Fig. 1 here
The next figure shows the subject's dermal lesions (Fig." 2).
These lesions were not vesicles; they were bloodless lesions.
They were not gas lesions, and no gas could be sampled from
them. They were hard and raised, and something liad squeezed
the blood out of them so that they did not bleed when they were
opened. Although the figure doesn't show them, there were many
lesions on the scalp, where the itching was extreme. There were
no lesions under the diver's suit, and there were also no lesions
on the mucous membranes. Since the eye, like the skin, was ex-
posed, the question whether bubbles occurred in the conjunctiva
of the eye has been raised. No human exposures have caused
bubbles in the eye, the mouth, the nose, or the mucosae.
Fig. 2 here
The next figure (Fig. 3) is a diagram of a capillary, showing
how the nitrogen breathed diffuses out into the environment from
the capillaries, while the helium in the environment diffuses
into the capillary and continues to move from there.. This diagram
was drawn in the chamber at 300 fsw to explain that a process
-6-

involving two moving gases might be causing the symptoms, and
that a subcutaneous gas phase might be involved.
Fig. 3 here
Figure 4 shows a semi-cartoon, semi-serious experimental
plan for exposing subjects in" a bathtub in a high-pressure chamber
to one breathing gas while surrounding them with water, which
might even permit the escaping gas bubbles to be seen as they.
left the body. We did not perform this experiment because of the
seriousness of the vestibular effects caused by exposing the
entire body. Instead, the experiment we conducted involved the
diver keeping an arm under water while breathing helium, and no
bubbles were seen coming through the skin. We will later talk
about why no bubbles occurred in this situation..
Fig. 4 here
We also talked to people in the Chemical Engineering Department,
to get a better understanding of gas transfer from the engineering
perspective. We made a cell, put a membrane on top of it that
would hold water, and put water and then oil on top of the membrane.
By simply filling one part of the cell with nitrogen and the other
with helium, it was possible to qee bubbles being generated at the
oil-water interface. The bubble.-naking process could be accelerat-
ed by seeding at the interface. Here, then, was an example of
bubbles forming in an isobaric, steady-state situation, without
pressure on either side of the membrane. Both "isobaric" and
"counterdiffusion" were obvious terms to choose to describe this
in vitro situation.
-7-
Next, we extrapolated from this environmental situation
to the high-pressure chamber exposure that had produced the lesions
and the vestibular derangement. Theoretically, the ratio of
maximum generatable excess supersaturation in relation to ambient
pressure is about 0.3 atmospheres. At 100 few, that would be
about one atmosphere, and at 37 atm, the pressure at which our
symptomatic episodes occurred, the steady-state supersaturation
would be about 9 atmospheres. This seemed unreasonable; even if
such a supersaturation was theoretically feasible, gradienti Mould
be established and gases would diffuse in all directions from
many tiny foci, causing excess saturations of lesser.degree in
adjacent tissues.
Our next step in the process of trying to measure what was
happening involved exposing animals to various isobaric inert
gas counterdiffusion circumstances. Figure 5 shows lesions in a
pig, similar to those that developed in human subjects, and Table 1
displays the results of a seiies of experiments undertaken by
Joe Idiculain animals to follow what had been observed in man.
In this series, different breathing gases - neon, nitrogen,
argon, nitrous oxide, and sulfur hexafluoride - were administered
at different pressures ranging from 66 to 300 fsw to animals
surrounded by helium in a chamber. The internal-external relation
of the gases was also reversed, with helium given as the breathing
gas and the other gases used as the environmental gas. The plus-
marks on the table indicate the experimental situations that caused
lesions in the pigs, who were anesthetized and otherwise without
-8-

Sym1ptOmS.
Fig. 5 here
Table 1 here
After these experiments, our work at the laboratory involved
tissues, synthetic membranes, biological membranes, and whole
animals; Fig. 6 shows an animal in a box with its head in a hood;
which permits it to be exposed .to one atmospheric gas while
breathing another one. This expn-.ental. arrangement also allowed
us to put the box inside a pr* . chamber, if necessary. The
Idicula group' s experiments W: -;Awn that nitrous oxide breathed
at one atmosphere by avc *t.,r rounded by helium generated bubbles
in the bloodstream in addition to severe isobaric skin lesions.
This finding caused us to use nitrous oxide at sea leve . for many
of our investigations.
Fig. 6 here
In a pig in this experimental set-up, one of the most obvious
effects is the expansion of the gut, which is not related to the
environment but to nitrous oxide entering that gas space via the
lungs and circulation. Bubbles do form in the blood, and are
visible post mortem in the cut kidney, the atrium, and the vessels
of the eye, which means they also occur in the brain. The serious-
ness of the problem is shown by the fact that animals exposed to
nitrous oxide breathing while surrounded by helium die in about
1-1/2 hours after the beginning of the experiment. The rapidity
of this lethal process handicapped this type of experiment, so we
began to investigate where bubbles were going from the pulmonary
-9-

artery. They began to appear in the blood after about 26 minutes
of nitrous oxide breathing, and at about 45 minutes, there was
massive bubbling in the venous blood coming to the lung. Almost
from the beginning, bubbles seemed to have been breaking through
the lungs; the lungs did not filter the bubbles out effectively.
It is important that we not continue to believe that they do
filter all the bubbles out.
Another group at our laboratory, which included Dr. Cowley,
wanted to study counterdiffusion using a rabbit's ear, in which
the circulation is visible. Figure 7 shows the experimental set-
up, with the rabbit breathing one gas through a mask while its
ear is surrounded with a different gas. A group of rabbits exposed
in this way at a pressure of 11 atmospheres died within-2 hours
just from breathing air while surrounded by helium, with no other
stresses. Nitrous oxide kills at. sea level in a counterdiffusion
situation, and air kills at 10 or more atmospheres of pressure.
However, rabbits breathing. normoxic nitrogen at 11 atmospheres
who are not surrounded by a helium environment do not die, so it
is clear that we are dealing with an inert gas phenomenon. More-
over, many of the diving studies done at several laboratories have
involved pressures, gases, and t1Unes very similar to those of the
experiments we have just described, so we have often been very
close to exposing human subjects to these conditions.
Fig. 7 here
The next experimental problem was how to keep the animal
alive long enough to study the counterdiffusion process. We
-10-
decided to counterdiffuse only a part of the animal, such as the
ear, leg, or hindquarters, and to insert a trap in the vena cava
to catch the bubbles coming from the counterdiffused region. This
procedure is shown in Fig. 8. Since the trap catches the emboli
before they can kill the animal, the heart, lungs, and brain con-
tinue to operate properly, although the counterdiffused region,
in this case the pig's hindquarters, is clearly in bad shape. As
Fig. 8 shows, after 4 to 6 hours of counterdiffusion, the process,
though superficial, is intense. Several significant changes have
occurred: there is a marked derangement of the cutaneous circula-
tion. Bubbles have accumulated in the capillaries, causing an
almost complete cessation of circulation and extravasation from
the capillaries into the tissues. The line of demarcation between
the counterdif fused region and the rest of the skin is very sharp,
as can be seen in the photograph (Fig. 8). This preparation per-
mits the animal to continue to live, and it is sometimes necessary
to kill it after 8 hours or so.
Fig. 8 here*
The next step in our investigation was to measure the volume
and composition of the bubbles coming from the pig's hindquarters.
Figure 9 shows a plot of the volume of bubbles in the trap. The
same gas is measured cumulatively as it increases in volume;
eventually, the rate of gas bubble formation peaks and sta1ilizes,
regardless of the duration of the exposure. A major problem with
this technique is that no measurements can be taken until the
bubbles begin to form,which takes about 1-1/2 hours. The time
-11-

Fig. 9 here
of greatest experimental interest, the beginning of the counter-
diffusion process, cannot therefore be observed with this prepara-
tion. The volume of gas that comes through the trap (in partial
pressures) is shown in Fig. 10.' About 200 milliliters of .gs per
hour per square meter of surface area were generated in the pig's.
hindquarters at a pressure of one atmosphere and in a nitrous
oxide/helium counterdiffusion environment. The same amount,
proportionately, seems to be liberated in experiments involving
the rabbit's ear, which Dr. Cowley will discuss later.
Fig. 10 here
Pathology and experimental pathways
It is also possible to determine the composition of the vena
caval blood in the trap, and to deduce. certain pathways for gas
exchange. Helium is found in the blood at a level of 16%. The
composition of the arterial blood is known, as is that of the
venous blood. Some blood does not go through the skin but is
shunted back into the venous blood, but other blood does go through
the skin and is affected. These-two streams then merge. The
chart shown in Fig. 10 reflects our estimate of what happens in
the skin during counterdiffusion, and shows the percentage of
each gas in the trapped bubbles.
Next, we conducted a study designed to measure the rates
at which different gases -- helium, neon, methane, ethane, carbon
dioxide, nitrous oxide -- move through the skin, i.e., the flux
of various gases. Temperature has an influence on the flux of
-12-

helium through the skin. Simple diffusion of helium at tempera-
tures in the 37 to 410 C range accounts for 60 ml/hr/m2/atm.
Using these figures, it is possible to imagine the amount of
helium movement that would occur at 40 atm (1200 fsw) in a diver
suddenly starting to breathe .a neon-oxygen mixture in a helium
environment; the amount entering the diver's body through the
skin might be as great as 5000 ml per hour.
The final point of this review is to see that we are dealing
with more than one topic, and with different aspects of these
topics. We know that helium diffuses through the skin and other
surfaces, and we know that dermal lesions occur. These lesions
should be thought of as warnings of incipient embolization,
whether or not the emboli have-broken out. We know that continuous
embolization occurs, and that this can break through the lungs
and is one of the mechanisms that may be involved in vestibular
functional effects.
We are looking at events occurring at the surface and away
from the surface, at events that are both transient and continuous.
Where a gas phase is involved, many different elements are pertinent:
decompression, compression, deep gas exchange, and superficial gas
-; exchange. These events must all be tied together, and it is7"
essential that we avoid becoming compartmentalized to the extent
that we miss the interconnections between them.
-13-

Discussion,
Q. Has the rate of embolization been measured under other
counterdiffusion situations, for example, during 120 breathing
in a helium environment? Have different pressures been used?
A. We have conducted N20 studies at 2 atm, and the rate-of-
formation curve was essentially identical to the one at I atm.
The same volume of gas was produced per square meter, but
there were twice as many molecules because the pressure.was
2 atm. In experiments with pigs at 1200 fsw, using Ne and
N2 , we have seen skin lesions but no emboli over periods of
time at least equivalent to those of the human studies.
Q. Have experiments been conducted to observe the onset of the
process or the effect on the process of varying the inert
gases to look at the rate of.change?
A. In experiments designed to measure gas flows, gas volumes,
and gas composition, we .have not tried to alter the process.
In studies of gas exchange in the ear, we have administered
oxygen, to observe the change in gas volura caused by the
experimental equivalent of tAerapy.
Q. Have you observed whether reverting to the original gas
causes the embolization to stop, or whether, once started,
the process proceeds inevitably?
A. We have not as yet conducted a systematic effort to deter-
mine that.
Q. Why were experimental gases such as N20 and S?6 used?
-14-

A. N20 was used because it was convenient and could be worked
with at sea level; SF7 was part of an attempt to study all
the inert gases that had been used as breathing gases and
to look at respiratory function when dense gases were being
breathed.
Q. Since a venous bubble must be more or less equilibrated by
the time it gets into the major flow, would it be possible
to measure the time it takes for the gas to go from the skin
to the bubble trap by adding x fast isotope to the gas diffusing
in?
A. We were not able to find a rapidly diffusing radioactive
isotopic gas to use in such studies.
Q. Is the gas in the bubble trap equilibrated with the-gas in
the venous blood so that it in fact represents the partial
pressure of the gas?
A. Any tonometer that equilibrates a gas phase with a liquid
phase has to have the .abtlity to reach an equilibAum pressur.-
The venous blood is at a subatmospheric pressure, which woas
there cannot be true equilibrium between any gas phase in
contact with that blood. We'have estimated partial pressures
at atmospheric pressure of the gases in the gas phase of the
bubble trap. These values do not precisely equal the gas
tensions in the blood because there is no true equilibrium,
but there is a close near-equilibrium between them.
Q. What is known about the location of bubble formation?
-15-

A. Initially, we believed that gas spaces were being formed
subcutaneously in millions of tiny locations, and later we
decided they could form in the capillaries in addition to the
gas spaces. Now we believe they form in the gas spaces, and
there are gas spaces where there are no capillaries.
Q. Was there any fluid at all in the skin lesions? Were they
gas-filled?
A. In the divers, they were hard, raised, bloodless lumps, in
which something had pressed on-the capillaries and squeezed
the blood out. When scratched open, no blood or fluid came
out. Without microscopic sections, which we didn't do on
the human• subjects because it is impossible to do histology
properly at pressure, it was difficult to tell what was inside
the lesions. In the pigs, however,- the microscopic sections
showed the gas spaces you saw on the histological slides.
Q. Is there any danger that a long surgical procedure in a
nitrogen environment could cause differentials great enough
* to cause bubble formation?
A. It might occur with nitrous oxide at high partial pressure,
but not with halothane or with other anesthetics, which ate
used at low concentrations..
Q. Did the divers with the vestibular problems have any auditory
symptoms such as tinnitus, hearing loss, ear pain, or a-
fe'eling of ear fullness?
A. The divers who had the vestibular problem had no hearing
loss afterwards, even on audiometric tests, and they showed
no signs of hearing loss during the episode. They had no
auditory or visual symptoms; severe vertigo and nausea were
-16-

the only symptots.. It is important to remember, however,
that the vestibular derangement associated with gas switching
is distinct from the other type of vestibular problem related
to changing from nitrogen to helium during decompression.
There should not be any blurring of the distinctions between
these two phenomena.
17

Readings in Isobaric Gas Counterdif fusion
1. Collins, J.M. Inert gas transfer in the body. Experimental
study an4 perfusion/diffusion modeling of transcutaneous
and gas cavity dynamics. Ph.D. theiis. University of
Pennsylvania, 1976.
2. Cowley, J.R.M., and C.J. Lambertsen. Isobaric gas counter-
diffusion in rabbit eye. J. Appi. Physiol.: Respirat.
Environ. Exercise Physiol. 47:220-223, 1979.
3. Cowley, J.R.M.,. C. Allegra, and C.J. Lambertsen. Measurement
of subcutaneous tissue pressure during superficial isobaric
gas counterdiffusion. J. Appl. Physiol.: Respir. Environ.
Exercise Physiol. 47:224-227, 1979.
4- Dueker, C.W.. C.J. Lambertsen, 3.3. Rosowslki,. and J.C. Saunders.
Middle ear gas exchange in isobaric counterdiffusion. J. AppI.
Physiol.: Respirat. Environ. Exercise Physiol. 47:1239-1242. 1979.-
5. Feld, J.N., and C.J. Lambertsen. Optimal choice of inert gases
to be breathed for minimum--time decompression scheduling.
Paper presented at the Aerospace Medical Association meeting,
Miami Beach, 1972.
6. Graves, D.J., J. Idicula, C..J. Lambertsen, and J.A. Quinn.
Bubble formation in physical and biological systems: a manifesta-
tion of counterdiffusion in composite media. Science *179:
582-584, 1973.
7. Graves, D.J., J. Idicula, C.J. Lambertsen, and J.A. Quinn.
Bubble formation resulting from counterdiffusion supersatura-
tion: a possible explanation for isobaric inert gas 'urticaria'
-18-
and vertigo. Phys. Med. Biol. 18:256-264, 1973.
8. Hammond, R.E., C.J. Lambertsen, J.R. Williams, and J.M.
Collins. Transcutaneous flux of helium, nitrogen and nitrous
oxide relative to peripheral blood flow. Fed. Proc. 37:430,
1978.
9. Idicula, J., D.J. Graves, J.A. Quinn, and C.J. Lambertsen.
Bubble formation resulting from the steady counterdiffusion
of two inert gases. In: C.J. Lambertsen, ed. Underwater
Physiology V. Proceedings of-the Fifth Symposium on Under-
water Physiology. Bethesda: Federation of American Societies
for Experimental Biology, 1976.
10. Imbert, J.P. Proposition of a perfusion limited model for
isobaric counterdiffusion. M.S. thesis. University of
Pennsylvania, 1975.
11. Karreman, G., and C.J. Lambertsen. Kinetics of isobaric
counterdiffusion. Bull. Math. Biol. 39:587-595, 1977.
12. Kronheim, S., C.J. Lambertsen, C.W. Nichols,. and P.L. Hendricks.
The dynamics of inert gas exchange and bubble formation and
resolution in the eye. In: C.J. Lambertsen, ed. Underwater
Physiology V. Proceedings of the Fifth Symposium on Under-
water Physiology. Bethesda:-Federation of American Societies
for Experimental Biology, 1976.
13. Lambertsen, C.J. Concepts for advance in the therapy of
bends in undersea and aerospace activity. Aerosp. Med. 39:
1086-1093, 1968.
-19-

14. Lambertsen, C.J., and J. Idicula. A new gas lesion syndrome
in man, induced by "isobaric -gas counterdiffusion." J. Appl.
Physiol. 39:434-443, 1975.
15. Lambertsen, C.J., and R.E. Peterson. Gas lesion diseases:
The significance of isobaric gas exchange in decompression.
In: Proceedings of the Offshore Technology Conference, 1978.
16. Quinn, J.A. Gas transfer through the skin: a two-layer
model relating transcutaneous flux to arterial tension. In:
I.A. Silver, ed. Proceedings-of the Third Symposium -.
.International Society for Oxygen Transport to Tissue. New
York: Plenum Press, 1977.
17. Quinn, J.A., D.J. Graves, and R.A. Smock. Bubbles generated
in membrane oxygenators: nitrogen washout and counterdiffusion
supersaturation. J. Appl. Physiol. 37:479-486, 1974.
18. Ranade, A. Analysis of inert gas exchange in the middle ear.
Ph.D. thesis. University of Pennsylvania, 1978.
19. Ranade, A., C.J. Lambertsen, and A. Noordergraaf. Theoretical
analysis of inert gas exchange in the middle ear. Paper
presented at the Annual Conference on Engineering in Medicine
and Biology, 1978.
20. Smith, D.R., R.J. Lander, irid J.A. Quinn. Carrier-mediated
transport in synthetic membranes. In: N.N. Li, ed. Recent
Developments in Separation Science. Vol. III. Cleveland:
CRC Press, 1977.
-20-

THEORETICAL BASES OF TRANSIENT ISOBARIC SUPERSATURATION:.'
EXPERIMENTAL SUPPORT
Brian G. D'Aouse and Christopher Young
There are three important reasons for this workshop: 1) to assembleand organize theoretical vs. experimental information on isobariccounterdiffusion more clearly; 2) to eliminate current confusion interminology; and 3) to assess both the present risk and potential ad-vantage in gas switching or steady-state differential situations suchas those that occur when switching back to air by mask after helioxexposures or when breathing heliox during welding in an argon atmos-phere. At Virginia Mason, we entered into this research area aboutfour years after the phenomenon was described by Dr. Lambertsen's group.At that time the discovery was a surprise to us, mired as we were in aprogram to clarify the basic aspects of bubble formation on the one handand gas transport on the other. It soon became clear that coulnterdif-fusion might be an effective research tool; we believe we can increaseour understanding of these basic questions by using countertransport,counterequilibration, or counterdiffusion-.as a research tool.
I had lunch with Dr. Per Scholander the other day, and he repeatedsomething that has always impressed me: "I have never talked about any-thing I understood." With that as an introduction, I hope I can presson confident of some sympathy on your part.
We became very interested In Drs. Lightfoot and Tepper's ideas on"counterdiffusion supersaturation when we were initially studying this
phenomenon, which we were trying to fit into the concept of what makesa bubble? What is the relationship--of AP and the pressure ratio?
Our contribution to this workshop will have two parts. Firbt, wewill present some results of an analysis by Dr. Young of a standardKrogh cylinder model with wash-in aid wash-out of helium and nitrogen,respectively, as well as a number of other -gases. This analysis willbe based on two extremes and one compromise. The two extremes occurwhen time constants of the equilibrating gases are controlled or deter-mined by either the solubility of the counterequilibrating gases, or bythe diffusion coefficients. The compromise tnvolves both diffusiondifferences and various values of tissue-to-blood partition coefficients,i.e., solubility ratios. The results of these analyses demonstrate notonly the improbability of a strictly diffusion-related time constantbut also suggest, in concert with our experimental evidence, that theperfusion (solubility)-related time constant is even more controllingthan we have previously thought, at least as concerns the bubblesobserved by Doppler at the central venous location after isobaricsupersaturation.
*-21-

Second, we will present a sunary of our experimental work, whichapproximately delineates the time constants important for vhole'bodysupersaturation in the awake goat and also supports a perfusion-limitedmodel.
Synopsis
We know that the isobaric countertransport of two gases producessupersaturation, and must now decide vhich of a number of transport .processes in combination with which particular properties of the gasesproduces these supersaturations.. To avoid semantic problem, I-preferthe following terms for the,-various operational situations. When asudden switch of environmental gas which is also breathed occurs in thevertebrate body, the situation can clearly be termed a transient iso-baric counterequilibration. If only the breathing gas is changed,counterequilibration approaching a steady state in which one c4n con-ceive of stable decreasing gradients between the skin and the lungs ofthe surrounding gas on the one hand and the lungs and the outside ofthe skin on the other is involved.
This latter situation I prefer to describe as steady-state iso-baric countertransport rather than "counterdiffusion," since it isnot yet clear whether the perfusi6n vs. diffusion ratios are the mostcritical in determining the degrees of supersaturation measured. Aswe shall show, there is increasing evidence that it is indeed the per-fusion-limited situation or model that best describes our experimentalresults with transient switches, i.e., bubble formation in the vascularbeds (Hills 1977; Kety 1951).
The model of Graves, Idicula, Lambertsen and Quinn (1973), forwhich a physical analogy has been constructed and supersaturation pres-sures directly measured, has ..ony two limitations: size and thedifficulty of experimenting with capillary dimensions. This model isof greater conceptual value in demonstrating a mechanism at the steadystate. In a situation involving transient switches, Fig. 1 showstransient excess pressure across silicon rubber, and provides a useful
7conceptual analogy for the transient situation.
This physical observation was actually first reported in 1967 byWinsey and Folkman, who suggested exploiting it as a simple gas fractionanalyzing method. This is feasible and both inexpensive and simpleand, as reported by Graves and his co-workers (1973), has now resultedin a commercial product (see paper by Graves, this workshop). Thisphenomenon can be considered a.pure example of isobaric countirdiffusion.
In an earlier paper (D'Aoust, Smith, Swanson, White, Harvey,Hunter, Neuman and Goad 1977), we alluded to the difficulty in decidingupon the mechanisms of isobaric supersaturation. This is readily under-standable when it is accepted that helium saturates the body fasterthan nitrogen (Behnke and Willmon 1941; Buehlmann 1975); however, thereason that these time constants differ has never been clearly explain-ed. In the case of helium, solubility and diffusivity could be involved.The time constants or half-times of these gases are empirically derived
-22-

and expressed in the multiple exponential parallel compartment model.Because such a model is so common in diving calculations, it is. worthre-emphasizing how the phenomenon of isobaric supersaturation confoundssuch a model and forces us to consider the actual tissue or vascularlocation of bubbles (Lambertsen and Idicula 1975).
Part of the rationale suppqrting a multiple parallel compartmentmodel is that it allows for a spectrum of half-times in the body, forwhich there is much evidence (there being nothing said about how muchgas is dissolved in which tissues of which half-times). However, oncethe phenomenon of isobaric bubble formation was demonstrated, it becamenecessary to consider where the bubbles were forming and what specifichalf-times applied in these regions.
Thus, with the two gases, there is no way to decide which heliumhalf-time is best applied to which nitrogen half-time. On the.otherhand, the use of a constant ratio of half-times for helium and nitrogen(Buehlmann 1975) is obviously an oversimplification because heliumdiffuses faster, is less soluble, and has a lower fat/water partitioncoefficient than nitrogen. For this reason, in our original analysiswe arbitrarily used a pairing scheme (Fig. 3) which provided for adifferent helium/nitrogen half-time ratio according to the supposedbasis for the nitrogen half-time.- Thus, for a very fast tissue (whichwas assumed to be aqueous), a ratio of 2 :1 (TiN2 :TjHe)- was used;whereas for the long tissues (which were assumed to Se more fat con-trolled) a lower ratio was used... This is"still arbitrary; however, itseemed a more reasonable approximation to known facts than using aconstant ratio. In fact, it may have been even less justified than weimagined, as we shall show in this presentation.
It was natural as a. next step to try to calculate the differentdegrees of supersaturation that would be encountered if the ratio ofthe time constants was, on the "one hand, chiefly due to a diffusionratio difference or,. on the other, t'6 a solubility or perfusion-limitedratio difference. This gave rise to the following analysis, performedby Dr. Young.
In the perfusion-limite4 situation, the time constant k of thecompartment i is Q.Xi where Q is the blood flow into the compartment,
V* , V is the volume of the compartment, and A- the tissue-to-blood parti-
tion coefficient of gas i. Thus, if aBi is the solubility of gas i inthe blood and aTi is the solubility of gas i in the tissue, then thetime constant of gas i is.
ki -- -- i
V aTi
In other words, at given flow (Q) and volume (V), the time constant ki "is equal to the blood tissue ratio of solubilities for gas i.
Now suppose gas 1 and 2 are counterequilibrating. If gas 1 iswashing out while gas 2 is washed in, then the total pressure at any
-23-

ET Qfr -
Fig. 1..L:.Lo3
771 * J I.
... .... ------
2 2I
..----..- *
__ 0FSW
130. 9341
U"-
I o.LU
* C
500
C 0,0 , oo°° o :. '" ......
S0 so--'
tok' to 3
.15 0- , ,
.0400o0 Cr4O 1:20 200 2:40 3:20 4:00 4:40 5:20 900 640 7:20 S0
Time (Hr:Min.)
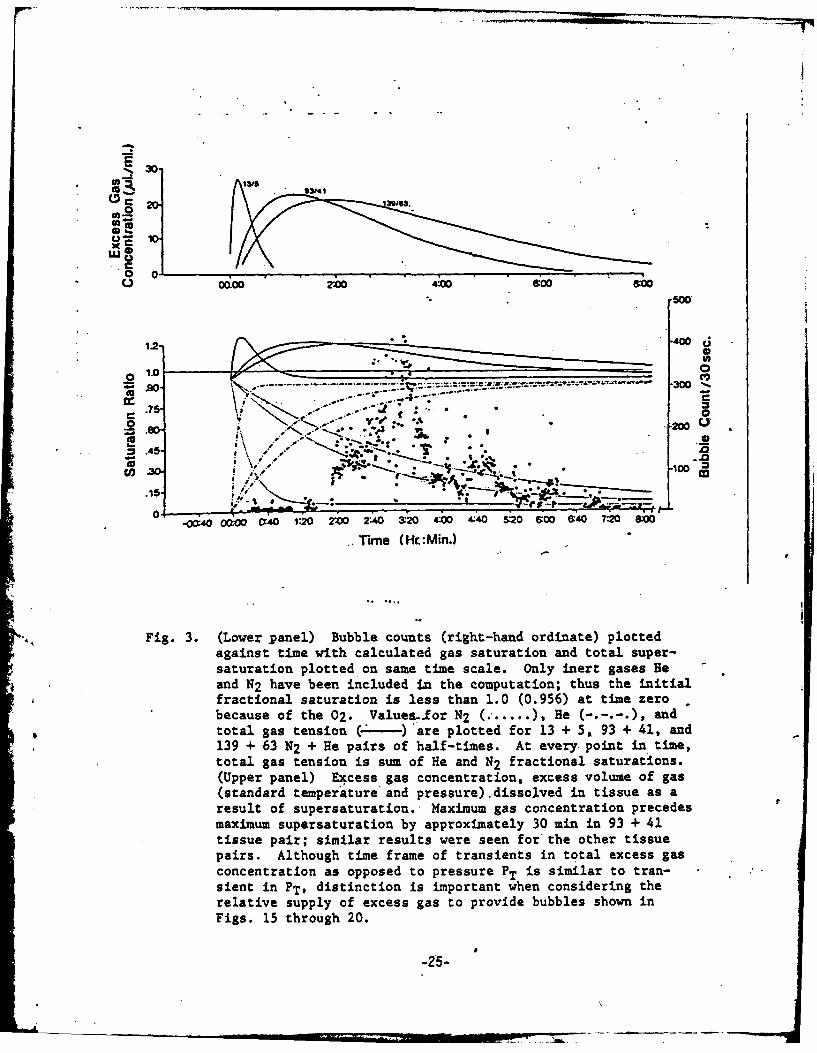
* Fig. 3. (Lower panel) Bubble counts (right-hand ordinate) plottedagainst time with calculated gas saturation and total super-saturation plotted on same time scale. Only inert gases Heand N2 have been included in the computation; thus the initialfractional saturation is less than 1.0 (0.956) at time zerobecause of the 02. Values.for N2 ( .... ), He (-.-.-.), andtotal gas tension (-.---)'are plotted for 13 + 5, 93 + 41, and139 + 63 N2 + He pairs of half-times. At every point in time,total gas tension is sum of He and N2 fractional saturations.(Upper panel) Excess gas concentration, excess volume of gas(standard temperature and pressure) dissolved in tissue as aresult of supersaturation. Maximum gas concentration precedesmaximum supersaturation by approximately 30 min in 93 + 41tissue pair; similar results were seen for the other tissuepairs. Although time frame of transients in total excess gasconcentration as opposed to pressure PT is similar to tran-sient in PT, distinction is important when considering therelative supply of excess gas to provide bubbles shown inFigs. 15 through 20.
I-25-
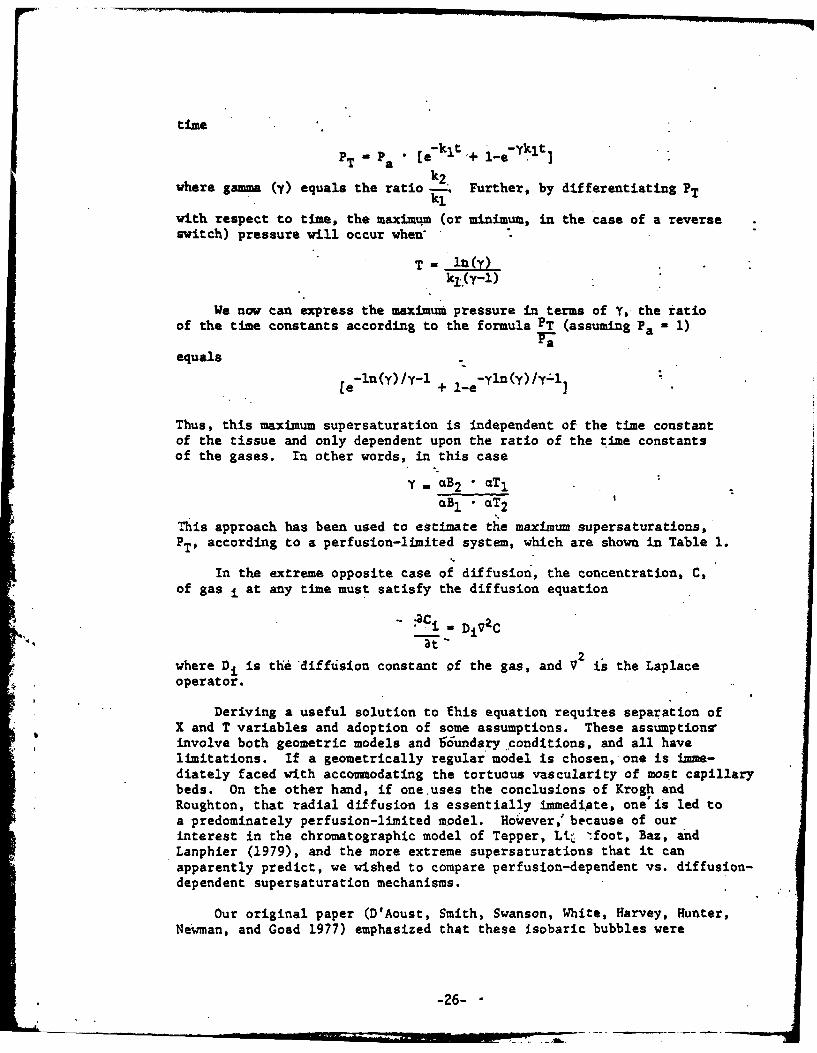
time
PT " a " [ekit + 1-e-klt]
where gamma (y) equals the ratio k2. Further, by differentiating PT
with respect to time, the maximum (or minimum, in the case of a reverseswitch) pressure will occur when*
T WY1 ()k1 .(y-l)
We now can express the maximum pressure in terms of Y, the iatioof the time constants according to the formula PT (assuming Pa 1)
equals-ln(y)/Y-l -ylIn (y ) / y ': l
[e + l-e ()yl
Thus, this maximum supersaturation is independent of the time constantof the tissue and only dependent upon the ratio of the time constantsof the gases. In other words, in this case
y. aB2 * aTI
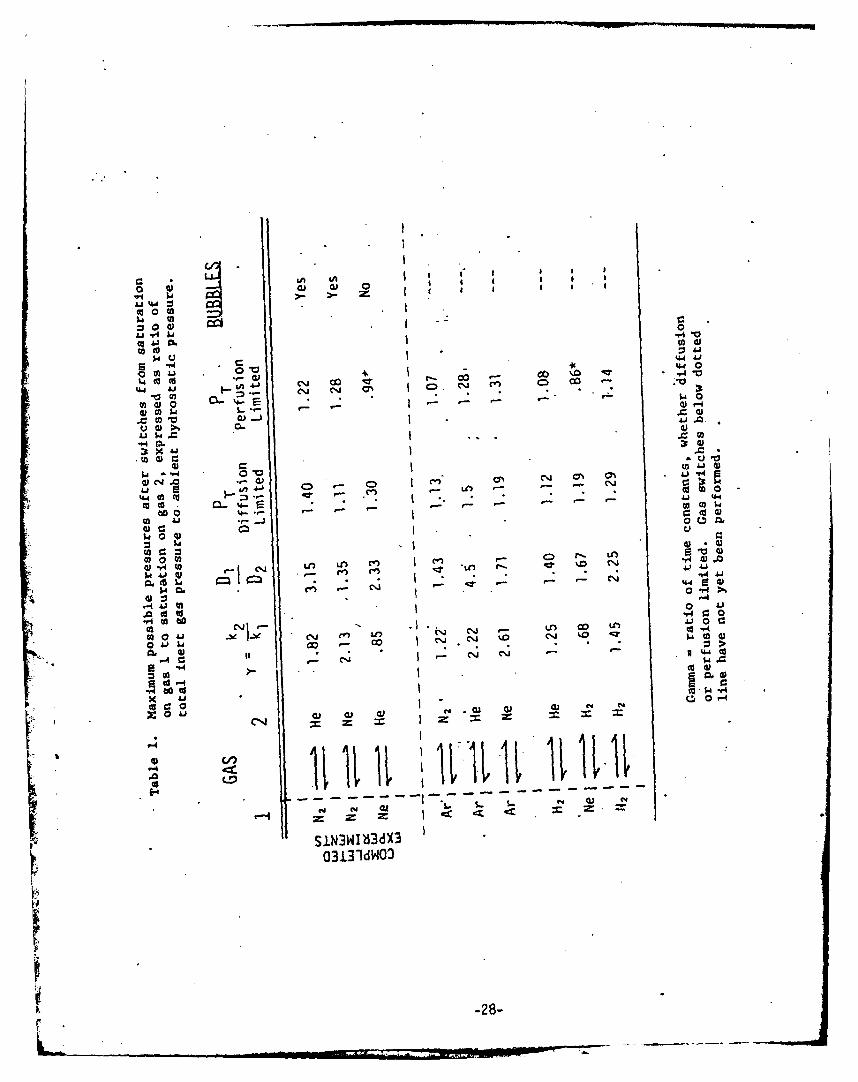
This approach has been used to estimate the maximum supersaturations,PT' according to a perfusion-limited system, which are shown in Table 1.
In the extreme opposite case of diffusion, the concentration, C,of gas i at any time must satisfy the diffusion equation
.. C - i DjVZCat
2.where Di is the diffusion constant of the gas, and V is the Laplaceoperator.
Deriving a useful solution to this equation requires separation ofX and T variables and adoption of some assumptions. These assumptions,involve both geometric models and 56undary conditions, and all havelimitations. If a geometrically regular model is chosen, one is imme-diately faced with accommodating the tortuous vascularity of most capillarybeds. On the other hand, if one uses the conclusions of Krogh andRoughton, that radial diffusion is essentially immediate, one'is led toa predominately perfusion-limited model. However," because of ourinterest in the chromatographic model of Tepper, Li .foot, Baz, andLanphier (1979), and the more extreme supersaturations that it canapparently predict, we wished to compare perfusion-dependent vs. diffusion-dependent supersaturation mechanisms.
Our original paper (D'Aoust, Smith, Swanson, White, Harvey, Hunter,Newman, and Goad 1977) emphasized that these isobaric bubbles were
-26- "
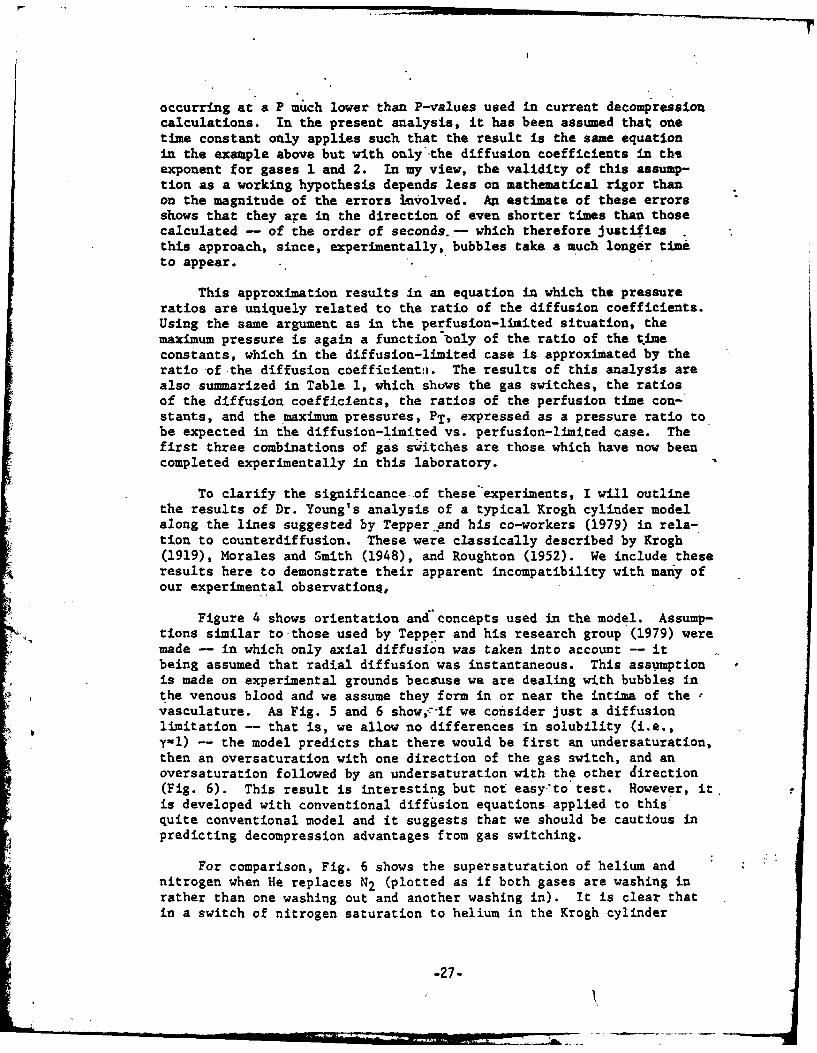
occurring at a P much lower than P-values used in current decompressioncalculations. In the present analysis, it has been assumed that onetime constant only applies such that the result is the same equationin the example above but with only the diffusion coefficients in theexponent for gases 1 and 2. In my view, the validity of this assump-tion as a working hypothesis depends less on mathematical rigor thanon the magnitude of the errors Involved. An estimate of these errorsshows that they are in the direction of even shorter times than thosecalculated - of the order of seconds. - which therefore justifiesthis approach, since, experimentally, bubbles take a much longer timeto appear.
This approximation results in an equation in which the pressureratios are uniquely related to the ratio of the diffusion coefficients.Using the same argument as in the perfusion-limited situation, themaximum pressure is again a function bnly of the ratio of the t imeconstants, which in the diffusion-limited case is approximated by theratio of the diffusion coefficient:;. The results of this analysis arealso summarized in Table 1, which shows the gas switches, the ratiosof the diffusion coefficients, the ratios of the perfusion time con-stants, and the maximum pressures, PT, expressed as a pressure ratio tobe expected in the diffusion-limited vs. perfusion-limited case. Thefirst three combinations of gas switches are those which have now beencompleted experimentally in this laboratory.
To clarify the significance-of these'experiments, I will outlinethe results of Dr. Young's analysis of a typical Krogh cylinder modelalong the lines suggested by Tepper and his co-workers (1979) in rela-tion to counterdiffusion. These were classically described by Krogh(1919), Morales and Smith (1948), and Roughton (1952). We include theseresults here to demonstrate their apparent incompatibility with many ofour experimental observation4,
Figure 4 shows orientation and" concepts used in the model. Assump-tions similar to those used by Tepper and his research group (1979) weremade - in which only axial diffusion was taken into account -- itbeing assumed that radial diffusion was instantaneous. This assumptionis made on experimental grounds bectuse we are dealing with bubbles inthe venous blood and we assume they form in or near the intima of the ,vasculature. As Fig. 5 and 6 show;:-If we consider just a diffusionlimitation - that is, we allow no differences in solubility (i.e.,Y-1) - the model predicts that there would be first an undersaturation,then an oversaturation with one direction of the gas switch, and anoversaturation followed by an undersaturation with the other direction(Fig. 6). This result is interesting but not easy-to test. However, it.is developed with conventional diffusion equations applied
to this'
quite conventional model and it suggests that we should be cautious inpredicting decompression advantages from gas switching.
For comparison, Fig. 6 shows the supersaturation of helium andnitrogen when He replaces N2 (plotted as if both gases are washing inrather than one washing out and another washing in). It is clear thatin a switch of nitrogen saturation to helium in the Krogh cylinder
-27-
000
co 0 (A0 c00
-f4tA A C 14 V.
d) y.1 o Cg 00 CC).4o
Liwe
.441
C) C~
to 00
w. 0 4)
-r LO Cn c) LM Ai0 q) 0 - N al -Cr
4 J
m. 0
410
N4 .~j N0 4
Ln 6.0 -:0
cd -4-P.4 000C
r60 Aj J O WI -44
0 C.UP
SIN3Wlb3d%303131dWO3
-28-

model, total-gas pressure along the entire cylinder (in the blood andtissue) (Fig. 5) is first undersaturated and then becomes oversaturated.Also, with time (Fig. 6) there is an initial oversaturation and thenan undersaturation which, if a bubble was initially formed, might tendto redissolve the bubble. One might gain the impression %ere thatdepending on the model one chooses or its geometry and boundary condi-tions, gas switches can be predtcted to have completely opposite re-sults. An important consideratibn in this example, however, is thatthe required perfusion time constant of the entire cylinder is on theorder of 12 seconds. Remember that radial diffusion is consideredinstantaneous in this situation and we are only modelling axial dif-fusion. According to the analysis, the tube behaves as if a "front"of supersaturation moves down the tube. The particular profile shownoccurs 6 seconds after initiation of conditions. This is obviously avery short time compared with the time it takes to visualize bubblesat the central venous location after-such a gas switch, and the relation-ship (if any) between these concepts and our results is not ye clear.The chief advantage of this analysis, however, is that it apparefitlyallows us to exclude certain theoretical mechanisms fro n consideration.This is shown by the next series of figures, Figs. 7. through 14, whichshow results of the analysis with a variety of solubilities, diffusivi-ties and flows. We are on the one hand considering only solubilitydifferences (Fig. 8) and on the other considering both solubility anddiffusion differences (Fig. 7). Note that there is very little dif-ference among these figures (Figs. 7-14) when they are compared on thebasis of similar perfusion time constants..of more than 60 seconds.This points to the conclusion that taking the effects of solubilityinto account tends to dampen the extremes arrived at in thestrictlydiffusion-limited case.
For example, Fig. 7 and Fig. 8 show the plot of the supersa-uration(PT) with time in the venous end of the model in Fig. 4 with (Fig. 7),and without (Fig. 8), diffusion-differences taken into account. Thevalues S1 and S2 are the tissue-to-blood partition coefficients and, itqill be noticed, are extreme values related more to fat/water partitioncoefficients than actual tissue-to-blood partition coefficients. Note,however, the very slight difference in PT max in both figures (Figs. 7and 8). It is clear that in this model diffusion differences can havesignificant effects only for short time constants of a few minutes atmost. This is the important point to remember when comparing thisanalysis to our results (Figs. 15 through 19).
This is illustrated more clearly in Figs. 9 through 12, which showthe same results for different flow rates (i.e., perfusion time constants -volume + flow). fhese range over 3, 6, 60, and 60Q seconds and take intoaccount both diffusion and solubility differences, and are more physio-logically reasonable time constants than the ones used in Figs. 7 and 8.
Notice that for very short perfusion time constants -- in factunphysiologically fast blood flow (Fig. 9) -- the maximum PT occurs,and that this decreases as the perfusion time constant becomes more"physiologic" (Figs. 10, 11, and 12) to the point at which the PT isapproximately 1.2 x ambient for a 600-second tissue cylinder, i.e., a
-29-

FIGURE 4
-wAW.
(500jj)-
1.-.2UR FIGURE 6
o D 10.xl
*' .8 -2 x 10~
0 s -1.0
eC,, S s 1.07' n .2- .e Hel 2
/ aPERFUSION TflM CONSTANT - 6 SEC
0 0'0 100 200 300 460) 56 0 12. 5 3 50Seconds
1.4 FIGURE 7 I.4 FIGURE 8
PT PT
D 2 x1 D 2 x 10⁻⁵
0Nz 26 HZ e 1.3.0 Sim3.0
23 1 2-Z. 2 S2 -5.0
2 /.-. PERFUSION TIME CONSTANT - 60 SEC 2 1 EFSO IECNTN 0S2: AXIAL DIFFUSION WITH SOLUBILITY SERFUBIONITY DFECSON LYa60S
/.1 DIFFERENCES SOUIIY..FRNCSOL0 t- I I 0 fI-
o 250 500 750 1000 0 250 500 750 1000Seconds Seconds
-30-

Fig. Schematic of two Krogh cylinders, the top indicating a highvelocity of flow relative to the bottom. Arrow enteringindicates a concentration of dissolved gas ofl, and arrowleaving is shaded accoraing to degree of transport to tissuein transit through the inner tube. On lower diagram, a slowerflow (indicated by a shorter arrow) on the left is accordinglymore depleted of gas as it exits on the right,
Fig. 5. Supersaturation in model shown in Fig. 4 when only diffusiondifferences are considered, that is, solubility partitioncoefficients are similar for each gas. Abscissa is length ofKrogh cylinder, and ordinate-As saturation fraction. Noticethat when switching from nitrogen saturation to heliumi-thereis an initial undersaturation and then an oversaturation alongthe length of the tissue cylinder. By the same token, thereverse switch should provide first an oversaturation, thenan undersaturation of a similar degree. The helium concentra-tion line is a flatter slope along length of the tissue cylin-der because of its more rapid diffusion.
Fig. 6. Time plot of situation shown in Fig. 5. Initial lag in bothsupersaturation and apparent increase in concentration inblood leaving the cylinder is due to the diffusion effectcoupled with a very short perfusion time constant. The phys-iological relevance of this-model is questionable.
Fig. 7. Same flow model as in Fig. 8; however, diffusion is taken -intoaccount in this situation. Very little difference is shownbecause solubility differences are sufficiently extreme (model-
.4 led after fat/water solubilities) to be responsible for mostof the supersaturation, whereas despite a three-fold differencein diffusion coefficient, little effect is seen because ofrelatively long perfusion time constant of 60 secs.
Fig. 8. Same Krogh tissue cylinder shown in Fig. 4 modelled according.to solubility differences only where diffusion constants ofeach gas are considered similar. Flow is set to give a 60-secperfusion time constant and plot is in the time domain. Noticedegree of supersaturation due only to solubility differences,not to diffusion.
-31-o

10-minute time congtant. Notice also the relatively slight differencein PT between a 60-second and 600-second time constant, with the 10-minute time constant producing a proportionately greater duration ofsupersaturation.
This is important relative to experimental information we haveaccumulated. Figure 13 conveniently summarizes this relationship witha composite plot of PT for 3, 6, 60, and 606 second tissues. It showsthe proportionately shorter duration Df supersaturation relative toperfusion time constant for faster flows. Figure 14 plots Pma" as a,function of perfusion time constant on a log scale to illustrate thispoint. This indicates a decreasing exponential relationship betweenmaximum supersaturation and the perfusion time constant. In otherwords, only the very well-perfused tissues can produce the highestsupersaturations.
It is clear that taking into account some reasonable values forthe blood tissue partition coefficients of helium and nitrogen, thatis, 1.2 for helium and 2 for nitrogen, also tends to prolong the periodof supersaturation. These values of N2 solubility are taken fromestimates of an approximate nitrogen capacity in the body of 20-22 ml/kg(Groom 1967).
Notice particularly that the very high supersaturations requirealmost ridiculously short perfusion time constants for the Krogh cylin-der; this raises the question as to their-physiological reality andprovides an argument against the importance of diffusion-dependent timeconstants in producing isobaric supersaturation in the microcirculation.Further and more important support comes from our experimental results.
Figures 15 through 18 show results illustrating bubble productionafter gas switches from nitrogen saturation to helium at 66, 100, 132,165, and 198 fsw and saturation times of 2, 4, 8, and 17 hours. Notethat these are all transient effecti and cannot necessarily be comparedto the original observations of Blenkarn, Aquadro, Hills,and Saltzman(1971) and Idicula (1975).
In addition, the results of two gas switches from nitrogen to crudeneon on the one hand and crude neon to helium on the other are alsoshown (Fig. 19). These are of particular value and interest in relationto the predictions in Table 1. One notices in these results a highdegree of variability in bubble count and time; however, it is quiteclear that when exposure time is reduced to 2 hours, the number ofbubbles decreases markedly, suggesting that the major time conistants ofthe body (which are involved in the bubbles we detect) are saturated atless than four hours and involve half-times of approximately 40-60:min-utes.
Figures 15 and 16 show linear plots of bubble counts against timeafter gas switches at 66-99, 132, 165, and 198 fsw. It is clear thatreliably large numbers of bubbles do not occur until 165 fsw and 198 fsw,though again variability is considerable.
-32-

FIGURE 9 FIGURE 1014(4-
1.2 - 1.2
.D 6.0OxO 10 .8-.Dl '6.0 x J0)5
a/D 2 x10 .0D m2x 10-3.6- N 2 2He S -1.2 !Nz 1-.24 ; 1 24 He//S 2 -2.0 01 S1.
.2 - 2 2 .,,PEFSION TDME CONSTANT - 3 SEC .2- 1 1 EFSO IECNTN E
OEF PEFSONTf NTN - 6 SE
0 6 12 18 25 .0 12 25 -7 0SecondsSeconds'
IA_ .FIGURE 11 IA4 FIGURE 1:2
1.2 1.2-
1.0- PAMB .- ----- PAM$
5
.6- / D 2 2x10- 0 He.. D- - 2 x10 -
S, n 1.2 . S1 w 1.2.4 1. A4 I/ r. s2 a 52.02 of ". S 2 2.0I', PERFUSION TflE CONSTANT - 60 SEC I! PERFUSION TDM CONSTANT - 600 SEC
0.1 .. 0Vf I0 125 250 375 500 0 1000 2000 3000 40O00
Seconds' Seconds
600 3 FIGURE 13 18FIGURE 14
1.2-
60 Z
.6-.
.1.01 5 10 50 100 500 000
0 r ime -33 Log of Prfusion Time Constant

Fig. 9. Very fast perfusion time constant modelled according to dif-fusion differences and'more physiologic solubility ratios of1.2 for helium and 2 for nitrogen, that is, the tissue toblood solubility ratio for each gas. Notice maximum super-,saturation pressure of 1.567 x ambient pressure together withconsiderable lag in helium/nItrogen kinetics.
Fig. 10. Slightly slower perfusion time constant of 6 sec showing astill elevated PT and a still considerable lag before PTrises.
Fig. 11. A perfusion time constant of 60 sec with same parameters asin Fig. 10. Notice much less extreme supersaturation pressureas well as much shorter lag relative to perfusion time con-stant.
Fig. 12. Same conditions as in previous three figures, with a 600-secperfusion time constant.- Notice again a not much decreasedsupersaturation pressure relative to a 60-sec time constantbut a rather more protracted supersaturation time relative toperfusion time constant of 60 sec, i.e., 10 minutes.
Fig. 13. Composite plot of previous .4 figures showing supersaturationpressure only relative to fractional superposition of timeconstant (abscissa). Notice, for the diffusion-relatedextreme supersaturations, both an increased lag relative tothe time constant and a shorter duration relative to the timeconstant, compared with-a longer perfusion time constant tis-sue of 60 and 600 seconds.
Fig. 14. Plot of data in Fig. 13, with Pmax fraction of ambient plottedagainst log of perfusion time constant, showing how maximumsupersaturation pressure asymptotes as perfusion time constantincreases,
-34-
' - ' ' . _ I L ! , ... . . .. .... ...
79-83 - ,10S1O7O 17 W Solf !ITW So o NfAtW
NZ to He
t.. . t to. o ,
S I 2 3 4 5 6 "' ,S 10, I' I S 2 3 4 5
~0079-102SpoIoO17hr SOt
t-aoo- 99 t.sw.NZ lo Fe
io-
I I I S 0 -I
S 1tc 2 3..4 5 9 10 11 MC 13 I
000- "" O 79-17179-171 DiobloCrackerjock 17 hi SotI7hr Sat 132 fiw
100 132 ts. *o. NZ to He: N14 to He ,
A- , o.0- 10
1-
l ala 101112Switch 1 2 3 4 5 6 7 S 1 11 113wtc 2 3 4 S 6 7 1 It
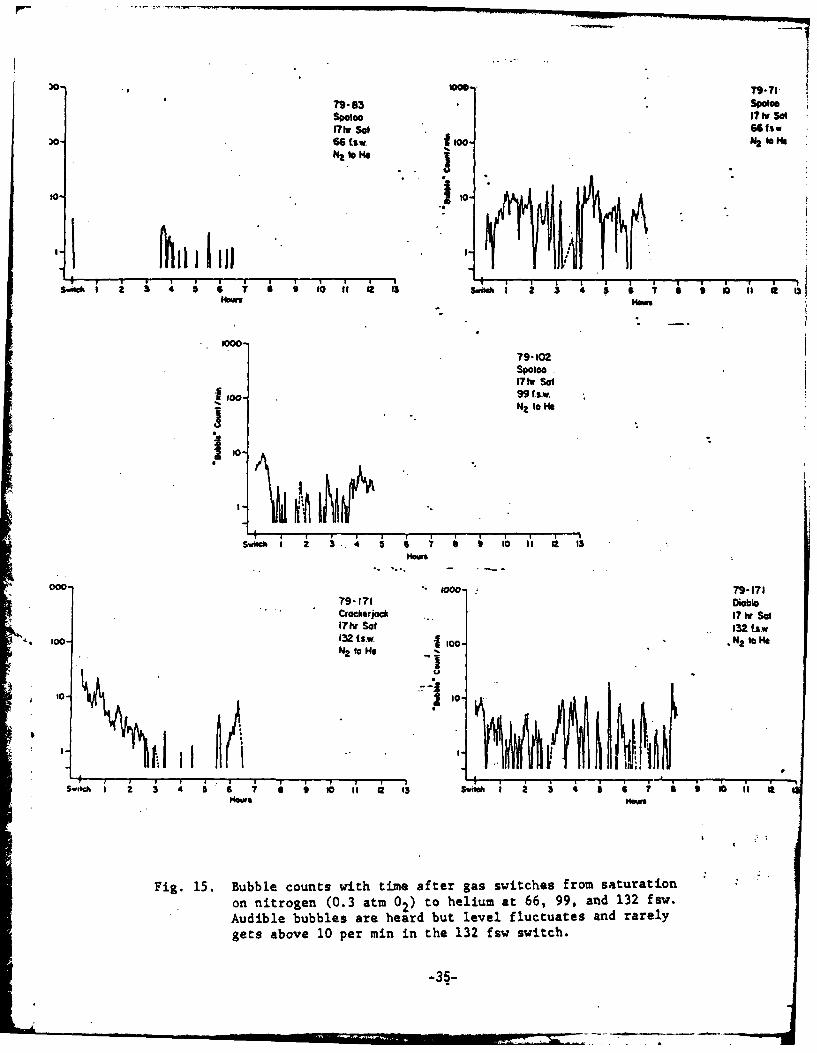
Fig. 15. Bubble counts with time after gas switches from saturationon nitrogen (0.3 atm 02) to helium at 66, 99, and 132 fsw.Audible bubbles are heard but level fluctuates and rarelygets above 10 per min in the 132 fsw switch.
-35-

Dibl
100 7S-186
* 165 tax-100 N2 10 He
Switch 1 2 3 4 5 6 ? S C t0 11 12 t3
IHow
II1000- ?9 -186
Kerneal17tw Sal165 (S.W.
1 o- N to. He
Swt I 2
Nooo
Fig. 16. Bubble counts with time plotted for a gas switch at 165 fsw.Notice level frequently rises above 100 bubbles per minute.
-36-

This depth was then chosen to "titrate" saturation time prior tothe switch. Although a matrix approach would be preferable, tige andfunding limits preclude using such an approach. These results areshown in Fig. 17, in which saturation times of 8, 4, and 2 hours are-compared at a depth of 165 fsw. A 4-hour saturation time appears to beindistinguishable from an 8-hour saturation time, whereas a 2-hoursaturation gives markedly fewer-bubbles. Itowever, these data obviouslypossess only limited accuracy for comparisoi. More statistically com-plete experiments are necessary.
A word about our bubble counting procedures is necessary. Thebubble counter used has been previously described ( Haugen and Belcher1976). The output from the counter is monitored by a Wang computer andrecorded and stored on tape, which is then used to plot the averagebubble counts per minute against time on an X-Y plotter. A runningmean-smoothing program is used to damp the oscillations observed.Figure 18 compares a direct minute-by-minute plot with the smoohingprogram., which averages over seven consecutive counts and plots themean at the time of the middle count to show the degree of smoothingwhich can arbitrarily be accomplished. The small error (=5 minutes)in time which this allows is unimportant relative to the time framesof the record.
By far the most interesting results of this work are the three gasswitches shown at the top of Table 1. Both nitrogen to neon and neonto helium switches (Fig. 19) were carried*out at 198 fsw. It is very.interesting that the maximum pressure ratios predicted by the diffusion-limited scheme (see the table in Table 1) are 1.1 (14 fsw) for nitrogento neon and 1.3 (56 fsw) for neon tohelium. By contrast the perfusion-limited situation predicts 1.28 (52 fsw) for the nitrogen to neon and0.94, i.e., undersaturation, for neon to helium. Remember these arebased on best estimates of A, the tissue/blood partition coefficient.It is therefore extremely infirigting that on the neon to helium switch,almost no bubbles were heard (Fig. 19), suggesting that the perfusion-
*. dependent model is by far the most important one in predicting thebubbles we see. Up until the present time, we have perhaps been sub-consciously assuming that diffusion differences are the major factorin determining bubble formation. Thus, it is more probably the kolu-bility ratios or more properly the ratio of the solubility-dependentpartition coefficients of gases 1 and 2 which In the transient situa-tion are important in producing the bubbles we detect by Doppler, andprobably are also the major mechanism in the steady-state situation aswell. We intend to continue these swi, hing combinations according tothe switches outlined in Table 1. Particular attention will be paid tothe neon to hydrogen switch, which also indicates an 6ndersaturation,and which Peter Edel and I hope to carry out next year.
The full significance of these experiments cannot yet be estimatedand requires finer analysis of a number of different combinations ofgases before some choices can be made between the importance of thediffusion vs. perfusion-related time constant. However, Fig. 20 pre-sents some past experiments relevant in this regard. Two transientgas switch experiments with a pig are presented, and it is apparent
-37-
b00--coo_ 9-. 3
79-236 B-d-2KernoI $01etySet165 Liw to NZ IO N
goN o t O
Switch 1 3 4Milckh I 2 3 4 5 • 7 • t o 'a
79-237 0" 9-2EbonyCA4 hr Sol4Or "5165 tsw 165 fSj
JO0- NZ to Ie io0. N2 S
Switch 1 2 3 4 5 6 7 8 9 10 11 12 13 swithI 2 3 4 5 • T i s I I,,Hews Hours
3o.- 79-242 79-242
Ebony Buddy2W, St 2hr Sot165 .65fsw
Do- N? to HO C foo- NZ (2hrz) so
W" . . . " .4 5-1S~mtiml 23 4 5 5 t I1 SSudi Z 345S7aall
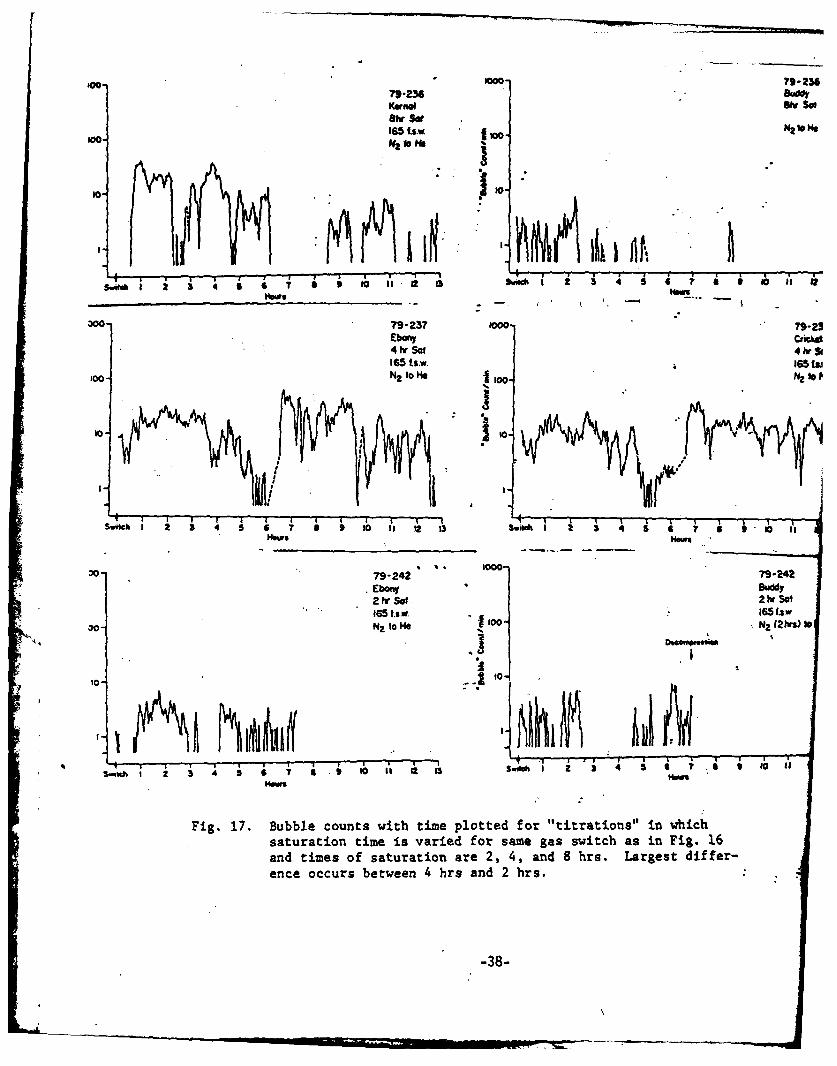
Fig. 17. Bubble counts with time plotted for "titrations" in whichsaturation time is varied for same gas switch as in Fig. 16and times of saturation are 2, 4, and 8 hrs. Largest differ-ence occurs between 4 hrs and 2 hrs.
-38-

0o- 79-229 low0 ?
CrIcbs Ebony8tv SoI ee Sol165 fsw 165 fsw
0-NZ 10 He too. NZ o Me
'o--to-
I Suwul 2 3 4 3 "ow i S momI 3Sud 7 S S I I 1
10007- 229
Ioo
Swuich 1 2 3 4 5 6 7 9 9 to 11 12 13
100..- 79-229
to °o %.
m.ows
Fig. 18. Difference in variability when plotted on an individual basisminute by minute compared to a running mean of seven consecu-tive samples with time of the middle plotted. Considerablesmoothing results when plotted in this way, whether or not theseven samples are weighted or even, top and bottom, respective-ly.
-39-
.... -,--L r W , ,1 t&- ". -;, --

o-79-.!73 5000
NOW 79178
iT hr Sot Kersul
98 tsw . 17 Iv SolN2 to N 100N. 1919 Law
NZ to No
o I I I
Sw5hI 2 3 4 1 6 7 11 9 ti0 I'I 12 3 switch 1 2 3 4 5 6 7 1 0 If as 1Hour ms
00 79-252 5000-Kunol .17-252
Kaheao Ebonay17 hr SOt ... hrt So
198 f .1 I Sf t""€ NIo ts
00. No to O to- No to He
50- -. 50-
Switc 1 4 3 t i a ""
Switch 1 2 3 4 5 7 1 10 I 2 13 6. 57
Fig. 19. Comparison of two switches; top, N2 to Ne, which caused a con-
siderable number of bubbles in both animals; bottom, Ne to lie,
which caused no bubbles compared to number shown in top switch.
Also note that these gas switches were carried out at 198 fsw.
Decompression revealed few bubbles, so that one cannot conclude
that none were present after the switch.
-40-

I000
??- .055Pig Swuitdt132 I..w.
I . -U2 10 He
S l 2 3 4 S 6 7 S 1 to i- M 0
77-11
Pig Swilch132.t1~w
NZ to He
swc '1 2 3' " 6 '7 r • ,
- - -. -- - -. N -.
nO0 77-278
Goal SSIC Swi ch
100.
S.fI I 2 5 4 5 6 7 9 10 i
Fig. 20. Comparison of three gas switches, two on a pig with a centralvenous Doppler bubble detector after a transient gas switchat 132 fsw and one on a goat where only the breathing gas waschanged. Note variability in pig experiments, which highlyresembles the ini~la1 part of the goat experiment. On theother hand, the later part of goat experiment shows much moreregular patterns, with an apparent hourly period.
-41-

that the duration and number of bubbles are greatly increased over thosewhich have been seen in the goat. In view of the additional fat contentin the pig and its greater gas content, this result fits very well. Notonly could there be some tissues where the actual reservoir of gas isgreater than in the goat but these same tissues might also be likely toexhibit a much higher value for the tissue-to-blood partition coeffi-cients.
It is also noteworthy that the variability in bubble count withtime in both pig gas switches resembles the initial part of the plot-inthe goat experiment; however, in-the goat this was a breathing gas switchonly, which was therefore approaching the steady state. Equally inter-esting is the fact that the latter part of the goat experiment showed adifferent quality of bubble count with time, characterized by a highsustained count for approximately 50 minutes and then decreasing sharp-ly for a shorter period. This may reflect vascular "prograifni g," whichwas able to clear out skin-related bubbles.
What then is the mechanism of bubble formation in the experimentswe have done so far? Both the theoretical analysis and the resultspresented allow the conclusion that the mechanism of supersaturationresponsible for the bubbles we observe by Doppler ultrasound at thecentral venous location depends primarily on the blood partition ratiosof the saturating and desaturating gases. This is additional support,but support of a new and different nature, for the classical perfusion-dependent model (Kety 1951) used in diving, and it provides no supportat all for a diffusion-dependent mechanism. This conclusion is consis-tent both with the analysis presented initially, in which it was shownthat the effects of diffusion which are accessible to the capillary canonly be exerted for very fast perfusion time constants and with theestimates of PT presented in Table 1, which indicate undersaturationwith the neon to helium gas switch. Further, both the magnitude- anddirection of the error involved in our approximation of the diffusion-dependent time constant strengthen "ather than weaken this argument.
Finally, the critical supersaturations for bubbles formed in themicrocirculation would appear to be over 25 but under 52 fsw, or very,
a ,very near the original AP suggested-empirically by Haldane. This hasnow been supported even further by results of our studies of decompres-sion in salmonids (Beyer, D'Aoust,:.'Smith, and Casillas 1978; D'Aoust,Smith, Swanson, White, Stayton, and Moore 1979). However, at highpressures, other factors may have to be considered, since empiricallycritical AP values have been demonstrated to change with depth (Hennessyand Hempleman, 1977; Hennessy,. 1978)'
-42-
Acknowledgments
We are grateful to Roland White, Dick Dunford, Andy Majevski,Maureen Vaughn and Jerry Mahoney for tkilled assistance in experimentalaspects of this work. in particular,..Jerry Mahoney spent many hoursperforming data analysis to produce Figs. 15 - 20. The typing'andeditorial expertise of Ms. Ginny Schaffer are also much appreciated.
This work was supported by ONR Contract #N00014-78-C-0749 andNHLBl Grants #HL 22406 and H HL 17503-.
-43-

References
Behnke, A.A. and T.L. Wilimon. 1941. Gaseous nitrogen and heliumelimination from the body during rest and exercise. Am. J. Physiol.131:619-638.
Beyer, D.L., B.G. D'Aoust, L.S. Smith, and . Casillas. 1978. Decom-pression and isobaric supersaturation in fluid-breathing vertebrates:Timed response via bio-assay, hematology, and ultrasonic bubbledetection. In: C.W. Shilling and M.W. Beckett, eds. UnderwaterPhysiology VI. Proceedings of the Sixth Symposium on UnderwaterPhysiology. Bethesda: Federation of American Societies for Experi-mental Biology.
Blenkarn, G.D., C. Aquadro, B.A. Hilli, and H.A. Saltzman, 1971,Urticaria following the sequential breathing of various inert .gasesat a constant ambient pressure of seven atmospheres. A possiblemanifestation of gas induced osmosis. Aerosp. Med. 42:141.
Buehlmann, A.A. 1975. Decompression theory: Swiss practice. In: ThePhysiology and Medicine of Diving and Compressed Air Work. P.B.Bennett and D.H. Elliott, eds. "London: Bailliere-Tindall.
D'Aoust, E.G., H. Seibold, and R. White. 1975. Direct measurement oftotal dissolved gas pressure. Undersea Biomed. Res. 2:146.
4i D'Aoust, B.G., K.H. Smith, H.T. Swanson, R. White, C. Harvey, W.L.Hunter, T.S. Neuman, and R.F. Goad. 1977. Venous gas bubbles:Production by transient deep isobaric counterdiffusion of heliumagainst nitrogen. Science 197:889-891.
D'Aoust, B.G. 1980. VMRC's-daea relevant to current assumptions usedin USN decompression calculation. In:T.E. Berghage, ed. Decompres-sion theory.. The Seventeenth Undersea Medical Society Workshop 29WS(DT) 6-25-80. Bethesda: Undersea Medical Society.
D'Aoust, B.G., K.H. Smith, H.T. Swanson, R. White, L. Stayton, andJ. Moore. 1979. Prolonged bubble production by transient isobaric.counterequilibration of helium against nitrogen. Undersea Biomed.Res. 6:109-125.
Graves, D.J., J. Idicula, C.J. Lambertsen, and J.A. Quinn. 1973.Bubble formation resulting from counterdiffusion supersaturation:A possible explanation for inert gas "urticaria'3 and "vertigo."Phys. Med. Biol. 18:356-364.
Groom, A.C., R. Morin, and L.E. Farhi. 1967. Determination of dissolvedN2 in blood and investigation of N2 washout from the body. J. Appl.Physiol. 23:706-712.
-44-

Harvey, C.A., and C.J. Lambertsen. 1978. Deep tissue isobaric inertgas exchange: Predictions during normoxic helium, neon, and nitrogenbreathing at 1200 fsw. In: C.W. Shilling and M.W. Beckett, ads.Underwater Physiology VI. Proceedings of the Sixth Symposium onUnderwater Physiology. Bethesda: Federation of American Societiesfor Experimental Biology.
Haugen, D.P., and .E.O. Belcher. 1976. Hyperbaric decompression bloodflow monitoring. Final Report. N0001-69-C-0402. Appl. PhysicsLab., University of Washington. APL U.W. 7609.
Hennessy, T.F., and H.V. Hempleman. 1977. An examinatiou of the criticalreleased volume concept in decompression sickness. Proc. R. Soc.Lond. B. 197:299-313.
Hennessy, T.F. 1978. On the role of-gas-induced countertransportmechanics at high pressure. J. Med. Aeronaut. Spat. Med. 17(65):122.
Hills, B.A. 1977. Supersaturation by counterperfusion and diffusion ofgases. J. Appl. Physiol.: Respirat. Environ. Exercise Physiol. 42:758-760.
Kety, S. 1951. The theory and applications of the exchange of inertgas at the lungs and tissues. Pharmacql. Rev. 3:1-41.
Krogh, A. 1919. The number and distribution of capillaries inmuscles with calculations of the oxygen pressure head necessary for.supplying tissue. J. Physiol. Lond. 52:409-415.
Lambertsen, C.J., and J. Idicula. 1975. A new gas lesion syndrome-inman induced by "isobaric gas..counterdiffusion." J. Appl. Physiol.39:434-443.
* Morales, M., atidR.E. Smith. 1948. ..On the theory of blood-tissue ex-* change of inert gases. VI. Validity of approximate uptake expres-
sions. Bull. Math. Biophys. 10:191-200.
Roughton, F.J.W. 1952. Diffusion and chemical reaction velocity incylindrical and spherical systemi of physiological interest. Proc.R. Soc. Lond. B 140:203-229.
Tepper, R.S., E.N. Lightfoot, A. Baz, and E.H. Lanphier. 1979.. Inertgas transport in the microcirculation: Risk of isobaric sujersatura-tion. 3. Appl. Physiol.: Respirat. Environ. Extrcise Physiol.46(6):1157-1163.
Winsey, H.S., and J. Folkman, 1967. Silicon rubber: Oxygen, carbondioxide and nitrous oxide measurement in gas mixtures. Science157:203.
-45-

Discussion
Q. Does the upper curve in Figs. 15-20 represent the difference betweenthe two lower curves?
A. No, the sum. These switches are nitrogen desaturating and heliumwashing in, but they have been plotted as if both are washing in,which permits-comparison of the time course of each gas. To get thetotal, they should be added at th& same time. For looking at thetime constants of the gases, this method of plotting is much moreconvenient.
Let me run through a series of these quickly now (Figs. 15-20).Remember, these are extreme solubility ratios that almost certainlydo not apply in vivo, so this is-an extreme case, but it does showthe difference (remember we have a different time scale no*) in thetime form of this supersaturation and the effect which the solubilitydifferences would have upon it. With diffusion limitations, it isvery brief compared to the time here.
We looked at a number of these, to make diffusion limiting, andoptimized the maximum supersaturation. We are looking at 4 maximumsupersaturation of 0.57 times ambient. The perfusion time constantyou need for that is 3 seconds. The flows are so extreme that wewould be stripping intimal cells off the capillary. Notice (Fig. )what happens when you allow for a slower perfusion time constant,and also notice these are more reasonable tissue-to-blood partitioncoefficients now. We have the 9'ame relative coefficients for heliumand nitrogen, but different solubility ratios. And again at 6 sec-onds, total pressure comes down a bit. Sixty-second perfusion timeconstant; that means the Krogh cylinder's ratio of capacity to flowgives you that time to e1fge the total volume of it. Notice weare getting protracted but lower supersaturations and this protrac-tion increases more. However, it reauires a more reasonable phys-iological time constant. Don't -ask z to tell you what tissue thisis.
* Q. Kidney?
A. And perhaps some muscle, heart muscle (which is bad analogy). Nowhere (Fig. ) the time constants are overlaid -- 3 seconds, 6, 60,600. And this shows the effect on the time of maximum supersatura-tion pressure relative to the perfusion time constant. This indicatesthat if you really want to go for high supersa.turation pressure, youhave to get impossibly fast perfusion time constants, in this partic-ular model.
Where does that leave us? I wanted most to talk about the realworld and our experiments. These figures (Figs. 15-20) show thekind of saturation we have been allowing. We are making overly surethe animal is saturated. At 66 fsw we can say there are virtuallyno bubbles. By overemphasizing the noisy part of the trace, we are
-46-

being conservitive, which means when we get a high count it is
more reliable relative to the signal-to-noise ratio, which is stilla problem. Anybody who has used Doppler realizes that. We aretaking steps to get more reliable counting but we do not have it yet.
So let's go through this quickly. At 66 fsw apparently thereis not sufficient delta P (-AP) there, pomewhat under an atmosphere.Perhaps occupationally this could be said to be a safe switch atsaturation with these two gases. One-hundred fsw gives a similarpicture. We have done more diveb than you see here at each level.At 132 fsv, we are starting to get levels higher than you can countwith your ear, but we still have periods when there are no bubbles.Notice how long this continues: this is a transient switch, so ul-timately the bubbles have to go away. There are plots that do notcontinue so long, to subject the goats to the same regime. Most ofthese switches have the bubbles cleared out by 12 hours.
Q. Let me be sure I understand these figures (Figs. 15-20). You've
got the animal saturated on nitrogen?
A. Yes, and it is 0.3 atmospheres of oxygen.
Q. At 132 fsw. And all of a sudden you can put the entire animal intohelium?
A. Yes, we layered the helium on top. It takes about 5 minutes at themost. We end up with a residual concentration of N2 of the orderof 1-2% of nitrogen.
Q. Then you leave the goat there the whole time?
A. The isobaric period is all the second gas, that's right.
Q. So the rest of the dive or experiment is on this helium atmosphere?
A. That's correct.
Q. Why just bubble numbers?
A. These are bubble counts per minute. I used to plot single countsand they showed the same thing'. We.-have left a little "token" zeropoint here (Figs. - ) because, in fact, there are periods whenthe bubble counter does not count any bubbles and when you do nothear bubbles. I think it gives a better impression of what isphysiologically happening. It is very easy to tidy this up, but Ithink it allows you too many liberties with the meaning of thesedata.
I will go on with the next pressure, 132 fsw. We have a sus-picion there is a tremendous amount of difference in these animals..We have the impression also that these bubbles (Fig. ) are form-ing at the inner surface of a vessel or capillaries and are beingcollected by perhaps a critical flow, or sheer, and are therefore
-,'7-

collected according to the perfusion of that compartment, whichvaries. There is a pattern that seems to suggest that anxiety onthe part of the animal makes a lot of difference to what we see.We are getting ready now to try to take some through-the-chambersamples with the catheter to determine what different catecholaminelevels can do to this. At 165 fsw we get a much higher rate ofbubbles. One-hundred ninety-eight fsw is the deepest we have gone,and we have shown a lot of data on that.
These are now plots (Figs. .- ) of minute-by-minute bubblecounts smoothed by a computer pr6gram that simply takes every Vand computes the middle one.as the mean time and smoothes accord-ing to the mean 7 counts and weights according to a normal distri-bution. If you do not do that you get a far more noisy lookingplot. The next thing we wanted to do was titrate the time.
Q. The 165 fsw experiment interests-me because this is the naturaldepth point at which many tables change to air from helium andthe solution to the problem arising at the switch was to make thechange much more slowly. You say you took 5 minutes; have you everdone an experiment with 15 or 20 minutes to make the change?
A. That is another form of titration and, of course, adding any vari-able geometrically increa'ses't.he matrix of experiments and it justtakes time. We have not done thst yet. What we are trying to dois to evaluate an optimal depth and -his seems to be it, so thisis the one we have started to titrati the time at.
Q. "Optimal" means you make the most bubbles?
A. Yes, reliably. But I think we will make more bubbles if we Justkeep going deeper. 1 would not want to go where we got a reliablylevel plot or even something like the 198-fsw experiments, becauseI think we would be missing aspects of variability that often can
*. give us a clue that will short'n this process, which is very timeconsuming. For example, this point about catecholamines; when wefirst did this switching technique, we found about as many bubblesat 132 fsw of the switch with these same kinds of animals -- theyare different individuals but I have no reason to think they are
*basically different. We got the same number of bubbles at 132 fsythen as we do at 198 fsw now with this technique of layering, whichis much less noisy, more gentle, and just as efficient. We haveevery reason to believe from looking at the animals that are awakethat they were much more anxious with the noise. Our accountantsupstairs got upset with it, so you can imagine what the animalsfelt like. I have been in there during. one switch, and it was verynoisy the old way.
Q. Do the animals move around, kick?
A. They are restrained. They can move their feet, they can move upand down.
Q. Do they move when you make the switch?
-48-
A. No, not now. They used to.* Now they are very quiet. You can seethe gas discontinuity come down. They sometimes shake their headswhich makes you suspect there are some middle ear or vestibularhappenings. But that's very brief and we have never had any indi-cation that an animal was bent. (Though how you tell that I wishI knew.)
Let me go on with the titration of time. This is 17 hours(Fig. ). We regard this kind of plot as not too different fromthis, although subjectively, when you listen to it, it is quitedifferent. We simply do not have the automatic counting techniqueoptimized yet, so I cannot say that if we took Spencer's "bubblegrade" and had a sheet with time on it and had an observer listen-ing and grading 1, 2, 3, 4, we would have a much cleaner plot. ButI have confidence that we are improving this technique and we canalways go over these tapes and redo them when we get a betterlogarithm. You will see a tantalizing periodicity here that mayor may not mean something. The other picture (Fig. ) of thattype of response we have from a steady-state situation with thisanimal, the only one we have done where the animal was surroundedby one gas and breathing another. So at 8 hours we see what wemust regard as essentially the same picture, or at lease we cannotstatistically tell it is different from listening to the bubblecount. And at 4 hours, a: similar picture. We have bbviogsly beenwasting a lot of time on this one. And at 2 hours, we definitelysee things change, i.e., decrease. So I do assume that what weare seeing is the major time constant, by which I mean bulk of gas.I think we are seeing the major time constant saturated at around3 to 4 hours. That makes it around 40 minutes, which if you lookat a goat and a man is probabl3' not too unreasonable. I do notknow if anybody has accurately measured skeletal muscle time con-stants at exercise, but I am sure that is what we are looking at.Here is another 2-hour saturation. I think we have pretty wellestablished that 2 hourd'iB"too short. Four hours might be adequateif we can find one exposure and one depth to work with for theseother types of experiments that Dr. Bennett suggested and which wewould like to do. At the present time there is so much variabilitywe are not sure. This is just an illustration of what happens ifwe plot a moment-by-moment couUt as compared to a smoothing'proce-dure.
Q. You're talking about a transient phenomenon. On the other hand,since your data are going out to 12 hours, that does not seem likea transient phenomenon. Conceivably is it possible that you havegot a mixed effect of some sort here?
A. I think it is possible but unlikely. The fact that we have 1%nitrogen or 2% residual means there could not be any steady state.I think there are probably several things going on here, differentmechanisms of bubble formation, as we showed with the diffusionmodel. You ought to get some bubbles right away, fast, but wherethey are going to be and whether you are going to see them, I donot know. And since in our analysis the supersaturation went downand then up, that logically must be interpreted to mean that the

reverse switch would also make bubbles or make supersaturation.
Q. Have you done the reverse experiment?
A. Not yet, but we shall.
Q. Did you follow this out far.enough to pee if it went down to zero?
A. In many cases the bubbles stop by 12 hours.
Q. I mean it is transient in the sense that eventually the bubblesmust go away.
A. Eventually they have to stop, and as some of you heard me reportbefore, when we first did two pigs that were awake and rather large(about 300 lbs.), after the goat-work, they just kept bubbling afterthe 12 hours. We thought we should wait to see how long they wouldlast. The longest time was 48 hours. They did start to wane, andwe rationalized that since a pig has a lot of fat and a lot moregas in it and was a bigger animal, the bubbles lasted longer. Wealso wondered whether we were looking at bubbles. We thought wemight be looking at some dots or thrombi, which led to experimentsin which we medicated the goats with antiplatelet drugs, and thatturned up something else new. So we came back and regrouped, try-ing to concentrate on first things first, which is the biophysicalside of it, the time constant and the-degree of supersaturation.We have shown that the time constant we are thinking about is around40 minutes. A 4-hour saturation is necessary and at least 130 to132 fsw. We now realize, however, that the collection process israther protracted.
Q. Aren't you actually mixing two phenomena, since you are switchingthe entire chamber?
A. No, this has got to be transient.
Q. The animals are both inspiring and being externally exposed.
A. And nitrogen will eventually be completely eliminated down to what-ever ambient level in the chamber. So how can we be mixing twophenomena?
Q. You are getting a transient, which is your deep tissue.
A. Logically it is one switch. In terms of the actual mechanismsgoing on (this is what I tried to allude to) there are severaldifferent ones. Initially there is going to be a skin effect, butit is initial only in contrast to Dr. Lambertsen's steady-statesituation, where it is the chronic situation.
Q. True, but I don't see how you can separate the two because you havea superficial initial isobaric effect, and I do not know how youcan distinguish which one was the transient.
-50-k

A. Well, I*am looking at the goat as a "blob" of tissue per se andsome of everything we collect comes from the skin initially, al-though I think that's rather minor because the gas level comesdown rapidly and is biphasic, according to Dr. Young's analysis.The gradient there would be a gradient of nitrogen out from theskin and some bubbles that perhaps may never get collected. Basic-ally, I agree with you.
Q. Transient experiments leave helium diffusing against nitrogensuperfically, and the same effect is caused by the respired gas,.and I do not think you can tell which is producing the bubbles.
A. Transient is the key word. The gradients are transient, whatevertheir direction. That is the difference. Yes, we are probablymixing a number of phenomena, but the way I prefer to look at it istransient vs. a steady state. Now the steady-state situation mixesa transient with a steady state, but it builds up to an equilibriumor a constant situation.
Q. But you do not know that the so-called 40 minute time constant isnot the 40 minute time constant it would take until somebody starteditching?
A. No, I do not, but I believe that is contrary to clinical ekperience.I believe your itching is rather soon, is it not? 15 minutes? Upto 40? Well, I cannot argue with the. point now except to say thateventually those gradients have to dissipate, and that is the reallogical difference in this case.
Q. I think it comes down to the question: where are bubbles generatedand which are you at risk from?
A. I would be happy if it came.down to just that question. I think wehave said you are not at risk from a switch at less than 60 or 100fsw. I think the bubbles we are seeing come from everywhere.
Q. Is there any reason why you cannot just change the inspired gas orthe surroundings so that you could at least say which?
A. That is coming. We have done one experiment of that sort. We ardjust beginning to do the next half of this project, which was tocompare the steady state vs. the transient situation.
Q. Did you ever notice any dermal lesions, or in the experizqents thatwere done at New London with humans, was itching.noticed in thatcase?
A. Yes, Claude Harvey noticed itching. I think it was at the 100 fsw.They did not wait to find out if the itching was transient. Alsoone subject reported something that looked like a knee bend, althogghit was somewhat vague. They compressed one more atmosphere to treatthe knee bend and the itching became worse, even though they com-pressed on helium. This suggests that whatever was causing the
-51-
itching perhaps had not reached equilibrium by that time and theadded pressure still added more gas to the bubbles than it reducedthem in volume.
Q. Saturated on nitrogen and then switched to helium?
A. Yes. The divers were all in gas-tight exposure suits in nitrogen.First they were in the chamber overnight. Then they wore the suits,the helium was brought into the chamber, and they just stepped outof the suits. So they accomplished the same thing that we do, onlyprobably faster. That was a fairly fast gas switch. But the log-ical distinction I am making is the situation where gradients mustdissipate vs. the situation where they reach a steady state.
Q. I noticed that your dramatic changes occurred in 2 hours. Therewas an interruption. Now I wonder if that has anything to do withother bubble formation mechanisms like nucleation, for instance.You also mentioned that later on you used platelet anticoagulants.Have you ever considered coagulants or anticoagulants? Hagemanfactor is a contact factor, and Newton Harvey showed that it wasdependent on lipids in glass tubes, etc. So what do you think ofthe effect of nucleation as another mechanism?
A, You mean actual nuclei that are in the blood? Or stationary? Ithink something like that has to be the explanation of the bubbleswe see. The long, protracted appearance of these bubbles givesyou the idea of looking at a beer glass. It is constantly bubblingfrom one point. If it was nuclei, we have to keep regeneratingthem somehow because the nucleus is gone. So this is why the modelwe chose theoretically does not distinguish between the inside ofthe capillary and the tissue.
Q. I think 'it is a mistake "to-say you have to keep regenerating nucleito keep regenerating bubbles. **As soon as you form a macroscopicbubble, it will probably produce rosaries, etc., the kind of thingthat Albano has talked about. You may have a gas phase trapped inthe tissue. The tissue deformation pressure prevents it from. ex-panding in that place, but gas.-keeps leaking out of that region anddiffusing into that region from the tissue. In other words, bubblesonce formed can produce lots o -bubbles.
A. That is the mechanism I think we have in order to get a physicalanalog, because I think that is what is troubling us all. I do notthink that is a viable explanation for this. But if it vas justextravascular or extracapillary, is there a mechanism? You haveto bud off a bubble that is bigger to get a lower pressure. If youdo one smaller, you require a higher pressure. And how do you getit when you have already passed the peak of supersaturation?
Q. In these sections that Albano has made he sees strings of bubbles,-which apparently originate at a site which is an original. Inother words, nucleation theory is relevant to the formation of thatprimary bubble. Once you have those primary bubbles, then you can
-52-
. .= w ,,, ,, ~pm • : .. . .. " .. .... a'•
bubble continuously until all the supersaturation is relieved.Way back in the 30's, Becker and Douring and other investigators --
even Vulgarea -- studied the formation of primary nucleation. Nowthe probability of bubble formation generated spontaneously is verylow, as I think Placid and other people have shown. But there isstill the possibility that other substances like dirt started itoff.
A. I agree with that completely. I.think it is facetious to call aplatelet dirt or an intimal cell dirt, but physically, f thinkthis is reasonable. Let me answer one query you had. We did doan experiment where we medicated the animal with antiplatelet drugs -anturane, persantine, and aspirin, and we wanted to follow this up,but not until we had a clearer idea of the time constants that weare generally dealing with. The remarkable thing about that wasthe kind of plot we got after a -witch at 198 fsw -- the gpatsstopped eating when we switched to helium, perhaps because theydid not smell because of the helium. I think they lost their appe-tite. So we can assume they had only a 3-hour dose of the drugs.But what we got here was the clearest phasic increase in bubblecount with the least variability we had ever seen.. I got very ex-cited about this. I wanted to pursue it, but there are some bio-physical factors we have to look at first because we are studyingthe transients involved and we need to get at these basic limits.But this was very, very clear and rather immediate. It was as ifthis picture is clouded by some sort"of stickiness. The bubbleshangup in capillaries, perhaps. There is perhaps a mechanism tohold them there and with those.Orugs everything seemed to slidealong a little better and so we got the kind of peak we thought weshould get. So that kind of medication may be a tool to try to getat the time constants.
Q. Have you tried aspirin instead of persantine?
A. We tried all three at once to be most sure of an effect, anturane,persantine, and aspirin. We have done only two experiments. Theyboth turned out similarly, but again, with different levels and wehave not done anything more.
Q. I think regarding regenerationbf nuclei there is fairly strongevidence for thinking that this occurs. For example, Newton Harveyyears ago squashed bubbles out of existance and found it very dif-ficult to generate free gas. More recently, Walder took some shrimpsand squashed any potential nuclei out and found it very difficult togive them decompression sickness. But he did:an important furtherstep, which was to wait four hours or thereabouts and they returnedto normal. In other words, you can decompress them and they willfizz. It would seem, therefore, there are gas spaces floatingaround in the tissues.
A. That's the key. In the tissues, and we have to get a mechanism --perhaps what Dr. Yount suggested -- to get that gas into the blood-stream. Because that is all we are seeing or can see with thismethod.
-53-

Q. Most people would agree you could not conceivably move the heart atthe rate it is'moving and past structures like that without someform of embolization occurring. Once you have got nucleipresenta lot of these explanations are not necessary.
A. I agree, once you have the nuclei.
Q. There is a certain attractiveness in assuming there are bubblesalready there, maybe attached to walls.
A. We do not hear them. They are stationary.
Q. Harvey attached them to walls of vessels. It is the wrong part ofthe program, but I was hoping to say there is good evidence forthis.
A. I think that is almost universally accepted. I do not see*.thatwhat I am saying here contradicts that in any way. Maybe my con-ception of what is important is off. But we are dealing with aphenomenon. We are looking at bubbles that are collected. It issome fraction, we hope most, of the total amount of gas emboliza-tion. I want to ask a question. You remember that table I putup (Table 1). Now I want everybody to tell me: we have done twoextra switches that are not nitrogen and helium, One was nitrogento neon and the other was neon to helium. Which one do you think -
gave bubbles? We had saturation on nitrogen and we switched toneon. Neon's diffusion coefficient is about 2.7 to 3 cm2 sec, 5
depending on where you look it up. The other switch was neon tohelium, and all of this is at 03 atmospheres of oxygen and 198 fsw.Which one bubbled? The solubility values for neon are just overthose for helium, at 370C about .009 ml/L/atm. That's a Bunsensolubility coefficient. Helium is 0.006 and nitrogen is about 0.012.
Q. Are those lipid solubilities?
A. Those are aqueous. Here is theN 2 into helium switch. We got alot of bubbles on this. We got no bubbles with the neon to helium.This is the supersaturation predicted on a strictly perfusio.n-limited or solubility-limited s stem. And this is the situationpredicted with the diffusion-limited system. The switch from neonto helium involves a higher diffusion coefficient, according to this
ratio. Yet we got no bubbles on that switch.
This figure (Fig. ), unfortunately, is mislabeled. This isactually nitrogen to neon, and this is nitrogen to neon. on theother animal. Something that has made me thitik about the two sit-uations is this sometimes different bubble counting pattern whichoccurs after a while. In any case, it could have something to dowith "vascular programming."
Now, here is the neon to helium story (Fig. ). I think Iheard what I would call one or two bubbles over 5 or 6 hours. Butthere were a few during decompression. There must have been some
-54-

bubbles there because as soon as decompression was instituted, weheard some bubbles. I should say on these switches when we-decom-press, which is according to a U.S. Navy saturation approach, wehea:- bubbles that do not increase in number at all; in other words,they are indistinguishable from the isobaric periods. So we feelwe are not blowing them up or making any more.
Here then (Fig. ) was the difference in a pig switch whichkept on bubbling in this case to .12 hours because that is when weterminated the experiment. What I am trying to show here is thatin our Krogh cylinder what happens in the tissue may or may not bereflected in what we see with the Doppler.
Q. What is that thing going through the wall of the vessel? Is thata gas bubble?
A. That is what I am supposing and, if you like, rhetorically asking.If all we are seeing is imething that starts here - that is oneway to interpret it -- there is much more tissue than there isvolume of vasculature in action and we have to provide for somemechanism to get this gas into the circulation. Maybe there issome damage associated with this and perhaps it is minor. I am notsure.
Let me continue with this last pig experiment. This isobaricperiod went on for 48 hours.. It increased and it leveled off andmaintained itself. This next figure (Fig. ) shows our only steady-state experiment. But it was done by a tracheostomy, which for agoat has a number of problems. The operation changes brain bloodflow. It changes temperature response. Equilibrium temperature inthe chamber is abnormal because of helium. I do not think it is anormal environment at all. So we have changed our approach and aresimply trying to either baffle the head or use a mask. This is theonly steady-state study we have'done. Notice we have a plot thatlooks much like the other transient switches and then up here wehave this kind of periodicity. I wonder if this is something thatjust reflects vascular programing to some tissue bed? We do notknow if it is significant, but we see it quite often. And of course,once again you have to take my word for it that the bubbles stopped,although it makes sense to assume they would stop. One of thesedays we will do a longer experiment to satisfy the skeptics: we willsimply camp there until the bubbles stop.
-55-

CONTRASTS OF SUPERFICIAL COUNTERDIFFUSION
IN SKIN AND EYE
J. R. M. Cowley.
Two recent papers of mine, which appeared in the Journal of Applled
Physiology (47:224-227, 1979; 47:220-223, 1979), cover attempts to study
isobaric counterdiffusion in the eye of the rabbit and attempts to
measure increases in tissue pressure in the ear during the process. In
my presentation today, I will discuss the information in those papers
and expand upon them briefly.
As has already been noted, in the human counterdiffusion exposures
there were no obvious visual disturbances, nor was there any itching at
the conjunctiva. We decided to investigate this further in animals.
However, even under the most severe counterdiffusion stress, which for
the rabbits turned out to be nitrous oxide breathing while surrounded
with helium at sea level, we were unable to produce measurable gas bubble
formation in either he cornea or the conjunctiva. We were interested
in conducting this type of experiment at higher pressures, but we
couldn't take the rabbits to more than two atmospheres because they die
of nitrous oxide toxicity at greater..pressures. Also, at higher pres-
sures the pulmonary effects in rabbits are much greater than the counter-
diffusion effects.
In the JAP paper on the eye, I included a mathematical model of
counterdiffusion that combines both perfusion-limited and diffusion-
limited models across a slab of tissue. Using this model, we explained
why we didn't see bubbles. We assumed that bubbles were the normal
-56-

state of affairs, and tried to explain their absence.
The model assumes the tissue has a moving slab of blood behind it,
a surface area, a diffusion distance, and a diffusion rate. This
model uses a block instead of a ;ylinder, but is otherwise very similar
to a Krogh cylinder.
Fig. 1 here - slab model
The dynamics of the rabbit's eye are well documented in terms of
thickness and perfusion with aqueous fluid, and for simplicity we assumed
that everything in the eye was aqueous rather than fat. We did:'t, worry
about solubility coefficients, either -- if they play a part, it will
only be to make bubbles come more easily. Theoretically, then, there
would be a supersaturation at the base of the cornea at the corneal-
aqueous fluid surface, which would be less than the intraocular pressure
at sea level using nitrous orlde and helium. Exposing the animal to
5 atmospheres or so would -ause the intraocular pressure to fall to an
insignificant level, at which point it would be possible to generate gas.
It would take about 48 hours to Venerate one milliliter of gas. At the
same time, any small bubbles that were generated would be carried away
in the aqueous drainage. We believe this explains why we didn't see any
bubbles in the eye. On the surface of the eye there would not be any
overpressure -- since the conjunctiva itself has no perfusion, the pres-
sures would be much lower.
In the skin, the same' model would predict that counterdiffusion
would generate a supersaturation and bubbles. We had attempted to
measure this supersaturation by gas analysis several times, without
success, so we decided to measure it directly. We chose the rabbit's
ear because there wouldn't be any question of muscle artifacts, and
-57-
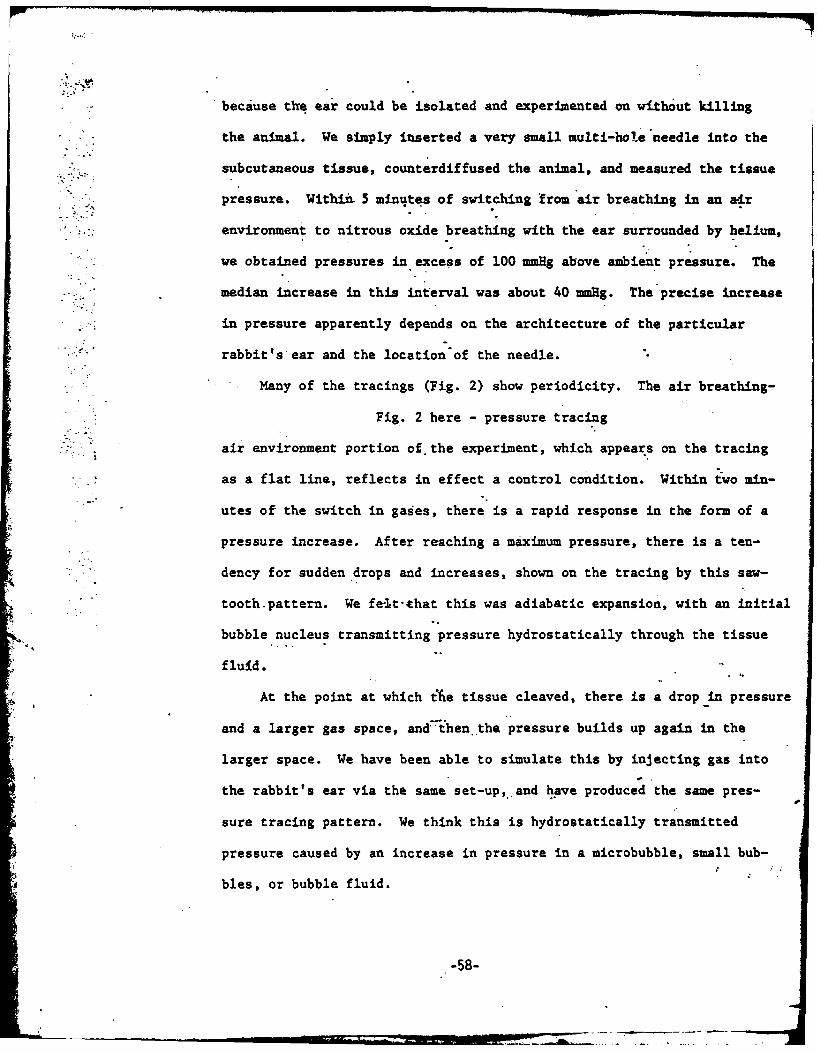
because the ear could be isolated and experimented on without killing
the animal. We simply inserted a very small multi-hole needle into the
subcutaneous tissue, counterdiffused the animal, and measured the tissue
pressure. Withif. 5 minutes of switching from air breathing in an air
environment to nitrous oxide breathing with the ear surrounded by helium,
we obtained pressures in excess of 100 mmHg above ambient pressure. The
median increase in this interval was about 40 mmHg. The precise increase
* .in pressure apparently depends on the architecture of the particular
rabbit's ear and the location of the needle.
Many of the tracings (Fig. 2) show periodicity. The air breathing-
Fig. 2 here - pressure tracing
air environment portion of the experiment, which appears on the tracing
as a flat line, reflects in effect a control condition. Within two min-
utes of the switch in gases, there is a rapid response in the form of a
pressure increase. After reaching a maximum pressure, there is a ten-
dency for sudden drops and increases, shown on the tracing by this saw-
tooth.pattern. We felt.-that this was adiabatic expansion, with an initial
bubble nucleus transmitting pressure hydrostatically through the tissue
fluid.
At the point at which tfie tissue cleaved, there is a drop-in pressure
and a larger gas space, andthen the pressure builds up again in the
larger space. We have been able to simulate this by injecting gas into
the rabbit's ear via the same set-up,, and have produced the same pres-
sure tracing pattern. We think this is hydrostatically transmitted
pressure caused by an increase in pressure in a microbubble, small bub-
bles, or bubble fluid.
-58-

We have for the first time been able to show an actual increase in
tissue pressure of up to 50 mmHg during counterdif fusion. It has been
suggested that the bubble, or gas phase, may have been introduced by
the needle rather than caised by the supersaturation, but since we have
not medicated the animal and have only disrupted it to the extent of.
inserting.; fluid-filled needle into its ear, we feel that is unlikely.
Also, the pressure in the ear tissue of the several rabbits we injected
built up to about 20 mmHg before the first drop in pressure. But this
cleavage pressure varied a great deal depending on where oh the rabbit's
skin surface we injected the needle. It was greatest at the nose and
the tips of the ears, where it reached about 200 mmHg. On rabbits,
these are the only points at which the skin is attached dlosely. It
appears that where the skin is tigh , the gas phase is very small -
there is a correspondence between the size of the gas-phase and the
tissue deformation pressure or cleavage pressure. 'The time interval
between the peaks would range from about 1 to 2 minutes.
To verify some of our fipdings, we created an ear window in the rabbit
by removing the cartilage on 9.ne side of the skin and leaving the other
side of the skin intact, with its blood supply. Then we counterdiffused
the animal. Rabbits have an interesting characteristic: they re' late
Pig. 3 here window set-up
thermally via two mechanisms, panting and changing the blood flow to
their ears. There is a linear correlation between these two phenomena,
as shown in Fig. 4. Despite the physiology textbooks, rabbits do not
Fig. 4 here - temp/resp. rate graph
breathe at 50 breaths a minute. They breathe at a higher rate, but if
-59-

Stainless Steel Stainless SigelLower Rim Upper Rim
PloticDisc
SecuringSeuigcrwNut Pe euigSrw
* (actual size)
HELIUM
Inner Layer Plastic-Skin Disc
Outer Layer Skin Blood VesselsCartilage
HELIUM
Figure 3
-60-

40
35-0
30-
0 100 200 300Fig. 4. RESPIRATORY FREQUENCY (breaths/min)

you give them barbiturates the rate drops to 50 per minute. We tried
in these experiments to use respiratory frequency as an index of the
perfusion of the ear. We counterdiffused 5 rabbits, and their respira-
tory frequencies, which 'vak. naturally, gave us 5 different perfusiob
rates. We then measured the volume of gas released or generated in'.the
7-cm2 ear window area, using a gas-tight syringe, and then we measured
the gas composition of a sample of this gas to obtain the nitrous oxide
to helium ratio (Fig. 5).
Fig. 5 here - expt. results N20/He
Table 1 shows the data for these experiments. The correlation is
Table 1 here - summary table
between breathing rate and rate of gas evolution. We used at least 7
volume measurements to calculate the rate of gas evolution per minute.
These data confirm the rates per square meter of skin surface seen in
the pigs; the order of magnitude is the same for rabbits and pigs.
Our mathematical model would predict, breathing 80% nitrous oxide
while surrounded by helium, a nearly linear relation between the ratio
of nitrous oxide to helium and the perfusion (Fig. 6). If the experi-
Fig. 6 here - math predictions
mental data (Fig. 5) are compared to the model's predictions, they
show a similarly shaped hump-backed curve for the gas evolution rate,
and an almost linear relation between the nitrous-oxide/helium ratio
and the respiratory rate.
This series of experiments was interesting because, without doing
any gas analysis, we were able to confirm directly that counterdi.ffusion,.
produces an increase in tissue pressure.
-62-
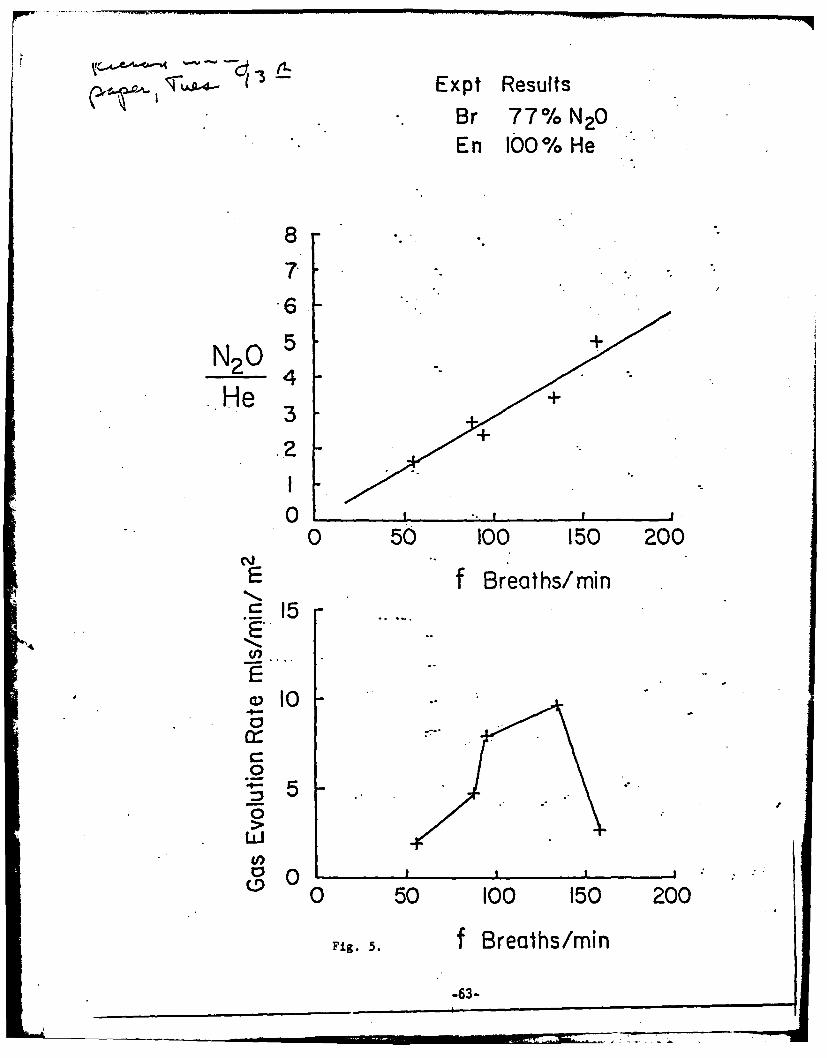
.-., - --~ Expt ResultsBr 77% N20En 100% He
8
.
N2 0
He 3
.2
00 50 100 150 200
NE f Breaths/minS 15E-
1I04 .7"0
4 5 e -"0"
0
0 50 100 150 200
Fig. 5. f Breaths/min
-63-

Br 80% NZ0I~'1 En 100% He
4-
N20He 2
00 4.- 8 12.. 16 20
E
E 3
(n
.0
0:
0 4 8 12 16 20
Perfusion mls/cm2-/sec X I0-Figure 6
-64-
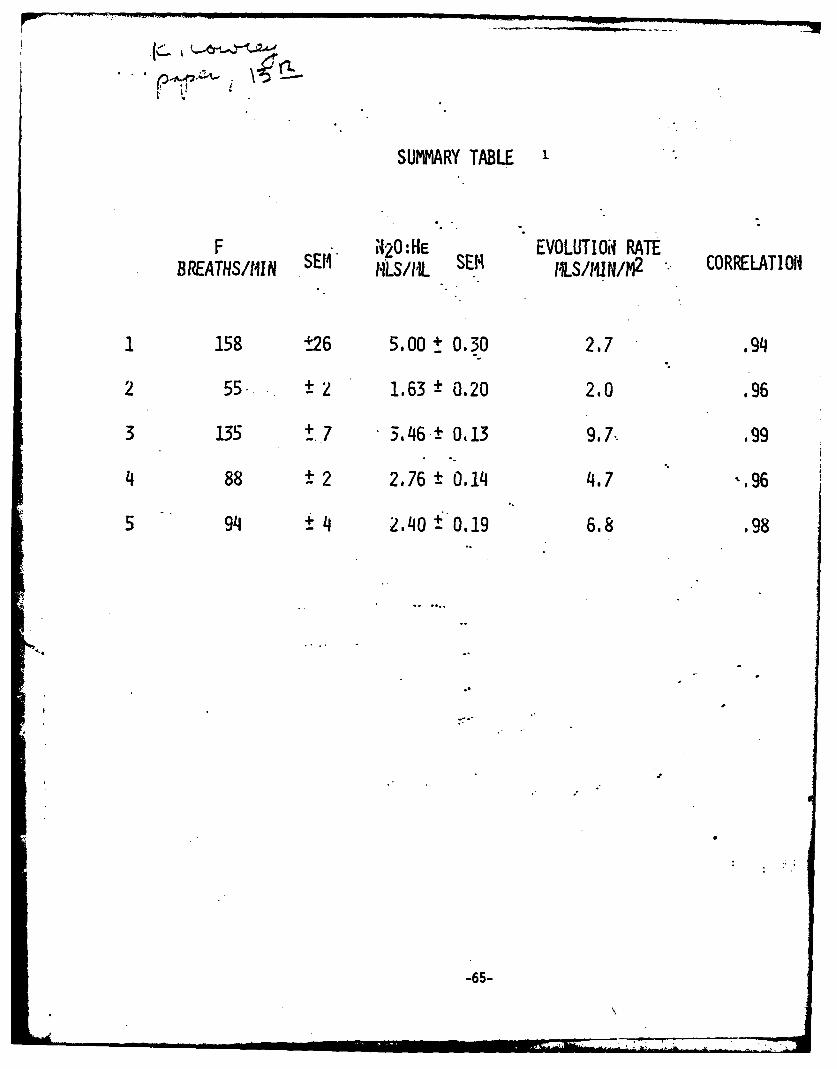
SUMMARY TABLE '
F 420 :HE EVOLUTIOd RATEBREATHS/t1IN SEM ALS/ML SEM IILS/IU N/M2 CORRELATION
1 158 t26 5.00 t 0.30 2.7 .94
2 55. 2 1.63 ± 0.20 2.0 .96
3 135 + 7 3.46.± 0.13 9.7.. .99
4 88 -2 2.76 0.14 4.7 -. 96
5 94 -4 2,40 f0.19 6.8 .98
-65-
N7 "

Discussion
Q. Have you attempted to measure the cleavage pressure after in-
Jecting fluid instead of gas?
A. We have not done that experilsent yet..
Q. Is this bubble formation self-contained, i.e., limited to the
skin, or does. the gas get injected into the capillaries? If it
does get into the capillary, you would expect to see, after a
long experiment, some hematological evidence of endothelial
damage.
A. It may be that the hemorrhagic skin lesions seen in the pig
counterdiffusion experiments correspond to that sort of damage.
Q. Did you see any evidence of bubbles at the central venous locatiou
before gas formation occurs in the skin?
A. You see bubbles building up in the tissue which are palpable. If
you follow the lymphatics you can dissect them. Rabbits have
lymphatic emboli but no venous emboli. They only occur in the
venous system below the point in the vena cava where the lymphatic
system dumps-.-
.-6
-66-
INERT GAS EXCHANGE IN THE MIDDLE EAR *
A. Ranade
I will briefly go over the data for mid'dle ear gas exchange, because
I would like later to present an hypothisis about how that gas exchange
is related to vestibular problems.
The gases in the middle ear provide an external environment for
counterdiffusion to the round window, bnd so our first studies investi-
gated whether the gases in the external canal and the gases in the blood
would provide a sufficient exchange to sustain the required gradient.
We considered a model whose parameters were: geometry of the surface
area of the tympanic membrane; thickness of the tympanic membrane; sur-
face area of the affected mucosal lining of the ear; the effect of
Eustachian tube function; the blood flow through the tympanic membrane;
and thickness across the mucosal lining. We used the ideal gas laws
and made the following assumptions: 1) the volume of the middle ear
cavity remains constant (any changes-due to the effects of positive and
negative pressure would be so small it was safe to ignore them); 2) the
partial pressure inside the tympanic-membrane remained uniform- no
local differences needed to be considered; 3)"the Eustachian tube functions
as an ideal pressure regulator -- as soon as the pressure in the middle
ear rises, the tube will open to vent the pressure, so that the pressure
within the cavity remains constant. Using these assumptions, and para-
meter values from the literature, we looked at how the model behaved
and how its results compared with experimental data.
• This paper is incomplete.
-67-
... ........ -, -,,. 1 ,-l n l . .. . ' '- " ..... 7M-

One of our early experiments involved a tracheostomized cat
breathin, nitrous oxide while it was surrounded by air. The gases
in the middle ear were sampled by a gas sampling syringe. As Fig. 1
shows, the gas uptake curve is nat exponential, which would indicate
PIg. 1 here - N20 uptake x middle ear P
a continuous exchange of nitrous oxide from the middle ear to the
outside through the tympanic membrane. This experiment strongly
suggested that the membrane was significantly permeable to nitrous
oxide, since the nitrous oxide was added to the respiratory tract
below the level of the nasal pharynx and had diffused into the middle
ear through the blood flow in the mucosal lining and perhaps in the
tympanic membrane.
We then did three types of experiments. One type was designed
to study the effect of the gases coming from the mucosal lining by
plugging the tympanic membrane with a dense plug of epoxy to prevent
diffusion across the membrane. To study the membrane effect only, we
would then fill the middle ear cavity with sulfur hexafluoride and put
helium and nitrous oxide or helium and neon in the breathing gas and
determine their uptake into the middle ear cavity. In the early p.art
of these experiments when the gas build-up was so small that the
gradient was not affected, we could observe diffusion across the
tympanic membrane. (We ignored the effect on the mucosal lining in
these experiments.)
-68-
General Discussion - Session I
Dr. Vann: During the discussion today, diffusion between compartments
has been neglected. From the time of Haldane on, people have
assumed that the body is made up df tissues and organs that
have different perfusion rat'es, different exchange rates.
These organs are occasionally next to each other, and when
a concentration difference occurs between adjacent tissues,
there is going to be diffuslon between them, and concentration
differences and perhaps supersaturation will be introduced
into the system.
Dr. Tepper: An experimental example of the situation you've just described
occurs when one is trying to wash out and measure renal blood -
flow with an inert gas .that is Very fat soluble. The gas will
saturate the perirenal fat, which will diffuse in and be measured
as part of the washout, skewing the data significantly.
There are also real differences between the chromatographic
and a totally perfusion-limited model; the predictions about
supersaturation made with-the two models are completely dif-
ferent. In the chromatographic model, theoretically, inert
gas switches can produce -supersaturations in aqueous tissues,
which cannot be done in the perfusion-limited model.
Jumping from phenomenology to a model again, if we can
invent a diffusion mechanism, a chromatographic mechanism, to
increase supersaturations over those we'd predict with a
perfusion-limited model, how do we account for the time delay-*
we see when the bubbles get back to the central venous location?
-69-
We must either assume that those bubbles were waiting to be
picked up, or were formed relatively recently. How does this
supersaturation have the supreme leisure to wait around for
8 hours before becoming manifest?
Discussant: Perhaps the opening and closing of pre-capillary sphincter.
valves, which accounts for the stop-start rather than continuous
flow of blood through the capillaries, plays a role in the
supersaturation time lag. Vascular tone, and active vascular
reactions, might explain a lot of the variation Ve. see.
Discussant: Yes; for example, the helium may come in and occupy what was
previously a nitrogen bubble, slightly expanding it. When the
circulation opens up again and the nitrogen comes back in, the
helium would of course diffuse out while the nitrogen diffuses
in. This might initially appear to be simplya back-and-forth
situation, but in fact when the nitrogen diffuses back in, it
is greeted. by a larger surface area in which to diffuse. So
there is a conftriidus sort of rectified diffusion occurring,
with the bubble getting bigger and bigger. At some point,
presumably, it will block the circulation, at which time it
will have nitrogen at the blood end and helium at' the ot1her
end. It is a highly unstable situation; it just continues
to expand until the partial pressures in the bubble are equal
to the partial pressures of the gases diffusing in, which can
never happen. Therefore the bubble just bleeps out through
the venous end.
-70-
Dr. Karreman: Another concept that will become more important as time
goes on, I think, is that of cooperative phenomena, such as
those that operate'-in blood coagulation.
Discussant: Are there data on the-time lags involved in Dr..Cowley's
experiments? .
Dr. Cowley: Yes; for the intact, undrugged animals I showed you, there
was a mean time lag to the beginning of generating a steady-
state gas phase of 50 minutes, plus or minus a standard error
of 20 minutes. A second group of animals pretreated with
10 milligrams of valium, intramuscularly, showed a time lag
of 248 minutes with an SE of 24 minutes. We were'thus able to
exert the beginning of pharmacological control over the process.
In rabbits, the drug apparently interfered with temperature
control; in fact, it dropped the perfusion rate in the rabbit's
ears. If we could lower the perfusion rate of the skin it
might be possible to remove divers from the range of emboliza-
tion. It might be easy to do by just cooling them.
Dr. D'Aoust: It is important to remember that solubility is temperature,
dependent.
Dr. Flynn: Wasn't the combination of valium and nitrous oxide inhalation.
a potent cardiovascular.depressant?
Dr. Cowley: No; the rabbits were still walking "round and kicking, even
though their ear temperatures had dropped by 7 degrees C.
Dr. Flynn: What kind of rabbits were these?
Ir. Cowley: New Zealand Whites.
-71-
= ' ,, n n nnn n ln r 'nT- ii-• . .. . . ... -
Discussant.: Dr. D'Aoust, what would you predict if you saturated your
goats with helium and then switched them to nitrogen?
Dr. D'Aoust: I would predict an undersaturation, and Keller and Buehlmann's
work demonstrates it. I would now predict it on the basis of the
ratio of blood-tissue solubilities rather than on the diffusion
coefficients' ratio, which we used in earlier publications.
Peter Edel has shown that contrary to expectations, hydrogen
is between helium and nitrogen with respect to decompression.
We will be doing a hydrogen switch to confirm this."
Discussant: Dr. D'Aoust, what happened when you went from helium satura-
tion, with goats, to a nitrogen or neon atmosphere?
Dr. D'Aoust: No isobaric phenomena happened, because we changed both9°
the breathing and the environmental gas at the same time, in
the middle of the decompression.
Dr. Lambertsen: Here at the Institute, we had several different kinds of
isobaric phenomena occurring either sequentially or simul-
taneously. For ixakple, our subjects were saturated with
nitrogen at the beginning of the experiment, and then were
switched to helium. Then they were saturated with helium and
changed to neon; later, they were breathing neon while sur-
rounded by helium, which means there were three different
isobaric phenomena in one set of experiments. This needs to
be looked at in relation to the earlier, discussion that
saturation on helium followed by a switch to nitrogen causes
vestibular problems.
Discussant: Perhaps we ought to stop switching gases toward the later
steges of decompression, since we have seen such a high
-72-
perqentage of cases of inner ear decompression sickness after
the switch. However, these inner ear cases might still be
counterdiffusion phenomena, because there is a fluid reservoir
in the inner ear.that is saturated with. helium, and the diver
then goes to a nitrogen environment. The diver's skin is sur-
rounded by nitrogen, and he is breathing nitrogen, but in the
inner ear compartment, the blood carrying nitrogen is coming
into this helium reservoir.
Dr. Lambertsen: There is definitely the potential for a counterdiffusion
episode in these vestibular cases, but it still might be a
form of decompression sickness. We have at least ruled out
one factor: a decrease in pressure. These divers were either
at 1200 fsw or in decompression. But it's difficult to jin-
point where the counterdiffusion lesion is: in the vasculature
of the inner ear, the fluid compartments of the inner ear, or
whether it is caused by endolymphatic hydrops. It. is also
difficult to relate these occurrences to Dr. D'Aoust's experi-
ments.
Dr. Flynn: Also, there were no vestibular problems on the nitrogen..
exposures down to 460 fsw, but after a helium dive, there were
vestibular problems at 150 faw. Further, even after a day of
exposure to helium at 400 fsw and a sudden switch to nitrogen
breathing, the only problems were cutaneous ones.
Dr. Lambertsen: True, and once the divers were at 1200 fsw and exposed
to a denser gas, they did have vestibular problems in 3 out
of 4 cases.
-73-

Discussant: Didn't'that only occur in neon, or on an exposure right
after a neon interval?
Dr. Lambertsen: To our knowledge, this is the only episode of its type
that has occurred with, no change in pressure.
Discussant: There was a similar event.involving xenon as an anesthetic,
which was followed postoperatively by vestibular derangemert.
That was also an isobaric situation.
Dr. Hempleman: I noticed in one of your examples that using SF6 as the
breathing gas caused no bubbling at all in the circumstances
you've experimented with.
Dr. Lambertsen: We expected to see a problem with SF6 , but we didn't;
perhaps the situation was hidden, or masked, or perhaps the
symptoms were just too insignificant to be noticeable.
Dr. Yount: If there is anything to Cowley's results with the eye, and
the prediction of the volume of gas released, the overpressure
with SF6 should.be high. The total volume of gas produced,
because SF6 has sucF" i"low solubility, would be similar to
that for nitrogen, raher than a high volume as with nitrous
oxide, which would be consistent with a low solubility in.
water.
Discussant: Yes, but the fat solubility of SF6 is Very large; however,
the fact that it has low solubility in water fits with the
superficial situation.
Discussant: How do we explain the situation in which the diver with
decompression sickness is recompressed on air and complains
that the pressure is making his pain worse?
Discussant: Oxygen is an inert gas until it is metabolized; in some
-74-

situations where there is a near-zero level of'metabolism in
the tissues involved, we would expect oxygen to act that way.
Examples are fluids that have no circulation: the aqueous
humor of the eye, and Verhaps the-inner ear fluid. Oxygen
may behave as an inert gas in the inner ear fluid.
Discussant: To what extent do you think that the rate of embolization of
nitrous oxide might have been artificially high due to emboli
coming up the vena cava and picking up nitrous oxide?
Dr. Bennett: That's difficult to answer because the time required. for
a bubble to grow and reach near-equilibrium with the blood is
not very long; with very tiny bubbles, the time may be only
seconds. We have tried 'to measure the rate of equilibration
with tonometers by injecting a bubble and then serially
analyzing it, and it is simply impossible to catch it before
equilibrium has essentially been reached. I would guess
that whatever the bubbles are like when they reach the vena
cave is what they'ri rike further down in the circulation.
However., they might coalesce on the way up, after coming
from different capillaries. But I don't think the individual
gas partial pressure changes.
Discussant: I wonder whether this venous gas embolization is going to be
clinically significant -- for example, in the presence of
cutaneous lesions?
Dr. Lambertsen: I don't think there is anything to worry about unless
,.here is itching, because there have never been vestibular
problems without severe skin lesions or lesions without severe
-75-
itching; But I do worry about the interactions among these
several phenomena, where, for example, one phenomenon re-
inforces another and makes it serious. These are the things
that have practical Inplications for diving practice.
Dr. Lanphier: I am generally skeptioal about modelling, and I think
it's .important to remember that in the case of bubbling and
decompression sickness, no one has ever tied them together
sufficiently to relate them usefully. It has been said that
capillaries open and close; what happens to the Rougjhen
cylinder when the capillaries close down? Maybe Roughten
intended his tube as a schematic, in which the capillary is
assumed to be in the middle of this very regular tube. But
what if the capillaries are scattered about and shift over
time, so that mathematically the summnation is the same as if
you had a central capillary inside a cylinder? Expressed
differently, if there was a big slab of tissue with capil-laries all over, oje ng and closing so that the shear was
decreasing and enlarging in diameter and moving from place
to place throughout the larger slab, the effect in any one
position with the overlapping of these discs would be, over-
a period of time, that they would all equalize out and could
be summated in a simple mathematical form. Is it possible,
perhaps, that the bubble of decompression sickness is some-
where in an area that has somehow been left out of this
shifting geometrical pattern?
-76-

Discussant.: The problems you raise can be handled either by assuming
that the capillaries are random, or by assigning them a
definite probability distribution. That way, you could
figure out what the equivalent capillary would be, in the
random case. However, I agree with Dr. Tepper that capillary
position is not random, but scattered with & purpose. In the
second case youmentioned, once you have the probability
distribution it is relatively simple to solve the problem.
If, as you suggested, the capillaries are moving, that can
be handled mathematically either by a stochastic approach or
something else.
Dr. Lanphier: It's important to remember that the capillaries are
opening and closing to change the CO2 and P02 , not to~relieve
inert gas. Also, even if the process is random and the exit
concentration is uniform, the local effects are different.
You are probably hitting a boundary region when a capillary
doesn't opl~n;..diffusion probably affects it. It doesn't really
matter if there Is an interaction between perfusion and dif-
fusion if it's an axial or a radial grade in, becausethe
same phenomenon could occur radially, too. Any geometric
relationship that-causes perfusion and diffusion to interact,
whether axially, radially, or square, can produce the same type
of effect. If there was a counterdiffusion system with the
endolymph and the perilymph, it would slow helium washout.
As the nitrogen went around in the perilymph, it would make
a hairpin curve.
-77-
Dr. Farmer: The perilymph and endolymph really don't f-1o like that.
The cochlea is richly supplied with blood vessels all the way
around its turn, so that what is happening in one section
is very similar to what's happening in another. It doeq
not depend on how the perilymph and endolymph flow in relation
to each other.
Dr. D'Aoust: In response to Capt. Bornmann, the evidence obtained by
watching the concentration of venous blood change after
decompression is,-as you say, that the decompression per se
alters the rate of nitrogen elimination, probably by affecting
the vascular progranning; whatever it is, it's apparently
related to.oxygen demand. If you compute two curves, you
get a mixed venous blood desaturation. Assuming thaf-one curve
reflects a normal body desaturation (the one I am talking about
would be just switching to oxygen and watching the nitrogen
come out isobarically), you watch the nitrogen come out after
decompressiAQ.and plot that to the same fractional scale. You
have to accept the conclusion that a lot of nitrogen is left
in the system. If you compute that nitrogen, on the average,
again, and thinking of the body as one compartment, you will
get enormous supersaturations.. Since we know that bubbles
form at supersaturations well below these, we are forced to
assume that these bubbles do affect the caillary flow, and
probably whole groups of capillaries, and probably whole org
parts. That is consistent with the data one gets looking at
mixed venous blood. You will get about 10 microliters of
-78-
. -. , • , i ' . . ... .. :... ... ' ,. . . .• -.OT .

nitrogen per cubic centimeter of blood; if you breathe oxygen
suddenly, that figure will drop to 1 or 2 cubic centimeters,
and if you decompress to 60 fsw, in goat and dog data that will
drop almost to the ambient level or to 10% of capacity. It
is as if you are recirculating blood without picking up any
tissue. nitrogen. This -its 'in with earlier comments that
decompression is a real stress on this normal vascular program-
ming, whatever controls it.
Dr. Hempleman: We tend to lose sight of the fact that in liquids mnd in
blood, nothing will happen unless there is a nucleus. It is
therefore profitless to pursue mechanisms that will produce
supersaturations of negligible proportions anyway, compared
with the atmospheres necessary to break liquids. It is the
nuclei that are important (and they only seem to occur in
blood). In endless experiments, the first bubbles seen are
vascular. Most of us believe, I think, that the bubbles in
both decompression sickness and counterdiffusion are vascular.
Dr. Flynn: If you •assume that there is a certain distribution of radii
of these gas nuclei in order to recruit any significant number,
it might be necessary to have a certain supersaturation before
you could begin to expand any of them. But according to Dr.
Yount's model, it would need to be a relatively large nucleus
that would expand with the minimal amount-'of supersaturation.
Dr. Hempleman: In 1972, when the first pictures of the counterdiffused
pig were shown, Keith Miller said to me: one thing that this
shows is that there are plenty of nuclei about and they're
-79-
very easily provoked. I think he was totally correct.
Dr. Yount: I agree with that statement. About models, although I'm a
model builder myself -- the idea is to find a problem to model
that is simple enough so it can be solved. The real world of
capillary beds is too complicated to solve. Also, model
builders only extract the most important features of the real
situation to model; they disregard the details.
What I am interested in about supersaturation mechanisms
is that: 1) supersaturatton is feasible; 2) the amunt of
supersaturation that is feasible is about 30 or 40 percent;
and 3) it usually takes about 20, 30, or 40 minutes to get a
supersaturation, but it can also be quite quick. With this
information, I know what I need to know from the model builders;
I am now ready to make tables or whatever else.
In response to Dr..Hempleman,.I believe there are nuclei
in aqueous media of all types; in the bones or in anything
that has water in..it., it is almost impossible to get rid of
a nucleus. I would therefore expect to see bubble formation
in the vitreous humor, in the skin, almost anywhere, in fact.
I also believe that most*bubble formation occurs in the tissue,
and I invoke the concept"of tissue deformation pressure to
account for what is seen. A bubble growing in tissue will
only grow to a. limited degree, maybe to..5 or 10 microns, at
which point its growth will stop because of deformation
pressure. It may then serve as a site for secondary bubble
formation; Dr. Coi-ley's talk showed that the bubbles stop
-80-
b!
growing at around 15 microns. Thereafter, it sends out one
bubble at a time, which then gets into the bloodstream, where
it can grow indefinitely. There is no tissue deformation
pressure in the blood;-and these Vubbles, of perhaps 100 microns
or larger, can be detected by Doppler or even be seen - but
not i. the tissue, because they are too small there to be
detected.
-81-

SESSION II: ISOBARIC INERT GAS COUNTERDIFFUSION:
Hypotheses and Theory
FkRL~h.j4l', r-A budhgmmm fljJ
83

INITIAL CONCEPTS
D. Graves
When Dr. Idicula of the Institute staff originally contacted me
about the problems-with the skin lesions, Dr. Quinn, who was also in
the Chemical Engineering Department, and I came up with the following
idea. We proposed a model with two layers of material - not necessarily
physically distinct layers, but something that offers resistance to
the transfer of material -- called for convenience layer A and layer B.
Fig. 1 - schematic of model
One gas is diffusing in one direction and another gas in the opposite
direction. In a physiologicalsituation, gas 2 is dissolved in.the blood
and is diffusing outward through the skin, and gas 1 in the surrounding
atmosphere is diffusing in and being carried away by the blood. In the
simplest conceptual terms, if we assuxme that the gas contacts first the
layer that has the least resistance, the drop in partial pressure of
gas 2 will be less steep in thid"layer than it is in the outer layer
and, conversely,.for the other gas the drop is less in the outer layer
than in the inner. If you add the partial pressures of the two, the sum
will exceed the ambient pressure P, which is assumed to be the same on
both sides, and will be at a maximum between these two layers.
In this model, which isn't new, the pressure can be described by
an equation in which the thicknesses of the layers .are'represented by
Axb and 6X, and there are four constants: the permeability for gas I
through layer A and through layer B, and the permeability for gas 2
through layer B and through layer A. Solving this equation will tell
you what the partial pressure at the interface between the two layers
84-

will be. This model makes a number of simplifying assumptions:. that
there are pure gases on the inner side of the layers and that there are
equal pressures; that the permeabilities are constant; and that the flux
of gas is a simple linear relationship given by: flux equals a constant
times the partial .pressure difference, divided by the thickness.
I said before that the gas had to contact the most permeable layer
first in the two-layer sequence. The only thing that is necessary is
for the relative permeabilities to be different for the right membrane
or the right layer. If there are layers with different semi-permeabilities,
they have to be arranged in the proper sequence, i.e., if you don't get
supersaturation with one arrangement, switching the two gases should
produce it. This is an important .and interesting corollary to this
simple model. Also, there is an optimum ratio of the thicknesses of
the two layers that yields the maximum supersaturation or the maximum
amount of dissolved gas in the system.
Fig. 2 - transient situation schematic
The transient situation,..as..Fig. 2 shows,will be the sum of two
exponentials. The total response can be a simple exponential, an
* overshoot which initially goes to a higher total pressure and then comes..
down to a steady state, a decrease brelow the steady state followed by a
return to the steady state, or a sitaation in which the first exponential
starts to come up to the steady state and then the second exponential
takes over, producing a two-humped response. Any of these four tyres
of transient behavior is possible.
Fig. 3 - oil-water membrane
Figure 3 shows the simple experimental device we built to test our
model. We saw bubbles at the interface at a pressure of only one atmos-
phere of helium or nitrogen. We would have achieved an even greater
-85-
'AD-A112 779 UNDERSEA MEDICAL SOCIETY INC BETHESDA MO F/6 13/10ISOBARIC INERT GAS COUNTERDIFFUS!ON.1U)NOV 82 M B KENT N00011N-74-C-0319
UNCLASSIFIED N4L
73mE~EEE

IIW 1 = .5~lI~
1.8
11111125 1I111. I111111.6
-t MICROCOPY RESOLUTION TEST CHART
NATIONAL LURI A OF OANOARL) 'NW A
effect by using helium .and nitrous oxide.
Figure 4 shows a second but similar experiment, using solid, rather
than liquid membranes, such as silicone rubber and ethyl cellulose.
The gases were again nitrogen and helium. The curve represents the
theoretical prediction from the odel, and the circles represent the
experimental data points. The fit is very good; the model seems to
work well for ali-the conditions we'ye tried.
We also looked at what happens in a membrane blood oxygenator
which gets rid of carbon dioxide and perhaps dissolved nitrogen that
may be present in the blood, and which is in contact on the other side
with pure oxygen. We wanted to see whether bubbles formed in the blood
Fig. 5 - blood oxygenator model
oxygenator. We assumed, as Fig. 5 shows, that there was one layer that
had a film of blood with a thickness repre'sentative of the blood flow
rate, and another membrane, usually silicone rubber. Oxygen passed in
one direction, and nitrogen and carbon dioxide moved in the other. In
this situation we identified a second mechanism, which we called exchange
rate supersaturation. Other investigators have called it the single-
layer moddl. It works as follows: there is a resistance - perhaps a
membrane or another physiological structure -- and blood or another fluid
on one side of the resistance, supp.1ying a particular gas, and another
gas on the other side of the resistance. The layer or resistance allows
one gas to penetrate in and be taken up by the blood faster than the
substances dissolved in the blood can pass out in the other direction.
An example of this situation is an air-filled balloon in a helium or
hydrogen atmosphere: the balloon expands because the hydrogen or helium
penetrates into the balloon faster than the air can escape, so there is
-86-

• o-
an increase in the total amount of gas within the system. Our theoretical
results with this model, however, were not exciting (Fig. 5). There was
some supersaturation, and the dashed and solid curves show the maximum
and minimum estimates. Depending on whether you are at the blood entry
into, or exit point from, the oxygenator, there are different degrees
of supersaturation. The maximum-in any situation would be 150 to 200 torrs.
Finally, although counterdiffusion generally has negative effects,
we were able to use it beneficially to produce a comnercial device for
analyzing gases. Figure 6 shows a prototype of this device. A reference
Fig. 6 - measuring device
gas passes through one chamber, and a sample gas flows through the other
chamber. A pressure transducer is-connected to the inner compartment,
so that the pressure you read will indicate the composition of the gas.
The difficulty in design was to devise a technique to make the membranes
extraordinarily thin and yet strong inough to withstand fairly high
pressures. We have done that, and the device measures gases such as
oxygen-nitrogen mixtures, nitrous'oxide, ammonia, ond half a dozen other
gases, with a time constant of 5 seconds. After a gas switch, the meter
changes in about 5 seconds., I'll close with that glimpse of one of the
useful aspects of counterdiffusion.
-87-

Discussion
Q. Would your first model, with the oil-water interface, fit the ear
counterdiffusion situation?
A. No, it fits the skin. It is-important to realize that the skin can
be very thin. The skin should be thought of here as a place. for
many millions of circulatory "and lipid-aqueous locations.
Q. Would you agree that, strictly speaking, only the solid membrane
model is really diffusion-limited2 The oil-water model would have
some micro-circulation, wouldn't it?
A. Yes, that's certainly what the theory would say.
Q. At what pressures will your gas analyzer work?
A. With the nitrogen and helium, we had pressures up to 0.5 atmospheres.
But in other cases I don't think we went over 1 to 200 mmHg.
Q. With the analyzer, does there have to be a different arta of the
membrane or a different thickness for each gas pair?
A. If you want optimum response, the pair of membranes should be set
at the right thickness ratios, and they should be made of the right
materials.' But in practice, one membrane pair would probably do
for several different binary mixtures.
Q. Doesn't this device work on the same principle as one developed by-
Folkman in Boston several years ago?
A. No, that was a transient device, while ours is steady st;.i.
gives you a continuous and accurate record of the composition of
the gas stream.
Q. What were the pressure transducers you used?
A. Ones that are commercially available.
-88-

Q. what is the accuracy of the device?
A. it is within a fewv percent, certainly less than 5 percent.
-89-

MULTIPLE INERT-GAS BUBBLE DISEASE: A REVIEW OF ME THEORY*
David E. Yount
This paper is a review of the theory of multiple inert-gas bubbledisease. The organization is etiolbgical, that is, the two factorsrequired to produce the disease-nuclpation and supersaturation-areconsidered in that order. Although the novel aspects of the theorypertain mainly to supersaturation mechanisms, rather than to nuclea-tion, a discussion of nucleation is appropriate because it can tell uswhat happens when a state of supersaturation is achieved and how muchsupersaturation is required to produce signs and symptoms.
Before dealing with the two main topics, we shall aptempt to definemore precisely several of the terms that will be used. Eirst, we shalldefine. "exogenous gas bubble disease" as a disease syndrome associatedwith the formation, via external causes, of gas bubbles in blood ortissue. Two conditions permit bubble formation in blood or tissue:1) the presence of gas or other nuclei and 2) the existence of a stateof dissolved-gas supersaturation. It follows that "decompression sick-ness" is a form of exogenous gas bubble disease in which a statr ofsupersaturation is achieved by reducing the ambient pressure. Similar- .ly, "multiple inert-gas bubble disease" is a form of exogenous gasbubble disease in which a state of supersaturation is achieved by usingtwo or more inert gases, either sequentially or simultaneously. Anexample of sequential use is the switching of the breathing mixturefrom nitrogen-oxygen to helium-oxygen. An example of simultaneous use*is the breathing of a nitrogen-oxygen mixture by a subject immersed ina helium-oxygen environment.
Decompression sickness arid multiple inert-gas bubble disease differprimarily in the manner in which the state of supersaturation isachieved. Hence, we -can anticipate that much of what is known aboutthe former disease syndrome will be applicable to the latter. Further-more, since compression and decompression frequently involve the use ofmore than one inert gas, it is not uncommon for a critical level'ofsupersaturation to be produced synergistically, i.e., through the simul-taneous action of decompression and .inert gas exchange which separatelymight be harmless.
Nucleation Theory
The relevance of nucleation theory to exogenous gas bubble diseaseis suggested by four ab initio considerations. The first is the -generality of symptoms and the fact that almost any body organ or partcan be affected. Second is the fact that humans consist mainly ofwater. Third, bubble formation is a general property of aqueous media,and fourth, the thresholds for bubble formation in vitro are remarkably.similar to those for the onset of symptoms in vivo.
* In the final report, the figures will be reduced and insertedabove their respective legends, as indicated in the text.
-90-
i i T " =- i-g... ..- ,

Three additional observations suggest that bubble formation isinitiated by stable gas nuclei. The existence of nuclei of some typeis implied by the fact that bubble formation often occurs at super-saturation pressures of the order of one atmosphere, whereas thetheoretical cavitation strength of pure water is more than 1000 atmos-pheres. Stability is implied by the phenomenon of denucleation. Agas filling is indicated by experiments in which samples are denucleat-ed by degassing or by the application of static pressure. Solid orliquid nuclei, being essentially incompressible, would not be affectedby pressurization.
The existence of stable gas nuclei is a scientific paradox. Nucleilarger than about 1 um in radius should float to the surface of astanding liquid, whereas smaller ones should collapse rapidly due tothe surface pressure 2y/r, where y is the surface tension and r is theradius of the liquid-gas interface. 'n the crevice model.(Harv.ey,Barnes, McElroy, Whiteley, Pease, and Cooper 1944), stability is main-tained by using the walls of a gas-filled crevice to support an inter-face that is ordinarily flat. (As the radius r approaches infinity,the surface pressure 2y/r approaches zero.) This mechanism presumablyaccounts for the familiar observation of a series of bubbles formingcontinuously at some point on the inner surface of a drinking glassfilled with a supersaturated liquid, such as beer or champ'agnee Thisprocess may also operate in vivo, for example, in the spaces betweenadjacent cell membranes.
There is by now considerable evidence that the main initiators ofbubble formation in a bulk liquid are spherical gas nuclei stabilizedby an outer shell or skin composed of surface-active molecules (Yount1979a; Yount, Yeung, and Ingle 1979). Such a skin opposes the inwardsurface "tension" 2y/r with an outward skin "compression" 2F/r. Theskin is gas-permeable initially.and during decompression, but it canbecome impermeable if the ambient pressure is increased rapidly by asufficiently large amount. Thus the pores between the skin moleculesclose if the magnitude of the compression is large enough. Bubbleformation occurs whenever the Laplace condition
Pss >-2y/r (1)
is satisfied, i.e., whenever the supersaturation pressure pss exceedsthe surface pressure 2y/r.
The surfactant model is essentially a description of the way nuclearradii respond to changes in ambient pressure. The model predicts thatthere should be a one-to-one correspondence between the parameter rminand the number of bubbles generated by a particular family of pressureschedules. By passing gelatin samples through Nuclepore filters priorto compression, it has recently been demonstrated (Yount, Yeung, andIngle 1979) that rmin is the initial radius of an actual physical
0structure capable of initiating bubble formation in gelatin.
Below about 8 atm, the surfactant model predicts that the family ofpressure schedules which yield a fixed bubble number N will be described
-91-
... k

by a linear relationship between the supersaturation pressure pis andthe initial increase in static pressure Pcrush or, equivalently,
"* between the allowed pressure reduction P1 - P2 and the exposure pres-sure PI:
pis s a Pcrush + b (2a).P1 - 1f2 = €P1 + d (2b)
For compressions larger than about 8 atm, the nuclear skins becomeimpermeable. Impermeability is characterized by a decrease in slopeand by a departure from the linearity predicted by Eqs. 2a and b. Thedecrease in slope occurs because the pressure inside a gas-impermeableskin increases as the radius and volume decrease. The increase ininternal pressure aids the elasticity or compression strength of theskin in resisting further decreases in radius.
The surfactant model is compared with data on bubble fordation ingelatin in Fig. 1 (Yount, Yeung, and Ingle 1979). The qualitativepredictions outlined above are confirmed by these data, and the quanti-tative agreement between the model calculations (dashed lines) and thedata points is excellent.
Fig. 1. Supersaturation pressure Pis versus crushing pressureP8rush for isopleths of constant bubble number N - 0.1, 1, 10,'30,10,- and 200. Dashed curves are predictions of the surfactantnucleation model (from Yount, Yeung, and Ingle 1979).
In Fig. 2, the predictions of the surfactant model are comparedwith a compilation of decompression data for humans (Yount 1979b).Although the available data for humans are highly variable, the simi-larity between these results and the bubble counts in Fig. 1 is
-92-

SATURATION TIME
Prn= Ps5.25 HOURS
E low
z 20 - T x
Pf
Is. Cc)
tPo LQ" TIME
- 15-. N 200
w X N= a30 _.
Dr O N=aIO "
H 1 0
z1 0-- ,
/ a-
. 0 0
05 1- 20
CRUSHING PRESSURE PCRUSH Pm-Po IN :AT.M.
-93-'
remarkable. Again, the qualitative features of the model are confirmed.
Fig. 2. Pressure reduction limits for humans. Below P1 10 ATA,the available data can be summarized by the straight line P1 "1.407 P2 + 0.50 ATA, derived from the compilation of Hennessy andRempleman (1977). At higher pressures, the data fall .well belowthis line and are better described by surfactant nucleation amdelcalculations, such as VP2 (from Yount 1979b).
The fundamental hypothesis that lines of constant effective dose EDare also lines of constant bubble number N has been subjected to adirect test by Watt and Lin (1979), ;who used a perivascular Dopplerprobe to detect gas emboli in the rat posterior vena cava caudad to therenal veins. Their results are plotted in Fig. 3 along with the ED-50points for rats exposed to 6, 12, and 18 atm abs by Berghage, Gomez,Roa, and Everson (1976). As expected, the subsymptomatic line forN ,- 1 measured by Watt and Lin (1979) lies just below the ED-50 pres-sure reductions of Berghage and his co-workers (1976). Furthermore,both data sets agree very well with-surfactant model predictions (solidlines). Finally, it should be noted that the Doppler bubble-detectionthresholds determined by Watt and Lin (1979) for a second dive pdrformed24 - 96 hours after the first exposure are significantly higher thanthose obtained on the first dive. We believe that acclimation of thistype results from a depletion of the reservoir of gas nuclei on previousexposures.
It is evident from the data in Figs. 1, 2, and 3 that the -degree ofsupersaturation required to produce a given bubble.number, effectivedose, or level of incidence is a strong function of the initial com-pression Pcrush or the exposure P1. This observation is particularlyrelevant to multiple inert-gas bubble disease since inert gas manipula-tion permits a state of supersaturation to be induced isobarically,i.e., without compression or decompression. Thus, whereas all of thedata points in Figs. 1, 2, and 3 lie in the pressure region
Pss 1 Pcrush (3a)
-94-

~~~'. ~ ili SK ~ 4~;;*.~-
-N CL C
=Mo IW
>>z M
1!1 u
IVc
*1-
00
CL
.1 0
0 w (
WZ \"*
am.C
a -
0 00
co N co0
(1d.LV) zd-Id NOIJ.fl3 1 38nSS38d

Fig. 3. Pressure reduction thresholds for bubble formation in rats.This comparison of the effective dose data of Berghage, Gomez, Roa,and Everson (1976) with the Doppler bubble detection data of Wattand Lin (1978) suggests that lines of constant effective dose EDare also lines of constant bubble number N, as has been assumed inapplying the surfactant nucleation model to exogenous gas. bubbledisease in rats and humans (from Young 1978).
data obtained isobarically may extend into a different pressure region
Pss ' Perush (3b)~where! wPss I (T - Pamb)max (4)
is the maximum supersaturation where
Pcrush (Pamb - T)max (5)
is the maximum over pressure or crushing pressure, and where T is thedissolved gas tension and Pamb the ambient static pressure.
The pressure region defined by Eq. 3b can also be reached by expo-Sure to high altitude or by using slow compressions or stepped compres-sions which permit a significant rise in the dissolved gas tension Twhile the ambient pressure Pamb is still increasing. For the scheduleshown in Fig. 4, the supersaturation is given by
Pss = Ps - Pf (6)
where ps is the saturation or equilibration pressure and pf is thefinal pressure at which the observations are made. By design, themaximum overpressure Pcrush occurs on the first step and is simply themagnitude of the initial compression.
-96-

o
o LUJ
0 A)Lo N- 0D U
z 4c 0 fro- jcf)l
a -J 0 0C DU rm 0-
~Hmzjn L0
on -J D
Z M'5o 0Jj0;49o
mz 0 C
0 0-.4 V)-
(LAJIV) zd-'d NOIIonflG8 ifSS3 d

Fig. 4. Pressure schedules used to investigate bubble formation inthe region Pss ' Pcrush' The definitions of Pss and Pcrush aresymmetric'in that Pss given'by Eq. 4 is the maximum supersaturationwhile Pcrush in Eq. 5 is the ma*imum overpressure or crushing pres-sure. For-this schedule, the maximum overpressure is achieved onthe first step and is 4.1 atm. The maximum supersaturation is 20.4
* .atm (from experiments by Yount and Yeung).
Our interest in the variables pss and Pcrush is due in part to the.experimpnral observation (Yount and- Strauss 1976) that bubble counts ingelatin depend only upon these pressure differences and not upon theabsolute pressures per se. Furthermore, since Pcrush is determined ina stepped compression by that increment which has the largest over-pressure, any other increments, whether they precede or follow thelargest, will have no effect. These generalizations are confirmed bythe gelatin results plotted in Fig. 5, which were obtained with a classof pressure schedules analogous to that shown in Fig. 4. The measuredpoints extend well into the region defined by Eq. 3b, and over much ofthis region, the dashed lines calculated from nucleation theory (Young1979a) give an accurate description of the data. Satisfactory agreementwith the aberrant points at large pss and at large Pcrush can be obtainedby taking into account the thickness of the nuclear skins.
-98-
po

PS
20-
18-
16- z AZII
12-
0oo
* C
(p r
0
0 46 1 1/16 o iei o r
/ ~RUH (IMB99A

Fig. 5. Supersaturation pressure pss versus crushing pressurePcrush for constant bubble numbers N - 1, 3, 10, 30, 50, 100, 200,and 500. These data demonstrate that the region pss > Pcrush isphysically meaningful and accessible to experiment through the useof stepped compressions such-as that shown in Fig. 4. Over much ofthe new region, dashed lines calculated from the surfactant nuclea-tion model continue to give an accurate description of the data(from experiments by Yount and Yeung).
Fig. 6 is the dive profile used by Lambertsen and Idicula (1975)and their associates to investigate the effects of various respired gasmixtures at ambient helium-oxygen pressures up to 1200 fsw. Clearlythis is a stepped compression. Furthermore, the steps at 400, 700, and900 fsw are of sufficient duration to permit equilibration of the gastension r with the ambient pressure pamb. It follows that Pcrush forthis profile is 400 fsw, rather than 1200 fsw, and hence (from Fig. 2)the allowed supersaturation is only-about half of that which would bepermitted after a continuous rapid compression to 1200 fsw. It is alsoimportant to point out that in a dive of such long duration, the pro-phylactic benefits of a large initial compression may be significantlyattenuated by the in vivo regeneration of gas nuclei during exposure.
The prediction that tire supersaturation tolerance of a subjectshould depend strongly upon compression rate-as well as compressionmagnitude follows directly from nucleation theory and cannot be derivedfrom conventional analyses of inert-gas exchange. The relevance ofnucleation theory to the etiology of gas bubble lesions in the skin andin other tissues exposed to the ambient gas mixture during chamber divesis even more profound. The time required for such tissues to equili-brate with the external gas may be very short. The gas tension T wouldthen follow closely the ambient pressure Pamb, so that the overpressurePcrush would be small--even during a continuous compression. Exposed
-100-

25- ~Nz3+ N=10 b-0 N=30o N=50-* N= 100A N--200 7 :
~20- N N500 ~/
:E~
15~- x i -0.O moo- ,
.04, -0
0 -e -10 .00
eoe # -
400
10 l5 l0p
10-101-

Fig. 6. Dive profile used by Lambertsen and Idicula (1975) to in-vestigate the effects of various respired gas mixtures at ambienthelium-oxygen pressures up to 1200 fsw. The value of Pcrash forthis profile is 400 fsw, rather than 1200 fsw, and hence (from Fig. 2)the allowed supersaturation is only about half of that which wouldbe permitted after a continuous rapid compression to 1200 fsw.
tissues would then have a much lower supersaturation tolerance thandeeper tissues with a longer time constant for gas uptake. This wouldnot be a serious problem during decompression at rates slow enough topermit dissolved gas to exit the faster tissues. However, large super-saturation pressures can be achieved and maintained in exposed tissuesvia the isobaric mechanisms reviewed in the next section. The combina-tion of large supersaturations and small tolerances would make the skinand other exposed tissues particularly vulnerable to multiple inert-gasbubble disease.
Multiple Inert-Gas Supersaturation Theory
1. Deep-tissue or whole-body supersaturation
In 1959, Hannes Keller pointed out the theoretical advantages of ashift from helium to nitrogen during decompression (Tepper, Lightfoot,Baz, and Lanphier 1979). The basic idea is illustrated by the rudi-mentary example shown in Fig. 7 (Yount 1978). Only one tissue compart-ment is involved, and the tissue half-times for two different -inertgases in this compartment are 20 minutes and 40 minutes, respectively.No other gases or vapors are present. The compartment is subjected toa pressure of 4 atm abs for a period of 80 minutes. The faster gas(Fig. 7a) requires a 27-minute decompression, and the slower gas (Fig. 7b)requires a 29-minute decompression. By switching from the faster gas tothe slower gas at the midpoint of the exposure (Fig. 7c)0, the decompres--sion obligation is reduced to zero. In a practical diving table basedon this idea (Keller and Buehlmann 1965), the time to decompress from a120-minute exposure to 130 fsw was 15 minutes. Without inert-gas
-102-

C-
0-
0-04-0
CD0 0
I00
0z 00 0 0
4 r ki 3 V 3 30.
00
013

Fig. 7. Illustration of how inert gas switching can be used to gaina decompression advantage. The faster gas (a) requires a 27--minutedecompression, and the slower gas (b) requires a 29-minute decom-pression. By switching from the faster gas to the slower gas at themidpoint of the exposure (c), the decompression obligation isreduced to zero (from Yount 1978).
switching, 210 minutes would have been required.
The ratio of the tissue half-. times between nitrogen and heliumt isassumed by Keller and Buehlmann (1945) to be 2.65. For a diffusion-limited system, this result can be derived from Fick's law
-ADS(Ap/Ax) (7)
where 4 is the flux or the diffusion rate for a gas with diffusion co-efficient D and solubility S in the barrier material. The area of thebarrier is A, its thickness is Ax, ifid the pressure drop across thebarrier is Ap. The ratio Ap/Ax is referred to as the pressure gradient.
Since the diffusion coefficient D is inversely proportional to thesquare root of the molecular weight of the gas, the fluax (4) is propor-tional to the solubility and inversely proportional: to the square r ,ootof the molecular weight. Similarly, the rate at which a materialsaturates is proportional to 4/S, the rate at which gas enters dividedby the quantity of gas that the material can contain. Assuming thatthe solubilities for the barrier and for the material being saturatedare the same, then the "saturation speed" is independent of the solu-bility and inversely proportional to the square root of the molecularweight. The ratio of the "solubility speeds" for N2 and He is
-104-

4 I 20 MINUTE HALF-TIME% 27 MINUTE DECOMPRESSION
3 - Ole
LUJ
01(n)
Wi 4 40 MINUTE HALF-TIMEct 29 MINUTE DECOMPRESSION
b. (1) 2 -sW~
zo
w~4 INERT GAS SWITCHING
IMMEDIATE DECOMPRESSION
C')LdX. 2
0 10
0 20 40 6080 100 120 14060180.
TIME IN MINUTE
-105- -7
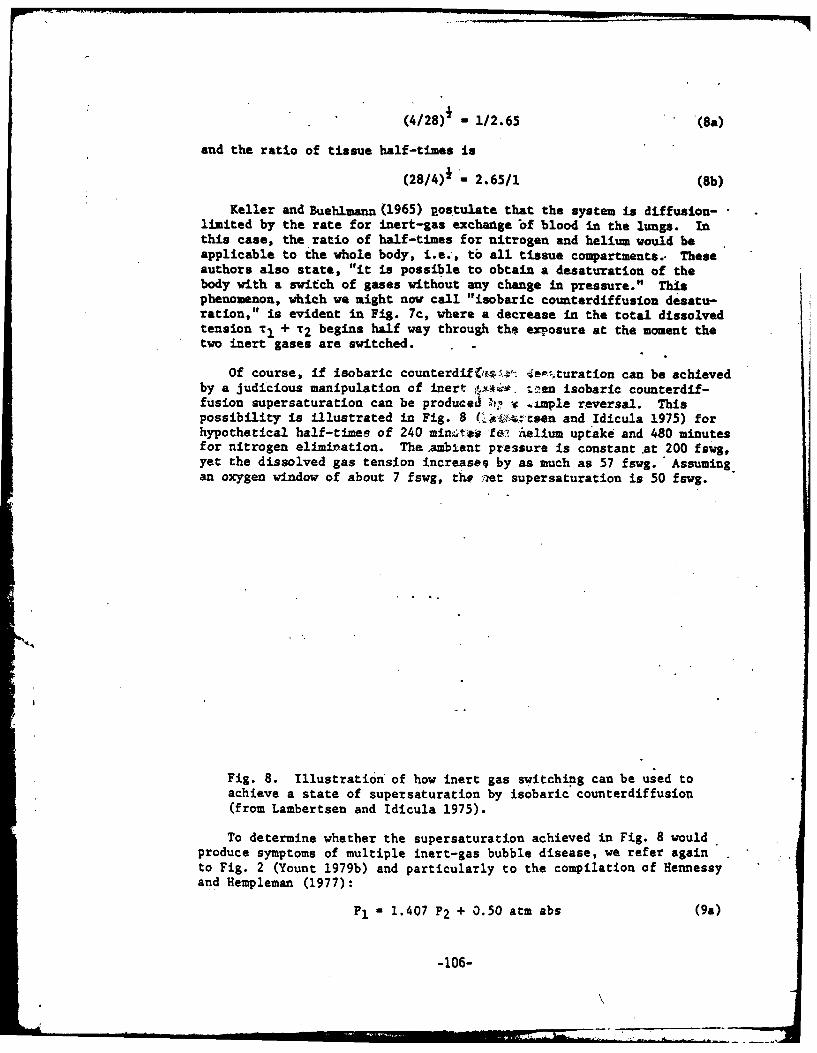
(4/28) - 1/2.65 (8a)
and the ratio of tissue half-times is
(28/4) - 2.65/1 (8b)
Keller and Buehlmann (1965) p.ostulate that the system is diffusion-limited by the rate for inert-gas exchange bf blood in the lungs. Inthis case, the ratio of half-times for nitrogen and helium would beapplicable to the whole body, i.e., tb all tissue compartments.. Theseauthors also state, "it is possible to obtain a desaturation of thebody with a switch of gases without any change in pressure." Thisphenomenon, which we might now call "isobaric counterdiffusion desatu-ration," is evident in Fig. 7c, where a decrease in the total dissolvedtension T1 + T2 begins half way through the exposure at the moment thetwo inert gases are switched.
Of course, if isobaric counterdif 0- '.turation can be achievedby a judicious manipulation of inert t -'en isobaric counterdif-fusion supersaturation can be produced ') v mple reversal. Thispossibility is illustrated in Fig. 8 C' t and Idicula 1975) forhypothetical half-times of 240 minm:te tst ihelium uptake and 480 minutesfor nitrogen elimination. The .ambient pressure is constant at 200 fswg,yet the dissolved gas tension increases by as much as 57 fswg. Assumingan oxygen window of about 7 fswg, the -et supersaturation is 50 fswg.
Fig. 8. Illustration of how inert gas switching can be used toachieve a state of supersaturation by isobaric counterdiffusion(from Lambertsen and Idicula 1975).
To determine whether the supersaturation achieved in Fig. 8 wouldproduce symptoms of multiple inert-gas bubble disease, we refer againto Fig. 2 (Yount 1979b) and particularly to the compilation of Hennessyand Hempleman (1977):
PI 1.407 P2 + 0.50 atm abs (9a)
-106-
, , m , n n n n l I "1 ,m,,,,,,..........-
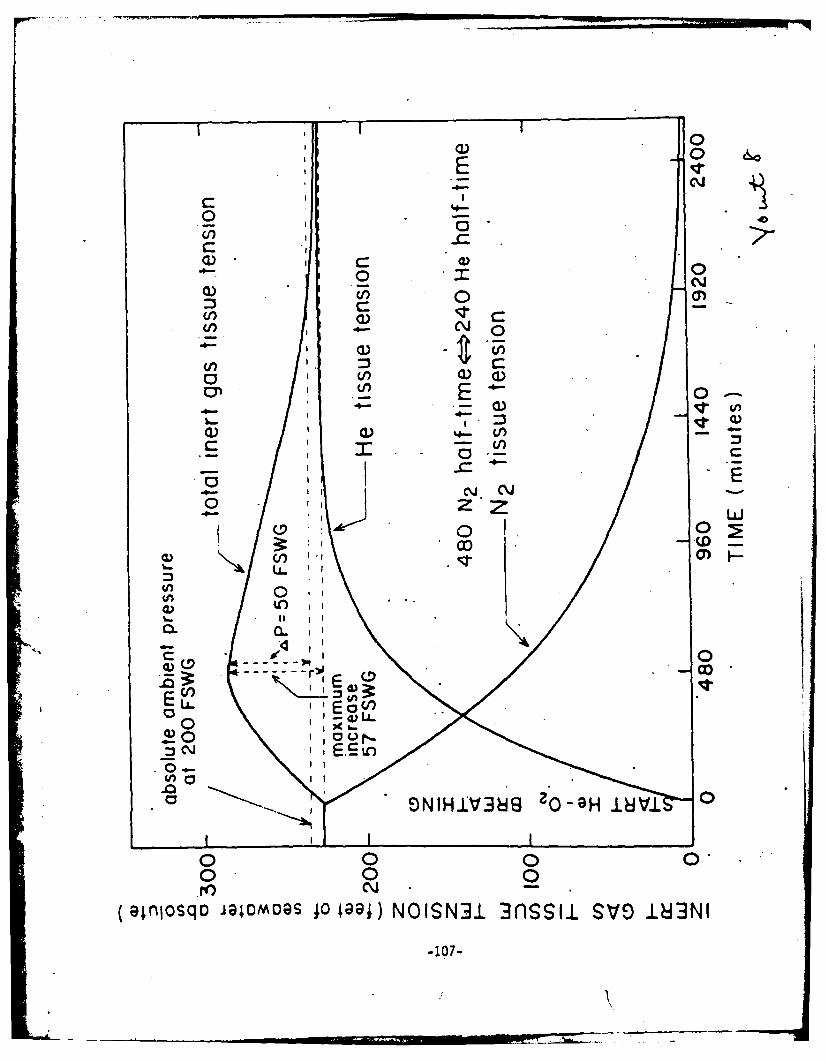
-
c
0 I\ 0
0- Il a)a)
Cl) 0
-4a)
3: - Cl) E
00
0'i 0
a)oq iima 001 OSN13sl V 8N
017
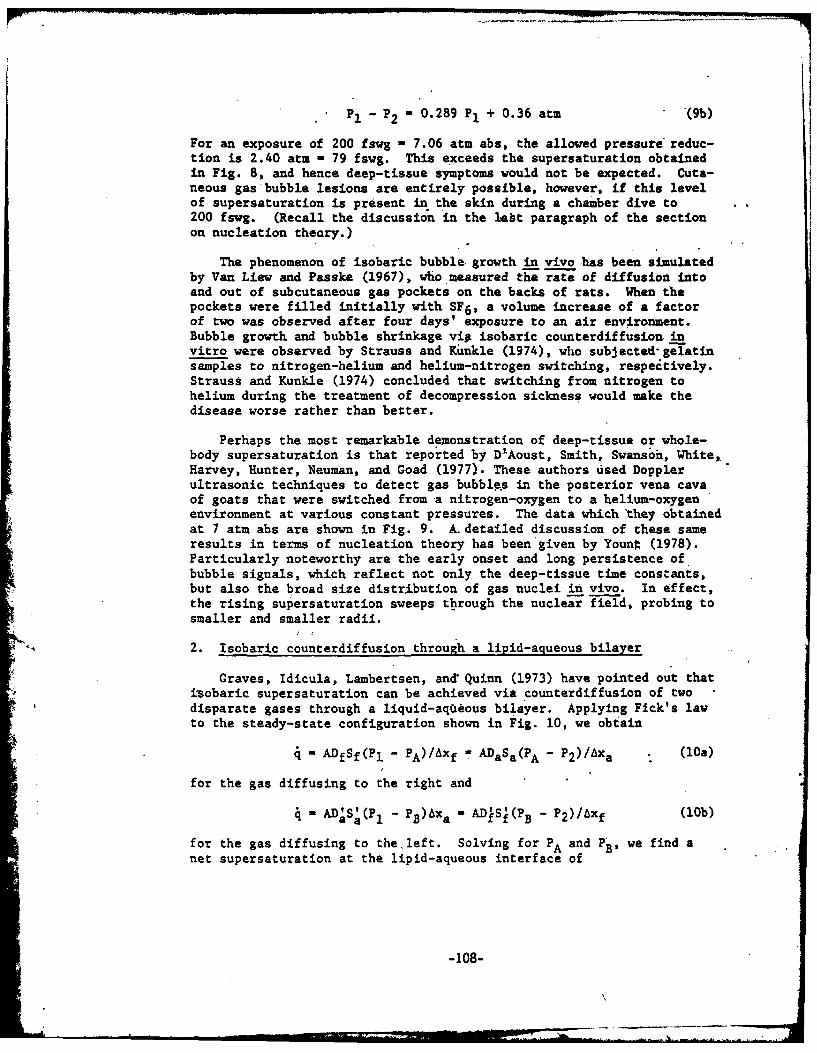
P1 - P2 "0.289 P1 + 0.36 atm (9b)
For an exposure of 200 fswg - 7.06 atm abs, the allowed pressure reduc-tion is 2.40 atm - 79 fswg. This exceeds the supersaturation obtainedin Fig. 8, and hence deep-tissue symptoms would not be expected. Cuta-neous gas bubble lesions are entirely possible, however, if this levelof supersaturation is present in the skin during a chamber dive to200 fswg. (Recall the discussion in the lAbt paragraph of the sectionon nucleation theory.)
The phenomenon of isobaric bubble growth in vivo has been simulatedby Van Liew and Passke (1967), who measured the rate of diffusion intoand out of subcutaneous gas pockets on the backs of rats. When thepockets were filled initially with SF6, a volume increase of a factorof two was observed after four days' exposure to an air environment.Bubble growth and bubble shrinkage vig isobaric counterdiffusion invitro were observed by Strauss and Kunkle (1974), who subjected-gelatinsamples to nitrogen-helium and helium-nitrogen switching, respectively.Strauss and Kunkle (1974) concluded that switching from nitrogen tohelium during the treatment of decompression sickness would make thedisease worse rather than better.
Perhaps the most remarkable demonstration of deep-tissue or whole-body supersaturation is that reported by D'Aoust, Smith, Swanson, White,.Harvey, Hunter, Neuman, and Goad (1977). These authors used Dopplerultrasonic techniques to detect gas bubbles in the posterior vena cavaof goats that were switched from a nitrogen-oxygen to a helium-oxygenenvironment at various constant pressures. The data whichthey obtainedat 7 atm abs are shown in Fig. 9. A. detailed discussion of these sameresults in terms of nucleation theory has been given by Younr (1978).Particularly noteworthy are the early onset and long persistence ofbubble signals, which reflect not only the deep-tissue time constants,but also the broad size distribution of gas nuclei in vivo. In effect,the rising supersaturation sweeps through the nuclear field, probing tosmaller and smaller radii.
. 2. Isobaric counterdiffusion through a lipid-aueous bilayer
Graves, Idicula, Lambertsen, and Quinn (1973) have pointed out thatisobaric supersaturation can be achieved via counterdiffusion of twodisparate gases through a liquid-aqte&ous bilayer. Applying Fick's lawto the steady-state configuration shown in Fig. 10, we obtain
4 - ADfSf(Pl - PA)/Axf - ADaSa(PA - P2)/Axa (10a)
for the gas diffusing to the right and
"AD;S(Pl - PB)Axa - Aff(PB - P2)/Axf (lOb)
for the gas diffusing to the left. Solving for PA and PB, we find anet supersaturation at the lipid-aqueous interface of
-108-

Fig. 9. Doppler bubble counts versus time after inert gas switch-ing from nitrogen to helium in goats at 7 atm abs. Primary bubblesare recruited only while the local supersaturation is rising. Ineffect, the rising supersaturation sweeps through the nuclear field,probing to smaller and smaller radii. Once formed, however, primary.bubbles in situ can serve as generators of secondary cavities viatissue cleavage and free-gas migration, a process which continuesuntil the supersaturation is relieved (from D'Aoust, Smith, Swanson,White, Harvey, Hunter, Neuman, and Goad 1977).
(AxaAxf)'(Pl - P2)(DfSfDjSj - DaSaDjSj)(PA + PB) - (P1 + P2) - (DaSaAXf + DfSftXa)(D'Stxf + DfSkca) (ii)
Since P1 is greater than P2, the criterion for supersaturation by thismechanism is (Graves, Idicula, Lambertsen, and Quinn 1973)
DfSfDjSj > DaSaDjSk (12)
The maximum supersaturation is achieved when the layer thickness arein the ratio (Graves, Idicula, Lambertsen, and Quinn 1973)
(AxafAxf) - (DaSaDaSa/DfSfDISk)i (13)
The degree of supersaturation that can be achieved by thii mechanismapproaches 30% of the absolute pressure (Graves, Idicula, Lambertsen,and Quinn 1973). This would exceed the deep-tissue pressure reductiontolerances shown in Fig. 2 at exposure above 5-10 atm abs, and it couldresult in cutaneous gas bubble lesions at even lower pressures. (Againrecall the discussion in the last paragraph of the section on nucleation.theory.)
-An investigation of the kinetics of isobaric counterdiffusion at alipid-aqueous bilayer has been carried out by Karreman and Lambertsen
-lO9-
I . ... . . . , , , T . .

*3esoc/luno:D ajqqnE]
o 0 0
0 0
01 do 06
W 00
40
i so 0
.,. or. ~ d __&
0 @
C.u/Iy o * luauo oile uoieile
-.O *sOX _110

PP:- V
Fig. 10. Isobaric supersaturation via counterdiffusion of twodisparate gases through a lipid-aqueous bilayer (Graves, IdiculaLambertsen, and Quinn 1973). For Gas A (N2) diffusing to the right,the pressure gradients are C - PA)/Axf and (PA - P2)/Axa ForGas B (He) diffusing to the left, the pressure gradients are (PPB)Axa and (PB - P2)/xf. The total dissolved tension (PA + PB)exceeds the ambient pressure (PI.+ P2) throughout the bilayer,reaching a maximum at the lipid-aqueous interface.
(1977) using the approximation of Landahl (1953) that assumes theadvancing diffusion front is linear. This idea is illustrated inFig. 11. Karreman and Lambertsen (1977) found that for helium diffusingagainst nitrogen, the time required to reach a steady state is in therange 0.01 to 12.4 sec. The layer thicknesses assumed by these authorsvaried from 5 to 160 Um, where the first value may approximate thediameter of a capillary while the second is an estimate of the dilstancefrom a skin capillary through the dermis to the surrounding atmosphere.This circulation suggests not only that the steady state approximation"of Graves, Idicula, Lambertsen, and7Quinn (1973) is valid, but alsothat the dissolved gas tension in the skin would follow the ambientpressure rather closely--even during rapid compressions. Thus Pcrushcould indeed be small for certain peripheral tissues, as conjecturedin the last paragraph of the section on nucleation theory.
3. Isobaric counterperfusion
Supersaturation via isobaric counterperfusion is depicted in Fig. 12(Hills 1977). The more diffusible gas, Gas I, is adjacent to the barrierat ambient pressure on the left, while the blood on the opposite sideof the barrier is initially saturated with the less diffusible gas,Gas II. The tension of Gas I in the mixed venous blood is PI and the
-111-

TOTAL TENSION
P, ++2c P P
NZ9)
z GAS A
0 (He)
zIul P1
I-s
uPB
bi
CI)W ,
ww
p20 -jiP
LIPI AQEOU
X f 0X

Fig. 11. Kinetics of isobaric counterdiffusion at a lipid-aqueousbilayer. In the approximation of Landahl (1953), as applied byKarreman and Lambertsen (1977), the advancing diffusion front isassumed to be linear in a given medium. For layer thicknesses inthe range from 5 to 160 Um, the time to reach a steady state variesfrom 0.01 to 12.4 sec.
tension of Gas II in the mixed venous blood is P2. The tension P2 isless than the ambient pressure P be-cause some of the gas originallyin the blood has diffused out.
In the steady-state configuration shown in Fig. 12, Fick's lawgives
41 ADlSl(P - Pl)/x 4SiP1 (14a)
for the gas diffusing to the right and
q2 = AD2 S2P2 /x - QSI(P - P 2 ) (14b)
for the gas diffusing to the left. Solving for P "and P2 , we find a
net supersaturation at the interface between the diffusion barrier andthe perfusion zone of (Hills 1977)
Pi + P2 - P - aP(61 - 02)/(l + al)(l + a82) (15)
where a - A/xo, 81 - DISl/Sj, and 02 - D2S2/S'
-113-

44
I
00z Iz J
-114-

Fig. 12. Isobaric supersaturation via counterperfusion (Hills1977). The more diffusible gas (1) is adjacent to the diffusionbarrier at ambient pressure P. The less diffusible gas (II) iscarried into the perfusion zone dissolved in the arterial bloodat the same initial pressure. This configuration results in asteady-state supersaturation, not only of the perfusion zone, butalso of the adjacent diffusion barrier.
The criterion for supersaturation via isobaric counterperfusion is
DSliSJ > D2S2/Si (16)
For an aqueous tissue and aqueous blood, we have S1 - Si and S2 - SjHence the only requirement is that Dl is greater than D2, i.e., thatone gas diffuses faster than the other.
Hills (1977) emphasizes that this result applies to steady-statecbnditions. Hence if there are nucleation sites in the supersaturatedmedia, bubbles can be produced continuously. Furthermore, the counter-perfusion mechanism can explain bubble formation within the fluidcompartments of the inner ear, where the presence of a suitable lipid-aqueous bilayer is questionable.
4. Chromatographic supersaturation
The phenomenon of simultaneous capillary perfusion and axial dif-fusion in a tissue cylinder has been investigated by Tepper, Lightfoot,Baz, and Lanphier (1979). The geometry considered by these authors isshown in Fig. 13a. The response time for radial diffusion is assumedto be very short compared to the capillary transit time, so that radialconcentration gradients can be neglected. The relative importance of
-115-
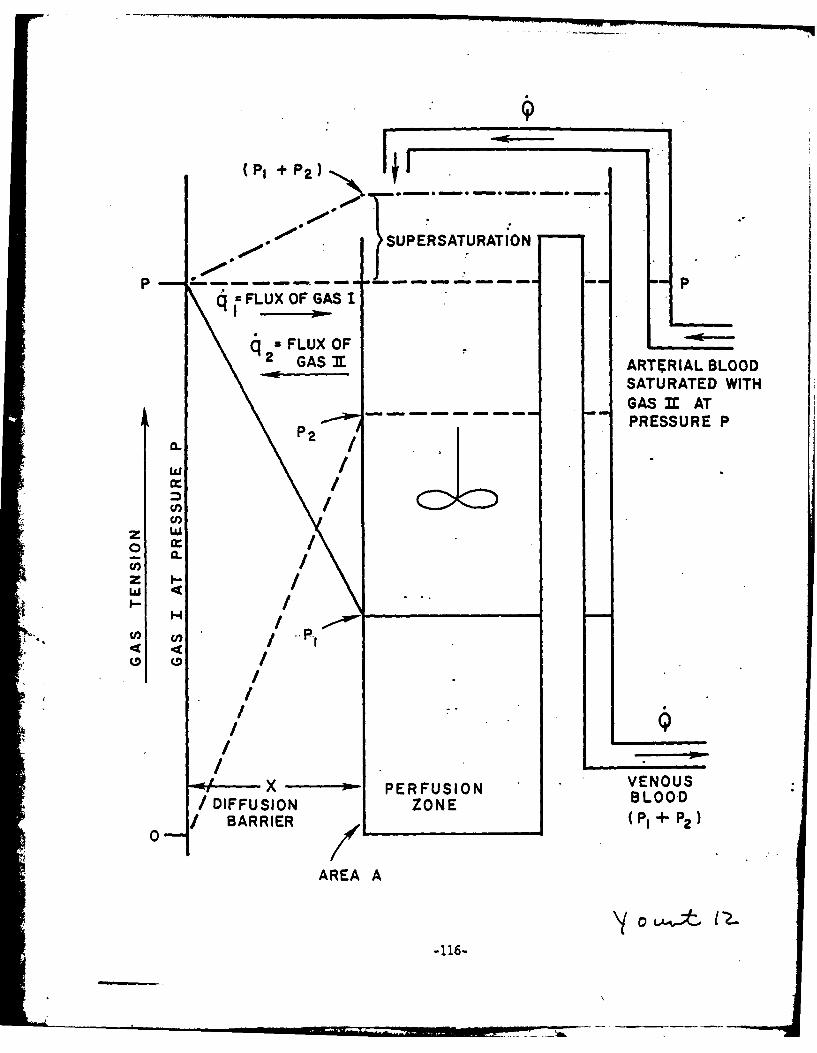
(P, + P2 F, F .a .a
SUPERSATURATION
q JFLUX OF GAS I
q =FLUX OF2GAS 3 ARTMIAL BLOOD
SATURATED WITHGAS 31 AT
- -- - -PRESSURE P
U,
( L
o P-1
U7a

Fig. 13. Isobaric chromatographic supersaturation (Tepper, Light-foot, Baz, and Lanphier 1979). In (a) a tissue cylinder ii sub-.jected simultaneously to capillary perfusion and axial diffusion.Radial concentration gradients are neglected. When the gas dis-solved in the capillary blood is switched from nitrogen to helium,helium enters the system more rapidly than nitrogen is removed.The result is a transient supersaturation .(b).
axial diffusion in the tissue compared with axial convention in thecapillary can be characterized by the Peclet (Pe) number, which is theratio of the response time for-axial diffusion to that for removal ofsolute by convection from its volume distribution. As the Pe numberapproaches zero, axial diffusion becomes very rapid compared to axialconvection.
Order of magnitude calculations by Tepper, Lightfoot, Baz, andLanphier (1979) indicate that the Pe numbers for fatty tissues lie inan intermediate region, e.g., Pe -. 4. If the inert gas dissolved inthe capillary blood is switched from nitrogen to helium, a significantsupersaturation can result. This is illustrated in Fig. 13b for ashift at one atm abs from 80% nitrogen to 80% helium. The elapsed timeis 0.60 of the helium response time THe. Because of finite axial dis-persion, there is a non-uniform concentration of each inert gas alongthe cylinder. Furthermore, the concentration of t'he helium that hasentered is greater than the concentration of nitrogen that has beenremoved. A supersaturation of about 25% is the result. At t = 1.4 THe,the total inert gas tension can exceed the ambient pressure by as muchas 40%.
-117-

FATTY -TISSUE
1 I I0 0. 1 *0.2 0.3 0.4 0.5 0.6 O.7 0.8 0.9 1.0
X/ L
(a)
1.6
I- 1.4E-KN2 +He
LU 1.2
cc) I.0 - - -
r.H-ENTERING N2 REMAININGCL 0.8 H
LU 0.4
0.2
00 0. 1 0. 2 0.3 0.4 0.5 0.6 0.7 0.8 0.9 1.0
X/L
(b)
Yo0 .v

5. Gas-induced osmosis
We shall end this section by describing another process which,although it is not a supersaturation mechanism per se, is frequentlymentioned in the same context (Blenkarn, Aquadro, Hills, and Saltzman1971; Hills 1972). This process is gas-induced osmosis-the transferof a liquid solvent through a semipermeable membrane that inhibits thetransfer and equilibration of a dissolved gas. The osmotic pressureOP for a tension differential Ap across a membrane is given by (Hills1972)
OP - aS(bp)T/273 (17)
where T is the absolute temperature in degrees Kelvin, S is the solu-bility, and a is the reflection coefficient, sometimes interpreted asthe fraction of the solute molecules which are reflected upon strikingthe barrier.
Assuming that tissue membranes are, in fact, somewhat impermeableto dissolved gas (i.e., that a is not equal to zero), osmotic pressuredifferences would be induced by the local gradients in dissolved gasconcentration that occur during compression, as well as during decom-pression and inert gas switching.- This could result in cell hydration,in cell dehydration, or even in cell death.
Discussion
The discovery of isobaric supersaturation of tissue-has added a new*dimension to diving theory. On the one hand, exposure to different
inert gases, either sequentially or simultaneously, constitutes apotential hazard that must now be taken into account. On the other,inert gas manipulation provides an opportunity not only to improve div-ing practice, but also to investigate a number of problems related todiving physiology.
A remarkable illustration of this last point is given by the experi-ment of Cowley, Allegra, and Lambertsen (1979), who subjected the earsof New Zealand White rabbits to isobaric counterdiffusion at 1 atm abs.
*The rabbits breathed a mixture of 80% nitrous oxide and 20% oxygen whiletheir ears alone were surrounded by helium. Subcutaneous pressurechanges were detected by a fluid-filled needle inserted into the exter-nal ear and attached to a transducer-recorder system. The developmentof a gas phase in the tissue was signaled by a pressure increase from0 mmHg to a maximum of 48 ± 10 (SD) mmHg. The mean time tP reach themaximum pressure was 75 ±10 (SD) minutes.
A representative tracing from the experiment of Cowley, Allegra,and Lambertsen (1979) is shown in Fig. 14. The increase in tissuepressure begins within 5 minutes after the breathing gas is switchedfrom air to the nitrous-oxide mixture. In the interval from about 10to 20 minutes, the tissue pressure appears to be approaching exponen-tially a steady-state level, presumably determined by the degree ofsupersaturation achieved in the rabbit ear under the given conditions.
-119-

Fig. 14. Subcutaneous pressure measured by Cowley, Allegra, and
Lambertsen (1979) in the external ear of a New Zealand White rabbitsubjected to isobaric counterdiffusion at 1 atm abs. Formation ofa primary gas phase is signaled by the initial increase in pressure.Tissue cleavage, associated with a sudden increase in free gasvolume, is indicated by a sharp decline.. The cycle of exponentialrise and sharp decline has important implications for the timecourse of gas elimination from the tissue.
After about 20 minutes, however, the exponential rise is abruptly ter-minated, apparently by cleavage of subcutaneous tissue which permitsthe free gas volume to expand. The cycle of exponential rise andabrupt decline is repeated again and again, generating a saw-toothedpattern with a gradual decrease in overall pressure during long expo-sure times. (See especially Fig. 5 in the paper by Cowley, Allegra,and Lambertsen 1979.)
The data of Cowley and his co-workers (1979), like those of D'Aoust,Smith, Swanson, White, Harvey, Hunter, Neuman and Goad (1977), have
'4 important implications for the time course of gas elimination from thetissue (Yount 1978; Yount 1979b). The primary event, once the requireddegree of supersaturation has been achieved, is the formation of a.
macroscopic gas phase, i.e., a bubble, from a microscopic gas nucleus.Whereas nuclei are stable and typically have radii less than 1 um,bubbles are intrinsically unstable,.- Thus bubbles which form in lean
gelatin samples ordinarily grow until the local supersaturation isrelieved (Yount and Strauss 1976), while bubbles in tissue tend to
expand until the deformation pressure 6 (which is negligible in lean
gelatin) increases to a value large enough to withitand the supersatu-
ration and prevent additional gas from diffusing into the cavity (Youllt.
1978; Yount 1979b).
The data of Cowley, Allegra, and Lambertsen (1979) are of particu-lar interest because neither of the above conditions prevails. Thesupersaturation is not relieved by the creation of the gas phase;"rather, it is maintained at a more or less constant level by a steady-state counterdiffusion mechanism. Similarly, the tissue deformation
-120-

.7-
z
Ld
0
"00<
Z O ZOT ~0 0.
F~- o*;- 0z w Wr 0
0.00
121--0

pressure does not rise to the supersaturation level, but instead- itis periodically discharged via tissue cleavage. This situation callsto mind the bubble chains seen in champagne or the "rosaries" of post-mortem bubbles reported by Albano (1970), and one can easily imagine aseries of "secondary" bubbles originating at the site of a "primary"nucleus and discharging ultimately into the vasculature. This is notto say that intact bubbles move freely through tissue and capillarywalls; rather, they are pools along the cleavage streams through whichfree gas migrates.
The above scenario is quite consistent with the data of D'Aoustand his group (1977), shown in Fig. 9. Primary bubbles are recruitedonly while the supersaturation is increasing, but secondary bubblescontinue to be generated by the primary sites until the local super-saturation falls below the local deformation pressure. Furthermore,whereas a value of 48 t 10 (SD) mmHg may be typical of a rabbit's ear(Cowley, Allegra, and Lambertsen 1979), the deformation pressures inblood and in other liquids must be negligible. Evidently, there is agradient in deformation pressure, and it is this gradient that providesthe force necessary to drive the cleavage streams of free gas out ofthe tissue and into the blood. The bubbles which form at the ends ofthese streams are not held in check by the tissue deformation pressureand may grow to many tens of microns. This facilitates detection bythe Doppler apparatus, which Continues to serve as a reliable monitorof the in situ liberation of dissolved tissue gas long after the forma- "tion of primary bubbles has ended. Since bubble size in tissue isordinarily limited, perhaps to a few microns in radius (Rubissow andMackay 1974), it may appear to an observer with poor visual resolutionthat all bubbles originate directly .in the blood. Albano (1970), onthe other hand, has emphasized the continuity of extra- and intra-vascular bubbles, and his work is in accord with the point of viewexpressed here.
This work is a result of research sponsored in part by theUniversity of Hawaii Sea Grant College Program under InstitutionalGrant No. NA79AA-D-00085 from NOAA, Office of Sea Grant, U.S.Department of Commerce.
-122-

References
Albano, G. 1970. Principles and Observations on the Physiology of theScuba Diver. English translation: ONR Report DR-150, Office ofNaval Research, Department of the Navy, Arlington, Va., pp. 207-274.
Berghage, T.E., J.A. Gomez, C.E. Roa, and T:R. Everson.. 1976. Pressure-reduction limits for rats following steady-state exposures between6 and 60 ata. Undersea Biomed. Res. 3:261-271.
Blenkarn, G.D., C. Aquadro, B.A. Hills, and H.A. Saltzman. 1971.Urticaria following the sequential breathing of various inert gasesat a constant ambient pressure of 7 ata: A possible -anifestationof gas induced osmosis. Aerospace Med. 42:141-146.
Cowley, J.R.M., C. Allegra, and C.J. Lambertsen. 1979. Measuretaent ofsubcutaneous tissue pressure during superficial isobaric gas counter-diffusion. J. Appl. Physiol.: Respir. Environ. Exercise Physiol.47:224-227.
T'Aoust, B.G., K.H. Smith, H.T. Swanson, R. White, C.A. Harvey, W.L.Hunter, T.S. Neuman, and R.F. Goad. 1977. Venous gas bubbles:Production by transient, deep isobaric counter-diffusion of heliumagainst nitrogen. Science 197:889-891.
Graves, D.J., J. Idicula, C.J. Lambertsen, and J.A. Quinn. 1973.Bubble formation resulting from counterdiffusion supersaturation:A possible explanation for inert gas "urticaria" and "vertigo."Phys. Med. Biol. 18:256-264.
Harvey, E.N., D.K. Barnes, W.D. McElroy, A.H. Whiteley, D.C. Pease,and K.W. Cooper. 1944. Bubble formation in animals. I. Physicalfactors. 3. Cell. Comp. Physiol. 24:1-22.
- *Hennessy, T.R., and H.V. Hempleman.. 1977. An examination of thecritical released gas volume concept in decompression sickness.Proc. R. Soc. Lond. B. 197:299-313.
Hills, B.A. 1972. Gas-induced osmosis in the lung. 3. Appl. Physiol;33:126-129.
Hills, B.A. 1977. Supersaturation by counterperfusion and diffusionof gases. 3. Appl. Physiol.: Respir. Environ. Exercise Physiol.42:758-760.
Karreman, G., and C.J. Lambertsen. 1977. Kinetics of isobaric counter-diffusion. Bull. Math. Biol. 39:587-595.
Keller, H., and A. Buehlmann. 1965. Deep diving and short decom, 'ssidnby breathing mixed gases. 3. Appl. Physiol. 20:1267-1270.
-123-

Lambertsen, C.J., and J. Idicula. 1975. A new gas lesion syndromein man, induced by "isobaric gas counterdiffusion." J. Appl.Physiol. 39:434-443.
Landahl, H.D. 1953. An approximation method for the solution ofdiffusion and related problems. Bull. Math. Biophys. 15:49-61.
Rubissow, G.J., and R.S. Mackay. 1974. Decompression study andcontrol using Ultrasonics. Aerospace Med. 45:473-478.
Strauss, R.H., and T.D. Kunkle. 1974. Isobaric bubble growth: Aconsequence of alternating atmospheric gas. Science 186:443-444.
Tepper, R.S., E.N. Lightfoot, A. Baz, and E.H. Lanphier. 1979. Inertgas transport in the microcirculation: Risk of isobaric supersatura-tion. J. Appl. Physiol.: Respir. Environ. Exercise Physiol.. 46:1157-1163.
Van Liew, H.D., and M. Passke. 1967. Permeation of neon, nitrogen,and sulfur hexafluoride through walls of subcutaneous gas pocketsin rats. Aerospace Med. 38:829-831.
Watt, D.G., and Y.C. Lin. 1979. Uoppler detection of thresholds fordecompression-induced venous gas emboli in the awake rat. Aviat.Space Environ. Med. 50:571-574.
Yount, D.E. 1980. Responses to the twelve assumptions presently usedin calculating decompression schedules. In: Berghage, T.E., Chairman.Decompression Theory. UMS Workshop 29WS(DT)i Bethesda: UnderseaMedical Society.
Yount, D.E. 1979a. Skins of varying permeability: A stabilizationmechanism for gas cavitation'nuclei. J. Acoust. Soc. Am. 65:1429-1439.
Yount, D.E. 1979b. Application of a bubble formation model to decom-pression sickness in rats and humans. Aviat. Space Environ. Med..50:44-50.
Ybunt, D.E., and R.H. Strauss. 1976.. Bubble formation in gelatin: Amodel for decompression sickness. J. Appl. Phys. 47:5081-5089.
Yount, D.E., C.M. Yeung, and F.W. Ingle. 1979. Determination of theradii of gas cavitation nuclei by filtering gelatin. J. Acoust.Soc. Am. 65:1440-1450.
-124-

Q. Does your model take the thickness of the skin into account?
A. In our most recent work, we have adopted a model that takes skinthickness into account. We now have data to show that this isnecessary, under extreme conditions - for example, when the sideof the nucleus is so small that the skin thickness is a significantfraction of the radius.
Q. You made a comparison between the.Berghage data and the findingsof Watt and Lin, but since Watt used air and Berghage used helium-oxygen, do you think the comparison is valid?
A. The number of bubbles that form, as a first approximation, isindependent of whether the gas involved is helium or nitrogen;this has been experimentally tested in gelatin. This doesn't meanthat people are equally sensitive-to the two gases; a lot nresecondary bubbles may be released in the case of nitrogen than ina helium situation.
Q. Would you re-state the conclusion from your paper that you thoughtwas so important?
A. The first point is that Pcrush may be smaller than we thought, ifthe gas tension rises significantly during compression. Thosetissues that have extremely short time constants will have extreme-ly low Pcrush, and instead of. getting very high allowed pressurereductions -- 4 or 5 atmospheres - we may actually be limited to1 or 2 atmospheres. The vestibular region falls into this class -
if the respiratory gas is the same as the ambient gas, the Eustachiantube acts as another pathway. One could therefore have a gas tensionin the vicinity of the round window or the vestibule that is closeto ambient pressure as one compresses, which means that this regionis not well protected by ih "compression of nuclei. This would becompatible with bubble formation in these areas, and explain whyadditional compression would have little effect on the size of thenuclei.
Q. This would clarify why Harvey's 4ivers' itching was aggravated whenthey compressed an additional atmosphere on the same gas. Thebenefits of compression were less than the negative effects of theextra atmosphere of helium. The divers were clearly not yet equili-brated.
-125-
ISOBARIC SUPERSATURATION:
THEORETICAL MODELS*
R. S. Tepper
The use of multiple inert gases in combination or .in sequence hasbecome increasingly common in diving. The differences in the physicalproperties of the inert gases have generally been exploited to decreasethe work of breathing at increased pressure, to balance the effects ofnitrogen narcosis and the high pressure nervous syndrome, and to decreasethe time required for decompression. In 1959, Hannes Keller (Keller andBuehlmann 1965) noted the theoretical 'advantage of switching the inspiredinert gas from He to N2 during decompression from a deep dive emlyloyingHe. Such shifts subsequently became a central feature of the approachto deep diving described by Keller and Buehlmann (Keller and Buehlmann1965; Buehlmann 1975). Only during the past decade has the divingcommunity become aware of some of the possible hazards of simultaneousexposure to different inert gases or of shifting breathing media underconstant ambient pressure.
In 1971, Blenkarn and his co-workers (Blenkarn, Aquadro, Hills andSaltzman 1971) first reported the occurrence of urticarial lesions inindividuals breathing either N2 or Ne while surrounded by He-at a con-stant ambient pressure of 7 ATA. These cutaneous lesions were thoughtto be fluid filled and were attributed to gas-induced osmosis. Lambertserand his group (Lambertsen and Idicula 1975) reported similar cutaneouslesions while studying the effect of inspired gas density on respiratorywork at increased ambient He pressures. Dissection of these lesionsrevealed confluent gas spaces rather than extravasation of fluid. Thisgroup stbsequently produced both cutaneous lesions and fatal venous gasemboli in pigs breathing N20 and surrounded by He at a constant ambientpressure (unpublished observations). They attributed these manifesta-tions to isobaric supersaturation and bubble formation resulting fromthe difference in the rates of cutaneous counterdiffusion of the inspiredand ambient inert gases. Lambertsen designated this phenomenon as the"isobaric gas counterdiffusion syndrome" (Lambertsen and Idicula 1975).
Graves, Idicula, Lambertsen and Quinn (1973) proposed a model,illustrated in Fig. 1, to explain how the steady-state, two compartmentsystem with oil and water is able to produce supersaturation because ofthe differences in diffusivities and solubilities, and relative perme-abilities, of the two inert gases. This model's shortcomings, however,are that it requires a specific orientation of the lipid-aqueous layer,and that it neglects convective transport by the blood. Both of thesedefects limit it as a model with realistic predictive ability.
* In the final report, the figures in this paper will be reduced andinserted above their respective legends in the text.
-126-

~1
Fig. 1. Schematic showing supersaturation in a two-layer systemduring a counter-current diffusion experiment. In the real case,Gas 1 may be He; Gas 2, N2; Layer A, H20; Layer B, oil. Partialpressure profile is indicated for each gas. Bubbles can form ifat least one of the two layers is a liquid.
A closer approximation of the actual biological system has beenproposed by Hills (1977). As depicted in Fig. 2, the diffusive resis-tance of the skin lies in series with the convective transport of awell-mixed blood supply. This todel allows for supersaturation tooccur solely from diffusional differences between inert gases in asingle aqueous phase. Collins (1978) has measured the transcutaneousfluxes of several inert gases in piglets. Using Hills' model, hiscalculations of the relative counterdiffusion potentials of the differ-ent inert gases were in general agreement with the reported occurrencesof isobaric supersaturation. This model makes it possible to predictwhich exposures to various inert gas.es may produce cutaneous super-saturation. However, the model's predictive! ability is still limitedby its use of steady-state analysis.
Analysis of transient responses
Although cutaneous counterdiffusion can produce a sustained steady-state isobaric supersaturation, it is important to examine the transientresponse of a system. This is best illustrated by the recent work ofCowley and Lambertsen (1979). These investigators were unable to pro-duce bubble formation in either the cornea or anterior chamber of theeyes of animals breathing N20 and surrounded by He at 2 ATA after 2 to3 hours' exposure. Using the above model, with the cornea representingthe diffusion barrier and the anterior chamber as the convective
-127-

e."
00
/1 * 0 000 0
-0 00 0MI0
_'0* _0 06
0 - -* CL
~~010
LAJ LAJI
3-.@-(WIO) ainssaidL * i
-12
.. 7 77

Fig. 2. Readily diffusible gas (1) washes away from outer surfaceof skin or membrane any less diffusible gas (I) that has permeatedthis barrier from perfused zone supplied with blood free of Gas Ibut saturated with Gas II at ambient pressure (P). By adding gastensions, it can be seen that the stirred pool, and hence the over-flow (venous blood), becomes supersaturated (P1 + P2 > P) as thesystem reaches steady state.
transport system in series, they subsequently estimated that it wouldrequire approximately 16 days to generate 1 ml of gas in the anteriorchamber. This could have been estimated from the transient responsetime of the system, the time needed to reach steady state. It is there-fore important to know whether the predicted steady-state values willoccur during the time-span that is actually at issue.
The importance of transient analysis is further emphasized by theconsideration of "deep tissue" isobaric supersaturation, a phenomenonfirst speculated about by Lambertsen and Idicula (1975). This phenom-enon could result from an abrupt switch in the respired inert gas suchthat the first gas exits the tissues more slowly than the second gasenters. A switch from N2 to He, the reverse of the presumably benefi-cial shift proposed by Keller and described by Buehlman (1975), couldtheoretically produce isobaric supersaturation. In contrast to thesustained steady-state bubble formation that can be produced by super-ficial counterdiffusion, "deep-tissue" supersaturation is not sustainedand results from transient differences in the microcirculation.
Although several authors have discussed the theoretical possibil-ities of "deep tissue" isobaric supersaturation (Tepper, Lightfoot, Bazand Lanphier 1979; D'Aoust, Smith, Swanson, White, Stayton and Moore1979), there has been no experimental verification of bubble formationresulting specifically from "deep tissues." D'Aoust and his co-workers(D'Aoust, Smith, Swanson, White, Stayton and Moore 1979) have documented
-129-

Super- I PI P21 m
saturation(?-
flux of gas 1(4 2 )
ArterialBlood
z p t0
~ GsIsaturated gas I
C., Perfusion_Blo.
xso PefonBooDBarrierI+
2
Area A * ....-.-.--
-136-
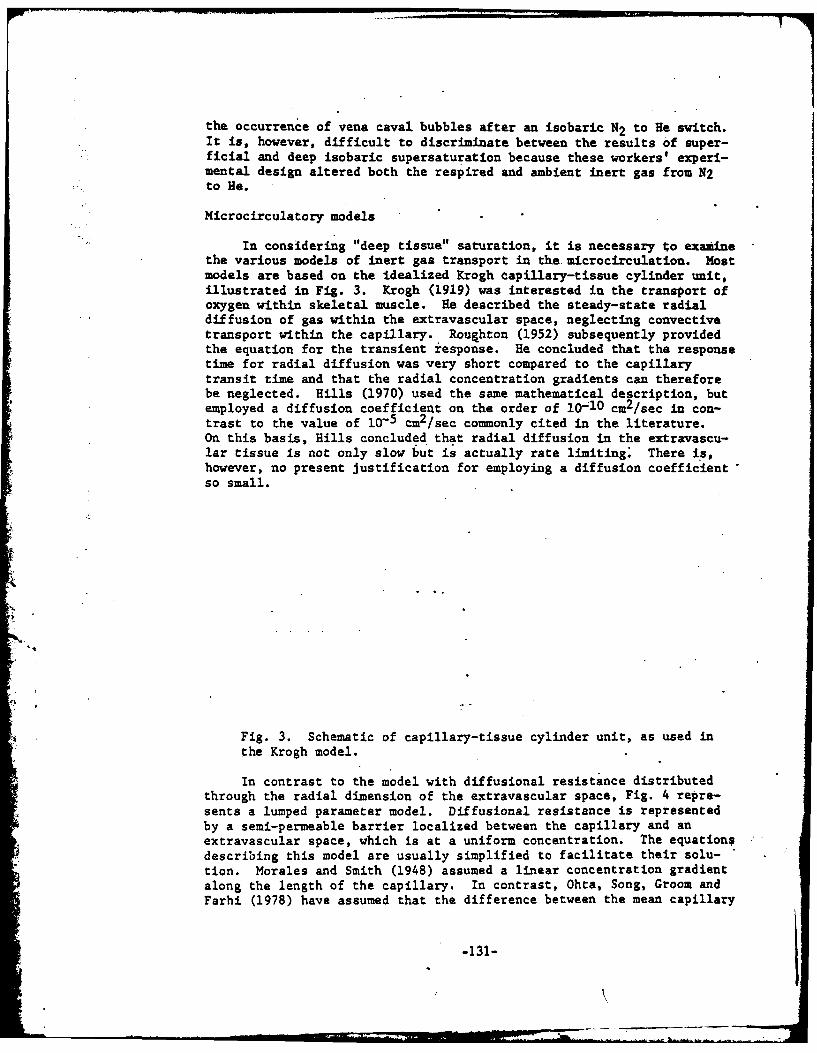
the occurrence of vena caval bubbles after an isobaric N 2 to He switch.It is, however, difficult to discriminate between the results of super-ficial and deep isobaric supersaturation because these workers' experi-mental design altered both the respired and ambient inert gas from N2to He.
Microcirculatory models
In considering "deep tissue" saturation, it is necessary to examinethe various models of inert gas transport in the. microcirculation. Mostmodels are based on the idealized Krogh capillary-tissue cylinder unit,illustrated in Fig. 3. Krogh (1919) was interested in the transport ofoxygen within skeletal muscle. He described the steady-state radialdiffusion of gas within the extravascular space, neglecting convectivetransport within the capillary. Roughton (1952) subsequently providedthe equation for the transient response. He concluded that the responsetime for radial diffusion was very short compared to the capillarytransit time and that the radial concentration gradients can thereforebe neglected. Hills (1970) used the same mathematical description, butemployed a diffusion coefficient on the order of 10 10 cm2/sec in con-trast to the value of 10-5 cm2/sec co-mmonly cited in the literature.On this basis, Hills concluded that radial diffusion in the extravascu-lar tissue is not only slow but is actually rate limiting. There is,however, no present Justification for employing a diffusion coefficientso small.
Fig. 3. Schematic of capillary-tissue cylinder unit, as used inthe Krogh model.
In contrast to the model with diffusional resistance distributedthrough the radial dimension of the extravascular space, Fig. 4 repre-sents a lumped parameter model. Diffusional resistance is representedby a semi-permeable barrier localized between the capillary and anextravascular space, which is at a uniform concentration. The equationsdescribing this model are usually simplified to facilitate their solu-tion. Morales and Smith (1948) assumed a linear concentration gradientalong the length of the capillary. In contrast, Ohta, Song, Groom andFarhi (1978) have assumed that the difference between the mean capillary
-131-
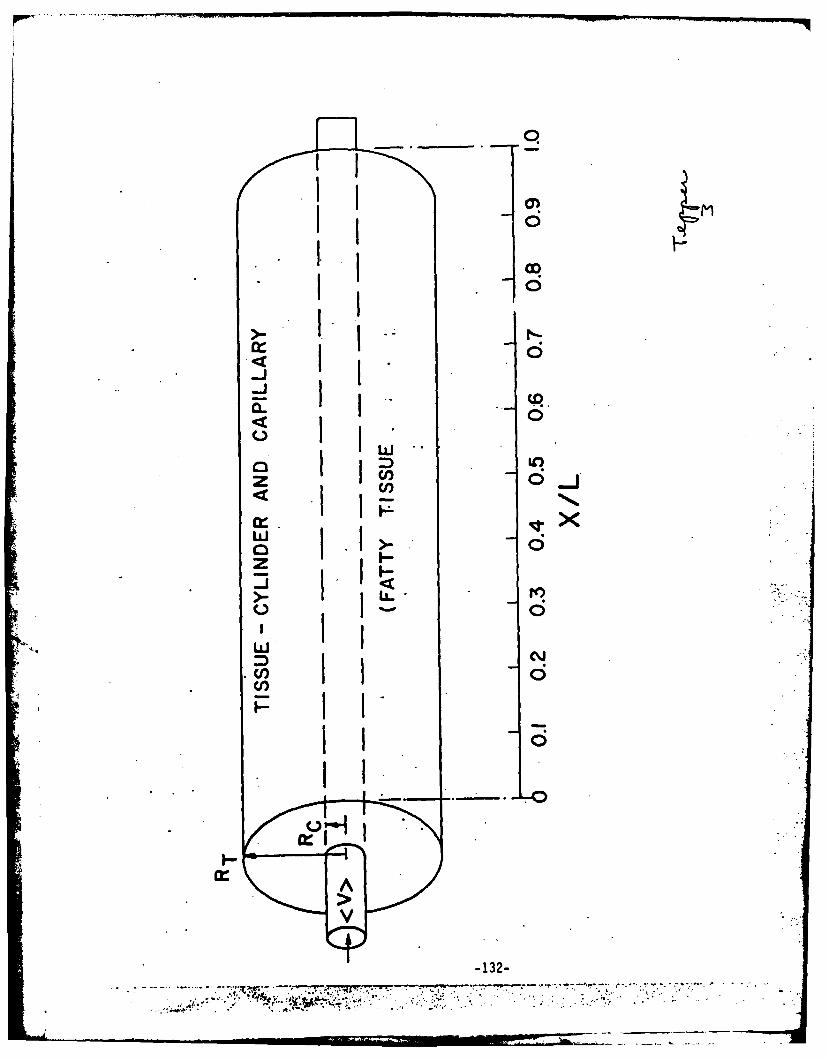
II0
i0
ix1
-132
I7-
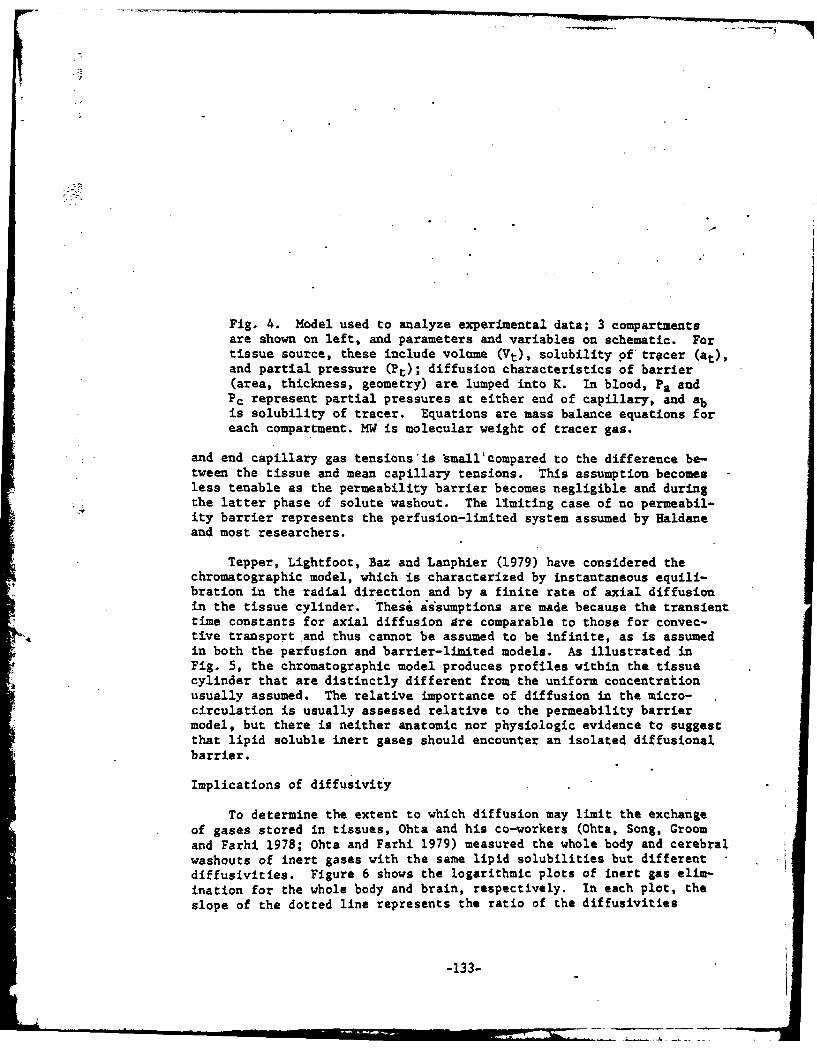
Fig. 4. Model used to analyze experimental data; 3 compartmentsare shown on left, and parameters and variables on schematic. Fortissue source, these include volume (Vt), solubility 9f tracer (at),and partial pressure (Pt); diffusion characteristics of barrier(area, thickness, geometry) are lumped into K. In blood, Pa andPc represent partial pressures at either end of capillary, and abis solubility of tracer. Equations are mass balance equations foreach compartment. MW is molecular weight of tracer gas.
and end capillary gas tensions'is small'compared to the difference be-tween the tissue and mean capillary tensions. This assumption becomesless tenable as the permeability barrier becomes negligible and duringthe latter phase of solute washout. The limiting case of no permeabil-ity barrier represents the perfusion-limited system assumed by Haldaneand most researchers.
Tepper, Lightfoot, Baz and Lanphier (1979) have considered thechromatographic model, which is characterized by instantaneous equili-bration in the radial direction and by a finite rate of axial diffusionin the tissue cylinder. These assumptions are made because the transienttime constants for axial diffusion are comparable to those for convec-
4, tive transport and thus cannot be assumed to be infinite, as is assumedin both the perfusion and barrier-limited models. As illustrated inFig. 5, the chromatographic model produces profiles within the tissuecylinder that are distinctly different from the uniform concentrationusually assumed. The relative importance of diffusion in the micro-circulation is usually assessed relative to the permeability barriermodel, but there is neither anatomic nor physiologic evidence to suggestthat lipid soluble inert gases should encounter an isolated diffusionalbarrier.
Implications of diffusivity
To determine the extent to which diffusion may limit the exchangeof gases stored in tissues, Ohta and his co-workers (Ohta, Song, Groomand Farhi 1978; Ohta and Farhi 1979) measured the whole body and cerebralwashouts of inert gases with the same lipid solubilities but differentdiffusivities. Figure 6 shows the logarithmic plots of inert gas elim-ination for the whole body and brain, respectively. In each plot, theslope of the dotted line represents the ratio of the diffusivities
-133-

* .<. .V..;t...
I- %4
-14-.
0' * 0M

Fig. 5. Schematic of chromatographic model.
and the predicted curve of the barrier-limited model. The slopes ofthe plots were very near 1.0, the value predicted for a perfusion-limited model. These authors thus concluded that the rate of exchangeof inert gases is limited only by the gas partition coefficient andthe blood perfusion rate.
If, however, one examines the late phase of each washout, one con-sistently notes that the more rapidly diffusible gas is at a higherconcentration and thus is washini out more slowly. This is demonstratedby the proportionately larger number of points above than below thecurve in Fig. 6, as well as by examining the raw data in Fig. 7. Abarrier-limited model cannot explain the slower washout of the morediffusible gas. Figure 8 is a theoretical plot of the washout of twoinert gases with the same lipid solubilities and a 1.5:1.0 ratio'ofdiffusivities, using the chromatographic model. Note the slowerwashout of the more diffusible gas.-The logarithmic plot has a slopeof 0.92, distinctly less than 1.5 and very close to 1.0. This occursbecause more of the inert gas with the greater diffusivity returns tothe proximal end of the tissue cylinder and thus slows its washout.As suggested by Tepper,. Lightfoot, Baz and Lanphier (1979)," such inter-action of perfusion and diffusion should not be neglected. Figure 9illustrates the marked difference in the predicted local and averagetissue supersaturations for the chromatographic and perfusion-limitedmodels after an isobaric shift from N2 to He. In addition, the per-fusion-limited model predicts supersaturation only in fatty tissues,while the chromatographic model predicts supersaturation even inaqueous tissues.
-135-

ail .
w .. o.
1 06
w/
+I
rw
cnI--. ( 0 -
0 . ) 0
a_ (VAiV) 8aflssgJd sD oEJGpuI fssij
- -136-
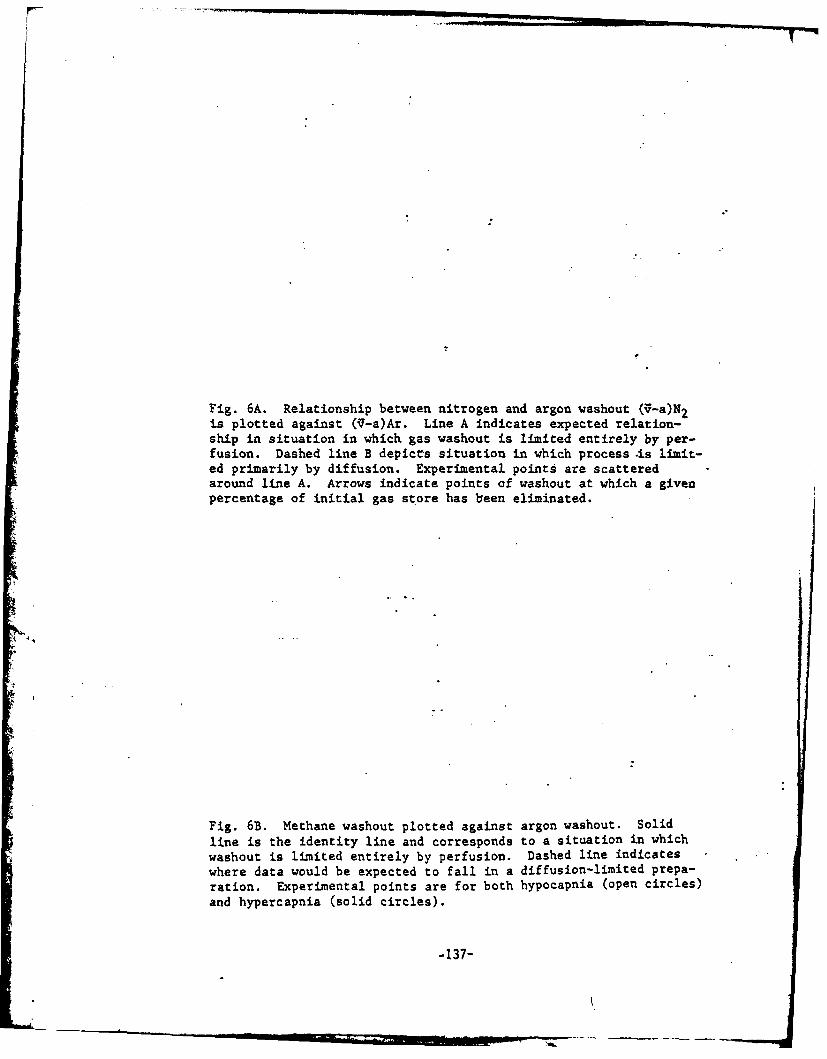
Fig. 6A. Relationship between nitrogen and argon washout (V-a)N2is plotted against (1-a)Ar. Line A indicates expected relation-ship in situation in which gas washout is limited entirely by per-fusion. Dashed line B depicts situation in which process .is limit-ed primarily by diffusion. Experimental points are scatteredaround line A. Arrows indicate points of washout at which a givenpercentage of initial gas store has been eliminated.
Fig. 6B. Methane washout plotted against argon washout. Solidline is the identity line and corresponds to a situation in whichwashout is limited entirely by perfusion. Dashed line indicateswhere data would be expected to fall in a diffusion-limited prepa-ration. Experimental points are for both hypocapnila (open circles)and hypercapnia (solid circles).
-137-

F, A
100
990
IL 9
B. A
0.21 -0
100 10 0.
% 9-)A

06 C0
0 0
lot~ I I I
CN
.4qlv
-139-

Fig. 7A. Washout of argon and nitrogen from body stores. Abscis-sa is time in minutes. Ordinate (log scale) is (,-a) differenceexpressed as percent of initial blood level before washout. Whenvalues for Ar and N2 expressed in this fashion are not identicalin any 1 sample, the two data are connected. Scatter is causedby differences in behavior of individual animals.
*
Fie. 7B. Washout of argon and methane from body stores. Abscissais time in minutes. Ordinate (log scale) is (V-a) difference,divided by control value. Solid line is average of points fromhypercapnic animals; dashed line, hypocapnic animals.
-140-

XN2
10.0-OAr
5.0 6
50 100 150 200Time,.min
-7 7 r7
I. *~ .S..r:MINIMUMFAIL *

H yperoani
a-oHypocapnia I- SyErcpi
F V . .-. Hypercopnia -
I .E
*60 120 180 60 120 180Time (min) Time (min)
-142-

Figs. 8A and 8B. Plots of washout for two inert gases with same
lipid solubilities and a 1.5:1.0 ratio of diffusivities, usingthe chromatographic model.
-143-

100 A1
29
10 0 0 00
xx
00
/initial D 1.5 00
x =I more diffusi ble gas0 2, less dif f us ible gas
1.0-*S= tissue solubility
D= diffusivity
~0 .5 1.0 1.5 2.0 2.5 3.0
7/r4"fDisplacement Time-144-

* OD
.- cni
0 L() ND I
ho0t-
Fig. 9. Difference in predicted local and average tissue super-
saturations, using the chromatographic and perfusion-limited models.
Conclusion
Models are only gross simplifications of very complex systems andare at best no better than the anatomic, physiologic and mathematicalassumptions upon which they are based. Steadfast adherence to a singlemodel can limit both interpretation of experimental data and predictiveability, the two prime reasons for modeling.
Awareness of isobaric supersaturation has added a new dimension todiving theory and new opportunities to investigate the mechanismscontrolling inert gas transport in the microcirculation.
-146-
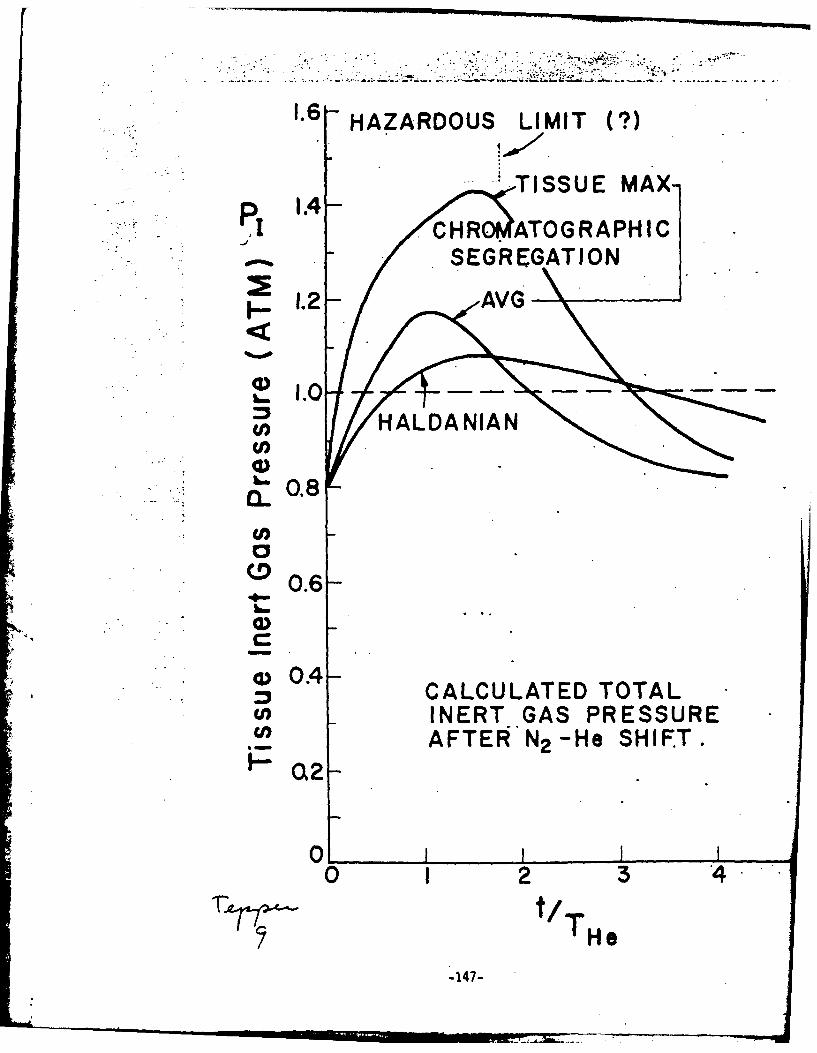
.6HAZARDOUS LIMIT(?
TISSUE MAX-p1.4
7. .CHR* AOGRAPHICSEGREGATION
1.2
HALDANIAN
0O.8
~0.
04
CALCULATED TOTALINERT-GAS.PRESSUREAFTER N2 -He SHIFT.
012 34t/T
-147-

References
Blenkarn, G.D., C. Aquadro, B.A. Hills and H.A. Saltzman. 1971..Urticaria following the sequential breathing of various inert gasesat a constant ambient pressure of 7 ATA: a possible manifestation ofgas-induced osmosis. Aerospace Med. 42:141-146.
Brenner, H. 1962. The diffusion model of.longitudinal mixing in bedsof finite length-numerical values. Chem. Eng. Sci. 17:229-243.
Buehlmann, A.A. 1975. Decompression Theory: Swiss Practice. In:P.B. Bennett and D.H. Elliott.. The Physiology andMedicine of Divingand Compressed Air Work. London: Bailliere-Tindall.
Collins, J.M. 1978. Isobaric inert gas supersaturation: observations,theory, and predictions. J. AppI. Physiol.: Respirat. Environ.Exercise Physiol. 44(6):917.
Cowley, J.R.M., and C.J. Lambertsen.1979. Isobaric gas counterdiffusionin rabbit eye. J. Appl. Physiol.: Respirat. Environ. ExercisePhysiol. 47(1):220-223.
D'Aoust, B.G., K.H. Smith, H.T. Swanson, R. White, L. Stayton, andJ. Moore. 1979. Prolonged bubble production by transient isobariccounterequilibration of helium against nitrogen. Undersea Biomed.Res. 6:109-125.
Graves, D.J., J. Idicula, C.J. Lambertsen and J.A. Quinn.1973. Bubbleformation resulting from counter-diffusion supersaturation: a possibleexplanation for inert gas "urticaria" and "vertigo." Phys. Med.Biol. 18:256-264.
Hills, B.A. 1977. Supersaturation by counterperfusion and diffusionof gases. J. Appl. Physiol.;'Respirat. Environ. Exercise Physiol.42:758-760.
Hills, B.A. 1970. Vital issues in computing decompression schedulesfrom fundamentals. II. Diffusion versus blood perfusion in con-trolling blood: tissue exchange.. Int. J. Biometeorol. 14:323-342.
Keller, H. and A.A. Buehlmann 1965..Deep diving and short decompressionby mixed gases. J. Appl. Physiol. 20:1267-1270.
Krogh, A. 1919. The number and distribution of capillaries in muscleswith calculations of the oxygen pressure head necessary fof supplyingtissue. J. Physiol. (London) 52:409-415.
Lambertsen, C.J., and J. Idicula. 1975. A new gas lesion syndrome inman induced by "isobaric gas counterdiffusion." J. Appl. Physiol.39:434-443.
-148-

Morales, f., and R.E. Smith. 1948. On the theory of blood-tissueexchange of inert gases. VI. Validity of approximate uptakaexpressions. Bull. Math. Blophyp. 10:191-200.
Ohta, V., S.11. Song, A.C. Groom and L.E. Farhi. 1978. Is inert gasvashout from the tissues limited by diffusion? J. Appi. Physiol.:Respirat. Environ. Exercise Physiol. 456):903-907.
Ohta, Y. and L.E. Parhi. 1979. Cerebral gas exchange: perfusion and.diffusion limitations. J. Appl. Physiol.: Respirat, Environ.Exercise Physiol. 46(6):1164-1168.
Roughton, F.J.W. 1952. Diffusion and chemical reaction velocity incylindrical and spherical systems of physiological interest. Proc.Roy. Soc. London - Ser. B. 140:203-229.
Tepper, R.S., E.N. Lightfoot, A. Baz and E.H. Lanphier. 1979. Inert gastransport in the microcirculation: risk of isobaric supersaturation.J. Appl. Physiol.: Respirat. Environ. Exercise Physiol. 46:1157-1163.
-149-

Discussion
Q. The model's accuracy depends on the tissue, and whether or not thecapillaries really are that parallel. The vascularity is neveradequately taken into account in these cylindrical models.
A. I agree, but some investigators have begun to take vascularity intoaccount.
Q. Does your cylinder model assume the same diffusion coefficient forthe intra- and extracellular material?
A. I would be happy to use different coefficients, if you can tell mewhy they should be different. I am just lumping them together here.
Q. I think the intracellular diffusion coefficients are probably ordersof magnitude lower than extra-cellular ones, as Ling has shown inhis work. "
A. The bulk of the physiological and circulatory literature showsclearly that Krogh's diffusion coefficients are accurate. In fact,it would be very difficult to explain gas exchange across thealveolar membrane if there were very low diffusion coefficientsthere.
Q. How did Ohta and Fahri generate the curve for the whole body washout -data?
A. Line A in their figure (Fig. 6) is hand drawn, and their. data pointsfit the slope of 1.0 very nicely.
Q. Why doesn't their plot go through 0.1 at the bottom?
A. Their axes are confusing;, they only go down to 0.2. But I thinktheir data show that the system is not totally diffusion limited;there is no permeability barriet.
1!
-150-

.COUNTER-TRANSPORT OF INERT GASES:
EFFECTS OF STEADY-STATE AND TRANSIENT GRADIENTS
B. A. Hills
When we first observed the cutaneous effects of the isobariccounter-transport of gases in the chambers at Duke University in March,1970 (Blenkarn, Aquadro, Hills and Saltzman 1971), our first reactionwas to make sure that there was no contaminant in the normoxic nitrogensupplied to the head-tents of the divers a few minutes beforehand. Themagnitude of the disorder and its resemblance to classical "skin-bends"were striking, and yet in this case it was occurring without any decom-pression at a simulated depth of 200 feet during what would otherwisehave been a fairly routine "saturatioW" exposure to normoxic helium.This extensive erythematous maculopapular eruption in all three subjectswas totally unexpected and, naturally, caused my colleagues to abandonplant for a scheduled pulmonary study. Upon looking more closely at thesubjects, however, it occurred to me that the urticaria terminated atthe line around the chest, back and shoulders where the head-tent hadbeen taped down to effect a gas seal.
This was particularly interesting since it meant that this "iso-baric urticaria" was observed only where the skin was exposed to heliumwhile the blood supplied to the cutaneous vdssels had been equilibratedwith nitrogen at the lungs at the same partial pressure. Hence it wasconcluded that this was a phenomenon caused essentially by the super-position of two steady-state gradients of different inert gases in oppo-site directions -- but only when the two gases were in a particularorientation. For instance, it occurs only when helium is adjacent toepithelium and nitrogen is intrivascular, but not vice versa.
This situation also arises in'the ear, so it was particularlyinteresting when the group at the University of Pennsylvania appliedreverse gas gradients at 400 feet (Lambertsen 1976). Not only did theyconfirm our earlier findings at Duke but, without any decompression,
?L they also produced vestibular disorders indistinguishable from thoselisted as symptoms of decompression sickness. Before discussing themechanisms which have been propose& -to explain how reverse gas gradientscan induce this isobaric blood-epithelium phenomenon, it must be empha-sized that both the cutaneous and vestibular manifestations refer tosteady-state gradients rather then to any transient situation.
Steady-state vs. transient conditions
Steady-state conditions pertain in the inner ear or across theskin, since any helium diffusing across the epithelium or otherwisebeing transported towards the nearest vessels under the-tension gradientwill be removed by the perfusing blood, thus preventing any accumulation.An essentially similar situation arises for nitrogen in the oppositedirection, so that this counter-transport of different gases results inessentially static gradients of both gases. It is my preference to call
~-151-

this phenomenon "counter-transport" rather than "counter-diffusion,"since diffusion is only one of many transfer processes which might beinvolved in the passage of inert gas molecules between blood and epi-thelium. "Counter-current" is certainly not an appropriate term, sinceit implies the transfer of one solute between two streams flowing inopposite directicns rather than opposite paths for two solutes in asituation where only one medium, if any, needs to flow.
In other words, it is only the continuous removal of gas whichhas traversed the blood-epithelial barrier that makes steady-state con-ditions possible, thereby presenting the intellectual challenge ofexplaining the mechanism accounting for the isobaric cutaneous andvestibular phenomena.
By contrast, many more transient situations can occur in vivowhere, upon switching breathing mixtures, one gas can diffuse into atissue or tissue compartment faster than another can leave. This canresult in transient supersaturation if the switching occurs in thewrong direction, i.e., from a less to a more diffusible gas. Therefore,gases are switched in the opposite diriction during decompression, i.e.,from helium to nitrogen, to take adv...age of the transient unsaturationwhich can be induced. This reasoning has been exploited to great ad-vantage in the multiple inert gas switches employed by Keller andBuehlmann (1965) in formulating the decompressions for their epochaldiving experiments. Switching gases in the reverse direction, i.e.,from less to more diffusible, to provoke gas phase formation is oflargely academic interest, but the increase in the number of bubbles(D'Aoust, Smith, Swanson, White, Stayton and Moore 1979) and the in-crease in the probability of decompression sickness (Harvey 1977) foundwhen this was done tends to confirm the rationale of Keller and Buehlmann.However, this confirmation calls into question one of the major axiomson which many decompression tables have been formulated, namely, thatblood perfusion controls inert gas uptake and ininat-on from tissue.
In these transient situations.we are probably concerned with dif--, . ferent tissues than those in which symptoms can be provoked under
steady-state conditions. This is fairly obvious since, in the transientsituation, we can envisage'a "back wall" to our tissue in which theblood is both the source of supply of one gas and a sink for the .other.On the other hand, the steady-state counter-transport phenomenon re-quires a separate source for each of the two gases, each acting as asink for the other, so we are probably dealing with a very differentmechanism. In fact it would seem that the transient and steady-statemanifestations of isobaric decompression sickness are different phenom-ena, and it is unfortunate that they are sometimes given the same name.
Mechanisms for steady-state isobaric decompressionsickness
Though the transient manifestations of gas switching can be ex-plained on the basis of the same models and arguments proposed forformulating decompression tables, this is not true for the steady-state.phenomenon. The latter could be a red herring and may not be particu-larly important in commercial diving, but explaining it does present atantalizing intellectual challenge.
-152-

There is little doubt that the real mechanism is related to thegeometric requirements -- helium adjacent to epithelium separated fromblood equilibrated with nitrogen, resulting in fixed gas gradients inopposite directions. When we first discovered the cutaneous manifesta-tions (Blenkarn et al. 1971), I was working on gas-induced osmosis(Hills 1971), so this osmosis was offered as a possible explanation forthe urticaria, since the gas gradients were.ideally situated to effecta fluid shift in the direction of increasing nitrogen concentration.Though such shifts do undoubtedly occur, there is considerable doubtwhether they would be large enough to cause cutaneous manifestations ofthe magnitude observed. On the other hand, it is easier to envisagehow minimal fluid shifts across a membrane as physiologically active asReissner's membrane could cause the vestibular manifestations. Thisreasoning is compatible with the results of some preliminary studies(unpublished observations) on four monkeys in which we found thatnystagmus can be induced simply by ventilating one middle ear withnitrous oxide and the other with helium, having previously humidifiedboth gases at body temperature. Moreover, the direction of nystagmuswas reversed upon switching gases.
On the other hand, in the skin, any effects of osmotically inducedfluid shifts are probably minimal compared with those of the bubblesformed and demonstrated so convinc7ngly by Idicula, Graves and Quinn(1976). The ingenious explanation offered for those bubbles was counter-diffusion supersaturation (Graves, Idicula, Lambertsen and Quinn 1973),a concept which is based upon a tissue bilayer of two solvents for thetwo gases - one aqueous and one fatty, and both of comparable thickness.Though this is a plausible mechanism to offer for isobaric urticaria, itis inappropriate to explain vestibular manifestations since there is nofat in the inner ear or, at least, there is no lipid layer of adequatethickness to cause any degree of supersatuation.
In this connection it musi'be remembered that, in vivo, we are not*- dealing with inert gases alone. An local increase in total inert gas
tension must be greater than the inherent unsaturation caused by themetabolic gases (Hills and LeMessurier 1969) before there can be a netsupersaturation and, hence, before bubbles can form. The inherent un-saturation essentially arises from the metabolic conversion of oxygeninto a much more soluble gas (CO2), and must be incorporated into anypredictions of overall supersaturation.
To return to the observation made above, the lack of enough fatin the inner ear to comply with the counter-diffusion model has led meto suggest that processes other than diffusion can influence the opposinggas gradients.
Counter-perfusion model
It is, perhaps, rather ironic for me to argue that blood perfusionas a process makes an appreciable contribution to gas tension gradients..However, if a circulation-controlled compartment representing the bloodvessels is placed in series with a single diffusion barrier (i.e., amonolayer) to form the model shown in Fig. 1, then supersaturation can
-153-
Fig. 1. A readily diffusible gas (I) removes from outer surfaceof epithelium any of a less diffusible gas (II) which haspermeated this diffusion barrier from the perfused zone suppliedwith blood free of gas I but saturated with gas II at theambient pressure, P. By adding gas tensions, it can be seen thatthe effectively stirred pool and hence the overflow (venous blood)becomes supersaturated (Pl + P2 > P) as the system attains steadystate. From hijIj 1977.
-154-
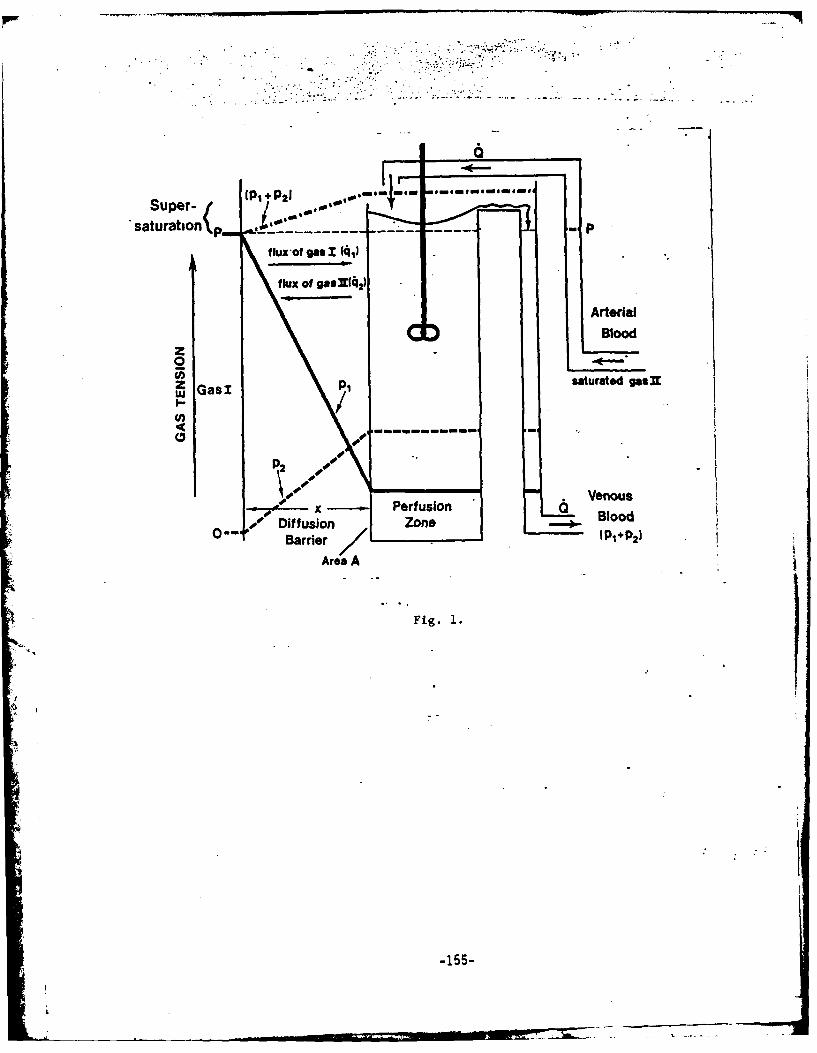
.,79
Sup(PI + P21 04,0.m ai mom n emmmm
SatUration\p. eea.'.- -P
f lux -of gas 1 (41
flUX Of gaSllq 2)
ArterialBlood
0 -
GasI p1 saturated gasnw
P2
.4 x Perf usion Venous
0-- ~ Diffusion ZoneBloBarrier P+ 2
Area A
Fig. 1.
-155-
be produced in the steady state without invoking any fat. This modelhas been presented (Hills 1977) as a "counter-perfusion" mechanism,although "counter-transport" might be a more appropriate term since theprocess also involves diffusion. In addition to its compatibility withthe inner ear, the counter-perfusion model (Fig. 1) would indicate thatthe greatest level of supersaturation should occur in the vessels.This is compatible with the findings in experimental animals at theUniversity of Pennsylvania (Cunnington, Lambertsen and Cowley 1978),where it was found that the opposing gas gradients cause a continuousstream of venous bubbles. Hence this model may be more appropriatethan counter-diffusion for explaining the cutaneous as well as thevestibular manifestations of isobaric counter gradients. This wasessentially the conclusion of Collins (1978) after his comprehensivestudy of counter-transport phenomena using many pairs of differentgases and gases other than helium and nitrogen.
Conclusion
These arguments may sound very academic and appear to be divorcedfrom the reality of naval or commercial diving, but isobaric decompres-sion sickness has occurred in the field when a diver at about 150 feetbreathed air on BIBS while still in the heliox environment of the bell.Moreover, vestibular symptoms are very common after transfer from the....bell to the deck decompression chamber-,ie.,-from heliox to air. Henceit would seem desirable in commercial diving to minimize the likelihoodof counter-gradients of nitrogen and helium occurring between the gascavity of the middle ear and the blood perfusing the inner ear. Meanswhich we have used to effect this and have tested to avoid vestibularproblems in 40 man-exposures to 500 and 600 feet include:
(a) Use of Trimix to reduce the nitrogen gradient upon transfer-ring from the bell to air in the deck decompression chamber.
(b) Compressing the first 100 feet while breathing air on BIBSin the bell to push some- nitrogen into the middle ear and
-' thus to reduce the nitrogen gradient upon switching to thedeck decompression chamber during the subsequent decompres-sion (although most of this N2 would be washed out over a"saturation" exposure -- .which could explain the higher pre-ponderance of vestibular problems in this mode of diving).
(c) Slowly venting the bell 7with air. for the hour or so beforetransfer to the deck decompression chamber.
Though our results do not prove that these measures were respon-sible for preventing vestibular symptoms, they are. simple to incorporateinto diving practice. They present no new hazards and, it is hoped,could reduce the incidence of the symptoms which opposing gradients ofdifferent gases can provoke -- whatever the mechanism(s) involved.
-156-

References
Blenkarn, G.D., C. Aquadro, B.A. Hills and L.A. Saltzman (1971).Urticaria following sequential breathing of various inert gases at7 ATA: A possible manifestation of gas-induced osmosis. AerospaceMed. 42:141-146.
Collins, J.M. (1978). Isobaric inert gas supersaturation: observations,theory and predictions. J. App1. hysiol. 44:914-917.
Cunnington, J.P.W., C.J. Lambertsen and J.R.M. Cowley. The dynamicsand composition of spontaneous, continuous gas embolism in the pigduring isobaric gas counter-diffusion. In: C.W. Shilling and M.W.Beckett, Proceedings of the Sixth Symposium of Underwater Physiology.Bethesda: Federation of American Societies for Experimental Biology,1978.
D'Aoust, B.G., K.H. Smith, H.T. Swanson, R. White, L. Stayton and J.Moore (1979). Prolonged bubble production by transient isobariccounter-equilibration of helium against nitrogen. Undersea Biomed.Res. 6:109-126.
Graves, D.J., J. Idicula, C.J. Lambertsen and J.A. Quinn (1973).Bubble formation resulting from counter diffusion supersaturation:a possible explanation for inert gas urticaria and vertigo. Physics.Med. Biol. 18:256-264.
Harvey, C.A. (1977). Shallow saturation hyperbaric exposures to nitro-gen-oxygen environments and isobaric switches to helium-oxygen.Undersea Biomed. Res. 4:A15. (Abstract only)
Hills, B.A. (1971). Gas-induced osmosis as a factor influencing thedistribution of body water: "Clin. Sci. 40:175-191.
Hills, B.A. (1977). Supersaturation by counterperfusion and diffusionof gases. J. Appl. Physiol. 42:,38-760.
Hills,. B.A. and D.H. LeMessurier (1969). Unsaturation in living "tissuea relative to the pressure and composition of inhaled gas and its sig-:
nificance in decompression theory. Clin. Sci. 36:185-195.
Idicula, J., D.J. Graves and J.A. Quinn. Bubble formation resultingfrom the steady counterdiffusion of two gases. In: C. J. Lambertsen.Proceedings of the Fifth Symposium on Underwater Physiology.Bethesda: Federation of American Societies for Experimental Biology,1976.
Keller, H. and A.A. Buehlmann (1965). Deep diving and short decompres-sion by breathing mixed gases. J. Appl. Physiol. 20:1267.
-157-

Lambertsen, C.J. Collaborative investigation of limits of humantolerance to pressurization with helium, neon and nitrogen. Simu-lation of density equivalent to helium-oxygen respiration at depthsto 2,000, 3,000, 4,000 and 5,000. feet of sea water. In: C.J.Lambertsen. Proceedings of the Fifth Symposium on UnderwaterPhysiology. Bethesda: Federation of American Societies forExperimental Biology, 1976.
-158-

SESSION III. CLARIFICATION OF TERMINOLOGY
Chairman: C. J. Lambertsen
Session IIISession III. Panel Discussion
Dr. Labertsen: The purpose of this open discussion is to arrive, at
a systematic identification of words that will describe
the variety of phenomena we have been discussing in the
workshop so far. I have put on te board a rough outline
of the different gas movement situations we have been
talking about; the outline will serve as a base, to ensure
that we are all talking about the same things (Fig. 1).
Fig. 1 here - Sch&matic of coumterdiffusion,
terminology, drawn by Dr. Lambertsen
There are some surface-related phenomena that occur
when the gas being breathed differs from the surrounding
gas; we know the skin is involved, and that the eye is
part of the body's surface. The ear is in the same category;
we don't know whether the inner ear is involved in patho-
logical processes, but we do know that something is happening
to drive gas across.the tympanic membrane. Continuing with
surface-related events, the mucosa would have to be part
of the picture, because we'think of it as separate from
the skin.
There are other exchange-related situations that occur
beneath the body's surface: in the gut, the middle ear, and
other deep tissues. And sometimes, both deep and surface-
related phenomena occur simultaneously or in rapid sequence.
With that as an introduction, let's open the topic of
terminology up for discussion.
-160-

Session III
Dr. Farmer: -Inner ear problems related to gas changes have been..
clearly identified, but there is no evidence that the-
middle ear is involved in these situations; the post-dive
audiologic studies of the Predictive Studies IV divers
do not show middle ear injury. It is possible that the
middle ear played a role iA these inner ear incidents; if
there is heliox in the external auditory canal and the
inner ear is saturated with heliox, and another inert
gas mixture is introduced, there probably will be mixing
problems across the round window membrane. I don't think
changes in middle ear pressure per se play a major role,
but I'm not prepared to exclude pressure changes from
consideration altogether. In addition to any changes
occurring across the round window membrane, a situation
has occurred in which one .compartment is differentially
perfused, which makes it more than likely that something
definitely has occurred in the inner ear.- We need to
devise a method of doing the tympanometry of pressure,
taking into account that the characteristics of sound
transmission change drastically with certain gases, such
as helium. At Duke, we ha~ve calibrated transducers for
helium down to 1000 fsw, and easurements obtained with
those could be used. But I think the inner ear shoild
be the focus of our immediate attention.
.Discussant: Since we are talking about diving, a context in which
the words "deep" and "surface" have specific meanings that
-161-
differ from the ones intended here, I think we should use
other words to describe physiological counterdiffusion
effects in the body. Another thing that should be clearly
kept in mind is that there are both temporary (transient)
and continuous (steady-state) phenomena.
Dr. Hemplemen: Looking at Dr. Labertsen's list, I think we all ought
to be able to agree to the use of the term "isobaric,"
which is unavoidable in discussing this phenomenon.
Dr. Lambertsen: Other words on the list that have been used are inert
gases, counterdiffusion, supersaturation, deep tissue, sub-
saturation, counterperfusion, superficial, countercurrent,
and mass transfer. It should be noted that gases other than
inert gases, such as oxygen and carbon dioxide, are often
involved in these situations; also, I-have deliberately not
used the term gas transfer7, which is-often misused.
Dr. Hempleman: We need words to describe the isobaric switching of
ambient gas, and I ihfnk we should avoid words primarily
related to modeling, like counterdiffusion and counter-
perfusion. To my.mind, the one key word is supersaturation.
Dr. Vann: There are four possibilities externally that arise from the
situation we're talking about: the breathing gas. can be
changed, or the environmental gas can be changed; both can
be changed; neither can be changed; or either one can be
changed. That is the "action" level -- there is also the
symptom level, and the level of mechanisms. There should
be three sets of words, one associated with each level.
-162-
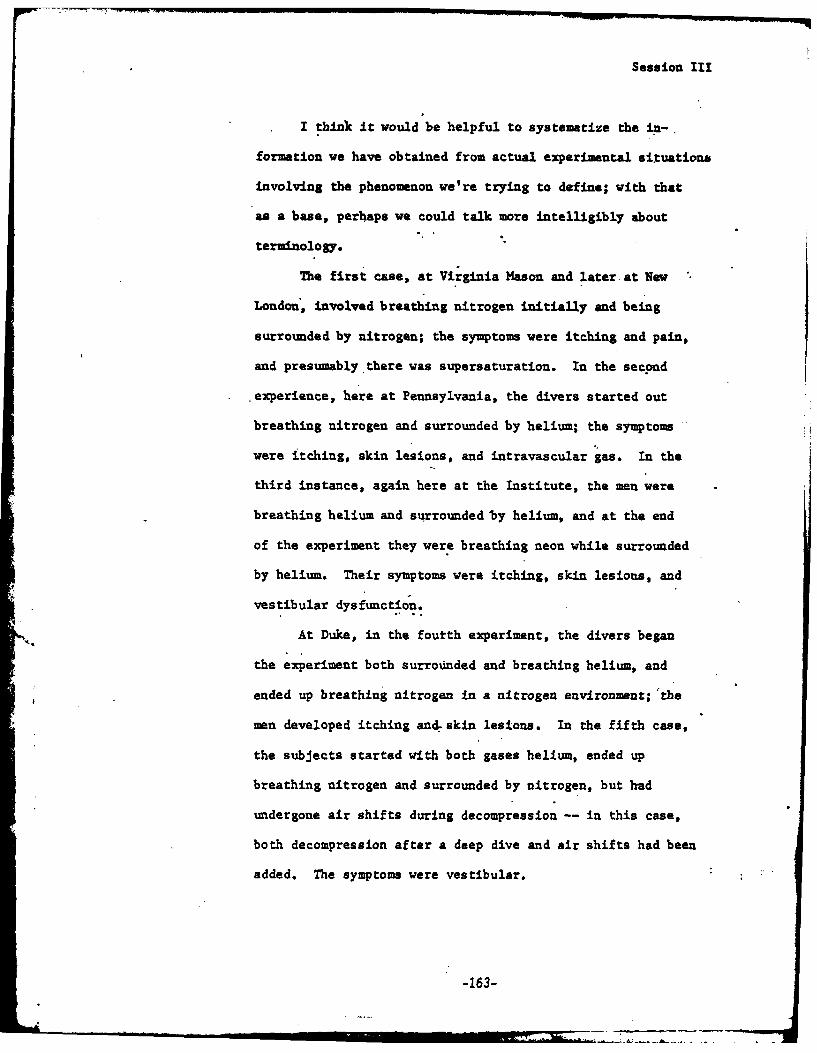
Session III
I think it would be helpful to systematize the in-
formation we have obtained from actual experimental situations
involving the phenomenon we're trying to define; with that
as a base, perhaps we could talk more intelligibly about
terminology.
The first case, at Virginia Mason and later at New
London, involved breathing nitrogen initially and being
surrounded by nitrogen; the symptoms were itching and pain,
and presumably there was supersaturation. In the second
experience, here at Pennsylvania, the divers started out
breathing nitrogen and surrounded by helium; the symptoms
were itching, skin lesions, and intravascular gas. In the
third instance, again here at the Institute, the men were
breathing helium and surrounded by helium, and at the end
of the experiment they were breathing neon while surrounded
by helium. Their symptoms were itching, skin lesions, and
vestibular dysfunction.
At Duke, in the foutth experiment, the divers began
the experiment both surrounded and breathing helium, and
ended up breathing nitrogen in a nitrogen environment; "the
men developed itching and.-skin lesions. In the fifth case,
the subjects started with both gases helium, ended up
breathing nitrogen and surrounded by nitrogen, but had
undergone air shifts during decompression -- in this case,
both decompression after a deep dive and air shifts had been
added. The symptoms were vestibular.
-163-

Session III
In the Keller-Buehlmann dive, they started out with
helium and helium, and ended with nitrogen and nitrogen;
.theirs was an undersaturation situation, presumably.
Finally, there is another coubinapion that is used in the
laboratory: begin with helitsm breathing while surrounded
by nitrogen, and continue with the same gases throughout:
no problems develop. Maybe reviewing these experimental
situations will help us to find the right words to describe
what we have seen.
Dr. Yount: It is important to remember, despite the fact that we have
all agreed that the highest box on the terminology chart
should say "isobaric," that we often encounter gas exchange
problems during decompression; using the general term
isobaric misses the synergism involved when gas exchange
and decompression act cumulatively. I have developed a
glossary of terms; after I present it, perhaps we could
discuss it.
Exogenous gas bubble disease: A disease syndrome associated
with the formation, via external causes, of gas bubbles in
blood or tissue.
Decompression sickness: A form of exogenous gas bubble
disease in which a state of supersaturation is achieved
by reducing the ambient pressure.
Multiple inert gas bubble disease: A form of exogenous gas
bubble disease in which a state of supersaturation is achieved
by using two or more inert gases, either sequentially or
simultaneously.
-164-
0001MR!"

0=**J.UA LAA.
Isobaric supersaturation: A state of supersaturation pro-
duced at constant ambient pressure, for example via inert
.gas exchange or a temperature change leading to reduced
solubility.
Isobaric multiple inert gas, supersaturation: A state of
supersaturation produced at a constant ambient pressure by
using two or more gases, either sequentially or simultaneously.
Sequential inert gas supersaturation: A state of super-
saturation produced by using two or more inert gases
sequentially.
Simultaneous multiple inert gas supersaturation: A state
of supersaturation produced by using two or more inert
gases simultaneously.
Isobaric: at constant pressure. A process is isobaric
over some time interval if there is no significant change
of pressure during that interval. Mathematical definition:
A process is isobaric over some time interval if this
equation
lim -P - 0
is satisfied throughout that interval. Practical definition
for inert gas exchange: A process is isobaric if there is
no significant change in pressure during a time interval
long enough to permit a substantial exchange of inert gas.
Dr. Lambertsen: I think that glossary is an excellent beginning, and
perhaps what we should do is assemble a small group at
-165-
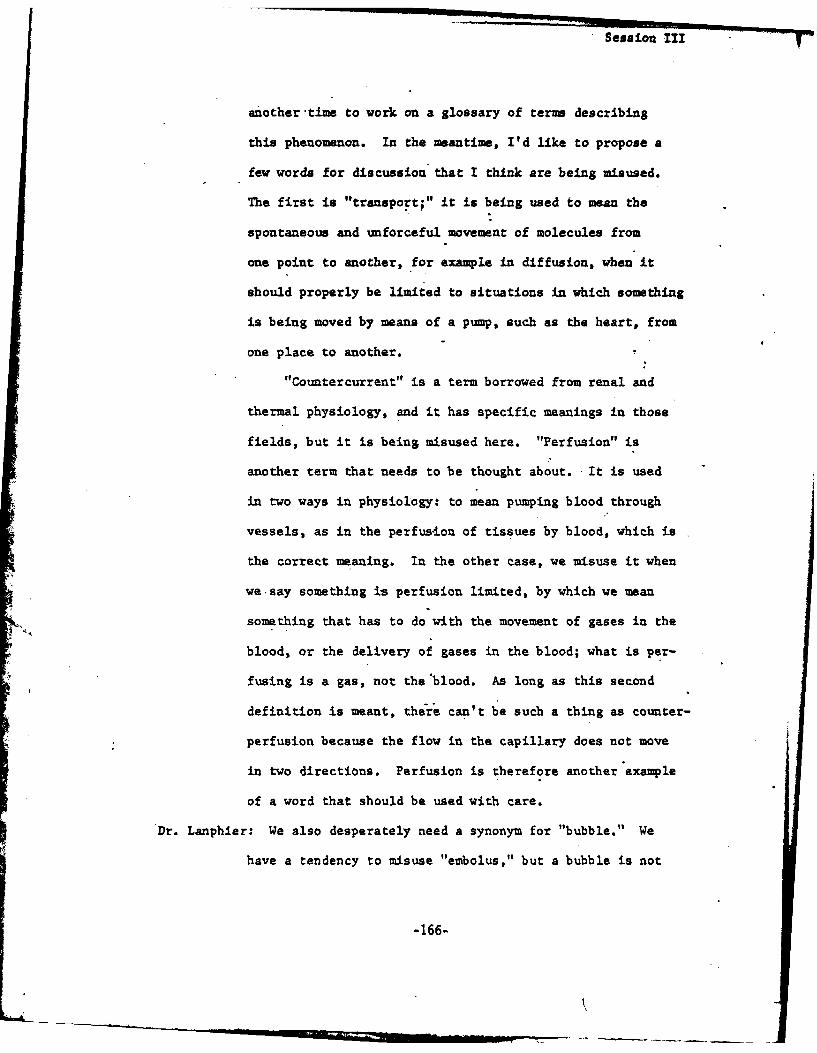
Session III
another time to work on a glossary of terms describing
this phenomenon. In the meantime, I'd like to propose a
few words for discussion that I think are being misused.
The first is "transport;" it is being used to mean the
spontaneous and unforceful movement of molecules from
one point to another, for example in diffusion, when it
should properly be limited to situations in which something
is being moved by means of a pump, such as the heart, from
one place to another.
"Countercurrent" is a term borrowed from renal and
thermal physiology, and it has specific meanings in those
fields, but it is being misused here. "Perfusion" is
another term that needs to be thought about. -It is used
in two ways in physiology: to mean pumping blood through
vessels, as in the perfus-ion of tissues by blood, which is
the correct meaning. In the other case, we misuse it when
we-say something is perfusion limited, by which we mean
something that has to do with the movement of gases in the
blood, or the delivery of gases in the blood; what is per-
fusing is a gas, not the'blood. As long as this second
definition is meant, there can't be such a thing as counter-
perfusion because the flow in the capillary does not move
in two directions. Perfusion is therefore another example
of a word that should be used with care.
Dr. Lanphier: We also desperately need a synonym for "bubble." We
have a tendency to misuse "embolus," but a bubble is not
-166-

an ewbolus until it lodges somewhere. We have not
maintained that distinction during this workshop.
Dr. Farmer: Since the purpose of these workshops is information and
its dissemination, and since we have been unable to reach
a consensus on terminology, the report of this workshop
should s-imply include the suggestions for terminology
that have been put forward here.
Dr. Lambertsen: Let's end this session by saying that we will have
another smaller meeting in the future, at which we dill
try to develop the terminology to describe the complex
phenomenon we are dealing with; at that time, we will try
to keep several aspects of the phenomenon, including
clinical observations, dperational considerations, and
laboratory circumstances, in mind.
-q
-167-
SESSION IV. INPLICATIONS IN OPEN SEA AND CHAM3ER
OPERATIONS, DECOM4PRESSION AND THERAPY
Chairman: R. C. Boramann

Field Ops
Session IV. General Discussion
Dr. Bornmann: It is important to remember that certain dynamics having
to do with the characteristics of the gas, the character-
istics of the delivery', and the characteristics of the
membrane determine whether 6r not bubbles will form; for
example, if the order of presentation of the gases is
reversed, nothing of practical consequence happens - no
bubbles occur. In our four-choice box, the presentation
or inside-outside relation of the gases makes a great-
difference. The complex nature of the phenomenon we're
studying should also be kept in mind. And further, when
we analyze the practical risk involved, we need to determine
what, theoretically, the possibility is that something will
happen, and then to calculate, given the possibility under
certain circumstances, what the likelihood in a specific
instance is that it will happen. Finally, the magnitude
of the risk that would occur if all of these things fell
into place needs to be determined. We know that when a
diver decompresses, there are bubbles all over the place,
but very few of these divers develop decompression sickness.'
Dr. Lambertsen: It will be helpful to list practical field or laboratory
situations that involve a gas change under three categories:
compression, decompression, and recompreision. One example
of an inert gas change that has been conducted for 40 or
50 years is helium diving after air saturation; this gas
change might present problems if the dive was deep enough.
PzlLCL h. I;A~ bLAhS.4 n1
-170-
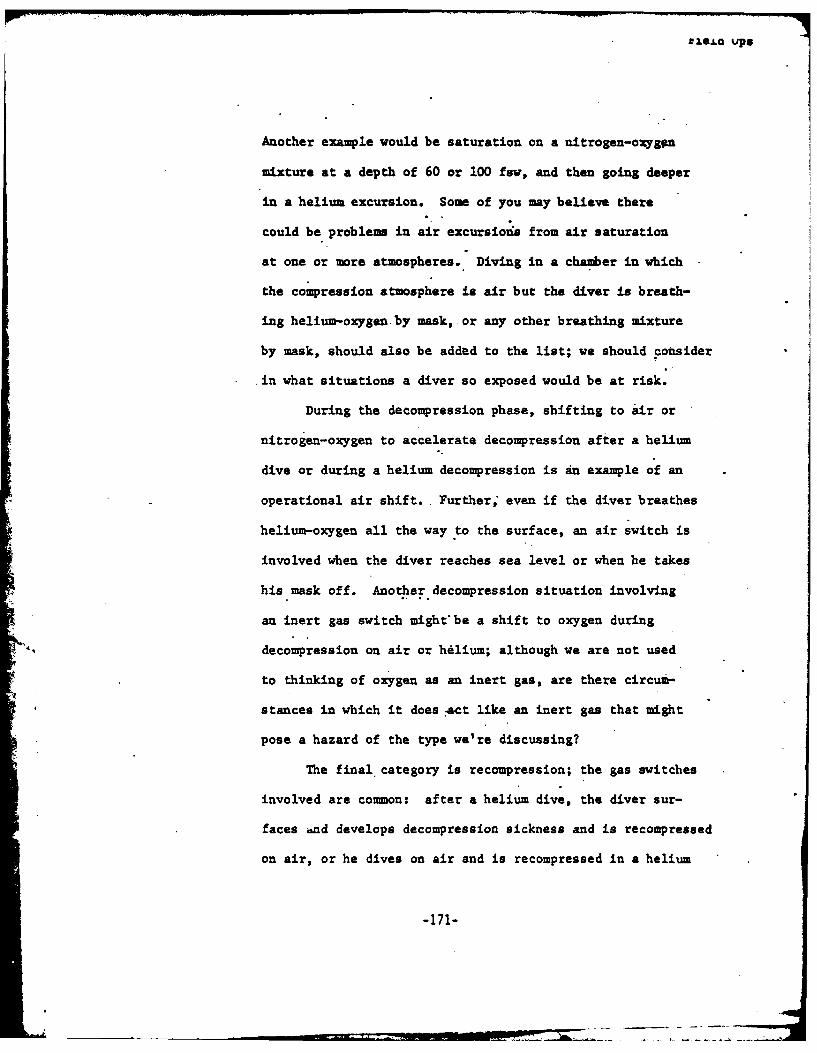
lic.L ups
Another example would be saturation on a nitrogen-oxygen
mixture at a depth of 60 or 100 fsw, and then going deeper
in a helium excursion. Some of you may believe there
could be problems in air excursiots from air saturation
at one or more atmospheres. Diving in a chamber in which
the compression atmosphere is air but the diver is breath-
ing helium-oxygen, by mask, or any other breathing mixture
by mask, should also be added to the list; we should consider
in what situations a diver so exposed would be at risk.
During the decompression phase, shifting to air or
nitrogen-oxygen to accelerate decompression after a helium
dive or during a helium decompression is an example of an
operational air shift.. Further; even if the diver breathes
helium-oxygen all the way to the surface, an air switch is
involved when the diver reaches sea level or when he takes
his mask off. Another decompression situation involving
an inert gas switch might be a shift to oxygen during
decompression on air or helium; although we are not used
to thinking of oxygen as an inert gas, are there circum-
stances in which it does act like an inert gas that might
pose a hazard of the type we're discussing?
The final category is recompression; the gas switches
involved are common: after a helium dive, the diver sur-
faces and develops decompression sickness and is recompressed
on air, or he dives on air and is recompressed in a helium
-171-
atmosphere. Or the diver breathes oxygen by mask and is
recompressed. We should classify these and other opera-
,tional gas switching situations as not hazardous, hazardous
under limited circumstances, or h4zardous in general.
Dr. Lanphier: There are some situations .at normal pressure that should
also be discussed. For. instance, some concern has been
expressed about difficulties that might arise when respiratory
physiologists switch from sulfur hexafluoride to helium,
and there are also anesthetic situations, such as switching
from halothane breathing, that have the potential to be
hazardous. There has probably not been much difficulty in
the past because the contentrations of halothane are.so
low, and probably no one has been exposed to sulfur hexa-
fluoride long enough to saturate on it.
Switching from air t6 helium does, according to our
calculations, produce a fair amount of supersaturation,
especially if the cAr6iatographic model is correct. However,
*- in diving this is apparently an innocuous event; has anyone
made such a switch and then taken the animal or subject to
altitude? That might provide us with an index of the hazard..
Discussant: Something of that sort was done in the Apollo program; they
switched to a helium atmosphere and then went to altitude.
There was more decompression sickness with helium than
with nitrogen; the onset of decompression sickness occurred
earlier.
Dr. Flynn: An isobaric category should be added to the list. For example,
-172-

.IC.LQ Wpm.
in the Deep Submergence Rescue Vehicle (DSRV) program,
we intend to transfer at. 132 few from nitrox saturation
to helium saturation. Another isobaric gas switch occurs
when, in an experimental situati6n, there is trimix in
the chamber and the physiologist wants to study the
effects of helium breathing. Both of these situations
involve washing out some nitrogen and washing in helium.
Dr. D'Aoust: Several diving companies have tried welding in an argon
atmosphere while the diver breathes helium; this permits
them to weld dry, and is another operational example of
isobaric inert gas counterdiffusion conditions.
Dr. Labertsen: It is important to remember that these categories of
events are not mutually exclusive: any point during com-
pression, decompression, or recompression at which the
pressure is held steady is an isobaric point.
Dr.' Hempleman: Another situation where there is one gas around the
body and another is being breathed occurs during short
excursions in water of moderate temperature when the diver
is breathing helium but air is serving as the insulating
blanket in the suit.
Discussant: We have been doing dives to as deep as 140 fsw for 10
minutes in a no-decompression dive or to 100 fsw for
60 minutes while the chamber is compressed with air and.
the diver is breathing helium-oxygen by mask. From what
I have read about counterdiffusion, this sort of situation
should present no hazard; however, we are planning to go
-173-

Yi.eld Ups
as deep as 300 fsw for 30 minutes soon. as there been
any operational experience, or are there theoretical
considerations, that should be taken into account before
we do that?
Dr. Hempleman: We have done divea of that sort in the past, but they
have and should only be short dives; if the breathing
system fails, the diver must be decompressed immediately
into a zone of safety because he is breathing very high
partial pressures of nitrogen and oxygen. Of course, this
is not a counterdiffusion problem.
Discussant: Any time a diver comes off the mask for any reason, he
takes on nitrogen; when he switches back to the mask, the
same kind of situation would be created as with a helium
switch after nitrogen saturation, especially in rapidly
exchanging compartments. There don't seem to be problems
except after a long period of saturation; short transitions
don't appear to cause trouble.
Dr. Hempleman: In Link's early saturation work, a greater degree of
nitrogen narcosis was observed than could be accounted
for by the air partial pressure. I think it's possible
that counterdiffusion may have been involved somewhat.
There has also been the suggestion that the Link divers
had some vestibular involvement. Also, in commercial
diving it is common for the diver to breathe helium on
mask in the deck decompression chamber when the bell is
-174-
~ .& -
Field Ops
in air. I have never heard of difficulties with this
situation, even at 500 fs.w.
Dr. Lanphiert. We should be cautious about saying that certain situa-
tions are safe on the basis of a ielatively limited
exposure. When considering'a situation such as the
possibility of vestibulat problems in the Link experi-
ments, we should avoid saying that nothing untoward
happened until the.data have been looked at in that light.
Cdr. Smith: I am wondering whether there are percutaneous absorption
risks in a rescue situation where a rescuer wearing a
Scott Air Pack or a rebreather enters a gaseous or
petroleum vapor atmosphere, at any pressure or at sea:
level pressure.
Dr. Lambertsen: The question is a very interesting one, and it should
be investigated, but it goes beyond the scope of this
workshop.
Dr. Vann: In the past, after a helium-roxygen dive we have recompressed
the diver on air, or oxygen for the shallower Table 5 or
Table 6. Are there circumstances in which we should
consider using helium for recompression?
Discussant: One such situation occurs when a diver has had an omitted
decompression or an air embolism and it is clear that
recompression to 165 fsw is not going to'save the diverts
life.
Dr. Vann: Are counterdiffusion problems likely in the situation you
des cribed?
-175-

Y1e.L ups
Discussant: Probably not, at least during the recomptession phase,
because any gas is being compressed. When helium has been
used to recompress, it has been very effective, prin-
cipally because helium makes more oxygen available to the
tissues than nitrogen does.
Dr. Bennett: Counterdiffusion was one of the things we worried about
at Duke, and the treatment John Miller and others have
developed therefore calls for recompressing to 165 fsw
and then saturating on 0.5 atmospheres of oxygen. We
feel this technique is preferable to trying to Judge
whether going deeper on helium will provide a sufficient
safety factor in a particular case.
Discussant: The Duke experience, which involves treating individuals
whose decompression has been delayed by several hours, is
very different from the omitted decompression or embolism
situation that was .posed earlier. Two examples of the
omitted decompression or "embolism problem are the accidents
on the U.S.S. Chanticleer and the U.S.S. Skylark, in which
the divers blew up from a. tremendous depth and either
walked into the chamber or regained consciousness while
being recompressed on air, only later to lapse into
unconsciousness. and die. I think that either recompressing
to 300 or 400 fsw with helium or saturating would have
dealt with the gas phase and permitted these men to be
stabilized. The question being posed is: Does the benefit
-176-

Yleld Ups.
of the increase in static pressure outweigh the risk
associated with counterdiffusion?
Discussant: There was a case of blow-up in the Gulf recently, where
the man came up from 250 fsw. He was initially recom-
pressed to 190 faw on air because the rig didn't have
any helium. After 6 hours at 190 fsw, they transferred
him to a rig that had helium saturation capability, and
this treatment was effective. The diver has some residuals,T
but the wonder is that he's alive at all.
Dr. Lanphier: In the perfusion-limited gas exchange model, one would
predict, with a 2.6 to 1.0 nitrogen to helium ratio,
that an isobaric shift at 165 fsw would cause some over-
pressure. If one shifted and recompressed an additional
200 fsw, the supersaturation would be destroyed.* If one
shifted at 60 fsw, there would be a smaller overpressure
that would disappear with an additional 20 fsw of recom-
pression. This phenomenon is a result of an oxygen window
caused by increasing pressure at a greater rate than the
gas pressure is increasing. At least theoretically, then,
if a gas switch was acco-mpanied simultaneously by recom-
pression, overpressure problems might be avoided.
Discussant: Some recent gelatin experiments of Ed Beckman's show that
bubbles formed at high pressures require higher pressures
to eliminate. The implication for a treatment table would
be that symptoms with onset at depth require treatment at
-177-

Field Ops
deeper depths than symptoms with shallow onset or surface
onset.
Discussant: In an operational situation of a blow-up from 450 fsw
after 30 minutes at that depth, and with helium satura-
tion capability available,.it is safe to say that the
coumterdiffusion effects can be ignored.
Dr. Bennett: In the Gulf, they often recompress to 165 fsW on air,
and stay there for the prescribed treatment time. But
at the end of the air treatment, if the patient isn't
improving, they have to make a decision whether or not
to switch to helium.
Discussant: Another difficult operitional situation occurs when .the
NOAA Ops procedure is being used. For example, a diver
is saturated on nitrox at 100 fsw, makes an excursion
on nitrox to 250 fsw, and then presents with vestibular
symptoms on his return to 100 fsw. There are three
treatment options: the diver could be brought from the
habitat in a bell and transferred to a deep diving system;
he could be transferred into a nitrox environment at
100 fsw and then be recompressed deeper with helium; or7"'
he could be transferred at 100 faw and then be recoi-
pressed deeper with nitrox. What treatment would be best
in these circumstances?
Discussant: It would be best to recompress him to 200-225 fsw on
nitrox, rather than using helium at that nitrox satura-
tion level. I would not compound the vestibular problem
-178-
oMW
r1eJLa ups.
by switding gases; thus far, recompressing to 3 ATA
deeper than symptom onset depth has worked well with inner
.ear problems.
Discussantt If you can compress faster than the transient potential
supersatUration, you will bo safe. If you have to switch
to helium to go deeper, the best way to do it is just by
topping off with it, slowly.
Discussant: Using the diffusion-limited model, there would be more
and more driving force for gas coming into the tissue, .the
same driving force as is available for gas out of the tissue.
Dr. Lambertsen: It is essential to avoid setting up rigid rules about
what can or cannot be done in certain instances. In
actual operational situations, there are many factors to
be considered: the oxygen partial pressure, the inert gas,
the rate and degree of comression, the equipment available,
and the seriousness and time limitations of the symptoms
you'are dealing with."'
Discussant: It seems clear that the risks associated with counter-
diffusion do not outweigh the need for prompt recompression.
Vascular emboli are not a short-term problem with counter-
diffusion - they do not develop for many hours..
Dr. Farmer: The vestibular incidents that occurred during decompression
from a deep helium-oxygen dive and after.an air shift were
decompression sickness incidents rather than counter-
diffusion or counterperfusion phenomena. I think a he'ium
bubble that formed deep was stimulated by the air shift
-179-

Field Ops
to the point where it became clinically significant. The
situation may have been aggravated by counterdiffusion
'effects, however. The diver with an inner ear problem
should be recompressed'with the same or similar breathing
mixture as was used in the dive.
Dr. Lambertsen: Since what you are recommending runs counter to therapy
and decompression theory, would you explain the basis for
your opinion?
Dr. Farmer:. It is based on my intuitive feeling that the bubble causing
the problem is a helium bubble. Drs. Miller and Bennett
agree with my treatment recommendations, although we have
only subjective and clinical evidence to rely on.
Discussant: However, in cases other than those invoJving the inner ear,
we have been using air for recompression of type - decom-
pression sickness for decades, and this procedure has been
effective, simple, and economical.
Dr. Lambertsen: And air treatment in those circumstances also has
advantages, theoretically -- that is the important part.
Discussant: The vestibular hit and the peripheral hit are physiologically
not the same. The tissues involved in the peripheral event
are perfusion limited. The vestibule, however, has a fluid
reservoir, which acts both as a source and a sink for gas
molecules, and there may be a diffusion b'arrier in the
surrounding tissue. It is easy to imagine that the inner
ear situation resembles that of the skin, in which a diffused
-180-
-i

-iela ups
subcutaneous base lies under a horny diffusion layer.
A similar situation would occur in any compartment, for
example in the bowel, with nitrogen coming in through the
wall and a helium reservoir inside the bowel. The cerebral
spinal fluid, and perhaps the vitreous humor, are other
examples.
Discussant: Dr. Hempleman, is it still your opinion that the percent-
age of inner ear injuries that occur in deep decompres-
sion sickness on very deep helium-oxygen dives is higher
than for shallow or moderately deep helium-oxygen dives?
Dr. Hempleman: My opinion has altered only to the extent that I would
now say that on such dives the likelihood of any type II
incident is higher than experience at shallower depths
would indicate; I would not now limit the statement to
inner ear incidents only.
Dr. Lanphier: Dr. Bennett, would you expand on your statement that
more oxygen is available 'to the tissues with helum than
with nitrogen?
Dr. Bennett: In some experiments with cats, which have been published
in the Journal of Applied.Physiology, we measured the
available oxygen in the cortex. We used 35 psi of oxygen,
and added up to 132 psi of helium, and also did this with
other gases such as nitrogen and argon. We found that
when helium and oxygen were used, the amount of oxygen
available was almost the same as if oxygen alone had been
-181-
Yield Ops
used. The amount of oxygen became progressively less
when nitrogen was used, and continued to fall with argon.
Dr. D'Aoust: Some other work that points to the mysteries of helium
was done by Larry Raymond, who found that breathing helium-
oxygen increased the time until ventricular fibrillation
was reached by 25Z, compared to nitrogen-oxygen breathing.
He suggested that the diffusions of the two gases in the
lung might be responsible.
Dr. Lambertsen: In closing the workshop, I would like to say that it
has been successful -- many topics of interest have been
raised, and several problems have been recast as questions
for research, the results of which will appear over many
years.
-182-

104CASIFID a ilI CF/G fine ML

SECURITY CLASSIFICATION OF THIS PAGE ("ohien Data E n
REPORT DOCUMENTATION PADr. Peter B. Bennett 1. REPORT NUMBE R.
DirectorF.G. Hall Environmental ResearchLaboratory 4. TITLE (and Subtitle)
Duke University Medical CenterBox 3823 Isobaric Inert Gas Counterdiffusio
Durham, NC 27710
Senior Medical Officer 7 Editor
Underwater Medicine Marthe Beckett KentInstitute of Naval MedicineAlverstoke 9. PERFORMING ORGANIZATION NAME AND ADDRESS
Gosport, Hants, P012 2DLUnited Kingdom Undersea Medical Society, Inc.
9650 Rockville Pike, Bethesda, MDMr. Peter 0. Edel i. CONTROLLING OFFICE NAME AND ADDRESS
Sea Space Research Company2248 Potomac Street SameMarrero, LA 70072
14. MONITORING AGENCY NAME & ADDRESS(It dilferent fr
Dr. C.J. LambertsenDirectorInstitute for Environmental MedicineUniversity of Pennsylvania MedicalCenter 16. DISTRISUTION STATEMENT (of this Report)
Philadelphia, PA 19104
Only to the Navy Distribution LisDr. Claes E.G. Lundgren
Department of Physiology120 Sherman HallSchool of Medicine & Dentistry 17. DISTRIUTION STATEMENT (of the abstract entered In
SUNY at BuffaloBuffalo, NY 14214
Dr. R.D. VannDepartment of Anesthesiology IS. SUPPLEMENTARY NOTES
Duke Un-versity Medical CenterDurham, NC 27710 Report of Workshop co-chaired by
Capt. Robert C. Bornmann, MC,USN,Dr. Paul Webb
Webb Associates 19. KEY wORDS (Continue on revere side It nece sar d I
P.O. Box 308Yellow Springs, OH 45387 Isobaric- supersaturation - count
decompression - therapy of decompDr. Edmundo AshkarDirectorHyperbaric and Envronemtal 20. ABSTRACT (Continue an ,reere side It necessamad hI
yerarc nde ro This was the 22nd Workshop of theResearch Center by the Office of Naval Research uUniversity of Buenos Aires were 32 participants representingBuenos Aires, Argentina agencies and universities but all
The co-Chairmen were Prof. Dr. ChBornmann, MC,USN.
DO IIM 1473 EDITION OF I NOV45 IS OSOLE
S'N 0102- LF-014-6601