Embed Size (px)
Citation preview
AD-A092 223 TEXAS UNIV AT AUSTIN DEPT OF CHEMISTRY r/o V/.flN THE PHOTOASSISTED HYDROGEN PRODUCTION FROM TITANIA Alt WATER--ETC(U)NOV SO S SATO, .J N WHITE NOO1S.75C-0922
UNCLASSIFIED NtEE' OEEEEEEEEEso
*ffflLN

I'll'
MICROCOPY RESOLUTION TEST CHARTNAT IONAL BUR[AU OF STANDARDS- 163-A
OFFICE OF NAVAL RESEARCH
Contract N00014-75-C-0922
ask No. NR 056-578
TECHNICAL REPORT NO. 18
0 On the Photoassisted Hydrogen Production
from Titania and Water
by
S. Sato and J. M. White
Prepared for Publication .
in
Journal of Physical Chemistry A
Department of Chemistry
University of Texas at Austin
Austin, Texas 78712
November 12, 1980
Reproduction in whole or in part is permitted forany purpose of the United States Government.
This document has been approved for public release
and sale; its distribution is unlimited.
%tCURITY CLASSIFICATION OF THIS PAGE (When Dote Entered)
REPORT DOCUMENTATION PAGE READ INSTRUCTIONSREPRT UMBR BFORE COMPLETING FORM
SREPORT NUMBER -Z. GOVT ACCESSION NO . PIENT'S CATALOG NUMBER
4. TITLE (old S..betl )/0 Onte hta se yrgnProductioa TecnicalDept, : 8
on the Photoassiste(I Iydrogen Po o ehia eC from Titania and Water, .. ROI P --1 .
41 6 PERFORMING OV,4f, ORT NUMBER
I CONTRACT OR "G J#*%MBER(a)
S./Sato a T.M. teN00014-75-C-V922
3. PERFORMING ORGANIZATION NAME AND ADDRESS I0. PROGRAM ELEMENT PROJECT. TASJ. M. White, Department of Chemistry AREA A WORK UNIT NUMERS
University of Texas Project NR 056-578Austin, Texas 78712
II, CONTROLLING OFFICE NAME AND ADDRESS . ROT-oA-
Department of the Navy *~ ~ Nove 8zOffice of Naval Research is. NUMUEROF PAGESArlington, Virginia 22217 . 1i
14. MONITORING AGENCY NAME G ADORESS(I/ different from Controlllng Office) 1. SECURITY CLASS. (of thle report)
;~~~h / ,.......,,,...,..°.....,.~ ~--f; 1I0. DECLASSIFtCATIONO'OWNGRAOINGi . SCHEDULE
14. DISTRIBUTION STATEMENT (of thle Repo1T
Approved for Public Re'lease: Distribution Unlimited
17. DISTRIBUTION STATEMENT (of the abotrat entered In Block 20, It different from Reort)
* IN. SUPPLEMENTARY NOTES
* Preprint, accepted, Journal of Physical Chemistry
*9IS. KEY WORDS (Continue on revore. sfde If necesey end identify by block nImber)t I
20. ABSTRACT (Continue o eveoeo aide it neceaoaty eid Identlfy by block mmber)
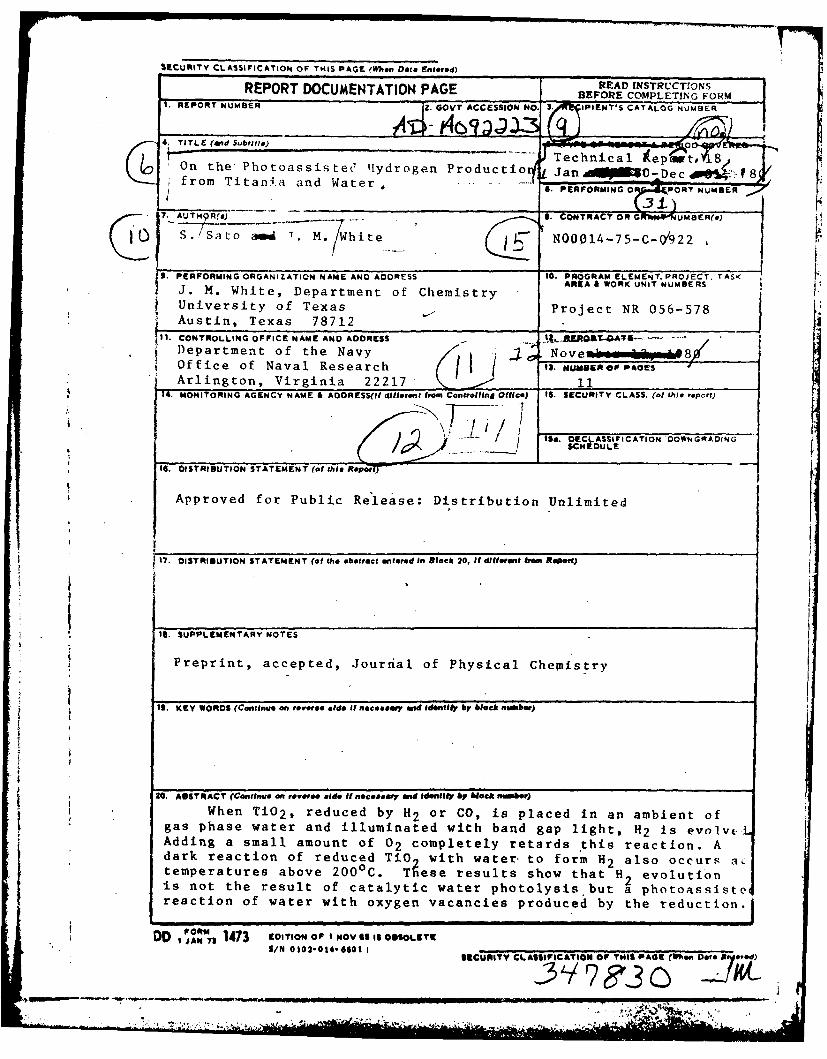
When TiO2, reduced by H2 or CO, is placed in an ambient ofgas phase water and illuminated with band gap light, H2 is evolveLAdding a small amount of 02 completely retards this reaction. Adark reaction of reduced TiO with water to form H2 also occurs actemperatures above 2000 C. T~ese results show that H2 evolutionis not the result of catalytic water photolysis but a photoassstc'reaction of water with oxygen vacancies produced by the reduction.
DD 1473 cDITION oP I Nov as is o.soL.T.S/N 0102-014 6601 I
-. CURITY CLASSI.ICATIO" OP THIS PAGE (Whe
* - . **..S ~ *j***'*? . 0

On the Photoassisted Hydrogen Production
from Titania and Water*
S. Sato** and J. M. White
Department of ChemistryUniversity of Texas at AustinAustin, Texas 78712
Abstract
When TiO 2, reduced by H2 or CO, is placed in an ambient of gas phase
water and illuminated with band gap light, H2 is evolved. Adding a small
amount of 02 completely retards this reaction. A dark reaction of reduced
TiO 2 with water to form H2 also occurs at temperatures above 200 C. These
results show that H evolution is not the result of catalytic water photolysis
but a photoassisted reaction of water with oxygen vacancies
produced by the reduction.
NTIS
Supported in part by the Office of Naval Research. Iv.
** Present address, Research Institute for Catalysis, Hokkaido University,Sapporo 060, Japan
- -Ad
Introduction
The photodecumposition of water over heterogeneous catalysts con-
taining compound semiconductors has recently received considerable attention.
Some works involve iLh, uu of semiconductors alone for achieving this and the
results and their interpretation are the subject of some disagreement.
Schrauzer and Guth1) concluded that water adsorbed on TiO 2 or Fe2 0 3 -doped
TiO was catalytically photolyzed in their system, whereas Van Damme and2
Hall2 ) , on the basis of finding only a trace of H2 , concluded that H2 forma-
tion arose from the non-catalytic photodecomposition of hydroxyl groups
originally present on T0 2. Kawai and Sakata 3 ) , on the other hand, found that
D was formed in the dark when gaseous D2 0 was contacted with T0 2 reduced222
by CO under UV irradiation. The evolution of D2 was accelerated by illumin-
ation and continued even after evacuating D20, but no 02 was observed. The
acceleration was ascribed to the photodecomposition of D2 0 over TiO 2 on the
assumption that oxygen formed was held at the TiO2 surface. This assumption
is based on the fact that 0 as well as H was formed by the addition of2 2
Ru02, a good electrode material for 02 evolution, to TO 2. Rao et al.
4 )
have recently reported that H2 and H202 are produced when reduced TiO 2
(in flowing H2 for - 6 hr at 700-8000C) is suspended in liquid water and illum-
inated in bubbling N . Unreduced TiO 2 produces neither H2 nor H2 02
We have already reported that platinized Ti02 is a suitable catalyst
for the photolysis of water to H2 and 02 but TiO2 alone is not. 5 ) Moreover,
we found that reduced TiO 2 produces H2 when illuminated in the presence of
gaseous or liquid water as observed by Kawai and Sakata3 ) and Rao et al.
4 )
2)but we concluded, in agreement with Van Damme and Hall , that this H2
production is non-catalytic. However, our results require somewhat different
interpretation. This brief paper presents the experimental results and
-2-

our interpretation of them, the latter relying heavily on a model for the
energy band diagram of illuminated TiO 2.
-3-
4 - ,- , - , ~

Experiments and Results
The experimental apparatus and precedures have been described else-
5)where . TO2 (MCB, ;natase) was reduced in flowing H2 (or CO) under various
conditions, cnold ir 1) or CO and stored in air. Reduced TiO 2 (0.25g) was
spread on the flat bottom of a quartz reaction cell and outgassed at 200C
for - 3 hr. After introducing water vapor at room temperature, the sample
was illuminated by a 200 W high-pressure Hg lamp and the products were analyzed
by a mass spectrometer.
In every case studied, only H2 was observed in the gas phase and its
formation rate dropped to almost zero after a few hrs of illumination. The
maximum amount of H2 formed increased with the reduction temperature and time
and it was larger for H 2-reduced TiO 2 than for CO-reduced samples prepared
under the same conditions. The results described below were obtained for H2-
reduced TO 2 . For substrates reduced at temperatures above 700C, H2 was
formed even in the dark in agreement with Kawal and Sakata 3) but its forma-
tion stopped within 30 min. When D2 0 instead of H2 0 was used, the
products were dominated by D2. Since the amount of HD formed did not exceed
the value expected from the isotopic purity of D20, the hydrogen evolved is
believed to come from water added and not from pre-existing surface hydroxyl
groups. Support for this also comes from the facts that no increase in RD
was observed when D2 (0.12 Torr) was added to the H2 0 reduced TiO 2 system
under illumination and that no products were formed when TO 2 samples were
illuminated in vacuo.
Light of energy less than the band gap of TiO 2 produced no H2, sug-
ge;ting that photogenerated electrons and/or holes play an important role.
The addition of 02 (3.2 x 10- 3 Torr) completely inhibited H2 formation and
its pressure dropped by a factor of 2 after 1 hr. of illumination. The
-4-
addition of 13CO (0.25 Torr), on the other hand, had no effect and no 13Co 2
was observed. This is significant since CO is oxidized over TiO2 in the
presence of band gap light and oxygen.
When reduc,€! "Wl gas immersed in liquid water and illuminated, the
amount of If2 formed ', larger than observed in the gas phase process. The
liquid water-TiO2 system was prepared by cooling the bottom of the reaction
cell to 00 C in order to cryogenically pump water from the reservoir to the cell.
After the sample was covered with 0.2-0.3 ml of water, the cell was warmed
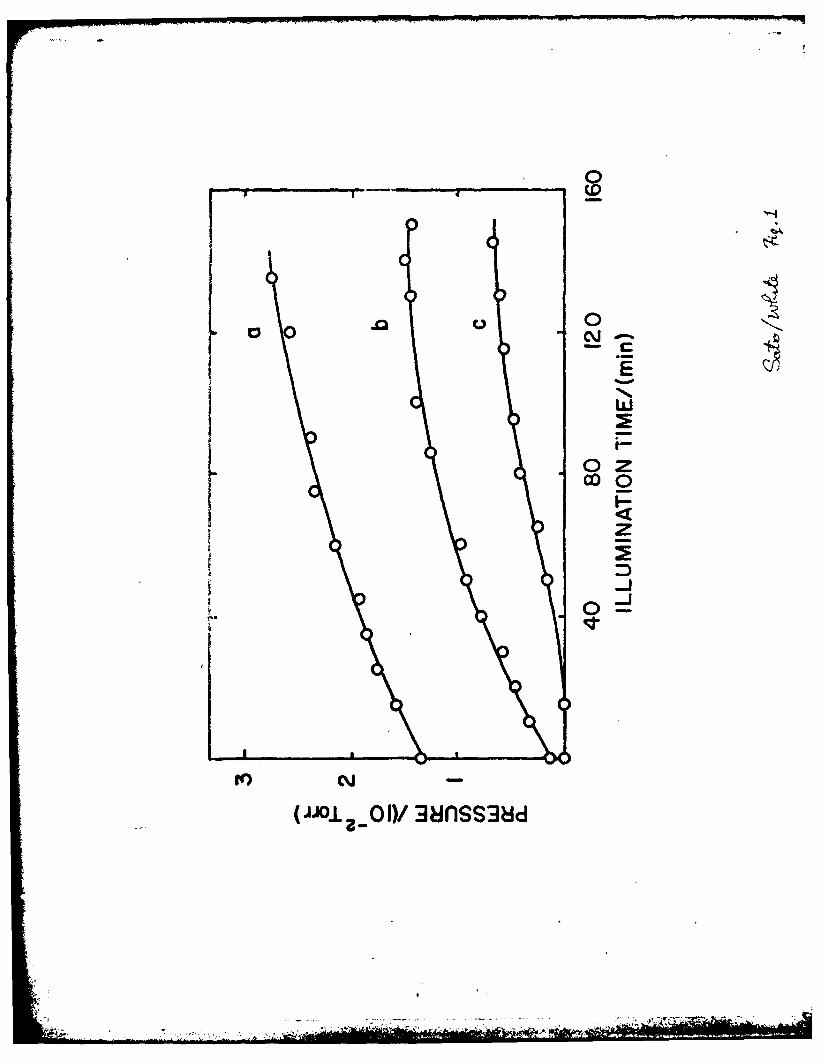
to - 230C and then illuminated. The results are shown in Fig. 1 for variously
reduced TO02 samples. Just as in the gas phase process, the H2 evolution
rate dropped to zero after a few hrs. and no 02 was detected. The TiO 2
0 -2sample reduced at 750 C for 4 hr produced - 1.3 x 10 Torr (0.13 p mole)
of H2 in the dark (the pressure at time zero of curve (a) in Fig. 1 is due to
this) and H2 formation was accelerated by illumination.
Although the formation of H202 was not checked in our experiments, its
concentration is limited by photodecomposition to 02 and H20 over TiO2.
4)Rao et al. observed that the addition of H202 (- 5 P mole) to their reaction
mixture (700 ml) followed by 1 hr of illumination brought about a two-fold
decrease in the H202 concentration. This implies that the maximum achievable
concentration of H 202 over illuminated TiO 2 is very low, less than 4 p mole/1.
Applying this to our system, I x 10- 3 p mole, at most, of H202 could exist
in the water. This is much less than the amount of H 2 formed (>0.1 U mole).
In addition to the above results, we find that H2 is also formed when
reduced TiO2 samples are heated in gaseous water at temperatures higher than
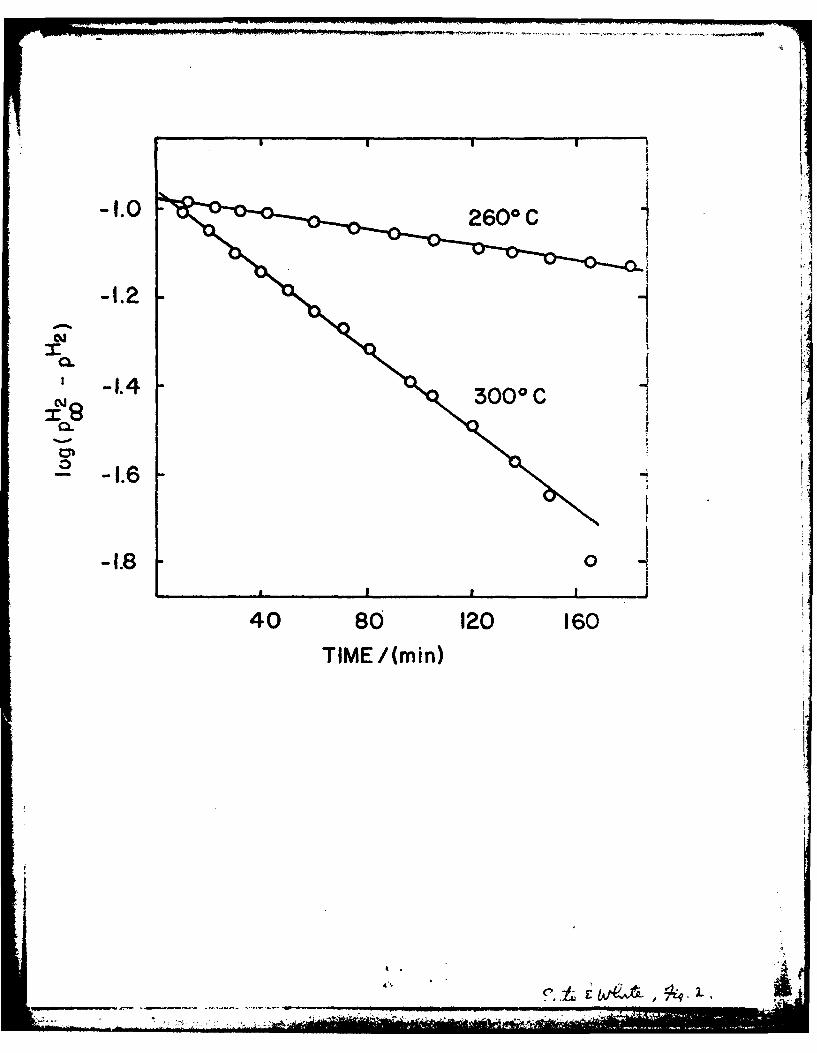
2000 C. The H2 formation rate in this thermal reaction is proportional to
(P H p12), where p H2 is the maximum H2 pressure and pH 2 the H2 pressure
at time t. The time dependence can, therefore, be described by the first order
-5-.

equation:
log (pH - p112) = - kt
where k is the rate constant. Fig. 2 shows plots of this relation for two
sets of thermal reaction data. These data are consistent with a mechanism
in which water reacts with oxygen vacancies of TiO2 at a rate proportional
to their concentration. The activation energy of the thermal reaction is
about 24 Kcal/mole. It is noteworthy that the H2 formation rate in the
liquid water-illuminated TiO 2 system also depends on temperature and the
activation energy is about 15 Kcal/mole between 0 and 23 C. The photo-
processes, however, do not obey a first order equation.
Discussion and Conclusions
All of our photo results are consistent with a mechanism in which a
reaction between H20 and oxygen vacancies of reduced TiO2 is photoassisted by
the production of electron-hole pairs in the solid. This reaction is thermo-
dynamically downhill and not catalytic.
The reduction (doping) of TiO 2, however, is important in the prepar-
5,6)ation of active Pt/TiO2 catalysts and the TiO2 electrodes of photoelectro-
chemical (PEC) cells 7 ), even though the oxygen vacancies are photo-oxidized
by water. We assume that the bulk oxygen vacancies are retained during the
photolysis of water and the active materials therefore have a relatively high
conductivity. Ease of photogenerated electron transport from TiO 2 to Pt (or
other cathode materials) and photochemical activity increase with conduc-
tivity. The position of the Fermi level and the thickness of the space charge
layer of TiO2 will also be affected by doping.
-6-

The fact that TiO2 alone is inactive for water photolysis can be des-
cribed in terms of the energy band diagram of illuminated TiO 28). According
to a recent study 9) in this area, the flat band potential (electron Fermi level)
of TiO2 (rutile) is abcit 100 mV more negative than the H+/ H2 redox potential. 1:.This implies that the water photolysis in PEC cells with a TiO2 photoanode is
energetically possible under open circuit conditions. However, there are some
potential drops, for example, across the Helmholtz layer, so that the over-
voltage available for H2 evolution becomes lower. Even if anatase has a some-
10)what more negative flat band potpntial than rutile 0
, the overvoltage would
10)be too low for efficient evolution of H2 at the TiO 2 surface . Similar
overvoltage requirements for the reduction of protons are found with SrTiO11)3.
Consequently, these semiconductor catalysts show increased photocatalytic
activity for water decomposition when a material, such as Pt, is added which
readily evolves H2 at a lower overvoltage.
In passing, we note that the maximum amount of H2 (1 11 mole) produced
thermally exceeds that observed in the photoreaction (_ 0.2 p mole). This
difference is readily accounted for since in the photoprocess not all of the
surface is illuminated.
To summarize, in the process proposed here, water reacts slowly with 1
surface oxygen vacancies to evolve H2 and remove the vacancies by filling them
with oxygen or hydroxyl species. This is a non-catalytic process but is sig-
nificantly accelerated by band gap irradiation. Bulk oxygen vacancies are
retained during the photoprocess. Experimental support for this proposal
co-aes from isotope tracing, the effects of reduction temperature and time,
and the effects of added 02 and CO. In the photoprocess, photogenerated holes
probably oxidize water to produce some oxygen containing species which react
with the oxygen vacancies at the surface.
~-7-
References
(1) G. N. Schrauzer and T. D. RJih, J. Am. Chem. Soc., 99, 7189 (1977).
(2) H. Van Damme andi V -. Hall, J. Am. Chem. Soc., 101, 4373 (1979).
(3) T. Kawat and T. Sakata, Chem. Phys. Lett., 72, 87 (1980).
(4) M. V. Rao, K. Rajeshwar, V. R. Pal Verneker, and J. DuBow, J. Phys.Chem., 84, 1987 (1980).
(5) S. Sato and J. M. White, Chem. Phys. Lett., 72, 83 (1980).
(6) S. Sato and J. M. White, J. Am. Chem. Soc., (in press).
(7) M. S. Wrighton, D. S. Ginley, P. T. Wolczanski, A. B. Ellis, D. L.Morse and A. Linze, Proc. Nat'l. Acad. Sci. USA, 72, 1518 (1975).
(8) K. Rajeshwar, P. Sinch and J. DuBow, Electrochem. Acta, 23, 1117 (1978);H. P. Maruska and A. K. Ghosh, Solar Energy, 20, 443 (1978).
(9) M. Tomkiewicz, J. Electrochem. Soc., 126, 1505 (1979).
(10) B. Kraeutler and A. J. Bard, J. Am. Chem. Soc., 100, 5985 (1978).
(11) M. S. Wrighton, P. T. Wolczanski and A. B. Ellis, J. Solid State Chem.,
22, 17 (1977). -
-8-
Figure Captions
Figure 1
Evolutirz of H 2frovi illuminated, reduced TiO 2immersed in liquid
2 2
hr; (c) at 600 C for 3 hr. (0.1 Torr 1 11~ mole).
Figure 2
First order plots of H2 pressures ePH2 'pH2) during the reaction
of reduced TiC) with gaseous water (-~ 24 Torr) at 2600C and 300 0%
in the dark. TiO) was reduced by H2 at 700%C for 6 hr.
pH2 -0.108 Torr.cc
-9-
0
(0
00 OJ -OI 08SS
lop I'lI.W 10 m
-1.0 2600 C
-1.4
40 80 120 160TIME /(min)
SP472-3/Al7 472:GAN:716:ddc78u472-60,3
TECHNICAL REPORT DISTRIBUTION LIST, 056
No. No.Copies Copies
Dr. D. A. Vroom Dr. C. P. FlynnIRT Department of PhysicsP.O. Box 80817 University of IllinoisSan Diego, Califc'ria 92131 1 Urbana, Illinois 61801
Dr. G. A. Somorjai Dr. W. KohnDepartment of Chemistry Department of PhysicsUniversity of California University of CaliforniaBerkeley, California 94720 1 (San Diego)
LaJolla, California 92037Dr. L. N. JarvisSurface Chemistry Division Dr. R. L. Park4555 Overlook Avenue, S.W. Director, Center ofWashington, D.C. 20375 1 Materials Research
University of MarylandDr. J. B. Hudson College Park, Maryland 20742Materials DivisionRensselaer Polytechnic Institute Dr. W. T. PeriaTroy, New York 12181 1 Electrical Engineering
DepartmentDr. John T. Yates University of MinnesotaSurface Chemistry Section Minneapolis, Minnesota 55455National Bureau of StandardsDepartment of Commerce Dr. Narkis TzoarWashington, D.C. 20234 1 City University of New York
Convent Avenue at 138th Street
Dr. Theodore E. Madey New York, New York 10031Surface Chemistry SectionDepartment of Commerce Dr. Chia-wei Woo
National Bureau of Standards Department of PhysicsWashington, D.C. 20234 1 Northwestern University
Evanston, Illinois 60201J. M. WhiteDepartment of Chemistry Dr. D. C. Mattis
University of TexasAustin, Texas 78712 Polytechnic Institute of
I New York333 Jay Street
Dr. Keith H. Johnson Brooklyn, New York 11201Department of Metallurgy and Materials
Science Dr. Robert M. HexterMassachusetts Institute of Technology Department of Chemistry
Cambridge, Massachusetts 02139 1 University of Minnesota
Minneapolis, Minnesota 55455Dr. J. E. DemuthIBM Corportion Dr. R. P. Van DuyneThomas J. Watson Research Center Chemistry DepartmentP.O. Box 218 Northwestern University
Yorktown Heights, New York 10598 1 Evanston, Illinois 60201 1
• i-7 . . . . ............. .* '- ,

SP472-3i/A19 472:GAN:716:ddc78u472-608
TECHNICAL REPORT DISTRIBUTION LIST, 056
No. No.Copies Covies
Dr. M. G. Lagally Dr. J. OsteryoungDepartment of Metallurgical Chemistry Department
and Mining Engineers g SUNY, BuffaloUniversity of Wisconsin Buffalo, New York 14214
Madison, Wisconsin 53706 1Dr. G. Rubloff
Dr. Robert Gomer I.B.M.Department of Chemistry Thomas J. Watson Research Center
James Franck Institute P. 0. Box 2185640 Ellis Avenue Yorktown Heights, New York 10598
Chicago, Illinois 60637 1Dr. J. A. Gardner
Dr. R. G. Wallis Department of PhysicsDepartment of Physics Oregon State UniversityUniversity of California, Irvine Corvallis, Oregon 97331Irvine, California 92664 1
Dr. G. D. Stein
Dr. D. Ramaker Mechanical Engineering DepartmentChemistry Department Northwestern UniversityGeorge Washington University Evanston, Illinois 60201Washington, D.C. 20052 1
Dr. K. G. Spears
Dr. P. Hansma Chemistry DepartmentChemistry Department Northwestern UniversityUniversity of California, Evanston, Illinois 60201
Santa BarbaraSanta Barbara, California 93106 1 Dr. R. W. Plummer
University of PennsylvaniaDr. P. Hendra Department of Physics
Chemistry Department Philadelphia, Pennsylvania 19104Southhampton UniversityEngland S09JNH 1 Dr. E. Yeager
Department of ChemistryProfessor P. Skell Case Western Reserve UniversityChemistry Department Cleveland, Ohio 41106 2
Pennsylvania State UniversityUniversity Park, Pennsylvania 16802 1 Professor George H. Morrison
Cornell University
Dr. J. C. Hemminger Department of ChemistryChemistry Department Ithaca, New York 14853University of California, IrvineIrvine, California 92717 1 Professor N. Winograd
Pennsylvania State University
Dr. Martin Fleischmann Chemistry Department
Department of Chemistry University Park, Pennsylvania 16802Southampton UniversitySouthampton 509 5NK Professor Thomas F. George
Hampshire, England I The University of RochesterChemistry DepartmentRochester, New York 14627
- '1
sF4 72-3/Al 472 :GAN: 716:ddc78u472-608
TECHNICAL REPORT DISTRIBUTION LIST, GEN
No. No.Copies Copies
Office of Naval Research U.S. Army Research Office
Attn: Code 472 Attn: CRD-AA-IP
800 North Quincy Street P.O. Box 1211
Arlington, Virginia 22217 Research Triangle Park, N.C. 27.709 1
OR Branch Office Naval Ocean Systems Center
Attn: Dr. George Sandoz Attn: Mr. Joe McCartney
536 S. Clark Street San Diego, California 92152 1
Chicago, Illinois 60605 1Naval Weapons Center
ONR Area Office Attn: Dr. A. B. Amster,
Attn: Scientific Dept. Chemistry Division
715 Broadway China Lake, California 93555 1
New York, New York 10003Naval Civil Engineering Laboratory
ONR Western Regional Office Attn: Dr. R. W. Drisko
1030 East Green Street Port Hueneme, California 93401 1
Pasadena, California 91106 1Department of Physics & Chemistry
ONR Eastern/Central Regional Office Naval Postgraduate School
Attn: Dr. L. H. Peebles Monterey, California 93940 1
Building 114, Section D666 Summer Street Dr. A. L. Slafkosky
Boston, Massachusetts 02210 1 Scientific AdvisorCommandant of the Marine Corps
Director, Naval Research Laboratory (Code RD-1)
Attn: Code 6100 Washington, D.C. 20380 1
Washington, D.C. 20390 1Office of Naval Research
The Assistant Secretary Attn: Dr. Richard S. Miller
of the Navy (RE&S) 800 N. Quincy Street
Department of the Navy Arlington, Virginia 22217
Room 4E736, PentagonWashington, D.C. 20350 1 Naval Ship Research and Development
Center
Commander, Naval Air Systems Command Attn: Dr. G. Bosmajian, Applied
Attn: Code 310C (H. Rosenwasser) Chemistry Division
Department of the Navy Annapolis, Maryland 21401Washington, D.C. 20360
Naval Ocean Systems Center
Defense Technical Information Center Attn: Dr. S. Yamamoto, Marine
Building 5, Cameron Station Sciences Division
Alexandria, Virginia 22314 12 San Diego, California 91232
Dr. Fred Saalfeld Mr. John Boyle
Chemistry Division, Code 6100 Materials Branch
Naval Research Laboratory Naval Ship Engineering Center
Washington, D.C. 20375 1 Philadelphia, Pennsylvania 19112 1
I.
sP472-3/A3 472:GA'::716:ddc
78u4 72-60S
TECH-NICAL REPORT DISTRIBUTION LIST, GEN
No.
Copies
Dr. Rudolph J. MarcusOffice of Naval ResearchScientific Liaison GroupAmerican EmbassyAPO San Francisco 06503 1
Mr. James KelleyDTNSRDC Code 2803Annapolis, Maryland 21402 1
Dr. L. F. Peebles ONR Eastern/Central Regional Office I cooy31de 114, Section D 666 Summer Street,Boston, MA 02210
Dr. G. Sandoz ONR-Branch Office, 536 S. Clark Street, I convChicago, IL 60605
Dr. R. J. Marcus ONR Western Regional Office1030 East Green St., Pasadena, CA Q1106 1 cony
Dr. G. A. Meece ONR Chemistry Program, 800 North Ouincv 5 cooiesStreet, Arlington, VA 22217
I S