Embed Size (px)
Citation preview
FINAL: 11/20061
ACUTE EXPOSURE GUIDELINE LEVELS2
(AEGLs)3
CARBON MONOXIDE4
(CAS Reg. No. 630-08-0)5
November 20066
CARBON MONOXIDE FINAL: 11/2006
ii
PREFACE7
Under the authority of the Federal Advisory Committee Act (FACA) P. L. 92-463 of 1972, the8National Advisory Committee for Acute Exposure Guideline Levels for Hazardous Substances (NAC/AEGL9Committee) has been established to identify, review and interpret relevant toxicologic and other scientific data10and develop AEGLs for high priority, acutely toxic chemicals.11
AEGLs represent threshold exposure limits for the general public and are applicable to emergency12exposure periods ranging from 10 minutes to 8 hours. AEGL-2 and AEGL-3 levels, and AEGL-1 levels as13appropriate, will be developed for each of five exposure periods (10 and 30 minutes, 1 hour, 4 hours, and 814hours) and will be distinguished by varying degrees of severity of toxic effects. It is believed that the15recommended exposure levels are applicable to the general population including infants and children, and16other individuals who may be sensitive or susceptible. The three AEGLs have been defined as follows:17
AEGL-1 is the airborne concentration (expressed as ppm or mg/m³) of a substance above which it18is predicted that the general population, including susceptible individuals, could experience notable19discomfort, irritation, or certain asymptomatic, non-sensory effects. However, the effects are not disabling20and are transient and reversible upon cessation of exposure.21
AEGL-2 is the airborne concentration (expressed as ppm or mg/m³) of a substance above which it22is predicted that the general population, including susceptible individuals, could experience irreversible or23other serious, long-lasting adverse health effects, or an impaired ability to escape.24
AEGL-3 is the airborne concentration (expressed as ppm or mg/m³) of a substance above which it25is predicted that the general population, including susceptible individuals, could experience life-threatening26health effects or death.27
Airborne concentrations below the AEGL-1 represent exposure levels that could produce mild and28progressively increasing odor, taste, and sensory irritation, or certain asymptomatic, non-sensory effects. With29increasing airborne concentrations above each AEGL level, there is a progressive increase in the likelihood30of occurrence and the severity of effects described for each corresponding AEGL level. Although the AEGL31values represent threshold levels for the general public, including sensitive subpopulations, it is recognized32that certain individuals, subject to unique or idiosyncratic responses, could experience the effects described33at concentrations below the corresponding AEGL level.34

CARBON MONOXIDE FINAL: 11/2006
iii
TABLE OF CONTENTS35
PREFACE . . . . . . . . . . . . . . . . . . . . . . . . . . . . . . . . . . . . . . . . . . . . . . . . . . . . . . . . . . . . . . . . . . . . . . . . . ii36TABLE OF CONTENTS . . . . . . . . . . . . . . . . . . . . . . . . . . . . . . . . . . . . . . . . . . . . . . . . . . . . . . . . . . . . . . iii37EXECUTIVE SUMMARY . . . . . . . . . . . . . . . . . . . . . . . . . . . . . . . . . . . . . . . . . . . . . . . . . . . . . . . . . . . vii38
1. INTRODUCTION . . . . . . . . . . . . . . . . . . . . . . . . . . . . . . . . . . . . . . . . . . . . . . . . . . . . . . . . . . . . 139
2. HUMAN TOXICITY DATA . . . . . . . . . . . . . . . . . . . . . . . . . . . . . . . . . . . . . . . . . . . . . . . . . . . 3402.1. Acute Lethality . . . . . . . . . . . . . . . . . . . . . . . . . . . . . . . . . . . . . . . . . . . . . . . . . . . . . . . . . 441
2.1.1 Case Studies . . . . . . . . . . . . . . . . . . . . . . . . . . . . . . . . . . . . . . . . . . . . . . . . . . . . 4422.2. Nonlethal Toxicity . . . . . . . . . . . . . . . . . . . . . . . . . . . . . . . . . . . . . . . . . . . . . . . . . . . . . . 743
2.2.1 Experimental Studies . . . . . . . . . . . . . . . . . . . . . . . . . . . . . . . . . . . . . . . . . . . . . 7442.2.2 Case Studies . . . . . . . . . . . . . . . . . . . . . . . . . . . . . . . . . . . . . . . . . . . . . . . . . . . 1545
2.3. Developmental/Reproductive Toxicity . . . . . . . . . . . . . . . . . . . . . . . . . . . . . . . . . . . . . 20462.4. Genotoxicity . . . . . . . . . . . . . . . . . . . . . . . . . . . . . . . . . . . . . . . . . . . . . . . . . . . . . . . . . . 23472.5. Carcinogenicity . . . . . . . . . . . . . . . . . . . . . . . . . . . . . . . . . . . . . . . . . . . . . . . . . . . . . . . 23482.6. Summary . . . . . . . . . . . . . . . . . . . . . . . . . . . . . . . . . . . . . . . . . . . . . . . . . . . . . . . . . . . . 2349
3. ANIMAL TOXICITY DATA . . . . . . . . . . . . . . . . . . . . . . . . . . . . . . . . . . . . . . . . . . . . . . . . . . 25503.1. Acute Lethality . . . . . . . . . . . . . . . . . . . . . . . . . . . . . . . . . . . . . . . . . . . . . . . . . . . . . . . . 2551
3.1.1. Rats . . . . . . . . . . . . . . . . . . . . . . . . . . . . . . . . . . . . . . . . . . . . . . . . . . . . . . . . . . 25523.1.2. Mice . . . . . . . . . . . . . . . . . . . . . . . . . . . . . . . . . . . . . . . . . . . . . . . . . . . . . . . . . 25533.1.3. Guinea Pigs . . . . . . . . . . . . . . . . . . . . . . . . . . . . . . . . . . . . . . . . . . . . . . . . . . . . 2654
3.2. Nonlethal Toxicity . . . . . . . . . . . . . . . . . . . . . . . . . . . . . . . . . . . . . . . . . . . . . . . . . . . . . 29553.2.1 Monkeys . . . . . . . . . . . . . . . . . . . . . . . . . . . . . . . . . . . . . . . . . . . . . . . . . . . . . . 29563.2.2 Dogs . . . . . . . . . . . . . . . . . . . . . . . . . . . . . . . . . . . . . . . . . . . . . . . . . . . . . . . . . 3057
3.3. Developmental/Reproductive Toxicity . . . . . . . . . . . . . . . . . . . . . . . . . . . . . . . . . . . . . 31583.3.1 Pigs . . . . . . . . . . . . . . . . . . . . . . . . . . . . . . . . . . . . . . . . . . . . . . . . . . . . . . . . . . 31593.3.2 Rabbits . . . . . . . . . . . . . . . . . . . . . . . . . . . . . . . . . . . . . . . . . . . . . . . . . . . . . . . 31603.3.3 Rats . . . . . . . . . . . . . . . . . . . . . . . . . . . . . . . . . . . . . . . . . . . . . . . . . . . . . . . . . . 31613.3.4 Mice . . . . . . . . . . . . . . . . . . . . . . . . . . . . . . . . . . . . . . . . . . . . . . . . . . . . . . . . . 3262
3.4. Genotoxicity . . . . . . . . . . . . . . . . . . . . . . . . . . . . . . . . . . . . . . . . . . . . . . . . . . . . . . . . . . 32633.5. Carcinogenicity . . . . . . . . . . . . . . . . . . . . . . . . . . . . . . . . . . . . . . . . . . . . . . . . . . . . . . . 32643.6. Summary . . . . . . . . . . . . . . . . . . . . . . . . . . . . . . . . . . . . . . . . . . . . . . . . . . . . . . . . . . . . 3265
4. SPECIAL CONSIDERATIONS . . . . . . . . . . . . . . . . . . . . . . . . . . . . . . . . . . . . . . . . . . . . . . . 34664.1. Stability, Metabolism and Disposition . . . . . . . . . . . . . . . . . . . . . . . . . . . . . . . . . . . . . . 34674.2. Mechanism of Toxicity . . . . . . . . . . . . . . . . . . . . . . . . . . . . . . . . . . . . . . . . . . . . . . . . . 34684.3. Other Relevant Information . . . . . . . . . . . . . . . . . . . . . . . . . . . . . . . . . . . . . . . . . . . . . . 3669
4.3.1. Species Variability . . . . . . . . . . . . . . . . . . . . . . . . . . . . . . . . . . . . . . . . . . . . . . 36704.3.2. Intraspecies Variability . . . . . . . . . . . . . . . . . . . . . . . . . . . . . . . . . . . . . . . . . . . 37714.3.3. Time Scaling . . . . . . . . . . . . . . . . . . . . . . . . . . . . . . . . . . . . . . . . . . . . . . . . . . . 38724.3.4. Mathematical models of COHb formation . . . . . . . . . . . . . . . . . . . . . . . . . . . . 3973

CARBON MONOXIDE FINAL: 11/2006
iv
5. DATA ANALYSIS FOR AEGL-1 . . . . . . . . . . . . . . . . . . . . . . . . . . . . . . . . . . . . . . . . . . . . . 42745.1. Human Data Relevant to AEGL-1 . . . . . . . . . . . . . . . . . . . . . . . . . . . . . . . . . . . . . . . . . 42755.2. Animal Data Relevant to AEGL-1 . . . . . . . . . . . . . . . . . . . . . . . . . . . . . . . . . . . . . . . . . 42765.3. Derivation of AEGL-1 . . . . . . . . . . . . . . . . . . . . . . . . . . . . . . . . . . . . . . . . . . . . . . . . . . 4277
6. DATA ANALYSIS FOR AEGL-2 . . . . . . . . . . . . . . . . . . . . . . . . . . . . . . . . . . . . . . . . . . . . . 44786.1. Human Data Relevant to AEGL-2 . . . . . . . . . . . . . . . . . . . . . . . . . . . . . . . . . . . . . . . . . 44796.2. Animal Data Relevant to AEGL-2 . . . . . . . . . . . . . . . . . . . . . . . . . . . . . . . . . . . . . . . . . 45806.3. Derivation of AEGL-2 . . . . . . . . . . . . . . . . . . . . . . . . . . . . . . . . . . . . . . . . . . . . . . . . . . 4581
7. DATA ANALYSIS FOR AEGL-3 . . . . . . . . . . . . . . . . . . . . . . . . . . . . . . . . . . . . . . . . . . . . . 49827.1. Human Data Relevant to AEGL-3 . . . . . . . . . . . . . . . . . . . . . . . . . . . . . . . . . . . . . . . . . 49837.2. Animal Data Relevant to AEGL-3 . . . . . . . . . . . . . . . . . . . . . . . . . . . . . . . . . . . . . . . . 49847.3. Derivation of AEGL-3 . . . . . . . . . . . . . . . . . . . . . . . . . . . . . . . . . . . . . . . . . . . . . . . . . . 5085
8. SUMMARY OF AEGLs . . . . . . . . . . . . . . . . . . . . . . . . . . . . . . . . . . . . . . . . . . . . . . . . . . . . . . 52868.1. AEGL Values and Toxicity Endpoints . . . . . . . . . . . . . . . . . . . . . . . . . . . . . . . . . . . . . 52878.2. Comparison with Other Standards and Criteria . . . . . . . . . . . . . . . . . . . . . . . . . . . . . . . 55888.3. Data Adequacy and Research Needs . . . . . . . . . . . . . . . . . . . . . . . . . . . . . . . . . . . . . . . 5789
9. REFERENCES . . . . . . . . . . . . . . . . . . . . . . . . . . . . . . . . . . . . . . . . . . . . . . . . . . . . . . . . . . . . . 5990
APPENDIX A91
Time Scaling Calculations for AEGLs . . . . . . . . . . . . . . . . . . . . . . . . . . . . . . . . . . . . . . . . . . . . 6692AEGL-2 . . . . . . . . . . . . . . . . . . . . . . . . . . . . . . . . . . . . . . . . . . . . . . . . . . . . . . . . . . . . . . . . . . . . 6793AEGL-3 . . . . . . . . . . . . . . . . . . . . . . . . . . . . . . . . . . . . . . . . . . . . . . . . . . . . . . . . . . . . . . . . . . . . 6894
APPENDIX B95
Mathematical Model for Calculating COHb and Exposure Concentrations . . . . . . . . . . . . . . . . 6996
APPENDIX C97
Derivation Summary for Carbon Monoxide AEGLs . . . . . . . . . . . . . . . . . . . . . . . . . . . . . . . . . 7898AEGL-1 . . . . . . . . . . . . . . . . . . . . . . . . . . . . . . . . . . . . . . . . . . . . . . . . . . . . . . . . . . . . . . . . . . . . 7999AEGL-2 . . . . . . . . . . . . . . . . . . . . . . . . . . . . . . . . . . . . . . . . . . . . . . . . . . . . . . . . . . . . . . . . . . . . 80100AEGL-3 . . . . . . . . . . . . . . . . . . . . . . . . . . . . . . . . . . . . . . . . . . . . . . . . . . . . . . . . . . . . . . . . . . . . 83101
CARBON MONOXIDE FINAL: 11/2006
v
LIST OF TABLES102
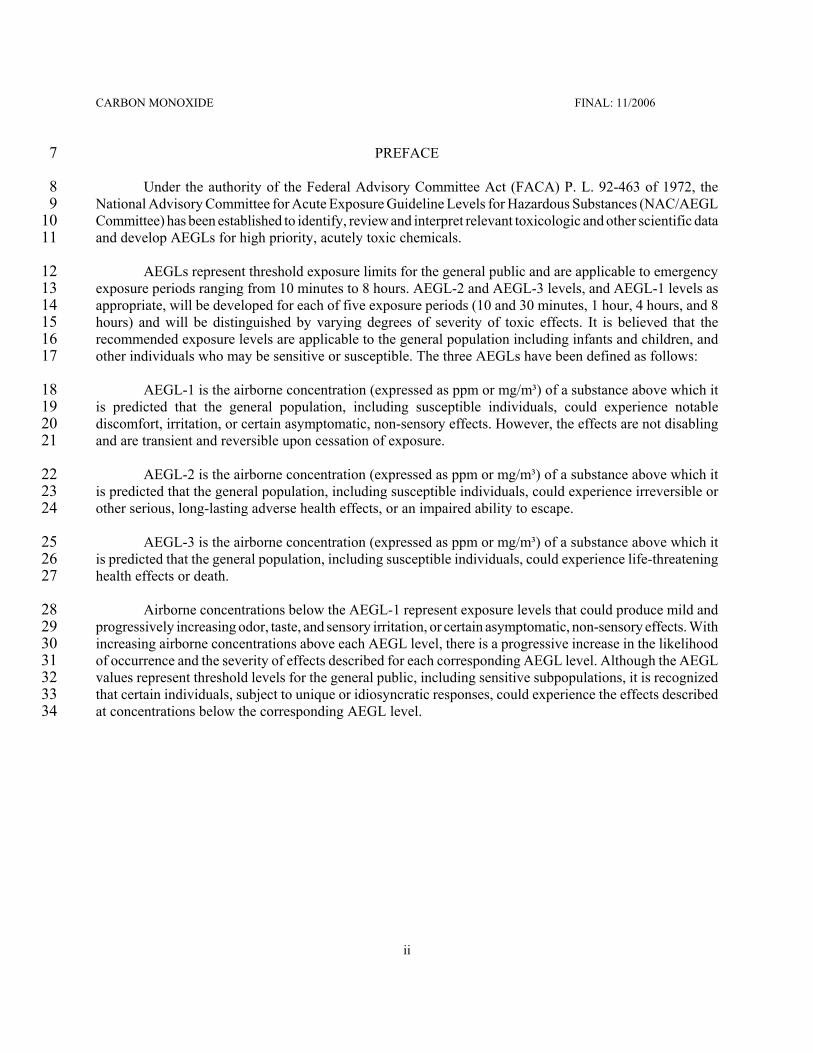
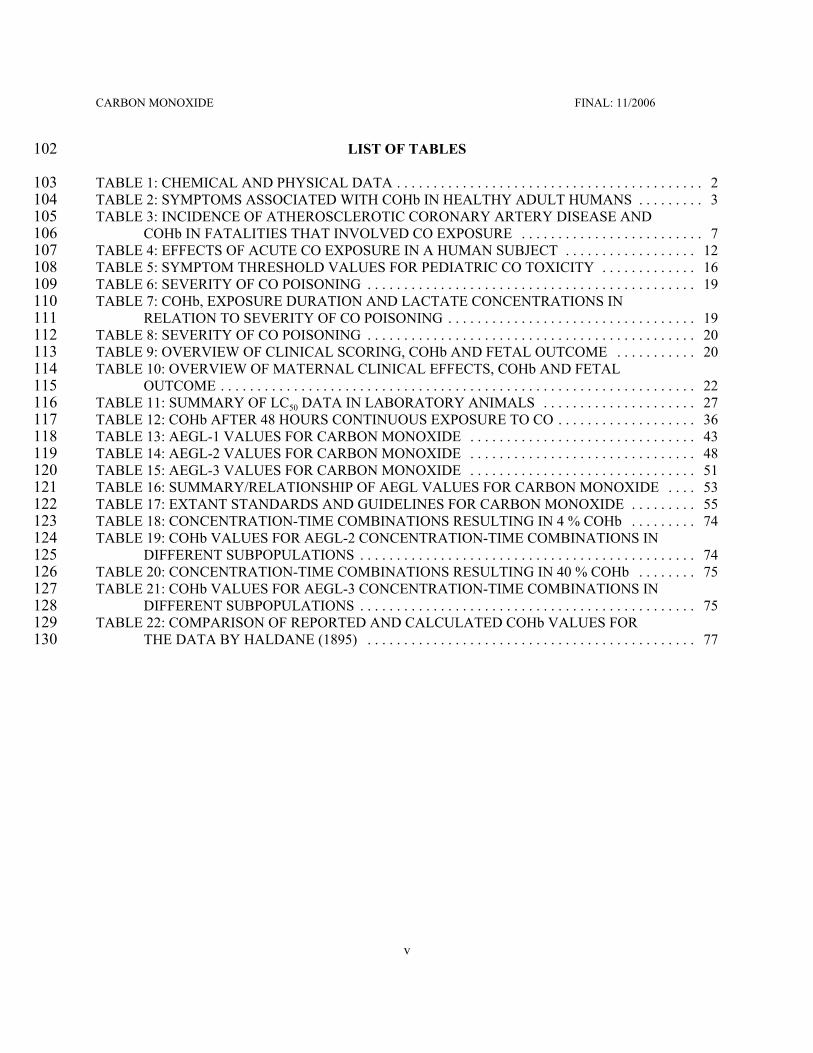
TABLE 1: CHEMICAL AND PHYSICAL DATA . . . . . . . . . . . . . . . . . . . . . . . . . . . . . . . . . . . . . . . . . . 2103TABLE 2: SYMPTOMS ASSOCIATED WITH COHb IN HEALTHY ADULT HUMANS . . . . . . . . . 3104TABLE 3: INCIDENCE OF ATHEROSCLEROTIC CORONARY ARTERY DISEASE AND105
COHb IN FATALITIES THAT INVOLVED CO EXPOSURE . . . . . . . . . . . . . . . . . . . . . . . . . 7106TABLE 4: EFFECTS OF ACUTE CO EXPOSURE IN A HUMAN SUBJECT . . . . . . . . . . . . . . . . . . 12107TABLE 5: SYMPTOM THRESHOLD VALUES FOR PEDIATRIC CO TOXICITY . . . . . . . . . . . . . 16108TABLE 6: SEVERITY OF CO POISONING . . . . . . . . . . . . . . . . . . . . . . . . . . . . . . . . . . . . . . . . . . . . . 19109TABLE 7: COHb, EXPOSURE DURATION AND LACTATE CONCENTRATIONS IN110
RELATION TO SEVERITY OF CO POISONING . . . . . . . . . . . . . . . . . . . . . . . . . . . . . . . . . . 19111TABLE 8: SEVERITY OF CO POISONING . . . . . . . . . . . . . . . . . . . . . . . . . . . . . . . . . . . . . . . . . . . . . 20112TABLE 9: OVERVIEW OF CLINICAL SCORING, COHb AND FETAL OUTCOME . . . . . . . . . . . 20113TABLE 10: OVERVIEW OF MATERNAL CLINICAL EFFECTS, COHb AND FETAL114
OUTCOME . . . . . . . . . . . . . . . . . . . . . . . . . . . . . . . . . . . . . . . . . . . . . . . . . . . . . . . . . . . . . . . . . 22115TABLE 11: SUMMARY OF LC50 DATA IN LABORATORY ANIMALS . . . . . . . . . . . . . . . . . . . . . 27116TABLE 12: COHb AFTER 48 HOURS CONTINUOUS EXPOSURE TO CO . . . . . . . . . . . . . . . . . . . 36117TABLE 13: AEGL-1 VALUES FOR CARBON MONOXIDE . . . . . . . . . . . . . . . . . . . . . . . . . . . . . . . 43118TABLE 14: AEGL-2 VALUES FOR CARBON MONOXIDE . . . . . . . . . . . . . . . . . . . . . . . . . . . . . . . 48119TABLE 15: AEGL-3 VALUES FOR CARBON MONOXIDE . . . . . . . . . . . . . . . . . . . . . . . . . . . . . . . 51120TABLE 16: SUMMARY/RELATIONSHIP OF AEGL VALUES FOR CARBON MONOXIDE . . . . 53121TABLE 17: EXTANT STANDARDS AND GUIDELINES FOR CARBON MONOXIDE . . . . . . . . . 55122TABLE 18: CONCENTRATION-TIME COMBINATIONS RESULTING IN 4 % COHb . . . . . . . . . 74123TABLE 19: COHb VALUES FOR AEGL-2 CONCENTRATION-TIME COMBINATIONS IN124
DIFFERENT SUBPOPULATIONS . . . . . . . . . . . . . . . . . . . . . . . . . . . . . . . . . . . . . . . . . . . . . . 74125TABLE 20: CONCENTRATION-TIME COMBINATIONS RESULTING IN 40 % COHb . . . . . . . . 75126TABLE 21: COHb VALUES FOR AEGL-3 CONCENTRATION-TIME COMBINATIONS IN127
DIFFERENT SUBPOPULATIONS . . . . . . . . . . . . . . . . . . . . . . . . . . . . . . . . . . . . . . . . . . . . . . 75128TABLE 22: COMPARISON OF REPORTED AND CALCULATED COHb VALUES FOR129
THE DATA BY HALDANE (1895) . . . . . . . . . . . . . . . . . . . . . . . . . . . . . . . . . . . . . . . . . . . . . 77130

CARBON MONOXIDE FINAL: 11/2006
vi
LIST OF FIGURES131
FIGURE 1: LC50 VALUES FOR CO IN DIFFERENT SPECIES . . . . . . . . . . . . . . . . . . . . . . . . . . . . . 28132FIGURE 2: COHb FOR DIFFERENT EXPOSURE CONCENTRATION-TIME COMBINATIONS . 40133FIGURE 3: CATEGORICAL REPRESENTATION OF ALL CO INHALATION DATA . . . . . . . . . . 54134FIGURE 4: COHb VS. EXPOSURE TIME PLOTS . . . . . . . . . . . . . . . . . . . . . . . . . . . . . . . . . . . . . . . 72135FIGURE 5: CALCULATION OF 60-MINUTE AEGL-2 FOR HEALTHY ADULT . . . . . . . . . . . . . . 73136FIGURE 6: CALCULATION OF 60-MINUTE EXPOSURE CONCENTRATION THAT WOULD137
RESULT IN 40 % COHb IN A HEALTHY ADULT . . . . . . . . . . . . . . . . . . . . . . . . . . . . . . . . 76138
CARBON MONOXIDE FINAL: 11/2006
vii
EXECUTIVE SUMMARY 139
Carbon monoxide (CO) is a tasteless, non-irritating, odorless and colorless gaseous substance. The140main source of CO production is the combustion of fuels. Exposure at the workplace occurs in blast furnace141operations in the steel industry and when gasoline- or propane-powered forklifts, chain-saws or other142machines are used in confined spaces, such as companies, tunnels and mines. Environmental exposure to CO143can occur while traveling in motor vehicles (9-25 and up to 35 ppm), visiting urban locations with heavily144traveled roads (up to 50 ppm), or cooking and heating with domestic gas, kerosene, coal or wood (up to 30145ppm) as well as in fires and by environmental tobacco smoke. Endogenous CO formation during normal146metabolism leads to a background carboxyhemoglobin concentration (COHb) of about 0.5-0.8 %. Smokers147are exposed to considerable CO concentrations leading to a COHb of about 3-8 %. 148
CO binds to hemoglobin forming COHb and thereby renders the hemoglobin molecule less able to149bind oxygen. Due to this mechanism, the oxygen transport by the blood and the release of bound oxygen in150the tissues are decreased. Tissue damage results from local hypoxia. Organs with a high oxygen requirement,151such as the heart and the brain, are especially sensitive for this effect.152
AEGL-1 values were not recommended because susceptible persons may experience more serious153effects (equivalent to AEGL-2 level) at concentrations, which do not yet cause AEGL-1 effects in the general154population.155
Patients with coronary artery disease show health effects at lower COHb levels than children,156pregnant women or healthy adults and, thus, constitute the most susceptible subpopulation. For the derivation157of AEGL-2 values a level of 4 % COHb was chosen. At this exposure level, patients with coronary artery158disease may experience a reduced time until onset of angina (chest pain) during physical exertion (Allred et159al., 1989; 1991). In the available studies, the CO exposure alone (i.e. with subjects at rest) did not cause160angina, while exercise alone did so. However, since all studies used patients with stable exertional angina,161who did not experience angina while at rest, it cannot be ruled out that in more susceptible individuals (a part162of the patients with unstable angina pectoris might belong to this group) CO exposure alone could cause or163increase angina symptoms. The changes in the electrocardiogram (ST-segment depression of 1 mm164(corresponding to 0.1 mV) or greater) associated with angina symptoms were considered reversible, but is165indicative of clinically relevant myocardial ischemia requiring medical treatment. An exposure level of 4 %166COHb is unlikely to cause a significant increase in the frequency of exercise-induced arrhythmias. Ventricular167arrhythmias have been observed at COHb of 5.3 %, but not at 3.7 % (Sheps et al., 1990; 1991), while in168another study no effect of CO exposure on ventricular arrhythmia was found at 3 or 5 % COHb (Dahms et169al., 1993). This exposure level, which corresponds to COHb values of 5.0-5.6 % in newborn and children was170considered protective of acute neurotoxic effects in children, such as syncopes, headache, nausea, dizziness171and dyspnea (Klasner et al., 1998; Crocker and Walker, 1985), and long-lasting neurotoxic effects (defects172in the cognitive development and behavioral alterations) in children (Klees et al., 1985). A mathematical173model (Coburn et al., 1965; Peterson and Stewart, 1975) was used to calculate exposure concentrations in air174resulting in a COHb of 4 % in adults at the end of exposure periods of 10 and 30 minutes and 1, 4 and 8175hours. A total uncertainty factor of 1 was used. A level of 4 % COHb was the NOEL for AEGL-2 effects in176patients with coronary artery disease, while the LOEL was estimated at 6-9 %. In comparison, the LOEL was177about 10-15 % in children and 22-25 % in pregnant women. Since AEGL-2 values were based on178experimental data on the most susceptible subpopulation, they were considered protective also for other179subpopulations and a total uncertainty factor of 1 was used. 180
CARBON MONOXIDE FINAL: 11/2006
viii
It is acknowledged that apart from emergency situations, certain scenarios could lead to CO181concentrations which may cause serious effects in persons with cardiovascular diseases. These scenarios182include e.g. extended exposure to traffic fume emissions (e.g., in tunnels or inside cars with defect car exhaust183systems), charcoal or wood fire furnaces, and indoor air pollution by tobacco smoking.184
The derivation of AEGL-3 values was based on observations in humans. Several case reports indicate185that in patients with coronary artery disease, CO exposure can contribute to myocardial infarction (which was186considered an AEGL-3 endpoint). In the published cases of myocardial infarction, the following COHb values187were measured after transport to the hospital: 52.2 % (Marius-Nunez, 1990), 30 %, 22.8 % (Atkins and Baker,1881985), 21 % (Ebisuno et al., 1986), 15.6 % (Grace and Platt, 1981). Case reports on stillbirths after CO189poisoning of pregnant women reported measured maternal COHb of about 22-25 % or higher (Caravati et al.,1901988; Koren et al., 1991). These anecdotal reports on cases affecting susceptible subpopulations were191considered as important supporting information, but not as an adequate basis for the derivation of AEGL-3192values because of uncertainties about the end of exposure COHb levels, and whether repeated and/or193prolonged exposures caused the infarction. The analysis of 101 cases of lethal poisoning and 158 cases of194non-lethal poisoning by Pach et al. (1878; 1979) was used as the basis for derivation of AEGL-3 values. In195the group of surviving patients only those were included from which blood for COHb analysis had been196obtained within 2 hours from cessation of exposure. The COHb at the end of exposure was calculated by the197authors of the report. Analysis revealed that only about 2 % of deceased subjects had COHb levels below 40198%. Of the patients that survived about 16 % had a COHb above 40 %. From this study a threshold for lethal199poisoning of about 40 % can be derived. This level is supported by experimental studies performed in healthy200human subjects. Studies by Chiodi et al. (1941), Henderson et al. (1921), and Haldane (1895) suggest that201a COHb of about 34-56 % does not cause lethal effects in healthy individuals. Further support come from the202studies by Kizakevich et al. (1994), Stewart et al. (1970), and Nielsen (1971) that reported headache as the203only symptom when subjects were exposed to 20-33 % COHb. A level of 40 % COHb was used as the basis204for AEGL-3 derivation. This point of departure is supported by studies in animals reporting minimum lethal205COHb levels in rats and mice of about 50-70 % (E.I. du Pont de Nemours and Co., 1981; Rose et al., 1970).206A mathematical model (Coburn et al., 1965; Peterson and Stewart, 1975) was used to calculate exposure207concentrations in air resulting in a COHb of 40 % at the end of exposure periods of 10 and 30 minutes and2081, 4 and 8 hours. A total uncertainty factor of 3 was used. A total uncertainty factor of 3 for intraspecies209variability was considered adequate based on supporting evidence for susceptible subpopulations: 1)210Exposure to the derived AEGL-3 concentrations will result in COHb values of about 14-17 % in adults,211which, based on case reports, was considered to protect heart patients against CO-induced myocardial212infarction. It should be noted, however, that a clear threshold for this endpoint cannot be defined because213myocardial infarction might be triggered at lower COHb in hypersusceptible individuals. 2) This COHb level214was considered protective of lethal effects in the unborn, because in the case studies available, stillbirths were215found only after measured maternal COHb of about 22-25 % or higher (Caravati et al., 1988; Koren et al.,2161991) and the level was supported by animal studies.217
The AEGL values are listed in the table below.218

CARBON MONOXIDE FINAL: 11/2006
ix
SUMMARY TABLE OF AEGL VALUES FOR CARBON MONOXIDE219Classification220 10-Minute 30-Minute 1-Hour 4-Hour 8-Hour Endpoint (Reference)
AEGL-1221(Nondisabling)222
N.R.a N.R. N.R. N.R. N.R. -
AEGL-2 b223(Disabling)224
420 ppm (480 mg/m³)
150 ppm(170 mg/m³)
83 ppm(95 mg/m³)
33 ppm(38 mg/m³)
27 ppm(31 mg/m³)
Cardiac effects inhumans with coronaryartery disease (Allred etal., 1989; 1991)
AEGL-3 c225(Lethal)226
1700 ppm(1900 mg/m³)
600 ppm(690 mg/m³)
330 ppm(380 mg/m³)
150 ppm(170 mg/m³)
130 ppm(150 mg/m³)
Lethal poisoning wasassociated with a COHb$40 % in 98 % of cases(Pach et al., 1978; 1979);no severe or life-threatening effects inhealthy humans at COHbof 34-56 % (Chiodi etal., 1941; Henderson etal., 1921; Haldane,1895)
a N.R., not recommended because susceptible persons may experience more serious effects (equivalent to227AEGL-2 level) at concentrations, which do not yet cause AEGL-1 effects in the general population.228
b It was estimated that exposure to the AEGL-2 concentration-time combinations result in COHb levels of2295.3-5.6 % in newborns, 4.9-5.2 % in 5-year-old children, 4.0 % in adults and 6.2-11.5 % in adult smokers.230
C It was estimated that exposure to the AEGL-3 concentration-time combinations result in COHb levels of23119.5-20.1 % in newborns, 18.1-18-7 % in 5-year-old children, 13.8-17.2 % in adults and 16.1-23.0 % in adult232smokers.233
References234
Allred, E.N., E.R. Bleecker, B.R. Chaitman, T.E. Dahms, S.O. Gottlieb, J.D. Hackney, M. Pagano, R.H.235Selvester, S.M. Walden and J. Warren, 1989. Short-term effects of carbon monoxide exposure on the exercise236performance of subjects with coronary artery disease. New England Journal of Medicine 321, 1426-1432.237
Allred, E.N., E.R. Bleecker, B.R. Chaitman, T.E. Dahms, S.O. Gottlieb, J.D. Hackney, M. Pagano, R.H.238Selvester, S.M. Walden and J. Warren, 1991. Effects of carbon monoxide on myocardial ischemia.239Environmental Health Perspectives 91, 89-132. 240
Atkins, E.H. and E.L. Baker, 1985. Exacerbation of coronary artery disease by occupational carbon monoxide241exposure: A report of two fatalities and a review of the literature. American Journal of Industrial Medicine2427, 73-79.243

CARBON MONOXIDE FINAL: 11/2006
x
Caravati, E.M., C.J. Adams, S.M. Joyce and N.C. Schafer, 1988. Fetal toxicity associated with maternal244carbon monoxide poisoning. Annals of Emergency Medicine 17, 714-717.245
Chiodi, H., D.B. Dill, F. Consolazio and S.M. Horvath, 1941. Respiratory and circulatory responses to acute246carbon monoxide poisoning. American Journal of Physiology 134, 683-693.247
Coburn, R.F., R.E. Forster and P.B. Kane, 1965. Considerations of the physiological variables that determine248the blood carboxyhemoglobin concentration in man. Journal of Clinical Investigation 44, 1899-1910.249Crocker, P.J. and J.S. Walker, 1985. Pediatric carbon monoxide toxicity. The Journal of Emergency Medicine2503, 443-448.251
Crocker, P.J. and J.S. Walker, 1985. Pediatric carbon monoxide toxicity. Journal of Emergency Medicine 3,252443-448.253
Dahms, T.E., L.T. Younis, R.D. Wiens, S. Zarnegar, S.L. Byers and B.R. Chaitman, 1993. Effects of carbon254monoxide exposure in patients with documented cardiac arrhythmias. Journal of the American College of255Cardiology 21, 442-450.256
Ebisuno, S., M. Yasuno, Y. Yamada, Y. Nishino, M. Hori, M. Inoue and T. Kamada, 1972. Myocardial257infarction after acute carbon monoxide poisoning: case report. Angiology 37, 621-624.258
Grace, T.W. and F.W. Platt, 1981. Subacute carbon monoxide poisoning. Journal of the American Medical259Association 246, 1698-1700.260
Haldane, J., 1895. The action of carbonic acid on man. Journal of Physiology 18, 430-462.261Klasner, A.E., S.R. Smith, M.W. Thompson and A.J. Scalzo, 1998. Carbon monoxide mass exposure in a262pediatric population. Academic Emergency Medicine 5, 992-996.263
Henderson, Y., H.W. Haggard, M.C. Teague, A.L. Prince and R.M. Wunderlich, 1921. Physiological effects264of automobile exhaust gas and standards of ventilation for brief exposures. Journal of Industrial Hygiene 3,26579-92.266
Kizakevich, P.N., M.L. McCartney, M.J. Hazucha, L.H. Sleet, W.J. Jochem, A.C. Hackney and K. Bolick,2672000. Noninvasive ambulatory assessment of cardiac function in healthy men exposed to carbon monoxide268during upper and lower body exercise. Eurpean Journal of Applied Physiology 83, 7-16.269
Klasner, A.E., S.R. Smith, M.W. Thompson and A.J. Scalzo, 1998. Carbon monoxide mass exposure in a270pediatric population. Academic Emergency Medicine 5, 992-996.271
Klees, M., M. Heremans and S. Dougan, 1985. Psychological sequelae to carbon monoxide intoxication in272the child. The Science of the Total Environment 44, 165-176.273
Koren, G., R. Sharav, A. Pastuszak, L.K. Garrettson, K. Hill, I. Samson, M. Rorem, A. King and J.E. Dolgin,2741991. A multicenter, prospective study of fetal outcome following accidental carbon monoxide poisoning in275pregnancy. Reproductive Toxicology 5, 397-403.276

CARBON MONOXIDE FINAL: 11/2006
xi
Marius-Nunez, A.L., 1990. Myocardial infarction with normal coronary arteries after acute exposure to277carbon monoxide. Chest 97, 491-494.278
Nielsen, B., 1971. Thermoregulation during work in carbon monoxide poisoning. Acta Physiologica279Scandinavica 82, 98-106.280
Pach, J., L. Cholewa, Z. Marek, M. Bogusz and B. Groszek, 1978. Analysis of predictive factors in acute281carbon monoxide poisoning. Veterinary and Human Toxicology 21 Suppl, 158-159. 282
Pach, J., L. Cholewa, Z. Marek, M. Bogusz and B. Groszek, 1978. Various factors influencing the clinical283picture and mortality in acute carbon monoxide poisoning [in Polish]. Folia Medica Cracoviensia, 20,284159-168.285
Peterson, J.E. and R.D. Stewart, 1975. Predicting the carboxyhemoglobin levels resulting from carbon286monoxide exposures. Journal of Applied Physiology 39, 633-638.287
Sheps, D.S., M.C. Herbst, A.L. Hinderliter, K.F. Adams, L.G. Ekelund, J.J. O'Neill, G.M. Goldstein, P.A.288Bromberg, J.L. Dalton, M.N. Ballenger, S.M. Davis and G.G. Koch, 1990. Production of arrhythmias by289elevated carboxyhemoglobin in patients with coronary artery disease. Annals of Internal Medicine 113, 343-290351.291
Sheps, D.S., M.C. Herbst, A.L. Hinderliter, K.F. Adams, L.G. Ekelund, J.J. O'Neill, G.M. Goldstein, P.A.292Bromberg, M. Ballenger, S.M. Davis and G. Koch, 1991. Effects of 4 Percent and 6 Percent293Carboxyhemoglobin on Arrhythmia Production in Patients with Coronary Artery Disease. Research Report294No. 41, Health Effects Institute, Cambridge, Massachusetts.295
Stewart, R.D., J.E. Peterson, E.D. Baretta, R.T. Bachand, M.J. Hosko and A.A. Herrmann, 1970.296Experimental human exposure to carbon monoxide. Archives of Environmental Health 21, 154-164.297

CARBON MONOXIDE FINAL: 11/2006
1
1. INTRODUCTION298
Carbon monoxide (CO) is a tasteless, odorless and colorless gaseous substance (WHO, 1999a). CO299is produced by both natural and anthropogenic processes. The main source of CO production is the300combustion of fuels. The burning of any carbonaceous fuel produces CO and carbon dioxide as the primary301products. The production of carbon dioxide predominates when the air or oxygen supply is in excess of the302stoichiometric needs for complete combustion. If burning occurs under fuel-rich conditions, with less air or303oxygen than is needed, CO will be produced in abundance (WHO, 1999a). Emission sources include gasoline-304and diesel-powered motor vehicles, stationary combustion equipment, such as heating and power generating305plants, industrial processes, such as blast furnace operation in steel industry, indoor sources, such as gas306ovens, unvented kerosene and gas space heaters and coal and wood stoves, as well as wildfires and tobacco307smoking. Exposure at the workplace occurs in blast furnace operations in the steel industry and when308gasoline- or propane-powered forklifts, chain-saws or other machines are used in confined spaces, such as309companies, tunnels and mines. Low concentrations are produced in the atmosphere by reactions of hydroxyl310radicals with methane and other hydrocarbons as well as by the reactions of alkenes with ozone. 311
In addition to exogenous sources, humans are also exposed to small amounts of CO produced312endogenously. In the process of natural degradation of hemoglobin to bile pigments, oxidation of the313tetrapyrrol ring of heme leads to opening of the ring and formation of biliverdin and CO (WHO, 1999a). The314endogenous CO formation leads to a background carboxyhemoglobin concentration in blood (COHb) of315about 0.5 to 0.8 % (NIOSH, 1972).316
Increased destruction of red blood cells, e.g. caused by hematomas, blood transfusion or intravascular317hemolysis, and accelerated breakdown of other heme proteins will lead to increased production of CO. In318patients with hemolytic anemia, the CO production rate was 2-8 times higher and blood COHb was 2-3 times319higher than in healthy individuals (Coburn et al., 1966).320
Smokers are exposed to considerable CO concentrations leading to an average COHb of 4 %, with321a usual range of 3-8 % (Radford and Drizd, 1982).322
Exposure to CO can also be caused indirectly by exposure to certain halomethanes, particularly323dichloromethane (synonym: methylene chloride), because these solvents are at least partly metabolized324oxidatively to CO by cytochrome P450 (Gargas et al., 1986; see ATSDR, 1998 for review).325
Environmental exposure to CO can occur while traveling in motor vehicles, working, visiting urban326locations associated with combustion sources, or cooking and heating with domestic gas, charcoal or wood327fires, as well as by environmental tobacco smoke. WHO (1999a) summarized environmental concentrations328as follows: CO concentrations in ambient air monitored from fixed-site stations are generally below 9 ppm329(8-hour average). However, short-term peak concentrations up to 50 ppm are reported on heavily traveled330roads. The CO levels in homes are usually lower than 9 ppm; however, the peak value in homes could be up331to 18 ppm with gas stoves, 30 ppm with wood combustion and 7 ppm with kerosene heaters. The CO332concentrations inside motor vehicles are generally around 9-25 ppm and occasionally over 35 ppm. Similar333exposure levels were reported by EPA (2000).334

CARBON MONOXIDE FINAL: 11/2006
2
TABLE 1: CHEMICAL AND PHYSICAL DATA335Parameter336 Value Reference
Molecular formula337 CO WHO, 1999a
Molecular weight338 28.01 WHO, 1999a
CAS Registry Number339 630-08-0 WHO, 1999a
Physical state340 gaseous WHO, 1999a
Color341 colorless WHO, 1999a
Synonyms342 none
Density343 1.250 g/l at 0 °C1.145 g/l at 25 °C
WHO, 1999a
Melting point344 -199 °C WHO, 1999a
Boiling point345 -191.5 °C WHO, 1999a
Solubility346 35.4 ml/l at 0 °C21.4 ml/l at 25 °C
WHO, 1999a
Odor347 odorless WHO, 1999a
Explosive limits in air348 12.5 % (LEL) to 74.2 % (UEL) WHO, 1999a
Conversion factors349 1 ppm = 1.145 mg/m³1 mg/m³ = 0.873 ppm
WHO, 1999a

CARBON MONOXIDE FINAL: 11/2006
3
2. HUMAN TOXICITY DATA 350
Based on older literature the COHb in the blood has been correlated with symptoms in healthy adults,351shown in the left half of Table 2 (WHO, 1999a). Very similar tables are found in different publications (e.g.352AIHA, 1999; Winter and Miller, 1976, Holmes, 1985, Stewart, 1975). However, with respect to both lethal353and nonlethal effects of CO, susceptible subpopulations have been identified and effects on these are depicted354in the right half of Table 2 for comparison (see subsequent sections for references). The unborn fetus and355adults with coronary artery disease are considerably more susceptible for lethal effects of CO than healthy356adults. For nonlethal effects of CO, subjects with coronary artery disease (increased frequency of arrhythmias357and reduced time to onset of angina and to changes in the electrocardiogram and children (syncopes, long-358lasting neurotoxic effects) constitute susceptible subpopulations.359
TABLE 2: SYMPTOMS ASSOCIATED WITH COHb IN HEALTHY ADULT HUMANS AND360SUSCEPTIBLE SUBPOPULATIONS361
Healthy Adults;362adopted from WHO, 1999a363
Susceptible Subpopulations
COHb364(%)365
Symptoms COHb(%)
Symptoms
.1366 physiologic background concentration 2 during physical exertion reducedtime to onset of angina andelectrocardiogram signs ofmyocardial ischemia in subjectswith coronary artery disease
3-8367 background concentration in smokers 5-6 increase in cardiac arrhythmias insubjects with coronary arterydisease
7 headache, nausea in children
10368 no appreciable effect, except shortness of breathon vigorous exertion, possible tightness acrossthe forehead, dilation of cutaneous blood vessels
13 cognitive development deficits inchildren
15 myocardial infarction in subjectswith coronary artery disease
20369 shortness of breath on moderate exertion,occasional headache with throbbing in temples
25 syncopes in children
25 stillbirths
30370 decided headache, irritable, easily fatigued,judgment disturbed, possible dizziness, dimnessof vision
40-50371 headache, confusion, collapse, fainting onexertion
60-70372 unconsciousness, intermittent convulsion,respiratory failure, death if exposure is longcontinued
80373 rapidly fatal

CARBON MONOXIDE FINAL: 11/2006
4
2.1. Acute Lethality374
Mortality from CO poisoning is high: for England and Wales, 1365 deaths due to CO exposure were375reported in 1985. In the USA, more than 3800 people annually die from accidental or intentional CO exposure376(WHO, 1999a). 377
Immediate death from CO is most likely caused by effects on the heart, because the myocardial tissue378is most sensitive to hypoxic effects of CO. Severe poisoning results in marked hypotension and lethal379arrhythmias, which have been considered responsible for a large number of pre-hospital deaths. Rhythm380disturbances include sinus tachycardia, atrial flutter and fibrillation, premature ventricular contractions,381ventricular tachycardia and fibrillation (WHO, 1999a).382
The susceptible subpopulations for lethal effects are subjects with coronary artery disease and the383unborn fetus (see Section 2.3). The review on death causes by Balraj (1984) shows an association between384coronary artery disease and relatively low COHb. A number of case studies is presented in which CO385exposure contributed to myocardial infarction (all cases of infarction are presented in this section irrespective386of whether the patients were rescued from death by intensive medical care or not).387
The British Standards Institution (BSI, 1989) has published the following concentration-time388combinations as lethal exposures to CO (used for hazard estimation in fires): 40000 ppm x 2 minutes, 16000389ppm x 5 minutes, 8000 ppm x 10 minutes, 3000 ppm x 30 minutes and 1500 ppm x 60 minutes. The390International Standard Organization has published lethal exposure concentrations of 12000-16000 ppm for3915 minutes and 2500-4000 ppm for 30 minutes (for an adult engaged in light activity) (ISO, 1989). From the392documents it was concluded that the published values are for normal, healthy adults and that the values were393based on animal data (especially monkeys; Purser and Berrill, 1983); the documents did not discuss the issue394of subpopulations at higher risk for lethal effects.395
2.1.1 Case Studies396
Pach et al. (1978; 1979) reviewed a cases of carbon monoxide in the Toxicological Clinic, Cracow,397Poland in the years 1975-1976. Excluded from this study were mixed intoxications, e.g., by CO and398medicaments. Group A were 101 persons (60 men and 41 women, mean age 48 ±15 years) that had died from399CO poisoning before arrival at the clinic. Measurement of COHb and autopsy was done on these subjects.400Group B comprised 220 subjects (95 men and 125 women, mean age 38 ±18 years) that were treated for CO401poisoning. COHb was determined upon arrival at the clinic. Patients for which the time between the end of402exposure and blood drawing at the clinic was longer than 120 minutes (N = 62) were excluded from further403analysis. For the patients, the COHb at the end of exposure was recalculated. Mean COHb values for Groups404A and B were 62 ±10 % and 28 ±14 %, respectively. In Group A, the percentages of subjects with COHb405between 30-40, 40-50, 50-60, 60-70, 70-80 and 80-90 % were 2, 6, 26, 44, 21 and 2, respectively, while 3,40625, 32, 24, 12, 3, 0.6 and 0.6 % of the patients in the corrected Group B had COHb values between 0-10,10-40720, 20-30, 30-40, 40-50, 50-60, 60-70 and 70-80 %, respectively. Within each group no correlation between408COHb and either sex, blood alcohol above 0.1% or poisoning circumstances (accidental or suicidal) were409found. Group A showed a higher percentage (34 %) of subjects that were 60 years or older than Group B (13410%), while Group B had a higher percentage of subjects younger than 30. 411

CARBON MONOXIDE FINAL: 11/2006
5
Grace and Platt (1981) reported two cases of myocardial infarction due to CO poisoning. In the first412case, a 67-year-old man was exposed to increased CO concentrations for about a few weeks in his home due413to a rusted-out flue of a gas-furnace. The man presented to the emergency room after three days of persistent414light-headedness with vertigo, brief stabbing anterior chest pain that worsened with deep inspiration, a dry415cough, chills and a mild headache. His wife experienced similar malaise and dizziness that had been resolving416over the past week. At the hospital, his symptoms were explained with a diagnosis of viral syndrome,417hypokalemia of unclear origin and diabetes mellitus with diabetic peripheral and autonomic neuropathy. Ten418days after discharge he was seen in the emergency room with true vertigo, palpitations and nausea, but was419sent home to be followed up as an outpatient. Four days later he returned to the emergency room after420development of rectal urgency and an explosive incontinent diarrheal stool, followed by a severe crushing421anterior chest pain. With the pain he collapsed on the floor. The electrocardiogram showed an acute422myocardial infarction. His COHb (measured on arterial blood gases) was 15.6 %, the level of the patient‘s423wife was 18.1 %. The patient survived and recovered completely.424
In the second case, a 69-year-old man came to the emergency room after awakening two days earlier425with confusion, nausea and vomiting. He then passed out and awoke the next day in the bathroom. He crawled426to the living room, where he again passed out for an undetermined amount of time, awoke to open his door427for fresh air, and then went to bed. He later experienced auditory and visual hallucinations and phoned his428neighbor for help. An acute inferior myocardial infarction with secondary mild congestive heart failure and429chronic obstructive pulmonary disease was diagnosed. During his hospitalization, his sister and daughter-in-430law spent a night in his mobile home. They arrived at the emergency room early the next morning with431throbbing headaches, vomiting and vertigo. Their COHb values were 28 and 32 %. A faulty gas water heater432had caused CO exposure. The patient survived and recovered completely.433
Atkins and Baker (1985) described two fatal cases of workers with severe atherosclerotic coronary434artery disease. The first worker (age not stated) was a shipping employee in a plant that reconditioned steel435dyes. A gas-fired furnace was used for tempering the dyes, but also for heating the plant. One day the worker436was found unconscious and resuscitation efforts at a nearby hospital were unsuccessful. Autopsy showed a437severe two-vessel coronary artery disease and old scarring, and a COHb of 30 %. Four other workers of the438plant complaining of nausea were seen in the emergency room, but COHb was not obtained. The second439worker (age not stated) was operating a bale press in a used-clothing company. As well as gas- and oil-fired440heaters, there were a number of propane-fueled forklifts used to transport bales of clothing and ventilation441was poor. Resuscitation was unsuccessful after his collapse. Autopsy revealed three-vessel coronary artery442disease and global subendocardial ischemia. Two blood samples showed COHb of 24.1 and 21.5 %. Five443other workers from the same company were also seen, complaining of light nausea, lightheadedness and444headache. One was hospitalized with a COHb of 35 %; the others had levels from 4.1 to 12.8 %. CO445measurement was performed in the company the next day and revealed concentrations of 135-310 ppm.446Concentrations were highest near forklifts (250-310 ppm) and near the bale press (120-230 ppm), which was447where the patient had been working at the time of his death.448
Ebisuno et al. (1972) reported a case of myocardial infarction after acute CO poisoning in a healthy449young man. A 28-year-old male ironworker was admitted to the emergency room complaining of precordial450pain. Two hours before admission the patient had been exposed accidentally to CO for about one hour while451working at a blast furnace. After the exposure he experienced a sense of fullness of the head and precordial452pain following transient unconsciousness. Blood samples two hours after the exposure contained COHb of45321 %. The electrocardiogram was interpreted as an acute anterior myocardial infarction. The coronary454arteriogram one month after onset of infarction showed no significant narrowing on both left and right455
CARBON MONOXIDE FINAL: 11/2006
6
coronary arteries. The left ventriculogram showed a giant aneurysm in the apical portion. At operation from456the ventricular aneurysmectomy, a massive transmural myocardial necrosis was observed. After surgical457treatment, the patient is free of symptoms.458
Marius-Nunez (1990) reported the case of a 46-year-old man, who suffered an acute myocardial459infarction after CO exposure. He was found unconscious in a doorway of a burning apartment. Artificial460respiration was initiated until arrival at the emergency room. The electrocardiogram showed sings of461myocardial infarction, which was confirmed by high levels of cardiac enzymes in the patient‘s serum. Blood462gas analysis revealed a COHb of 52.2 %. After 3 hours treatment with 100 % oxygen, the patient became alert463and oriented, COHb was 23 %. After 7 hours, he was extubated and a COHb of 13.4 % was measured. The464patient‘s medical profile was negative for coronary heart disease risk factors, such as smoking, hypertension,465diabetes mellitus or coronary artery disease. A coronary angiogram performed one week later failed to reveal466evidence of coronary obstructive lesions.467
Balraj (1984) reviewed all deaths that were certified by the Cuyahoga County Coroner‘s Office from468the years 1958-1980, wherein asphyxia by CO was the primary caused of death and a natural disease was the469„other“ diagnosis or vice versa. During the 23-year period, 38 deaths were certified. These were divided into470two groups: Group 1 consisted of 28 cases where all diagnosis including the abnormal COHb was471documented by complete postmortem examination. Group 2 consisted of 10 cases where the diagnosis of the472"other" condition was based on review of medical records, including results of coronary angiogram, serum473enzymes, and clinical history; autopsy was not performed on these 10 cases. The Group 3 served for474comparison and comprised all deaths that occurred in individuals 35 to 86 years of age in whom the COHb475was 60 % and more (n = 100). A complete autopsy had been performed in each of these cases. 476
Of the 28 cases in Group 1, the primary cause of death was asphyxia by CO in 21 cases. The "other"477condition in 19 of these cases was atherosclerotic coronary artery disease. Of these, 8 persons had478hypertensive cardiovascular disease and 2 had pulmonary emphysema in addition. In the remaining 7 cases479of this group, the primary cause of death was atherosclerotic coronary artery disease and the "other" condition480was asphyxia by CO. In Group 2 atherosclerotic coronary artery disease was the primary cause of death and481asphyxia by CO was the "other" condition in 3 cases. In the remaining 7 cases asphyxia by CO was the482primary cause of death and in all but one of these cases, the "other" condition was atherosclerotic coronary483artery disease, two of the individuals had hypertensive cardiovascular disease in addition. The results are484presented in Table 3.485

CARBON MONOXIDE FINAL: 11/2006
7
TABLE 3: INCIDENCE OF ATHEROSCLEROTIC CORONARY ARTERY DISEASE AND COHb IN486FATALITIES THAT INVOLVED CO EXPOSURE; 487
adopted from Balraj, 1984488Number of cases
Group 1 Group 2 Group 3
Total489 28 10 100
Age (years)490 30-40 1 0 22
41-50 1 0 31
51-60 7 2 28
61-70 10 4 10
71-80 5 2 6
81-90 4 2 3
COHb (%)491 10-30 14 5 0
40-50 4 3 0
60 and more 0 0 100
Delayed deaths492 10 2 0
Coronary493atherosclerosis494
mild 2 unknown 89
moderate 2 unknown 5
severe 24 5 6
Myocardial infarct495 recent 1 0 0
old 4 1 2
Heart weight (g)496 415 and more 20 unknown 13 497
2.2. Nonlethal Toxicity498Nonlethal effects of CO on humans have been reported in experimental studies in both healthy499
individuals and in patients with coronary artery disease (see Section 2.2.1). Case studies (see Section 2.2.2)500are presented for children and adults and identify children as another susceptible subgroup for nonlethal CO501effects. 502
2.2.1 Experimental Studies503
2.2.1.1 Subjects with Coronary Disease504
A large number of studies investigated the effects of low CO exposure (COHb <10 %) on healthy505individuals and high-risk groups. These experiments have been reviewed extensively by WHO (1999a) and506EPA (2000). In healthy individuals, symptoms, such as decreases in work capacity and decrements of507neurobehavioral function, start at COHb of 5 % (WHO, 1999a; EPA, 2000; Hazucha, 2000). With respect508
CARBON MONOXIDE FINAL: 11/2006
8
to high-risk groups, studies evaluating ST-segment changes in the electrocardiogram and cardiac509arrhythmogenic effects in patients with coronary artery disease will be presented here, because these gave510the most consistent results and also were considered most relevant for AEGL derivation (for review see WHO5111999a; EPA, 2000).512
Caracteristic points of an electrocardiogramm are the P wave, reflecting atrial depolarization, the513QRS-complex, representing the ventricular muscle depolarization, and the T-wave, reflecting ventricular514muscle repolarization. In the normal electrocardiogramm, the ST-segment is isoelectric, resting at the same515potential as the interval between the T-wave and the next P wave. Horizontal depression or a downsloping516ST-segment merging into the T-wave occurs as a result of ischemia, ventricular strain, changes in the pattern517of ventricular depolarization or drug effects. In chronic ischemic heart disease, there may be moderate degrees518of horizontal ST-segment depression or a downward sloping ST-segment, flattening or inversion of T-waves519and prominent U-waves. It is difficult to define an abnormal ST-segment depression in precise quantitative520terms. However, a myocardia ischemia has to be considered if the beginning of the ST-segment is more than5210.5 mm (corresponding to 0.05 mV) below the isoelectric line and there is an associated T-wave abnormality522(Wilson et al., 1991).523
Allred et al. (1989a; b; 1991) conducted a multicenter study of effects of low COHb on 63 individuals524with coronary artery disease. Male subjects aged 41-75 (mean = 62.1 years) with stable exertional angina525pectoris (diagnosis established for >3 months; no at rest symptoms) and a positive stress test (measured by526a greater than 1-mm change in the ST-segment of the electrocardiogram and occurrence of angina symptoms),527were studied in three different test centers using standardized test protocols. Only patients showing528reproducible effects before and after a test stay in the exposure chamber on the qualifying visit were included.529On the subsequent exposure days, the stress test was repeated before the exposure and if the result was not530reproducible compared to the qualifying visit, the visit was repeated on another date and at the second failure531in the pretest the subject was dropped from the study. Further evidence that these subjects had coronary artery532disease was provided by the presence of at least one of the following criteria: angiographic evidence of533narrowing (~70 %) of at least one coronary artery, documented prior myocardial infarction or a positive stress534thallium test demonstrating an unequivocal perfusion defect. 535
All patients were tested three times on separate days in a double-blind fashion. On each of the 3536exposure days, the subject performed a symptom-limited exercise test on a treadmill (pretest), he was then537exposed for 50-70 minutes randomly to air and to CO (subjects were exposed to CO concentrations that were538experimentally determined to produce end-exposure COHb of 2.2 % or 4.4 %; these COHb values were 10539% higher than the targeted concentrations to compensate for the CO loss during exercise) and afterwards he540performed a second symptom-limited exercise test. The mean exposure levels and ranges for the test541environment were clean air (0 ppm), 117 ppm (range 42-202 ppm) for COHb of 2 % and 253 ppm (range 143-542357 ppm) for COHb of 4 %. Gas chromatographic measurements of COHb were performed 1 minute after543the pretest, after 30 and 40 minutes into exposure, at the end of exposure and 1 minute after the second stress544test and revealed postexercise COHb of 2.0±0.1 and 3.9±0.1 %, respectively. The time to onset of angina and545the time to 1-mm ST-segment change were determined for each test. The percent changes following exposure546at both 2 % and 4 % COHb were then compared with the same subject's response to the randomized exposure547to room air.548
When potential exacerbation of the exercise-induced ischemia by exposure to CO was tested using549the objective measure of time to 1-mm ST-segment change, exposure to CO levels producing COHb of 2 %550resulted in a overall statistically significant 5.1 % decrease in the time to attain this level of ischemia. For551individual centers, results were significant in one, borderline significant in one and nonsignificant in one552

CARBON MONOXIDE FINAL: 11/2006
9
center. At 4 % COHb, the decrease in time to the ST criterion was 12.1% (statistically significant for all553patients, the effect was found in 49/62 subjects) relative to the air-day results. Significant effects were found554in all three test centers. The maximal amplitude of the ST-segment change was also significantly affected by555the carbon monoxide exposures: at 2 % COHb the maximal increase was 11 % and at 4 % COHb the increase556was 17 % relative to the air day.557
At 2 % COHb, the time to angina was reduced by 4.2 % in all patients (effects were significant in two558test centers and nonsignificant in one center). At 4 % COHb, the time was reduced by 7.1 % in all patients559(effects were significant in one, borderline significant in one and nonsignificant in one center). The two end-560points (time to angina and time to ST change) were also significantly correlated. 561
Only at 4 % COHb a significant reduction in the total exercise time and in the heart rate-blood562pressure product was found (this double product provides a clinical index of the work of the heart and563myocardial oxygen consumption).564
A number of other studies also evaluated the same endpoints. A reduced time to onset of exercise-565induced chest pain was reported at COHb of 2.5-3.0 % (Aronow et al., 1972), 3 % (Kleinman et al., 1989),5662.9 % and 4.5 % (Anderson et al., 1973) and at 3.9 % (Kleinman et al., 1998). No significant depression of567the ST-segment was found at COHb of 3.8 % (Sheps et al., 1987) and 3.9 % (Kleinman et al., 1998). WHO568(1999a) has tried to explain the differences between these studies by differences in experimental methodology569and analysis of data and by differences in subject populations and sample size.570
Sheps et al. (1990; 1991) assessed the effect of CO exposure on ventricular arrhythmias. 41 subjects571with established coronary artery disease (36 men and 5 women) with a mean age of 62.8±1.1 years were572analyzed. Patients were categorized based on arrhythmia frequency on the training day before, during and5736 hours after exercise: 10 had no arrhythmias (0-2 ventricular premature depolarizations (VPD)/h), 11 had574low-level arrhythmias (3-50 VPD/h), 11 had intermediate-level arrhythmias (51-200 VPD/h) and 9 had high-575level arrhythmias (>200 VPD/h). The protocol was performed over 4 consecutive days. Day 1 was the576familiarization session and instructions were given how to use the 24-hour ambulatory electrocardiogram577recorder; a symptom-limited maximal bicycle exercise test was done. Days 2 to 4 were exposure days with578either pure room air or CO (100 or 200 ppm) administered in a randomized double-blind fashion. COHb579measurements were performed before exposure, after 30 and 60 minutes into the exposure, at the end of the580exposure and before and after exercise using an IL-282 CO-oximeter. Exposures were stopped when the target581levels of 4 or 6 % COHb was reached. Exposure durations were 94.2 ± 4.2 (SE) minutes (range 40 to 170582min) for the 4 % level and 82.3 ± 2.9 (SE) minutes (range 39 to 135 min) for the 6 % level. On all three test583days, the mean pre-exposure COHb was 1.8 %. The post-exposure and post-exercise COHb measured were5841.46 and 1.36 % for air exposure, 4.01 and 3.93 % for the 4-% group and 5.91 and 5.02 % for the 6-% group.585Comparisons of arrhythmia data were done at COHb of 1.41, 3.71 and 5.33 %, respectively. 586
During the exposure period, the mean number of single VPD/h on the room air day was significantly587higher than on the 4 % COHb day, while no significant difference in the mean number of VPD/h was noted588between room air and 6 % COHb exposure. When the baseline level of VPD frequency was controlled for589by calculating the difference between the VPD frequency during exposure and the VPD frequency before590exposure, there was no significant difference between the room air and 4 % COHb exposure. 591
During exercise period, the frequency of single VPD/h was greater in the 6-% day than on room-air592day (167±38 vs. 127±28 VPD/h; p=0.03). This effect was still significant, when the baseline VPD level was593controlled for (117±34 vs. 74±26, p=0.04). For this analysis, data from subjects in the low, medium and high594VPD frequency groups were pooled. The difference remained significant when all subjects, including those595
CARBON MONOXIDE FINAL: 11/2006
10
categorized in the "no arrhythmia" group were included in the analysis. The VPD frequency was not596significantly increased at 4 % COHb.597
The initial findings (essentially negative) of this study in 10 patients with ischemic heart disease and598no ectopy during baseline monitoring were also published separately (Hinderliter et al., 1989).599
Dahms et al. (1993) studied 28 men and 5 women with documented coronary artery disease and a600minimum of 30 ventricular ectopic beats per hour over a 20-h period studied. On three testing days, the601subjects were exposed in a randomized double-blind fashion to either room air or sufficient CO to elevate602their COHb to 3 or 5 % in 1 hour. The mean exposure concentrations during this hour were 159±25 ppm and603292±31 ppm, respectively. This was followed by a maintenance exposure to mean concentrations of 19.3 and60431 ppm, respectively, for an additional 90 minutes, which included the exercise test (after 60 minutes of605equilibrium exposure) and immediate postexercise phase. The subjects then left the laboratory and resumed606their normal daily activity to determine changes in ventricular ectopic beats after CO exposure. To this end,607continuous 20-h ambulatory electrocardiograms were obtained with the recorder placed on the patients 2608hours before CO exposure. There was no significant change in the frequency of single ventricular ectopic609beats at rest from 115±28 (in room air) to 121±31 at 3 % and 94±23 at 5 % COHb. Exercise itself increased610the frequency of ventricular ectopic beats (from a baseline of 116 to 206 during exercise and 375 during611exercise recovery for the room air exposure), but there was no additional effect of CO exposure. Analysis of612the data based on grouping of the subjects by the severity of disease (ventricular ectopic beat frequency,613ejection fraction, presence of exercise-induced ischemia) indicated no proarrhythmic effect of CO.614
2.2.1.2 Healthy Adults615
Chiodi et al. (1941) exposed each of 4 male subjects (aged 21-33 years) repeatedly to CO616concentrations of 0.15-0.35 % (1500-3500 ppm) for 70 minutes or longer. During 1 hour before exposure,617basal oxygen consumption, ventilation, pulse rate and blood pressure were recorded and arterial blood for pH618determination was obtained. The subject, remaining in rest during exposure, then breathed CO-containing619air from a 600-liter gasometer. The measurement of the above mentioned parameters was continued during620exposure. In one set of experiments the test subjects reached COHb between 3.4 and 10.4 % (8 experiments621in total with the following COHb at the end of exposure: 4.6, 6.3, 7.2, 9.2 and 9.8 % in subject H.C. and 3.4,6229.5 and 10.4 % in subject F.C.). In another set of experiments , three subjects reached COHb of 27-52% at623the end of exposure (in 11 of a total of 22 experiments COHb between 40 and 52 % were measured). The624following COHb values were measured at the end of exposure: 0, 31, 32, 32, 33, 39, 41, 42, 43, 45 and 52625% in subject H.C., 0, 27, 35, 41, 43 and 48 % in subject F.C. and 0, 0, 41, 42 and 44 % in subject S.H. No626statement was made on whether any symptoms were observed. The cardiac output increased 20-50 % at627COHb >40 %, while the changes were negligible at COHb of <30 %. No effects on the other parameters628measured were found.629
Henderson et al. (1921) exposed volunteers in a 6.4-m³ gas-tight, steel-walled exposure chamber. CO630was generated by dripping formic acid into strong sulfuric acid. A defined volume of CO was led into the631chamber and mixed with an electric fan. Analysis of the exposure concentration in the chamber was done632using the iodine pentoxide method. Subjects (9 men and 1 woman; number of subjects at each concentration633given in brackets) were exposed for 1 hour at 200 ppm (2), 300 ppm (3), 400 ppm (11), 500 ppm (1), 600 ppm634(9), 800 ppm (4), 900 ppm (1) or 1000 ppm (1) CO. Blood samples were taken before exposure, at 30 minutes635into the exposure, at the end of the exposure (60 minutes) and once or twice during the next three hours after636

CARBON MONOXIDE FINAL: 11/2006
11
end of the exposure. The COHb was determined using the carmine method. Directly after leaving the637exposure chamber, subjects breathed several times into a bladder bag and CO was determined in the exhaled638air using the iodine pentoxide method. CO concentrations in alveolar air after 60 minutes was 130-136 ppm639at an exposure concentration of 400 ppm, 120-230 ppm at 600 ppm and 140-230 ppm at 800 ppm. The COHb640percentage ranged from 11-12 % at 200 ppm, 10-14 % at 300 ppm, 14-22 % at 400 ppm, 16-26 % at 600 ppm,64126-34 % at 800 ppm, 34 % at 900 ppm and 38 % at 1000 ppm. After exposure to up to 500 ppm for 60642minutes, no symptoms were observed. At 600 ppm, 2/9 subjects reported slight frontal headache. At 800 ppm643all subjects reported decided frontal headache during 4-8 hours. At 900 ppm insomnia and irritability occurred644in addition to headache. At 1000 ppm, irritability, throbbing frontal headache and at times Cheyne-Stokes645breathing were observed. The Romberg test (ability to stand erect with eyes closed) showed a marked loss646of equilibrium after a 60-minute exposure to 800 ppm or higher.647
Haldane (1895) reported on a series of 11 studies in which the author exposed himself to different648CO concentrations for different exposure times. The exposure conditions and effects are summarized in the649following Table 4. The subject breathed the CO atmosphere from a mouthpiece. No mentioning of an650analytical measurement of the exposure concentrations used was made. At the end or one or more times651during the exposure, the exposure was interrupted and the subject walked in the room or ran up a flight of652stairs (once or a few times) to investigate the effect of physical exertion at different COHb levels. The COHb653was determined colorimetrically by measuring the amounts of carmine solution that had to be added to the654diluted blood sample or to an equal dilution of normal, oxygenated blood to adopt the color of a CO-saturated655blood dilution. For COHb <70 %, the author found his COHb determinations accurate within a 5 % error.656Although the exposure measurement of this study does not meet today‘s standards, the reported COHb values657are in fairly well agreement with the values calculated from the given exposure concentration and exposure658time using the mathematical model of Coburn, Forster and Kane (see Section 4.3.4) when assuming a resting659ventilation rate (see Table 21 in Appendix B).660

CARBON MONOXIDE FINAL: 11/2006
12
TABLE 4: EFFECTS OF ACUTE CO EXPOSURE IN A HUMAN SUBJECT; 661adopted from Haldane, 1895662
No.663 Exp. conc. (vol. %) [ppm]
Totalexposure
time (min)
Observations at time (min) /COHb (%)
1664 0.50 [5000] 11.5 no symptoms; hyperpnea after running upstairs
2665 0.39 [3900] 30.5 no symptoms 15 min / 23 %
slight feeling of palpitation, pulse 102 22 min
palpitation, respiration 18, pulse 120, feeling abnormal 29 min
after running upstairs became giddy, much out of breath,palpitations, slightly impaired vision
30.5 min / 39 %
3666 0.40 [4000] 24 no symptoms except unusual hyperpnea and giddiness afterrunning upstairs
24 min / 27 %
4667 0.36 [3600] 29 - 18 min / 26 %
on walking throbbing in the head and palpitations, onrunning giddy, short of breath
29 min / 37 %
5668 0.41 [4100] 29 - 15 min / 13 %
very slight hyperpnea and palpitations 28 min
after running marked giddiness and impairment of vision andhearing (for 1-2 min)
29 min / 35 %
6669 0.12 [1200] 120 - 15 min / 8 %
slight tendency to palpitations, pulse 96 33 min
no symptoms 46 min / 18 %
slight palpitations, sleepy 67 min
after running (no exposure) distinct dimness of vision andhearing, slight tendency to stagger, abnormal hyperpnea
90 min / 27 %
slight hyperpnea while sitting 104 min
distinct hyperpnea, feeling uneasy, dull and abnormal; afterrunning: weak in the legs, markedly impaired vision andhearing, confusion
120 min / 37 %
7670 0.21 [2100] 71.5 - 20 min / 17 %
very slight feeling of fullness, throbbing in the head 34 min
- 40 min / 39 %
feeling decidedly abnormal, slight hyperpnea, markedthrobbing
43 min
breathing decidedly deeper, pulse 104 45 min

CARBON MONOXIDE FINAL: 11/2006
No. Exp. conc. (vol. %) [ppm]
Totalexposure
time (min)
Observations at time (min) /COHb (%)
13
feeling decidedly abnormal, impaired vision, slight feeling ofgiddiness
54 min
hyperpnea more distinct, beginning to look pale/yellowish 59 min
- 61 min / 44.5 %
feeling worse shortly after any movement in the chair 63 min
hyperpnea marked, slight confusion of mind 65 min
vision dim, limbs weak, difficulty in getting up and walkingwithout assistance; at 6 min after exposure stop veryunsteady walking, nearly falling, very indistinct vision
71 min / 49 %
8671 irregular due todisconnectedtubing, 0.43 %for last 10 min
35 hardly able to stand, no walking alone without falling down 35 min, 56 %
9672 0.027 [270] 210 - 60 min / 7 %
- 120 min / 11 %
- 180 min / 15 %
no symptoms; after running: very slight unusual shortness ofbreath and palpitations
210 min / 14 %
10673 0.021 [210] 240 - 60 min / 8 %
- 120 min / 13 %
- 180 min / 13 %
no symptoms 240 min / 13 %
11674 0.046 [460] 240 - 60 min / 17 %
- 120 min / 28 %
- 180 min / 28 %
no symptoms; after running: unusual hyperpnea, slightpalpitations
240 min / 23 %
Stewart et al. (1970) performed 25 inhalation exposure experiments on a total of 18 healthy men (age67524-42). These were exposed sedentary in an exposure chamber at <1, 25, 50, 100, 200, 500 or 1000 ppm for676periods of 30 minutes to 24 hours. The chamber atmosphere was monitored continuously by infrared677spectroscopy and periodically by gas chromatography. The subjects performed the following678psychoneurological tests: hand and foot reaction time in a driving simulator, Crawford collar and pin test,679Crawford screw test, hand steadiness test, Flanagan coordination test, othorator visual test, complete680audiogram, resting 12-lead electrocardiogram, standard electroencephalogram, visual evoked response and681time estimation-hand reaction time test. No subjective symptoms or objective signs of illness were noted682

CARBON MONOXIDE FINAL: 11/2006
14
during or in the 24-hour period following exposure to 25 ppm for 8 hours, 50 ppm for 1, 3 or 8 hours, or 100683ppm for 1, 3 or 8 hours. There was no detectable change from control values in the clinical tests. A significant684relationship between the Crawford collar and pin test and CO concentration was considered a chance finding685by the authors. Of 11 subjects exposed to 200 ppm for 4 hours, 3 subjects reported they had developed a686„mild sinus“ headache in the final hour. In the clinical tests, no detectable statistical change from control687values was observed. In the first exposure to 500 ppm for 1.8 hours, one of the two subjects reported light-688headedness after 20 minutes of exposure, which was believed to be due to his hyperventilation. After 1 hour689of exposure, both subjects were aware of a 10 % increase in heart rate with the minimal exertion of walking690to the blood port. After 90 minutes of exposure the second subject noted the onset of mild frontal headache.691During the second exposure to 500 ppm for 2.3 hours, the same subjects both developed mild frontal692headaches after 1 hour of exposure. Minimal exertion caused a transient intensification of the pain. Both693headaches remained mild during the first postexposure hour, then they intensified into excruciatingly severe694occipitofrontal headaches, reaching a pain peak 3.5 hours after exposure, and persisted for 7 hours. During695the third exposure to 500 ppm, the occurrence of mild frontal headaches was noted after 1 hour of exposure.696Immediately after exposure, both subjects were placed in a hyperbaric chamber and administered oxygen and697the mild headaches were gone within minutes. The mean COHb reached after 2.3-h exposure to 500 ppm was698about 25.5%, after 4-h exposure to 200 ppm about 16.0 % and after 8-h exposure to 100 ppm about 12.5 %.699
In another experiment (Kizakevich et al., 1994) evaluating cardiovascular responses of exercising700individuals, 16 health young men performed a sequence of brief (5 minutes) multi-level treadmill and hand-701crank exercises at <2 % COHb and after attaining 5, 10, 15 or 20 % COHb on different days . Non-invasive702impedance cardiography was used to estimate cardiac output, stroke volume, heart rate, cardiac contractility703and time-to-peak ejection time. The electrocardiogram was used to assess myocardial irritability and ischemia704and changes in cardiac rhythm. The results showed that compensatory cardiovascular responses to705submaximal upper- and lower-body exercise (e.g., increased heart rate, cardiac contractility, cardiac output)706occur after CO exposures. These changes were highly significant for exposures attaining 20% COHb. The707authors concluded that healthy young men can perform submaximal exercise without overt impairment of708cardiovascular function after CO exposures attaining 20 % COHb. 709
Nielsen (1971) investigated the effect of CO exposure on thermoregulation. Experiments were710performed repeatedly on two subjects. Subject JHB reached COHb levels of 25 % (mean of 8 experiments)711and 33 % (4 experiments) and subject PJC reached 30 % (4 experiments). After reaching the desired COHb712level, the subjects exercised on a chair-ergometer for 1 hour at a medium to high workload (mean heart rate713120-170 beats per minute). The subjects were not exposed continuously to CO during exercise, but the COHb714level was maintained by breathing a calculated volume of CO from an anesthesia bag for 1-1.5 minutes every71515 minutes during exercise. CO exposure led to an increase in the plateau level of the deep body temperature716during exercise of 0.3-0.5 °C. The lactic acid concentration was not increased after exercise at air exposure717(120 mg/l in JHB and 79 mg/l in PJC), but increased during CO exposures (309-660 mg/l in both subjects).718The authors stated neither the absence nor the presence of any symptoms of CO exposure.719

CARBON MONOXIDE FINAL: 11/2006
15
2.2.2 Case Studies720
2.2.2.1 Children721
Klasner et al. (1998) published a retrospective chart review on a mass poisoning at an elementary722school. The CO leak was discovered at noon, about 4 hours after school started. Of the 564 people at school,723504 were children. Any child who showed evidence or complained of symptoms was sent to a hospital by724ambulance or school bus. 177 children (mean age 8.7±1.8 years, range 4-12 years) were taken to one of three725hospitals. All children were given 100 % oxygen by face mask in the hospital (the authors stated that only726few of these received simple face mask oxygen en route to the hospital). The level of poisoning was assessed727according to standardized poison center data sheets (TESS, toxic exposure surveillance sheets) and was728recorded as unknown (n=6), no effect (n=16), minor effect (n=124) or moderate effect (n=30). One child, for729whom the data sheet classification was that of a major effect, was considered miscoded by the authors because730the medical record showed that this child was sent home from the hospital without further treatment.731Symptoms were present in 155 children and a mean COHb of 7.0 % (95 %-C.I. 6.6-7.5 %) was measured in732a total of 147 children (blood was drawn at the same time oxygen therapy began). The authors estimated that733the children were exposed at least 60 minutes (in some cases 90 to 120 minutes) to fresh air prior to obtaining734their initial COHb. In the 177 children the following symptoms (number of mentionings) were observed735(some children reported more than one symptom): headache (139), nausea (69), dizziness (30), dyspnea (19),736vomiting (13), abdominal pain (11), drowsiness (9), other symptoms (0). The authors found a correlation737between the total number of symptoms reported and the COHb, such that children with higher COHb were738slightly more likely to report more symptoms. The authors did not mention how many of the 60 adults739experienced symptoms, but stated that symptomatic adults were taken adult hospital facilities.740
Crocker and Walker (1985) analyzed 28 patients with CO poisoning that were 14 years old or741younger. 25/28 CO exposures were secondary to faulty venting or faulty combustion of gas furnaces, 2/28742were secondary to faulty combustion of a gas stove and 1/28 to motor vehicle exhaust. 12 patients had COHb743of less than 15 % and were completely asymptomatic. These patients were considered to have nontoxic744exposures, and they were not studied further. Of the 16 patients (mean age 7.0±3.8 years, 3 children were745younger than 5 years) with COHb of 15 % or higher, 16/16 experienced nausea, 12/16 experienced associated746vomiting, 13/14 (no information on 2) complained of headache and 11/16 patients were reported to be747lethargic.3/14 patients reported visual problems, such as blurred or double vision. 9/16 reported at least one748syncopal episode with an average COHb of 31.6 % and a threshold level of 24.3 %. Every patient with a749COHb of 24.5 % or higher experienced syncope. Lethargy was reported in 11/16 patients at a mean COHb750of 25.9 % and a threshold of 18.6 %. Symptoms and COHb are presented in Table 5. All patients were751successfully treated with hyperbaric oxygen. The authors provided the COHb measured after hospital752admission, but did not give any information on the delay between the end of exposure and measurement and753on (probable) oxygen administration before hospital admission, e.g. oxygen by face mask during ambulance754transport.755
Patient follow-up utilizing parental telephone interview and medical record review 3-12 months after756the poisoning was used to screen for neurologic sequelae. Three patients had developed problems: a 12-year-757old boy with 36.1 % COHb had developed chronic headaches, a 6-year-old girl with 36.9 % COHb had758developed memory difficulties after suffering a major motor seizure during the poisoning episode and an 8-759year-old girl with 24.5 % COHb developed poor school performance, which were attributed to her long-760standing poor reading ability; psychological evaluation revealed no cognitive deficits. The former two761children reported complete resolution of their symptoms by 9 months post exposure.762

CARBON MONOXIDE FINAL: 11/2006
16
TABLE 5: SYMPTOM THRESHOLD VALUES FOR PEDIATRIC CO TOXICITY; adopted from763Crocker and Walker, 1985764
Symptom765 Threshold COHb (%) Average COHb (%) Percentage of patients * (%)
none766 <15 <15 100
Nausea767 16.7 27.1 100
Vomiting768 19.8 29.4 78.6
Headache769 16.7 28.3 91.6
Lethargy770 18.6 25.9 78.6
Visual symptoms771 24.5 32.5 25.0
Syncope772 24.5 31.6 64.3
Seizures773 36.9 36.9 6.3
* The percentage of patients showing the respective symptom refers to the 16 patients with COHb >15 %, except for774asymptomatic patients ("none"), which refers to the 12 patients with COHb <15 %.775
Klees et al. (1985) investigated the neurotoxic sequelae of CO poisoning in children that had been776brought to the emergency department of St. Pierre Hospital, Brussels following CO poisoning (irrespective777of whether they were subsequently hospitalized or not). Cases were only studied when follow-up was778possible: in a short-term follow-up of 20 children that were submitted to psychological tests at the time of779the intoxication and who were re-examined again about 3 months later, and in a long-term follow-up of 14780children that were re-examined between 2-11 years after the intoxication. The authors listed the COHb781measured after hospital admission, but did not give any information on the delay between the end of exposure782and measurement neither did they indicate a (probable) oxygen administration before hospital admission, e.g.783oxygen by face mask during ambulance transport.784
In the long-term follow-up, 6 of the 14 children (age 2.8-12.1 years at the time of intoxication; mean785age 7.8 years) exhibited serious disorders (spatial organization problems, constructive apraxia, deterioration786of lexical activity, as well as spelling and arithmetic); two of them had a previous history of psychological787difficulties, but displayed additional difficulties after the poisoning. COHb between 13 and 32 % (mean 21788%) have been reported for 4/6 children (no data on the other 2 children were available). Seven of the 14789children (age >6 years, except for one 3.5-year old child; mean age 9.8 years) exhibited slight impairment790of visual memory and concentration; these children had COHb between 16 and 26 % (mean 22 %). One child791of this group did not display any sequelae.792
In the short-term follow-up, the authors grouped the 20 children according to age. In children below7933 years of age (n=6, 2.0-2.9 years), medium intoxications (n=5, symptoms included loss of consciousness,794but no coma; reported COHb 16-27 %) did not produce manifest sequelae except for a momentary standstill795in the child‘s progress of about 2 months, but their negative behavior was found to be amplified (children796were more nervous, more irritable, more anxious); however it was not possible to determine if these797behavioral disturbances were a direct effect of the CO intoxication of whether they were due to798neurophysiological causes or to the stressful psychological conditions surrounding the intoxication. In one799case of severe intoxication (symptoms included coma; COHb 37 %) developmental level regression (motricity800and language), violent anger and nervosity were observed. 801
In children from 4 to 9 years old (n=8), the intoxication did not alter the intellectual capacities, but802in 6 cases (reported COHb of 4, 6, 25 and 27 %; missing data for two children) the mnestic and instrumental803
CARBON MONOXIDE FINAL: 11/2006
17
aspects of the cognitive development were modified (the other two were difficult to evaluate due to804intellectual retardation and language retardation). Visuo-spatial perceptions and topographical memory were805particularly perturbed, as was auditory memory.806
In children over 10 years of age (n=10), difficulty in perceiving and organizing the material to be807memorized either auditory or visually was found in the three children less than 12 years (COHb of 26, 27 and80836 %). With the three children over 14 years, one case (30 % COHb) of serious balance impairment was809observed and only some slowness and instability with the other two (COHb of 26 and 30 %).810
Meert et al. (1998) evaluated clinical characteristics and neurologic outcome of all children with CO811poisoning admitted to the Children‘s Hospital of Michigan, Detroit between January 1987 and December8121996. Exposures were categorized as 1) severely toxic when COHb was >25 %, 2) toxic when COHb was813between 10.1 and 25 %, 3) suspected toxic when COHb was #10 % with acute neurologic manifestations,814or 4) nontoxic when COHb was #10 % without acute neurologic manifestations. Of 106 cases (median age8153.5 years, range 0.1 to 14.9 years) were investigated, 37 with severe toxic, 37 with toxic, 13 with suspected816toxic and 19 with nontoxic exposures. The most common presenting symptoms included altered level of817consciousness (lethargy, unresponsiveness), metabolic acidosis, tachycardia and hypertension. All exposures818were accidental, occurring as a result of smoke inhalation during house fires in 95, motor vehicle exhaust in8196 and defective heating system in 5 cases. Forty-three children had an associated cutaneous burn injury. All820patients received normobaric oxygen for a median period of 5.5 hours (range 0.6 to 44 hours). Fifteen patients821died, 8 from hypoxic-ischemic encephalopathy after cardiopulmonary arrest at presentation, 3 from massive822burn injury and 4 from late complications of burn injury. Nine survivors suffered neurologic sequelae: 1) 6823had persistent deficits, such as cognitive and motor deficits or developmental delay (of these 4 had presented824with respiratory or cardiorespiratory arrest with COHb between 31.5 and 45 % and the other two; COHb 14.8825and 5.9 %; had severe burns with 40 and 75 %, respectively, of the body surface area affected) and 2) 3826patients developed delayed neurologic syndromes (2 children; COHb 33.3 and 34.8 %; with transient tremors,827cognitive deficits and hallucinations starting after 4 and 14 days, that resolved spontaneously after about 2828months, and 1 child; COHb 3.1 %; that developed deficits in cognitive and interpersonal skills after 51 days829and in whom brain imaging revealed bilateral occipital lobe infarcts).830
Further information on pediatric CO poisoning can be found in the review of White (2000).831
2.2.2.2 Adults832
Burney et al. (1982) reported an epidemiologic and clinical investigation of 184 persons exposed to833CO in a public school. CO release was from a furnace and was caused because of a door to the exhaust834chamber had been inadvertently left ajar. The CO was distributed throughout the school building by a forced835air heating system. Exposure began at 7.30 a.m. and ended at 10.00 a.m. Of the 184 exposed persons (146836students and 38 teachers, mean age for all exposed was 20 years) 160 became ill and 96 were transported to837four hospitals for treatment. COHb levels were measured on 66 persons and showed a mean of 18.2±6.4 %,838with almost half falling between 21 and 25 %. Persons in whom COHb levels were drawn had a mean839exposure time of 107±33 minutes. Of the 160 persons who became ill, the following symptoms were reported840for 159 persons: headache (90 %), dizziness (82 %), weakness (53 %), nausea (46 %), trouble thinking (46841%), shortness of breath (40 %), trouble with vision (26 %), and loss of consciousness (6 %). For headache,842dizziness, muscle weakness, trouble with vision and trouble with thinking, a strong correlation between843symptom and duration of exposure was found, while nausea, shortness of breath and loss of consciousness844

CARBON MONOXIDE FINAL: 11/2006
18
did not show this correlation. The authors corrected the measured COHb level for the delay between exposure845and the drawing of blood samples and reported a corrected mean COHb of 20.7±7.0 %. 846
Ely et al. (1995) reported a poisoning incident in a warehouse of a small sewing company. A propane-847fueled forklift was in use in the warehouse, in which a total of 30 people worked. The forklift was parked in848a position where its exhaust focused directly into an air intake duct, that communicated with a vent opening849above a table in the inspection and packing area, where 5 people worked. On the day of the incident, one man850reported pronounced nausea, vomiting, dizziness and had a tonic-clonic seizure. Simultaneous, other851coworkers developed chest pain and dyspnea. The warehouse was evacuated immediately. Air CO852measurements were 386 ppm in the sewing area and 370 ppm in an unrelated work area. Thirty persons with853complaints of severe headaches (93 %), dizziness (63 %), weakness (63 %), nausea (60 %), chest pain or854tightness (57 %), shortness of breath (50 %), vomiting (37 %), abdominal pains (33 %), muscle cramping (30855%), difficulty concentrating (23 %), visual changes (20 %) and confusion (17 %) were treated for CO856exposure. Twenty-six patients had expiratory CO analyses after being treated with 100 % oxygen for over8572 hours. Expiratory CO was higher in those from the inspection and packing area (21.1±0.7 % versus 8.4±4.8858%). These persons were among the most severely ill. The authors extrapolated the mean expiratory CO859concentration of 21.1 % back to a COHb of about 35 % at the end of exposure. Two years after the incident,860follow-up was obtained for 25 (83 %) of the patients: 11 (44 % of those reached) reported seeing physicians861for persisting symptoms (numbness in arms or legs, 36 %; restlessness, 36 %; persistent headaches, 32 %;862irritable or violent behavior, 16 %; confusion, 16 %; incontinence, 16 %; difficulty walking or moving863arms/legs, 16 %; memory loss, 16 %; difficulty speaking, 4 %).864
Sokal and Kralkowska (1985) analyzed 39 patients (18 men, 21 women) that were hospitalized for865acute CO poisoning. 25 patients were intoxicated by household gas and 14 patients by coal-stove gas. The866patient‘s ages ranged from 13 to 78 years. The duration of the poisoning varied between 1 and 14 hours and867was established on the basis of an epidemiological review of the circumstances of poisoning. The severity868of poisoning evaluated on admission to hospital according to the clinical criteria presented in Table 6. On869basis of the clinical criteria, 16 cases were classified as degree I, 12 as degree II, 8 as degree III and 4 as870degree IV. For statistical analysis the mild and moderate cases (I and II) were pooled into one group and the871severe and very severe cases (III and IV) into another. Results presented in Table 7 show that mean COHb872in severe and very severe poisonings were only slightly higher (not statistically significant) than those in the873mild and moderate group. On the other hand, the average duration of exposure which induced severe or very874severe poisonings was about twice as long as that associated with mild and moderate poisonings. In the severe875and very severe poisonings, the lactic acid concentration in blood, as an indicator of metabolic acidosis, was876significantly higher. For pyruvate and glucose concentrations no significant differences were found (not877shown).878
TABLE 6: SEVERITY OF CO POISONING; from Sokal and Kralkowska, 1985879Grade I (mild)880 headache, vomiting, tachycardia, no disturbances of consciousness
Grade II (moderate)881 disturbances or loss of consciousness without other neurological symptoms,tachycardia, pain-induced reflexes still intact
Grade III (severe)882 loss of consciousness, intense muscular tonus, neurological symptoms, tachycardiaand tachypnea, circulatory and respiratory disturbances not observed
Grade IV (very severe)883 loss of consciousness, clinical signs of central nervous system damage, circulatory
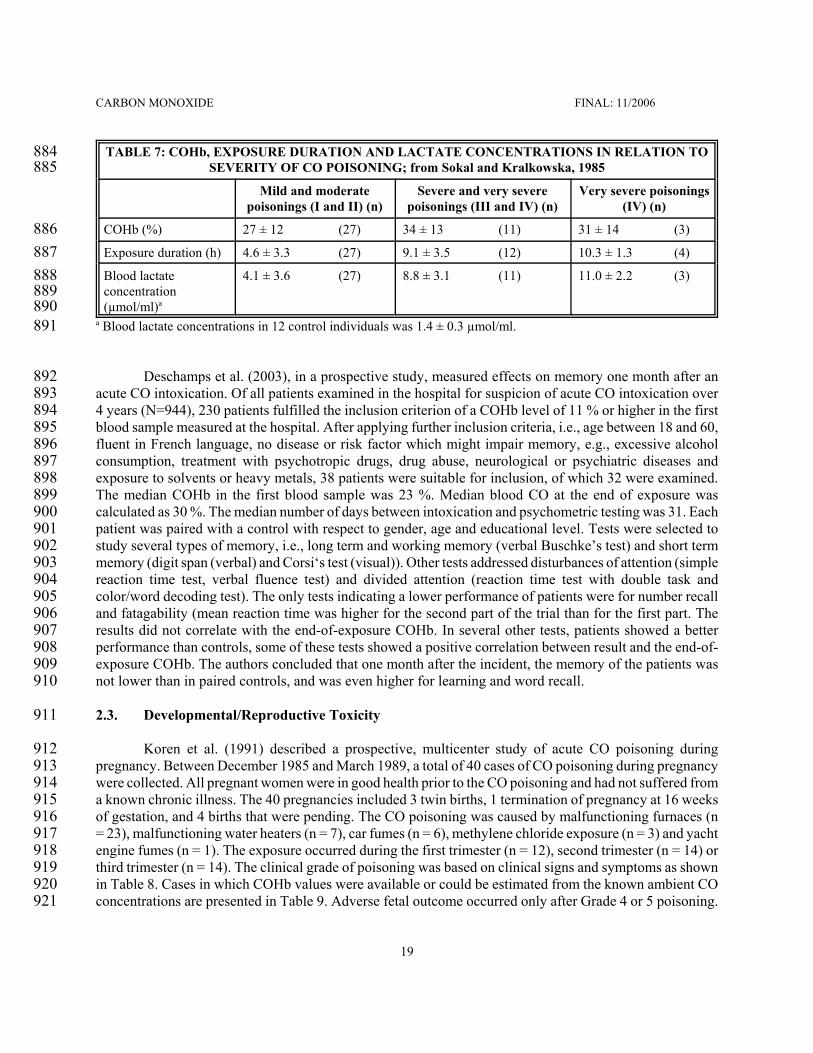
CARBON MONOXIDE FINAL: 11/2006
19
TABLE 7: COHb, EXPOSURE DURATION AND LACTATE CONCENTRATIONS IN RELATION TO884SEVERITY OF CO POISONING; from Sokal and Kralkowska, 1985885
Mild and moderatepoisonings (I and II) (n)
Severe and very severepoisonings (III and IV) (n)
Very severe poisonings(IV) (n)
COHb (%)886 27 ± 12 (27) 34 ± 13 (11) 31 ± 14 (3)
Exposure duration (h)887 4.6 ± 3.3 (27) 9.1 ± 3.5 (12) 10.3 ± 1.3 (4)
Blood lactate888concentration889(µmol/ml)a890
4.1 ± 3.6 (27) 8.8 ± 3.1 (11) 11.0 ± 2.2 (3)
a Blood lactate concentrations in 12 control individuals was 1.4 ± 0.3 µmol/ml.891
Deschamps et al. (2003), in a prospective study, measured effects on memory one month after an892acute CO intoxication. Of all patients examined in the hospital for suspicion of acute CO intoxication over8934 years (N=944), 230 patients fulfilled the inclusion criterion of a COHb level of 11 % or higher in the first894blood sample measured at the hospital. After applying further inclusion criteria, i.e., age between 18 and 60,895fluent in French language, no disease or risk factor which might impair memory, e.g., excessive alcohol896consumption, treatment with psychotropic drugs, drug abuse, neurological or psychiatric diseases and897exposure to solvents or heavy metals, 38 patients were suitable for inclusion, of which 32 were examined.898The median COHb in the first blood sample was 23 %. Median blood CO at the end of exposure was899calculated as 30 %. The median number of days between intoxication and psychometric testing was 31. Each900patient was paired with a control with respect to gender, age and educational level. Tests were selected to901study several types of memory, i.e., long term and working memory (verbal Buschke’s test) and short term902memory (digit span (verbal) and Corsi‘s test (visual)). Other tests addressed disturbances of attention (simple903reaction time test, verbal fluence test) and divided attention (reaction time test with double task and904color/word decoding test). The only tests indicating a lower performance of patients were for number recall905and fatagability (mean reaction time was higher for the second part of the trial than for the first part. The906results did not correlate with the end-of-exposure COHb. In several other tests, patients showed a better907performance than controls, some of these tests showed a positive correlation between result and the end-of-908exposure COHb. The authors concluded that one month after the incident, the memory of the patients was909not lower than in paired controls, and was even higher for learning and word recall. 910
2.3. Developmental/Reproductive Toxicity911
Koren et al. (1991) described a prospective, multicenter study of acute CO poisoning during912pregnancy. Between December 1985 and March 1989, a total of 40 cases of CO poisoning during pregnancy913were collected. All pregnant women were in good health prior to the CO poisoning and had not suffered from914a known chronic illness. The 40 pregnancies included 3 twin births, 1 termination of pregnancy at 16 weeks915of gestation, and 4 births that were pending. The CO poisoning was caused by malfunctioning furnaces (n916= 23), malfunctioning water heaters (n = 7), car fumes (n = 6), methylene chloride exposure (n = 3) and yacht917engine fumes (n = 1). The exposure occurred during the first trimester (n = 12), second trimester (n = 14) or918third trimester (n = 14). The clinical grade of poisoning was based on clinical signs and symptoms as shown919in Table 8. Cases in which COHb values were available or could be estimated from the known ambient CO920concentrations are presented in Table 9. Adverse fetal outcome occurred only after Grade 4 or 5 poisoning.921

CARBON MONOXIDE FINAL: 11/2006
20
TABLE 8: SEVERITY OF CO POISONING; adopted from Koren et al., 1991922Grade 1923 Alert, oriented, headache, dizziness, nausea
Grade 1+924 As Grade 1, but another person exposed in the same incidence was unconscious
Grade 2925 Alert, alterations of mental state, more pronounced headache, dizziness, nausea
Grade 3926 Not alert, disorientation, loss of recent memory, muscle weakness, incoordination
Grade 4927 Disoriented, depressed sensorium, limited and inappropriate response to simple commands
Grade 5928 Comatose, responding only to pain or not responding to any stimulus
TABLE 9: OVERVIEW OF CLINICAL SCORING, COHb AND FETAL OUTCOME; 929adopted from Koren et al., 1991930
Grade931 COHb (%) Time of examafter exposure (h)
Treatment a Outcome
5932 40-50 2 HfO, 2 h Elective termination (in the text the authorsstate: fetal death at term followed bymaternal demise)
5933 26 1 HfO, 3 h Stillborn
4934 39 2 HybO, 2 h Normal
4935 25 2 HfO, 2 h Cerebral palsy compatible with postanoxicencephalopathy
4936 21 2 HybO, 2 h Normal
2937 13.8 1 HfO, 7 h andHybO, 2 h
Normal
1938 18 unknown HfO, 12 h Normal
1939 14 unknown none Normal
1940 6.2 1.5 none Normal
1941 2.4 unknown none Normal
1942 0.8 1 none Normal
1943 2 unknown none Normal
Cases with indirect measures of exposure9441+945 32, measured
in affected son2 HfO, 12 h Normal
1+946 32 - none Fetal bradycardia
1947 32 - none Normal
1948 14 - none Normal
1949 14 - none 36-week gestation
1950 5 - none Normala HfO = high-flow oxygen; HybO = hyperbaric oxygen 951

CARBON MONOXIDE FINAL: 11/2006
21
Caravati et al. (1988) reported on six cases of acute CO poisoning during pregnancy (all cases of952patients with CO poisoning during pregnancy admitted to two teaching hospitals in Salt Lake City during a953two-year period). Results of COHb measurements and outcomes are given in Table 10. Cases 5 and 6 were954treated with 100 % oxygen for 5 hours before the COHb measurement, which is between 3 and 4 half-life955times of CO under this condition, using a half-life time of 80 minutes for treatment with 100 % oxygen956(Peterson and Stewart, 1970). It can be concluded that the end-of-exposure COHb values were about 8-16957fold higher and thus were about 40-80 % in Case 5 and 22-44 % in Case 6. In conclusion, the three cases of958stillbirths were associated with maternal COHb concentrations of 22 % or higher.959

CARBON MONOXIDE FINAL: 11/2006
22
TABLE 10: OVERVIEW OF MATERNAL CLINICAL EFFECTS, COHb AND FETAL OUTCOME;960adopted from Caravati et al., 1988961
Case962 COHb(%)
Time betweenend of
exposure andblood
sampling (h)
Treatment Maternal Effects and Fetal Outcome
196328-year-old,964pregnancy965week 20966
9.6 8 100 % oxygen by facemask for 10 h; thenCOHb had reduced to1.7 %
Poisoning was caused by a gas-leak inthe restaurant where the woman worked;during a 6-hour working period, shedeveloped severe headache, nausea anddizziness; she visited hospital 6 hourslater with persisting headache, lethargyand dizziness; she was discharged ingood health and delivered a normalfemale infant weighing 2900 g fourmonths later.
296732-year-old,968pregnancy969week 16970
23 not stated 100 % oxygen by facemask for 10 h; after2.5 and 9.5 h COHbwas 8.9 and 1.8 %,respectively.
Poisoning was caused by cloggedfurnace; she complained of headache,nausea and dizziness of 48 hoursduration; she was discharged 36 hourslater in good health and delivered a termhealthy male infant weighing 2920 g.
397119-year-old,972pregnancy973week 30974
39 not stated 100 % oxygen by facemask for 8 h; after 5 hCOHb had reduced to4 %
Poisoning was caused by amalfunctioning heater; after 18 hoursexposure she complained of severeheadache and nausea; she was dischargedafter 8 hours of oxygen therapy anddelivered a healthy 3940-g male infant.
497518-year-old,976pregnancy977week 41978
32 not stated oxygen treatmentusing iron lung
The woman was found unconscious andwas combative on arrival in theemergency department; her mental statusrapidly improved an she recalled havingnausea, vomiting and headache earlierthat day; fetal heart tones were absentand the woman delivered a stillbornfemale infant the next day.
597920-year-old,980pregnancy981week 38982
5 5 hours withoxygentreatment
100 % oxygen by facemask duringambulance andhelicopter transport tothe hospital
The woman was found awake outside herhome together with case 6; they hadoccluded the furnace the evening beforeto improve heating; she delivered astillborn 3380-g male fetus 36 hourslater.

CARBON MONOXIDE FINAL: 11/2006
Case COHb(%)
Time betweenend of
exposure andblood
sampling (h)
Treatment Maternal Effects and Fetal Outcome
23
698318-year-old,984pregnancy985week 13986
2.8 5 hours withoxygentreatment
100 % oxygen by facemask duringambulance andhelicopter transport tothe hospital
The woman was found unconscioustogether with case 5; fetal heart rate was136 per min at the scene and 190-200 permin 5 hours after the exposure; after 5hours, she was somnolent but orientedand regained full mental alertness duringthe next 2 hours; fetal heart ratedecreased to 150-160 per min the nextday and the woman was discharged; shedelivered a nonviable 1210-g fetus at 33weeks of gestation; autopsy revealedbrachycephaly, craniosynostosis, multipleorgan cavity anomalies, multiplecontractures of extremities, hypoplasticlungs and a small brain withhydrocephalus.
Farrow et al. (1990) reported a case of fetal death in a 20-year-old woman, who was exposed to CO987due to use of a portable propane heater in her unventilated mobile home. She arrived by ambulance at the988hospital approximately 60 minutes after being found unconscious at her mobile home. En route to hospital989she had been intubated and had received 100 % supplemental oxygen. Her measured COHb at the time of990admission was 7 %. On the second day in hospital, the patient delivered a 1050-g stillborn female fetus. On991gross autopsy, bright red discoloration of the skin and visceral organs was noted. A fetal COHb of 61 % was992measured. The authors assumed that the mother had reached a minimal COHb of 40 to 50 % since she was993found unconscious.994
2.4. Genotoxicity995
No studies documenting genotoxic effects of CO in humans were located in the available literature.996
2.5. Carcinogenicity997
No studies documenting carcinogenic effects of CO in humans were located in the available literature.998
2.6. Summary999
In healthy adults, death from CO poisoning occurs at COHb larger than 50 % (AIHA, 1999; WHO,10001999a; Steward, 1971; Steward et al, 1970). At COHb of about 16 % headaches can develop (Steward et al.,10011970). Subtle (non-adverse) effects, such as decrements in neurobehavioral function start at about 5 % COHb1002(WHO, 1999a; EPA, 2000).1003
CARBON MONOXIDE FINAL: 11/2006
24
Analysis of clinical case reports of CO poisoning revealed that only about 2 % of subjects that had1004died had COHb levels below 40 %. Of the patients that survived about 16 % had a COHb above 40 % (Pach1005et al., 1978; 1979). Persons with coronary artery disease constitute a subpopulation that is much more1006susceptible to the effects of CO. Case reports indicate that death through myocardial infarction can occur at1007COHb around 20-30 % and as low as about 15 % in this group (Balraj, 1984; Atkins and Baker, 1985;1008Ebisuno et al., 1986; Grace and Platt, 1981). In individuals with coronary artery disease, a COHb of 2.0 or10094.0 % can significantly reduce the time to onset of angina and the time to 1-mm ST-segment change in the1010electrocardiogram during physical exercise (Allred et al., 1989a; b; 1991). At 5.3 %, but not at 3.7 % COHb1011an increased arrhythmia frequency was observed in subjects with coronary artery disease (Sheps et al., 1990;10121991).1013
Children and the unborn also constitute susceptible subpopulations: Measured COHb of higher than101422-25 % in the mothers‘ blood may lead to stillbirths (Koren et al., 1991; Caravati et al., 1988). After CO1015poisonings associated with mean COHb of 21 % (range 13-32 %) irreversible neurotoxic effects resulting in1016defects in the cognitive development and in behavioral alterations were observed in a long-term follow-up1017study, especially in young children (mean COHb 21 %) (Klees et al., 1985). Acute symptoms of CO1018poisoning in children include effects, such as nausea, vomiting, headache and lethargy. These symptoms were1019reported to occur already at a COHb of 7 % in one study (Klasner et al., 1998), while in another study a1020threshold of 16.7-19.8 % COHb was found (Crocker and Walker, 1985). Visual symptoms and syncopes1021occurred at a threshold of 24.5 % COHb, at higher COHb every child experienced at least one syncope1022(Crocker and Walker, 1985).1023
CARBON MONOXIDE FINAL: 11/2006
25
3. ANIMAL TOXICITY DATA1024
3.1. Acute Lethality1025
Lethality data for acute inhalation exposure have been reported for rats, mice and guinea pigs. The1026lethality data are summarized in Table 12 and graphically presented in Figure 1.1027
3.1.1. Rats1028
E.I. du Pont de Nemours and Co. (1981) determined LC50 values for male Crl:CD rats (weight1029250±25 g) at exposure times of 5, 15, 30, and 60 minutes. The experiment was performed in duplicate with1030one set of animals exposed head only to the test gas while the other set was unrestrained inside a 175-liter1031rectangular exposure chamber. In restrained rats, respiration rate was monitored by recording pressure1032fluctuations due to breathing in a body plethysmograph. During CO exposures the chamber atmosphere was1033monitored continuously for oxygen (BioMarine Industries model 225 oxygen meter), carbon dioxide and CO1034(InfraRed Industries model 702-D non-dispersive analyzer) using infrared analyzers. Blood from CO exposed1035rats that died during or within 30 minutes post-exposure was collected by cardiac puncture. The blood was1036measured for hemoglobin, COHb and oxyhemoglobin by an Instrumentation Laboratories model 282 CO-1037Oximeter. The post-exposure observation period was 14 days during which time body weights were1038monitored. 1039
Nearly all of the deaths occurred during the exposure period; of all animals that died only 2 of 2161040restrained and 3 of 148 unrestrained rats died after the end of the exposure period. The authors reported LC501041values for the 5-, 15-, 30-, and 60-minute exposure periods for the unrestrained rats of 10151 ppm (95% C.I.,10429580-10953 ppm), 5664 ppm (95% C.I., 5218-6078 ppm), 4710 ppm (95% C.I., 4278-5254 ppm), and 39541043ppm (95% C.I., 3736-4233 ppm), respectively. The LC50 values were lower (higher toxicity) for restrained1044rats. For the respective exposure durations values of 10754, 4318, 2890 and 1888 ppm were obtained. The1045RD50 for rats exposed to CO was 15000 ppm. The COHb values were 60 % or higher in rats that had died1046after unrestrained exposure and 50 % or higher in rats that had died after restrained exposure.1047
Darmer et al. (1972) reported a LC50 of 14200 ppm for 5 minutes exposure. Haskell Laboratory1048(1978) obtained a LC50 of 4070 ppm for 30 minutes exposure. Hartzell et al. (1985) reported a LC50 of 86361049ppm for 15 minutes exposure and 5207 ppm for 30 minutes exposure. Kimmerle (1974) reported a LC50 of10505500 ppm for 30 minutes and 4670 ppm for 60 minutes exposure. 1051
Rose et al. (1970) reported a LC50 of 2070 mg/m³ (95 % C.I. 1831-2241 mg/m³) (1807, 1598-19561052ppm) for 4 hours exposure in male Sprague-Dawley rats. The COHb in animals that had died was between105350 and 80 %.1054
3.1.2. Mice1055
Pesce et al. (1987) exposed groups of about 100 OF1-strain mice/age group/sex to 5.5 Torr (about10567200 ppm; final analytical concentration) for 76 minutes or to 4.4 Torr (about 5800 ppm) for 146 minutes.1057For the 76-minute exposure, survival rates for males were 36 % for 31-day-old males and 22 % for 184-day-1058old males. Of the exposed females, 57 % of 31-day-old females and 63 % of 184-day-old females survived.1059After exposure for 146 minutes, survival rates were 40 % for 34-day-old males, 27 % for 85-day-old males,106024 % for 230-day-old males and 27 % for 387-day-old males and 48 % for 34-day-old females, 67 % for 85-1061

CARBON MONOXIDE FINAL: 11/2006
26
day-old females and 56 % for 387-day-old females. Except for the about 1-month-old mice, male mice1062showed a significantly lower survival than females. Survival was not significantly influenced by age. 1063
Winston and Roberts (1978) investigated the influence of age on lethal effects of CO on mice (strain1064not stated; male mice were used in all groups, except for the two youngest groups that comprised both males1065and females). Animals of different age were exposed to 2000 ppm CO for up to 6 hours in stainless steel1066exposure chambers. The analytical concentration was determined by an automated gas chromatograph.1067Mortality occurred in 3/37 two-day old mice, 21/32 17-day-old mice, 16/20 30-day-old mice, 11/17 54-day-1068old mice, 10/20 108-day-old mice and 6/18 150-day-old mice. The animals of the youngest and that of the1069oldest age group were found to be more resistant to CO. These two groups were also found less susceptible1070to lethal effects from hypoxic hypoxia when mice were exposed to a reduced oxygen concentration of 7.5 %.1071
Hilado et al. (1978) reported 30-minutes LC50 values of 3570 ppm for Swiss-Webster mice and 80001072ppm for ICR mice. Respiratory distress was the only sign observed during the exposures.1073
Rose et al. (1970) reported a LC50 of 2800 mg/m³ (95 % C.I. 2679-2926 mg/m³) (2444, 2339-25541074ppm) for 4 hours exposure in male Swiss albino mice. COHb was not determined.1075
3.1.3. Guinea Pigs1076
Rose et al. (1970) reported a LC50 of 6550 mg/m³ (95 % C.I. 5509-7788 mg/m³) (5718, 4809-67991077ppm) for 4 hours exposure in Hartley guinea pigs. The COHb in animals that had died was between 57 and107890 %.1079

CARBON MONOXIDE FINAL: 11/2006
27
TABLE 11: SUMMARY OF LC50 DATA IN LABORATORY ANIMALS1080
Species1081 Concentration(ppm)
Exposuretime (min) Remark Reference
Rat1082 14200 5 Darmer et al., 1972
Rat1083 10151 5 Crl:Cd strain, male E.I. du Pont de Nemours andCo., 1981
Rat1084 8636 15 Hartzell et al., 1985
Rat1085 5664 15 Crl:Cd strain, male E.I. du Pont de Nemours andCo., 1981
Rat1086 5607 30 Herpol et al., 1976
Rat1087 5500 30 Kimerle, 1974
Rat1088 5207 30 Hartzell et al., 1985
Rat1089 4710 30 Crl:Cd strain, male E.I. du Pont de Nemours andCo., 1981
Rat1090 4070 30 Haskell Laboratories, 1978
Rat1091 4670 60 Kimerle, 1974
Rat1092 3954 60 Crl:Cd strain, male E.I. du Pont de Nemours andCo., 1981
Rat1093 1807 240 Sprague-Dawley strain, male Rose et al., 1970
Mouse1094 10127 15 Kishitani et al., 1979
Mouse1095 3570 30 Swiss-Webster strain Hilado et al., 1978
Mouse1096 8000 30 ICR strain Hilado et al., 1978
Mouse1097 2444 240 Swiss albino strain, male Rose et al., 1970
Guinea1098pig1099 5718 240 Hartley strain, male Rose et al., 1970
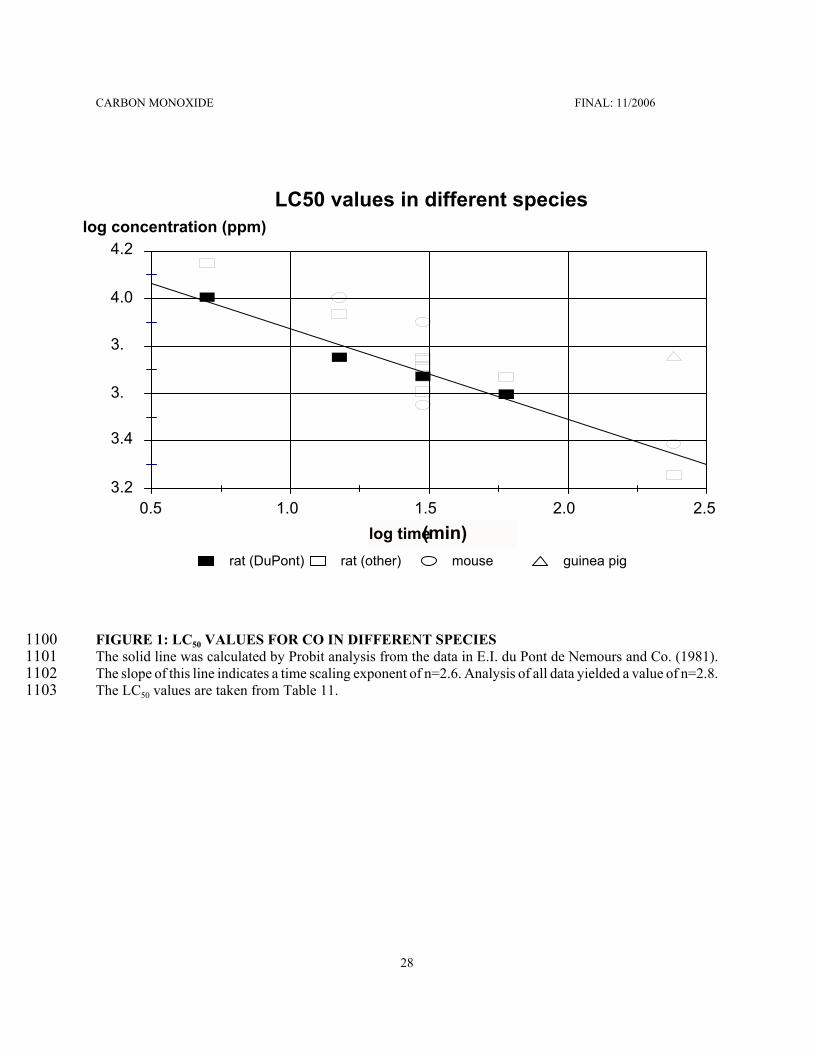
CARBON MONOXIDE FINAL: 11/2006
28
rat (DuPont) rat (other) mouse guinea pig
LC50 values in different species
log time (min)
4.2
4.0
3.
3.
3.4
3.20.5 1.0 1.5 2.0 2.5
log concentration (ppm)
FIGURE 1: LC50 VALUES FOR CO IN DIFFERENT SPECIES1100The solid line was calculated by Probit analysis from the data in E.I. du Pont de Nemours and Co. (1981).1101The slope of this line indicates a time scaling exponent of n=2.6. Analysis of all data yielded a value of n=2.8.1102The LC50 values are taken from Table 11.1103

CARBON MONOXIDE FINAL: 11/2006
29
3.2. Nonlethal Toxicity1104
A large number of studies investigated nonlethal effects of single and repeated CO exposures in1105animals (see WHO, 1999a for review). Reported here are only studies that support or add information to the1106effects seen in humans, because these studies were considered most relevant. These include syncope-like1107observations and behavioral effects in monkeys, effects on heart function in dogs as well as1108developmental/reproductive toxic effects in different species. 1109
3.2.1 Monkeys1110
Purser and Berrill (1983) studied the behavioral effects of CO exposure on cynomolgus monkeys (31111male animals, 4-5 years old). The basic behavioral model consisted of an individual monkey placed in a1112chamber with a lever press at one end a reward (chocolate candy) dispenser at the other. At 5-minute1113intervals throughout the test session a buzzer was sounded and a light flashed over the lever. If the monkey1114pressed the lever within a 1-minute period, a candy was presented in the dispenser. The monkey then moved1115the length of the chamber to pick up the candy. The major performance parameter measured was the time1116from the animal releasing the lever to its first touch of the dispenser, i.e., the time taken to traverse the1117chamber. Each session consisted of the following stages: 1) a 25-minute preexposure period during which1118baseline carbon dioxide production and behavioral task performance times were established, 2) 2.5 % CO was1119introduced into the chamber at a sufficiently high flow rate to increase the concentration to 900 ppm within11201 minute, 3) 900 ppm CO were maintained for 30 minutes, during which the effects on clinical condition,1121carbon dioxide production and behavioral task performance were examined, 4) the chamber was flushed of1122CO, decreasing the concentration to less than 100 ppm within 4 minutes, 5) animals were maintained for1123anther 45 minutes in the chamber while their clinical condition, carbon dioxide production and behavioral1124task performance were monitored. Carbon dioxide and CO concentrations were monitored continuously using1125infrared analyzers. Five preliminary experiments were conducted at a 1000 ppm CO, followed by the main1126experimental series that consisted of 10 exposures at 900 ppm, 3 for each animal, and 1 preliminary run. For11273 exposures (one for each animal) the animals were removed from the chamber 5 minutes after the end of the1128exposure period so that venous blood samples could be taken for COHb analysis. 1129
During the 4 preliminary exposures to 1000 ppm CO, there was generally no visible effect of the1130animals until 18-20 minutes of exposure had elapsed, at which time they generally became less active,1131occasionally sitting down for short periods. At approximately 25 minutes a dramatic change occurred over1132a period of 1-2 minutes and the animals went from an apparently normal state to one of severe intoxication.1133This change was preceded by one or more warning signs at approximately 23 minutes, which consisted of1134momentary closure of eyes, yawning and shaking of the head. Immediately prior to collapse the animals1135sometimes paced around in a mechanical fashion, often swaying as they walked. As few as 20 seconds later1136the animals were lying or rolling on the floor, sometimes attempting to rise before sitting on the floor or lying1137down again. During recovery, the animals remained in a state of severe intoxication for approximately 301138minutes, lying down with their eyes closed. On three occasions animals vomited during this period. After 25-113930 minutes the animals were usually sufficiently recovered to get up and move around the chamber, in1140response to the buzzer they would sometimes move towards or even press the lever although they made no1141attempt to fetch the candy. The performance of the behavioral task was unaffected during the first 15 minutes1142of exposure, but before the first minor clinical signs there was generally a slowing of response.1143
During exposures to 900 ppm, the first signs generally occurred after 20-25 minutes when the animals1144became less active, followed by the minor warning signs at approximately 26 minutes. Although in most cases1145the animals were lying down at the end of the exposure period, they did not appear to be severely intoxicated1146and in 6 of 9 exposures the signs were mild and the animals did not reach a state of collapse. During the1147
CARBON MONOXIDE FINAL: 11/2006
30
recovery period the animals remained in a state of intoxication for approximately 16 minutes. Recovery was1148more rapid than that following exposure to 1000 ppm, as all animals performed the behavioral task within114925 minutes of the end of exposure. The first effects upon the chamber traverse time occurred at 15 minutes1150into the exposure as a slight, statistically significant decrement in performance. The decrement at 20 minutes1151was not statistically significant while at 25 minutes it was highly significant, as the mean response time was1152twice the preexposure response time (1.10 sec vs. 0.62 sec). The first time that the test was conducted1153successfully on all occasions was after 25 minutes of recovery when the mean chamber traverse time was 31154times as long as the mean preexposure time. From 30 to 45 minutes the animals were more active and1155response times gradually improved but did not reach the preexposure level. 1156
The mean COHb measured at the end of the exposure was 32.9 % (range 31.7-34.8 %). Carbon1157dioxide production, indicating the metabolism in the animals, decreased gradually throughout the exposure1158(statistically significant at 25 and 30 minutes of exposure) and then increased gradually towards preexposure1159levels during the recovery period (significantly lower until 15 minutes into the recovery period). 1160
From earlier experiments, the authors estimated COHb of 16-21 % for the period of 15-20 minutes1161when deficits in behavioral task performance were started during the exposure period. In the state of severe1162intoxication, the animals were capable of performing some coordinated behavioral actions when they were1163sufficiently stimulated, e.g. by loud noise or removing them from the chamber. The authors report that in1164unpublished experiments using higher CO concentrations the animals passed rapidly from this stage to one1165of deep coma. 1166
DeBias et al. (1979) reported that CO exposure (100 ppm for 16 h; resulting in a COHb of 9.3 %)1167reduced the threshold for ventricular fibrillation induced by an electrical shock applied to the myocardium1168of monkeys during the final stage of ventricular repolarization. The voltage required to induce fibrillation was1169highest in normal animals breathing air and lowest in infarcted animals breathing CO. Additivity was found1170for the effects of infarction alone and CO exposure alone each of which required significantly less voltage1171for fibrillation.1172
3.2.2 Dogs1173
Aronow et al. (1979) reported that CO exposure increased the vulnerability of the heart to induced1174ventricular fibrillation in normal dogs breathing 100 ppm CO for 2 hours (resulting COHb was 6.3-6.5 %).1175The ventricular fibrillation was induced by an electrical stimulus applied to the myocardium.1176
Sekiya et al. (1983) reported that exposure to CO concentrations of 3000 ppm for 15 minutes1177followed by 130 ppm for 1 hour (resulting COHb was 13-15 %) increased the severity and extent of ischemic1178injury and the magnitude of ST-segment elevation which was induced in anaesthetized dogs by coronary1179artery ligation more than did ligation alone.1180

CARBON MONOXIDE FINAL: 11/2006
31
3.3. Developmental/Reproductive Toxicity1181
3.3.1 Pigs1182
Dominick and Carson (1983) exposed pregnant sows to CO concentrations between 150 and 400 ppm1183for 48-96 hours between gestational days 108-110 (average gestation was 114 days). They showed a1184significant linear increase in the number of stillbirths as a function of increasing CO concentration. Stillbirths1185were significantly elevated above control levels when the maternal COHb exceeded 23 % saturation. These1186saturation levels were obtained at approximately 250 ppm.1187
Morris et al. (1985) exposed 16 pigs to 0, 200 or 250 ppm from gestational day 109 until birth1188(maternal COHb at 24 hours into the exposure was 0, 13.6 and 17.1 %, respectively). Stillbirth rate for the11893 groups (total of 123 piglets) were2.3, 2.4 and 4.8 %, respectively. The study authors stated that the stillbirth1190rate was not affected because the observed rates were lower than the industrial norm of 5-10 %. The COHb1191in neonatal piglets at birth were 0, 19.8 and 22.4 %, respectively. The authors found impairment of negative1192geotaxis behavior and open field activity 24 hours after birth in the 250-ppm group. Activity in open field1193was significantly reduced at 48 hours after birth in piglets from both exposure groups.1194
3.3.2 Rabbits1195
Astrup et al. (1972) reported an increase in fetal mortality and malformations in rabbits exposed to1196180 ppm CO continuously throughout gestation. Maternal COHb was 16-18 %.1197
Rosenkrantz et al. (1986) exposed rabbits to high concentrations of CO-containing cigarette smoke1198(12 puffs of 2700-5400 ppm CO; exposure to puffs of cigarette smoke by face mask; each puff sequence1199consisted of 30 seconds cigarette smoke and 30 seconds fresh air) for 12 minutes daily from gestational days12006-18. The COHb level reached at the end of each exposure was 16 %. A large number of fetal deaths, but no1201malformations were observed in exposed animals.1202
3.3.3 Rats1203
Choi and Oh (1975) exposed rats to 750 ppm CO for 3 h/d on gestational days 7, 8 or 9. An excess1204of fetal absorptions and stillbirths as well as a decrease in body length and an increase in skeletal anomalies1205were observed. COHb was not determined.1206
Penney et al. (1980) exposed pregnant COBS rats for the last 18 days of gestation to 200 ppm CO.1207The mean maternal COHb was about 27.8 % and the mean fetal level was 27.0 %. The body weight of the1208pups was significantly lower than that of controls. The heart weight of both exposed females and pups was1209significantly increased. 1210
Mactutus and Fechter (1985) exposed Long-Evans rats continuously throughout gestation to 0 or 1501211ppm CO. Mean COHb was 15.6 % vs. 1 % in control subjects. At 120 days of age, CO-exposed rats acquired1212a conditioned avoidance response equally well as control animals. However, following a 24-h interval the1213CO-exposed rats failed to demonstrate significant retention. In a second experiment, in which animals1214received 50 training trials per day until a criterion of ten consecutive avoidance responses was met, the1215prenatal CO-exposed rats again acquired the task as well as control animals. When tested for retention 28 days1216later, a significant memory impairment was again observed in terms of trials required to retain the avoidance1217

CARBON MONOXIDE FINAL: 11/2006
32
criterion as well as in total percent avoidance. At one year of age, the CO-exposed rats showed impairment1218relative to air-exposed controls in both the original learning and retention of the two-way avoidance response.1219
3.3.4 Mice1220
Singh and Scott (1984) exposed groups of 17 pregnant CD-1 mice to CO concentrations of 0, 65, 125,1221250 or 500 ppm for 24 h/d on gestational days 6 to 17. Mice were sacrificed and examined on day 18. No1222signs of maternal toxicity were observed at any dose. The mean percent fetal mortality per litter was 4.52,12235.89, 12.50, 15.50 and 55.30 %, respectively. Besides a dose-dependent increase in embryolethality, fetus1224weights were significantly reduced at exposure levels of 125 ppm or higher. No fetal malformations were1225detected. COHb was not determined.1226
Singh (1986) exposed CD-1 mice to 0, 65 or 125 ppm CO continuously during gestational days 7 to122718 (COHb not determined). No signs of maternal toxicity were observed. Exposure did not affect the number1228of live pups born per litter or their birth weight. Prenatal exposure to 125 ppm significantly increased the time1229required by pups for righting reflex on day 1 of birth and negative geotaxis on day 10. Prenatal exposure at1230both concentrations significantly decreased the mean aerial righting score of pups on day 14.1231
3.4. Genotoxicity1232
No information regarding the carcinogenicity of CO in animals was located in the available literature.1233
3.5. Carcinogenicity1234
No information regarding the carcinogenicity of CO in animals was located in the available literature.1235
3.6. Summary1236
Several studies reported LC50 values in rats, mice and guinea pigs. In the study of E.I. du Pont de1237Nemours and Co. (1981), the following LC50 values were calculated by Probit analysis: 10151 ppm for 51238minutes, 5664 ppm for 15 minutes, 4710 ppm for 30 minutes and 3954 ppm for 60 minutes.1239
In a study in cynomolgus monkeys, at exposure to 900 ppm no signs of intoxication occurred during1240the first 20-25 minutes (corresponding to COHb of about 16-21 %), at 25 minutes the animals‘ performance1241in a behavioral test significantly decreased and at the end of the exposure period (30 min) animals became1242less active and were lying down. After about 25 minutes at a 1000 ppm, within 1- 2 minutes the animals went1243into a state of severe intoxication, virtually unable to perform coordinated movements (Purser and Berrill,12441983).1245
In developmental toxicity tests, CO caused an increase in the rate of stillbirths or fetal mortality in1246pigs after a 2-3 day-exposure to COHb above 23 % (Dominick and Carson, 1983), in rabbits after continuous1247exposure to 16-18 % COHb throughout gestation (Astrup et al., 1972) as well as after daily exposure to high1248CO concentrations in cigarette smoke (exposure for 12 minutes/day on gestational days 6-18, resulting in1249COHb of 16 %) (Rosenkrantz et al., 1986), in rats after 3 exposures to 750 ppm for 3 h/d (Choi and Oh, 1975)1250and in mice after exposure to 125 ppm for 11 d (Singh and Scott, 1984). Significant memory impairment in1251behavioral tests were found in young rats after continuous CO exposure throughout gestation (mean maternal1252COHb was 15.6 %) (Mactutus and Fechter, 1985).1253
CARBON MONOXIDE FINAL: 11/2006
33
In monkeys, a COHb of 9.3 % resulted in reduced threshold for electric shock-induced ventricular1254fibrillation (DeBias et al., 1979). A similar effect was found in dogs at 6.3-6.5 % COHb (Aronow et al.,12551979). A COHb of 13-15 % increased the severity and extent of ischemic injury and the magnitude of ST-1256segment elevation in a myocardial infarction model in dogs (Sekiya et al., 1983).1257
CARBON MONOXIDE FINAL: 11/2006
34
4. SPECIAL CONSIDERATIONS1258
4.1. Stability, Metabolism and Disposition1259
CO is produced endogenously in normal metabolism: when an α-methylene bridge in the heme group1260of hemoglobin is broken during the catabolic process, one molecule of CO is released. It has been estimated1261that this production amounts to approximately 0.3 to 1.0 ml/h with an additional 0.1 ml/h resulting from a1262similar catabolic process involving other heme-containing compounds (e.g., myoglobin as well as cytochrome1263and catalase enzymes). This endogenous production of CO gives rise to an baseline or back ground level1264approximately of 0.5-0.8 % COHb (NIOSH, 1972).1265
Almost all of the CO that has been inhaled is eliminated through the lungs when the previously1266exposed person enters an atmosphere free of CO. Carbon monoxide not only binds to hemoglobin forming1267COHb, but 10-50 % of the total body store of CO is also distributed to extravascular sites such as skeletal1268muscle, where it can bind to myoglobin. Extravascular CO can be slowly metabolized to carbon dioxide1269(Fenn, 1970). Inside the cells, CO can bind to all heme proteins capable of binding oxygen, such as1270myoglobin, cytochrome c oxidase, cytochrome P450 enzymes and tryptophan oxygenase (WHO, 1999a).1271However, the exact extent of this binding in vivo as well as the physiological consequences in terms of1272inhibition of protein and enzyme function and the existence and relevance of possible toxic effects has not1273been clearly shown up until now (cf. extensive discussion in WHO, 1999a).1274
The time required to eliminate half of the gas is 3 to 5 hours (Landaw, 1973), depending on the1275amount of respiration, which acts to wash it out of the body. Peterson and Stewart (1970) reported a range1276for the elimination half-time from 128 to 409 minutes from 39 experiments, with an average of 320 minutes1277in human subjects that breathed normal air after CO exposure. Increased oxygen pressure helps to dislodge1278it from the hemoglobin. One hundred percent oxygen given at atmospheric pressure reduces the half-1279elimination rate to about 80 minutes (Peterson and Stewart, 1970). Weaver et al. (2000) reported a half-life1280of 74±25 minutes for COHb in CO-poisoned patients receiving 100 % oxygen. Klasner et al. (1998) reported1281a half-time of 44 minutes for children (n=26, 4-12 years old) when given 100 % oxygen via face mask.1282Hyperbaric oxygen at 3 bar pressure reduces the half time to about 20-25 minutes (Beard, 1982; Landaw,12831973). 1284
4.2. Mechanism of Toxicity1285
If not stated otherwise, the information on the mechanism of toxicity is taken from the extensive1286recent reviews of WHO (1999a) and EPA (2000). The best understood biologic effect of CO is its1287combination with hemoglobin (Hb) to form COHb, thereby rendering the hemoglobin molecule less able to1288bind with oxygen. Although the rate of CO binding with hemoglobin is about one-fifth slower and the rate1289of dissociation from hemoglobin is an order of magnitude slower than the respective rates for oxygen, the CO1290chemical affinity for hemoglobin (represented by the Haldane coefficient M) is about 245 times greater than1291that for oxygen. One part of CO and 245 parts of oxygen would form equal parts of oxyhemoglobin and1292COHb (50 % each), which would be achieved by breathing air containing 21 % oxygen and 570 ppm CO.1293The steady-state ratio of COHb/oxyhemoglobin is proportional to the ratio of their respective partial1294pressures:1295
COHb / O2Hb = M (PCO / PO2)1296
CARBON MONOXIDE FINAL: 11/2006
35
Under dynamic conditions, competitive binding of oxygen and CO to hemoglobin is complex: the1297greater the number of heme groups bound to CO, the greater the affinity of free heme groups for oxygen. CO1298not only occupies oxygen binding sites, molecule for molecule, thus reducing the amount of available oxygen,1299but also alters the characteristic relationship between oxyhemoglobin and the partial pressure of oxygen,1300which in normal blood is S-shaped. The difference in the partial pressure of oxygen between freshly1301oxygenated arterial blood (P(O2) = 100 mm Hg) and mixed venous blood (P(O2) = 40 mm Hg) represents a1302release to the tissues of approximately 5 ml O2/100 ml blood (NIOSH, 1972). With increasing COHb in1303blood, the dissociation curve is shifted gradually to the left, and its shape is transformed into that of a1304rectangular hyperbola. This changes the release of oxygen to the tissues appreciably: the oxygen content of1305the blood is not only lowered during exposure to CO, but the shift of the oxyhemoglobin dissociation curve1306to the left decreases the amount of remaining oxygen that is made available to the tissues. Both mechanisms1307serve to effectively lower the tissue partial pressure of oxygen and hence can create a generalized tissue1308hypoxia. Because the shift occurs over a critical saturation range for release of oxygen to tissues, a reduction1309in oxyhemoglobin by CO poisoning will have more severe effects on the release of oxygen than the1310equivalent reduction of hemoglobin due to anemia. 1311
While the brain has a higher requirement for oxygen than the heart, in contrast to the cerebral1312circulation the coronary circulation must supply an even increased amount of oxygen during periods of1313generalized tissue hypoxia; since under these circumstances the heart is forced to increase both its rate and1314its output in order to meet the normal oxygen demands of the body. This increase in myocardial activity1315demands an increased oxygen supply to the myocardium, which must be met by the coronary circulation.1316Under hypoxic conditions increased oxygen supply to the peripheral tissues can be accommodated by1317increased blood flow (via vascular dilatation) and/or increased oxygen extraction by the tissues. The1318myocardium under these circumstances appears only to increase the flow of blood rather than to extract an1319additional amount of oxygen from the coronary circulation. While the peripheral tissues normally extract only132025 percent of the oxygen content of the perfusing arterial blood during resting conditions, the myocardium1321extracts 75 percent, thus leaving the mixed venous blood only 25 percent saturated. This mechanism has the1322overall effect of maintaining the myocardial oxygen tension at a higher level than would be present in other1323muscle tissue and thus insures a continual aerobic metabolism, even under hypoxic duress. In terms of oxygen1324partial pressure, the mixed venous blood of the peripheral tissues is approximately 40 mm Hg while the mixed1325venous blood of the coronary circulation is only 20 mm Hg. In the presence of COHb (and the shift to the left1326of the oxyhemoglobin dissociation curve), however, the arterio-venous difference can only be maintained by1327an increased flow in the coronary circulation. In an individual with diminished coronary circulation because1328of coronary heart disease, however, this situation may result in a decrease in the venous oxygen partial1329pressure of the myocardium precipitated by an inability to maintain the normal arterio-venous gradient.1330Studies in dogs suggest that exercise plus an increased COHb, in addition to the global myocardial hypoxia,1331leads especially to areas of relative hypoxia in the left ventricle secondary to redistributive changes in1332subendocardial blood flow (Einzig, 1980). This hypoxic effect is further enhanced, as mentioned above, by1333an increase in cardiac rate and output as a general response to peripheral tissue hypoxemia. A person with1334diminished coronary circulation caused by coronary heart disease, consequently, may be constantly near the1335point of myocardial tissue hypoxia, which can ultimately lead to myocardial infarction.1336

CARBON MONOXIDE FINAL: 11/2006
36
4.3. Other Relevant Information1337
4.3.1. Species Variability1338
With regard to lethal effects, COHb of 50-80 % have been reported as lethal level in rats and guinea1339pigs (Rose et al., 1970; E.I. du Pont de Nemours and Co., 1981). In apparently healthy people that died from1340CO poisoning, usually COHb of 60 % or higher are found (Balraj, 1984; AIHA, 1999; Winter and Miller,13411976, Holmes, 1985, Stewart, 1975). 1342
Syncopes have been reported to occur in children at a threshold of 24.5 % COHb (Crocker and1343Walker, 1985). In monkeys, at COHb little higher than 16-21 % syncope-like effects occurred (Purser and1344Berrill, 1983). The lowest COHb that resulted in cognitive development defects in children in a long-term1345follow-up study was 13 % (Klees et al., 1985). In mice, memory impairment was found in the offspring of1346rats exposed continuously at 15.6 % COHb during gestation (Mactutus and Fechter, 1985).1347
Taken together, these studies imply a limited species variability for different effects with regard to1348the COHb at which these effects occur. However, the exposure conditions necessary to reach a certain COHb1349differ between species due to different affinities of their hemoglobin for CO. 1350
The equilibrium COHb of different species is determined by the species-specific Haldane (affinity)1351constant M. Reported values are 228 for dogs (Sendroy and O‘Neal, 1955), 195 for monkeys (Sendroy and1352O‘Neal, 1955), 170 for rats (Rodkey and O‘Neal, 1970) and 117 for guinea pigs (Rodkey and O‘Neal, 1970).1353Jones et al. (1971) reported equilibrium COHb in different species after 48-hour continuous exposure as1354shown in Table 12. Using the mathematical model described in Appendix B, corresponding COHb values for1355a 70-kg man can be calculated as 7.9, 13.8 and 25.0 % for 51, 96 and 200 ppm, respectively.1356
TABLE 12: COHb AFTER 48 HOURS CONTINUOUS EXPOSURE TO CO;1357adopted from Jones et al., 19711358
CO concentration (ppm)1359 species COHb in blood (%) (n)
511360 dog 5.7 (2)
511361 monkey 5.3 (3)
511362 rat 5.1 (15)
511363 guinea pig 3.2 (15)
961364 dog 12.5 (2)
961365 monkey 10.3 (3)
961366 rat 7.5 (15)
961367 guinea pig 4.9 (15)
2001368 dog 20.8 (2)
2001369 monkey 20.0 (3)
2001370 rat 16.4 (15)
2001371 guinea pig 9.4 (15)
CARBON MONOXIDE FINAL: 11/2006
37
4.3.2. Intraspecies Variability1372
Experiments in mice did not indicate that very young or very old animals were more susceptible to1373lethal effects of CO exposure (Pesce et al., 1987; Winston and Roberts, 1978). However, there is considerable1374variability within human subpopulations: a COHb of about 15 % only leads to very slight symptoms, such1375as headache, in healthy adults (Stewart et al., 1970; WHO, 1999a). In contrast, the same COHb was reported1376to cause long-lasting defects in the cognitive development and behavioral alterations in children (Klees et al.,13771985) or even to contribute to death from myocardial infarction in individuals with coronary artery disease1378(Grace and Platt, 1981; Balraj, 1984). In case reports of myocardial infarction, other subjects that were1379exposed under the same conditions (and sometimes had higher COHb) did not experience effects above the1380AEGL-2 level (Atkins and Baker, 1985; Grace and Platt, 1981). 1381
Subpopulations at higher risk for toxic effects of CO include the following groups:1382
a) fetuses because of higher CO affinity and slower CO elimination (see Sections 2.3 and 4.3.4);1383
b) children because they develop acute neurotoxic effects (e.g. headaches, nausea), long-lasting neurotoxic1384effects (e.g. memory deficits) and impaired ability to escape (i.e. syncopes) at lower COHb than adults (see1385Section 2.2.2.1);1386
c) people with pre-existing diseases, either known or unknown, that already decrease the availability of1387oxygen to critical tissues, including subjects with coronary artery disease (see Sections 2.2.1 and 2.2.1.1),1388chronic obstructive lung disease, chronic anemia and hemoglobinopathies, such as sickle cell anemia.1389For example, in sickle-cell disease, the average lifespan of red blood cells with abnormal hemoglobin is 121390days compared to an average of 120 days in healthy individuals with normal hemoglobin. “As a result,1391baseline COHb levels can be as high as 4%. Presumably, exogenous exposure to CO, in conjunction with1392higher endogenous CO levels, could result in critical levels of COHb. However, it is not known how ambient1393or near-ambient levels of CO would affect individuals with these disorders” (EPA, 2000; see also WHO,13941999a). Due to the physiologic adaptation in these subpopulations, they are not considered more susceptible1395than patients with coronary artery disease.1396
d) people at high altitude, especially those not living there long enough for physiological adaptation. “It is1397important to distinguish between the long-term resident of high altitude and the newly arrived visitor from1398low altitude. Specifically, the visitor will be more hypoxemic than the fully adapted resident. One would1399postulate that the combination of high altitude with carbon monoxide would pose the greatest risk to persons1400newly arrived at high altitude who have underlying cardiopulmonary disease, particularly because they are1401usually older individuals. Surprisingly, this hypothesis has never been tested adequately” (WHO, 1999a). Due1402to physiologic adaptation, people living at high altitude are not considered generally more susceptible than1403patients with coronary artery disease. Since it is generally not advisable for patients with severe coronary1404artery disease to travel to places at high altitude, it is not considered necessary to especially take that part of1405the identified susceptible subpopulation (i.e. patients with coronary artery disease; see below) into account1406when deriving AEGL values.1407
An estimated 62 million people in the United States (about 20 % of the population) have one or more1408types of cardiovascular disease (American Heart Association, 2003). For the major diseases within the1409category of total cardiovascular disease, about 50 million Americans have high blood pressure, 13 million1410

CARBON MONOXIDE FINAL: 11/2006
38
have coronary heart disease, 4.9 million have heart failure, 4.7 million have cerebrovascular disease (stroke),1411and 1 million have congenital cardiovascular defects.1412
The prevalence of cardiovascular diseases increases with age. It is 10 % for males and 4 % for1413females at age 25-34, 51 % for males and 48 % for females at age 55-64 and 71 % for males and 79 % for1414females at age 75 or older (American Heart Association, 2003).1415
Coronary heart disease caused more than 1 of every 5 deaths in the USA in 2000. Coronary heart1416disease was mentioned as cause of death in 681,000 cases and myocardial infarction in 239,000 deaths. Fifty1417percent of men and 63 % of women who died suddenly of coronary heart disease had no previous symptoms1418of this disease (American Heart Association, 2003).1419
Within the group of people with coronary heart disease, 7.6 million had myocardial infarction (heart1420attack) and 6.6 million of angina pectoris (chest pain) (American Heart Association, 2003). The prevalence1421of angina pectoris in the British adult population is about 4 % (Williams and Stevens, 2002).1422
Angina pectoris is a symptom of coronary heart disease. Common features of an attack are central1423chest pain, pain radiating to the lower jaw, or arms, and shortness of breath. The pain occurs when there is1424insufficient oxygen delivery to the heart, leading to ischemia. This is usually, although not exclusively, a1425result of an atheromatous narrowing (stenosis) in one or more of the coronary arteries. Angina can classified1426broadly as stable or unstable, depending on its severity and pattern of occurrence. Stable angina is typically1427provoked by exercise (e.g., hurrying across a street or climbing a long flight of stairs), stress or extremes of1428temperature and is relieved by either rest or sublingual nitrates or both. Unstable angina is understood as1429anginal pain that occurs with lesser degrees of exertion, with increasing frequency, or at rest (i.e., without1430exertion). The pain may be more severe, last longer, and requires more intensive intervention (usually1431hospitalization for initiation of medication under cardiac monitoring). If left untreated, unstable angina may1432result in a heart attack and irreversible damage to the heart. The diagnosis of angina is generally based on1433clinical history, electrocardiograph stress testing (where patients are exercised on a treadmill to look at the1434effect on their electrocardiogram), and coronary angiography (looking for narrowings in the coronary arteries)1435(Williams and Stevens, 2002).1436
4.3.3. Time Scaling1437
The LC50 values for different exposure periods are shown in Figure 1. Overall the distribution does1438not seem to argue against a linear relationship between log(concentration) and log(time) and from the data1439from E.I. du Pont de Nemours and Co. (1981) a value of 2.6 can be calculated for the exponent n from the1440slope. Regression analysis of all data yielded a value of n=2.8. However, taking a closer look at the data from1441this study suggests that the data might be distributed non-linearly and that the slope decreases with increasing1442exposure time. 1443
The AEGL-2 and AEGL-3 exposure concentrations were derived from a mathematical model based1444on the same COHb at the end of the respective exposure periods. These values are also distributed non-1445linearly in a log-log plot: the slope between the two shortest exposure periods (10 and 30 min) is equivalent1446to n=1.0-1.1 and the slope between the two longest exposure periods (4 and 8 h) is equivalent to n=2.9-3.4.1447This non-linearity is probably caused by the fact that the COHb depends strongly on the ventilation rate and1448lung blood flow for short exposure rates, while for long exposure rates the COHb becomes independent of1449
CARBON MONOXIDE FINAL: 11/2006
39
these parameters and exclusively depends on the affinity of hemoglobin for CO (represented by the Haldane1450constant M). Since rats have a higher ventilation rate per kg body weight than humans, their COHb reaches1451the steady state faster and therefore for the same exposure time the slope for rats is smaller than the1452corresponding slope for humans, i.e., COHb depends stronger on the ventilation rate in humans compared1453to rats. 1454
4.3.4. Mathematical models of COHb formation1455
In 1965, Coburn, Forster and Kane developed a differential equation (CFK model) to describe the1456major physiological variables that determine the COHb in blood using data from patients with increased1457endogenous production of CO due to anemia (Coburn et al., 1965). The CFK model is represented by the1458following equation:1459
1460 d COHbdt
VVb
COHb PM B Vb OHb
PB Vb
t CO t O CO( )= −
∗∗ ∗ ∗
+∗
2
where: B = 1 / DL + PL / VA1461M = Ratio of affinity of blood for CO to that for O2; M = 2181462OHb = ml of O2 per ml blood; OHb = 0,21463COHbt = ml of CO per ml blood at time 1464PO2 = average partial pressure of oxygen in the lung capillaries; PO2 = 100 mm Hg1465VCO = rate of endogenous CO production; VCO = 0.007 ml/min1466DL = diffusivity of the lung for CO; DL == 30 ml / min mm Hg1467PL = barometric pressure minus the vapor pressure of water at body temperature,1468
PL = 713 mm Hg1469Vb = blood volume; Vb = 5500 ml1470PCO = partial pressure of CO in the air inhaled (mm Hg)1471VA = alveolar ventilation rate; VA = 6000 ml/min (awake), 4000 ml (sleeping)1472t = exposure duration (min)1473
Peterson and Stewart (1970) reported that the CFK model well predicted COHb measured in 181474healthy male students, aged between 24 and 42 years, that were exposed to the following combinations of CO1475concentrations and exposure times: about 50 ppm for 30 minutes to 24 hours, about 100 ppm for 15-4801476minutes, about 200 ppm for 15-120 minutes and about 500 ppm for 15-114 minutes. They used the following1477integrated form of the CFK equation and parameters:1478
1479 A COHb B V PA COHb B V P
t A B Vbt CO CO
CO CO
∗ − ∗ −∗ − ∗ −
= − ∗0
exp( / )
where A = PO2 / M OHb1480B = 1 / DL + PL / VA1481M = Ratio of affinity of blood for CO to that for O2; M = 2181482OHb = ml of O2 per ml blood; OHb = 0,21483COHbt = ml of CO per ml blood at time 1484COHb0 = ml of CO per ml blood at beginning of the exposure1485

CARBON MONOXIDE FINAL: 11/2006
40
PO2 = average partial pressure of oxygen in the lung capillaries; PO2 = 100 mm Hg1486VCO = rate of endogenous CO production; VCO = 0.007 ml/min1487DL = diffusivity of the lung for CO; DL == 30 ml / min mm Hg1488PL = the vapor pressure of water at body temperature, PL = 713 mm Hg1489Vb = blood volume; Vb = 5500 ml1490PCO = partial pressure of CO in the air inhaled (mm Hg)1491VA = alveolar ventilation rate; VA = 6000 ml/min (awake), 4000 ml (sleeping)1492t = exposure duration (min)1493
FIGURE 2: COHb FOR DIFFERENT EXPOSURE CONCENTRATION-TIME COMBINATIONS1494(from Peterson and Stewart, 1975)1495
In another study by Peterson and Stewart (1975), data from a series of human exposures to CO were1496analyzed to determine the fit to the theoretical CFK equation. 19 men and 3 women were exposed to1497concentrations of 50, 100 or 200 ppm for 0.33-5.25 hours. Three exercise levels from sedentary to 0, 150 or1498300 kpm/min on an ergometer were used (15 subjects in total). These resulted in mean ventilation rates of149910.1 (9.1 for women), 14.0, 24.0 (19.7 for women) and 29.7 l/min, respectively. The CFK model predicted1500COHb for both men and women as well as for resting and exercising subjects within a standard error of about15012 %. In contrast to the original model, which assumes all variables to be constant except t, PL, COHbt and PCO,1502the following parameter alterations were introduced:1503
PO2: When the partial pressure of oxygen in inspired air (PiO2) is less than the 149 mm Hg found1504under normal conditions, the partial pressure of oxygen in the lung capillaries will be less1505than the value of 100 mm Hg assumed by Coburn and coworkers. From measurements of1506oxygen partial pressure in arterial blood, which is assumed to be the same as the oxygen1507

CARBON MONOXIDE FINAL: 11/2006
41
partial pressure in lung capillaries, the following equation was derived: PO2 = 1 / (0.072-15080.00079 PiO2 + 0.000002515 (PiO2)2) and 1509PiO2 = FiO2 (PB - 47 - PiCO) with FiO2 = fraction of oxygen in inspired air, PB = barometric1510pressure (mm Hg), PiCO = partial pressure of CO in inspired air1511
DL: Body size effects on diffusivity at rest were was calculated from published data as: 1512DL = 1 / (-0.0287 + 0.1188/A) with A = body surface in m2 1513
Vb: the published blood volume relationship of 74 mg/kg of body weight for men and 73 ml/kg for1514women was used.1515
VA: The alveolar ventilation rate was expressed as: VA = VE - f VD; with VE = total rate of ventilation1516(ml/min), f = respiration rate (min-1) and VD = dead space (ml)1517
OHbt: At standard concentrations, 1 g of hemoglobin will hold 1.38 ml of oxygen and thus OHbmax1518= 1.38 [Hb]/100, with [Hb] being the hemoglobin concentration in blood (g/100 ml). During1519and after CO exposure, the value of OHbt that must be used is actually OHbt = OHbmax -1520COHbt. In this case, the CFK equation can only be solved by iterative procedures. 1521
COHb: This value can be converted to the more conventional „percentage saturation“ by:1522% carboxyhemoglobin = COHb 100/OHbmax 1523
1524Tikuisis et al. (1992) studied the rate of formation of COHb in healthy young males at a low (45 W)1525
and moderate (90 W) exercise load. Ten nonsmoking subjects were exposed to CO on two separate occasions1526distinguished by the activity level. Each experiment began with an exposure to 3000 ppm for 3 minutes1527during a rest period followed by 3 intermittent exposures ranging from 3000 ppm for 1 minute at low exercise1528to 667 ppm for 3 minutes at moderate exercise. The net increase in COHb after all exposures (about 10 %)1529deviated by <1 % between the measured and values predicted from the CFK model. Within this deviation,1530there was a general tendency of the CFK equation to underpredict the increase in COHb for the exposures1531at rest and the first exercise exposure and to overpredict levels for the latter two exposures at exercise. 1532
Benignus et al. (1994) exposed 15 men to 7652 mg/m³ (6683 ppm) CO for 3.1-6.7 minutes at rest.1533Except for the Haldane constant M, which was assumed to be 245, all other physiological parameters of the1534CFK equation were measured for each individual from the very beginning of exposure. Arterial COHb was1535considerably higher than the venous COHb. The rate of increase in blood COHb and the arterial-venous1536COHb differences varied widely among individuals. The peak arterial COHb at the end of exposure ranged1537from 13.9 to 20.9 %. The peak venous levels reached during the recovery period ranged from 12.4 to 18.11538%. The arterial-venous difference ranged from 2.3 to 12.1 % COHb. The CFK equation overestimated venous1539blood COHb, whereas arterial blood levels were significantly and consistently underestimated.1540
Hill et al. (1977) developed a mathematical model to predict values of blood COHb in mother and1541fetus for prolonged exposures to 30-300 ppm CO. During CO exposure, fetal COHb lag behind maternal1542COHb by several hours. During prolonged uptake, fetal levels eventually overtake maternal levels and1543approach equilibrium values as much as 10 % higher than the mother‘s, due to the higher affinity of CO for1544fetal hemoglobin compared to adult hemoglobin. During CO washout the fetal levels again lag behind the1545mothers.1546

CARBON MONOXIDE FINAL: 11/2006
42
5. DATA ANALYSIS FOR AEGL-1 1547
5.1. Human Data Relevant to AEGL-11548
CO has no odor and does not cause irritative effects. A large number of studies investigated the1549effects of low CO exposure (COHb <10 %) on healthy individuals and high-risk groups. In these, effects on1550healthy persons, such as decreases in work capacity and decrements of neurobehavioral function, start at1551COHb of 5 % (WHO, 1999a; EPA, 2000). 1552
In patients with coronary artery disease, which constitute the most susceptible subpopulation, the time1553to onset of angina and the time to 1-mm ST-segment change in the electrocardiogram during physical exercise1554were significantly reduced at COHb of 2.0 or 4.0 % (Allred et al. 1989a; b; 1991).1555
5.2. Animal Data Relevant to AEGL-11556
No studies in experimental animals were located that were considered relevant for the derivation of1557AEGL-1 values. The studies describing effects of CO on cardiac function, such as Sekiya et al. (1983),1558DeBias et al. (1979) and Aronow et al. (1979), normally employ models in which the heart was damaged1559additionally by an electric stimulus or by coronary artery ligation. Effects of CO exposure found in these1560systems can hardly be extrapolated quantitatively to humans.1561
5.3. Derivation of AEGL-11562
CO is an imperceptible toxic gas. Until very severe symptoms occur (inability to walk) none or only1563nonspecific symptoms were noted in healthy humans and monkeys (Haldane, 1895; Purser and Berrill, 1983).1564
In patients with coronary artery disease, which constitute the most susceptible subpopulation, effects,1565such as significant electrocardiogram changes, reduced time to the onset of angina and increased cardiac1566arrhythmia, start occurring at exposure concentrations little higher than current ambient air quality guidelines,1567e.g. the U.S. National Air Quality Guideline of 9 ppm for 8 hours (National Air Pollution Control1568Administration, 1970; FR , 2000; EPA, 2000; Raub, 2000), the WHO Air Quality Guideline of 10 mg/m³ (91569ppm) for 8 hours (based on 2.5 % COHb) (WHO, 1999a) and the designated European Union Limit Value1570of 10 mg/m³ (9 ppm) for 8 hours (EC, 1999). These cardiac effects were considered above the AEGL-1 level1571and thus would not constitute a suitable basis for the derivation of AEGL-1 values. 1572
AEGL-1 values are not recommended because susceptible persons may experience more serious1573effects (equivalent to AEGL-2 level) at concentrations, which do not yet cause AEGL-1 effects in the general1574population.1575
In addition, CO exposures encountered frequently in everyday life are at or above the concentration1576range, in which AEGL-1 level would have to be set: smokers have COHb in the range of 3-8 % (Radford and1577Drizd, 1982) and CO concentrations of about 10-50 ppm, which can be found on heavily traveled roads,1578inside motor vehicles and in homes with gas-, coal-, wood- or kerosene-fired heaters and stoves, correspond1579to an equilibrium COHb of 1.8-7.5 % (see Figures 2 and 4).1580

CARBON MONOXIDE FINAL: 11/2006
43
TABLE 13: AEGL-1 VALUES FOR CARBON MONOXIDE1581
AEGL Level1582 10 minutes 30 minutes 1 hour 4 hours 8 hours
AEGL-11583 N.R.a N.R. N.R. N.R. N.R.a N.R., not recommended because susceptible persons may experience more serious effects (equivalent to1584AEGL-2 level) at concentrations, which do not yet cause AEGL-1 effects in the general population1585

CARBON MONOXIDE FINAL: 11/2006
44
6. DATA ANALYSIS FOR AEGL-2 1586
6.1. Human Data Relevant to AEGL-21587
In patients with coronary artery disease, COHb of 2 or 4 % significantly reduced the time to angina1588and the time to 1-mm change in the ST-segment of the electrocardiogram upon physical exercise; at 4 % the1589total exercise time and the heart rate-blood pressure product were also significantly reduced (Allred et al.,15901989a; b; 1991). A reduced time to onset of exercise-induced chest pain at COHb between 2.5 and 4.5 % was1591also reported by several other studies (Aronow et al., 1972; Anderson et al., 1973; Sheps et al., 1987;1592Kleinman et al., 1989; 1998). 1593
Sheps et al. (1990; 1991) reported that in patients with coronary artery disease the frequency of1594ventricular premature depolarizations was significantly increased at an COHb of 5.3 %, but not at 3.7 %,1595compared to room air exposure. Dahms et al. (1993) found no increased frequency of ventricular ectopic beats1596at COHb of 3 or 5 %. 1597
Klasner et al. (1998) analyzed a mass poisoning of 504 school children. In 147 of 155 children that1598showed symptoms, the mean COHb measured about 1 hour (up to 2 hours) after removal from the CO1599atmosphere was 7.0 % COHb. Of all children that were examined in hospital (177) (mean age 8.7 years) the1600following symptoms were observed: headache (139), nausea (69), dizziness (30), dyspnea (19), vomiting (13),1601abdominal pain (11) and drowsiness (9).1602
In an analysis of CO poisonings in 16 children (up to 14 years of age) with COHb of 15 % or higher,1603Crocker and Walker (1985) reported thresholds for effects, such as nausea, vomiting, headache and lethargy1604between 16.7 and 19.8 % COHb (average concentrations in children displaying these symptoms were 25.9-160529.4 %). Visual symptoms and syncopes occurred at a threshold of 24.5 % COHb (average 31.6-32.5 %). All16069 children with a COHb of 24.5 % or higher experienced at least one syncope.1607
In an investigation on long-term effects of CO poisoning in children, evaluated 2-11 years after the1608poisoning, Klees et al. (1985) reported that 6 of the 14 children exhibited serious disorders (spatial1609organization problems, constructive apraxia, deterioration of lexical activity, as well as spelling and1610arithmetic). Compared to the other 7 children, that exhibited only slight impairment of visual memory and1611concentration, the first group of more severely affected children were younger (mean age 7.8 years; range 2.8-161212.1 years) than the latter group (mean age 9.8 years; range 3.5-14.5); there was no difference in measured1613COHb (mean 21 (range 13-32) % in the first vs. 22 (16-26) % in the latter group). A short-term follow-up1614(3 months after the poisoning) suggested that medium intoxications (reported COHb 16-27 %) did not1615produce manifest sequelae except for a momentary standstill in the child‘s progress of about 2 months.1616
Kizakevich et al. (1994) reported that healthy young men can perform submaximal exercise without1617overt impairment of cardiovascular function after CO exposures attaining 20 % COHb. Stewart et al. (1970)1618found that a CO exposure of healthy subjects resulting in 12.5 to 25.5 % COHb did not affect the results of1619several neurophysiological tests. Nielsen (1971) did not report on severe effects in three subjects that were1620repeatedly exposed to CO resulting in concentrations of 25-33 % COHb. In a poisoning incident at the1621workplace, severe headaches, dizziness, weakness, nausea, chest pain, shortness of breath and other1622symptoms were reported for a COHb of about 35 % (Ely et al., 1995).1623
CARBON MONOXIDE FINAL: 11/2006
45
6.2. Animal Data Relevant to AEGL-21624
In a study in cynomolgus monkeys, Purser and Berrill (1983) reported that during exposure to 9001625ppm CO for a total of 30 minutes, no signs of intoxication occurred until 20-25 minutes (corresponding to1626COHb of about 16-21 %). At 25 minutes into the exposure, the animals‘ performance in a behavioral test1627significantly decreased. At the end of the exposure period, the animals became less active, most of them were1628lying down, but animals did not collapse. At a 1000 ppm, no effects were observed during the first 16-201629minutes. At this time the animals became less active and sat down for short periods. At about 25 minutes, the1630animals went into a state of severe intoxication within 1-2 minutes, in which animals were lying down with1631eyes closed, they sometimes vomited and were virtually unable to perform coordinated movements.1632
Significant memory impairment in behavioral tests were found in young rats after continuous CO1633exposure throughout gestation (mean maternal COHb was 15.6 %) (Mactutus and Fechter, 1985).1634
In monkeys, a COHb of 9.3 % resulted in reduced threshold for electric shock-induced ventricular1635fibrillation (DeBias et al., 1979). Aronow et al. (1979) reported that CO exposure increased the vulnerability1636of the heart to induced ventricular fibrillation in normal dogs breathing 100 ppm CO for 2 hours (resulting1637COHb was 6.3-6.5 %). The ventricular fibrillation was induced by an electrical stimulus applied to the1638myocardium. A COHb of 13-15 % increased the severity and extent of ischemic injury and the magnitude1639of ST-segment elevation in a myocardial infarction model in dogs (Sekiya et al., 1983).1640
6.3. Derivation of AEGL-21641
The derivation of AEGL-2 values was based on effects in patients with coronary artery disease. An1642estimated 62 million people in the United States (about 20 % of the population) have one or more types of1643cardiovascular disease (American Heart Association, 2003). For the major diseases within the category of1644total cardiovascular disease, about 50 million Americans have high blood pressure, 13 million have ischemic1645(coronary) heart disease, 5 million have heart failure, 4 million have cerebrovascular disease (stroke), and 21646million have rheumatic fever or heart disease. 1647
For the derivation of AEGL-2 values a level of 4 % COHb was chosen. At this exposure level,1648patients with coronary artery disease may experience a reduced time until onset of angina (chest pain) during1649physical exertion (Allred et al., 1989a; b; 1991).1650
Caracteristic points of an electrocardiogramm are the P wave, reflecting atrial depolarization, the QRS1651complex, representing the ventricular muscle depolarization, and the T wave, reflecting ventricular muscle1652repolarization. In the normal electrocardiogramm, the ST segment is isoelectric, resting at the same potential1653as the interval between the T wave and the next P wave. Horizontal depression or a downsloping ST segment1654merging into the T wave occurs as a result of ischemia, ventricular strain, changes in the pattern of ventricular1655depolarization or drug effects. In chronic ischemic heart disease, there may be moderate degrees of horizontal1656ST segment depression or a downward sloping ST segment, flattening or inversion of T waves and prominent1657U waves. It is difficult to define an abnormal ST segment depression in precise quantitative terms. However,1658a myocardia ischemia has to be considered if the beginning of the ST segment is more than 0.5 mm1659(corresponding to 0.05 mV) below the isoelectric line and there is an associated T wave abnormality (Wilson1660et al., 1991).1661

CARBON MONOXIDE FINAL: 11/2006
46
According to the practice guidelines for chronic stable angina (Gibbons et al., 1999), a ST-segment1662depression at rest is a marker for adverse cardiac events in patients with and without known coronary artery1663disease. Additional exercise-induced ST-segment depression in the patient with >=1 mm rest ST-segment1664depression is a reasonably sensitive indicator of coronary artery disease. The ST-segment depression is1665indicative of clinically relevant myocardial ischemia requiring medical treatment. From the ST-segment1666depression, the Duke treadmill score can be calculated. It equals the exercise time in minutes minus (5x the1667ST-segment deviation, during or after exercise, in millimeters) minus (4x the angina index, which has a value1668of "0" if there is no angina, "1" if angina occurs, and "2" if angina is the reason for stopping the test). Among1669outpatients with suspected coronary artery disease, the two thirds of patients with scores indicating low risk1670(score >=5) had a four-year survival rate of 99% (average annual mortality rate 0.25%), and the 4% who had1671scores indicating high risk (score <-10) had a four-year survival rate of 79% (average annual mortality rate16725%) (Gibbons et al., 1999).1673
In the available experimental studies, the CO exposure alone (i.e. with subjects at rest) did not cause1674angina, while exercise alone did so. Moreover, the changes in the electrocardiogram (ST-segment depression1675of 1 mm or greater) as well as the angina symptoms can be considered fully reversible after a single incident.1676This effect level was considered to be below that defined for AEGL-2. It should be noted that all experimental1677studies used patients with stable exertional angina, who did not experience angina while at rest. Thus, it is1678considered likely that in more susceptible individuals (a part of the patients with unstable angina pectoris1679might belong to this group) CO exposure alone could increase angina symptoms. In hypersusceptible patients1680more severe effects, even including myocardial infarction cannot be ruled out. 1681
It should be noted that in contrast to the anecdotal case reports on myocardial infarction discussed1682in the derivation of AEGL-3, the studies investigating electrocardiogram changes and angina symptoms in1683patients with coronary artery disease, used here for the derivation of AEGL-2 values, are high-quality, well-1684conducted experimental studies with well-characterized exposure conditions and information on1685interindividual variability.1686
An exposure level of 4 % COHb is unlikely to cause a significant increase in the frequency of1687exercise-induced arrhythmias. This effect has been observed at COHb of 5.3 %, but not at 3.7 % (Sheps et1688al., 1990; 1991), while in another study no effect of CO exposure on ventricular arrhythmia was found at 31689or 5 % COHb (Dahms et al., 1993). No experimental studies in heart patients are available that used1690significantly higher levels of COHb. 1691
Use of a level of 4 % COHb as a point of departure for the derivation of AEGL-2 values is supported1692by the studies in animals: a COHb of 9.3 % resulted in a reduced threshold for electric shock-induced1693ventricular fibrillation in monkeys (DeBias et al., 1979) and a COHb of 6.3-6.5 % increased the vulnerability1694of the heart to electrically induced ventricular fibrillation in healthy dogs (Aronow et al., 1979). These animal1695studies suggest that a level below 6-9 % COHb should be selected for AEGL-2 derivation in order to protect1696individuals with compromised cardiac function. 1697
A total uncertainty factor of 1 for intraspecies variability was considered adequate based on1698supporting evidence in other susceptible subpopulations (children, pregnant women, elderly people and1699smokers):1700
CARBON MONOXIDE FINAL: 11/2006
47
1) The derived AEGL-2 values would result in a COHb of 4.9-5.2 % in 5-year-old children (see Table 19 in1701Appendix B). This level is considered protective of neurotoxic effects in children: 1) in the study by Klasner1702et al. (1998) acute neurotoxic effects, such as headache, nausea, dizziness, dyspnea and vomiting were found1703at a mean COHb of 7.0 % (measured after a mean time of 1 hour (up to 2 hours) after removal of the children1704from the CO atmosphere). This suggests that the end of exposure COHb had been between 10 and 14 % (these1705values were estimated using the mathematical model of Coburn et al. (1965) and Peterson and Stewart (1975).17062) In the study by Crocker and Walker (1985) a threshold of 24.5 % COHb for syncopes in children, an effect1707that was considered to impair the ability to escape, was reported. 3) In the study by Klees et al. (1985), that1708investigated long-lasting neurotoxic effects (defects in the cognitive development and behavioral alterations)1709in children, the lowest concentration resulting in cognitive development defects was 13 % COHb in the long-1710term follow-up study. The COHb reported in the Crocker and Walker (1985) as well as in the Klees et al.1711(1985) studies were measured after hospital admission and may have been considerably lower than levels at1712the time of the end of the CO exposure, as has also been described in the Klasner et al. (1998) study. Also1713the percentage of children that received oxygen before hospital admission was probably considerably higher1714in these two studies since after acute exposure to high CO concentrations (e.g. by fires in homes) severe1715poisoning symptoms occurred. Oxygen administration reduces the elimination half time in children to about171644 minutes (Klasner et al., 1998).1717
The observations in children are supported by observations in experimental animals. In the study by1718Purser and Berrill (1983) at COHb little higher than 16-21 % syncope-like effects occurred in monkeys and1719in mice memory impairment was found in the offspring of rats exposed continuously at COHb of 15.6 %1720during gestation (Mactutus and Fechter, 1985).1721
2) Caravati et al. (1988) and Koren et al. (1991) described cases of stillbirth after CO exposure of pregnant1722women. In these cases, the COHb measured in the maternal blood were higher than 22-25 %. There are no1723studies reporting effects on the unborn after a single acute exposure resulting in lower COHb levels (EPA,17242000). Cigarette smoking of pregnant women is associated with a lower birth weight, however, these effects1725cannot be clearly attributed to CO only because cigarette smoke is a complex mixture of chemicals (EPA,17262000). There is no evidence that a single elevation of COHb has any negative effects on pregnancy.1727
3) There is no evidence that elderly people without cardiovascular disease are more susceptible to an acute1728CO exposure than younger adults (EPA, 2000; WHO, 1999a). Therefore, AEGL-2 values derived on effects1729in coronary artery disease patients are likely to protect other elderly people. 1730
4) In smokers with a background COHb of 3-8 % from smoking, exposure to the AEGL-3 concentration-time1731combinations will result in 6.2. and 11.5 % COHb (see Table 19 in Appendix B). Smokers may show an1732adaptive response to their chronically elevated COHb levels, as evidenced by increased red blood cell1733volumes or reduced plasma volumes (EPA, 2000). This adaptive response is likely to reduce the effect level1734in smokers compared to non-smokers exposed to the same total COHb level. The estimated COHb exposure1735level in smokers who are healthy adults is unlikely to lead to significant health effects (Kizakevich et al.,17361994; Stewart et al., 1970; Nielsen, 1971). For pregnant women, cigarette smoking alone may cause effects1737on the unborn (EPA, 2000). A single additional exposure to COHb levels of 6.2-11.5 % over the “smoking1738background” of 3-8 % COHb is considered unlikely to significantly contribute to the effects of smoking1739during pregnancy. No study is available that compared the effects on the cardiovascular system of a 4 %1740elevation of the background COHb level in non-smoking and smoking patients with coronary artery disease.1741
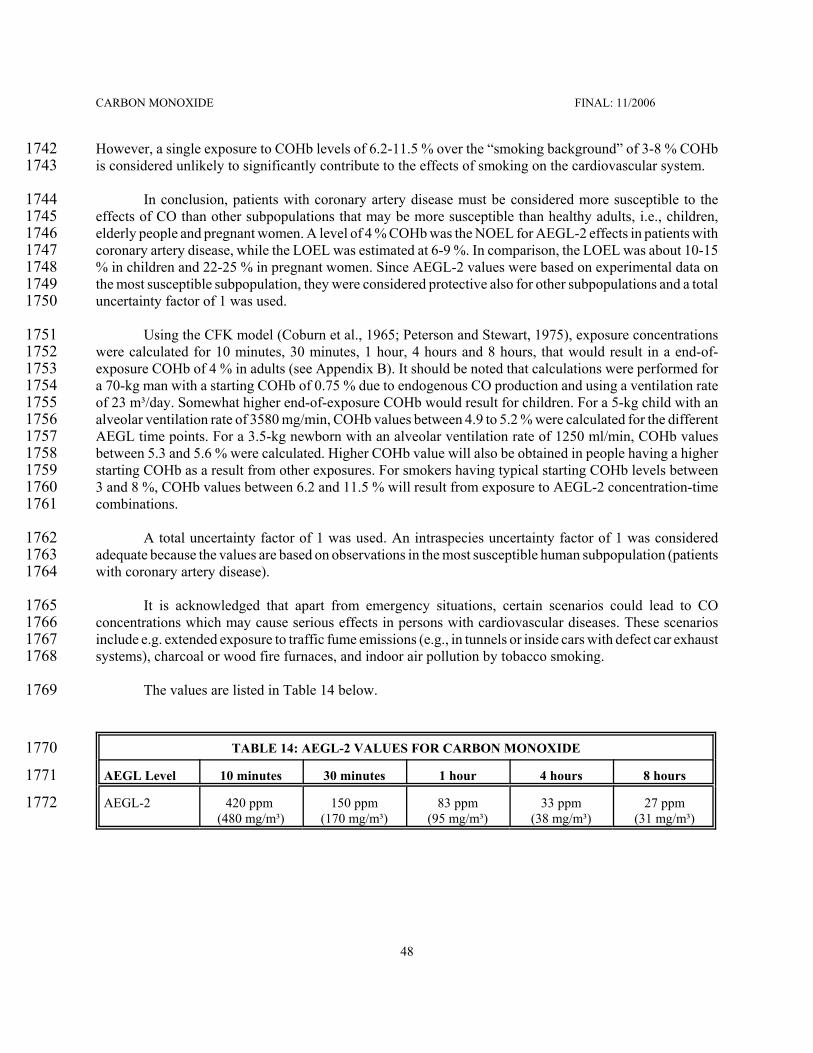
CARBON MONOXIDE FINAL: 11/2006
48
However, a single exposure to COHb levels of 6.2-11.5 % over the “smoking background” of 3-8 % COHb1742is considered unlikely to significantly contribute to the effects of smoking on the cardiovascular system.1743
In conclusion, patients with coronary artery disease must be considered more susceptible to the1744effects of CO than other subpopulations that may be more susceptible than healthy adults, i.e., children,1745elderly people and pregnant women. A level of 4 % COHb was the NOEL for AEGL-2 effects in patients with1746coronary artery disease, while the LOEL was estimated at 6-9 %. In comparison, the LOEL was about 10-151747% in children and 22-25 % in pregnant women. Since AEGL-2 values were based on experimental data on1748the most susceptible subpopulation, they were considered protective also for other subpopulations and a total1749uncertainty factor of 1 was used. 1750
Using the CFK model (Coburn et al., 1965; Peterson and Stewart, 1975), exposure concentrations1751were calculated for 10 minutes, 30 minutes, 1 hour, 4 hours and 8 hours, that would result in a end-of-1752exposure COHb of 4 % in adults (see Appendix B). It should be noted that calculations were performed for1753a 70-kg man with a starting COHb of 0.75 % due to endogenous CO production and using a ventilation rate1754of 23 m³/day. Somewhat higher end-of-exposure COHb would result for children. For a 5-kg child with an1755alveolar ventilation rate of 3580 mg/min, COHb values between 4.9 to 5.2 % were calculated for the different1756AEGL time points. For a 3.5-kg newborn with an alveolar ventilation rate of 1250 ml/min, COHb values1757between 5.3 and 5.6 % were calculated. Higher COHb value will also be obtained in people having a higher1758starting COHb as a result from other exposures. For smokers having typical starting COHb levels between17593 and 8 %, COHb values between 6.2 and 11.5 % will result from exposure to AEGL-2 concentration-time1760combinations.1761
A total uncertainty factor of 1 was used. An intraspecies uncertainty factor of 1 was considered1762adequate because the values are based on observations in the most susceptible human subpopulation (patients1763with coronary artery disease).1764
It is acknowledged that apart from emergency situations, certain scenarios could lead to CO1765concentrations which may cause serious effects in persons with cardiovascular diseases. These scenarios1766include e.g. extended exposure to traffic fume emissions (e.g., in tunnels or inside cars with defect car exhaust1767systems), charcoal or wood fire furnaces, and indoor air pollution by tobacco smoking.1768
The values are listed in Table 14 below.1769
TABLE 14: AEGL-2 VALUES FOR CARBON MONOXIDE1770
AEGL Level1771 10 minutes 30 minutes 1 hour 4 hours 8 hours
AEGL-21772 420 ppm (480 mg/m³)
150 ppm(170 mg/m³)
83 ppm(95 mg/m³)
33 ppm(38 mg/m³)
27 ppm(31 mg/m³)

CARBON MONOXIDE FINAL: 11/2006
49
7. DATA ANALYSIS FOR AEGL-3 1773
7.1. Human Data Relevant to AEGL-31774
A large number of deaths occur annually due to acute poisonings in fires and in closed locations (e.g.1775in private homes and workplaces). In the latter instance, poisoning usually occurs because gas-, oil- or coal-1776fired furnaces or stoves are operated without sufficient ventilation. In apparently healthy people that died1777from CO poisoning, usually COHb of 60 % or higher are found (Balraj, 1984; AIHA, 1999; AIHA, 1999;1778Winter and Miller, 1976, Holmes, 1985, Stewart, 1975). In early experimental studies, healthy subjects were1779exposed to sufficient concentration-time combinations to reach levels of about 40 to 55 % COHb (Haldane,17801895; Chiodi et al., 1941). Effects described at this level of CO exposure included hyperpnea, confusion of1781mind, dim vision and unsteady/inability to walk (Haldane, 1895). Henderson et al. (1921) exposed subjects1782for 1 hour to 34-38 % COHb. Subjects showed a marked loss of equilibrium in the Romberg test, irritability,1783throbbing frontal headache and at times Cheyne-Stokes breathing was observed. Analysis of 101 cases of1784lethal CO poisoning and 158 surviving patients revealed that only about 2 % of deceased subjects had COHb1785levels below 40 %. Of the patients that survived about 16 % had a COHb above 40 % (Pach et al., 1978;17861979). 1787
Kizakevich et al. (1994) reported that healthy young men can perform submaximal exercise without1788overt impairment of cardiovascular function after CO exposures attaining 20 % COHb. Stewart et al. (1970)1789found that a CO exposure of healthy subjects resulting in 12.5 to 25.5 % COHb did not affect the results of1790several neurophysiological tests. Nielsen (1971) did not report on severe effects in three subjects that were1791repeatedly exposed to CO resulting in concentrations of 25-33 % COHb.1792
In susceptible groups of the population, deaths may be caused by considerable lower exposure to CO:1793Caravati et al. (1988) and Koren et al. (1991) described cases of stillbirth after CO exposure of pregnant1794women. In these cases, the COHb measured in the maternal blood were higher than 22-25 %.1795
Persons with coronary artery disease constitute another susceptible subpopulation (Balraj, 1984).1796Several case reports indicate that death through myocardial infarction can occur after repeated or prolonged1797exposure, the corresponding COHb levels measured after transport to the hospital (and thus not representing1798the end-of-exposure concentrations) were around 20-30 % and as low as about 15 % (Atkins and Baker, 1985;1799Ebisuno et al., 1986; Grace and Platt, 1981).1800
7.2. Animal Data Relevant to AEGL-3 1801
Several studies reported LC50 values for rats, mice and guinea pigs for exposure durations between18025 minutes and 4 hours. The values are given in Table 11 and are shown in Figure 1. Similar to humans, the1803minimum lethal COHb in rats and mice were about 50-70 % (E.I. du Pont de Nemours and Co., 1981; Rose1804et al., 1970).1805
An increase in the rate of stillbirths was reported in pigs after a 2-3 day-exposure to CO resulting in1806maternal COHb above 23 % (Dominick and Carson, 1983). Increased rates in fetal mortality were also1807observed in rabbits after continuous exposure maternal COHb of 16-18 % throughout gestation (Astrup et1808al., 1972) as well as after daily exposure to high CO concentrations in cigarette smoke (exposure for 121809minutes/day on gestational days 6-18, resulting in COHb of 16 %) (Rosenkrantz et al., 1986).1810

CARBON MONOXIDE FINAL: 11/2006
50
7.3. Derivation of AEGL-31811
The derivation of AEGL-3 values was based on observations in humans. Several case reports indicate1812that in patients with coronary artery disease, CO exposure can contribute to myocardial infarction (which was1813considered an AEGL-3 endpoint). In the published cases of myocardial infarction, the following COHb values1814were measured after transport to the hospital: 52.2 % (Marius-Nunez, 1990), 30 %, 22.8 % (Atkins and Baker,18151985), 21 % (Ebisuno et al., 1986), 15.6 % (Grace and Platt, 1981). These anecdotal reports on cases affecting1816susceptible subpopulations were considered as important supporting information, but not as an adequate basis1817for the derivation of AEGL-3 values because of uncertainties about the end of exposure COHb levels, and1818whether repeated and/or prolonged exposures caused the infarction. 1819
The analysis of 101 cases of lethal poisoning and 158 cases of non-lethal poisoning by Pach et al.1820(1878; 1979) was used as the basis for derivation of AEGL-3 values. In the group of surviving patients only1821those were included from which blood for COHb analysis had been obtained within 2 hours from cessation1822of exposure. The COHb at the end of exposure was calculated by the authors of the report. Analysis revealed1823that only about 2 % of deceased subjects had COHb levels below 40 %. Of the patients that survived about182416 % had a COHb above 40 %. From this study a threshold for lethal poisoning of about 40 % can be derived.1825This level is supported by experimental studies performed in healthy human subjects. Studies by Chiodi et1826al. (1941), Henderson et al. (1921), and Haldane (1895) suggest that a COHb of about 34-56 % does not cause1827lethal effects in healthy individuals. Further support comes from the studies by Kizakevich et al. (1994),1828Stewart et al. (1970), and Nielsen (1971) that reported headache as the only symptom when subjects were1829exposed to 20-33 % COHb. A level of 40 % COHb was used as the basis for AEGL-3 derivation. This point1830of departure is supported by studies in animals reporting minimum lethal COHb levels in rats and mice of1831about 50-70 % (E.I. du Pont de Nemours and Co., 1981; Rose et al., 1970).1832
Using the CFK model (Coburn et al., 1965; Peterson and Stewart, 1975), exposure concentrations1833were calculated that would result in a COHb of 40 % at the end of exposure periods for 10 and 30 minutes1834as well as for 1, 4 and 8 hours (see Appendix B). 1835
A total uncertainty factor of 3 for intraspecies variability was considered adequate based on1836supporting evidence in susceptible subpopulations:1837
1) Exposure to the derived AEGL-3 concentrations will result in COHb values of about 14-17 % in adults1838(see Table 21 in Appendix B). In the reported cases of myocardial infarction, the measured COHb was1839normally above 20 %, except in one case in which the measured COHb was about 15 %. In this case (Grace1840and Platt, 1981), the man was exposed during several weeks to (presumably) the same high CO concentration1841in his home and presented two times to the emergency room with signs of CO intoxication (which were1842misdiagnosed) until the infarction occurred. Therefore, the derived AEGL-3 values are considered to protect1843heart patients against CO-induced myocardial infarction. It should be noted, however, that a clear threshold1844for this endpoint cannot be defined because myocardial infarction might be triggered at lower COHb in1845hypersusceptible individuals and myocardial infarction can also occur spontaneously or by trigger effects (e.g.1846psychological stress, physical exertion) which have no relevant effects on the health of normal subjects. 1847
2) With regard to stillbirths, a COHb of 14-17 % was considered protective of lethal effects on the unborn,1848because in the case studies available, stillbirths were found only after measured maternal COHb of about 22-184925 % or higher (Caravati et al., 1988; Koren et al., 1991). In the clinic, a measured COHb of about 15-20 %1850

CARBON MONOXIDE FINAL: 11/2006
51
in pregnant women (implicating a higher end-of-exposure level) is considered a severe CO intoxication that1851could require hyperbaric oxygen treatment (Ellenhorn, 1997; Tomaszewski, 1998). Available animal studies1852reported increased rates of stillbirths after a 2-3 day exposure at maternal COHb above 23 % (Dominick and1853Carson, 1983), after continuous exposure at maternal COHb of 16-18 % (Astrup et al., 1972), and repeated1854short-term exposures at 16 % maternal COHb (Rosenkrantz et al., 1986). Taken together, the animal data1855support the conclusion that pregnant women should not be exposed to COHb levels higher than about 14-171856% in order to prevent lethal effects on the unborn. 1857
3) In smokers with a background COHb of 3-8 % from smoking, exposure to the AEGL-3 concentration-time1858combinations will result in COHb levels between 16.1 and 23.0 % (see Table 21 in Appendix B). Smokers1859may show an adaptive response to their chronically elevated COHb levels, as evidenced by increased red1860blood cell volumes or reduced plasma volumes (EPA, 2000). This adaptive response is likely to reduce the1861effect level in smokers compared to non-smokers exposed to the same total COHb level. The estimated COHb1862exposure level in smokers is considered protective of lethal effects if they are healthy adults. Also, from the1863discussion above, it is considered unlikely that smoking pregnant women will have an increase risk of1864stillbirths at the AEGL-3 exposure level. As discussed above, a threshold for the induction of myocardial1865infarction by CO exposure cannot be defined. Therefore, heavy smokers with coronary artery disease, which1866have a higher risk for myocardial infarction already from smoking (American Heart Association, 2003) , may1867be at somewhat higher risk compared to non-smoking patients. 1868
The values are listed in Table 15 below.1869
TABLE 15: AEGL-3 VALUES FOR CARBON MONOXIDE1870
AEGL Level1871 10 minutes 30 minutes 1 hour 4 hours 8 hours
AEGL-31872 1700 ppm(1900 mg/m³)
600 ppm(690 mg/m³)
330 ppm(380 mg/m³)
150 ppm(170 mg/m³)
130 ppm(150 mg/m³)

CARBON MONOXIDE FINAL: 11/2006
52
8. SUMMARY OF AEGLs 1873
8.1. AEGL Values and Toxicity Endpoints1874
The AEGL values for various levels of effects and various time periods are summarized in Table 16.1875They were derived using the following key studies and methods.1876
AEGL-1 values are not recommended because susceptible persons may experience more serious1877effects (equivalent to AEGL-2 level) at concentrations, which do not yet cause AEGL-1 effects in the general1878population.1879
The AEGL-2 was based on cardiovascular effects in patients with coronary artery disease, which1880constitute the most susceptible subpopulation. For the derivation of AEGL-2 values a level of 4 % COHb was1881chosen. At this exposure level, patients with coronary artery disease may experience a reduced time until1882onset of angina (chest pain) during physical exertion. The changes in the electrocardiogram (ST-segment1883depression of 1 mm or greater) associated with angina symptoms were fully reversible. An exposure level1884of 4 % COHb is unlikely to cause a significant increase in the frequency of exercise-induced arrhythmias.1885A mathematical model (Coburn et al., 1965; Peterson and Stewart, 1975) was used to calculate exposure1886concentrations resulting in a COHb of 4 % at the end of exposure periods of 10 and 30 minutes and 1, 4 and18878 hours. An intraspecies uncertainty factor of 1 was used. A total uncertainty factor of 1 was used. An1888intraspecies uncertainty factor of 1 was considered adequate because the values are based on observations1889in the most susceptible human subpopulation (patients with coronary artery disease). 1890
The AEGL-3 was based on the study by Pach et al. (1978; 1979) that analyzed 101 cases of lethal1891and 158 cases of non-lethal poisoning and revealed that only about 2 % of subjects that had died had COHb1892levels below 40 %. Of the patients that survived about 16 % had a COHb above 40 %. A threshold for1893lethality of 40 % is supported by experimental studies by Chiodi et al. (1941), Henderson et al. (1921), and1894Haldane (1895), in which exposures resulting in COHb of 34-56 % did not cause lethal effects in healthy1895individuals. Further support comes from the studies of Kizakevich et al. (1994), Stewart et al. (1970), and1896Nielsen (1971) that reported headache as the only symptom when health adults were exposed to 20-33 %1897COHb. A level of 40 % COHb was used as the basis for AEGL-3 derivation. A mathematical model (Coburn1898et al., 1965; Peterson and Stewart, 1975) was used to calculate exposure concentrations resulting in a COHb1899of 40 % at the end of exposure periods of 10 and 30 minutes and 1, 4 and 8 hours. An intraspecies uncertainty1900factor of 3 was used. The derived values (corresponding to a COHb value of about 15%) are supported by1901information on effects, such as myocardial infarction and stillbirths, reported in more susceptible1902subpopulations.1903

CARBON MONOXIDE FINAL: 11/2006
53
TABLE 16: SUMMARY/RELATIONSHIP OF AEGL VALUES FOR CARBON MONOXIDE1904
Classification1905 10-Minute 30-Minute 1-Hour 4-Hour 8-Hour
AEGL-11906(Nondisabling)1907
N.R. a N.R. N.R. N.R. N.R.
AEGL-21908(Disabling)1909
420 ppm (480 mg/m³)
150 ppm(170 mg/m³)
83 ppm(95 mg/m³)
33 ppm(38 mg/m³)
27 ppm(31 mg/m³)
AEGL-31910(Lethal)1911
1700 ppm(1900 mg/m³)
600 ppm(690 mg/m³)
330 ppm(380 mg/m³)
150 ppm(170 mg/m³)
130 ppm(150 mg/m³)
a N.R., not recommended because susceptible persons may experience more serious effects (equivalent to AEGL-2 level)1912at concentrations, which do not yet cause AEGL-1 effects in the general population1913
All inhalation data are summarized in Figure 3 below. The data were classified into severity1914categories chosen to fit into definitions of the AEGL level health effects. The category severity definitions1915are "No effect"; "Discomfort"; "Disabling"; "Some Lethality"; "Lethal" and "AEGL". In the figure depicting1916the COHb levels, the AEGL lines are drawn at the COHb levels for adults. The grey boxes above the lines1917indicate the range of COHb levels in neonates, children and smokers (with 8 % COHb from smoking).1918
The single exposure animal data point in the AEGL-2 COHb box represents the study by Aronow1919et al. (1979) using dogs with electrically damaged hearts. The two single exposure human data points in the1920bos represent the study by Sheps et al. (1990; 1991) reporting increase arrhythmia in heart patients and the1921study by Klasner et al. (1998) reporting moderate neurotoxic effects in children.1922

CARBON MONOXIDE FINAL: 11/2006
54
Consistency of Data for Carbon Monoxide with Derived AEGL Values
10
100
1000
10000
0 60 120 180 240 300 360 420 480
Time (minutes)
Con
cent
ratio
n (p
pm) Human - No effect
Human - DiscomfortHuman - DisablingAnimal - No effectAnimal - DiscomfortAnimal - DisablingAnimal - Some LethalityAnimal - LethalAEGL
AEGL - 3
AEGL - 2
Consistency of Data for Carbon Monoxide with Derived AEGL Values
1
10
100
CO
Hb
(%)
Human - No effectHuman - DiscomfortHuman - DisablingAnimal - No effectAnimal - DiscomfortAnimal - DisablingAnimal - Some LethalityAnimal - LethalAEGLHuman - Lethal
AEGL - 2
AEGL - 3
Single exposure Repeated or continuous exposure
FIGURE 3: CATEGORICAL REPRESENTATION OF ALL CO INHALATION DATA1923

CARBON MONOXIDE FINAL: 11/2006
55
8.2. Comparison with Other Standards and Criteria1924
Other standards and guidance levels for workplace and community exposures are listed in Table 17.1925The German BAT (Biologischer Arbeitsstoff-Toleranz-Wert; biological exposure index) is 5 % COHb,1926equivalent to a concentration of 30 ppm CO (Greim und Lehnert, 1994). The ACGIH BEI (biological1927exposure index) is 3.5 % COHb at the end of shift, equivalent to a CO concentration in end exhaled air of 201928ppm (ACGIH, 1999).1929
TABLE 17: EXTANT STANDARDS AND GUIDELINES FOR CARBON MONOXIDE 1930
Guideline1931Exposure Duration
10 minutes 30 minutes 1 hour 4 hours 8 hours
AEGL-11932 N.R. * N.R. N.R. N.R. N.R.
AEGL-21933 420 ppm 150 ppm 83 ppm 33 ppm 27 ppm
AEGL-31934 1700 ppm 600 ppm 330 ppm 150 ppm 130 ppm
ERPG-1 (AIHA) a1935 200 ppm
ERPG-2 (AIHA)1936 350 ppm
ERPG-3 (AIHA)1937 500 ppm
EEGL (NRC) b1938 1500 ppm 800 ppm 400 ppm 50 ppm[24 hours]
PEL-TWA (OSHA) c1939 50 ppm
IDLH (NIOSH) d1940 1200 ppm
REL-TWA (NIOSH) e1941 35 ppm[200 ppmceiling]
TLV-TWA (ACGIH) f1942 25 ppm
MAK (Germany) g1943 30 ppm
MAK Spitzenbegrenzung (Germany)1944 h194560 ppm
MAC (The Netherlands) i1946 25 ppm
Einsatztoleranzwert j1947 100 ppm
WHO Air Quality Guideline k1948 87 ppmfor 15 min
52 ppm 26 ppm 9 ppm
U.S. National Ambient Air Quality1949Standard l1950
35 ppm 9 ppm
EU Ambient Air Limit Value m1951 9 ppm
* N.R., not recommended because susceptible persons may experience more serious effects (equivalent to AEGL-2 level)1952at concentrations, which do not yet cause AEGL-1 effects in the general population.1953
CARBON MONOXIDE FINAL: 11/2006
56
a ERPG (Emergency Response Planning Guidelines, American Industrial Hygiene Association) (AIHA, 1999)1954The ERPG-1 is the maximum airborne concentration below which it is believed nearly all individuals could1955be exposed for up to one hour without experiencing other than mild, transient adverse health effects or without1956perceiving a clearly defined objectionable odor. The ERPG-1 value is based on a COHb of 5-6 %, which, based1957on the original CFK model using a ventilation rate at rest, is considered to be produced by 1-hour CO exposure1958to 200 ppm.. This exposure level is not expected to produce any effects during a 1-hour exposure period. While1959delayed transient effects, such as headache, are possible, no permanent effects in more susceptible individuals1960are expected.1961The ERPG-2 is the maximum airborne concentration below which it is believed nearly all individuals could1962be exposed for up to one hour without experiencing or developing irreversible or other serious health effects1963or symptoms that could impair an individual‘s ability to take protective action. The ERPG-2 value is based on1964a COHb of 10-12 %, which, based on the original CFK model using a ventilation rate at rest, is considered to1965be produced by 1-hour CO exposure to 350 to 500 ppm.. This exposure level is expected to cause slight1966neurological symptoms (increased threshold of visual light) in healthy individuals and chest pain at less1967exertion in heart patients. (Comment: The ERPG derivation does not discuss the CO effects on children.1968Moreover, model calculation for deriving ERPG values assumed a resting ventilation rate, while for derivation1969of AEGL values a ventilation rate corresponding to light to moderate activity was assumed).1970The ERPG-3 is the maximum airborne concentration below which it is believed nearly all individuals could1971be exposed for up to one hour without experiencing or developing life-threatening health effects. The ERPG-31972is based on the believe that humans can generally tolerate COHb of 20 % for brief periods without substantial1973toxicity. Based on the original CFK model using a ventilation rate at rest, it was considered that exposure to1974500 ppm for 1 hour will lead to a COHb of about 15 %. (Comment: The ERPG derivation does not discuss the1975CO effects on children. Moreover, model calculation for deriving ERPG values assumed a resting ventilation1976rate, while for derivation of AEGL values a ventilation rate corresponding to light to moderate activity was1977assumed).1978
b EEGL (Emergency Exposure Guidance Levels, National Research Council) (NRC, 1987)1979is the concentration of contaminants that can cause discomfort or other evidence of irritation or intoxication1980in or around the workplace, but avoids death, other severe acute effects and long-term or chronic injury. The1981NRC document states that 400 ppm (460 mg/m³) was determined as the concentration of CO to which a 1-hour1982exposure would result in a carboxyhemoglobin (COHb) level of less than 10% in resting individuals. The1983committee cautions that sensitive individuals, such as persons with angina or heart disease, should not be1984exposed to concentrations approaching the EEGL as they may incur serious adverse health effects (Comment:1985The EEGL derivation excludes patients with coronary artery disease. Moreover, model calculation for deriving1986EEGL values assumed a resting ventilation rate, while for derivation of AEGL values a ventilation rate1987corresponding to light to moderate activity was assumed).1988
c OSHA PEL-TWA (Occupational Health and Safety Administration, Permissible Exposure Limits - Time1989Weighted Average) (OSHA, website)1990
is defined analogous to the ACGIH-TLV-TWA, but is for exposures of no more than 10 hours/day, 401991hours/week.1992
d IDLH (Immediately Dangerous to Life and Health, National Institute of Occupational Safety and Health)1993(NIOSH, 1996)1994
CARBON MONOXIDE FINAL: 11/2006
57
represents the maximum concentration from which one could escape within 30 minutes without any escape-1995impairing symptoms, or any irreversible health effects. The IDLH value is based on the observation by1996Henderson et al., 1921, that exposure of a healthy man at 1000 ppm for 1 hour caused unpleasant but no1997dangerous symptoms, and that more severe symptoms develop at 40 % COHb (Steward, 1975). According to1998the CFK model, a 30-minute exposure at 1200 ppm will produce a COHb of 10-13 %. (Comment: The IDLH1999derivation does not discuss patients with coronary artery disease. In the Henderson et al. (1921) study, the2000subject was sitting still during exposure and developed Cheyne-Stokes breathing at the end of exposure, which2001is considered a serious effect. Moreover, model calculation in the IDLH derivation assumed a resting2002ventilation rate, while for derivation of AEGL values a ventilation rate corresponding to light to moderate2003activity was assumed).2004
e NIOSH REL-TWA (National Institute of Occupational Safety and Health, Recommended Exposure Limits -2005Time Weighted Average) (NIOSH, 1996)2006
is defined analogous to the ACGIH-TLV-TWA.2007f ACGIH TLV-TWA (American Conference of Governmental Industrial Hygienists, Threshold Limit Value -2008Time Weighted Average) (ACGIH, 2001) 2009
is the time-weighted average concentration for a normal 8-hour workday and a 40-hour workweek, to which2010nearly all workers may be repeatedly exposed, day after day, without adverse effect. “This value is intended2011to maintain blood COHb levels below 3.5 %, to minimize the potential for adverse neurobehavioral changes,2012and to maintain cardiovascular work and exercise capacities”. 2013
g MAK (Maximale Arbeitsplatzkonzentration [Maximum Workplace Concentration], Deutsche2014Forschungsgemeinschaft [German Research Association], Germany) (Henschler, 1981; DFG, 1999)2015
is defined analogous to the ACGIH-TLV-TWA. 2016h MAK Spitzenbegrenzung (Kategorie II,2) [Peak Limit Category II,1] (DFG, 1999)2017
constitutes the maximum average concentration to which workers can be exposed for a period up to 302018minutes, with no more than 4 exposure periods per workshift; total exposure may not exceed 8-hour TWA2019MAK.2020
i MAC ([Maximum Workplace Concentration], Dutch Expert Committee for Occupational Standards, The2021Netherlands) (MSZW, 1999)2022
is defined analogous to the ACGIH-TLV-TWA.2023j Einsatztoleranzwert [Action Tolerance Levels] (Vereinigung zur Förderung des deutschen Brandschutzes e.V.2024[Federation for the Advancement of German Fire Prevention]) (Greim, 1996)2025
constitutes a concentration to which unprotected firemen and the general population can be exposed to for up2026to 4 hours without any health risks. 2027
k Air Quality Guideline (WHO, 1999a)2028is based on a COHb of 2.5 %, which should not be exceeded even when a normal subject engages in light or2029moderate exercise.2030
l U.S. National Ambient Air Quality Standard (National Air Pollution Control Administration, 1970; FR , 2000; EPA,20312000)2032m EU Limit Value for Ambient Air (EC, 1999)20338.3. Data Adequacy and Research Needs2034
A sufficient number of experimental and case studies in humans is available for the derivation of2035AEGL values. 2036

CARBON MONOXIDE FINAL: 11/2006
58
CO is the classical example of an imperceptible toxic gas. Until very severe symptoms occur2037(inability to walk) none or only nonspecific symptoms were noted in monkeys and healthy humans. For this2038reason no AEGL-1 values for CO are recommended.2039
AEGL-2 values were based on cardiac effects in subjects with coronary artery disease. Several high2040quality studies are available addressing endpoints such as time to the onset of exercise-induced angina, time2041to the onset of exercise-induced 1-mm ST-segment changes in the electrocardiogram and frequency of2042exercise-induced arrhythmias. However, no experimental studies in heart patients are available that used2043significantly higher levels of COHb than about 5 % COHb. 2044
AEGL-3 values were based analysis of clinical cases of lethal and non-lethal poisoning as well as on2045old experimental studies in which healthy subjects were exposed to COHb of up to 40-56 %. The AEGL-32046values derived using an intraspecies uncertainty factor of 3 (corresponding to an COHb of about 15 %) are2047supported by the available case reports of lethal effects (myocardial infarction, stillbirths) in more susceptible2048subpopulations. Lethal effects from myocardial infarction in hypersusceptible patients with coronary artery2049disease at even lower CO concentrations, which could be at the upper end of the range of CO concentrations2050found inside buildings and in ambient air outside, cannot be excluded.2051
Most studies relating COHb on health effects do not investigate whether the frequency or severity2052of the effects increase with exposure time (at a constant COHb). There is thus an uncertainty concerning the2053increase of effects with time at a constant COHb. This is true for all AEGL levels. Studies elucidating this2054exposure-effect-time relationship could support the derived AEGL-2 and AEGL-3 values.2055

CARBON MONOXIDE FINAL: 11/2006
59
9. REFERENCES2056
ACGIH, American Conference of Governmental Industrial Hygienists, 2001. Carbon monoxide. Documentation of the2057Threshold Limit Values and Biological Exposure Indices. ACGIH, Cincinnati, OH, USA, Suppl. pp.1-4.2058
ACGIH, American Conference of Governmental Industrial Hygienists, 1999. 1999 TLVs and BEIs. ACGIH, Cincinnati,2059OH, USA.2060
AIHA, American Industrial Hygiene Association, 1999. Carbon Monoxide. Emergency Response Planning Guidelines.2061AIHA Press, Fairfax, VA, USA.2062
Allred, E.N., E.R. Bleecker, B.R. Chaitman, T.E. Dahms, S.O. Gottlieb, J.D. Hackney, D. Hayes, M. Pagano, R.H.2063Selvester, S.M. Walden and J. Warren, 1989a. Acute Effects of Carbon Monoxide Exposure on Individuals with2064Coronary Artery Disease. Research Report No. 25, Health Effects Institute, Cambridge, Massachusetts, USA, 1989,2065cited in WHO, 1999a.2066
Allred, E.N., E.R. Bleecker, B.R. Chaitman, T.E. Dahms, S.O. Gottlieb, J.D. Hackney, M. Pagano, R.H. Selvester, S.M.2067Walden and J. Warren, 1989b. Short-term effects of carbon monoxide exposure on the exercise performance of subjects2068with coronary artery disease. New Engl. J. Med. 321, 1426-1432.2069
Allred, E.N., E.R. Bleecker, B.R. Chaitman, T.E. Dahms, S.O. Gottlieb, J.D. Hackney, M. Pagano, R.H. Selvester, S.M.2070Walden and J. Warren, 1991. Effects of carbon monoxide on myocardial ischemia. Environ. Health Perspect. 91, 89-2071132. 2072
American Heart Association, 2003. Heart Disease and Stroke Statistics — 2003 Update. American Heart Association,2073Dallas, Texas; available on the internet at http://www.americanheart.org.2074
Anderson, E.W., R.J. Andelman, J.M. Strauch, N.J. Fortuin and J.H. Knelson, 1973. Effect of low-level carbon2075monoxide exposure on onset and duration of angina pectoris: a study in ten patients with ischemic heart disease. Ann.2076Intern. Med. 79, 46-50, cited in EPA, 2000.2077
Aronow, W.S., R. Charter and G. Seacat, 1979. Effect of 4% carboxyhemoglobin on human performance in cardiac2078patients. Preventive Med. 8, 562-566.2079
Aronow, W.S., C.N. Harris, M.W. Isbell, S.N. Rokaw and B. Imparato, 1972. Effect of freeway travel on angina2080pectoris. Ann. Intern. Med. 77, 669-676, cited in WHO, 1999a.2081
Astrup, P., H.M. Olsen, D. Trolle and K. Kjeldsen, 1972. Effect of moderate carbon monoxide exposure on fetal2082development. Lancet 7789, 1220-1222.2083
ATSDR, Agency for Toxic Substances and Disease Registry, 1998. Methylene Chloride. Update. U.S.Department of2084Health and Human Services, Public Health Service, Agency for Toxic Substances and Disease Registry, Atlanta,2085Georgia, USA.2086
Atkins, E.H. and E.L. Baker, 1985. Exacerbation of coronary artery disease by occupational carbon monoxide exposure:2087A report of two fatalities and a review of the literature. Am. J. Ind. Med. 7, 73-79.2088
Balraj, E.K., 1984. Atherosclerotic coronary artery disease and "low" levels of carboxyhemoglobin: Report of fatalities2089and discussion of pathophysiologic mechanisms of death. J. Foren. Sci. 29, 1150-1159.2090

CARBON MONOXIDE FINAL: 11/2006
60
Beard, R.R., 1982. Inorganic compounds of oxygen, nitrogen, and carbon. In: Patty's Industrial Hygiene and2091Toxicology. Vol. 2C, G.D. Clayton and F.E. Clayton (Eds.), John Wiley & Sons, New York, 1982, pp. 4114-4124.2092
Benignus, V.A., M.J. Hazucha, M.V. Smith and P.A. Bromberg, 1994. Prediction of carboxyhemoglobin formation due2093to transient exposure to carbon monoxide. J. Appl. Physiol. 76, 1739-1745, cited in WHO, 1999a.2094
BSI, British Standards Institution, 1989. Guide for the assessment of toxic hazards in fire in buildings and transport.2095Draft for Development. British Standards Institution, Milton Keynes, UK, 1989.2096
Caravati, E.M., C.J. Adams, S.M. Joyce and N.C. Schafer, 1988. Fetal toxicity associated with maternal carbon2097monoxide poisoning. Ann. Emerg. Med. 17, 714-717.2098
Chiodi, H., D.B. Dill, F. Consolazio and S.M. Horvath, 1941. Respiratory and circulatory responses to acute carbon2099monoxide poisoning. Am. J. Physiol. 134, 683-693.2100
Choi, K.D. and Y.K. Oh, 1975. [A teratological study on the effects of carbon monoxide exposure upon the fetal2101development of albino rats] (in Korean). Chungang Uihak 29, 209-213, cited in WHO, 1999a.2102
Coburn, R.F., R.E. Forster and P.B. Kane, 1965. Considerations of the physiological variables that determine the blood2103carboxyhemoglobin concentration in man. J. Clin. Invest. 44, 1899-1910.2104
Coburn, R.F., W.J. Williams, and S.B. Kahn, 1966. Endogenous carbon monoxide production in patients with hemolytic2105anemia. J. Clin. Invest. 45, 460-468, cited in WHO, 1999a.2106
Crocker, P.J. and J.S. Walker, 1985. Pediatric carbon monoxide toxicity. J. Emerg. Med. 3, 443-448.2107
Dahms, T.E., L.T. Younis, R.D. Wiens, S. Zarnegar, S.L. Byers and B.R. Chaitman, 1993. Effects of carbon monoxide2108exposure in patients with documented cardiac arrhythmias. J. Am. Coll. Cardiol. 21, 442-450.2109
Darmer, MacEwen and Smith, 1972. AMRL-TR-72-130. Paper No. 22, cited in E.I. du Pont de Nemours and Co., 1981.2110
DeBias, D.A., C.M. Banerjee, N.C. Birkhead, C.H. Greene, S.D. Scott, and W.V. Harrer, 1976. Effects of carbon2111monoxide inhalation on ventricular fibrillation. Arch. Environ. Health 31, 42-46, cited in WHO, 1999a. 2112
Deschamps, D., C. Geraud, H. Julien, F.J. Baud and S. Dally, 2003. Memory one month after acute carbon monoxide2113intoxication: a prospective study. Occup. Environ. Med. 60, 212-216.2114
DFG, Deutsche Forschungsgemeinschaft, 1999. MAK- und BAT-Werte-Liste 1999. Senatskommission zur Prüfung2115gesundheitsschädlicher Arbeitsstoffe, Deutsche Forschungsgemeinschaft, Wiley-VCH Verlag GmbH, Weinheim,2116Germany, 1999.2117
Dominick, M.A. and T.L. Carson, 1983. Effects of carbon monoxide exposure on pregnant sows and their fetuses. Am.2118J. Vet. Res. 44, 35-40, cited in WHO, 1999a.2119
Ebisuno, S., M. Yasuno, Y. Yamada, Y. Nishino, M. Hori, M. Inoue and T. Kamada, 1972. Myocardial infarction after2120acute carbon monoxide poisoning: case report. Angiology 37, 621-624.2121
E.I. du Pont de Nemours and Co., 1981. Inhalation Toxicity of Common Combustion Gases. Haskell Laboratory Report2122No. 238-81. Haskell Laboratory, Newark, DE, USA, 1981.2123

CARBON MONOXIDE FINAL: 11/2006
61
Einzig, S., D.M. Nicoloff and R.V. Lucas Jr., 1980. Myocardial perfusion abnormalities in carbon monoxide poisoned2124dogs. Can. J. Physiol. Pharmacol. 58, 396-405, cited in Penney et al., 1980. 2125
EC, European Commission, 1999. Vorschlag für eine Richtlinie des Rates über Grenzwerte für Benzol und2126Kohlenmonoxid in der Luft (1999/C 53/07), issued by the European Commission on 20.01.1999.2127
Ellenhorn, M.J., 1997. “Carbon Monoxide” in: Ellenhorn's Medical Toxicology. 2nd ed. Lippincott, Williams &2128Wilkins, Baltimore, pp.1465-1476. 2129
Ely, E.W., B. Moorehead and E.F. Haponik, 1995. Warehouse workers‘ headache: emergency evaluation and2130management of 30 patients with carbon monoxide poisoning. Am. J. Med. 98, 145-155.2131
EPA, U. S. Environmental Protection Agency, 2000. Air quality criteria for carbon monoxide. EPA 600/P-99/001F, U.2132S. Environmental Protection Agency, Office of Research and Development, Washington, D.C. 2133
Farrow, J.R., G.J. Davis, T.M. Roy, L.C. McCloud and G.R. Nichols II, 1990. Fetal death due to nonlethal maternal2134carbon monoxide poisoning. J. Foren. Sci. 35, 1448-1452.2135
Fenn, W.O., 1970. The burning of CO in tissues. In: Biological effects of carbon monoxide, R.F. Coburn (Ed.). Ann.2136N. Y. Acad. Sci. 174, 64-71, cited in WHO, 1999a.2137
Fowles, J.R., G.V. Alexeeff and D. Dodge, 1999. The use of benchmark dose methodology with acute inhalation2138lethality data. Reg. Toxicol. Pharmacol. 29, 262-278.2139
FR, Federal Register, 2000. Air Quality Criteria for Carbon Monoxide (Final). Federal Register Volume 65, Number2140160, August 17, 2000.2141
Gargas, M.L., H.J. Clewell and M.E. Andersen, 1986. Metabolism of inhaled dihalomethanes in vivo: differentiation2142of kinetic constants for two independent pathways. Toxicol. Appl. Pharmacol. 82, 211-223.2143
Gibbons R.J.,, K. Chatterjee, J. Daley, J.S. Douglas, S.D. Fihn, J.M. Gardin, M.A. Grunwald, D. Levy, B.W. Lytle, R.A.2144O'Rourke, W.P. Schafer, S.V. Williams, 1999. ACC/AHA/ACP-ASIM guidelines for the management of patients with2145chronic stable angina: a report of the American College of Cardiology/American Heart Association Task Force on2146Practice2147Guidelines (Committee on the Management of Patients With Chronic Stable Angina). J. Am. Coll. Cardiol. 33,21482092–2197.2149
Grace, T.W. and F.W. Platt, 1981. Subacute carbon monoxide poisoning. J. Am. Med. Assoc. 246, 1698-1700.2150
Greim, H., 1996. Entwicklung von Verfahren zur Abschätzung der gesundheitlichen Folgen von Großbränden. Bericht2151zum Forschungsvorhaben 4b/92 des Bundesamtes für Zivilschutz, Germany.2152
Greim, H. and G. Lehnert, 1994. Kohlenmonoxid. Biologische Arbeitsstoff-Toleranz-Werte (BAT-Werte) und2153Expositionsäquivalente für krebserzeugende Arbeitsstoffe (EKA), Arbeitsmedizinisch-toxikologische Begründungen,2154Band 1. 7. Lieferung. DFG, Deutsche Forschungsgemeinschaft, VCH Verlag Weinheim, Germany, 1994, pp.1-2.2155
Haldane, J., 1895. The action of carbonic acid on man. J. Physiol. 18, 430-462.2156

CARBON MONOXIDE FINAL: 11/2006
62
Hartzell, G.E., D.N. Priest and W.G. Switzer, 1985. Modeling of toxicological effects of fire gases. II. Mathematical2157modeling of intoxication of rats by combined carbon monoxide and hydrogen cyanide. J. Fire Sci. 3, 115-128, cited in2158NIOSH, 1996.2159
Haskell Laboratories, 1978. No further information, cited in E.I. du Pont de Nemours and Co., 1981.2160
Hazucha, M.J., 2000. Effect of Carbon Monoxide on Work and Exercise Capacity in Humans. Chapter 5 in: Carbon2161Monoxide Toxicity. D.G. Penney (Ed.). CRC Press, Boca Raton, London, New York, Washington D.C., 2000, pp. 101-2162134.2163
Henderson, Y., H.W. Haggard, M.C. Teague, A.L. Prince and R.M. Wunderlich, 1921. Physiological effects of2164automobile exhaust gas and standards of ventilation for brief exposures. J. Ind. Hyg. 3, 79-92.2165
Henschler, D., 1981. Monochloressigsäure. In: Gesundheitsschädliche Arbeitsstoffe, Toxikologisch-arbeitsmedizinische2166Begründungen von MAK-Werten, Loseblattsammlung, 8. Lfg., DFG, Deutsche Forschungsgemeinschaft, VCH Verlag2167Weinheim, Germany.2168
Herpol, C., R. Minne and E. VanOutryve, 1976. Biological evaluation of the toxicity of gases produced under fire2169conditions by synthetic materials. Part I. Methods and preliminary experiments concerning the reaction of animals.2170Combust. Sci. Technol. 12, 217-228, cited in Fowles et al., 1999.2171
Hilado, C.J., H.J. Cumming, A.M. Machado, C.J. Casey and A. Furst, 1978. Effect of individual gaseous toxicants on2172mice. Proc. West. Pharmacol. Soc. 21, 159-160, cited in AIHA, 1999.2173
Hill, E.P., J.R. Hill, G.G. Power and L.D. Longo, 1977. Carbon monoxide exchanges between the human fetus and2174mother: a mathematical model. Am. J. Physiol. 232, H311-H323.2175
Hinderliter, A.L., K.F. Adams, C.J. Price, M.C. Herbst, G. Koch and D.S. Sheps. Effects of low-level carbon monoxide2176exposure on resting and exercise-induced ventricular arrhythmias in patients with coronary artery disease and no2177baseline ectopy. Arch. Environ. Health 44, 89-93.2178
Holmes, R.S., 1985. Genetic variants of enzymes of alcohol and aldehyde metabolism. Alcoholism: Clinical and2179Experimental Research 9, 535-538.2180
ISO, International Standard Organization, 1989. Toxicity testing of fire effluents - Part 1. ISO/TR 9122-1.2181
Jones, R.A., J.A. Strickland, J.A. Stunkard and J. Siegel, 1971. Effects on experimental animals of long-term inhalation2182exposure to carbon monoxide. Toxicol. Appl. Pharmacol. 19, 46-53.2183
Kimmerle, 1974. Combustion Toxicol. 1, 4-51, cited in E.I. du Pont de Nemours and Co., 1981.2184
Kishitani, K., K. Nakamura, 1979. Research on evaluation of toxicities of combustion gases generated during fires. In2185Proceedings of the Third Joint Panel Conderence of the U.S.-Japan Cooperative Program in Natural Resources held2186March 13-17, 1978, at the National Bureau of Standards, Gaithersburg, MD, M.D. Sherald (Ed.). U.S. Department of2187Commerce, Washington, D.C., cited in Fowles et al., 1999.2188
Kizakevich, P.N., M.L. McCartney, M.J. Hazucha, L.H. Sleet, W.J. Jochem, A.C. Hackney and K. Bolick, 2000.2189Noninvasive ambulatory assessment of cardiac function in healthy men exposed to carbon monoxide during upper and2190lower body exercise. Eur. J. Appl. Physiol. 83, 7-16.2191
CARBON MONOXIDE FINAL: 11/2006
63
Klasner, A.E., S.R. Smith, M.W. Thompson and A.J. Scalzo, 1998. Carbon monoxide mass exposure in a pediatric2192population. Academic Emerg. Med. 5, 992-996.2193
Klees, M., M. Heremans and S. Dougan, 1985. Psychological sequelae to carbon monoxide intoxication in the child.2194Sci. Total Environm. 44, 165-176.2195
Kleinman, M.T., D.M. Davidson, R.B. Vandagriff, V.J. Caiozzo and J.L. Whittenberger, 1989. Effects of short-term2196exposure to carbon monoxide in subjects with coronary artery disease. Arch. Env. Health 44, 361-369.2197
Kleinman, M.T., D.A. Leaf, E. Kelly, V. Caiozzo, K. Osann and T. O‘Niell, 1998. Urban angina in the mountains:2198effects of carbon monoxide and mild hypoxemia on subjects with chronic stable angina. Arch. Environ. Health 53, 388-2199397.2200
Koren, G., R. Sharav, A. Pastuszak, L.K. Garrettson, K. Hill, I. Samson, M. Rorem, A. King and J.E. Dolgin, 1991. A2201multicenter, prospective study of fetal outcome following accidental carbon monoxide poisoning in pregnancy. Reprod.2202Toxicol. 5, 397-403.2203
Landaw, S.A., 1973. The effects of cigarette smoking on total body burden and excretion rates of carbon monoxide. J.2204Occup. Med. 15, 231-235, cited in WHO, 1999a.2205
Mactutus, C.F. and L.D. Fechter, 1985. Moderate prenatal carbon monoxide exposure produces persistent and2206apparently permanent memory deficits in rats. Teratol. 31, 9-12.2207
Marius-Nunez, A.L., 1990. Myocardial infarction with normal coronary arteries after acute exposure to carbon2208monoxide. Chest 97, 491-494.2209
Meert, K.L., S.M. Heidemann and A.P. Sarnaik, 1998. Outcome of children with carbon monoxide poisoning treated2210with normobaric oxygen. J. Trauma Injury Infect. Crit. Care 44, 149-154.2211
Morris, G.L., S.E. Curtis and J. Simon, 1985. Perinatal piglets under sublethal concentrations of atmospheric carbon2212monoxide. J. Anim. Sci, 61, 1080-1087, cited in WHO, 1999a.2213
MSZW, Ministerie van Sociale Zaken en Werkgelegenheid, 1999. Nationale MAC-lijst 2000. Sdu Vitgeers, Den Haag,22141999.2215
National Air Pollution Control Administration, 1970. Air quality criteria for carbon monoxide. US Department of2216Health, Education, and Welfare, Public Health Service, Environmental Health Service, Washington, DC, publication2217no. AP-62.2218
Nielsen, B., 1971. Thermoregulation during work in carbon monoxide poisoning. Acta Physiol. Scand. 82, 98-106.2219
NIOSH, National Institute for Occupational Safety and Health, 1972 . Occupational Exposure to Carbon Monoxide.2220U.S. Department of Health, Education and Welfare.2221
NIOSH, National Institute of Occupational Safety and Health, 1996. Carbon Monoxide. Documentation for Immediately2222Dangerous to Life and Health Concentrations. Http://www.cdc.gov/niosh/idlh/630080.html. Download date 15.03.2000.2223
NRC, National Research Council, 1987. Emergency and continuous exposure guidance levels for selected airborne2224contaminants. Vol. 7. National Research Council, Commission of Life Sciences, Board on Toxicology and2225
CARBON MONOXIDE FINAL: 11/2006
64
Environmental Health Hazards, Committee on Toxicology, National Academy Press, Washington, DC, USA, pp. 1738,2226cited in NIOSH, 1996.2227
Numa, A.H. and C.J. Newth, 1996. Anatomic dead space in infants and children. J. Appl. Physiol. 80, 1485-1489.2228
OSHA, Occupational Health and Safety Administration. Code of Federal Regulations 29, Part 1910, 1910.1000.2229http://www.osha-slc.gov/OshStd_data/1910_1000_TABLE_Z-1.html. Download date 04.05.2000.2230
Pach, J., L. Cholewa, Z. Marek, M. Bogusz and B. Groszek, 1978. Analysis of predictive factors in acute carbon2231monoxide poisoning. Vet. Hum. Toxicol. 21 Suppl, 158-159.2232
Pach, J., L. Cholewa, Z. Marek, M. Bogusz and B. Groszek, 1978. Various factors influencing the clinical picture and2233mortality in acute carbon monoxide poisoning [in Polish]. Folia Medica Cracoviensia, 20, 159-168.2234
Penney, D.G., M.S. Baylerian and K.E. Fanning, 1980. Temporary and lasting cardiac effects of pre- and postnatal2235exposure to carbon monoxide. Toxicol. Appl. Pharmacol. 53, 271-278.2236
Pesce, V.H.D., M. Stupfel, V. Gourlet and C. Lemercerre, 1987. Age and survival of an acute carbon monoxide2237intoxication: an animal model. Sci. Total Environ. 65, 41-51.2238
Peterson, J.E. and R.D. Stewart, 1970. Absorption and elimination of carbon monoxide by inactive young men. Arch.2239Environ. Health 21, 165-171.2240
Peterson, J.E. and R.D. Stewart, 1975. Predicting the carboxyhemoglobin levels resulting from carbon monoxide2241exposures. J. Appl. Physiol. 39, 633-638.2242
Purser, D.A. and K.R. Berrill, 1983. Effects of carbon monoxide on behavior in monkeys in relation to human fire2243hazard. Arch. Environ. Health 38, 308-315.2244
Radford, E.P. and T.A. Drizd, 1982. Blood carbon monoxide levels in persons 3-74 years of age: United States, 1976-224580. Hyattsville, Maryland, US Department of Health and Humans Services, National Center for Health Statistics (DHHS2246Publication No. (PHS) 82-1250), cited in WHO, 1999a.2247
Raub, J.A., 2000. The Setting of Health-Based Standards for Ambient Carbon Monoxide and Their Impact on2248Atmospheric Levels. Chapter 4 in: Carbon Monoxide Toxicity. D.G. Penney (Ed.). CRC Press, Boca Raton, London,2249New York, Washington D.C., 2000, pp. 83-99.2250
Rose, C.S., R.A. Jones, L.J. Jenkins and J. Siegel, 1970. The acute hyperbaric toxicity of carbon monoxide. Toxicol.2251Appl. Pharmacol. 17, 752-760.2252
Rosenkrantz, H., R.J. Grant, R.W. Fleischman and R.J. Baker, 1986. Marihuana-induced embryotoxicity in the rabbit.2253Fundam. Appl. Toxicol. 7, 236-243.2254
Sekiya, S., S. Sato, H. Yamaguchi and K. Harumi, 1983. Effects of carbon monoxide inhalation on myocardial infarct2255size following experimental coronary artery ligation. Jpn. Heart J. 24, 407-416, cited in WHO, 1999a.2256
Sheps, D.S., K.F. Adams Jr., P.A. Bromberg, G.M. Goldstein, J.J. O‘Neil, D. Horstman and G. Koch, 1987. Lack of2257effect of low levels of carboxyhemoglobin on cardiovascular function in patients with ischemic heart disease. Arch.2258Environ. Health 42, 108-116.2259
CARBON MONOXIDE FINAL: 11/2006
65
Sheps, D.S., M.C. Herbst, A.L. Hinderliter, K.F. Adams, L.G. Ekelund, J.J. O'Neill, G.M. Goldstein, P.A. Bromberg,2260J.L. Dalton, M.N. Ballenger, S.M. Davis and G.G. Koch, 1990. Production of arrhythmias by elevated2261carboxyhemoglobin in patients with coronary artery disease. Ann. Intern. Med. 113, 343-351.2262
Sheps, D.S., M.C. Herbst, A.L. Hinderliter, K.F. Adams, L.G. Ekelund, J.J. O'Neill, G.M. Goldstein, P.A. Bromberg,2263M. Ballenger, S.M. Davis and G. Koch, 1991. Effects of 4 Percent and 6 Percent Carboxyhemoglobin on Arrhythmia2264Production in Patients with Coronary Artery Disease. Research Report No. 41, Health Effects Institute, Cambridge,2265Massachusetts.2266
Singh, J., 1986. Early behavioral alterations in mice following prenatal carbon monoxide exposure. Neurotoxicol. 7,2267475-482.2268
Singh, J. and L.H. Scott, 1984. Threshold for carbon monoxide induced fetotoxicity. Teratol. 30, 253-257.2269
Sokal, J.A. and E. Kralkowska, 1985. The relationship between exposure duration, carboxyhemoglobin, blood glucose,2270pyruvate and lactate and the severity of intoxication in 39 cases of acute carbon monoxide poisoning in man. Arch.2271Toxicol. 57, 196-199.2272
Stewart, R.D., 1975. The effect of carbon monoxide on humans. Annual Review of Pharmacology 15, 409-423.2273
Stewart, R.D., J.E. Peterson, E.D. Baretta, R.T. Bachand, M.J. Hosko and A.A. Herrmann, 1970. Experimental human2274exposure to carbon monoxide. Arch. Environ. Health 21, 154-164.2275
Tikuisis, P., D.M. Kane, T.M. McLellan, F. Buick and S.M. Fairburn, 1992. Rate of formation of cyrboxyhemoglobin2276in exercising humans exposed to carbon monoxide. J. Appl. Physiol. 72, 1311-1319.2277
Tomaszewski, C., 1998. Carbon Monoxide. Chapter 96 in: Goldfranks Toxicologic Emergencies, 6th Ed., L.R.2278Goldfrank, N.E. Flomenbaum, N.A. Lewin, R.S. Weisman, M.A. Howland and R.S. Hoffman (Eds.). Appleton and2279Lange, Stamford, CT, 1998, p. 1551-1563.2280
Weaver, L.K., S. Howe, R. Hopkins and K.J. Chan, 2000. Carboxyhemoglobin half-life in carbon monoxide-poisoned2281patients treated with 100% oxygen at atmospheric pressure. Chest 107, 801-808.2282
White, S.R., 2000. Pediatric Carbon Monoxide Poisoning. Chapter 21 in: Carbon Monoxide Toxicity. D.G. Penney2283(Ed.). CRC Press, Boca Raton, London, New York, Washington D.C., 2000, pp. 463-491.2284
WHO, World Health Organization, 1999a. Environmental Health Criteria 213, Carbon Monoxide (Second Edition),2285IPCS, International Programme on Chemical Safety; World Health Organization, Geneva, Switzerland, 1999.2286
WHO (World Health Organization), 1999b. Principles for the Assessment of Risks to Human Health from Exposure2287to Chemicals. Environmental Health Criteria 210. IPCS, International Programme on Chemical Safety; World Health2288Organization, Geneva, 110 pp.2289
Wilson, J.D., E.Braunwald, K.J. Isselbacher, R.G. Petersdorf, J.B. Martin, A.S. Fauci and R.K. Root (Eds.) 1991.2290Harrison’s Principles of Internal Medicine. 12th Ed. McGraw-Hill, Inc., New York.2291
Winston, J.M. and R.J. Roberts, 1978. Influence of increasing age on lethality induced by carbon monoxide or hypoxic2292hypoxia. Biol. Neonate 34, 199-202.2293
Winter, P.M. and J.N. Miller, 1976. Carbon monoxide poisoning. J. Am. Med. Assoc. 236, 1503.2294
CARBON MONOXIDE FINAL: 11/2006
66
APPENDIX A2295
Time Scaling Calculations for AEGLs2296

CARBON MONOXIDE FINAL: 11/2006
67
Time Scaling Calculations for AEGL-22297
Key study: Allred et al. (1989a; b; 1991); Sheps et al. (1990; 1991)2298
Toxicity endpoint: In an experimental study in 63 subjects with coronary artery disease, a significantly2299reduced time to ST-segment depression in the electrocardiogram and a significantly2300reduced time to onset of angina pectoris during physical exercise were found at 2 or23014 % COHb (Allred et al., 1989a; b; 1991). At higher COHb of 5.3, but not at 3.7 %,2302a significantly increased frequency of exercise-induced arrhythmias was found2303(Sheps et al., 1990; 1991). AEGL-2 values were derived on a COHb of 4 %.2304
Mathematical model: The CFK model (Coburn et al., 1965; Peterson and Stewart, 1975) was used to2305calculate exposure concentrations resulting in a COHb of 4 % at the end of the2306exposure periods. Concentrations were calculated for 10 and 30 minutes, 1, 4 and23078 hours (see Appendix B).2308
Scaling: Instead of a time scaling according to Cn x T = const., a mathematical model was2309used to calculated exposure concentrations for the relevant time periods (see2310Appendix B).2311
Uncertainty factors: Uncertainty factor of 123121 for intraspecies variability 2313
Calculations:2314
10-minute AEGL-2 10-min AEGL-2 = 424 ppm/1 = 420 ppm (480 mg/m³) 2315
30-minute AEGL-2 30-min AEGL-2 = 150 ppm/1 = 150 ppm (170 mg/m³) 2316
1-hour AEGL-2 1-hour AEGL-2 = 83 ppm/1 = 83 ppm (95 mg/m³) 2317
4-hour AEGL-2 4-hour AEGL-2 = 33 ppm/1 = 33 ppm (38 mg/m³) 2318
8-hour AEGL-2 8-hour AEGL-2 = 27 ppm/1 = 27 ppm (31 mg/m³) 2319
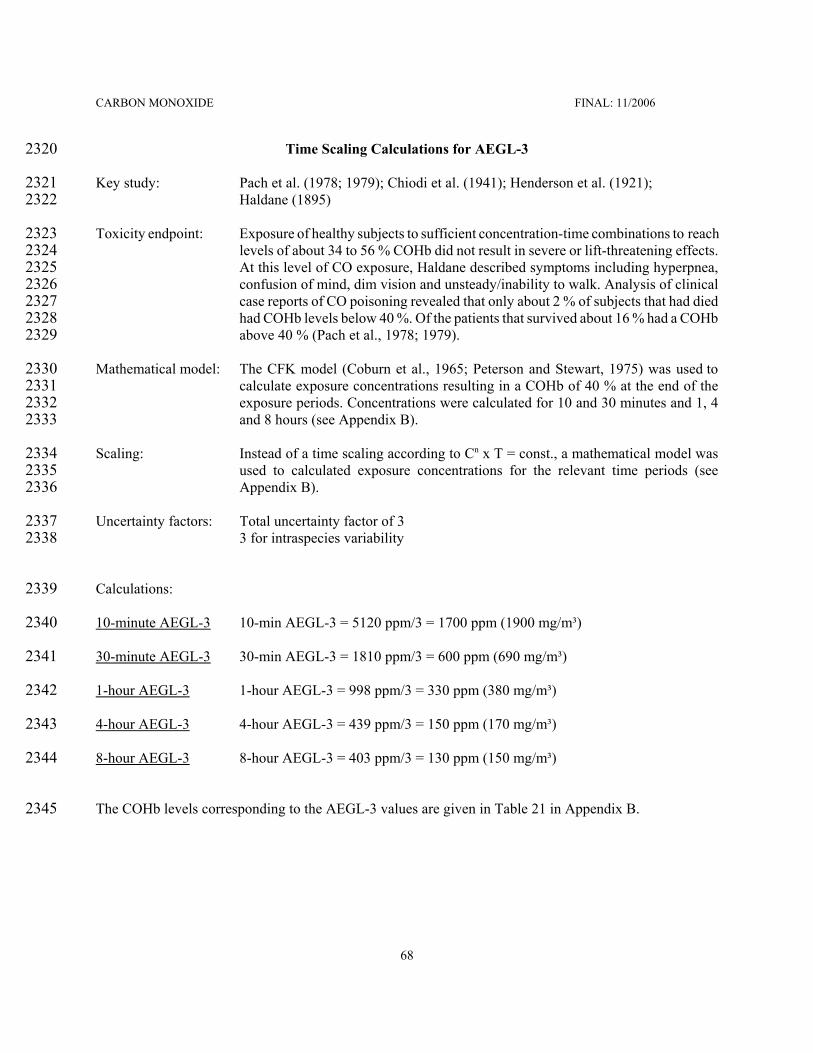
CARBON MONOXIDE FINAL: 11/2006
68
Time Scaling Calculations for AEGL-32320
Key study: Pach et al. (1978; 1979); Chiodi et al. (1941); Henderson et al. (1921); 2321Haldane (1895)2322
Toxicity endpoint: Exposure of healthy subjects to sufficient concentration-time combinations to reach2323levels of about 34 to 56 % COHb did not result in severe or lift-threatening effects.2324At this level of CO exposure, Haldane described symptoms including hyperpnea,2325confusion of mind, dim vision and unsteady/inability to walk. Analysis of clinical2326case reports of CO poisoning revealed that only about 2 % of subjects that had died2327had COHb levels below 40 %. Of the patients that survived about 16 % had a COHb2328above 40 % (Pach et al., 1978; 1979). 2329
Mathematical model: The CFK model (Coburn et al., 1965; Peterson and Stewart, 1975) was used to2330calculate exposure concentrations resulting in a COHb of 40 % at the end of the2331exposure periods. Concentrations were calculated for 10 and 30 minutes and 1, 42332and 8 hours (see Appendix B).2333
Scaling: Instead of a time scaling according to Cn x T = const., a mathematical model was2334used to calculated exposure concentrations for the relevant time periods (see2335Appendix B).2336
Uncertainty factors: Total uncertainty factor of 323373 for intraspecies variability 2338
Calculations:2339
10-minute AEGL-3 10-min AEGL-3 = 5120 ppm/3 = 1700 ppm (1900 mg/m³) 2340
30-minute AEGL-3 30-min AEGL-3 = 1810 ppm/3 = 600 ppm (690 mg/m³) 2341
1-hour AEGL-3 1-hour AEGL-3 = 998 ppm/3 = 330 ppm (380 mg/m³) 2342
4-hour AEGL-3 4-hour AEGL-3 = 439 ppm/3 = 150 ppm (170 mg/m³) 2343
8-hour AEGL-3 8-hour AEGL-3 = 403 ppm/3 = 130 ppm (150 mg/m³) 2344
The COHb levels corresponding to the AEGL-3 values are given in Table 21 in Appendix B.2345

CARBON MONOXIDE FINAL: 11/2006
69
APPENDIX B2346
Mathematical Model for Calculating COHb and Exposure Concentrations2347
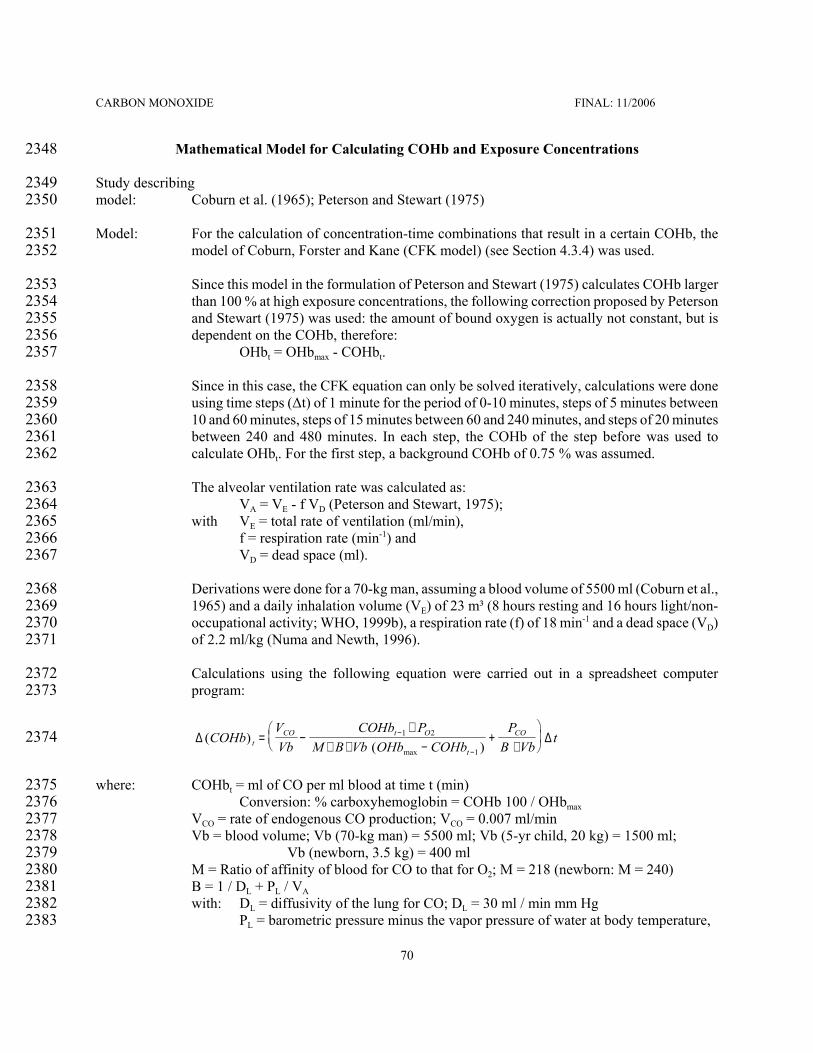
CARBON MONOXIDE FINAL: 11/2006
70
Mathematical Model for Calculating COHb and Exposure Concentrations2348
Study describing 2349model: Coburn et al. (1965); Peterson and Stewart (1975)2350
Model: For the calculation of concentration-time combinations that result in a certain COHb, the2351model of Coburn, Forster and Kane (CFK model) (see Section 4.3.4) was used.2352
Since this model in the formulation of Peterson and Stewart (1975) calculates COHb larger2353than 100 % at high exposure concentrations, the following correction proposed by Peterson2354and Stewart (1975) was used: the amount of bound oxygen is actually not constant, but is2355dependent on the COHb, therefore: 2356
OHbt = OHbmax - COHbt.2357
Since in this case, the CFK equation can only be solved iteratively, calculations were done2358using time steps (∆t) of 1 minute for the period of 0-10 minutes, steps of 5 minutes between235910 and 60 minutes, steps of 15 minutes between 60 and 240 minutes, and steps of 20 minutes2360between 240 and 480 minutes. In each step, the COHb of the step before was used to2361calculate OHbt. For the first step, a background COHb of 0.75 % was assumed.2362
The alveolar ventilation rate was calculated as: 2363VA = VE - f VD (Peterson and Stewart, 1975); 2364
with VE = total rate of ventilation (ml/min), 2365f = respiration rate (min-1) and 2366VD = dead space (ml).2367
Derivations were done for a 70-kg man, assuming a blood volume of 5500 ml (Coburn et al.,23681965) and a daily inhalation volume (VE) of 23 m³ (8 hours resting and 16 hours light/non-2369occupational activity; WHO, 1999b), a respiration rate (f) of 18 min-1 and a dead space (VD)2370of 2.2 ml/kg (Numa and Newth, 1996).2371
Calculations using the following equation were carried out in a spreadsheet computer2372program: 2373
2374 ∆ ∆( )( )max
COHbVVb
COHb PM B Vb OHb COHb
PB Vb
ttCO t O
t
CO= −
∗∗ ∗ −
+∗
−
−
1 2
1
where: COHbt = ml of CO per ml blood at time t (min)2375Conversion: % carboxyhemoglobin = COHb 100 / OHbmax 2376
VCO = rate of endogenous CO production; VCO = 0.007 ml/min2377Vb = blood volume; Vb (70-kg man) = 5500 ml; Vb (5-yr child, 20 kg) = 1500 ml; 2378
Vb (newborn, 3.5 kg) = 400 ml2379M = Ratio of affinity of blood for CO to that for O2; M = 218 (newborn: M = 240)2380B = 1 / DL + PL / VA2381with: DL = diffusivity of the lung for CO; DL = 30 ml / min mm Hg2382
PL = barometric pressure minus the vapor pressure of water at body temperature,2383

CARBON MONOXIDE FINAL: 11/2006
71
PL = 713 mm Hg2384VA = alveolar ventilation rate;2385
VA (70-kg man) = 23 m³/d * 1 " 106 ml/m³ * 1/1440 min/d - 18 /min * 2,2 ml/kg * 70 kg2386VA (70-kg man) = 13200 ml/min2387VA (5-yr child) = 3580 ml/min2388VA (newborn) = 1250 ml/min2389OHbmax = ml of O2 per ml blood under normal conditions; OHb = 0,22390PO2 = average partial pressure of oxygen in the lung capillaries; PO2 = 100 mm Hg2391PCO = partial pressure of CO in the air inhaled (mm Hg);2392
Conversion: PCO (mm Hg) = PCO (ppm) / 13162393t = exposure duration (min)2394

CARBON MONOXIDE FINAL: 11/2006
72
1
10
100 [C
OH
b] (%
)
1 10 100 1.000 Exposure time (min)
3000 2000 15001000
750500300200150
10075
50
30
2015
107.5
FIGURE 4: COHb VS. EXPOSURE TIME PLOTS 2395Data are shown for CO exposure concentrations indicated (70-kg man).2396
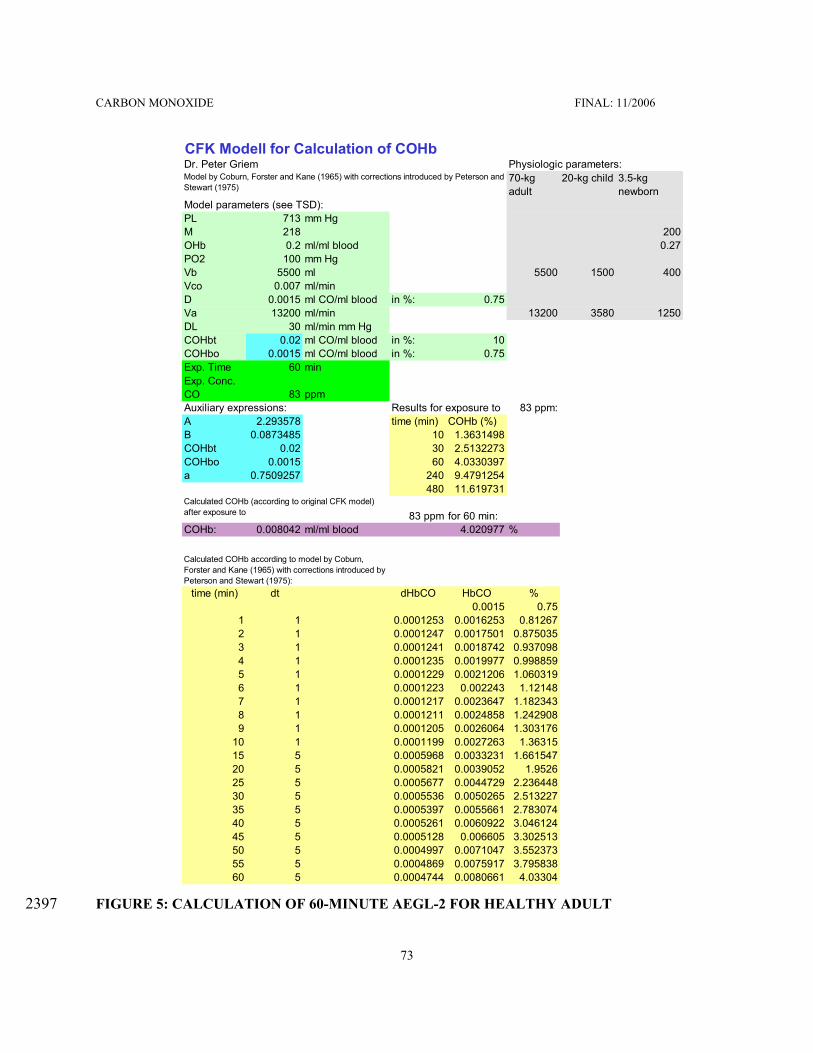
CARBON MONOXIDE FINAL: 11/2006
73
CFK Modell for Calculation of COHbDr. Peter Griem Physiologic parameters:
70-kg adult
20-kg child 3.5-kg newborn
Model parameters (see TSD):PL 713 mm HgM 218 200OHb 0.2 ml/ml blood 0.27PO2 100 mm HgVb 5500 ml 5500 1500 400Vco 0.007 ml/minD 0.0015 ml CO/ml blood in %: 0.75Va 13200 ml/min 13200 3580 1250DL 30 ml/min mm HgCOHbt 0.02 ml CO/ml blood in %: 10COHbo 0.0015 ml CO/ml blood in %: 0.75Exp. Time 60 minExp. Conc. CO 83 ppmAuxiliary expressions: Results for exposure to 83 ppm:A 2.293578 time (min) COHb (%)B 0.0873485 10 1.3631498COHbt 0.02 30 2.5132273COHbo 0.0015 60 4.0330397a 0.7509257 240 9.4791254
480 11.619731
83 ppm for 60 min:COHb: 0.008042 ml/ml blood 4.020977 %
time (min) dt dHbCO HbCO %0.0015 0.75
1 1 0.0001253 0.0016253 0.812672 1 0.0001247 0.0017501 0.8750353 1 0.0001241 0.0018742 0.9370984 1 0.0001235 0.0019977 0.9988595 1 0.0001229 0.0021206 1.0603196 1 0.0001223 0.002243 1.121487 1 0.0001217 0.0023647 1.1823438 1 0.0001211 0.0024858 1.2429089 1 0.0001205 0.0026064 1.303176
10 1 0.0001199 0.0027263 1.3631515 5 0.0005968 0.0033231 1.66154720 5 0.0005821 0.0039052 1.952625 5 0.0005677 0.0044729 2.23644830 5 0.0005536 0.0050265 2.51322735 5 0.0005397 0.0055661 2.78307440 5 0.0005261 0.0060922 3.04612445 5 0.0005128 0.006605 3.30251350 5 0.0004997 0.0071047 3.55237355 5 0.0004869 0.0075917 3.79583860 5 0.0004744 0.0080661 4.03304
Calculated COHb (according to original CFK model) after exposure to
Model by Coburn, Forster and Kane (1965) with corrections introduced by Peterson and Stewart (1975)
Calculated COHb according to model by Coburn, Forster and Kane (1965) with corrections introduced by Peterson and Stewart (1975):
FIGURE 5: CALCULATION OF 60-MINUTE AEGL-2 FOR HEALTHY ADULT 2397

CARBON MONOXIDE FINAL: 11/2006
74
Calculations: For the derivation of AEGL-2 values, exposure concentrations were calculated that would2398result in a COHb of 4 %. A representation of the spreadsheet for the 60-minute AEGL-2 is2399shown in Figure 5. Results are shown in the following Table 18.2400
TABLE 18: CONCENTRATION-TIME COMBINATIONS RESULTING IN 4 % COHb2401Exposure time (min)2402 for a 70-kg adult man
exposure concentration (ppm) exposure concentration (ppm),rounded
102403 424 420
302404 150 150
602405 83 83
2402406 33 33
4802407 27 27
For children, newborns and adult smokers, the end-of-exposure COHb values for exposure2408to the concentrations calculated in Table 18 were computed using the CFK model:2409
TABLE 19: COHb VALUES FOR AEGL-2 CONCENTRATION-TIME COMBINATIONS IN2410DIFFERENT SUBPOPULATIONS2411
Exposure2412time (min)2413
Exposureconcentration (ppm)
5-yrChild
Newborn Healthy adult Smoker (3 %COHb)
Smoker (8 %COHb)
102414 420 5.2 5.5 4.0 6.2 11.2
302415 150 5.2 5.6 4.0 6.3 11.3
602416 83 5.2 5.6 4.0 6.4 11.4
2402417 33 5.0 5.4 4.0 6.6 11.5
4802418 27 4.9 5.3 4.0 6.7 11.5
2419
For the derivation of AEGL-3 values, exposure concentrations were calculated that would2420result in a COHb of 40 %. A representation of the spreadsheet for the 60-minute value is2421shown in Figure 6. Results are shown in the following Table 20.2422

CARBON MONOXIDE FINAL: 11/2006
75
TABLE 20: CONCENTRATION-TIME COMBINATIONS RESULTING IN 40 % COHb2423Exposure time (min)2424 for a 70-kg adult man
exposure concentration (ppm) exposure concentration (ppm),rounded
102425 5120 5100
302426 1810 1800
602427 998 1000
2402428 439 440
4802429 403 400
For children, newborns, healthy non-smoking adults and smokers, the end-of-exposure COHb values2430for exposure to the AEGL-3 exposure concentration-time combinations were computed using the2431CFK model. For all subpopulations, the endogenous CO production rate was adjusted so that the2432starting level of 0.75 % for children and newborn and 3 and 8 % for smokers were constant without2433additional CO exposure.2434
TABLE 21: COHb VALUES FOR AEGL-3 CONCENTRATION-TIME COMBINATIONS IN2435DIFFERENT SUBPOPULATIONS2436
Exposure2437time (min)2438
Exposureconcentration (ppm)
5-yrChild
Newborn Healthyadult
Smoker (3 % COHb)
Smoker (8 % COHb)
102439 1700 18.7 19.9 13.8 16.1 21.1
302440 600 18.5 19.8 14.0 16.2 21.1
602441 330 18.3 19.6 14.1 16.4 21.2
2402442 150 18.6 20.1 16.4 18.6 22.7
4802443 130 18.1 19.5 17.2 19.2 23.0

CARBON MONOXIDE FINAL: 11/2006
76
CFK Modell for Calculation of COHbDr. Peter Griem Physiologic parameters:
70-kg adult
20-kg child 3.5-kg newborn
Model parameters (see TSD):PL 713 mm HgM 218 200OHb 0.2 ml/ml blood 0.27PO2 100 mm HgVb 5500 ml 5500 1500 400Vco 0.007 ml/minD 0.0015 ml CO/ml blood in %: 0.75Va 13200 ml/min 13200 3580 1250DL 30 ml/min mm HgCOHbt 0.02 ml CO/ml blood in %: 10COHbo 0.0015 ml CO/ml blood in %: 0.75Exp. Time 60 minExp. Conc. CO 998 ppmAuxiliary expressions: Results for exposure to 998 ppm:A 2.293578 time (min) COHb (%)B 0.0873485 10 8.4349598COHbt 0.02 30 22.664894COHbo 0.0015 60 40.019622a 0.7509257 240 62.314719
480 62.3289
998 ppm for 60 min:COHb: 0.0835478 ml/ml blood 41.773906 %
time (min) dt dHbCO HbCO %0.0015 0.75
1 1 0.0015726 0.0030726 1.5363012 1 0.0015649 0.0046375 2.318763 1 0.0015572 0.0061947 3.0973354 1 0.0015493 0.007744 3.8719835 1 0.0015414 0.0092853 4.6426626 1 0.0015333 0.0108187 5.4093267 1 0.0015252 0.0123439 6.1719328 1 0.001517 0.0138609 6.9304379 1 0.0015087 0.0153696 7.684794
10 1 0.0015003 0.0168699 8.4349615 5 0.0074593 0.0243292 12.164620 5 0.0072379 0.0315671 15.7835525 5 0.0070043 0.0385714 19.2857230 5 0.0067584 0.0453298 22.6648935 5 0.0064999 0.0518297 25.9148540 5 0.0062291 0.0580588 29.0293945 5 0.0059463 0.0640051 32.0025450 5 0.0056522 0.0696572 34.8286255 5 0.0053477 0.075005 37.5024860 5 0.0050343 0.0800392 40.01962
Calculated COHb (according to original CFK model) after exposure to
Model by Coburn, Forster and Kane (1965) with corrections introduced by Peterson and Stewart (1975)
Calculated COHb according to model by Coburn, Forster and Kane (1965) with corrections introduced by Peterson and Stewart (1975):
FIGURE 6: CALCULATION OF 60-MINUTE EXPOSURE CONCENTRATION THAT WOULD2444RESULT IN 40 % COHb IN A HEALTHY ADULT 2445

CARBON MONOXIDE FINAL: 11/2006
77
The following end-of-exposure COHb values were calculated for the series of experiments2446reported by Haldane (1895). Since exposure occurred while the subject was sitting on a2447chair, a ventilation rate of 7.5 l/min was used for the calculation (WHO, 1999b). The2448alveolar ventilation rate was calculated as: 2449VA (70-kg man) = 3600 l/8 h * 1 " 103 ml/l* 1/480 min/8 h - 18 /min * 2,2 ml/kg * 70 kg2450VA (70-kg man) = 4700 ml/min2451
TABLE 22: COMPARISON OF REPORTED AND CALCULATED COHb2452VALUES FOR THE DATA BY HALDANE (1895)2453
Experiment2454No.2455
Concentration(ppm)
Time(min)
COHb measured(%)
COHbcalculated (%)
12456 5000 11.5 not done 22
22457 3900 30.5 39 43
32458 4000 24 27 35
42459 3600 29 37 38
52460 4100 29 35 43
62461 1200 120 37 46
72462 2100 71 49 50
82463 irregular 35 56 -
92464 270 210 14 17
102465 210 240 13 15
112466 460 240 23 30
CARBON MONOXIDE FINAL: 11/2006
78
APPENDIX C2467
Derivation Summary for Carbon Monoxide AEGLs 2468

CARBON MONOXIDE FINAL: 11/2006
79
ACUTE EXPOSURE GUIDELINES FOR CARBON MONOXIDE 2469(CAS NO. 630-08-0)2470
AEGL-1 VALUES247110 minutes2472 30 minutes 1 hour 4 hours 8 hours
N.R.2473 N.R. N.R. N.R. N.R.a N.R., not recommended because susceptible persons may experience more serious effects2474(equivalent to AEGL-2 level) at concentrations, which do not yet cause AEGL-1 effects in the general2475population2476Reference: Not applicable2477
Test Species/Strain/Number: Not applicable / not applicable / not applicable2478Exposure Route/Concentrations/Durations: Not applicable / not applicable / not applicable2479Effects: Not applicable2480Endpoint/Concentration/Rationale: 2481CO is the classical example of a tasteless, non-irritating, odorless and colorless toxic gas. Until very2482severe symptoms occur (inability to walk) none or only nonspecific symptoms were noted in monkeys2483and healthy humans (Haldane, 1895; Purser and Berrill, 1983). In patients with coronary artery2484disease, which constitutes the most susceptible subpopulation, effects, such as significant2485electrocardiogram changes, reduced time to the onset and increased cardiac arrhythmia, start2486occurring at exposure concentrations little higher than current ambient air quality guidelines, e.g. the2487U.S. National Air Quality Guideline of 9 ppm for 8 hours (National Air Pollution Control2488Administration, 1970; FR , 2000; EPA, 2000), the WHO Air Quality Guideline of 10 mg/m³ (9 ppm)2489for 8 hours (based on 2.5 % COHb) (WHO, 1999a) and the designated European Union Limit Value2490of 10 mg/m³ (9 ppm) for 8 hours (EC, 1999). These effects were considered above the AEGL-1 effect2491level and thus would not constitute a suitable basis for the derivation of AEGL-1 values. AEGL-12492values were not recommended because susceptible persons may experience more serious effects2493(equivalent to AEGL-2 level) at concentrations, which do not yet cause AEGL-1 effects in the general2494population.2495In addition, CO exposures encountered frequently in everyday life are at or above the concentration2496range, in which AEGL-1 level would have to be set: smokers have COHb in the range of 3-8 %2497(Radford and Drizd, 1982) and CO concentrations between about 10 and 50 ppm, which can be found2498on heavily traveled roads, inside motor vehicles and in homes with gas-, coal-, wood- or kerosene-2499fired heaters and stoves, correspond to an equilibrium COHb of 1.8-7.5 % (see Figures 2 and 4).2500Uncertainty Factors/Rationale: Not applicable2501Modifying Factor: Not applicable 2502Animal to Human Dosimetric Adjustment: Not applicable 2503Time Scaling: Not applicable2504Data Adequacy: Not applicable2505
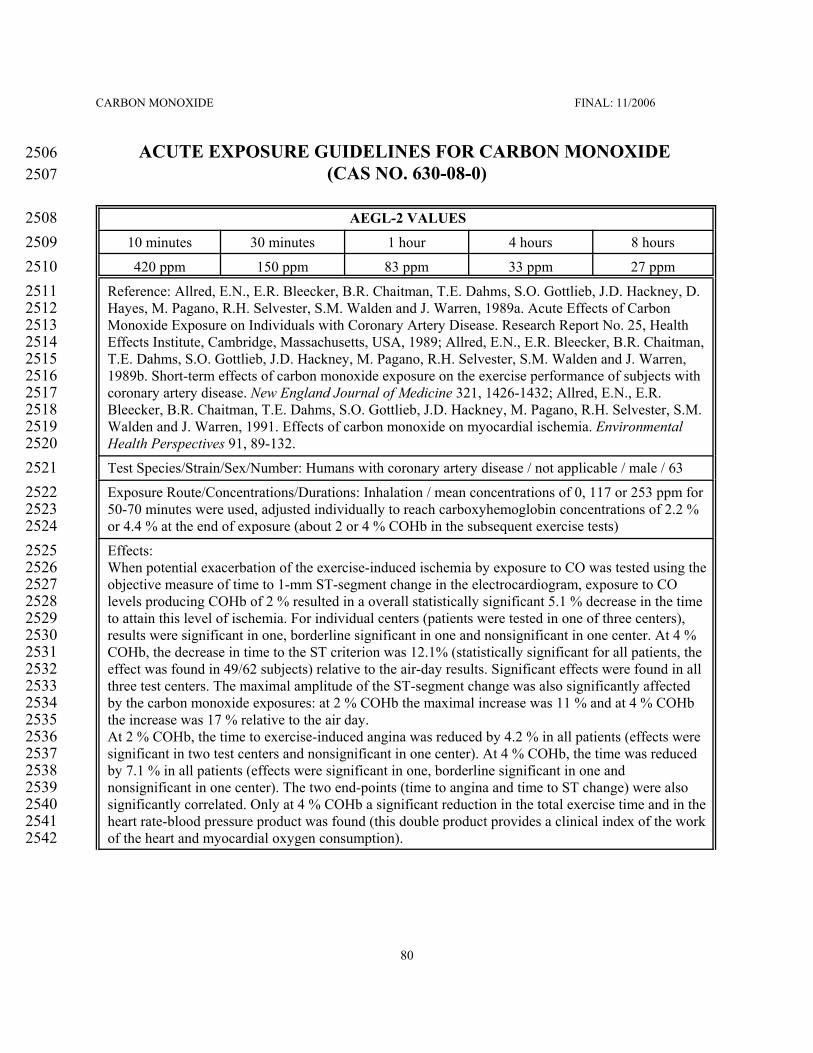
CARBON MONOXIDE FINAL: 11/2006
80
ACUTE EXPOSURE GUIDELINES FOR CARBON MONOXIDE 2506(CAS NO. 630-08-0)2507
AEGL-2 VALUES250810 minutes2509 30 minutes 1 hour 4 hours 8 hours
420 ppm2510 150 ppm 83 ppm 33 ppm 27 ppm
Reference: Allred, E.N., E.R. Bleecker, B.R. Chaitman, T.E. Dahms, S.O. Gottlieb, J.D. Hackney, D.2511Hayes, M. Pagano, R.H. Selvester, S.M. Walden and J. Warren, 1989a. Acute Effects of Carbon2512Monoxide Exposure on Individuals with Coronary Artery Disease. Research Report No. 25, Health2513Effects Institute, Cambridge, Massachusetts, USA, 1989; Allred, E.N., E.R. Bleecker, B.R. Chaitman,2514T.E. Dahms, S.O. Gottlieb, J.D. Hackney, M. Pagano, R.H. Selvester, S.M. Walden and J. Warren,25151989b. Short-term effects of carbon monoxide exposure on the exercise performance of subjects with2516coronary artery disease. New England Journal of Medicine 321, 1426-1432; Allred, E.N., E.R.2517Bleecker, B.R. Chaitman, T.E. Dahms, S.O. Gottlieb, J.D. Hackney, M. Pagano, R.H. Selvester, S.M.2518Walden and J. Warren, 1991. Effects of carbon monoxide on myocardial ischemia. Environmental2519Health Perspectives 91, 89-132. 2520Test Species/Strain/Sex/Number: Humans with coronary artery disease / not applicable / male / 632521Exposure Route/Concentrations/Durations: Inhalation / mean concentrations of 0, 117 or 253 ppm for252250-70 minutes were used, adjusted individually to reach carboxyhemoglobin concentrations of 2.2 %2523or 4.4 % at the end of exposure (about 2 or 4 % COHb in the subsequent exercise tests)2524Effects: 2525When potential exacerbation of the exercise-induced ischemia by exposure to CO was tested using the2526objective measure of time to 1-mm ST-segment change in the electrocardiogram, exposure to CO2527levels producing COHb of 2 % resulted in a overall statistically significant 5.1 % decrease in the time2528to attain this level of ischemia. For individual centers (patients were tested in one of three centers),2529results were significant in one, borderline significant in one and nonsignificant in one center. At 4 %2530COHb, the decrease in time to the ST criterion was 12.1% (statistically significant for all patients, the2531effect was found in 49/62 subjects) relative to the air-day results. Significant effects were found in all2532three test centers. The maximal amplitude of the ST-segment change was also significantly affected2533by the carbon monoxide exposures: at 2 % COHb the maximal increase was 11 % and at 4 % COHb2534the increase was 17 % relative to the air day.2535At 2 % COHb, the time to exercise-induced angina was reduced by 4.2 % in all patients (effects were2536significant in two test centers and nonsignificant in one center). At 4 % COHb, the time was reduced2537by 7.1 % in all patients (effects were significant in one, borderline significant in one and2538nonsignificant in one center). The two end-points (time to angina and time to ST change) were also2539significantly correlated. Only at 4 % COHb a significant reduction in the total exercise time and in the2540heart rate-blood pressure product was found (this double product provides a clinical index of the work2541of the heart and myocardial oxygen consumption).2542

CARBON MONOXIDE FINAL: 11/2006
81
Endpoint/Concentration/Rationale: 2543Patients with coronary artery disease show health effects at lower COHb levels than children,2544pregnant women or healthy adults and, thus, constitute the most susceptible subpopulation. For the2545derivation of AEGL-2 values a level of 4 % COHb was chosen. At this exposure level, patients with2546coronary artery disease may experience a reduced time until onset of angina (chest pain) during2547physical exertion (Allred et al., 1989; 1991). In the available studies, the CO exposure alone (i.e. with2548subjects at rest) did not cause angina, while exercise alone did so. However, it should be noted that all2549studies used patients with stable exertional angina, who did not experience angina while at rest. Thus,2550it cannot be ruled out that in more susceptible individuals (a part of the patients with unstable angina2551pectoris might belong to this group) CO exposure alone could increase angina symptoms. The2552changes in the electrocardiogram (ST-segment depression of 1 mm or greater) associated with angina2553symptoms were considered reversible, but is indicative of clinically relevant myocardial ischemia2554requiring medical treatment. An exposure level of 4 % COHb is unlikely to cause a significant2555increase in the frequency of exercise-induced arrhythmias. Ventricular arrhythmias have been2556observed at COHb of 5.3 %, but not at 3.7 % (Sheps et al., 1990; 1991), while in another study no2557effect of CO exposure on ventricular arrhythmia was found at 3 or 5 % COHb (Dahms et al., 1993).2558An exposure level of 4 % COHb was considered protective of acute neurotoxic effects in children,2559such as syncopes, headache, nausea, dizziness and dyspnea (Klasner et al., 1998; Crocker and Walker,25601985), and long-lasting neurotoxic effects (defects in the cognitive development and behavioral2561alterations) in children (Klees et al., 1985). 2562It is acknowledged that apart from emergency situations, certain scenarios could lead to CO2563concentrations which may cause serious effects in persons with cardiovascular diseases. These2564scenarios include e.g. extended exposure to traffic fume emissions (e.g., in tunnels or inside cars with2565defect car exhaust systems), charcoal or wood fire furnaces, and indoor air pollution by tobacco2566smoking.2567Uncertainty Factors/Rationale: 2568Total uncertainty factor: 12569Interspecies: Not applicable2570Intraspecies: 1 - A level of 4 % COHb was the NOEL for AEGL-2 effects in patients with coronary2571
artery disease, while the LOEL was estimated at 6-9 %. In comparison, the LOEL2572was about 10-15 % in children and 22-25 % in pregnant women. Since AEGL-22573values were based on experimental data on the most susceptible subpopulation, they2574were considered protective also for other subpopulations and a total uncertainty factor2575of 1 was used.2576
Modifying Factor: Not applicable2577Animal to Human Dosimetric Adjustment: Not applicable2578Time Scaling: 2579A mathematical model (Coburn et al., 1965; Peterson and Stewart, 1975) was used to calculate2580exposure concentrations in air resulting in a COHb of 4 % at the end of exposure periods of 10 and 302581minutes and 1, 4 and 8 hours.2582
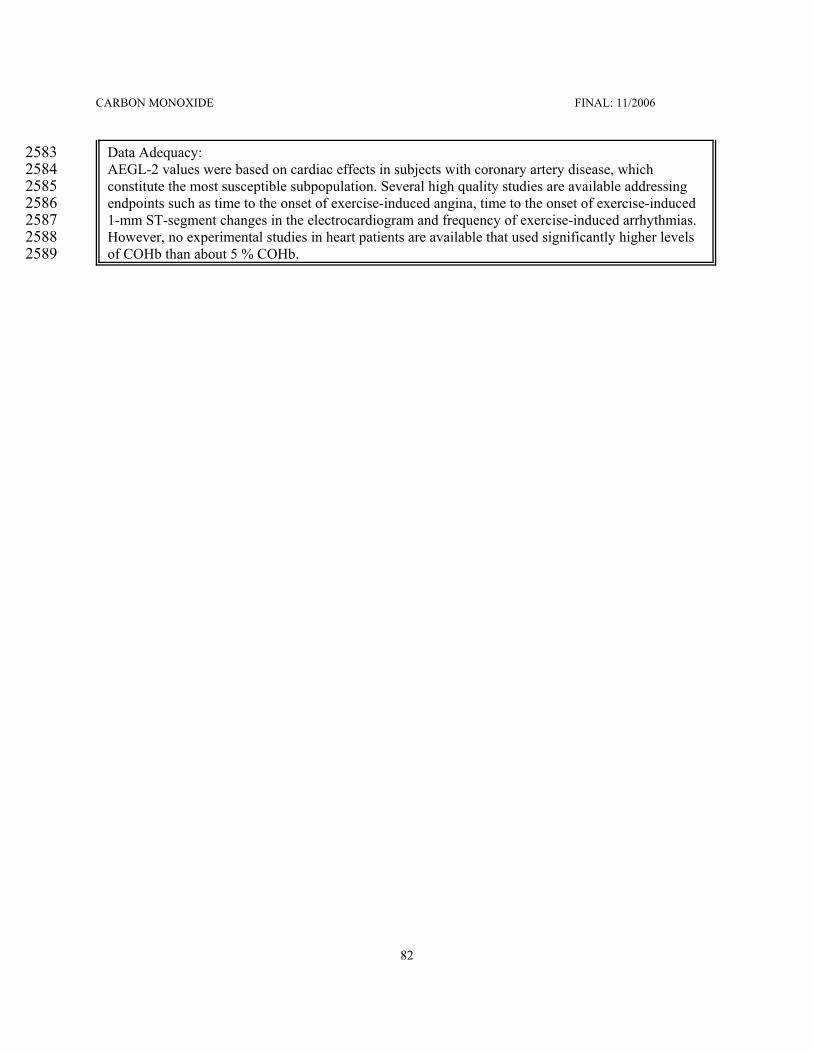
CARBON MONOXIDE FINAL: 11/2006
82
Data Adequacy: 2583AEGL-2 values were based on cardiac effects in subjects with coronary artery disease, which2584constitute the most susceptible subpopulation. Several high quality studies are available addressing2585endpoints such as time to the onset of exercise-induced angina, time to the onset of exercise-induced25861-mm ST-segment changes in the electrocardiogram and frequency of exercise-induced arrhythmias.2587However, no experimental studies in heart patients are available that used significantly higher levels2588of COHb than about 5 % COHb. 2589

CARBON MONOXIDE FINAL: 11/2006
83
ACUTE EXPOSURE GUIDELINES FOR CARBON MONOXIDE 2590(CAS NO. 630-08-0)2591
AEGL-3 VALUES259210 minutes2593 30 minutes 1 hour 4 hours 8 hours
1700 ppm2594 600 ppm 330 ppm 150 ppm 130 ppm
Reference: Pach, J., L. Cholewa, Z. Marek, M. Bogusz and B. Groszek, 1978. Analysis of predictive2595factors in acute carbon monoxide poisoning. Veterinary and Human Toxicology 21 Suppl, 158-159;2596Pach, J., L. Cholewa, Z. Marek, M. Bogusz and B. Groszek, 1978. Various factors influencing the2597clinical picture and mortality in acute carbon monoxide poisoning [in Polish]. Folia Medica2598Cracoviensia, 20, 159-168; Chiodi, H., D.B. Dill, F. Consolazio and S.M. Horvath, 1941. Respiratory2599and circulatory responses to acute carbon monoxide poisoning. American Journal of Physiology 134,2600683-693; Haldane, J., 1895. The action of carbonic acid on man. Journal of Physiology 18, 430-462;2601Henderson, Y., H.W. Haggard, M.C. Teague, A.L. Prince and R.M. Wunderlich, 1921. Physiological2602effects of automobile exhaust gas and standards of ventilation for brief exposures. Journal of2603Industrial Hygiene 3, 79-92.2604Test Species/Strain/Sex/Number: Pach et al. (1978; 1979): Lethal cases (60 men and 41 women, mean2605age 48 ±15 years); non-lethal cases 220 subjects (95 men and 125 women, mean age 38 ±18 years) /2606not applicable / males and females / 321 (total)2607Chiodi et al. (1941), Haldane (1895), Henderson et al. (1921): Humans (healthy young males) / not2608applicable / males / 4 (total) 2609Exposure Route/Concentrations/Durations: Inhalation / Pach et al. (1978; 1979) analyzed COHb in2610deceased subjects and in surviving patients that had been transported to hospital within 2 hours; for2611the latter end of exposure COHb were calculated; Chiodi et al. (1941): repeated test on three subjects2612that reached COHb of 27-52% at the end of exposure; individual COHb values were 31, 32, 32, 33,261339, 41, 42, 43, 45 and 52 % in subject H.C., 27, 35, 41, 43 and 48 % in subject F.C. and 41, 42 and 442614% in subject S.H.; Haldane (1895): repeated exposure of one subject reaching the following COHb at2615the end of exposure (time in min): 13 % (240 min), 14 % (210 min), 23 % (240 min), 27 % (24 min),261635 % (29 min), 37 % (29 min), 37 % (120 min), 39 % (30.5 min), 49 % (71 min), 56 % (35 min). 2617Effects: Pach et al. (1978; 1979) reported that only about 2 % of subjects that had died from CO2618poisoning had COHb levels below 40 %. Of the patients that survived about 16 % had a COHb above261940 %. In the experimental studies, no severe or life-threatening symptoms occurred. At a COHb of2620about 40-56 %, Haldane (1895) described symptoms included hyperpnea, confusion of mind, dim2621vision and unsteady/inability to walk. Chiodi et al. (1941) found no effect on oxygen consumption,2622ventilation, pulse rate, blood pressure and blood pH; the cardiac output increased 20-50 % at COHb2623>40 %, while the changes were negligible at COHb of <30 %.2624
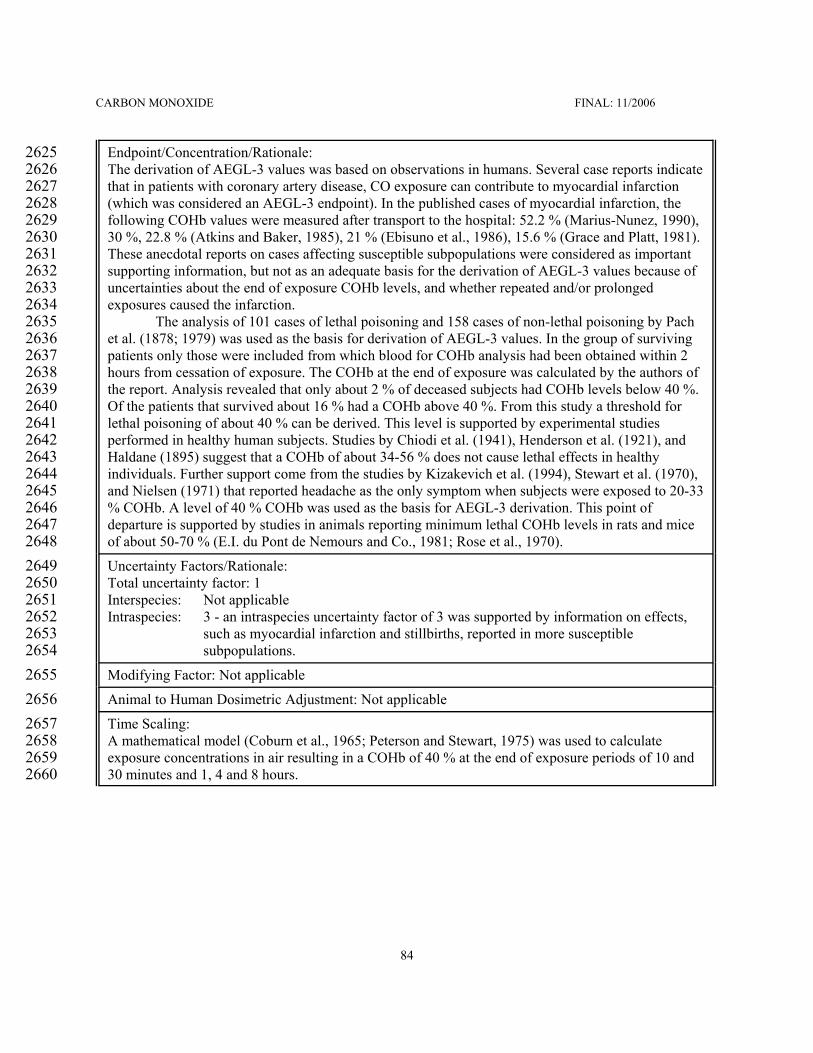
CARBON MONOXIDE FINAL: 11/2006
84
Endpoint/Concentration/Rationale: 2625The derivation of AEGL-3 values was based on observations in humans. Several case reports indicate2626that in patients with coronary artery disease, CO exposure can contribute to myocardial infarction2627(which was considered an AEGL-3 endpoint). In the published cases of myocardial infarction, the2628following COHb values were measured after transport to the hospital: 52.2 % (Marius-Nunez, 1990),262930 %, 22.8 % (Atkins and Baker, 1985), 21 % (Ebisuno et al., 1986), 15.6 % (Grace and Platt, 1981).2630These anecdotal reports on cases affecting susceptible subpopulations were considered as important2631supporting information, but not as an adequate basis for the derivation of AEGL-3 values because of2632uncertainties about the end of exposure COHb levels, and whether repeated and/or prolonged2633exposures caused the infarction. 2634
The analysis of 101 cases of lethal poisoning and 158 cases of non-lethal poisoning by Pach2635et al. (1878; 1979) was used as the basis for derivation of AEGL-3 values. In the group of surviving2636patients only those were included from which blood for COHb analysis had been obtained within 22637hours from cessation of exposure. The COHb at the end of exposure was calculated by the authors of2638the report. Analysis revealed that only about 2 % of deceased subjects had COHb levels below 40 %.2639Of the patients that survived about 16 % had a COHb above 40 %. From this study a threshold for2640lethal poisoning of about 40 % can be derived. This level is supported by experimental studies2641performed in healthy human subjects. Studies by Chiodi et al. (1941), Henderson et al. (1921), and2642Haldane (1895) suggest that a COHb of about 34-56 % does not cause lethal effects in healthy2643individuals. Further support come from the studies by Kizakevich et al. (1994), Stewart et al. (1970),2644and Nielsen (1971) that reported headache as the only symptom when subjects were exposed to 20-332645% COHb. A level of 40 % COHb was used as the basis for AEGL-3 derivation. This point of2646departure is supported by studies in animals reporting minimum lethal COHb levels in rats and mice2647of about 50-70 % (E.I. du Pont de Nemours and Co., 1981; Rose et al., 1970).2648Uncertainty Factors/Rationale: 2649Total uncertainty factor: 12650Interspecies: Not applicable2651Intraspecies: 3 - an intraspecies uncertainty factor of 3 was supported by information on effects,2652
such as myocardial infarction and stillbirths, reported in more susceptible2653subpopulations.2654
Modifying Factor: Not applicable2655Animal to Human Dosimetric Adjustment: Not applicable2656Time Scaling: 2657A mathematical model (Coburn et al., 1965; Peterson and Stewart, 1975) was used to calculate2658exposure concentrations in air resulting in a COHb of 40 % at the end of exposure periods of 10 and265930 minutes and 1, 4 and 8 hours.2660

CARBON MONOXIDE FINAL: 11/2006
85
Data Adequacy: 2661AEGL-3 values were based analysis of clinical cases of lethal and non-lethal poisoning as well as on2662old experimental studies in which healthy subjects were exposed to COHb of up to 40-56 %. The2663AEGL-3 values derived using an intraspecies uncertainty factor of 3 (corresponding to an COHb of2664about 15 %) are supported by the available case reports of lethal effects (myocardial infarction,2665stillbirths) in more susceptible subpopulations. Lethal effects from myocardial infarction in2666hypersusceptible patients with coronary artery disease at even lower CO concentrations, which could2667be at the upper end of the range of CO concentrations found inside buildings and in ambient air2668outside, cannot be excluded.2669