Embed Size (px)
Citation preview

Oregon Public Health Division
User Guide
Acute and Communicable Disease Prevention
Version 1 June 2014
2
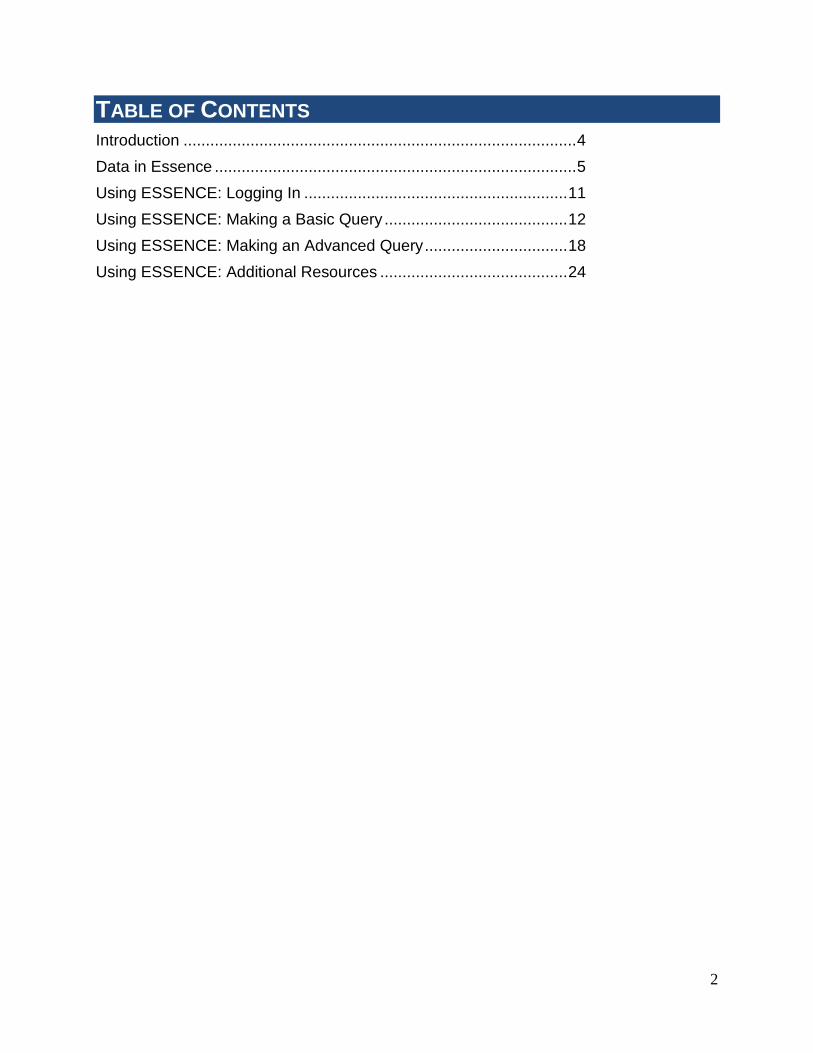
TABLE OF CONTENTS Introduction ........................................................................................ 4
Data in Essence ................................................................................. 5
Using ESSENCE: Logging In ........................................................... 11
Using ESSENCE: Making a Basic Query ......................................... 12
Using ESSENCE: Making an Advanced Query ................................ 18
Using ESSENCE: Additional Resources .......................................... 24
3
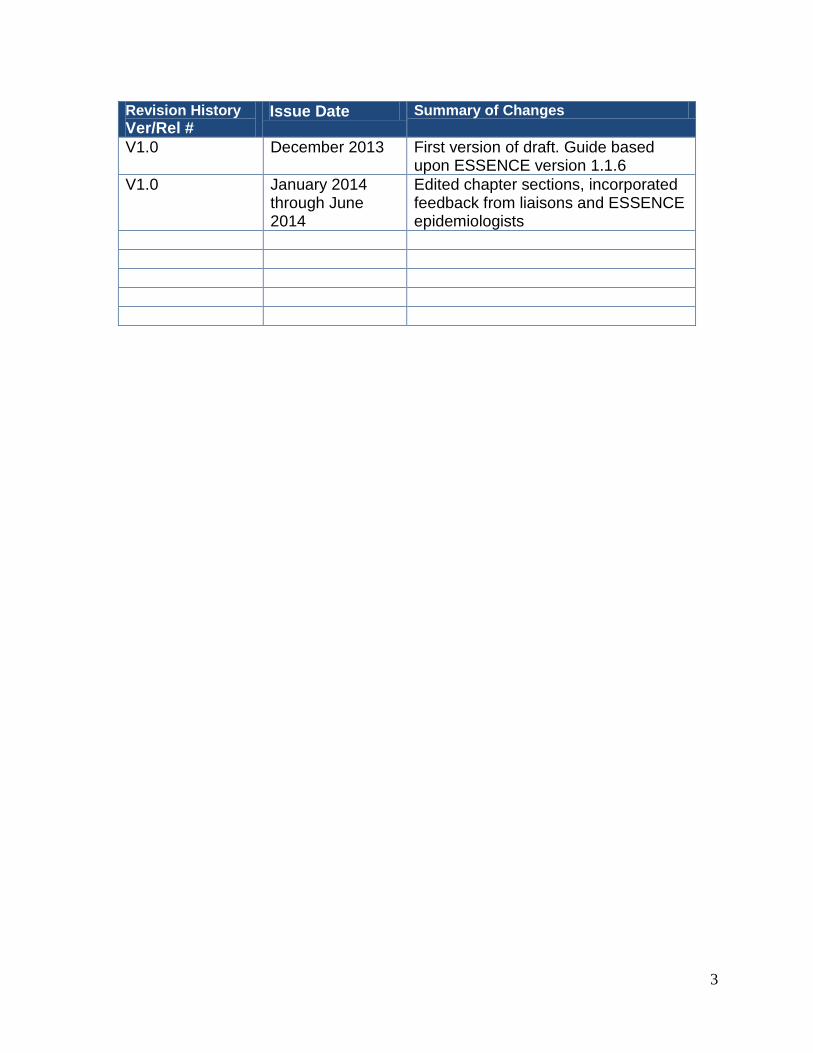
Revision History Ver/Rel #
Issue Date Summary of Changes
V1.0 December 2013 First version of draft. Guide based upon ESSENCE version 1.1.6
V1.0 January 2014 through June 2014
Edited chapter sections, incorporated feedback from liaisons and ESSENCE epidemiologists
4
INTRODUCTION
NOTE
When would I use ESSENCE? To support situational awareness Health validation or verification Outbreak investigation Detect or monitor individual cases of reportable disease
This user guide is intended to provide an overview of the most common functions of the Oregon Electronic Surveillance System for the Early Notification of Community-based Epidemics (ESSENCE). The manual provides a basic step-by-step introduction to navigating through the ESSENCE system by running queries. To obtain ESSENCE access, please contact ESSENCE Help at [email protected].
What are the public health uses of ESSENCE? ESSENCE is a syndromic surveillance application which will help Oregon epidemiologists:
• Support situational awareness through tracking geographic spread, detect peak, identify high-risk groups
• Health event validation or verification by using ED visits to verify or refute suspicion of community-wide outbreak
• Outbreak investigation • Detect or monitor individual cases of reportable diseases
What is syndromic surveillance? It is real-time collection, analysis, interpretation and dissemination of health data. It is not based on laboratory confirmed diagnosis of a disease but disease “syndrome”. ESSENCE shows changes in ED visits with statistical alerts. These alerts indicate that there are more visits than expected. ESSENCE also allows you to query visits by a chief complaint syndrome, specific chief complaints or triage notes. When did syndromic surveillance come to Oregon? Several hospitals started providing data in 2012 and the Oregon ESSENCE system went live in 2013. We anticipate that by 2016 we should have near or complete state-wide coverage. What’s the history of ESSENCE? In the early 2000’s, The Johns Hopkins University Applied Physics Laboratory (JHU/APL) began a collaborative biosurveillance project with Maryland and the Walter Reed Army Institute for Research. In 2004 the military assumed the responsibility for the military version of ESSENCE. JHU/APL has continued to maintain and develop the civilian version of ESSENCE. Other states that use ESSENCE include Washington, Florida, Maryland, and Missouri.
5
DATA IN ESSENCE Objective 1: User will know what type of data are available in ESSENCE. Objective 2: User will be able to distinguish between a Syndrome and Subsyndrome. Objective 3: User will be able to compare and contrasts Chief Complaints and triage notes.
NOTE
ESSENCE Data • Emergency
Departments • Orpheus • Poison Center • Vital Records
What data are in ESSENCE? Oregon ESSENCE houses data from four sources: emergency departments (ED), communicable disease (Orpheus) data, Oregon Poison Control Data and Vital Records. ED Data The syndromic classification of emergency department (ED) data in ESSENCE is based on the patient’s chief complaint, which is generally some variation on what the patient provided as the reason for visiting the ED.
Although chief complaints may include misspelled words and/or medical short-hand, the language-parsing algorithms in ESSENCE include a large number of common misspellings and medical shorthand terms and often correct for these mistakes. Whenever available we ask that hospitals send us the free text chief complaints. With few exceptions, ED data are sent to Oregon ESSENCE daily at 4:00 a.m. through the hospitals’ electronic health record systems connected with ESSENCE. Data are available on the weekends, holidays, and after hours. Data from ESSENCE are available for download and analysis. There are many data elements included in ESSENCE. See the next page for many of the common data elements you will see in ESSENCE.
6
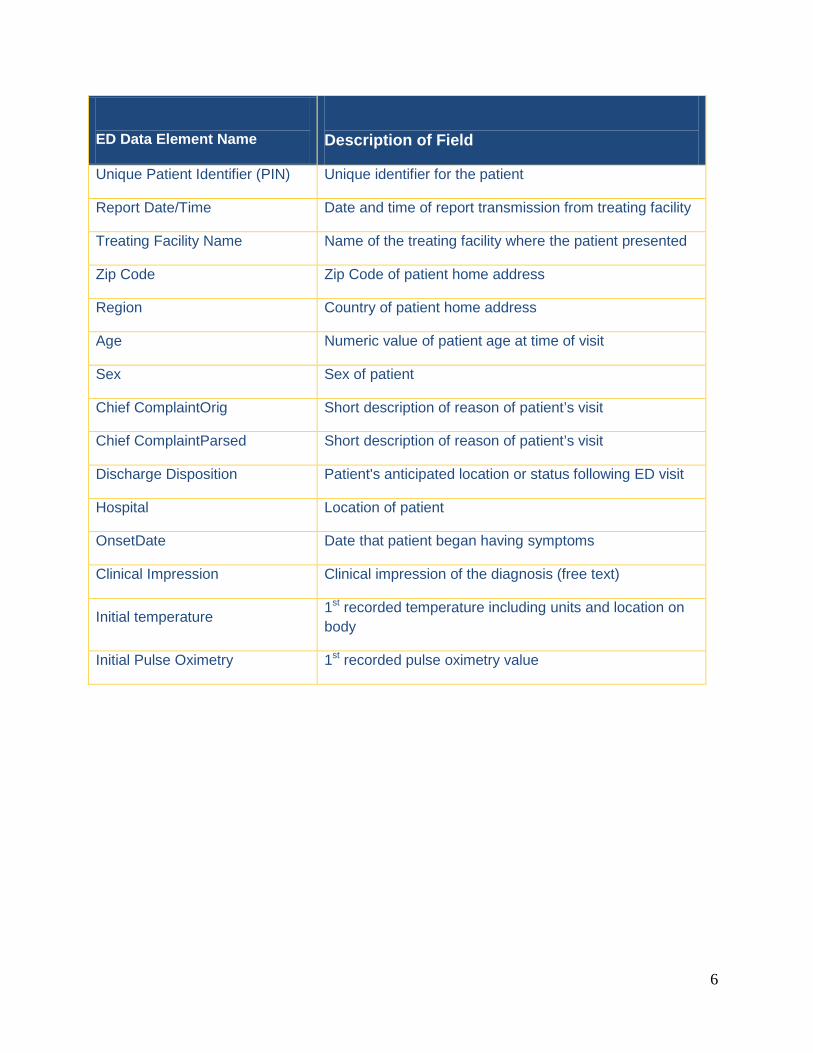
ED Data Element Name
Description of Field
Unique Patient Identifier (PIN) Unique identifier for the patient
Report Date/Time Date and time of report transmission from treating facility
Treating Facility Name Name of the treating facility where the patient presented
Zip Code Zip Code of patient home address
Region Country of patient home address
Age Numeric value of patient age at time of visit
Sex Sex of patient
Chief ComplaintOrig Short description of reason of patient’s visit
Chief ComplaintParsed Short description of reason of patient’s visit
Discharge Disposition Patient's anticipated location or status following ED visit
Hospital Location of patient
OnsetDate Date that patient began having symptoms
Clinical Impression Clinical impression of the diagnosis (free text)
Initial temperature 1st recorded temperature including units and location on body
Initial Pulse Oximetry 1st recorded pulse oximetry value

7
Subsyndromes are just smaller groups of chief complaint terms that get at a specific symptom. They are grouped together to form syndromes, which define a range of symptoms.
NOTE
Orpheus Data Oregon communicable disease data is from Orpheus, the state’s reportable disease database. Orpheus tracks person characteristics including age, gender, race/ethnicity and other key demographic information. It also includes pertinent information about reportable disease cases including date of report, type of test, case status, etc. Orpheus data imported into ESSENCE do not include names, dates of birth or case identifiers. Only users with access to Orpheus may view Orpheus data in ESSENCE. Poison Center Data Oregon Poison Center (OPC) also provides data to ESSENCE including time, de-identified personal information, place, substances, substance categories, clinical effects, exposure type, and clinical management. These data have been used to provide situational awareness as it relates to chemical substance exposures in Oregon, detect outbreaks associated with exposures to various chemical substances, and monitor individual cases of some reportable diseases (e.g. carbon monoxide poisoning, pesticide poisoning). These data are accessible only by ESSENCE epidemiologists.
Elements of ESSENCE Data Data from ESSENCE are available for download and analysis. ESSENCE can also be used to create charts and maps. Users can also search for specific chief complaints or search within triage note terms. Basic building blocks of ESSENCE: Syndromes and Subsyndromes Chief Complaint Syndromes are the most important tools in ESSENCE for syndromic surveillance. There are 12 Syndrome categories in ESSENCE, which can be used for searching Chief Complaint text. See the following page for a complete list of syndromes. Most syndromes are comprised of smaller groupings called Subsyndromes. See the following page for a complete list of subsydromes.
Vital Records The Oregon center for Health Statistics provides data to ESSENCE about deaths. The information includes cause of death, date, age, sex, race/ethnicity, and the type of injury. Vital records data imported into ESSENCE do not contain names, date of birth or individual identifiers. These data are accessible only by ESSENCE epidemiologists.
8
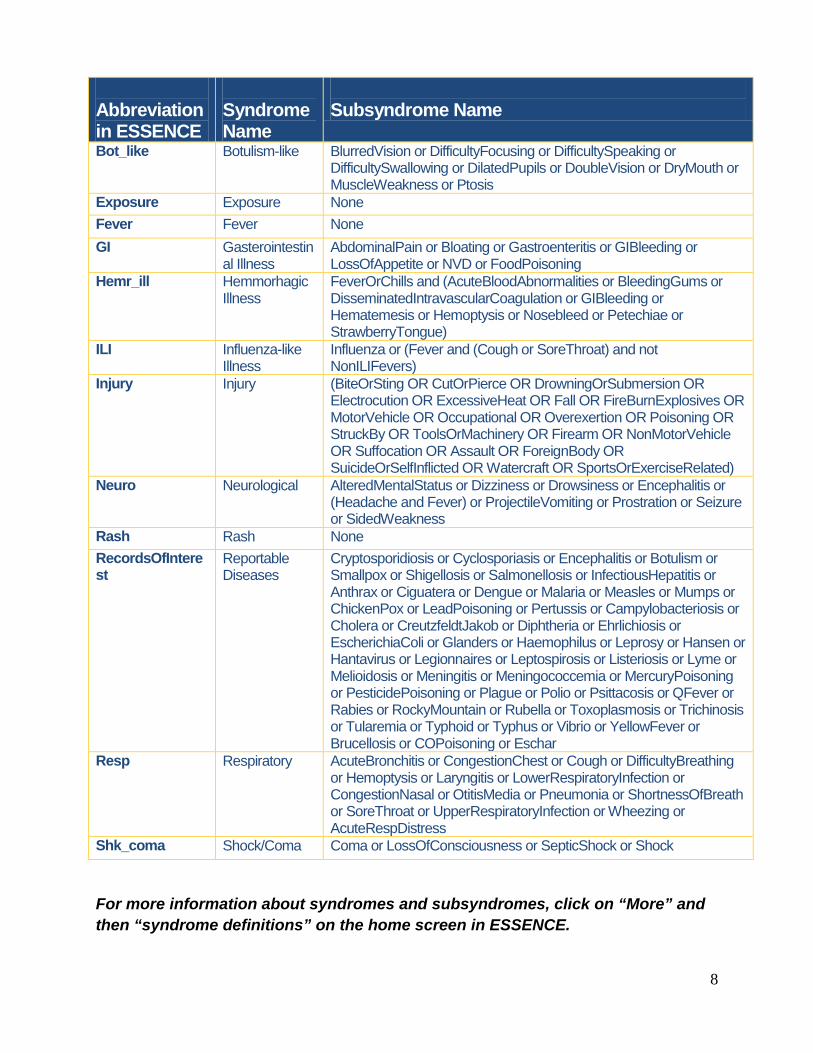
For more information about syndromes and subsyndromes, click on “More” and then “syndrome definitions” on the home screen in ESSENCE.
Abbreviation in ESSENCE
Syndrome Name
Subsyndrome Name
Bot_like Botulism-like BlurredVision or DifficultyFocusing or DifficultySpeaking or DifficultySwallowing or DilatedPupils or DoubleVision or DryMouth or MuscleWeakness or Ptosis
Exposure Exposure None Fever Fever None GI Gasterointestin
al Illness AbdominalPain or Bloating or Gastroenteritis or GIBleeding or LossOfAppetite or NVD or FoodPoisoning
Hemr_ill Hemmorhagic Illness
FeverOrChills and (AcuteBloodAbnormalities or BleedingGums or DisseminatedIntravascularCoagulation or GIBleeding or Hematemesis or Hemoptysis or Nosebleed or Petechiae or StrawberryTongue)
ILI Influenza-like Illness
Influenza or (Fever and (Cough or SoreThroat) and not NonILIFevers)
Injury Injury (BiteOrSting OR CutOrPierce OR DrowningOrSubmersion OR Electrocution OR ExcessiveHeat OR Fall OR FireBurnExplosives OR MotorVehicle OR Occupational OR Overexertion OR Poisoning OR StruckBy OR ToolsOrMachinery OR Firearm OR NonMotorVehicle OR Suffocation OR Assault OR ForeignBody OR SuicideOrSelfInflicted OR Watercraft OR SportsOrExerciseRelated)
Neuro Neurological AlteredMentalStatus or Dizziness or Drowsiness or Encephalitis or (Headache and Fever) or ProjectileVomiting or Prostration or Seizure or SidedWeakness
Rash Rash None RecordsOfInterest
Reportable Diseases
Cryptosporidiosis or Cyclosporiasis or Encephalitis or Botulism or Smallpox or Shigellosis or Salmonellosis or InfectiousHepatitis or Anthrax or Ciguatera or Dengue or Malaria or Measles or Mumps or ChickenPox or LeadPoisoning or Pertussis or Campylobacteriosis or Cholera or CreutzfeldtJakob or Diphtheria or Ehrlichiosis or EscherichiaColi or Glanders or Haemophilus or Leprosy or Hansen or Hantavirus or Legionnaires or Leptospirosis or Listeriosis or Lyme or Melioidosis or Meningitis or Meningococcemia or MercuryPoisoning or PesticidePoisoning or Plague or Polio or Psittacosis or QFever or Rabies or RockyMountain or Rubella or Toxoplasmosis or Trichinosis or Tularemia or Typhoid or Typhus or Vibrio or YellowFever or Brucellosis or COPoisoning or Eschar
Resp Respiratory AcuteBronchitis or CongestionChest or Cough or DifficultyBreathing or Hemoptysis or Laryngitis or LowerRespiratoryInfection or CongestionNasal or OtitisMedia or Pneumonia or ShortnessOfBreath or SoreThroat or UpperRespiratoryInfection or Wheezing or AcuteRespDistress
Shk_coma Shock/Coma Coma or LossOfConsciousness or SepticShock or Shock
9
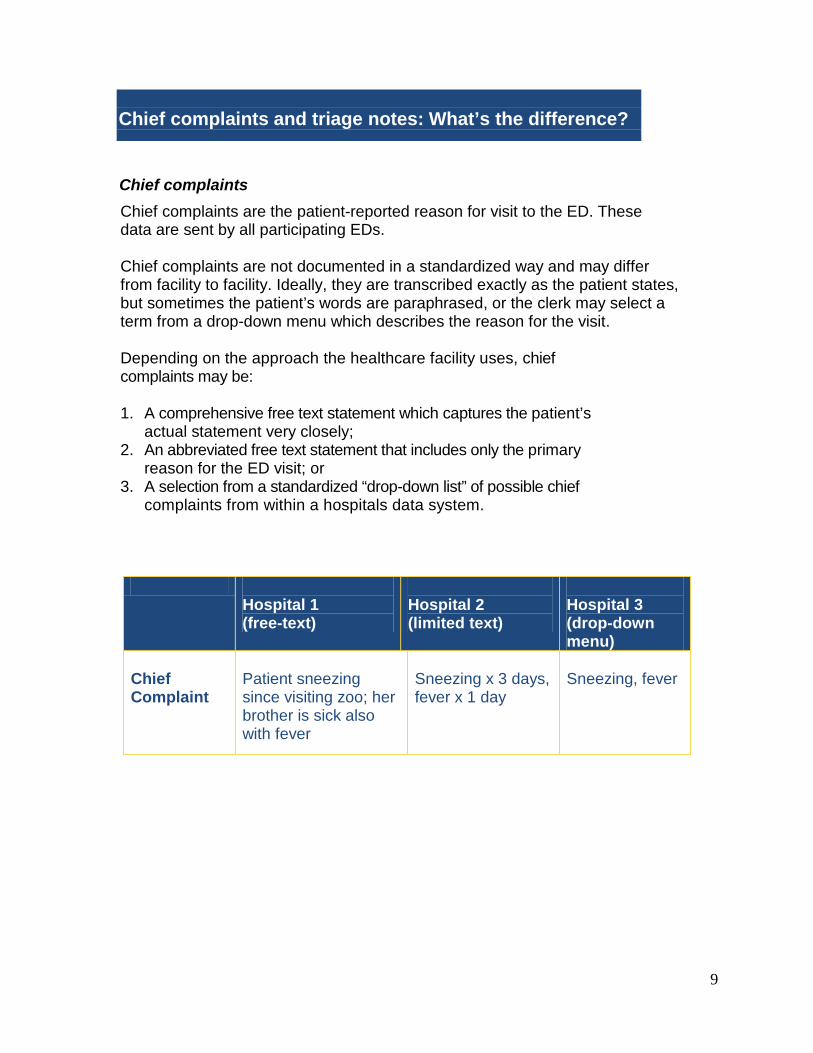
Hospital 1 (free-text)
Hospital 2 (limited text)
Hospital 3 (drop-down menu)
Chief Complaint
Patient sneezing since visiting zoo; her brother is sick also with fever
Sneezing x 3 days, fever x 1 day
Sneezing, fever
Chief complaints are the patient-reported reason for visit to the ED. These data are sent by all participating EDs. Chief complaints are not documented in a standardized way and may differ from facility to facility. Ideally, they are transcribed exactly as the patient states, but sometimes the patient’s words are paraphrased, or the clerk may select a term from a drop-down menu which describes the reason for the visit. Depending on the approach the healthcare facility uses, chief complaints may be: 1. A comprehensive free text statement which captures the patient’s
actual statement very closely; 2. An abbreviated free text statement that includes only the primary
reason for the ED visit; or 3. A selection from a standardized “drop-down list” of possible chief
complaints from within a hospitals data system.
Chief complaints
Chief complaints and triage notes: What’s the difference?
10
Hospital A (free-text)
Hospital B (limited text)
Hospital C (drop-down menu)
Triage Note
Parent states child has been sneezing x 2 days with a little bit of a fever (brother is also ill), and has not been able to sleep.
Respiratory illness, not sleeping
Respiratory illness with fever
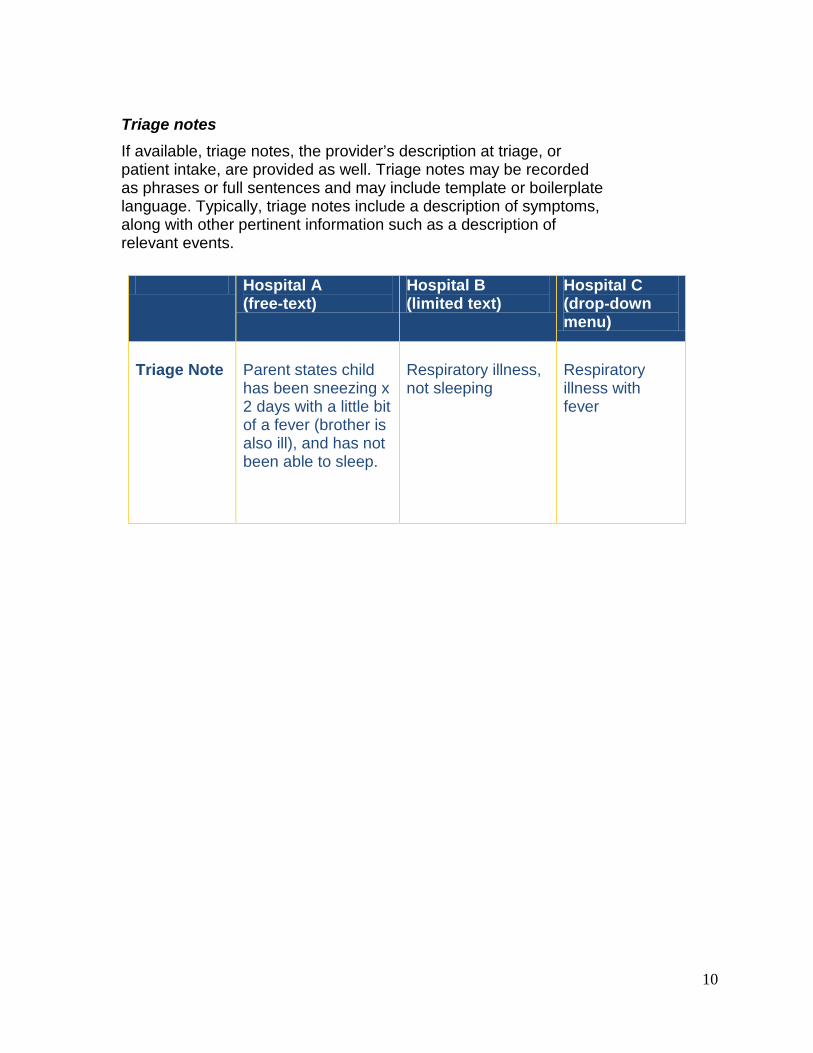
If available, triage notes, the provider’s description at triage, or patient intake, are provided as well. Triage notes may be recorded as phrases or full sentences and may include template or boilerplate language. Typically, triage notes include a description of symptoms, along with other pertinent information such as a description of relevant events.
Triage notes

11
USING ESSENCE: LOGGING IN Objective 1: User will know how to access ESSENCE with a secure password. Objective 2: User will know who to contact with questions.
1. The secure Oregon ESSENCE website can be accessed at
https://ESSENCE.OHA.Oregon.gov.
2. Click the ESSENCE-Oregon hyperlink on the ESSENCE site.
3. When prompted by the dialogue box enter your username and password.
NOTE
Mozilla Firefox is the preferred internet browser for using the ESSENCE application. Formatting and other components of the application may not fully resolve in Internet Explorer. Even if documents in ESSENCE say you can use Internet Explorer, don’t. Use Firefox instead.
4. Click on the “Log In” button to access ESSENCE. If you have any issues, contact [email protected] for assistance.
12
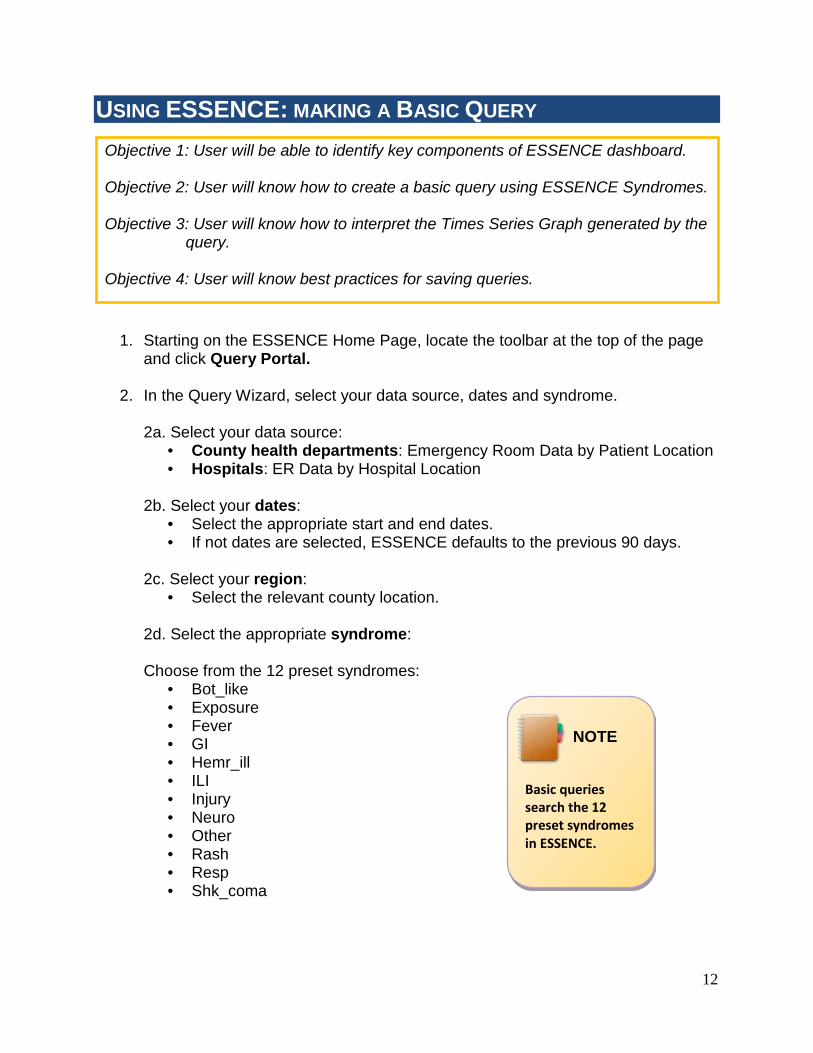
USING ESSENCE: MAKING A BASIC QUERY Objective 1: User will be able to identify key components of ESSENCE dashboard. Objective 2: User will know how to create a basic query using ESSENCE Syndromes. Objective 3: User will know how to interpret the Times Series Graph generated by the
query. Objective 4: User will know best practices for saving queries.
1. Starting on the ESSENCE Home Page, locate the toolbar at the top of the page and click Query Portal.
2. In the Query Wizard, select your data source, dates and syndrome. 2a. Select your data source:
• County health departments: Emergency Room Data by Patient Location • Hospitals: ER Data by Hospital Location
2b. Select your dates:
• Select the appropriate start and end dates. • If not dates are selected, ESSENCE defaults to the previous 90 days.
2c. Select your region:
• Select the relevant county location.
2d. Select the appropriate syndrome: Choose from the 12 preset syndromes:
• Bot_like • Exposure • Fever • GI • Hemr_ill • ILI • Injury • Neuro • Other • Rash • Resp • Shk_coma
NOTE
Basic queries search the 12 preset syndromes in ESSENCE.

13
TIP
When selecting Region (County) and Syndrome, make sure to click “Select” after each choice.
2a. Data Source 2b. Start and end dates
2c. Region = County
2d. Syndromes
14
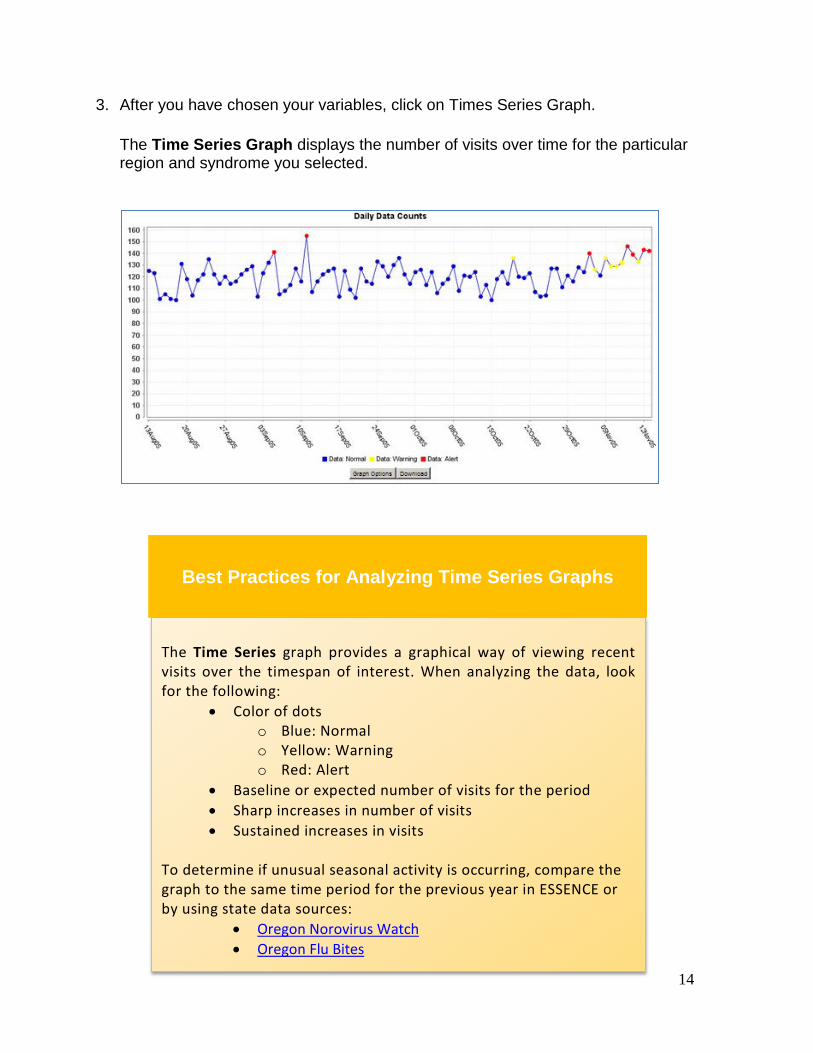
3. After you have chosen your variables, click on Times Series Graph.
The Time Series Graph displays the number of visits over time for the particular region and syndrome you selected.
The Time Series graph provides a graphical way of viewing recent visits over the timespan of interest. When analyzing the data, look for the following:
• Color of dots o Blue: Normal o Yellow: Warning o Red: Alert
• Baseline or expected number of visits for the period • Sharp increases in number of visits • Sustained increases in visits
To determine if unusual seasonal activity is occurring, compare the graph to the same time period for the previous year in ESSENCE or by using state data sources:
• Oregon Norovirus Watch • Oregon Flu Bites
Best Practices for Analyzing Time Series Graphs

15
4. Access Data details. Accessing Data Details is just one way users can drill down into the data. Data details include region, age, sex, chief complaint, and discharge diagnosis. There are three ways to access data details:
To see Data Details for one day, click on any of the colored dots.
To see Data Details for the entire range of dates, click the Data Details hyperlink.
You can also see Data Details for one day by clicking the links in the Data Table.
1
3
2

16
Data Details provide a snapshot into the query you’ve just run. Users new to ESSENCE, and those making Advanced Queries, should get in the habit of reviewing results from their queries using the Data Details tool. When reviewing Data Details, there are two general approach for analyzing the data.
• Specificity versus sensitivity in search terms If your search includes broad or common terms (e.g., abdominal pain, chest pain) you may want to evaluate whether a more specific query would be a better approach. Similarly, if you are getting fewer results than you might expect, maybe you need to add additional terms to your search.
• Similarities in patient age, gender or region Evaluating the descriptive epidemiology can help monitor trends and identify at-risk populations.
Best Practices for Interpreting Data Details

17
5. Save Query. It’s always a good idea to save your query. Type the name of your query and click Save Query.
Next, you will be prompted to decide Query Sharing Options. Simple click the check box next to the name of the person you want to see this query. In this example, I am sharing the query with Kathleen Vidoloff and Theresa Watts.
NOTE
To see all of your saved queries, go to the ESSENCE homepage and click on Query Manager.
18
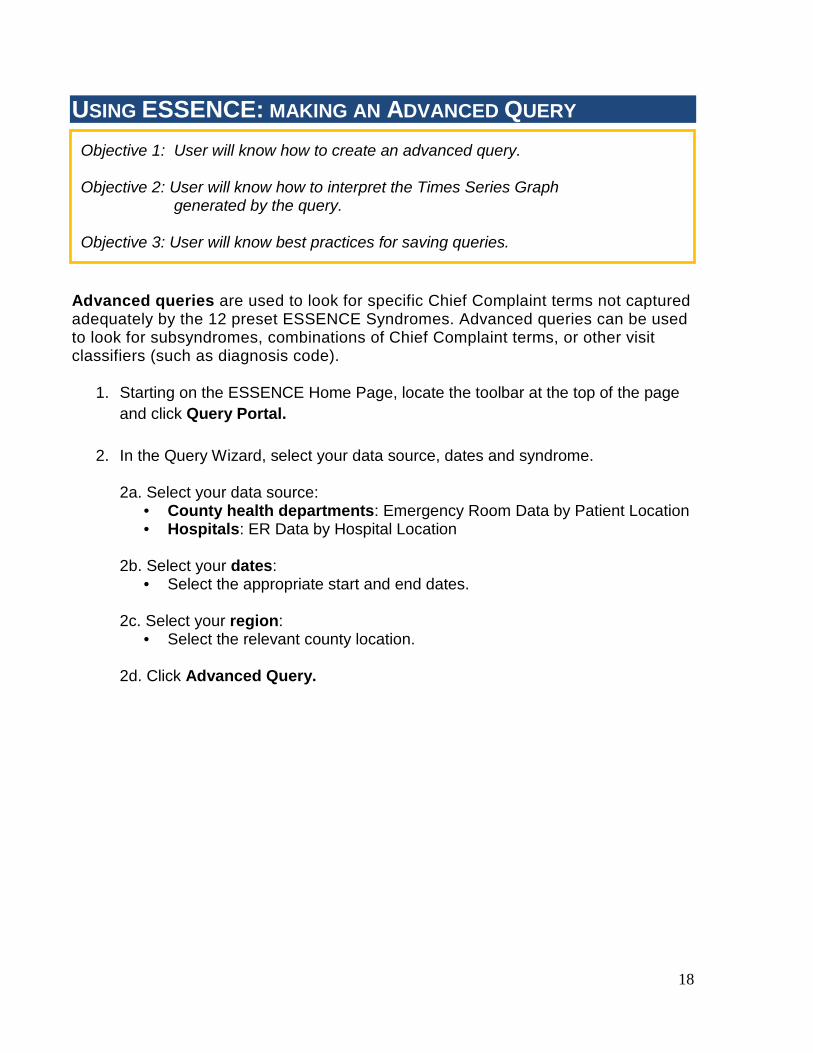
USING ESSENCE: MAKING AN ADVANCED QUERY Objective 1: User will know how to create an advanced query. Objective 2: User will know how to interpret the Times Series Graph generated by the query. Objective 3: User will know best practices for saving queries. Advanced queries are used to look for specific Chief Complaint terms not captured adequately by the 12 preset ESSENCE Syndromes. Advanced queries can be used to look for subsyndromes, combinations of Chief Complaint terms, or other visit classifiers (such as diagnosis code).
1. Starting on the ESSENCE Home Page, locate the toolbar at the top of the page and click Query Portal.
2. In the Query Wizard, select your data source, dates and syndrome. 2a. Select your data source:
• County health departments: Emergency Room Data by Patient Location • Hospitals: ER Data by Hospital Location
2b. Select your dates:
• Select the appropriate start and end dates.
2c. Select your region: • Select the relevant county location.
2d. Click Advanced Query.

19
TIP
When selecting Region (County) and Syndrome, make sure to click “Select” after each choice.
2a. Data Source 2b. Start and end dates
2c. Region = County
2d. Click Advanced Query
20
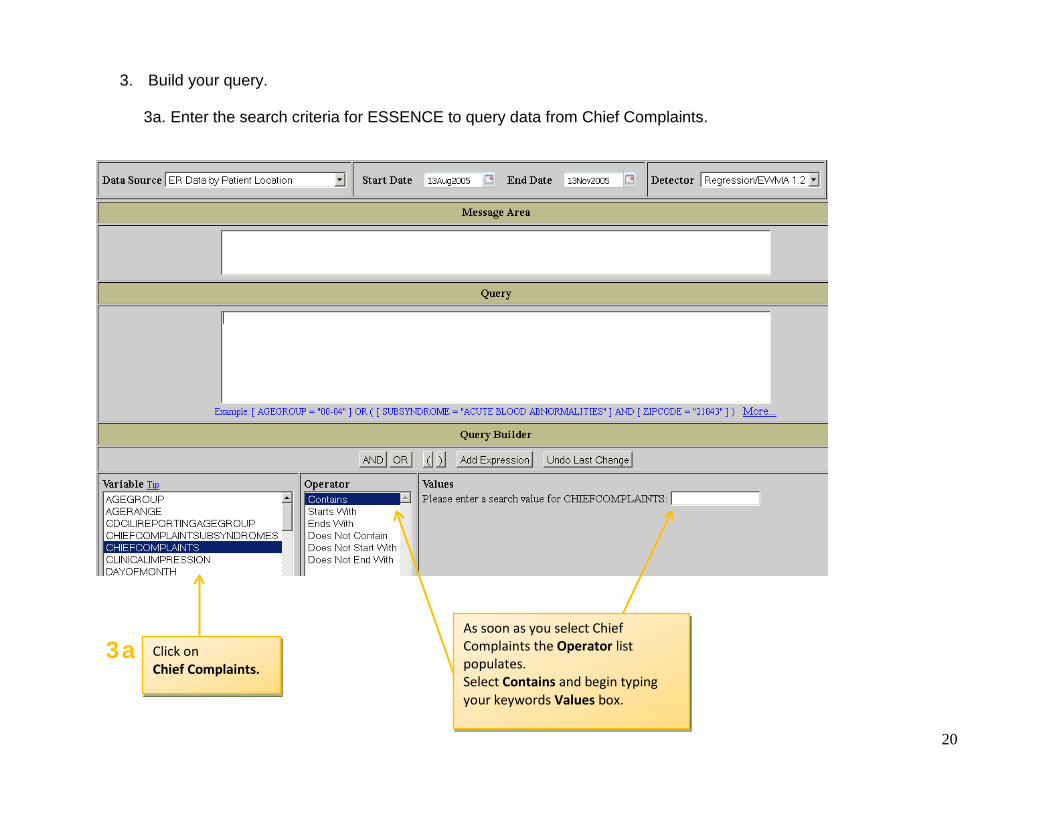
3. Build your query. 3a. Enter the search criteria for ESSENCE to query data from Chief Complaints.
Click on Chief Complaints.
As soon as you select Chief Complaints the Operator list populates. Select Contains and begin typing your keywords Values box.
3a
21
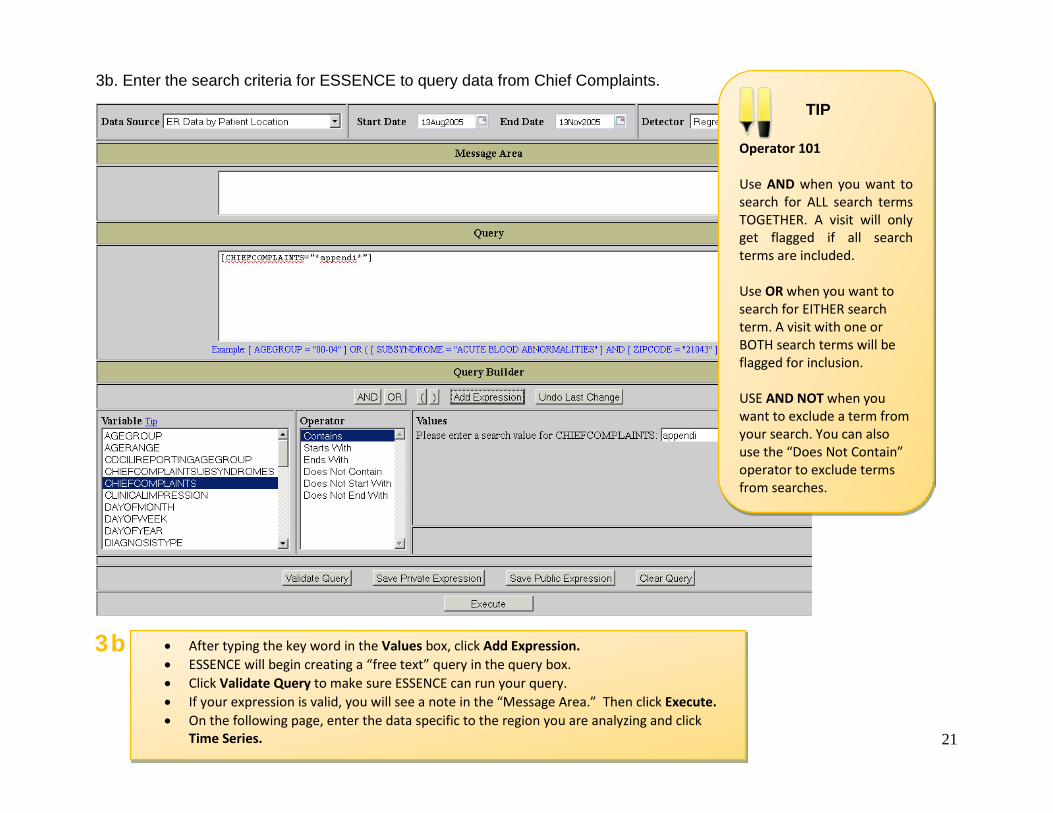
3b. Enter the search criteria for ESSENCE to query data from Chief Complaints.
Operator 101 Use AND when you want to search for ALL search terms TOGETHER. A visit will only get flagged if all search terms are included. Use OR when you want to search for EITHER search term. A visit with one or BOTH search terms will be flagged for inclusion. USE AND NOT when you want to exclude a term from your search. You can also use the “Does Not Contain” operator to exclude terms from searches.
TIP
3b • After typing the key word in the Values box, click Add Expression. • ESSENCE will begin creating a “free text” query in the query box. • Click Validate Query to make sure ESSENCE can run your query. • If your expression is valid, you will see a note in the “Message Area.” Then click Execute. • On the following page, enter the data specific to the region you are analyzing and click
Time Series.
22
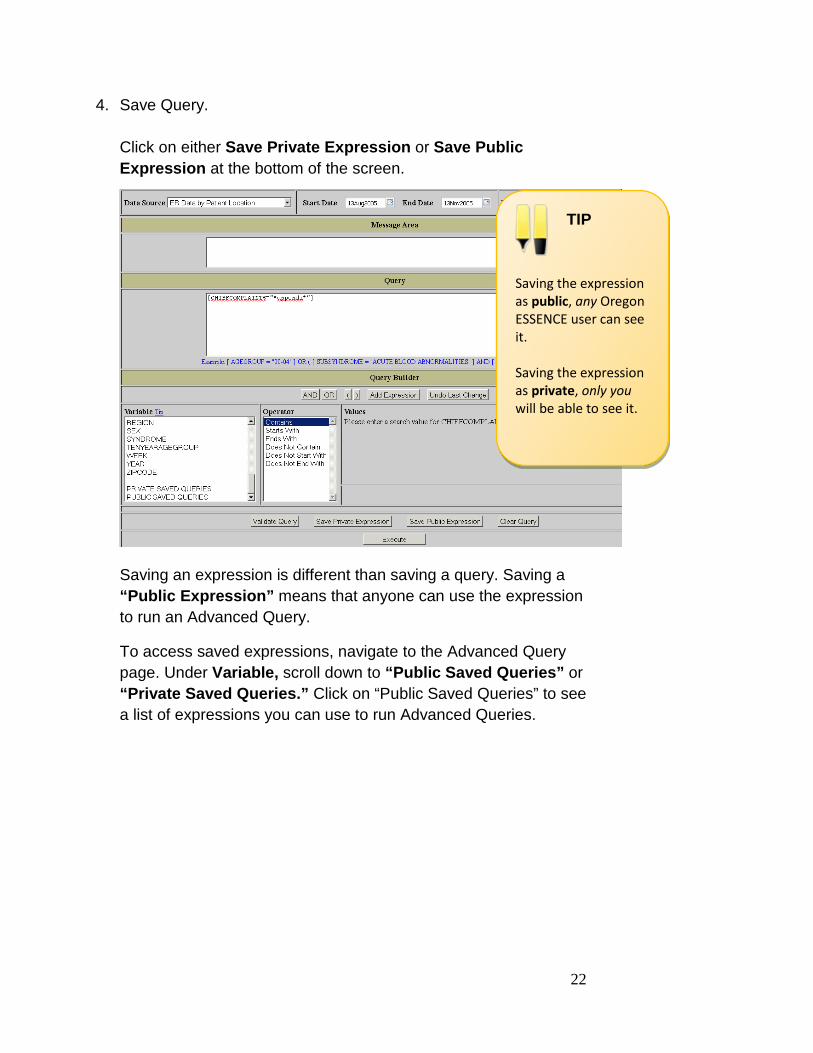
4. Save Query. Click on either Save Private Expression or Save Public Expression at the bottom of the screen.
Saving an expression is different than saving a query. Saving a “Public Expression” means that anyone can use the expression to run an Advanced Query.
To access saved expressions, navigate to the Advanced Query page. Under Variable, scroll down to “Public Saved Queries” or “Private Saved Queries.” Click on “Public Saved Queries” to see a list of expressions you can use to run Advanced Queries.
Saving the expression as public, any Oregon ESSENCE user can see it. Saving the expression as private, only you will be able to see it.
TIP

23
5. Interpret times series graph.
The Time Series graph provides a graphical way of viewing recent visits over the timespan of interest. When analyzing the data, look for the following:
• Color of dots o Blue: Normal o Yellow: Warning o Red: Alert
• Baseline or expected number of visits for the period • Sharp increases in number of visits • Sustained increases in visits
To determine if unusual seasonal activity is occurring, compare the graph to the same time period for the previous year by using state data sources:
• Oregon Norovirus Watch • Oregon Flu Bites
Best Practices for Analyzing Time Series Graphs
24
USING ESSENCE: ADDITIONAL RESOURCES Congratulations! You’ve made it through the basics of ESSENCE. Below are list of helpful links to ESSENCE resources. Helpful Links
Oregon ESSENCE site https://essence.oha.oregon.gov ESSENCE overview and training schedule https://public.health.oregon.gov/DiseasesConditions/CommunicableDisease/PreparednessSurveillanceEpidemiology/essence/Pages/Accessing-Oregon-ESSENCE.aspx
Accessing online training videos Coming soon!
Contact your public health or hospital liaison for help using ESSENCE http://public.health.oregon.gov/PHD/Directory/Pages/program.aspx?pid=77 (NOTE: Click on Staff for drop down menu)

25