Embed Size (px)
DESCRIPTION
Activity Based Costing and Just in Time.By Professor Richard McDermott.
Citation preview

Activity Based Costing
Accounting 3300Professor Richard McDermott

Traditional Costing Systems
• Product Costs– Direct labor– Direct materials– Factory Overhead
• Period Costs– Administrative expense– Sales expense
Appear on the income statement when goods are sold, prior to that time they are stored on the balance sheet as inventory.
Appear on the income statement in the period incurred.

Traditional Costing Systems
• Product Costs– Direct labor– Direct materials– Factory Overhead
Direct labor and direct materials are easy to trace to products.
The problem comes with factory overhead.
Traditional Costing Systems
• Typically used one rate to allocate overhead to products.
• This rate was often based on direct labor dollars or direct labor hours.
• This made sense, as direct labor was a major cost driver in early manufacturing plants.

Problems with Traditional Costing Systems
• Manufacturing processes and the products they produce are now more complex.
• This results in over-costing or under-costing.– Complex products are not allocated an adequate
amount of overhead costs.– Simple products get too much.

Today’s Manufacturing Plants
• Are more complex• Are often automated• Often make more than one product• Use proportionately smaller amount of direct
labor making direct labor a poor allocation base for factory overhead.

When the manufacturing process is more complex:
• Then multiple allocation bases should be used to allocate overhead expense.
• In such situations, managers need to consider using activity based costing (ABC).

ABC Definitions
• Activity based costing is an approach for allocating overhead costs.
• An activity is an event that incurs costs.• A cost driver is any factor or activity that has a
direct cause and effect relationship with the resources consumed.
ABC Steps
• Determine cost drivers.• Create activity cost pools.
– A activity cost pool is a pool of individual costs that all have the same cost driver.
• Allocate all overhead costs to activity pools.– Activity pools should be homogeneous—they
should have the same cost driver (such as labor hours).

ABC Steps:
• Calculate an overhead rate for each homogeneous activity cost pool:– Formula: total costs/base = rate
• Allocate overhead costs to each product consistent with the amount of the base of each activity pool the product uses.

Let’s work an example . . .
• Assume that a company makes widgets• Management decides to install an ABC system

Determine Cost Drivers
• Management decides that factory overhead costs have only three cost drivers– Direct labor hours– Machine hours– Number of purchase orders

Allocate each overhead cost in the general ledger to one of the activity cost pools.
Direct Labor
Machine Hours
# of Purchase Orders
General Ledger
Payroll taxes $1,000
Machine maintenance $500
Purchasing Dept. labor $4,000
Fringe benefits $2,000
Purchasing Dept. Supplies $250
Equipment depreciation $750
Electricity $1,250
Unemployment insurance $1,500
Which overhead costs do you think are driven by direct labor
hours?

Allocate each overhead cost in the general ledger to one of the activity cost pools.
Direct Labor
Machine Hours
# of Purchase Orders
General Ledger
Payroll taxes $1,000
Machine maintenance $500
Purchasing Dept. labor $4,000
Fringe benefits $2,000
Purchasing Dept. Supplies $250
Equipment depreciation $750
Electricity $1,250
Unemployment insurance $1,500
$1,000 2,000 1,500$4,500
Which overhead costs are driven by machine hours?
$ 500 750 1,250$2,500

Allocate each overhead cost in the general ledger to one of the activity cost pools.
Direct Labor
Machine Hours
# of Purchase Orders
General Ledger
Payroll taxes $1,000
Machine maintenance $500
Purchasing Dept. labor $4,000
Fringe benefits $2,000
Purchasing Dept. Supplies $250
Equipment depreciation $750
Electricity $1,250
Unemployment insurance $1,500
$1,000 2,000 1,500$4,500
And finally, which overhead costs are driven by number of purchase orders?
$ 500 750 1,250$2,500
$4,000 250$4,250

Calculate an overhead rate for each cost pool:
Direct Labor
Machine Hours
# of Purchase Orders
$1,000 2,000 1,500$4,500
$ 500 750 1,250$2,500
$4,000 250$4,250
Again, the formula is:
Costs in Activity Cost Pool/Base = rate
$4,500/1,000 = $4.50 per direct labor hour$2,500/250 = $10 per machine hour$4,250/100 = $42.50 per purchase order
The ABC rates are:
Assume the following bases:
Direct labor hours = 1,000Machine hours = 250Purchase orders = 100

Allocate overhead using this rate to all products consistent with how much of each base the product
uses.
$4,500/1,000 = $4.50 per direct labor hour$2,500/250 = $10 per machine hour$4,250/100 = $42.50 per purchase order
The ABC rates are:
Lets assume the company makes two products, Widget A and Widget B:
Let’s also assume that each product uses the following quantity of overhead cost drivers:
Base Widget A Widget B TotalDirect labor hours 400 600 1,000Machine hours 100 150 250Purchase orders 50 50 100
Notice thatall base unitsare accounted for.

So, let’s allocate overhead to Widget A:
Base A Rate Allocated
Direct labor hours 400 $ 4.50 $ 1,800.00
Just like we learned in Accounting 2020, we multiplythe base used by the rate.
In this case, 400 hours used to make Widget A ismultiplied by the rate of $4.50. This gives total overheadapplied for this activity cost pool of $1,800 toWidget A.

Continuing the calculation:
Widget A Base Rate AllocatedDirect labor hours 400 $ 4.50 $ 1,800.00 Machine hours 100 $ 10.00 $ 1,000.00 Purchase orders 50 $ 42.50 $ 2,125.00 Total $ 4,925.00
Let’s do the same thing for the other two rates, to get the total amountof overhead applied to Widget A:

Now let’s allocate overhead to Widget B:
Let’s do the same thing for Widget B:
Widget B Base Rate AllocatedDirect labor hours 600 $ 4.50 $ 2,700.00 Machine hours 150 $ 10.00 $ 1,500.00 Purchase orders 50 $ 42.50 $ 2,125.00Total $ 6,325.00
The original overhead to be applied was $4,500 of direct labordriven overhead + $2,500 of machine hour driven overhead + $4,250 of purchase order driven overhead = $11,250 total overhead to apply.
The actual overhead allocated was $4,925 for Widget A + $6,350 =$11,250 overhead applied.

Same Problem--Traditional Method
• Okay, so what if we had allocated the overhead in this company using traditional cost accounting allocation?
• Let’s assume the base is direct labor hours.• What would be the amount allocated to each
product?

CalculationGeneral Ledger
Payroll taxes $1,000
Machine maintenance $500
Purchasing Dept. labor $4,000
Fringe benefits $2,000
Purchasing Dept. Supplies $250
Equipment depreciation $750
Electricity $1,250
Unemployment insurance $1,500
This the total overhead we were given, the total amount is $11,250 as explained on the previous slide.
Base Widget A Widget B TotalDirect labor hours 400 600 1,000Machine hours 100 150 250Purchase orders 40 60 100
Total direct labor hours are 1,000, also given earlier.

Calculation
• The rate would be:– OH Rate = Overhead/Direct Labor Hours– $11,250/1,000 = $11.25 per hour.
• Applying overhead using this rate:– Widget A: 400 hours x $11.25 = $4,500– Widget B: 600 hours x $11.25 = $6,750– Total overhead applied = $11,250

ComparisonWidget A Widget B Total
Traditional Method $4,500 $6,750 $11,250
Activity Based Costing
$4,925 $6,325 $11,250
Difference -$425 $425 -0-
Which is more accurate?
ABC Costing!
Note these are total costs. To get per-unit costs ,we would divide by thenumber of units produced.

When do we use ABC costing?
• When one or more of the following conditions are present:
• Product lines differ in volume and manufacturing complexity.
• Product lines are numerous and diverse, and they require different degrees of support services.
• Overhead costs constitute a significant portion of total costs.

When do we use ABC costing?
• The manufacturing process or number of products has changed significantly—for example, from labor intensive to capital intensive automation.
• Production or marketing managers are ignoring data provided by the existing system and are instead using “bootleged” costing data or other alternative data when pricing or making other product decisions.

Additional Uses of ABC
• Activity Based Management (ABM)– Extends the use of ABC from product costing to a
comprehensive management tool that focuses on reducing costs and improving processes and decision making.

ABM
• ABM classifies all activities as value-added or non-value-added.
• Value-added activities increase the worth of a product or service to the customer.
• Example: Addition of a sun roof to an automobile.
• Non-value added activities don’t.• Example: The cost of moving or storing the product
prior to sale.

The Objective of ABM . . .
• To reduce or eliminate non-value related activities (and their costs).
• Attention to ABM is a part of continuous improvement of operations and activities.
Possible Cost Drivers
• Machine hours• Direct labor hours• Number of setups• Number of products• Number of purchase orders• Number of employees• Number of square feet

Common Classification System• Unit-level activities. Activities performed for
each unit of production.• Batch-level activities. Activities performed for
each of bath of products.• Product line activities.* Activities performed
in support of an entire product line.• Facility-level activities. Activities required to
sustain an entire production process.*The author calls these product costs but I call them product line costs to show they do not increase with each unit of product produced but the addition of new product lines. I think the author’s approach is a little confusing.

Common Classification System
• This system provides a structured way of thinking about relationship between activities and the resources they consume.

Facility Sustaining Activities
• Have no good cost driver• May or may not be allocated to products
depending upon the purpose for which the information is to be used
• Examples– Housekeeping– Factory yard maintenance
Manufacturing Systems
• Traditional systems . . .• Are “Just-in-Case.”
– Inventories of raw materials are maintained just in case some items are of poor quality or key suppliers don’t delivery on time.
• Are push systems.– Materials are pushed through the manufacturing
process.
• Based on standard costs. – Once a standard is reached improvement stops!
Manufacturing Systems
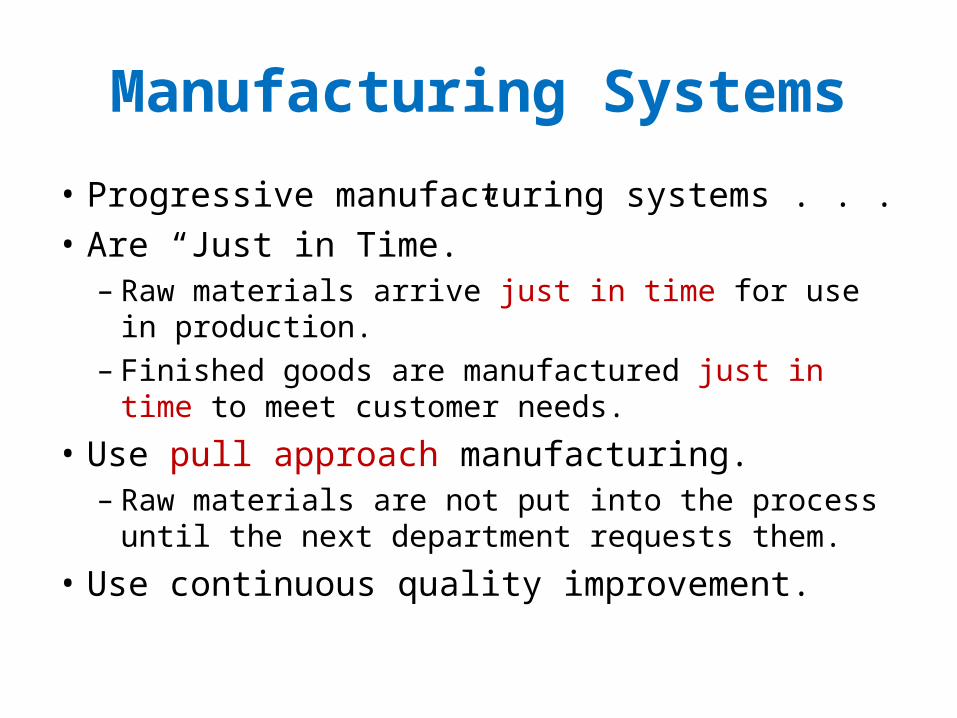
• Progressive manufacturing systems . . .• Are “Just in Time.”
– Raw materials arrive just in time for use in production. – Finished goods are manufactured just in time to meet
customer needs.
• Use pull approach manufacturing. – Raw materials are not put into the process until the
next department requests them.
• Use continuous quality improvement.

Three important elements must exist for JIT systems to work:
• Dependable suppliers who can deliver on short notice.
• If your plant is in Buffalo Chip, Wyoming, you are out of luck.

Three important elements must exist for JIT systems to work:
• Multi-skilled workforce who can work in work cells or work stations. – One worker may operate several kinds of
machines.
• Unions have traditionally opposed this.

Three important elements must exist for JIT systems to work:
• Employees and suppliers who can deliver on Total quality management. – The objective is no defects.

Objectives of JIT
• Reduction or elimination of inventories.• Enhanced production quality.• Reduction or elimination of rework costs.• Production cost savings from improved flow of
goods through the process.

Exercise 5-16
• Teledor Inc.• Uses the following cost hierarchy
– Unit– Batch– Product line– Facility sustaining
These are the
cost drivers!

Exercise 5-16
• Teledor manufactures boom boxes.• They differ significantly in complexity, etc.• The following page shows costs incurred in
2006.

Exercise 5-16
• Indirect labor cost $1,000,000• Procurement costs $500,000• Indirect materials cost $250,000• Machine set-up cost $600,000• Design process cost $800,000• Machine related overhead $1,100,000• Plant management $900,000
The question is: What categories do each of these costs fit in?

Exercise 5-16 (Classify)
• Indirect labor cost $1,000,000—unit • Procurement costs $500,000—batch • Indirect materials cost $250,000—unit • Machine set-up cost $600,000—batch • Design process cost $800,000—product line• Machine related overhead $1,100,000—unit • Plant management $900,000—facility
sustaining

Exercise 5-16
• Consider two types of boom boxes made by the company.
• One boom box is complex to make and is produced in many batches.
• The other boom box is simple to make and is produced in few batches.

Exercise 5-16
• Suppose the manufacturer needs the same number of machine hours to make each boombox, and that they allocate overhead costs using machine hours.
• Under a traditional system, how (if at all) might the boom boxes be mis-costed?
• Answer: the simple boom box would receive too much overhead as machine hours are not a good cost driver.

Exercise 5-16
• How is the cost hierarchy helpful to this company in managing its business?
• Using the cost hierarchy to calculate activity-based costs can help Teledor to identify both the costs of individual activities and the cost of activities demanded by individual products.

Exercise 5-17
• Plymouth Test Laboratories• ABC, Cost Hierarchy, Service Company
Exercise 5-17
• Plymouth Test Laboratories does heat testing and stress testing on materials.
Exercise 5-17
• Under its current simple costing system, all operating costs ($1,200,000) are allocated to a single overhead cost pool.
• Plymouth calculates a rate for a ‘test hour’ at $15 ($1,200,000 divided by 80,000 total test hours).

Exercise 5-17
• Of the two departments . . .• Heat Testing uses 50,000 test hours, and
Stress Testing uses 30,000 hours.• The controller feels there should be separate
cost structures and rates for Heat Testing and Stress Testing.

Exercise 5-17
• The controller divides Plymouth’s cost into four activity cost categories.

Cost Categories
• Direct labor cost of $240,000.– Heat testing $180,000.– Stress testing $60,000.

Exercise 5-17
• Setup cost of $350,000 allocated to the testing and stress testing on the basis of seven hours required.– Heat testing 13,500 setup hours.– Stress testing 4000 setup hours.

Exercise 5-17
• Design cost $210,000.• These costs are allocated on the basis of time
required to design the tests.– Heat testing requires 2,800 hrs.– Stress testing requires 1,400 hours.

Exercise 5-17
• Classify each cost as unit, batch, product line, or facility cost.

Unit Driven Costs
• Direct-labor costs, $240,000• Equipment-related costs (rent, maintenance,
energy, and so on), $400,000
Each unit is a cost driver, costs in this pool increase proportionately with units produced.

Batch Driven Costs
• Setup costs, $350,000
Each batch drives these costs-twice the number of batches, twice the cost!

Product Line Costs
• Designing the tests, $210,000.
Individual product lines drive these costs. If a company has four product lines, it has four
times the cost.

Facility Costs
• In this problem --apparently none!
There is no cost driver for facility costs. Whether they are allocated to products or not depends on
the use to which the information will be put. Facility costs include yard care, painting the
factory, watering the grounds, etc.—activities that are not driven by units, batches, or
products.

Exercise 5-17
• Calculate the cost per test hour for heat testing and stress testing.
• Why do these numbers differ from the $15 per test hour the company calculated using a simple costing system?

To calculate the cost per test we will . . .
1. Allocate unit, batch, and product line costs to the two products.
2. The two products in this problem are”1. A heat testing hour, and2. A stress testing hour.

To calculate the cost per test we will . . .
1. Total the cost for heat testing and stress testing, and then divide those costs by the number of heat testing or stress testing hours to get a rate per hour of heat testing or stress testing.

Some ABC costs to be allocated are given, others will need to be
allocated using a rate
The rate for equipment related costs (a unit cost) is $400,000 total costs divided by 80,000 hours = $5.00 per hour.
The rate for setup costs (a batch cost) is $350,000 total costs divided by $17,500 setup hours = $20 per setup hour.
The rate for design hours (a product line cost) $210,000divided by 4,200 setup hours = $50 per design hour.
Rate Calculation
We will use all of these rates in a moment.
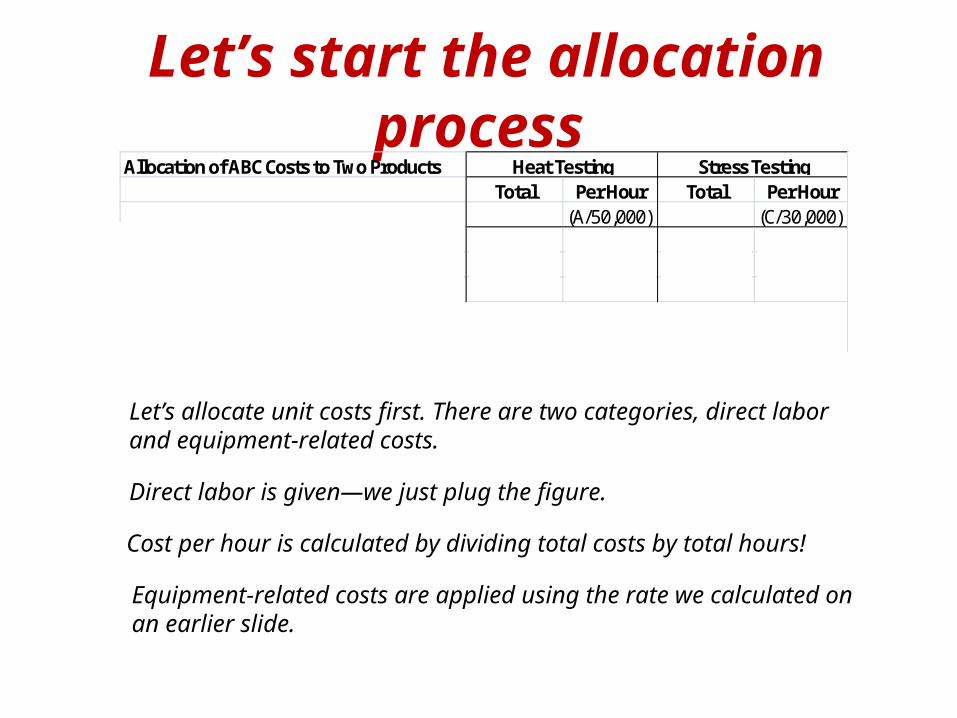
Let’s start the allocation process Allocation of ABC Costs to Two Products
Total Per Hour Total Per Hour(A/50,000) (C/30,000)
Unit CostsDirect labor (given) 180,000$ 3.60$ 60,000$ 2.00$ Equipment-related costs (use rates) $5.00 per hour x 50,000 hours 250,000 5.00 $5.00 per hour x 30,000 hours 150,000 5.00
Heat Testing Stress Testing
Let’s allocate unit costs first. There are two categories, direct labor and equipment-related costs.
Direct labor is given—we just plug the figure.
Equipment-related costs are applied using the rate we calculated onan earlier slide.
Cost per hour is calculated by dividing total costs by total hours!

Batch and product line costs are calculated the same way
Allocation of ABC Costs to Two ProductsTotal Per Hour Total Per Hour
(A/50,000) (C/30,000)Unit CostsDirect labor (given) 180,000$ 3.60$ 60,000$ 2.00$ Equipment-related costs (use rates) $5.00 per hour x 50,000 hours 250,000 5.00 $5.00 per hour x 30,000 hours 150,000 5.00
Batch Costs (use rates)Set up costs $20 per setup-hour x 13,500 set-up hours 270,000$ 5.40 $20 per setup-hour x 4,000 set-up hours 80,000$ 2.67
Product Line CostsCost of designing the tests $50 per hour x 2,800 design hour 140,000$ 2.80 $50 per hour x 1,400 hours 70,000$ 2.33
Total Costs 840,000$ 16.80$ 360,000$ 12.00$
Heat Testing Stress Testing
The total costs for each product have now been calculated!

Exercise 5-18
• Wolfston Group• Alternative allocation bases for a professional
services firm

Exercise 5-18
• The Wolfston Group provides tax advice to multinational firms.
• They charge clients for (a) direct professional time (at an hourly rate) and (b) support services (at 30% of the direct professional cost billed).

Exercise 5-18
• The company’s three professionals and their rates per professional hour are shown below.
Myron Wolston $500Ann Brown 120John Anderson 80

Exercise 5-18
• The company has just prepared the May 2005 bills for two clients.
• The hours of professional time spent on each client are as follows:
Seattle Tokyo
Wolfson 15 2
Brown 3 8
Anderson 22 30
Total 40 40

Exercise 5-18• What amount did the company bill to
Seattle and Tokyo for May 2005?Direct Professional Time Support Services Amount
ClientRate per
HourNumberof Hours Total Rate Total
Billed toClient
(1) (2) (3) (4) = (2) (3) (5) (6) = (4) (5) (7) = (4) + (6)SeattleWolfsonBrownAnderson
$500120
80
153
22
$7,500360
1,760
30%3030
$2,250108528
$ 9,750468
2,288$12,506
TokyoWolfsonBrownAnderson
$500120
80
28
30
$1,000960
2,400
30%3030
$300288720
$1,3001,248
3,120$5,668
.

Exercise 5-18
• Suppose support services were billed at $50 per paraprofessional labor hour (instead of 30% of professional labor costs).
• How would this change the amount they build the two clients for May 2005?

Exercise 5-18
Direct Professional Time Support Services Amount
ClientRate per
HourNumber
of Hours
TotalRate per
HourTotal
Billed toClient
(1) (2) (3) (4) = (2) (3)
(5) (6) = (3) (5)
(7) = (4) + (6)
SeattleWolfsonBrownAnderson
$500120
80
153
22
$7,500360
1,760
$505050
$ 750150
1,100
$ 8,250510
2,860$11,620
TokyoWolfsonBrownAnderson
$500120
80
28
30
$1,000960
2,400
$505050
$ 100400
1,500
$1,1001,360
3,900$6,360

Exercise 5-18
• The difference in billed amounts would be:
Requirement 1 Requirement 2
Seattle Dominion $12,506 $11,620Tokyo Enterprises 5,668 6,360
$18,174 $17,980
Both clients use 40 hours of professional labor time. However, Seattle Dominion uses a higher proportion of Wolfson’s time (15 hours), which is more costly. This attracts the highest support-services charge when allocated on the basis of direct professional labor costs.
Exercise 5-18
• How would you determine whether professional labor costs or professional labor hours is the more appropriate base for the company support services?
• Interviews with personnel.• Analysis of tasks undertaken for clients.

Exercise 5-19
• Automotive Products• Plantwide, department, and ABC indirect cost
rates

Exercise 5-19
• Automotive Products designs and produces automobile parts.
• In 2007, actual variable manufacturing overhead is $308,600.
• The company’s simple costing system allocates variable manufacturing overhead to its three customers based on machine hours and prices its contracts based on full costs.

Exercise 5-19
• One of its customers has regularly complained of being charged noncompetitive prices, so the companies controller realizes that it is time to examine the consumption of overhead resources more closely.

Exercise 5-19
• He knows that there are three main departments that consume overhead resources.– Design– Production– Engineering
• Interviews with the department personnel yield the information on the following slide.

Exercise 5-19Use of cost drivers by customer
Department Cost driver VariableManuf.
Overhead in 2007
United Motors
Holden Motors
Leland Vehicle
Design CAD design hours
$39,000 110 200 80
Engineering Engineering hours
29,600 70 60 240
Production Machine hours
240,000 120 2800 1080
Total $308,600

Exercise 5-19
• Compute the variable manufacturing overhead allocated to each customer in 2007 using the simple costing system that uses machine hours as the allocation base.
• The rate equals:– $308,600/4,000 machine hours = $77.15 per
machine hour.

Exercise 5-19
• Allocation of overhead to customers using this rate
• United Motors $77.15 ×120 = $9,258• Holden Motors $77.15 × 2800 = $216,020• Leland Vehicle $77.15 × 1080 = $83,322• Total allocated $308,600

Exercise 5-19
• Compute the variable manufacturing overhead allocated to each customer in 2007 using department-based variable manufacturing overhead rates.
• First we need to calculate the rates. We do that on the following slide.

Exercise 5-19Variable
Manufacturing Overhead in
2007
Total Driver Units
Rate Base
Design $39,000 390 $100 Per CAD hour
Production $29,600 370 $80 Per engineering
hour
Engineering $240,000 4,000 $60 Per machine hour
We are placing all overhead costs into three homogeneous pools, shown above. We then divide the amount in those cost pools by the total driver units to get the rate

Exercise 5-19
• Now we use the rates to apply cost from the three overhead accounts to products, based on the amount of each of those overhead services used by the individual products.
Exercise 5-19
United Motors
HoldenMotors
LelandMotors Total
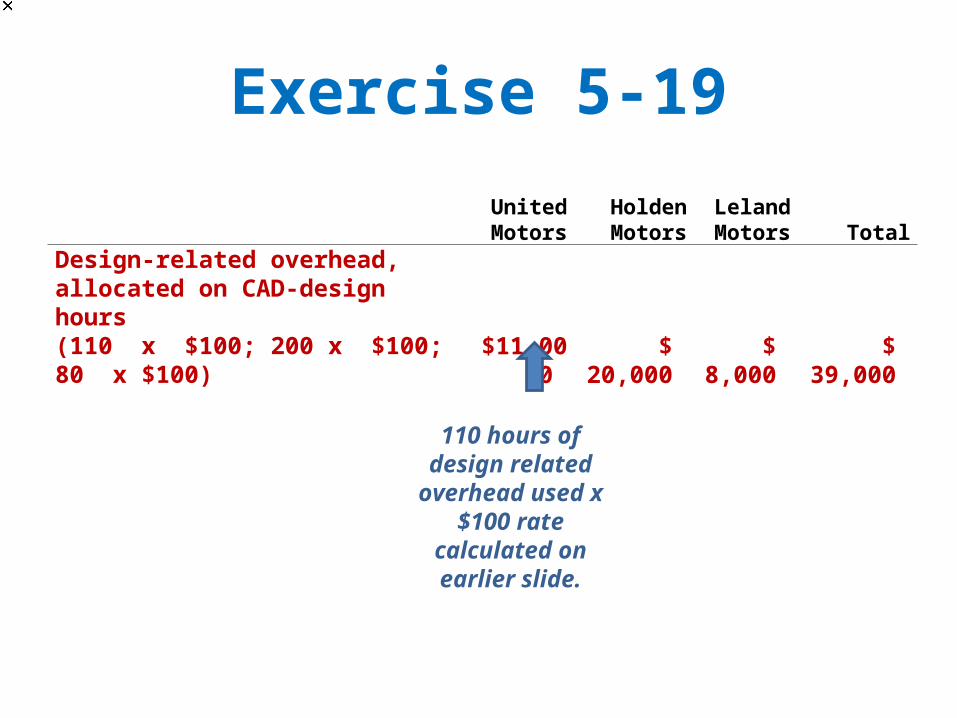
Design-related overhead, allocated on CAD-design hours (110 x $100; 200 x $100; 80 x $100) $11,000 $ 20,000 $ 8,000 $ 39,000
110 hours of design related overhead used x $100 rate
calculated on earlier slide.

Exercise 5-19 New Allocation System
United Motors
HoldenMotors
Leland Vehicle Total
Design-related overhead, allocated on CAD-design hours (110 x $100; 200 x $100; 80 x $100) $11,000 $ 20,000 $ 8,000 $ 39,000 Production-related overhead, allocated on engineering hours (70 x $80; 60 x $80; 240 x $80)
5,600 4,800 19,200 29,600 Engineering-related overhead, allocated on machine hours (120 x $60; 2,800 x $60; 1,080 x $60) 7,200 168,000 64,800 240,000 Total
$23,800 $192,800 $92,000 $308,600
Use the same process for the other overhead rates.

Exercise 5-19
• If the new rates are used which customer will be most unhappy?
• One way to answer that question is to calculate the ratio between the new rate and the old rate.

Ratio Old Rate/New Rate
• United Motors: $23,800/$9,258 = 2.57• Holden Motors: $192,800/$216,020 = 0.89• Leland Motors $92,000/$83,322 = 1.10• United Motors had the greatest increase in
overhead allocation. They will probably be the most unhappy customer with the new allocation system.

Exercise 5-19
• How will we explain the rate increased to United Motors if they complain?
• Let us compare the usage of both the old and the new driver units to see if they are now being charged fairly.

Exercise 5-19
• Remember, under the first allocation system they were charged using machine hours.
• Now they are charged according to their usage of all three cost drivers, design, engineering, and production.

Exercise 5-19Department Costs Driver United Motors Holden Motors Leland Motors
Design CAD design hours
28% 51% 21%
Engineering Engineering hours
19% 16% 65%
Production Machine hours
3% 70% 27%
While United Motors was using significant amounts of design, engineering, and production overhead, they were only being charged (under the old system) 3% of total overhead costs.
In other words, the single rate system was undercharging United Motors.

Exercise 5-19 Question
• How else might the company use information available from its department by department analysis of variable manufacturing overhead costs?

Exercise 5-19 Answer
• Other than for pricing, AP can also use the information from the department-based system to examine and streamline its own operations so that there is maximum value-added from all indirect resources.
• It might set targets over time to reduce both the consumption of each indirect resource and the unit costs of the resources.
• The department-based system gives AP more opportunities for targeted cost management.

Exercise 5-19 Question
• The company’s managers are wondering if they should further refine the department by department costing system into an ABC system by identifying different activities within each department.
• Under what conditions would it not be worthwhile to further refine the department costing system into an activity-based costing system?

Exercise 5-19 Answer
• It would not be worthwhile to further refine the cost system into an ABC system if there wasn’t much variation among contracts in the consumption of activities within a department.
• If, for example, most activities within the design department were, in fact, driven by CAD-design hours, then the more refined system would be more costly and no more accurate than the department-based cost system.

Exercise 5-19 Answer
• Even if there was sufficient variation, considering the relative sizes of the 3 department cost pools, it may only be cost-effective to further analyze the engineering cost pool, which consumes 78% ($240,000 $308,600) of the manufacturing overhead.
Exercise 5-23
• Family Supermarkets• ABC, retail product line profitability

Exercise 5-23
• Family Supermarkets (FS) decides to apply ABC analysis to three product lines:– Baked goods– Milk and fruit juice– Frozen foods

Exercise 5-23
• It identifies four activities and their cost activity rates as:Ordering $100 per purchase order
Delivery $80 per delivery
Shelf stocking $20 per hour
Customer support $.20 per item sold

Exercise 5-23
• The revenues, cost of goods sold, store support costs, and activity area usage of the three product lines are given on the following slide.

Exercise 5-23Baked Goods Milk and Fruit
JuiceFrozen
Products
Financial data
Revenues $57,000 $63,000 $52,000
Cost of goods sold $38,000 $47,000 $35,000
Store support $11,400 $14,100 $10,500
Activity-area usage (cost allocation base)
Ordering (purchase orders)
30 25 13
Delivering (deliveries) 98 36 28
Shelf stocking (hours) 183 166 24
Customer support (item sold)
15,500 20,500 7900

Exercise 5-23
• Using its simple costing system, FS allocated support cost of products at the rate of 30% of cost of goods sold.
• Use the simple costing system to prepare a product line profitability report for FS.
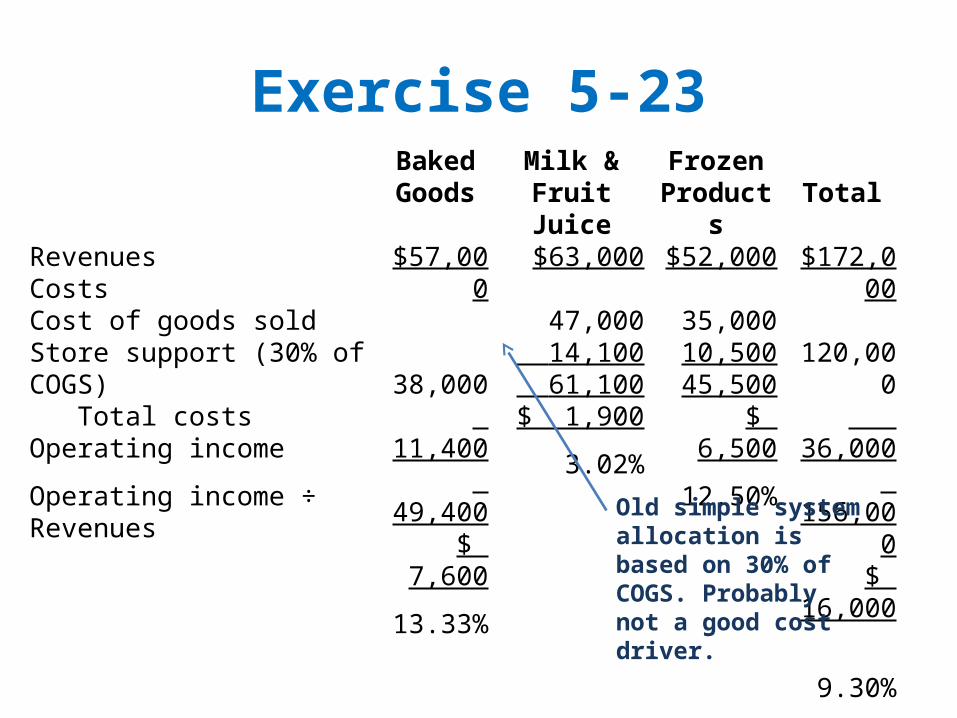
Exercise 5-23BakedGoods
Milk &Fruit Juice
FrozenProducts Total
RevenuesCostsCost of goods soldStore support (30% of COGS) Total costsOperating income
Operating income ÷ Revenues
$57,000
38,000 11,400 49,400$ 7,600
13.33%
$63,000
47,000 14,100 61,100$ 1,900
3.02%
$52,000
35,00010,50045,500
$ 6,500
12.50%
$172,000
120,000 36,000 156,000$ 16,000
9.30%
Old simple system allocation is based on 30% of COGS. Probably not a good cost driver.

Exercise 5-23
• Use the ABC system to prepare a product line report for FS.
• For reference, let’s go back and pick up for the rates and activity usage given in the problem.

BakedGoods
Milk &Fruit Juice
FrozenProducts Total
RevenuesCostsCost of goods sold
$57,000 38,000 3,000
$63,000 47,000 2,500
$52,000 35,000 1,300
$172,000 120,000 6,800
These first three rows are given in the problem. No calculation needed here!

BakedGoods
Milk &Fruit Juice
FrozenProducts Total
RevenuesCostsCost of goods soldOrdering ($100 × 30; 25; 13)
$57,000
38,0003,000
$63,000
47,000
$52,000
35,000
$172,000
120,000
Okay, let’s apply the first overhead rate (ordering) for the first department (Baked Goods).
The overhead rate for Ordering is $100 (given earlier), the number of orders used by Baked Goods is 30 (also given).
The amount of ordering overhead applied to Baked Goods is therefore $100 x 30 = $3,000

BakedGoods
Milk &Fruit Juice
FrozenProducts Total
RevenuesCostsCost of goods soldOrdering ($100 × 30; 25; 13)
$57,000
38,0003,000
$63,000
47,0002,500
$52,000
35,0001,300
$172,000
120,0006,800
Let’s use the same procedure and rate for the other two departments, then total the amount allocated.
BakedGoods
Milk &Fruit Juice
FrozenProducts Total
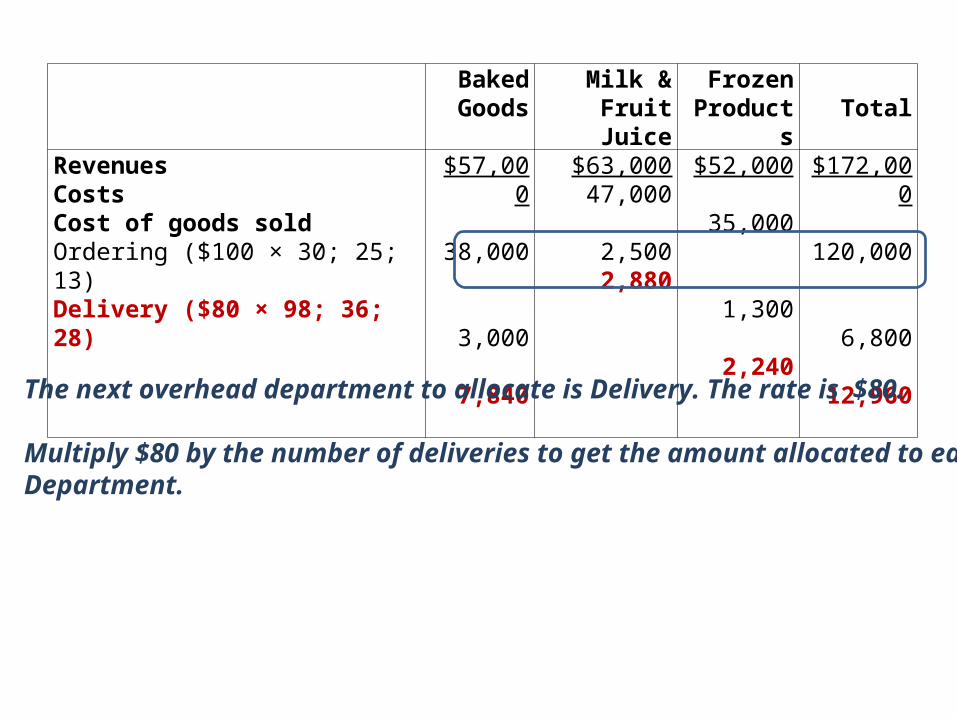
RevenuesCostsCost of goods soldOrdering ($100 × 30; 25; 13)Delivery ($80 × 98; 36; 28)
$57,000 38,000
3,000 7,840
$63,000 47,000
2,500 2,880
$52,000 35,000
1,300
2,240
$172,000 120,000
6,800
12,960
The next overhead department to allocate is Delivery. The rate is $80.
Multiply $80 by the number of deliveries to get the amount allocated to each Department.

BakedGoods
Milk &Fruit Juice
FrozenProducts Total
RevenuesCostsCost of goods soldOrdering ($100 × 30; 25; 13)Delivery ($80 × 98; 36; 28)Shelf-stocking ($20 × 183; 166; 24)Customer support ($0.20 × 15,500; 20,500; 7,900)
$57,000 38,000
3,000
7,840 3,660
3,100
$63,000 47,000
2,500
2,880 3,320
4,100
$52,000 35,000
1,300 2,240 480
1,580
$172,000 120,000
6,800
12,960 7,460
8,780
Let’s apply overhead for the remaining overhead cost pools to each department using the same methodology we just demonstrated.

BakedGoods
Milk &Fruit Juice
FrozenProducts Total
RevenuesCostsCost of goods soldOrdering ($100 × 30; 25; 13)Delivery ($80 × 98; 36; 28)Shelf-stocking ($20 × 183; 166; 24)Customer support ($0.20 × 15,500; 20,500; 7,900) Total costs
$57,000
38,000 3,000 7,840 3,660
3,100
55,600
$63,000
47,000 2,500 2,880 3,320
4,100 59,800
$52,000
35,000 1,300 2,240 480
1,580
40,600
$172,000
120,000 6,800 12,960 7,460
8,780
156,000
Next step, calculate total costs.

BakedGoods
Milk &Fruit Juice
FrozenProducts Total
RevenuesCostsCost of goods soldOrdering ($100 × 30; 25; 13)Delivery ($80 × 98; 36; 28)Shelf-stocking ($20 × 183; 166; 24)Customer support ($0.20 × 15,500; 20,500; 7,900) Total costsOperating income
Operating income ÷ Revenues
$57,000
38,000 3,000 7,840 3,660
3,100
55,600$ 1,400
2.46%
$63,000
47,000 2,500 2,880 3,320
4,100 59,800$ 3,200
5.08%
$52,000
35,000 1,300 2,240 480
1,580
40,600$11,400
21.92%
$172,000
120,000 6,800 12,960 7,460
8,780
156,000$ 16,000
9.30%
Finally, calculate operating income, then calculate the operating margin.
With accurate costing, Frozen Products is shown to be most profitable, Baked Goodsleast profitable.

Exercise 5-24
• Villeagas Wholesalers (Furniture)• ABC, wholesale, customer profitability

Exercise 5-24
• The following data were collected from last year’s operations.
$70,000$100,000$30,000$50,000gross salessales returns
406026100number of items$6,000$7,000$5,000$10,000amount
number of orders705015040regular30105010rush
Determine the contribution to profit from each chain last year.

Exercise 5-24Chain
1 2 3 4Gross sales $50,000 $30,000 $100,000 $70,000 Sale returns 10,000 5,000 7,000 6,000Net sales 40,000 25,000 93,000 64,000Cost of goods sold (80%) 32,000 20,000 74,400 51,200Gross margin 8,000 5,000 18,600 12,800Customer-related costs:Regular orders $20 × 40; 150; 50; 70 800 3,000 1,000 1,400Rush orders $100 × 10; 50; 10; 30 1,000 5,000 1,000 3,000Returned items $10 × 100; 26; 60; 40 1,000 260 600 400Catalogs and customer support 1,000 1,000 1,000 1,000Customer related costs 3,800 9,260 3,600 5,800Contribution (loss) margin $4,200 ($4,260) $15,000 $7,000
Contribution (loss) margin as % gross sales 8.40% -14.20% 15.00% 10.00%
As this follows the same methodology as in the earlier problem, I don’t work through the problem step-by-step.

Exercise 5-24 Analysis
• The analysis indicates that customers’ profitability (loss) contribution varies widely from (14.2%) to 15.0%.
• Immediate attention to Chain 2 is required which is currently showing a loss contribution.
• The chain has a disproportionate number of both regular orders and rush orders.

Exercise 5-24 Analysis
• Villeagas should work with the management of Chain 2 to find ways to reduce the number of orders, while maintaining or increasing the sales volume.
• If this is not possible, Villeagas should consider dropping Chain 2, if it can save the customer-related costs.

The End