Embed Size (px)
Citation preview

ACTIVE AND PASSIVE SURFACE WAVE TECHNIQUES
Overview Active and passive surface wave techniques are relatively new in-situ seismic methods for determining shear wave velocity (VS) profiles. Testing is performed on the ground surface, allowing for less costly measurements than with traditional borehole methods. The basis of surface wave techniques is the dispersive characteristic of Rayleigh waves when traveling through a layered medium. Rayleigh wave velocity is determined by the material properties (primarily shear wave velocity, but also to a lesser degree compression wave velocity and material density) of the subsurface to a depth of approximately 1 to 2 wavelengths. As shown in the adjacent diagram, longer wavelengths penetrate deeper and their velocity is affected by the material properties at greater depth. Surface wave testing consists of measuring the surface wave dispersion curve at a site and modeling it to obtain the corresponding shear wave velocity profile.
λ
λ
λ λ
Active Surface Wave Techniques Active surface wave techniques measure surface waves generated by dynamic sources such as hammers, weight drops, electromechanical shakers, vibroseis and bulldozers. These techniques include the spectral analysis of surface waves (SASW) and multi-channel array surface wave (MASW) methods.
Hammer Energy Sources Accelerated Weight Drop
Electromechanical Shaker Bulldozer Energy Source
1124 Olympic Drive, Corona, California 92881 ph. 951-549-1234 fx 951-549-1236 www.geovision.com

The SASW method is optimized for conducting VS depth soundings. A dynamic source is used to generate surface waves of different wavelengths (or frequencies) which are monitored by two or more receivers at known offsets. An expanding receiver spread and optimized source-receiver geometry are used to minimize near field effects, body wave signal and attenuation. A dynamic signal analyzer is typically used to calculate the phase and coherence of the cross spectrum of the time history data collected at a pair of receivers. During data analysis, an interactive masking process is used to discard low quality data and to unwrap the phase spectrum, as shown in the figure below. The dispersion curve (Rayleigh wave phase velocity versus frequency or alternatively wavelength) is calculated from the unwrapped phase spectrum. SASW Setup
HP Dynamic Signal Analyzer Masking of Wrapped Phase Spectrum and Resulting Dispersion Curve
The MASW field layout is similar to that of the seismic refraction technique. Twenty four, or more, geophones are laid out in a linear array with 1 to 2m spacing and connected to a multi-channel seismograph as shown below. This technique is ideally suited to 2D VS imaging, with data collected in a roll-along manner similar to that of the seismic reflection technique. The source is offset at a predetermined distance from the near geophone usually determined by field testing. The Rayleigh wave dispersion curve is obtained by a wavefield transformation of the seismic record such as the f-k or τ-p transforms. These transforms are very effective at isolating surface wave energy from that of body waves. The dispersion curve is picked as the peak of the surface wave energy in slowness (or velocity) – frequency space as shown. One advantage of the MASW technique is that the wavefield transformation may not only identify the fundamental mode but also higher modes of surface waves. At some sites, particularly those with large velocity inversions, higher surface wave modes may contain more energy than the fundamental mode.
DISPERSION CURVE
Wavefield Transform of MASW data MASW Field Setup 1124 Olympic Drive, Corona, California 92881 ph. 951-549-1234 fx 951-549-1236 www.geovision.com
Passive Surface Wave Techniques Passive surface wave techniques measure noise; surface waves from ocean wave activity, traffic, factories, etc. These techniques include the array microtremor and refraction microtremor (REMI) techniques. The array microtremor technique typically uses 7 or more 4.5- or 1-Hz geophones arranged in a two-dimensional array. The most common arrays are the triangle, circle, semi-circle and “L” arrays. The triangle array, which consists of several embedded equilateral triangles, is often used as it provides good results with a relatively small number of geophones. With this array the outer side of the triangle should be at least as long as the desired depth of investigation. Typically, fifteen to twenty 30-second noise records are acquired for analysis. The spatial autocorrelation (SPAC) technique is one of several methods that can be used to estimate the Rayleigh wave dispersion curve. A first order Bessel function is fit to the SPAC function to determine the phase velocity for particular frequency. The image shown below shows the degree of fitness of the Bessel function to the SPAC function for a wide range of phase velocity and frequency. The dispersion curve, is the peak (best fit), as shown in the figure below.
Triangle Array Geometry Dispersion Curve from Array Microtremor Measurements
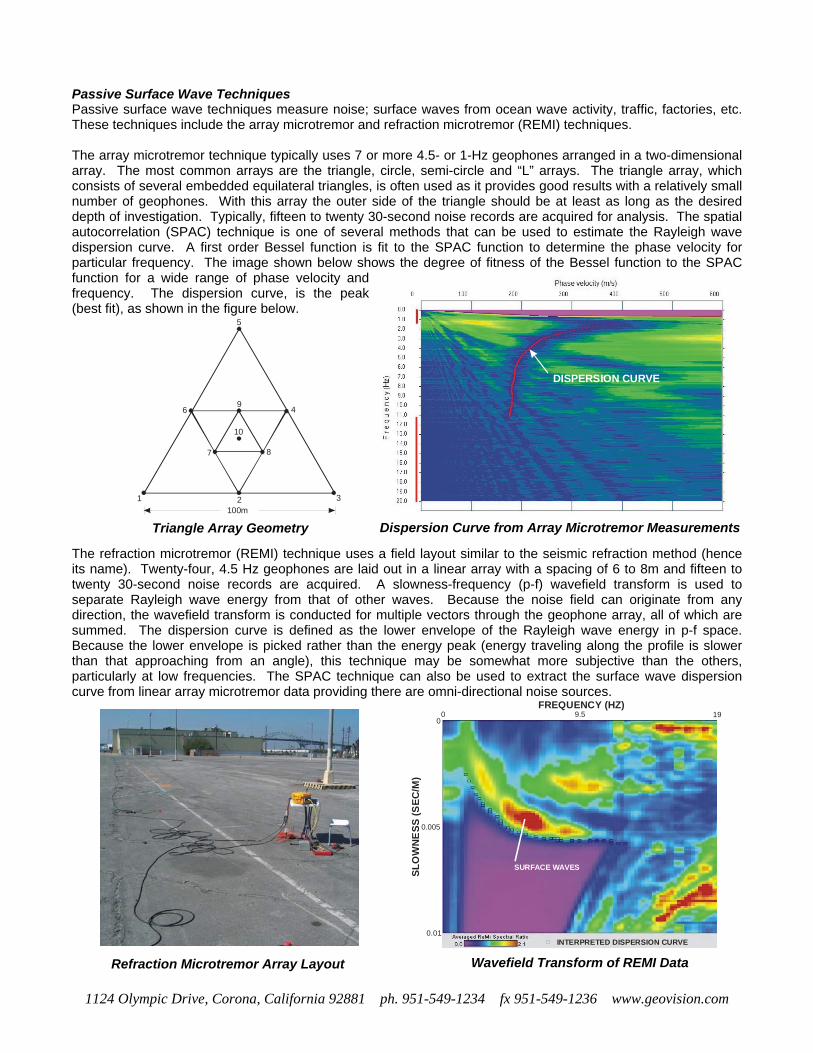
Refraction Microtremor Array Layout Wavefield Transform of REMI Data
1 2 3
4
5
6
7 8
9
10
100m
h s a field layout similar to the seismic refraction method (hence
DISPERSION CURVE
T e refraction microtremor (REMI) technique useits name). Twenty-four, 4.5 Hz geophones are laid out in a linear array with a spacing of 6 to 8m and fifteen to twenty 30-second noise records are acquired. A slowness-frequency (p-f) wavefield transform is used to separate Rayleigh wave energy from that of other waves. Because the noise field can originate from any direction, the wavefield transform is conducted for multiple vectors through the geophone array, all of which are summed. The dispersion curve is defined as the lower envelope of the Rayleigh wave energy in p-f space. Because the lower envelope is picked rather than the energy peak (energy traveling along the profile is slower than that approaching from an angle), this technique may be somewhat more subjective than the others, particularly at low frequencies. The SPAC technique can also be used to extract the surface wave dispersion curve from linear array microtremor data providing there are omni-directional noise sources.
INTERPRETED DISPERSION CURVE
FREQUENCY (HZ)0
SLO
WN
ESS
(SEC
/M)
199.50
0.01
0.005
SURFACE WAVES
1124 Olympic Drive, Corona, California 92881 ph. 951-549-1234 fx 951-549-1236 www.geovision.com

1124 Olympic Drive, Corona, California 92881 ph. 951-549-1234 fx 951-549-1236 www.geovision.com
Depth of Investigation Active surface wave investigations typically use various sized sledg velocity structure to depths of up to 15m. Weight drops and electromechanical shakers can often be used to image to depths of 30m. Bulldozers and vibroseis trucks can be used to image to depths as great as 100m. Passive surface wave techniques can often image shear wave velocity structure to depths of over 100m, given sufficient noise sources and space for the receiver array. Large passive arrays, utilizing long-period seismometers with GPS clocks have been used to image shear wave velocity structure to depths of several kilometers. Combined Active and Passive Surface Wave Testing The combined use of active and passive techniques may offer significant advantages on many investigations. It can be very costly to mobilize large energy sources for 30m/100ft active surface wave soundings. In urban environments, the combined use of active and passive surface wave techniques can image to these depths without the need for large energy sources. We have found that dispersion curves from active and passive surface wave techniques are generally in good agreement, making the combined use of the two techniques viable. It is not recommended that passive surface wave techniques be applied alone for UBC/IBC site classification investigations. Microtremor techniques do not generally characterize near surface velocity, which may have a significant impact of the average shear wave velocity of the upper 30m or 100ft and so should always be used in conjunction with SASW or MASW. An SASW sounding to a depth of 30m requires at least a 60m linear array. If sufficient space is not available for this, it may be possible to use a 45m triangle array on the site or place a 100-200m long REMI array along an adjacent sidewalk or an “L” array at an adjacent street intersection. Modeling There are several options for interpreting surface wave dispersion curves, depending on the accuracy required in the shear wave velocity profile. A simple empirical analysis can be done to estimate the average shear wave velocity profile. For greater accuracy, forward modeling of fundamental-mode Rayleigh wave dispersion as well as full stress wave propagation can be performed using several software packages. A formal inversion scheme may also be used. With many of the analytical approaches, background information on the site can be incorporated into the model and the resolution of the final profile may be quantified. Applications Active and passive surface wave testing can be used to obtain VS profiles for:
• UBC/IBC site classification for seismic design • Earthquake site response • Seismic microzonation • Liquefaction analysis • Soil compaction control • Mapping subsurface stratigraphy • Locating potentially weak zones in earthen embankments and levees
Microtremor Measurements along Sidewalk
e hammers to image the shear wave

Case History
1124 Olympic Drive, Corona, California 92881 ph. 951-549-1234 fx 951-549-1236 www.geovision.com
0 100 200 300 400 500Shear Wave Velocity (VS), m/s
100
60
0
Dep
th,
80
40
20 m
Surface Wave ModelPS Suspension Log
with energy ources typically capable of imaging to 30m. There is excellent agreement in the dispersion curves generated om all of the methods over the overlapping wavelength ranges. The minor differences probably result from
volume of the specific methods. Two Vs versus depth hly variable, near surface velocity structure values for the average shear-wave velocity of uch more tightly constrained than the actual m the PS log (194 m/s) is within 4% of that he small differences in VS30 between the two ehole versus large area) rather than errors in
The figures below show the surface wave dispersion curves and alternative shear wave velocity models for a site in Los Angeles, California. All of the previous figures illustrating SASW, MASW, array and refraction microtremor techniques were from this site. The dispersion curves from all four methods are shown on the left along with the theoretical dispersion curves for alternative S-wave velocity versus depth models on the right. Conditions at this site were very poor for active surface wave techniques because of the presence of very low velocity hydraulic fill. In fact, with active surface wave techniques it was only possible to image to a depth of about 12.5msfrvariable velocity of the hydraulic fill within the sampling models were generated to illustrate the difficulty modeling the higevident in the PS log. The two surface wave models yielded similar the upper 30m (VS30), 201 and 202 m/s, illustrating that Vs30 is mlayer thicknesses and velocities in the models. VS30 estimated froestimated from the two surface wave models (201 and 202 m/s). Tmethods may easily result from the different sampling regimes (boreither of the methods.
10
1
2
4
6
8
h (λ
R),
m
SASW DataMASW DataRefraction Microtremor DataArray Microtremor DataTheoretical Dispersion Curves
100 200 300 400 500 600Surface Wave Velocity (VR), m/s
100
40
60
80
Wa
200
20
vele
ngt
urements which are point estimates, surface wave testing is a global measurement, e subsurface is sampled. The resulting profile is representative of the
et. Although surface wave techniques s) of borehole techniques; the average
elocity over a large depth interval (i.e. the average shear wave velocity of the upper 30m or 100ft) is very well constrained. Because surface wave methods are non-invasive and non-destructive, it is relatively easy to obtain the necessary permits for testing. At sites that are favorable for surface wave propagation, active and passive surface wave techniques allow appreciable cost and time savings.
retical Dispersion Curve VS Model Field Data and Theo
cIn ontrast to borehole measthat is, a much larger volume of thsubsurface properties averaged over distances of up to several hundred fe
o not have the layer sensitivity or accuracy (velocity and layer thicknesdv