Embed Size (px)
Citation preview

An-Najah National University
Faculty of Graduate Studies
Activated carbon from Cyclamen Persicum Tubers for
Diclofenac removal from aqueous solution
By
Fatima Mohammed Abdelwahab Hussen
Supervisor
Dr. Shehdeh Jodeh
Co-Supervisor
Dr. Nidal Jaradat
This Thesis is Submitted in Partial Fulfillment of the Requirements for
the Degree of Master in Chemistry, Faculty of Graduate Studies,
An-Najah National University, Nablus, Palestine.
2013

iii
Dedication
To my father Spirit ,to my beloved mother, who raised me to be I am
today... ….
To my brothers , my sister and their families who have supported me …..
To the memory of my dearest friends ………….
I dedicate this work

iv
Acknowledgement
First of all, I would like to express my gratitude to ALLAH s.w.t. for
helping me to complete my study.
Many thanks and gratitude to my supervisors; Dr. Shehdeh Jodeh and
Dr.Nidal Jaradat for their academic, technical guidance and full support
during thesis work.
Thanks also for Dr.Azam AL’radj and Leena Dawabshi ; Department of
Microbiology and Parasitology- AL-Najah University –Palestine
Many thanks for Dr.Sa’d Zeud for his ideas that participated in this thesis.
I appreciate the warm host, facilitation and cooperation of the technical and
management staff of Chemistry Department at An-Najah National
University during the experimental and analysis work.
My deepest gratitude to my family; who enlightened my academic path
with care and support.

v
Activated carbon from Cyclamen Persicum Tubers for
Diclofenac removal from aqueous solution
Declaration
The work provided in this thesis, unless otherwise referenced, is the
researcher's own work, and has not been submitted elsewhere for any other
degree or qualification.
Student Name: إسم الطالب :
Signature: توقيعال :
Date: التاريخ:
vi
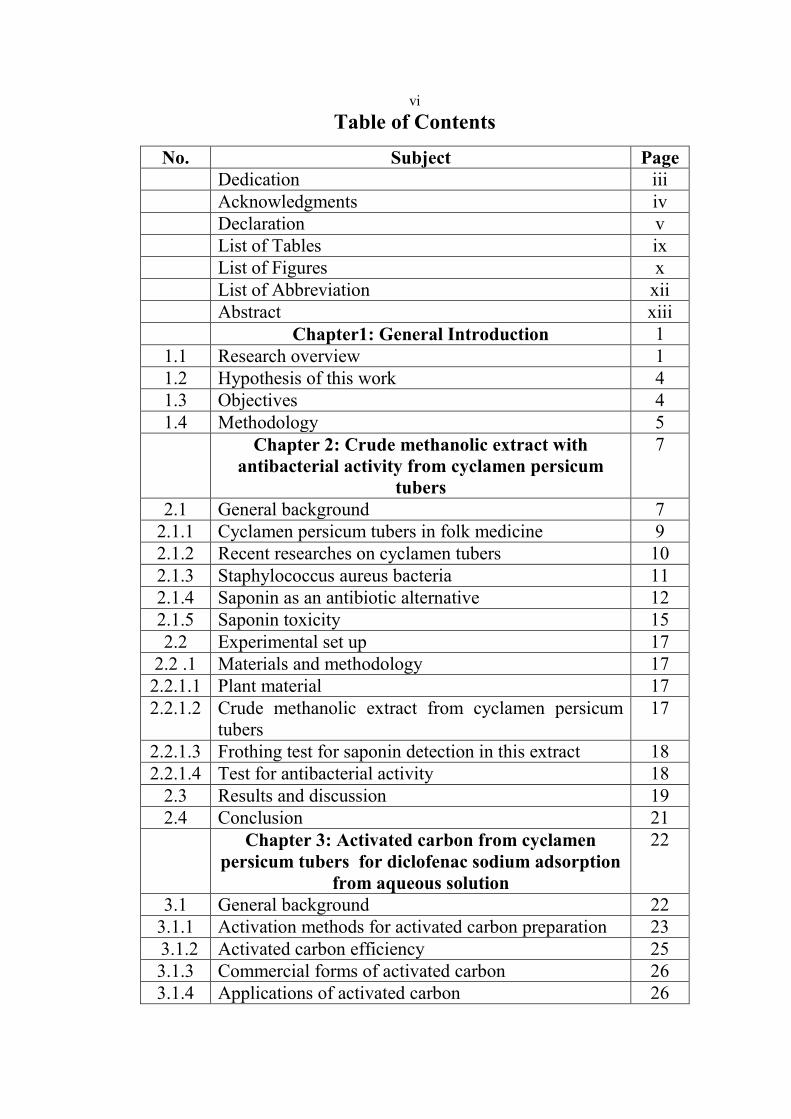
Table of Contents
No. Subject Page Dedication iii Acknowledgments iv Declaration v List of Tables ix
List of Figures x
List of Abbreviation xii
Abstract xiii
Chapter1: General Introduction 1
1.1 Research overview 1
1.2 Hypothesis of this work 4
1.3 Objectives 4
1.4 Methodology 5
Chapter 2: Crude methanolic extract with
antibacterial activity from cyclamen persicum
tubers
7
2.1 General background 7
2.1.1 Cyclamen persicum tubers in folk medicine 9
2.1.2 Recent researches on cyclamen tubers 10
2.1.3 Staphylococcus aureus bacteria 11
2.1.4 Saponin as an antibiotic alternative 12
2.1.5 Saponin toxicity 15
2.2 Experimental set up 17
2.2 .1 Materials and methodology 17
2.2.1.1 Plant material 17
2.2.1.2 Crude methanolic extract from cyclamen persicum
tubers
17
2.2.1.3 Frothing test for saponin detection in this extract 18
2.2.1.4 Test for antibacterial activity 18
2.3 Results and discussion 19
2.4 Conclusion 21
Chapter 3: Activated carbon from cyclamen
persicum tubers for diclofenac sodium adsorption
from aqueous solution
22
3.1 General background 22
3.1.1 Activation methods for activated carbon preparation 23
3.1.2 Activated carbon efficiency 25
3.1.3 Commercial forms of activated carbon 26
3.1.4 Applications of activated carbon 26
vii
3.1.5 Surface characteristics and chemistry of activated
carbon in this research
28
3.1.6 Adsorption process definition 34
3.1.6.1 Adsorption versus absorption 34
3.1.6.2 Adsorption mechanism 35
3.1.6.3 Adsorption isotherm 36
3.1.6.4 Adsorption kinetic models 38
3.1.7 Diclofenac sodium (DCF) overview 41
3.1.7.1 Environmental impact of DCF 43
3.1.7.2. Recent researches on DCF removal from aqueous
solution
44
3.1.7. 3 Eucarbon® 44
3.2 Experimental set up 46
3.2.1 Materials 46
3.2.1.1 Precursor 46
3.2.1.2 Activators 46
3.2.1.3 Furnace 46
3.2.1.4 Adsorbate and chemicals 47
3.2.1.5 FT-IR analysis 47
3.2.2 Activation process 47
3.2.2.1 Physical activation 47
3.2.2.2 Chemical activation 48
3.2.2.3 Percentage Yield of the prepared activated carbon 50
3.2.3 Adsorption kinetic of diclofenac sodium (DCF) onto
activated cyclamen tuber carbon
50
3.2.3.1 Determination method of DCF concentration 50
3.2.3.2 Diclofenac sodium standard solutions preparation 51
3.2.4 Adsorption experiment 52
3.2.4.1 Effect of adsorbent dosage 52
3.2.4.2 Effect of pH 52
3.2.4.3 Effect of temperature 52
3.2.4.4 Effect of contact time ( kinetic study) 53
3.2.4.5 Effect of diclofenac sodium (DCF) concentration 53
3.3 Results and discussion 53
3.3.1 FTIR analysis of activated carbon samples 53
3.3.2 Iodine number surface area 60
3.3.3 Percentage yield of prepared CTAC samples 62
3.3.4 Scanning electron microscopic (SEM) for AC 63
3.3.5 Adsorption of diclofenac sodium on AC from
cyclamen tubers
64
3.3.5.1 Effect of contact time 64

viii
3.3.5.2 Effect of adsorbent dosage 65
3.3.5.3 Effect of pH 66
3.3.5.4 Effect of temperature 67
3.3.5.5 Effect of diclofenac sodium concentration 69
3.3.5.6 Adsorption isotherm on CTAC 70
3.3.5.7 Kinetics of DCF adsorption on CTAC 73
3.3.5.8 Thermodynamic of DCF adsorption on CTAC 76
3.4 Conclusions 78
References 81
ب ا
ix
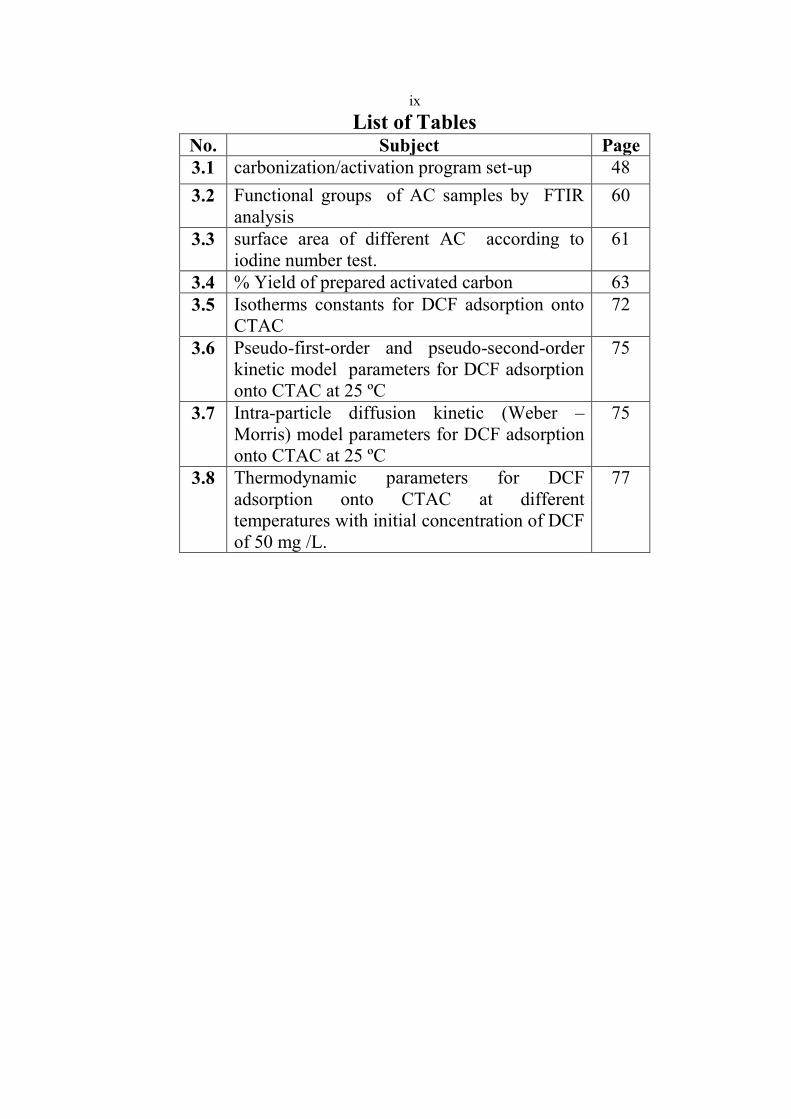
List of Tables No. Subject Page
3.1 carbonization/activation program set-up 48
3.2 Functional groups of AC samples by FTIR
analysis
60
3.3 surface area of different AC according to
iodine number test.
61
3.4 % Yield of prepared activated carbon 63
3.5 Isotherms constants for DCF adsorption onto
CTAC
72
3.6 Pseudo-first-order and pseudo-second-order
kinetic model parameters for DCF adsorption
onto CTAC at 25 ºC
75
3.7 Intra-particle diffusion kinetic (Weber –
Morris) model parameters for DCF adsorption
onto CTAC at 25 ºC
75
3.8 Thermodynamic parameters for DCF
adsorption onto CTAC at different
temperatures with initial concentration of DCF
of 50 mg /L.
77

x
List of Figures
No. Subject Page
2.1 Cyclamen persicum plant parts 7
2.2 Saponin glycoside structure from Cyclamen
repandum tubers
11
2.3 S. aureus bacterial colonies on (MHA) plate 19
2.4 Frothing test for saponin glycoside detection 20
3.1 Adsorption versus absorption 35
3.2 The structural formula of diclofenac sodium 41
3.3 DCF mechanism of action 42
3.4 Eucarbon® mediciene 45
3.5 Tube furnace scheme 48
3.6 FTIR analysis for activated carbon samples and
Eucarbon
54
3.7 SEM micrographs of several types of the produced
activated A ( ZnCl2 / CTAC) , B ( H3PO4 /CTAC
) , C (KOH /CTAC) , D( physically CTAC) , E
(Eucarbon® ).
62
3.8 A typical calibration curve for diclofenac sodium
analysis by UV-VIS spectrometric method
64
3.9 Effect of contact time on diclofenac sodium
removal by
CTAC and Eucarbon at (initial conc: 50 mg/L,
initial pH: 4, temperature: 25 ºC ).
65
3.10 Effect of adsorbent dosage on diclofenac sodium
removal by at (initial conc: 50 mg/L, initial pH: 4,
temperature: 25 ºC and contact time: 120 min).
66
3.11 Effect of pH on diclofenac sodium removal by
CTAC and Eucarbon at (initial conc: 50 mg/L,
temperature: 25 ºC, contact time: 120 min ).
67
3.12 Effect of temperature on diclofenac sodium
removal by CTAC and Eucarbon at (initial conc:
50 mg/L, initial pH: 4, contact time: 120 min.
68
3.13 Effect of diclofenac sodium conc on % removal by
CTAC and Eucarbon at (initial adsorbent dose:
0.25 g, initial pH: 4, contact time: 120 min,
Temperature 25 ºC)
69
3.14 Equilibrium adsorption isotherm of DCF onto
CTAC at (temperature: 20 ºC, initial pH: 4 and
solid/liquid ratio 0.25 g/50 mL).
70

xi
3.15 Langmuir plot for DCF adsorption onto CTAC at
(temperature 20 ºC, initial pH: 4 and solid/liquid
ratio 0.25 g/50 mL).
71
3.16 Freundlich plot for DCF adsorption onto CTAC at
(temperature: 20 ºC, initial pH: 4 and solid/liquid
ratio: 0.25 g/50 mL).
71
3.17 Pseudo-first order kinetic modeling of DCF
adsorption onto CTAC.
73
3.18 Pseudo-second order kinetics modeling of DCF
adsorption onto CTAC.
74
3.19 Intra-particle diffusion (Weber-Morris) modeling
of DCF adsorption onto CTAC.
74
3.20 Thermodynamic adsorption plot of ln K versus 1/T
for 50 mg/L DCF Concentration.
77

xii
List of Abbreviation
: Equilibrium concentration of the adsorbate.
: Initial solution concentration.
KL: Langmuir constant.
Freundlich relative adsorption capacity constant.
qt : Adsorption capacity at time t.
k1: Pseudo-first-order rate constant.
k2: Pseudo second order rate constant.
K`: Equilibrium constant of adsorption.
: Initial solute concentration fed to fixed bed.
Ct : adsorbate concentration in the fluid phase at time t.
Abs: Absorbance.
AC: Activated carbon.
CTAC : Cyclamen tubers activated carbon.
IN : iodine number (mg/g).
K* : Equilibrium rate constant of second-order kinetic model.
PR : percentage removal (%).
qe : Amount of adsorbate per unit mass of adsorbent at equilibrium(min).
qt : Amount of adsorbate per unit mass of adsorbent at time t (min).
DCF: Diclofenac sodium.
R : Correlation coefficient.
Vb : are volumes of sodium thiosulfate solution required for blank .
Cv : cylinder volume packed with dried activated carbon (ml).
Vs : are volumes of sodium thiosulfate solution required for sample
titrations(mL) .
ΔH° : standard enthalpy of a reaction.
ΔS° : standard entropy of a reaction.
ΔG°: standard free energy .

xiii
Activated carbon from Cyclamen persicum tubers for diclofenac
removal from aqueous solution
By
Fatima Mohammed Abdelwahab Hussen
Supervisor
Dr. Shehdeh Jodeh
Dr. Nidal Jaradat
Abstract
The aim of this work was to evaluate the antibacterial activity of the crude
methanolic extract obtaining from cyclamen persicum tubers and to re-use
the remaining tissues after extraction process to prepare activated carbon
by different methods then to set up a thermodynamic and kinetic study of
diclofenac sodium (DCF) pharmaceutical adsorption from aqueous solution
onto this activated carbon from cyclamen persicum tubers.
The prepared activated carbon samples were compared using Surface area
determined by iodine number method, scanning electron microphages
(SEM) and FTIR analysis. DCF adsorption onto activated carbon was
studied by batch experiments. The adsorptive properties of cyclamen tubers
activated carbon (CTAC) was investigated and compared with Eucarbon® ;
the available charcoal in the market, DCF concentration, pH, temperature
and contact time parameters were studied .
To investigate the nature of the surface and adsorption capacity of CTAC,
Freundlich and Langmuir models were used to study adsorption isotherm at
equilibrium. In order to determine whether the adsorption process is
chemical or physical, three kinetics models were used. Thermodynamic

xiv
study was carried out to determine if adsorption of DCF onto CTAC was
exothermic or endothermic reaction.
Results indicated antibacterial activity of the crude methanolic extract
against staphylococcus. aureis gram positive bacterial strain; using (MHA)
plate that showed zone of inhibition after overnight incubation at 37 °C, the
yield of this extract was 9%(w/w).
Results also showed that the activated carbon produced from cyclamen
tubers gives highest percentage yield which reaches up to 51.8%, using
phosphoric acid as activating agent, while largest Surface area determined
by iodine number was 606.78 mg/g using zinc chloride as activating agent,
SEM analysis showed that KOH produced the most porous structure in
CTAC.
Optimum percent of DCF removal was 72% when CTAC dosage was
0.25g and DCF concentration 50mg/L. Percentage removal of DCF
increases when the concentration of DCF increases as the maximum
percentage removal reached 81% when DCF concentration was 70mg/L
and 0.7g CTAC and pH ranging from 6 to 2.
The effect of temperature on adsorption by CTAC and Eucarbon® has also
been investigated in the range of 15-45 °C. The results indicated that the
temperature significantly affected DCF adsorption on both adsorbents.
xv
The equilibrium time for DCF adsorption was 120 min for CTAC and 150
min for Eucarbon®, but most of the adsorption attained within the first 15
min using CTAC while 30 min was needed for Eucarbon®.
Frenundlich model describe adsorption isotherm of DCF more efficiently
onto CTAC with n equal to 1.398 that indicated favorable adsorption. This
finding validated the assumption of multilayer physical adsorption process
of DCF. Pseudo-second order reaction model is the best for describing
adsorption of DCF with correlation coefficient closes to unity, this
validated that the adsorption process was physical one, adsorption process
was exothermic as ΔS° had negative charge, and also as ΔH° was less than
40 Kj / mol lthis suggesting a physisorption process. Concerning the change
in free energy, the adsorption process of the DCF onto CTAC was
spontaneous, depending on temperature.
1
Chapter 1
General Introduction
1.1. Research overview
Recently, carbon has been one of the magnificent elements which have
revolutionized material science. From carbon we obtain the best porous
adsorber (activated carbon) with excellent properties for large spectrum of
industrial and medicinal applications, the use of activated carbon in
medicine has a long historical tradition. Even the ancient Egyptians knew
about the medical use of charcoal 1550 years before Christ. At the end of
the 18th century, the German chemist Carl Wilhelm Scheele observed the
adsorption capacity of coal for gases [1].
Due to their fine distribution and large surface activated carbon is largely
capable of binding other substances, by this the harmful agents lose their
capability to affect the human body. The medical activated carbon is
obtained by the carbonization of raw materials at high temperatures:
Vegetable raw materials, such as wood, peat, walnut shells or coffee beans
can be used. Together with dehydrating agents they are heated up from 500
to 900 ºC and subsequently cleaned by a washout, to obtain an activated
carbon using chemical activator agent [2].
Carbenous material can be also activated by controlled pyrolysis of coconut
shells, bone, peat, lignite (coal), wood or petroleum under the flow of
steam, nitrogen gas or carbon dioxide at high temperatures (600-900 ºC). It

2
is washed with organic acids and dried. This “activation” creates the highly
developed internal pore structure and small particle size needed for
effective gastrointestinal decontamination. This “activation” also removes
substances previously adsorbed by the charcoal. For optimal adsorption,
charcoal should have small particle size, a large total surface area, and a
low mineral content. Optimal activated charcoal should have a surface area
of up to 1,000 m2/gram [3].
The amount of drug that adsorbs to the activated charcoal is dependent on
the charcoal-to-drug ratio, with the optimal ratio proposed to be 10:1.7 As
the dose of drug is rarely known, a standard dose of charcoal is normally
given. Toxin adsorption may be pH dependent, as these substances are
more likely to bind to activated charcoal in the unionized state. Higher
doses may be needed in the presence of food [4].
Activated charcoal has been shown to be effective agent in treatment of
drug poisoning cases due to its ability for drug adsorption, and then reduces
drug absorption into blood stream. A number of studies have investigated
the effects of activated charcoal on acetaminophen poisoning. The first
study compared three different decontamination methods in patients
ingesting 5g or more acetaminophen and showed that single dose AC
decreased the absorption of acetaminophen [5].
On the other hand many drugs and chemicals known to have little effect
from the administration of activated charcoal include common electrolytes,
iron, mineral acids or bases, alcohols, cyanide, most solvents, water

3
insoluble compounds such as hydrocarbons, lithium and other heavy
metals, this confirmed the suggested idea in using AC as antidote in drug
poisoning cases [6] .
Activated charcoal is also an effective remedy that can be used in a lot of
different conditions, such as :
Diarrhea ; by taking powdered activated charcoal along with clear liquids
such as vegetable broths, herbal teas (red raspberry, chamomile, and
peppermint ), will reduce electrolytes loss and to prevent dehydration
which caused in this condition. Food Poisoning; charcoal is very effective
for food poisoning as taking 1 tablespoon of charcoal in a glass of water
then drinking another glass of water will relieve food poisoning symptoms
especially diarrhea and abdominal pain. Gases (Flatulence); activated
charcoal will absorb gases very quickly and give relief of flatulence and
finally activated charcoal will be agood choise in indigestion by taking 1 -
2 tablespoonful of activated charcoal stirred in a glass of water will
facilitate digestion , and relieve the symptoms of gastric upset [7].
Commercial activated carbon is commonly produced from naturally
occurring carbonaceous materials such as coal, wood and peat, bones,
agricultural by products ,dried sewage sludge, carbonaceous materials also
can be obtained from paper mill sludge, old newspapers and waste tires[8].

4
On the other hand developing activated carbon for medicinal purposes
focuses on herbal resources as precursors of the carbonaceous material
such as vegetable residues, coconut-shell, palm seeds, olive stones, mixture
of apricot and peach stones, rice husks etc…[9].
1.2. Hypothesis of this work
This research is based on the hypothesis that Cyclamen Persicum tubers
will form an efficient source for developing herbal activated carbon with
high capacity for adsorption of various toxic materials as these tubers were
observed to retain and absorb water in high capacity for long time as it is
grown at rocky areas .
Also in this research a crude methanolic extract from cyclamen tubers will
be tested on staphlococcus. aureus bacterial strain in order to develop an
active ingredient for food poisoning treatment caused by this type of
microbes .
1.3. Objectives
The following objectives serve the goal of this research, which are:
Isolation of crude methanolic extract from cyclamen tubers and
investigation of its anti bacterial activity.
Production and characterization of activated carbon from the
remained tissues after the extraction process from cyclamen tubers.

5
Study the effect of chemical activation on the development of pore
structure of the produced activated carbon.
Study adsorption isotherms, kinetics and thermodynamics of
diclofenac sodium pharmaceutical adsorption onto activated carbon
produced from these tubers.
Compare the adsorption capacity of this prepared activated carbon
with Eucarbon®; the available medical charcoal in the market.
Developing an alternative drug for food poisoning treatment by
incorporating the extracted active ingredients with the prepared
activated carbon from these tubers.
1.4. Methodology
This project methodology is focused on making cyclamen persicum tubers
a good commercial source for medical applications, this is will be achieved
by the following two reaserches on these tubers.
In this research, obtaining a crude methanolic extract from cyclamen
persicum tubers was carried out by simple refluxing method using
methanol as a solvent for extraction, this extract was tested on
staphylococcus. aureus bacterial strain which causes usually food
poisoning.
The remaining cyclamen tubers tissues after extraction process were kept to
be used for the production of activated carbon by different method.
In this research, the production of activated carbon was carried out by using
6
chemical impregnation and physical activation. In physical activation, the
carbonization and activation were accomplished in a single step by carrying
out the thermal decomposition of the raw material under nitrogen gas flow.
While chemical impregnation with certain activating agents was carried out
in chemical activation process before carbonization. Three activating
agents were used, phosphoric acid, zinc chloride and potassium hydroxide.
Zinc chloride acts as a Lewis acid which is a strong dehydrating agent that
could modify the structure of carbon to form the porous structure. While
phosphoric acid, was also known as a strong acid acts as an acid catalyst to
promote cleavage reactions [10].
Potassium hydroxide is a strong base that react with the precursor by
exothermic reaction that leads to the formation of functional group –OK.
This bond oxidizes and removes the cross linkage between adjacent
graphene layers [11].
By using these three chemicals, the influences on the pore structure of the
produced AC can be accomplished, after the impregnation step, the
samples were carbonized in the horizontal furnace without using nitrogen
gas as inert atmosphere.
7
Chapter 2
Crude methanolic extract with antibacterial activity
from Cyclamen Persicum tubers
2.1. General background
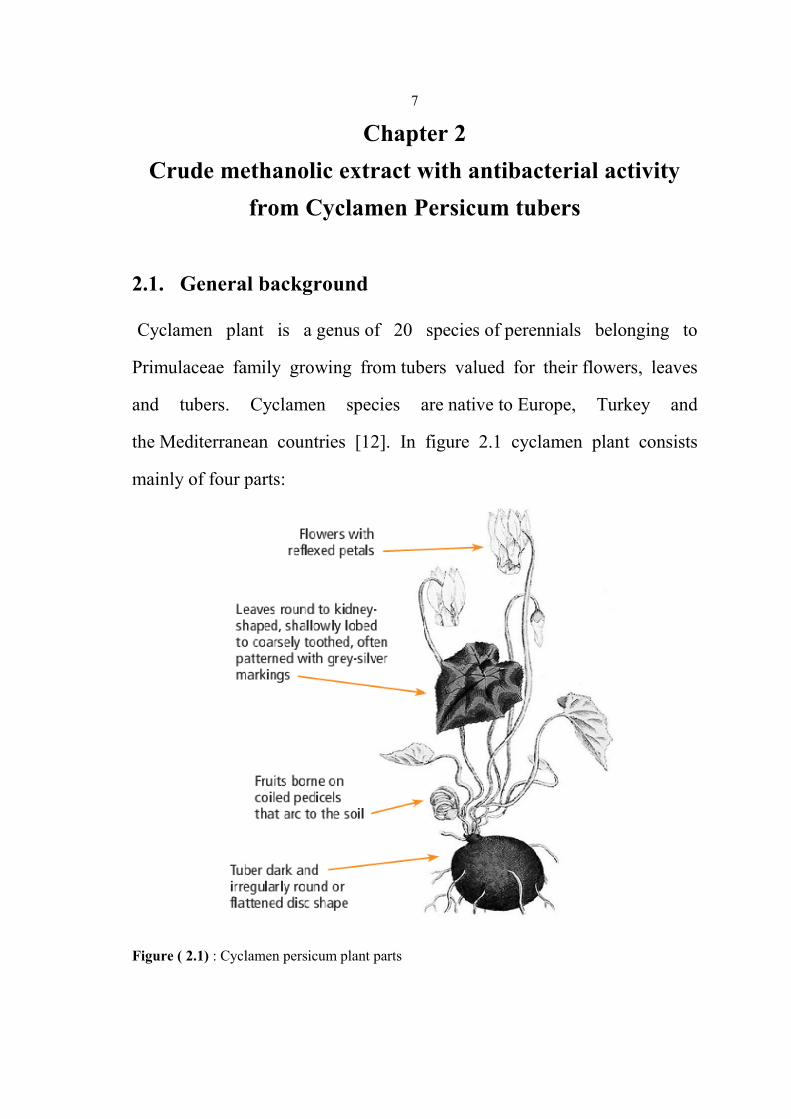
Cyclamen plant is a genus of 20 species of perennials belonging to
Primulaceae family growing from tubers valued for their flowers, leaves
and tubers. Cyclamen species are native to Europe, Turkey and
the Mediterranean countries [12]. In figure 2.1 cyclamen plant consists
mainly of four parts:
Figure ( 2.1) : Cyclamen persicum plant parts
8
The word "cyclamen" comes through Latin from the Greek cyclamīnos
meaning "circle", with reference to the shape of the tuber [13].
Tubers of cyclamen species are the storage organs from which flowers and
roots grow. It is a round in shape and develops from the hypocotyl (the
stem of a seedling). It is often mistakenly called a corm, but a corm (found
in crocuses for example) is defined as having a papery tunic and a basal
plate from which the roots grow. The storage organ of the cyclamen has no
papery covering and, depending on the species, roots may grow out of any
part [14].
The tuber may produce roots from the top, sides, or bottom, depending on
the species. Cyclamen persicum and Cyclamen coum root from the
bottom; Cyclamen hederifolium roots from the top and sides. Cyclamen
graecum has thick anchor roots on the bottom. The shape may be near
spherical, as in Cyclamen coum or flattened, as in Cyclamen hederifolium.
In older specimens of Cyclamen purpurascens and Cyclamen rohlfsianum,
growing points on the tuber may become separated by shoulders of tissue,
In most other species, the tuber is round in old age.
Leaves and flowers sprout in rosettes from growing points on the top of the
tuber. Growing points that have lengthened and become like
woody stems are known as floral trunks.

9
The size of the tuber varies depending on species. In Cyclamen
hederifolium, older tubers commonly reach 24 cm (9.4 in) across, but
in Cyclamen parviflorum, tubers do not grow larger than 2 cm (1 in) [15] .
2.1.1. Cyclamen persicum tubers in folk medicine
Several species of cyclamen plant tubers are widely used in traditional folk
medicine for their laxative and abortive effects, and anti-helmintic
properties [16].
In Turkish folk medicine tubers of Cyclamen are used as an ovule in their
natural form after removal of the outer surface, against infertility [17].
Pharmacological investigations on the methanolic extracts of Cyclamen
spp. tubers exhibited in the vitro cytotoxic activity [18]. Also spermicidal
effects of the cyclamen tubers extracts approved in some reaserches in
1985 [19].
In Europe the extract of cyclamen tubers was used as antimicrobial agent
due to its potency showed in vitro against bacteria [20].
Cyclamen tubers were used also for dermatological purposes due to their
anti inflammatory effects [21].
Also Fresh tubers of C. hederifolium were used in some parts of Itally to
treat hemorrhoids [22] .
10
2.1.2. Recent reaserches on cyclamen tubers
Antimicrobial activity tests were carried out against the
bacteria Pseudomonas aeruginosa , Salmonella choleraesuis . these tests
show inhibitory effects of cyclamen extracts against thses bacterial strains
[23].
Analgesic and anti-inflammatory activities was investigated at cyclamen
repandum tubers [24].
Early investigations on the different Cyclamen species resulted in the
isolation of triterpenoid saponins [25] .
A piperidine alkaloid and sterols were isolated from cyclamen coum tubers
[26].
The anthocyanin and flavonoid pigments of many Cyclamen cultivars have
also been investigated by various groups to show their effects in
pigmentation [27].
As a part of our ongoing studies on bioactive triterpenoid sapo-nins, we
investigated the chemical constituents of C. hederifolium.
Researches now adays are carried on Cyclamen tubes in order to isolate
active ingredients pocessing therapeutic effects on human.
Triterpene glycoside, repandoside was isolated from the methanol extract
of Cyclamen repandum tubers. The isolated saponin was characterized by
high resolution mass spectrometry and both 1D and 2D NMR

11
experiments.Antiinflammatory effect of this isolated saponin was
investigated in vitro to acheive good effects [28].
The structure of isolated saponin is given in figure (2.2)
Figure 2.2 : saponin glycoside structure from Cyclamen repandum tubers
Further investigation on this triterpene glycoside was carried out, to test
the anti proliferative activity in different cancer cell lines including Hela
(human cervical cancer cells), H-446 (human lung cancer cells), HT-29
(human colon carcinoma cells), U937 (human leukemia cells). In a range of
concentrations between 1 and 50 M, none of the tested compounds caused a
significant reduction of the cell number as compared to control [29].
In this research anti bacterial activity of methanol extract was investigated
against S. aurous bacterial strain in order to develop a new alternative drug
for food poisoning cases.
2.1.3. Staphylococcus aureus bacteria
It is a facultative anaerobic, Gram-positive coccus, it has a golden color
on the agar plate, aureus means "golden" in Latin.
12
S. aureus was discovered in Aberdeen; Scotland in 1880 by the
surgeon Sir Alexander Ogston in pus from surgical abscesses [30].
S. aureus can cause a range of illnesses like minor skin infections,
food poisoning, life-threatening diseases such as pneumonia, meningitis,
osteomyelitis, endocarditis, toxic shock syndrome (TSS), bacteremia and
sepsis [31].
As pathogenic bCFacteria in the human food chain staphylococci are one of
the most predominant bacterial species encountered during poultry
slaughter and processing. They have been recovered from air samples ,
neck skin of chicken carcasses, equipments and machinery surfaces.The
foods that most frequently cause Staphylococcus aureus food poisoning are
red meat, poultry and their products [32].
2.1.4. Saponin as an antibiotic alternative
Characteristics of Saponins
Saponins acquired their name from the soapwort plant (Saponaria root)
which was used as soap. Saponins are generally identified by their bitter
taste, throat irritation, froth and foam formation in aqueous solutions, fish
toxicity, and ability to lyse erythrosites [33].
Some saponins even have been used as flavor enhancers and sweeteners in
foods and cigarettes. For example, the flavor enhancer, licorice root extract
is rich in the saponin glycyrrhizin, and saponins from the roots of

13
Glycyrrhiza glabra are 941-fold as sweet as sucrose and 60 times sweeter
than cane sugar [34].
Chemical Nature of Saponins
Saponins are synthesized by a common metabolic pathway starting from
acetyl co-enzyme A. Mevalonic acid and then squalene are the
intermediary products for both triterpenoidal and steroidal saponins. In
general, synthesis of cholesterol, other steroids, and saponins proceed
through a common synthetic pathway[35].
Saponins are glycoside compounds whose chemical structures are
composed of a fat-soluble nucleus called the aglycone part that is either
triterpenoid (C-30), or neutral or alkaloid steroids (C-27) . One or more
sugar side chains called glycones can be linked through ether and ester
linkages to the aglycone nucleus at glycosylation sites. Triterpenoid
saponins naturally occur as saponin or free aglycone forms, while steroid
saponins occur only as saponins and never in the free aglycone form. The
molecular weights of saponins range from 1000 to 1500 Daltons [36].
Antibacterial and biological Activities of saponin
The antibacterial activity of saponins is affected by factors such as the
aglycone part, number, position and chemical structure of sugar side chain.
Many saponins are antimicrobial and considered as a part of plants’
defense systems. Plants known to have antimicrobial activity include

14
yucca, ginseng, and triterpenoid saponins from Holothuroidea class of
marine echinoderm animals [37].
Not all saponins have antibacterial activity. For example, medicagenic and
zanhic acid saponins isolated from alfalfa plants do not show activities
against Escherichia coli, Staphylococcus aureus, Bacillus subtitles,
Pseudomonas aeruginosa and Mycobacterium intracellular [38].
Antibacterial activities of saponins differ according to type of the bacteria.
Some saponins such as ivy saponin, spirostanol saponin, asterosaponin
from starfish, and yucca saponin show more antimicrobial activity against
gram positive bacteria (Staphylococcus aureus) than gram-negative bacteria
(Escherichia coli) at the same concentration. It was noted that saponin-rich
yucca extracts in ruminant diets decreased cellulolytic bacteria while not
affecting amylolytic bacteria [39].
Quillaja saponin (Quillaja saponaria) and yucca saponin (Yucca schidigera)
obtained from different commercial companies exhibited antibacterial
activity against Escherichia coli K-12 with different efficiencies,
suggesting that saponins from various sources differ in their biological
activity due to their different chemical structures and extraction procedure
[40].
Extraction methods and fat content have important effects on the
antibacterial activity of the resultant plant extracts. For example, fat free
extracts from Bauhinia variegata L. bark were more active than high fat

15
extracts against gram-positive bacterial strains such as Staphylococcus
aureus. However, fat free extracts exhibited either similar or less
antibacterial activity than high fat extracts against gram-negative bacterial
strains such as Escherichia coli.
Many of the biological activities mentioned above can be mediated by
interaction of saponins with cell surface proteins and receptors, secondarily
affecting enzymes.
Saponins also affect hormone activity. For example, saponins exhibit
strong stimulation effects on both adrenocorticotropic hormone (ACTH)
and corticosterone hormone . They show mineralocorticoid-like activity by
transforming biologically active steroid cortisol hormone into its inactive
metabolite, cortisone [41].
2.1.5. Toxicity of saponin
Many saponins exhibit toxic effects at high doses over long periods of time
causing problems such as excessive salivation, vomiting, diarrhea, loss of
appetite and manifestations of paralysis .Oral toxicity of saponins to warm-
blooded animals is relatively low and LD50 (lethal dose, 50%) values are
in the range 50-1000 mg/kg [42].
However, they are highly toxic when given intravenously. The toxic effects
of many saponins are neutralized by saliva of animals such as sheep,
intestinal bacteria [43].

16
Not all saponins are degraded at the same conditions and temperature. For
example, oat saponins are not affected until heated to 140 °C for 3 h.
Degradation increases as the pH decreases from 7 to 4 in avenacoside A.
Saponin degradation sometimes induces activity of enzymes such as β-
glycosidase that occur naturally in oat leaves. Removing the C-26-bound
glucose moiety results in forming a monodesmosidic saponin with the
highest antifungal activity [44].
Effect of Saponins on Intestinal Activity, nutrient Digestion and absorption
showed that Saponins reduce intestinal motility , increase the transit time of
ingesta, inhibit gastric emptying. Saponins can cause intestinal lesions,
damage the intestinal villi and alter intestinal morphology in the lower
intestine [45].
Many saponins decrease digestion by changing the site and the extent of
nutrient digestion in ruminants and altering rumen fermentation. Total
volatile fatty acid and microbial protein synthesis can be reduced. Digestive
coefficients of some organic matterials such as hemicelluloses and
cellulose are reduced and digestibility of some nutrients such as protein are
also reduced perhaps potentianted by damage to the intestinal
membranes[46].
17
2.2. Experimental set up
2.2.1 Materials and methodology
2.2.1.1 Plant material
Cyclamen persicum tubers were collected from different sites in Tulkarem
and Nablus cities between the months of July and September, 2012. These
tubers were identified by Dr. Nidal Jaradat, Faculty of pharmacy, An-Najah
National University, Palestine. The tubers were sun dried, cut into small
pieces then grounded using electronic grinder to obtain powdered tubers.
2.2.1.2 Crude methanolic extract from cyclamen tubers powder.
Simple refluxing method was followed for extraction of saponin glycosides
from Cyclamen tubers powder by suspending (150 g) of this powder 400
ml methanol and refluxed with magnetic stirring for about 4 hours at
40ºC.
The refluxed extract was cooled then filtered and the resulting solution was
evaporated to dryness to yield 19 g gummy yellow methanolic extracts
which stored at room temperature until used in further studies.
The remained cyclamen tuber powder was washed thorouly by distilled
water and dried at 110 ºC in an oven, to be used for activated carbon
production .This crude extract was kept under 4 ºC temperature in air tight
container.
18
2.2.1.3. Frothing test for saponin detection in this extract
Frothing test was acheived on the basis that aqueous solution of
saponins form very stable foams, that lasts at least for 10 min.
So 1 ml of the concentrated methanolic solution of the extract was
shaken with 5 ml of distilled water in a test tube. Formation of a
stable foams for 10 min will indicate the presence of saponin glycosides.
2.2.1.4. Test for antibacterial activity
Sensitive microorganisms employed in this study Staphylococcus.
aureus (Gram positive), was obtained from the Department of
Microbiology and Parasitology- Faculty of Science; AL-Najah University.
Susceptibility test of s. aureus bacteria to the methanolic extrac was
performed using surface of Muller-Hinton Agar (MHA) plates .Solution of
this methanolic extrat has been prepared in concentration of 4 mg of
extract per 1 ml of distilled water as a solvent .
This prepared solution was placed on the (MHA) plate containing bacteria
and incubated for 24 h at 37 ºC. The sensitivity of s. aureus against
saponin was evaluated by observing for zone of growth inhibition of this
bacteria in the plate.
In Figure ( 2.3 ) staphylococcus .aureus bacterial colonies have been shown
on (MHA) plate.

19
Figure 2.3 : S. aureus bacterial colonies on (MHA) plate
2.3. Results and discussion
The crude methanolic extract yield was calculated according to the
following equation:
This yield was 9% (w/w) of methanolic extract obtained from cyclamen
persicum tubers.
Frothing test to indicate the presence of saponin glycosides in this extract
showed positive result as one half cm foam lasted in the test tube for 10
min as shown in figure 2.4. So this extract forms a good source of saponin
glycosides that can be further isolated.

20
Figure 2.4 : frothing test for saponin glycoside detection
The yellow gummy extract exhibited in vitro anti bacterial activity against
staphylococcus bacteria as inhibition zone of staph .aureus on agar plate
(MHA) was observed after 24h incubation at 37ºC. this inhibition zone
was measured in millimeter using transparent ruler at different dilution
series as following:
Dilution factor inhibition zone (mm)
Pure 11
1:1 9
1:4 -
These results indicated that methanolic extract from cyclamen tubers was
active against gram positive staphylococcus aureas bacteria .

21
2.4. Conclusion
By this simple extract in method we concluded that a good yield of crude
methanolic extract from cyclamen persicum plant tubers can be obtained ,
which exhibited in vitro antibacterial activity against gram positive
staphylococcus .aureus bacterial strains.
Further investigations can be carried out on this extract for isolatinon of
different types of saponin glycosides compounds in future works.
These compounds may have other antimicrobial activity against several
types of microbes , this can be developed in more sophisticated researches.
22
Chapter 3
Activated carbon from Cyclamen Persicum Tubers for
Diclofenac removal from aqueous solution
3.1. General background
Activated carbon (AC) is defined as a solid, porous, black, tasteless
carbonaceous material, which have been subjected to reaction with gases
during or after carbonization in order to increase porosity. AC is
distinguished from elemental carbon by the removal of all non-carbon
impurities and the oxidation of the carbon surface. The main features
common to all AC are; graphite like referred to as Basic Structure other
definition for AC is that it is an amorphous solid with a large internal
surface area and pore volume [47].
For these reasons, activated carbons are widely used as adsorbents for the
removal of organic chemicals and metal ions of environmental or economic
concern from air, gases, potable water and wastewater.The surface oxygen
functional groups can be easily introduced to the carbon by different
activation methods including dry and wet oxidizing agents. Dry oxidation
methods involve the reaction with hot oxidizing gas such as steam and CO2
at temperatures above 700 ºC [48].
While wet oxidation methods involve the reaction between the carbon
surface and solutions of oxidizing agents as phosphoric acid (H3PO4), nitric
acid (HNO3), hydrogen peroxide (H2O2), zinc chloride (ZnCl2), potassium

23
permanganate (KMnO4), ammonium per sulphate (NH4)2SO8, potassium
hydroxide (KOH), etc.
From the above oxidizing agents, phosphoric acid and zinc chloride are
usually used for the activation of lignocellulosic materials, which have not
been carbonized before [49].
On the other hand, potassium hydroxide is usually used to activate coal or
chars precursors. It has been reported that zinc chloride produces activated
carbon with higher specific area than that produced by using phosphoric
acid. However, phosphoric acid activation is widely preferred over zinc
chloride because ZnCl2 has bad environmental impact and the activated
carbon produced when using it cannot be used in the food and
pharmaceutical industries [50].
3.1.1. Activation methods for activated carbon production
Production of activated carbon involves the two main steps which are
pyrolysis where the carboneous source materials are heated, decomposed
and converted to carbonized material in the absent of air . Then, the process
is continued by activation step which will increase the surface area of the
carbonized material. At present, there are two different activation
processes: (1) steam activation, (2) chemical activation. In steam
activation, steam is introduced in temperature range 600-1200 ºC, whereas
in chemical activation, raw material is impregnated with strong dehydrating

24
agent such as phosphoric acid (H3PO4) or zinc chloride (ZnCl2) and then
heat to 500-800 ºC to activate the carbon [51].
Activation process are discussed in detail as folowing:
Physical pyrolysis
In physical pyrolysis method the raw material with less than 25% moisture,
is carbonized first at 400 - 500 ºC to eliminate the bulk of the volatile
matter and then the carbon is subjected to oxidizing gases usually carbon
dioxide or steam at 800-1000 ºC or and with air at lower temperature, for
selective oxidation. The oxidation is preceded usually by a primary
carbonization of raw material. The pyrolysis of wood starts at temperature
about 225 ºC .
Carbon is oxidized by atmospheric oxygen is exposed also to CO2, so the
air should be excluded or very controlled during carbonizing and activating
The activation of charcoal consists in thermal treatment at high
temperatures (800-1000 ºC ), as a result, these incomplete combustion
products burn up and volatilize [52].
Chemical activation
Chemical activation has two important advantages when a lignocelluloses
material is especially used as a raw material. One is the lower temperature
at which the process is accomplished making the process more economical
compared to physical activation. The other is that the yield of chemical

25
activation is relatively higher, since carbon burn-off char is not required
The formation of tar and other by-products is inhibited by the chemical
agent [53].
Examples of chemical activating agents used in this research include zinc
chloride, phosphoric acid, or potassium hydroxide. The chemical is mixed
with the precursor prior to a carbonization step. This carbonization is often
milder in time and temperature than physical activation techniques. The
chemical agent acts to restrict the formation of tar during the heat treatment
within the carbon matrix. The chemical is then washed from the carbon,
and a porous structure remains. Chemical activation often creates
impressive pore structures with large surface areas, however the chemical
addition and washing steps leave the resulting carbon with an acidic
surface. This higher surface acidity can be deleterious to performance in
some adsorption conditions [54].
3.1.2. Activated carbon efficiency
Activated carbon efficiency for removing a given substance depends on
both its surface chemistry and its adsorption capacity. The AC adsorption
capacity is usually attributed to its internal pore volume that may be
distributed throughout the solid as pores ranging in width from micropores
to macrospores. When the pore sizes of the activated carbon are in the size
range of the pollutants, adsorption process will be enhanced and is
expected to be efficient. Adsorption capacity of the finished activated

26
carbon also depends essentially on the type of the activation methods and
on the structural properties of the original precursor material [55].
3.1.3. Commercial forms of activated carbon
Commercial activated carbon is produced as powder (PAC), fibers (FAC),
or granules (GAC) depending on its application. It regularly exhibits BET
specific surface magnitudes between 500 and 2000 m2 / g. However, the so-
called "super-activated carbons" exhibit surfaces areas above 3000 m2 / g.
Activated carbon's macro, meso, and micropore volumes may range from
0.5 to 2.5 m2 /g [56].
3.1.4. Applications of activated carbon:
Activated carbon is used in gas purification, gold purification, metal
extraction, water purification, medicine, sewage treatment, air filters in gas
masks and respirators, filters in compressed air and many other
applications.
Recently Activated Carbon filters have gained popularity among
recreational users of Cannabis, and other smoking herbs for their use in
effectively filtering out "Tar" from the smoke. They are becoming quick
competition for Vaporizers as they are only a fraction of the cost and
achieve nearly the same thing.
One major industrial application involves use of activated carbon in the
metal finishing field. It is very widely employed for purification of

27
electroplating solutions. For example, it is a main purification technique for
removing organic impurities from bright nickel plating solutions. A variety
of organic chemicals are added to plating solutions for improving their
deposit qualities and for enhancing properties like brightness, smoothness,
ductility, etc. Due to passage of direct current and electrolytic reactions of
anodic oxidation and cathode reduction, organic additives generate
unwanted break down products in solution. Their excessive build up can
adversely affect the plating quality and physical properties of deposited
metal. Activated carbon treatment removes such impurities and restores
plating performance to the desired level [57].
In environment field activated carbon can be used for removal of poisonous
heavy metal ions from aqueous solutions. Adsorption in this case is due to
the surface complex formation between the metal ions and the acidic
surface functional groups of AC. Adsorption is due to the surface complex
formation between the metal ions and the acidic surface function group of
AC. The removal efficiency is influenced by various factors, such as
solution concentration, solution pH, ionic strength, nature of adsorbate,
adsorbent modification procedure, Physical properties (surface area,
porosity), and the chemical nature of AC [58].
In medical applications activated carbon is used to treat poisonings and
overdoses following oral drug ingestion. It is thought to bind to poison and
prevent its absorption by the gastrointestinal tract. In cases of suspected
poisoning, medical personnel administer activated charcoal on the scene or
28
at a hospital's emergency department. Dosing is usually empirical at 1
gram/kg of body mass (for adolescents or adults ,give 50–100 g), usually
given only once, but depending on the drug taken, it may be given more
than once .In rare situations activated charcoal is used in Intensive Care to
filter out harmful drugs from the blood stream of poisoned patients.
Activated charcoal has become the treatment of choice for many
poisonings, instead of other decontamination methods such as ipecac-
induced emesis or stomach pumping [59].
3.1.5. Surface characteristics and chemistry of activated carbon in this
research
Activated carbon has unique characteristics; its high adsorption capacity is
related to the porous structure and chemical characteristics. These
characteristics determine its interaction with polar and non-polar
compounds. It also has active edge sites that determine its chemical
reaction nature. Therefore, the adsorption phenomena can't be only
explained in relation to surface texture including surface area and pore size
distribution, but a combination of both surface and chemical characteristics
of activated carbon.
Scanning electron microscope analysis (SEM):
The main features of the SEM are an electron source which provides the
electrons that interact with the material to be examined, an arrangement of
metal apertures, magnetic lenses and scanning coils or deflectors plates that
confines, focuses and turns the beam of electrons into a thin and focused
29
monochromatic beam which is accelerated towards the sample and which
irradiates the specimen in a raster fashion [60].
The interaction of the electrons with the specimen initiates a number of
reactions inside the sample which results in the generation of signals which
are taken advantage of to gain information about the sample. The SEM
imaging process involves four major steps. These include sample
preparation, the specimen scanning process, image formation and image
analysis. The kind of preparation required of the sample depends on
whether it is electrically conducting or not. Electrically conducting
samples, for instance metals, only require minimal sample preparation prior
to mounting on a sample stub for scanning and imaging. Non-conductive
specimens such as activated carbons, however, must first be made
conducting before mounting for study. Otherwise, these tend to charge
when scanned by the electron beam leading to scanning faults and other
image artifacts. Non-conducting samples are therefore first sputter coated
with an ultra-thin coating of an electrically-conducting material before
imaging. Other reasons for coating the sample surface are to increase the
signal and surface resolution, especially with samples of low atomic
number. Some of the commonly used materials for coating samples include
gold, graphite, platinum, chromium, tungsten, osmium, and indium. For
biological materials it is possible to increase the conductivity without
coating by impregnating them with osmium before imaging. It is also
possible to image non-conducting specimen without coating by using the
Environmental SEM (ESEM) or the field emission gun (FEG) SEM [61].

30
Iodine value of the activated carbon:
To investigate the porous structure of activated carbon, iodine adsorption
from liquid phase was adopted by some researchers, in the characterization
of sludge-based activated carbons. The adsorption of aqueous iodine is
considered a simple and quick test for evaluating the surface area of
activated carbons associated with pores larger than 1 nm [62].
The iodine value, defined as the amount of iodine adsorbed per gram of
activated carbon at an equilibrium concentration of 0.02 N iodine solution,
was measured according to the procedure established by the American
Society for Testing and Materials. The mean values of data for each
experiment were presented , standard deviation was calculated from
triplicate samples.
Iodine Number is accepted as the most fundamental parameter used to
characterize activated carbon performance. It gives the measure of activity
level (higher number indicates higher degree of activation) [63].
Iodine number indicates the micro pore (0 – 20 Å) content, reagents used
in the iodine value test are as listed below:
0.1N Iodine solution ( 12.7 g iodine in 1 Liter of Distilled water ).
0.05N Sodium thiosulphate pentahydrate solution (12.5 gm
Na2S2O3.5H2O in 1 liter distilled water)
1% Starch solution freshly prepared

31
Activated carbon
Procedure of the iodine value test:
( I ) Standardization of Iodine solution
* 10c.c of 0.1N Iodine solution was taken in conical flask.
* 2 drops of Starch solution was added to it.
* The pale yellow colour of Iodine Solution turned Blue.
* Titration of the formed solution was done with 0.05 N Sodium
thiosulphate till it becomes Colorless.
* Burette reading corresponds to blank reading.(B)
( II ) Activated carbon testing:
* 0.2 gm of Activated carbon was weighed very accurately.
* It was introduced into the Iodine flask which should be completely dry .
* 40cc of 0.1N Iodine solution was then added.
* The flask was shaken properly for 4 minutes and then filtered.
* The filterate was collected in a dry flask and then 10cc of the filtrate was
titrated against standard Sodium thiosulphate solution using starch as
indicator.

32
Burette reading corresponds to (A)
Calculations involved in iodine value estimation:
Iodine value: C x Conversion factor; mg/g
Factor: Mol wt. of iodine (127) x normality of iodine x 10 / Wt. of carbon x
Blank reading(B)
C=B-A
BET –Surface area of activated carbon
The surface area of activated carbon can be precisely determined by
measuring the adsorption isotherm for nitrogen gas molecules and
analyzing results using the Brunauer-Emmett-Teller (BET) isotherm
equation (1938). BET model is mostly used in surface area measurement of
amorphous material due to its simplicity, and accommodation with
different adsorption isotherm types .The BET model extends the monolayer
Langmuir model to multilayer adsorption. It assumes that the surface is
homogeneous and that the different layers of molecules do not interact; in
addition, forces of attraction between adsorbed molecules are neglected.
Each adsorbed molecule in the monolayer is assumed to be an adsorption
site for second layer of molecules, and so on. The relative pressure
increases, until bulk condensation occurs [64] .
Fourier Transform Infrared Spectroscopy ( FT-IR) :
FT-IR is most useful for identifying chemicals that are either organic or
inorganic. It can be utilized to quantitate some components of an unknown
mixture. It can be applied to the analysis of solids, liquids, and gasses. The

33
term Fourier Transform Infrared Spectroscopy (FT-IR) refers to a fairly
recent development in the manner in which the data is collected and
converted from an interference pattern to a spectrum. Today's FTIR
instruments are computerized which makes them faster and more sensitive
than the older dispersive instruments. FTIR is commonly used to identify
chemicals from spills, paints, polymers, coatings, drugs and contaminants.
FTIR is perhaps the most powerful tool for identifying types of chemical
bonds (functional groups). The wavelength of light absorbed is
characteristic of the chemical bond as can be seen in this annotated
spectrum. By interpreting the infrared absorption spectrum, the chemical
bonds in a molecule can be determined. FTIR spectra of pure compounds
are generally so unique that they are like a molecular "fingerprint". While
organic compounds have very rich, detailed spectra, inorganic compounds
are usually much simpler. For most common materials, the spectrum of an
unknown can be identified by comparison to a library of known compound.
Several infrared spectral libraries including on-line computer libraries, to
identify materials [65].
The surface functional groups anchored within carbons were found to be
responsible for the variety in physicochemical and catalytic properties of
the matters considered . So many researchers focused on how to modify as
well as to characterize the surface functional groups of carbon materials in
order to improve or extend their practical applications .The heteroatom on
the surface of activated carbon took significant role on its application. The
heteroatom of porous carbon surface mainly contained oxygen, nitrogen,

34
hydrogen, halogen, etc, which bonded to the edges of the carbon layers and
governed the surface chemistry of activated carbon. Among these
heteroatom, the oxygen-containing functional groups (also denoted as
surface oxides) were the widely recognized and the most common species
formed on the surface of carbons, which significantly influenced their
performance in sensors [66].
3.1.6. Adsorption Process definition
Adsorption is attachment or accumulation of fluid particles on pores of
surface, but absorption is taken fluid molecules by liquid or solid and
distribution throughout them. The substance that adsorbs is the adsorbate
and the underlying material is the adsorbent or substrate. The process of
adsorption involves separation of substance from one phase accompanied
by its accumulation or concentration at the surface of another. Separation
occurs due to differences in molecular weight, shape or polarity. These
differences cause some molecules to be held more strongly on the surface
than others or because the pores are too small to admit the larger
molecules. The reverse of adsorption is desorption [67].
3.1.6.1. Adsorption versus absorption.
Absorption is a physical or chemical process in which the molecules of one
phase are uniformly interpenetrated among those of the other some bulk
phase: gas, liquid or solid material to form a solution [68] .While in

35
adsorption molecules of one phase are present at the surface of the second
phase; the difference is illustrated in (Fig 3.1 ).
Figure 3.1 : Adsorption versus absorption
3.1.6.2. Adsorption mechanism
Adsorption process is one of the methods that used to remove contaminants
such as pharmaceuticals, heavy metals and others from water. Other
conventional processes for removing these compounds include extraction,
steam distillation, bacterial and chemical techniques, oxidation with
ozone/hydrogen peroxide ion-exchange electrochemical oxidation reverse
osmosis and photo catalytic degradation. Among the unit operations in
water and waste water treatment, adsorption technique remains widely
preferred due to its simplicity of design and operation initial cost,
flexibility and, ease of operation and insensitivity to toxic pollutants.
Moreover, adsorption does not result in the formation of harmful
substances [69].
36
In adsorption process atoms on the surface of the adsorbent are not wholly
surrounded by other adsorbent hold molecules atoms and therefore can
attract and of contacting adsorbate. The exact nature of the bonding
depends on the details of the species involved, but the adsorption process is
generally classified as physical adsorption (physisorption): a weak
interaction mainly due to Vander Waals forces or chemical adsorption
(chemisorption): interaction between the adsorbate and adsorbent's surface
is strong characterized by electronic bonds (e.g. ionic or covalent) [70].
3.1.6.3. Adsorption isotherms
An adsorption isotherm is the presentation of the amount of solute
adsorbed per unit weight of adsorbent as a function of the equilibrium
concentration in the bulk solution at constant temperature.
The most frequently isotherms used in describing the non-linear
equilibrium are: Langmuir isotherm, Freundlich isotherm and Brunauer
Emmett and Teller (BET) isotherm [71]. We will follow in this research the
two following adsorption isotherm models:
Langmuir Isotherm
In1916, Irving Langmuir was the first to develop a theoretical isotherm to
describe the reaction between adsorbed gases above a solid surface at a
fixed temperature; he was awarded Nobel Prize in chemistry for his
work.The Langmuir isotherm, originally derived for the adsorption of gas

37
molecules on solid surfaces, was modified to fit the adsorption isotherm of
solutes onto solid surfaces in solution systems.
Assumptions of Langmuir Model:
1- Monolayer adsorption: at maximum adsorption each site of free surface
adsorbent can be occupied only by one adsorbate molecule, no deposition
of adsorbate.
2- Identical adsorbent surface: adsorbent has a uniform surface and all sites
are energically equivalent, so adsorption occurs through the same
mechanism.
3- Adsorption is localized: when a molecule adsorbed at a given site it is
independent on the occupation of neighbouring sites, no movement of the
adsorbate on the surface of adsorbent, but molecule can be desorbed to
solution (a reversible process).
Langmuir equation (1.1) is given as follows:
(1.1)
Where qe is the amount of DCF adsorbed per unit mass of activated
carbon (mg/g) at equilibrium, qm is the maximum amount of DCF
adsorbed per unit mass of activated carbon (mg/g), Ce is the equilibrium
concentration of the DCF (mg/L), and b is the Langmuir constant (L/mg).

38
The Langmuir isotherm model which is based on the assumption of a
homogeneous adsorbent surface with identical adsorption sites [72].
Freundlich Isotherm
In 1914, Freundlich popularized and justified theoretically another
adsorption isotherm model , so known with his name. this assumption is
given in the following equation (1.2) :
(1.2)
Where Ce is the equilibrium concentration of the adsorbate (mg/L), qe is
the amount of adsorbate per unit mass of adsorbent (mg/g) at equilibrium,
KF and n are Freundlich constants. n giving an indication of how favorable
the adsorption process is. Kf has unit of ((mg/g) (L/mg).
(1/n) is related with adsorption capacity of the adsorbent. The slope (1/n)
ranging between 0 and 1 is a measure of surface heterogeneity, becoming
more heterogeneous as it is value gets closer to zero [73] .
3.1.6.4. Adsorption kinetic models
Adsorption kinetics study is important, since they give information about
the adsorption system behavior and the rate at which specific constituent
removed using certain adsorbent. In addition, they provide information
about whether the adsorption process is chemical or physical and which
specifically is the rate limiting step. There is several models that describe

39
the adsorption process. In this research we will use adsorption reaction
models, which are classified into :
Pseudo-first order kinetic models
A pseudo-first order kinetic model is considered as the earliest model
developed to the kinetic process of adsorption. The final integrated form
equation of this model as follows:
(1.3)
Where qe and qt (mg/g) are the adsorption capacity at equilibrium and at
time t (min), respectively. k1 (min-1) is the pseudo-first order rate constant
[74].
Pseudo-second order kinetic models
This model is commonly employed to describe the adsorption of metal
ions and polar functional group such as, ketones, aldehydes, dyes,
herbicides, and phenolic compounds from aqueous solution assuming
that Langmuir equation applies. The linearzed integral form of the
model is:
(1.4)
Where qe and qt (mg/g) are the adsorption capacity at equilibrium and at
time t (min), respectively K2 is the rate constant (g/(mg.min)) [75].

40
Second order kinetic models
The typical form of second order rate equation can be applied to describe
the adsorption process based on adsorbate uptake rate. The integrated forms
of this equation as follow :
(1.5)
Where C0 and Ct (mg/L) is the concentration of solute at t=0 and at time t
(min), respectively, and K2*(L/(mg.min) is the rate constant [76].
Intra-particle diffusion model:
In a liquid-solid system, the theory proposed by Weber and Morris to link
the fractional uptake of solute on particles varies proportionally here with
.
The Weber and Morris equation is:
(1.6)
qt (mg/g), Kb (mg/g min1/2) is the rate constant of intra-particle diffusion
and (A) gives an idea about the thickness of the boundary layer. The value
of kb will be calculated from the slope of the resulting curve[77].
41
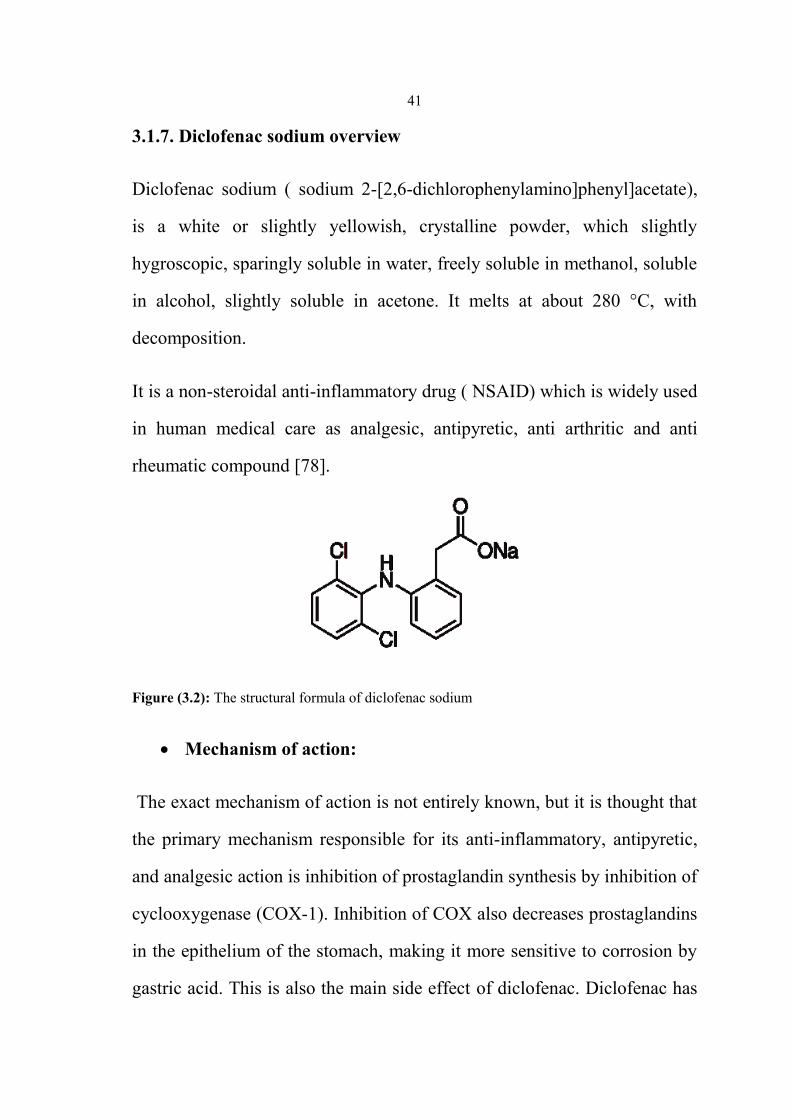
3.1.7. Diclofenac sodium overview
Diclofenac sodium ) sodium 2-[2,6-dichlorophenylamino]phenyl]acetate(,
is a white or slightly yellowish, crystalline powder, which slightly
hygroscopic, sparingly soluble in water, freely soluble in methanol, soluble
in alcohol, slightly soluble in acetone. It melts at about 280 °C, with
decomposition.
It is a non-steroidal anti-inflammatory drug ( NSAID) which is widely used
in human medical care as analgesic, antipyretic, anti arthritic and anti
rheumatic compound [78].
Figure (3.2): The structural formula of diclofenac sodium
Mechanism of action:
The exact mechanism of action is not entirely known, but it is thought that
the primary mechanism responsible for its anti-inflammatory, antipyretic,
and analgesic action is inhibition of prostaglandin synthesis by inhibition of
cyclooxygenase (COX-1). Inhibition of COX also decreases prostaglandins
in the epithelium of the stomach, making it more sensitive to corrosion by
gastric acid. This is also the main side effect of diclofenac. Diclofenac has

42
a low to moderate preference to block the COX2-isoenzyme
(approximately 10-fold) and is said to have therefore a somewhat lower
incidence of gastrointestinal complaints than noted with indomethacin and
aspirin [79].
Figure (3.3) : DCF mechanism of action
Side effects:
Gastrointestinal experiences including: abdominal pain, constipation,
diarrhea, dyspepsia, flatulence, gross bleeding/perforation, heartburn,
nausea, GI ulcers (gastric/duodenal) and vomiting. Abnormal renal
function, anemia, dizziness, edema, elevated liver enzymes, headaches,
increased bleeding time, pruritus, rashes and tinnitus. fever, infection,
sepsis, congestive heart failure, hypertension, tachycardia, syncope, dry
mouth, esophagitis, gastric/peptic ulcers, gastritis, gastrointestinal bleeding,
glossitis, hematemesis, hepatitis, jaundice, eosinophilia, leukopenia,
melena, purpura, rectal bleeding, stomatitis, thrombocytopenia, weight
changes, anxiety, asthenia, confusion, depression, dream abnormalities,

43
drowsiness, insomnia, malaise, nervousness, paresthesia, somnolence,
tremors, vertigo, asthma, dyspnea, alopecia, photosensitivity, sweating
increased, blurred vision, cystitis, dysuria, hematuria, interstitial nephritis,
oliguria/polyuria, proteinuria, renal failure [80].
3.1.7.1. Environmental impact of diclofenac sodium (DCF)
In recent years, diclofenac was found as an environmental contaminant in
sewage, surface, ground, and drinking water samples. In long-term
monitoring investigations of sewage was identified as one of the
environmentally most important pharmaceutically active compounds
(PhACs) present in the water cycle at concentrations up to the mg/l level.
No significant removal of diclofenac is observed during municipal sewage
treatment [81].
Sources of this pharmaceutical in environment
In spite of all benefits of these drugs in the treatment of many diseases for
human and animals, but if they were added to the environment in large
quantities, special interest will be needed. Through several sources this
pharmaceutical will be found that include:
1. Direct disposal at manufacturing.
2. Excretion with urine and feces (sewage water).
3. Drugs in animal manure [82].

44
3.1.7.2. Recent researches on diclofenac sodium (DCF) removal from
aqueous solution
Different trace pollutants and often enough some of these pollutants leave
the Sewage treatment plant unaffected. Some advanced water clarification
techniques, as ozonation, membrane bioreactors or coagulation/flocculation
and flotation, have been brought into discussion to improve the removal of
these trace pollutants like diclofenac [83].
Silica gel synthesized by sol-gel process was used as an adsorbent for
removal of diclofenac from contaminated water [84].
Carbamazepine and diclofenac removal was studied in waste water
treatment plants and occurrence in water bodies leading to that they don’t
cause acute environmental toxicity but their chronic effects needs attention,
their chemical, physical and pharmacological properties are also addressed
in context, which can largely influence their environmental behavior [85].
Karaman et.al studied removal of diclofinac from waste water using clay-
micelle complex which is positively charged, have large surface area and
include large hydrophobic domains so it was an efficient method for
adsorption [86].
3.1.7.3. Eucarbon®
Eucarbon® tablet was developed in 1909 by the pharmacist Mag. F.
Trenka and by Prof. Dr. W. Pauli, tablets contain a combination of

45
anthranoid drugs (Senna and Rhubarb), Sulfur, and the adsorbent Vegetable
Charcoal (carbo ligni) produced in accordance with GMP-Standards.
This formula is used for treatment of entire digestive system conditions,
especially due to its spasmolytic effect, relieving of gas pains and
detoxifying activity (by adsorbing toxins) from GI- tract.
Also charcoal from Carbo Ligni together with Senna leaf und Rhubarb
extract is a very useful medicine, for treatment of constipation especially in
high doses. Figure (3.4) showed this mediciene as available in the market
[87].
Figure (3.4) : Eucarbon® mediciene

46
3.2. Experimental set-up
3.2.1 Materials
3.2.1.1 Precursor:
The residual cyclamen tubers tissues remained after extraction of saponin
glycosides were used as the precursor for preparation of activated carbon
by physical activation method. This powder was washed many times with
distilled water , dried at 110 ºC in oven and then sieved through mesh # 18
to #30 to get rid of the remaining pulp and skin.
3.2.1.2 Activators:
Phosphoric acid H3PO4
Potassium hydroxide KOH
Zinc chloride ZnCl2
All of 98% purity were used as chemical reagents for activation of
cyclamen tubers powder.
3.2.1.3 Furnace:
Tubular regulated furnace (Lindberg 9001) with a 0.25 cm thick
cylindrical stainless steel tube (4 cm inner diameter and 74 cm length).

47
3.2.1.4 Adsorbate and Chemicals
Diclofenac sodium (DCF) (molecular weight = 318.1 g /mol; chemical
formula = C14H10Cl2NNaO2; pKa = 4.2) was purchased from Jerusalem
pharmaceutical company Ramallah – Palestine.
All other chemical used such as hydrochloric acid, sodium thiosulfate,
iodine and sodium hydroxide were of analytical grades.
3.2.1.5 FT-IR analysis
Nicolet iS5 FT-IR Spectrometer was used for the detection of functional
groups in the prepared activated carbon samples.
3.2.2. Activation process
3.2.2.1 Physical activation
In this process, the char produced from carbonization step is activated
using carbon gaseous activating agent N2 gas. Oxidation reaction takes
place between the carbon atom and the gas; increasing the number of pores
in the carbonaceous structure. This process is environmental friendly as no
chemical polluting agents are engaged in the process; still it has several
drawbacks represented in the low carbon yield and high energy
consumption.

48
Figure (3.5 ) : Tube furnace scheme
Longer carbonization/ activation time and higher temperature are required
to produce activated carbon with the same characteristics obtained in the
chemical activation . 30 g of dried cyclamen is placed in a flat crucible and
inserted in the center of calibrated furnace.The carbonization/activation
program is set according to Table (4.3).
Table (3.1): carbonization/activation program set-up
Parameter Value
Activation temperature 550 ºC
Heating rate 20 ºC/min
Holding time 70 min
N2 flow rate 0.2 L/min
3.2.2.2. Chemical activation
Chemical activation produces highly porous activated carbon by
impregnation of the precursor with the following chemical activating agent;
potassium hydroxide (KOH), phosphoric acid (H3PO4) and zinc chloride
(ZnCl2). These chemical agents have dehydrating properties that influence
the pyrolytic decomposition and prevent the formation of tars and volatile

49
organic compounds during activation at high temperature .As a result;
higher activated carbon yield is obtained.
impregnation by Phosphoric Acid
Phosphoric acid solution (100 mL, 50% w/w) was used in chemical
activation of cyclamen persicum Tubers. The solution was added to the 30g
sample and the mixture was thoroughly stirred at 85°C for 2 h.
After this impregnation procedure, the solution was filtered to separate the
residual acid. Then cyclamen tubers were then washed with deionized
water, dried in an oven at 110°C, before carbonization at 450°C for 50
min. After carbonization, the product was washed with hot deionized water
and then with cooled deionized water until pH of the filtrate became 6. The
product was then dried in an oven at 110°C and stored for further use.
Carbon Activation by Zinc Chloride
A sample of 25g Cyclamen persicum tuber powder was mixed by stirring
with zinc chloride solution (100 mL, 20 % w/w).
In this work, impregnation with zinc chloride was carried out at 70°C in
awater bath until excess water evaporated. Then the sample was filtered
and dried after washing with distilled water at 110°C in an oven. then
carbonized at temperature 450°C for 50 min. The carbonized product was
washed with 0.50 M hydrochloric acid solution, then with distilled water
50
and cooled, to remove residual inorganic activating agent. The final
product was dried in an oven at 110°C and stored for further use.
KOH impregnation of cyclamen tubers
A sample of 15g dried cyclamen tuber powder was mixed with KOH at
ratio (1: 0.5) weight by weight . The solid mixture is placed in 500 ml
round bottom flask, where 300 ml of distilled water is added. The solution
is refluxed for 2 hrs at 60 ºC, left to cool and then decanted. The wet solid
is then dried in the oven for 1 hr at 110 ºC. The impregnated sample is
carbonized and activated under 450 ºC temperature for 50 min.
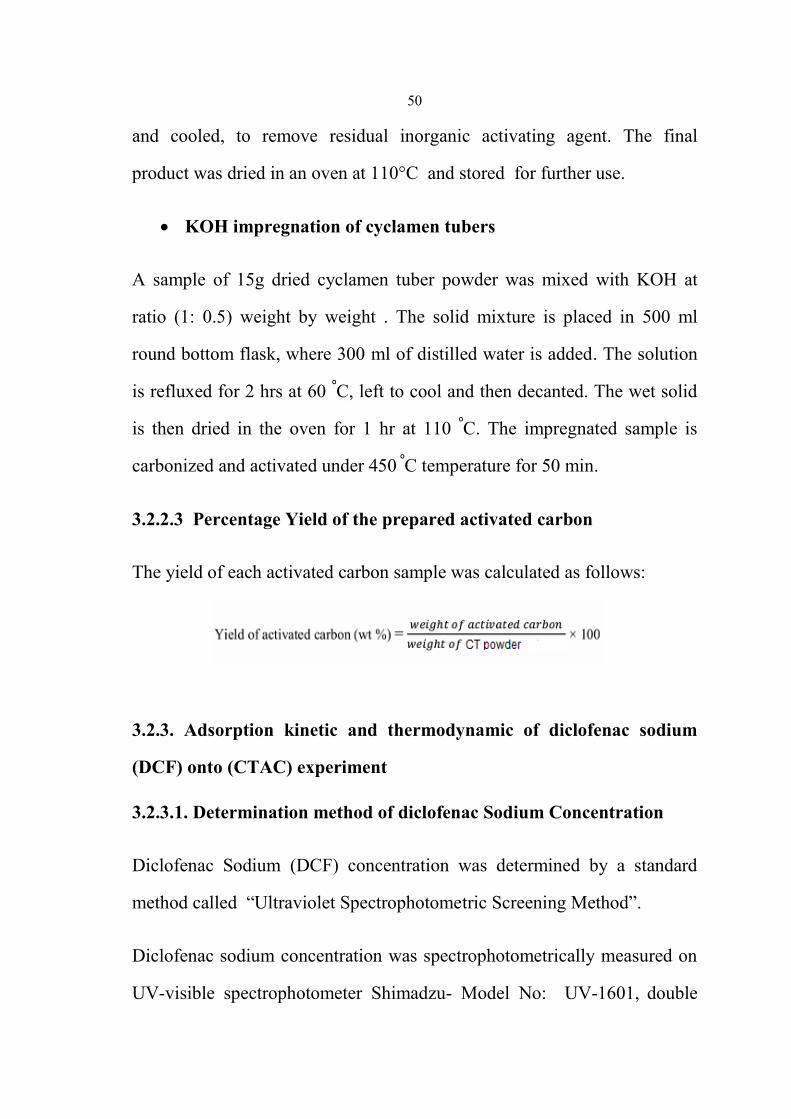
3.2.2.3 Percentage Yield of the prepared activated carbon
The yield of each activated carbon sample was calculated as follows:
3.2.3. Adsorption kinetic and thermodynamic of diclofenac sodium
(DCF) onto (CTAC) experiment
3.2.3.1. Determination method of diclofenac Sodium Concentration
Diclofenac Sodium (DCF) concentration was determined by a standard
method called “Ultraviolet Spectrophotometric Screening Method”.
Diclofenac sodium concentration was spectrophotometrically measured on
UV-visible spectrophotometer Shimadzu- Model No: UV-1601, double

51
beam spectrophotometer wave length range 190-1100 nm, accuracy ±
0.004. For Diclofenac sodium, maximum absorbance at 276 nm was
observed against distilled water background.
3.2.3.2. Diclofenac sodium Standard solutions preparation
Diclofenac sodium stock solution (1000 mg/L ) was prepared by dissolving
1.02 g in 100 ml distilled water then diluting to 1.00 L with distilled water,
this intermediate solution was used to prepare different calibration standard
solutions with concentrations in the range 0.0-50 mg/L diclofenac sodium.
Calibration curve was constructed by plotting value of net absorbance vs
concentration of standard diclofenac sodium (DCF) solution. For
comparison purposes, adsorption behaviors of activated carbons prepared
here and Eucarbon drug were studied.
The initial and final concentrations of DCF were measured. The amount of
adsorption at equilibrium, qe (mg/g), was calculated by the following
equation:
(3.1)
The removal percentage of diclofenac sodium (DCF) was calculated using
the following equation:
(3.2)
52
Where C0 and Ce are initial and equilibrium DCF concentration
respectively.
3.2.4. Adsorption experiment
3.2.4.1. Effect of Adsorbent Dosage
Different amounts (0.10-0.80 g) of activated carbon from cyclamen tubers
and Eucarbon drug were placed into conical flasks, then solutions (50 mL,
50 mg/L Diclofenac sodium) were added to each flask and the pH was
adjusted to 4. The mixtures were then shaken for 1.5 h at 25°C.
3.2.4.2. Effect of Initial pH
Effect of initial pH on adsorption was investigated in the pH range 2-12.
The pH was varied as desired, by adding sodium hydroxide or sulphuric
acid solutio. Diclofenac sodium (DCF) solutions (50 mL,50 mg/L each)
were added to adsorbent samples (0.25 g). The mixtures were then shaken
for 1.5 h at 25°C.
3.2.4.3. Effect of Temperature
The effect of temperature on adsorption was studied. Diclofenac sodium
solutions (50 mL, 50 mg/L each) were added to adsorbent samples (0.25 g)
at pH 4. The mixtures were shaken for 1.5 h at different temperatures in the
range 15-45°C.

53
3.2.4.4. Effect of contact time (Kinetic study)
The effect of time on adsorption was studied. Diclofenac sodium solution
(50 mL, 50 mg/L) was added to adsorbent sample (0.25 g) at pH 4. The
mixture was shaken at 25°C .
Aliquots (1 mL each) of the clear solution were pipetted out at different
time intervals until equilibrium was reached after 24 h.
3.2.4.5. Effect of diclofenac sodium (DCF) concentration
In each adsorption experiment, different concentration ranging from 20 to
80 mg/L Diclofenac sodium was added to 0.25g adsorbent, with initial pH
4. The flasks were shaken at 25°C for 150 minute to reach equilibrium.
The initial and final concentrations of DCF were measured. The amount of
adsorption at equilibrium, qe (mg/g), was also calculated .
3.3 Results and discussion
3.3.1 FTIR analysis of activated carbon samples
In these following figures FTIR analysis revealed the functional groups for
each prepared AC samples and Eucarbon drug for comparison.

54

55
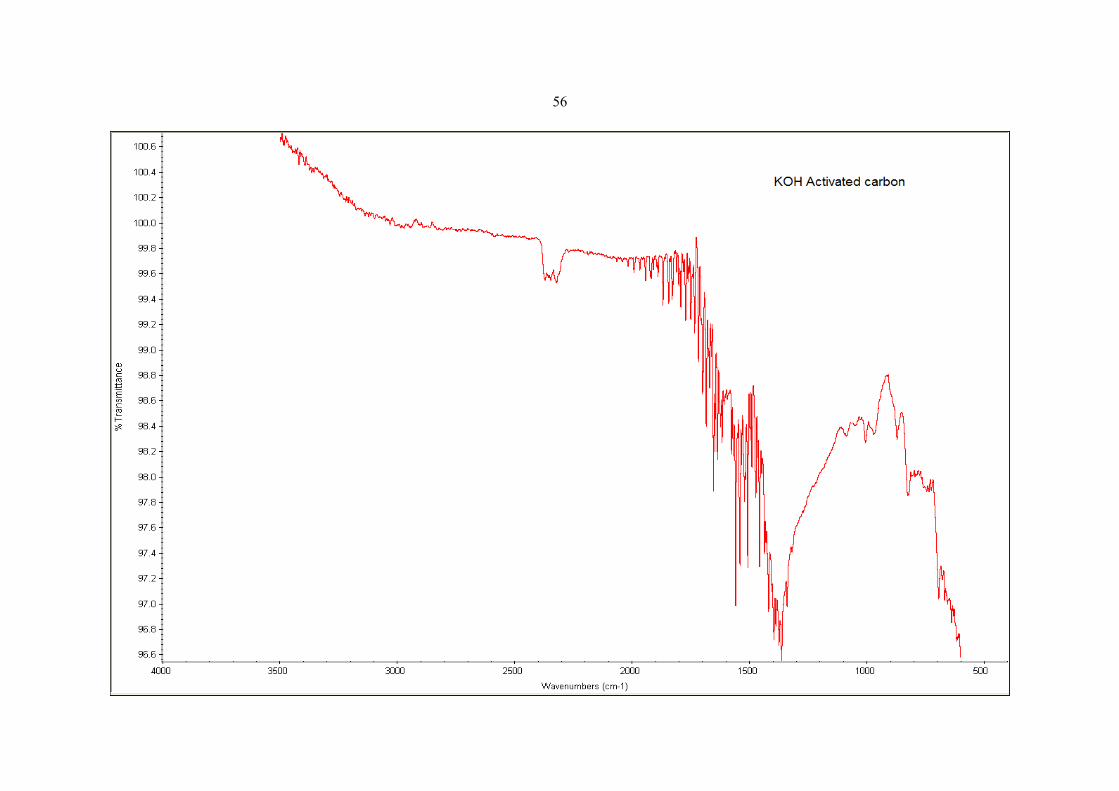
56

57

58
Figure (3.6) : FTIR analysis for activated carbon samples and Eucarbon

59
FT-IR spectra of activated carbon prepared from cyclamen tubers by
different activation methods was interpreted using of the FTIR spectra –
library references to reveal the existence of functional groups occurring in
each structure. The bands at 2800 - 2980 cm-1
(C-H aliphatic stretching)
and 1375 - 1465 cm-1
(C-H aliphatic bending) are more intense in
H3PO4 and KOH activated samples .The band at around 1800 cm-1
denotes
the existence of carbonyl/carboxyl groups and can be observed in H3PO4
but not in others.
The 1600-1500 cm-1
band, which is visible in H3PO4, KOH and physically
activated samples indicated the presence of an aromatic C=C ring
stretching .The bands observed at 1240-1000 cm-1
indicates the existence
C-O stretching of phenolic, acids, ethers and esters and alcoholic groups,
and were identified in the FTIR spectra of Eucarbon drug sample. 900-600
cm-1
Out of plane bending of C-H groups located at the edges of aromatic
planes were defined in H3PO4 activated carbon sample.In all activated
carbon samples produced from cyclamen tubers showed apeak at 2200-
2400 cm-1
which indicates the presence of -C≡N group .
Zinc chloride as activating agent diminished most of the functional groups
present in cyclamen tuber powder.

60
These functional groups can be summarized in table (3.2):
Table (3.2) : Functional groups of AC samples by FTIR analysis
Functional group Sample
Wave number (cm-1)
2200-2400 cm-1
-C≡N group ZnCl2
2200-2400 cm-1
-C≡N group
2800 - 2980 cm-1
(C-H aliphatic stretching,
1800 cm-1
carbonyl/carboxyl groups
900-600 cm-1
bending aromatic C-H
1600-1500 cm-1
aromatic C=C ring stretching.
H3PO4
2200-2400 cm-1
-C≡N group
1450-1300 cm-1
C-H vibrating alkene
1600-1500 cm-1
aromatic C=C ring.
KOH
2200-2400 cm-1
-C≡N group
1600-1500 cm-1
aromatic C=C ring stretching. Physical activation
1240-1000 cm-1
C-O stretching Eucarbon
3.3.2 Iodine number surface area :
As given in table 3.3 the best surface area of the produced activated carbon
samples following iodine number test was by using zinc chloride as
chemical activating agent which produced 606.78mglg followed by
physical activation process that gave 522.07 mg/g surface area .For
comparison Eucarbon drug had 592.62 mg /g using this iodine number test.
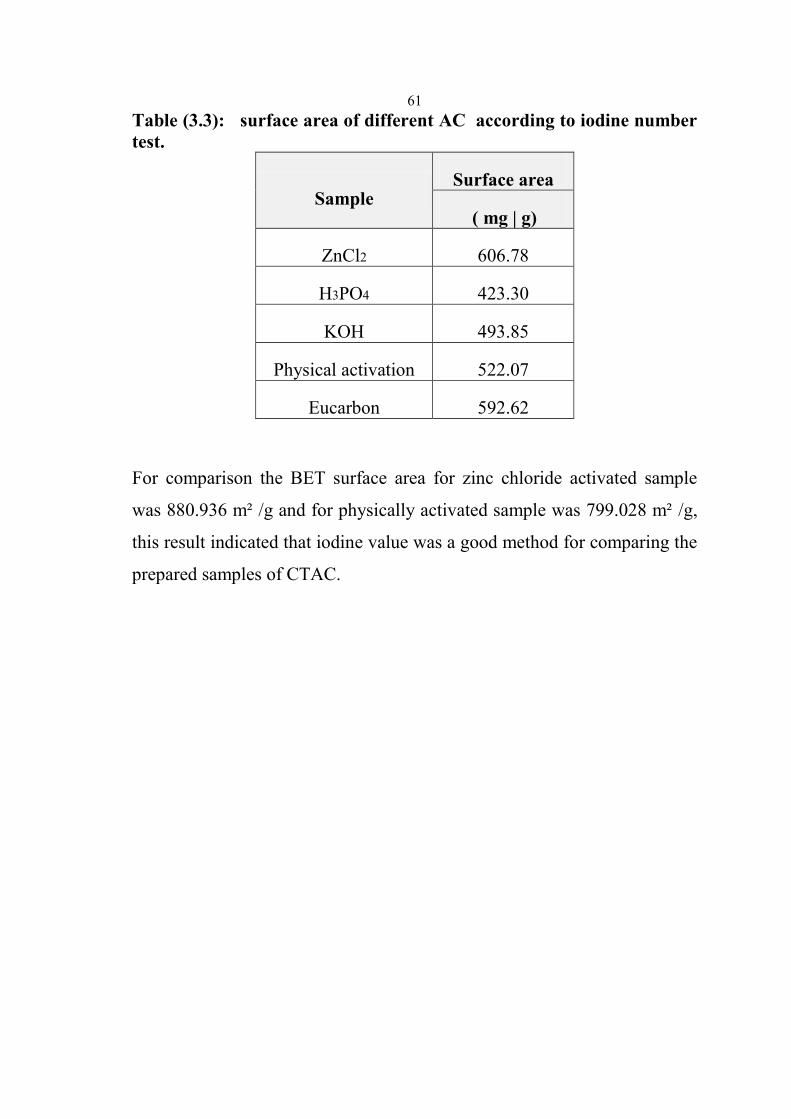
61
Table (3.3): surface area of different AC according to iodine number
test.
Surface area Sample
( mg | g)
606.78 ZnCl2
423.30 H3PO4
493.85 KOH
522.07 Physical activation
592.62 Eucarbon
For comparison the BET surface area for zinc chloride activated sample
was 880.936 m² /g and for physically activated sample was 799.028 m² /g,
this result indicated that iodine value was a good method for comparing the
prepared samples of CTAC.

62
3.3.3. Scanning electron microscopic (SEM) of AC:
In figure 3.7 different scanning electron microphages for activated carbon
samples were showed to indicate the effect of each method in activation
process.
Fig (3.7): SEM micrographs of several types of the produced activated A ( ZnCl2 / CTAC) , B
( H3PO4 /CTAC ) , C (KOH /CTAC) , D( physically CTAC) , E (Eucarbon® ).

63
The external surface showed best porous structure in chemically activated
carbon by potassium hydroxide ( KOH) reagent as this surface was rich in
pores, whereas the surface of the carbon activated physically has no porous
structure except for some occasional cracks ; The porous structure of the
prepared activated carbon by zinc chloride (ZnCL2) and phosphoric acid
(H3PO4) has less extent of porous structure comparing with potassium
hydroxide; this can be explained as the evaporation of KOH during
carbonization process would leave empty spaces on the carbon surface
more than other chemical reagents. Eucarbon® sample showed multilayer
structure that form sites for adsorption process on these layers but not
pores.
3.3.4.Percentage yield of the prepared CTAC samples
The %Yield of the prepared activated carbon from cyclamen tubers was
summerised in table (3.4) :
Table (3.4) : Percentage Yield of prepared activated carbon
% Yield CTAC sample
45% ZnCl2
53% H3PO4
40% KOH
26.5% Physically activated

64
3.3.5. Adsorption of diclofenac sodium on AC from cyclamen
persicum tubers
UV-VIS spectrophotometry which was chosen and preferred to many other
methods. That is due to its low pollution effects, simplicity, speed and
suitability to indicate the kinetic change of the diclofenac sodium
concentration. typical calibration curve for diclofenac sodium at 276 nm is
shown in figure (3.8):
Diclofenac sodium Calibration Curve
y = 0.0198x + 0.0228
R2 = 0.9986
0
0.2
0.4
0.6
0.8
1
1.2
0 10 20 30 40 50 60
Diclofenac sodium con (mg|L)
Ab
so
rban
ce
Figure (3.8) : A typical calibration curve for diclofenac sodium analysis by UV-VIS
spectrometric method
3.3.5.1. Effect of Contact Time
The effect of contact time on removal percentage % of diclofenac sodium
(DCF) was shown in Fig (3.9).
The adsorbed amount of DCF onto CTAC and Eucarbon® increases with
the increase of contact time, as shown in Fig(3.9), and the DCF adsorption
reached equilibrium in about 120 min for CTAC and 150 min for
Eucarbon® . Adsorption capacity for DCF showed a rapid increase in
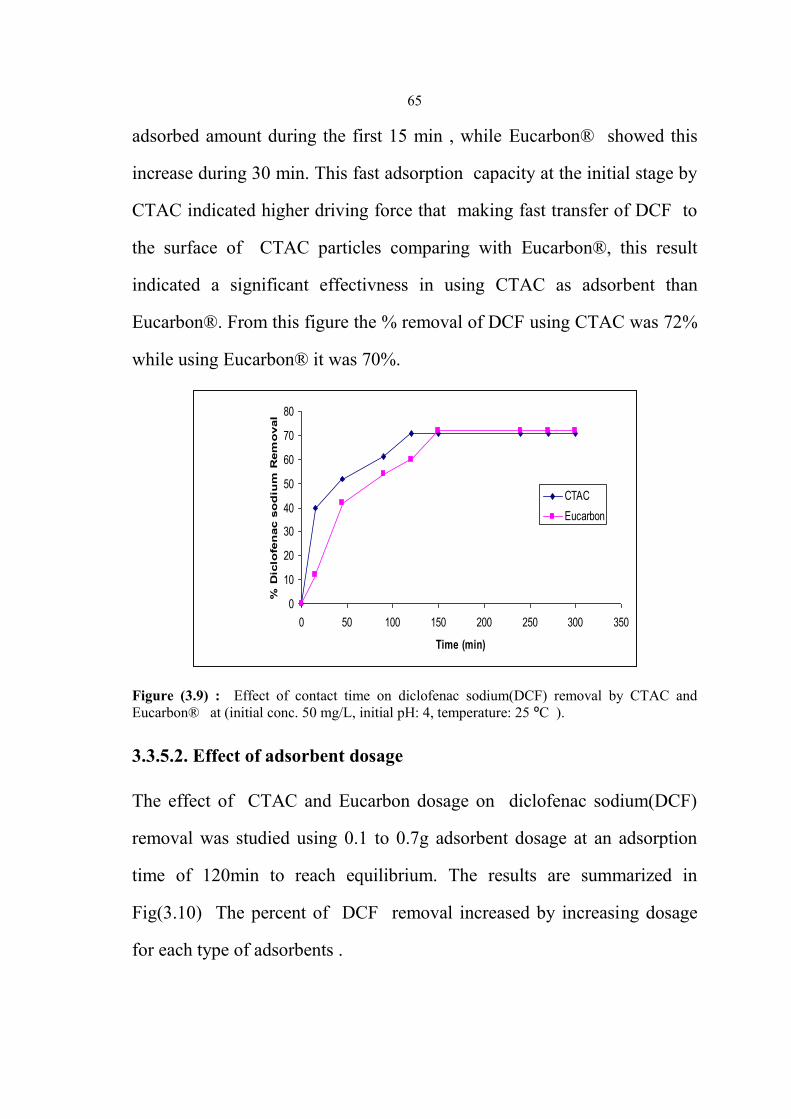
65
adsorbed amount during the first 15 min , while Eucarbon® showed this
increase during 30 min. This fast adsorption capacity at the initial stage by
CTAC indicated higher driving force that making fast transfer of DCF to
the surface of CTAC particles comparing with Eucarbon®, this result
indicated a significant effectivness in using CTAC as adsorbent than
Eucarbon®. From this figure the % removal of DCF using CTAC was 72%
while using Eucarbon® it was 70%.
0
10
20
30
40
50
60
70
80
0 50 100 150 200 250 300 350
Time (min)
% D
iclo
fen
ac s
od
ium
Rem
oval
CTAC
Eucarbon
Figure (3.9) : Effect of contact time on diclofenac sodium(DCF) removal by CTAC and
Eucarbon® at (initial conc. 50 mg/L, initial pH: 4, temperature: 25 ºC ).
3.3.5.2. Effect of adsorbent dosage
The effect of CTAC and Eucarbon dosage on diclofenac sodium(DCF)
removal was studied using 0.1 to 0.7g adsorbent dosage at an adsorption
time of 120min to reach equilibrium. The results are summarized in
Fig(3.10) The percent of DCF removal increased by increasing dosage
for each type of adsorbents .

66
Adsorption increases up to 82% with adsorbent dosage of (0.7 g/50 mL) of
CTAC and 76% with Eucarbon, because increasing adsorbent dosage at
fixed DCF concentration provided more available adsorption sites and thus
increased the extent of DCF removal.
0
10
20
30
40
50
60
70
80
90
0 0.2 0.4 0.6 0.8
Adsorbent dosage (g)
%R
em
ov
al
of
dic
lofe
na
c s
od
ium
CTAC
Eucarbon
Figure (3.10): Effect of adsorbent dosage on diclofenac sodium removal by at (initial conc: 50
mg/L, initial pH: 4, temperature: 25 ºC and contact time: 120 min).
3.3.5.3. Effect of pH
The variation of adsorption onto CTAC and Eucarbon® was investigated
in the pH range 2-12 using sulfuric acid and sodium hydroxide to control
pH. The effect of pH on diclofenac sodium (DCF) removal was studied,
using 0.25g CTAC and Eucarbon® at an adsorption time of 150 min to
reach equilibrium, figure (3.11) (summarizes these results:

67
0
10
20
30
40
50
60
70
80
90
0 2 4 6 8 10
pH
% R
em
ov
al
of
Dic
lofe
na
c s
od
ium CTAC
Eucarbon
Figure (3.11): Effect of pH on diclofenac sodium removal by CTAC and Eucarbon® at
(initial conc.50 mg/L, temperature: 25 ºC, contact time: 150 min )
For each adsorbents, the optimal pH for the adsorption of diclofenac
sodium (DCF) was 2, this result indicated pH less than the pKa of this
pharmaceutical (pKa = 4.20), as DCF present in its neutral form, and its
solubility in water decreases. So as pH decreases the vanderwal interaction
between DCF and adsorbent surface increased by physical adsorption
process.
3.3.5.4. Effect of Temperature
The effect of temperature on adsorption onto CTAC and Eucarbon was
investigated in the range of 15-45 ºC. The results were shown in Fig
(3.12).

68
In this Figure, diclofenac sodium(DCF) adsorption decreased with
increasing temperature. The highest percentage adsorption performance at
15 ºC which reach to 83.58 % by CTAC and 74% by Eucarbon.
0
10
20
30
40
50
60
70
80
90
15 25 35 45
Temperature
%D
iclo
fen
ac
so
diu
m R
em
ov
al
CTAC
Eucarbon
Figure (3.12): Effect of temperature on diclofenac sodium removal by CTAC and Eucarbon®
at (initial conc. 50 mg/L, initial pH: 4, contact time: 120 min.
Thus, when temperature increased it caused an increase in water solubility
of the DCF, which hindered its adsorption because the pharmaceutical
would have more affinity with the solvent than with the adsorbent. The
force of the attraction between the DCF and the adsorbents decreased as a
function of increasing temperature because the increasing temperature
caused an increase in the agitation of the dissolved chemical species,
reducing its physical interaction with the adsorbent.
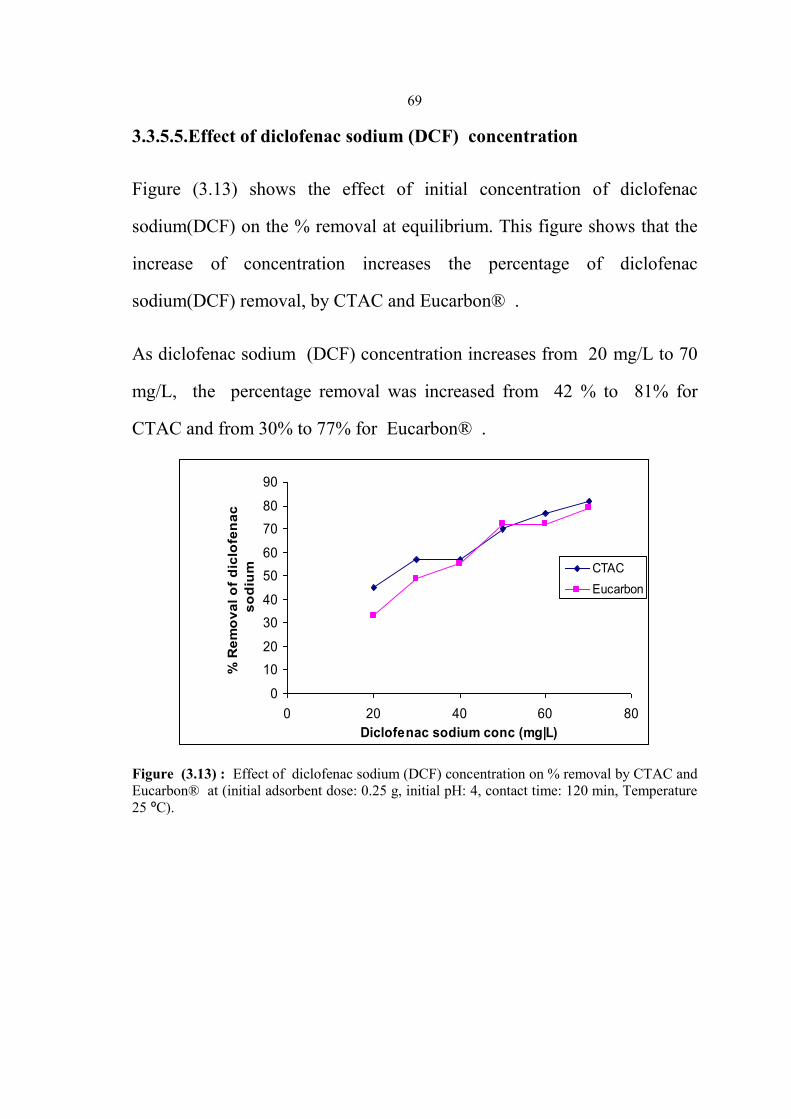
69
3.3.5.5.Effect of diclofenac sodium (DCF) concentration
Figure (3.13) shows the effect of initial concentration of diclofenac
sodium(DCF) on the % removal at equilibrium. This figure shows that the
increase of concentration increases the percentage of diclofenac
sodium(DCF) removal, by CTAC and Eucarbon® .
As diclofenac sodium (DCF) concentration increases from 20 mg/L to 70
mg/L, the percentage removal was increased from 42 % to 81% for
CTAC and from 30% to 77% for Eucarbon® .
0
10
20
30
40
50
60
70
80
90
0 20 40 60 80
Diclofenac sodium conc (mg|L)
% R
em
ov
al
of
dic
lofe
na
c
so
diu
m CTAC
Eucarbon
Figure (3.13) : Effect of diclofenac sodium (DCF) concentration on % removal by CTAC and
Eucarbon® at (initial adsorbent dose: 0.25 g, initial pH: 4, contact time: 120 min, Temperature
25 ºC).

70
3.3.5.6. Adsorption isotherms
In this research, Langmuir and Freundlich isotherm models were used to
describe the adsorption isotherm to study relationship between the amounts
of diclofenac sodium (DCF) adsorbed (qe) and its equilibrium concentration
in solution at 25 ºC onto CTAC (Ce) is given in Figure (3.14):
Figure (3.14): Equilibrium adsorption isotherm of DCF onto CTAC at (temperature: 25 ºC,
initial pH 4 and solid/liquid ratio 0.25 g/50 mL)
Adsorption isotherm for DCF onto CTAC at 25 ºC using Languimer
adsorption model is given in Figure (3.15) :

71
y = 0.045x + 0.964
R2 = 0.952
0
0.5
1
1.5
2
2.5
0 5 10 15 20 25 30
Ce (mg l L)
Ce l
qe (
glL
)
Figure (3.15): Langmuir plot for DCF adsorption onto CTAC at (Temperature; 25 ºC, initial
pH: 4 and solid/liquid ratio 0.25 g/50 mL)
Adsorption isotherm for DCF onto CTAC at 25 ºC using Freundlich
adsorption model is given in Figure (3.16) :
y = 0.7154x + 0.083
R2 = 0.9942
0
0.2
0.4
0.6
0.8
1
1.2
0 0.2 0.4 0.6 0.8 1 1.2 1.4 1.6
Log Ce (mg l L)
Lo
g q
e (
mg
l g
)
Figure (3.16) : Freundlich plot for DCF adsorption onto CTAC at (temperature: 25 ºC, initial
pH: 4 and solid/liquid ratio: 0.25 g/50 mL).
The adsorption isotherm parameters which were calculated from the slope
and intercept of the linear plots using the linear zed form of the Langmuir
and Freundlich equations, together with the R2 values are given in Table
(3.5) :

72
Table (3.5): Isotherms constants for DCF adsorption onto CTAC
Freundlich Isotherm Langmuir Isotherm
N KF
((mg/g)(L/mg)1/n
) R
2
Qmax
(mg/g)
KL
(L/mg)
R2
1.398 1.211 0.9942 22.22 0.0467 0.952
It is clear from the R2 values that the Freundlich isotherm is fitted to the
experimental data more than Langmuir isotherm model. The Freundlich
isotherm shows that adsorption will increase with increasing diclofenac
sodium (DCF) concentration and this adsorption occurred in multilayer
system rather one layer.
A favorable adsorption tends to have Freundlich constant (n) between 1
and 10. Larger value of n (smaller value of 1/n) implies stronger interaction
between the adsorbent and the adsorbate. From Table 3.5 it can be seen that
(n) value was between 1 and 10 showing favourable adsorption of
diclofenac sodium (DCF) onto the activated carbon prepared from
cyclamen tubers.
This finding validates that the assumption of multilayer physical adsorption
between the adsorbate (DCF) and the adsorbent surface (CTAC) is
achieved.

73
3.3.5.7. Kinetics of DCF Adsorption onto CTAC
The adsorption kinetics of DCF onto cyclamen tubers activated carbon
(CTAC) was evaluated using the linearzed pseudo-first-order and pseudo-
second-order equations, represented in the literature.
Adsorption kinetic of DCF onto CTAC at 25 ºC using pseudo-first-order
adsorption model was given in Figure (3.17) .
Adsorption kinetic of DCF onto CTAC at 25 ºC using pseudo-second-
order adsorption model was given in Figure (3.18) .
Intra-particle diffusion (Weber-Morris) kinetic model for DCF adsorption
onto CTAC at 25 ºC was given in Figure (3.19) .
y = -0.0208x + 2.2895
R2 = 0.7759
-2
-1.5
-1
-0.5
0
0.5
1
1.5
2
2.5
0 20 40 60 80 100 120 140 160
Time (min)
Lo
g (
qe-q
t)
Fig ( 3.17 ): Pseudo-first order kinetic modeling of DCF adsorption onto CTAC
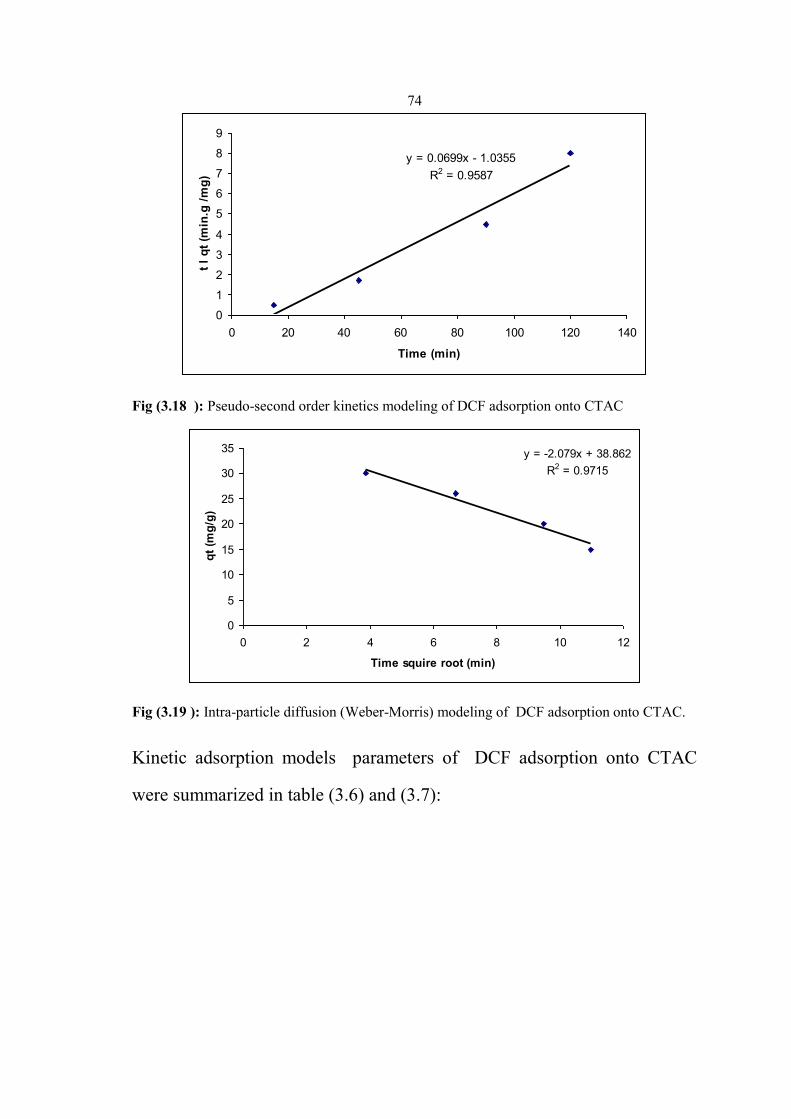
74
y = 0.0699x - 1.0355
R2 = 0.9587
0
1
2
3
4
5
6
7
8
9
0 20 40 60 80 100 120 140
Time (min)
t l
qt
(min
.g /
mg
)
Fig (3.18 ): Pseudo-second order kinetics modeling of DCF adsorption onto CTAC
y = -2.079x + 38.862
R2 = 0.9715
0
5
10
15
20
25
30
35
0 2 4 6 8 10 12
Time squire root (min)
qt
(mg
/g)
Fig (3.19 ): Intra-particle diffusion (Weber-Morris) modeling of DCF adsorption onto CTAC.
Kinetic adsorption models parameters of DCF adsorption onto CTAC
were summarized in table (3.6) and (3.7):
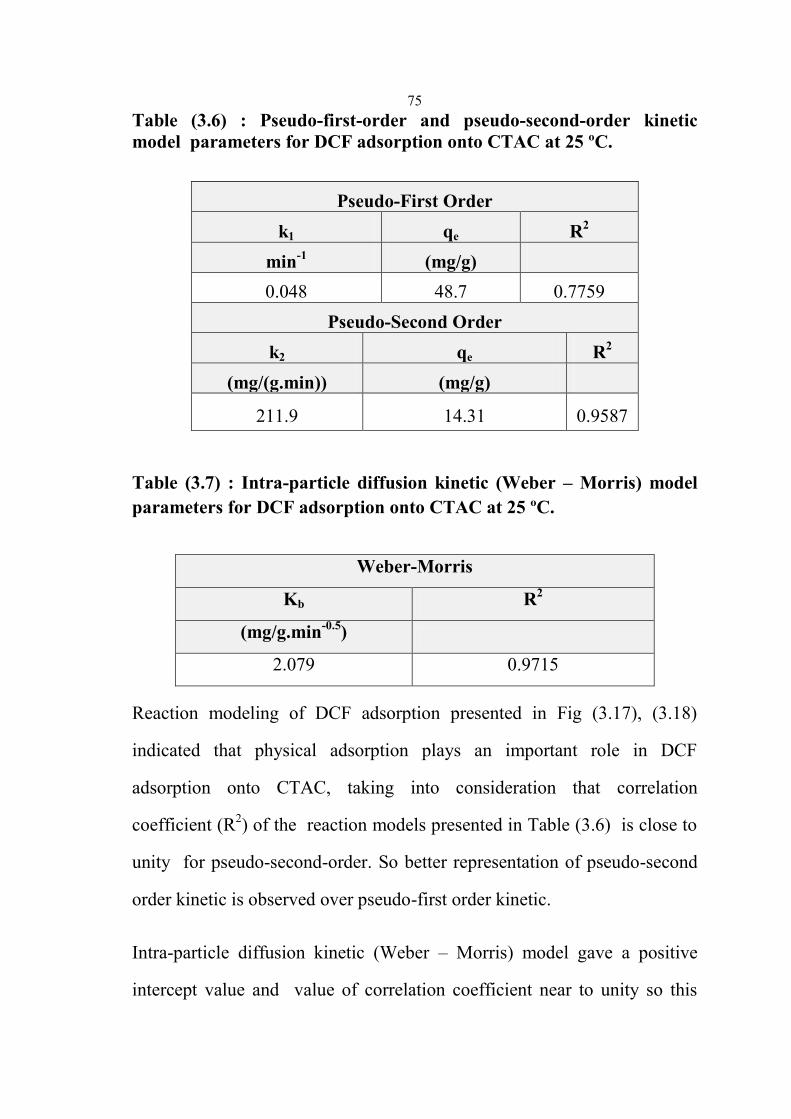
75
Table (3.6) : Pseudo-first-order and pseudo-second-order kinetic
model parameters for DCF adsorption onto CTAC at 25 ºC.
Pseudo-First Order
R2 qe k1
(mg/g) min-1
0.7759 48.7 0.048
Pseudo-Second Order
R2 qe k2
(mg/g) (mg/(g.min))
0.9587 14.31 211.9
Table (3.7) : Intra-particle diffusion kinetic (Weber – Morris) model
parameters for DCF adsorption onto CTAC at 25 ºC.
Weber-Morris
R2 Kb
(mg/g.min-0.5
)
0.9715 2.079
Reaction modeling of DCF adsorption presented in Fig (3.17), (3.18)
indicated that physical adsorption plays an important role in DCF
adsorption onto CTAC, taking into consideration that correlation
coefficient (R2) of the reaction models presented in Table (3.6) is close to
unity for pseudo-second-order. So better representation of pseudo-second
order kinetic is observed over pseudo-first order kinetic.
Intra-particle diffusion kinetic (Weber – Morris) model gave a positive
intercept value and value of correlation coefficient near to unity so this

76
model could describe the adsorption process although the linear line not
pass through origin point.
3.3.5.8. Thermodynamic of DCF adsorption onto CTAC
The thermodynamic parameters of the adsorption process for DCF onto
activated carbon from cyclamen tubers including changes in standard
enthalpy (ΔH°), standard entropy (ΔS°) and standard free energy (ΔG°) of
adsorption can be calculated by means of the following equations.[84]
(3.3)
where R is the universal gas constant (8.314 J.mol-1.K-1), and T is the
absolute temperature, (K) is the distribution coefficient of the system
which can be calculated as: K = Ci/Ce.
where Ci (mg) is the amount adsorbed on solid at equilibrium and Ce (mg/L)
is the equilibrium concentration of DCF.
The variation of Gibbs free energy (ΔG°ads) was estimated according to the
following expression [87].
ΔG°ads = – RT ln K (3.4)
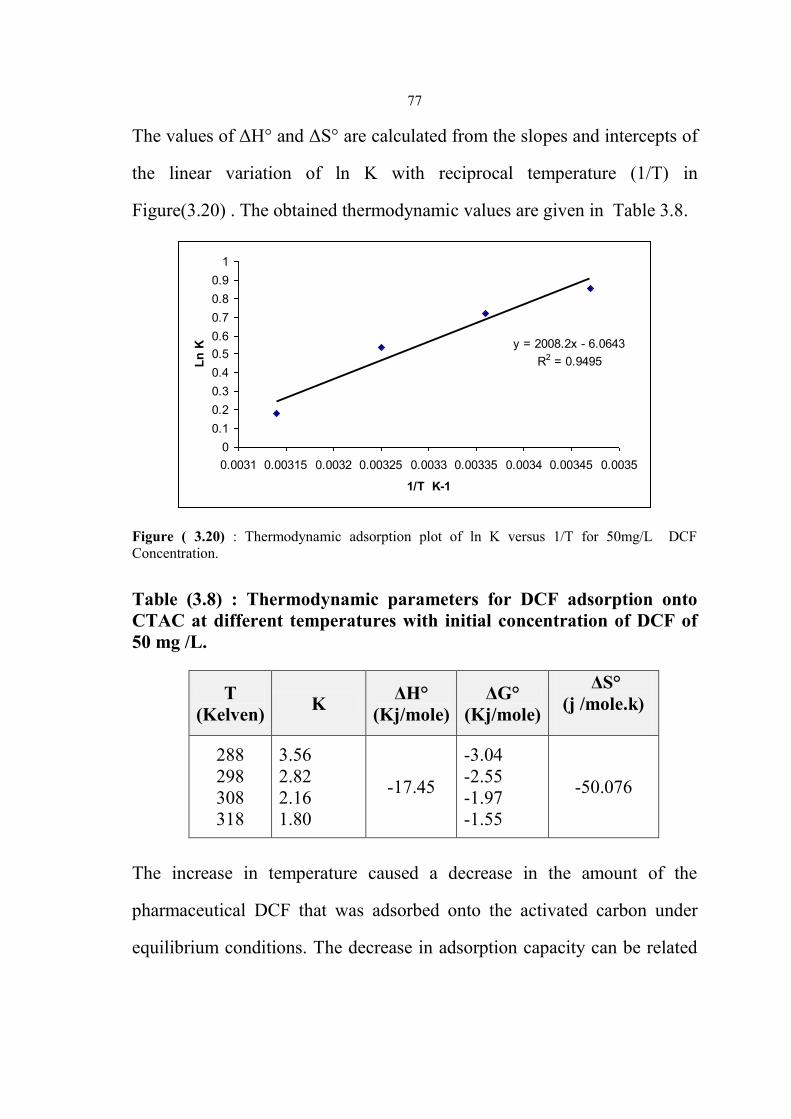
77
The values of ΔH° and ΔS° are calculated from the slopes and intercepts of
the linear variation of ln K with reciprocal temperature (1/T) in
Figure(3.20) . The obtained thermodynamic values are given in Table 3.8.
y = 2008.2x - 6.0643
R2 = 0.9495
0
0.1
0.2
0.3
0.4
0.5
0.6
0.7
0.8
0.9
1
0.0031 0.00315 0.0032 0.00325 0.0033 0.00335 0.0034 0.00345 0.0035
1/T K-1
Ln
K
Figure ( 3.20) : Thermodynamic adsorption plot of ln K versus 1/T for 50mg/L DCF
Concentration.
Table (3.8) : Thermodynamic parameters for DCF adsorption onto
CTAC at different temperatures with initial concentration of DCF of
50 mg /L.
ΔS°
(j /mole.k)
ΔG°
(Kj/mole)
ΔH°
(Kj/mole) K
T
(Kelven)
-50.076
-3.04
-2.55
-1.97
-1.55
-17.45
3.56
2.82
2.16
1.80
288
298
308
318
The increase in temperature caused a decrease in the amount of the
pharmaceutical DCF that was adsorbed onto the activated carbon under
equilibrium conditions. The decrease in adsorption capacity can be related
78
to two factors: the solubility of the pharmaceuticals in water and the energy
exchange that occurred during the process.
Thus, the temperature increase possibly caused an increase in the solubility
of the DCF, which hindered its adsorption because the pharmaceutical
would have more affinity with the solvent than with the adsorbent. The
force of the attraction between the DCF and the activated carbon decreased
as a function of increasing temperature because the increasing temperature
caused an increase in the agitation of the dissolved chemical species,
reducing its physical interaction with the adsorbent. Moreover, the
adsorption process was exothermic, which confirmed the decrease in
adsorption capacity with increasing temperature because as heat is released
to the system, the equilibrium shifted to the opposite direction of the
reaction.
Additionally, the ΔH° was less than 40 kJ/mol, suggesting a physisorption
process .Concerning the change in free energy, the adsorption process of
the DCF onto CTAC was spontaneous, depending on temperature.
3.4.Conclusion
1. Activated carbon produced from cyclamen persicum tubers gave a good
percentage of yield reaching 45% with highest adsorption capacity when
activated by zinc chloride.
2. Optimum percent of DCF removal 82% when CTAC dosage 0.7g and
DCF concentration 70mg/L and 77% for Eucarbon.
79
3. Percentage removal of DCF increases when the concentration of DCF
increases with maximum percentage removal reaching 81% when DCF
concentration was 70 mg /L and 0.25g CTAC.
4. At lowering pH from 6 to 2 the DCF adsorbing increases to reach its
optimal value at pH 2, the decrease in DCF adsorbing was observed at pH
from 7 to 12 .
5. The results showed that equilibrium time for DCF adsorption on CTAC
is 120 min, and 150 min for Eucarbon ,but most adsorption attained within
the first fifteen minutes for CTAC and within thirty minutes for Eucarbon.
6. DCF adsorption uptake increases when temperature is decreased
indicating ionization of DCF at higher temperature and so decreasing its
uptake by adsorbents surface.
7. The results showed that DCF adsorptions onto CTAC can be described
by pseudo-second-order model, that resulted in correlation coefficient
value near to unity.
8. Frenundlich equilibrium model describes the adsorption isotherm of
DCF onto CTAC more efficiently than Langmuir model.
9. The values of thermodynamic parameters indicated that the adsorption
process was spontaneous and exothermic one.

80
Recommendations for future researches.
This work has given a good accepting results, there are number of areas
that need further investigation. These include:
1- Studying the adsorption efficiency of this prepared activated carbon for
heavy metals and other pharmaceutical preparations.
2- Studying the effect of other pharmaceuticals in the aqueous medium on
DCF adsorption.
3- More advanced characterizations for CTAC.
4- Studying chemical composition of the raw material using gravimetric
analysis.

81
References
[1] Denti, E. and Walker, J.M. Activated carbon: Properties, selection,
and evaluation, in Giordano, C. (Ed.), Sorbents and Their Clinical
Applications, Academic Press, New York, NY, (1980); pp. 101-116.
[2] Karthikeyan, S. Sivakumar, P. and Palanisamy, P. N. Novel activated
carbons from agricultural wastes and their characterization, E-Journal
of Chemistry, 5, (2008); pp.409-426.
[3] Holt, L.E and Holz, P.H. A consideration of the role of charcoal in
the treatment of poisoning in children. Journal of Pediatrics. (1963); pp.
306-314.
[4] Neuvonen, P.J. Clinical Pharmacokinetics of oral activated
charcoal in acute intoxications. Clinical Pharmacokinetics. (1982); pp.
465-489.
[5] Underhill TJ, Greene MK, Dove AF. A comparison of the efficacy of
gastric lavage, ipecacuanha and activated charcoal in the emergency
management of paracetamol overdose, Archives of Emergency
Medicine, (1990); pp.148–154.
[6] Corby DG, Fiser RH, Decker WJ. Re-evaluation of the use of
activated charcoal in the treatment of acute poisoning. Pediatric Clinics
of North America, (1970); pp. 545-556.

82
[7] Cooney, David. Activated Charcoal: Antidote, Remedy, and Health
Aid. Brushton, NY: TEACH Services, Inc., (1999); pp.860-955.
[8] Khalili N. R., Campbell M., Sandi G. and Gola J. Production of micro
and mesoporous activated carbon from paper mill sludge, I: Effect of
zinc chloride activation. Carbon, 38, (2000); pp.1905-1915 .
[9] Kalderis, D., Bethanis, S., Paraskeva, P. & Diamadopoulos, E.
Production of activated carbon from bagasse and rice husk by a single-
stage chemical activation method at low retention times. Bioresource
Technology, Vol. 99, No. 15, ( 2008); pp. 6809–6816 .
[10] Rodríguez- Reinoso, F., Molina-Sabio, M., Muñecas, M.A. Effect of
microporosity and oxygen surface groups of activated carbon in the
adsorption of molecules of different polarity, J. Phys. Chem. 96 (1992);
pp. 2707–2713.
[11] Harry Marsh and Denis S. Carbon 22, (1984); pp. 603-606.
[12] Plant Resources of the USSR, Families Peoniaceae—Thymelaceae
[in Russian], Nauka, Leningrad, (1986); pp. 169–170.
[13] Shorter Oxford English dictionary, 6th edition, United Kingdom:
Oxford University Press. ISBN 01992-06872 ,( 2007); pp. 3804.
[14] Roger Phillips & Martyn Rix. The Random House Book of Bulbs ,
New York, NY, (1989); pp. 255-257.

83
[15] Kupchan, S.M., Hemingway, R.J., Knox, J.R., Barboutis, S.J. Werner,
D. Barboutis, M. A.J., Pharm. Sci. (1967); pp. 603–608.
[16] Leporatti, M.L., Ivancheva, S. Preliminary comparative analysis of
medicinal plants used in the traditional medicine of Bulgaria and Italy.
J. Ethnopharmacol.87, (2003); pp.123–124.
[17] Foubert, K., Theunis, M., Apers, S., Vlietinck, A.J., Pieters, L.
Chemistry distribution and biological activities of 13,28-epoxy-
oleanane saponins fromthe plant families Myrsinaceae and
Primulaceae. Curr Org. Chem, (2008); pp. 629–642.
[18] Fennell, C.W., Lindsey, K.L., Gaw, L.J., Sparg, S.G., Stafford, G.I.,
Elgorashi, E.E., Grace, O.M., van, J . Assessing African medicinal plants
for efficacy and safety: pharmacological screening and toxicology.
Journal of Ethno pharmacology 94, (2004) ; pp.205–217.
[19] Primorac, M.; Sekulovic, D.; Antonic, S.Pharmazie, (1985); pp. 585–
594.
[20] Mahasneh, A. M.; El-Oqlah, A. A.J. Ethnopharmacol. (1999); pp.
271–276.
[21] Loi, M. C.; Poli, F.; Sacchetti, G.; Selenu, M. B.; Ballero,
M.Fitoterapia , In vitro modulation of tracheal smooth muscle
reactivity by extracts of some Senegalese medicinal plants (2004); pp.
277–295.
84
[22] Guarrera, P.M. Traditional phytotherapy in Central Italy (Marche,
Abruzzo, and Latium). Fitoterapia , (2005); pp. 1–25.
[23] Mahasneh, A.M., El-Oqlah, A.A. Antimicrobial activity of extracts
of herbal plants used in the traditional medicine of Jordan. J.
Ethnopharmacol,(1999); pp. 271–276.
[24] Speroni, E., Cervellati, R., Costa, S., Dall’Acqua, S., Guerra, M.C.,
Panizzolo,C ,Utan, A.,Innocenti, G. Analgesic and antiinflammatory
activity of Cyclamen repandumS. et S.. Phytother. Res, (2007); pp. 684–
689.
[25] Çalıs_,I , Yürüker, A., Tanker, N., Wright, A.D., Sticher,
O.Triterpene saponins fromCyclamen coumvar.coum. Planta
Med,(1997); pp. 166–170.
[26] Yayli, N., Baltaci, C. A novel glycoside linked piperidine alkaloid
from Cyclamen coum. Turk. J. Chem, (1997); pp. 139–143.
[27] Webby, R.F., Boase, M.R. Peonidin 3-O-neohesperidoside and
other flavonoids fromCyclamen persicumpetals. Phytochemistry,
(1999); pp. 939–941.
[28] Stefano Dall’Acqua, Ignazio Castagliuolo, Paola Brun, Federica
Ditadi, Giorgio Palù, Gabbriella Innocenti, Triterpene glycosides with in
vitro anti-inflammatory activity from Cyclamen repandum tubers .
Carbohydrate Research 345, (2010); pp. 709–714.
85
[29] Dinda, B., Debnath, S., Mohanta, B.C., Harigaya, Y. Naturally
occurring triterpenoid saponins. Chem. Biodivers, (2010); pp. 2327–
2580.
[30] Ogston A. On Abscesses . Classics in Infectious Diseases. Rev.
Infec.t Dis. 6,(1984); pp. 122–128.
[31] Kluytmans . J, van Belkum . A, Verbrugh . H. "Nasal carriage
of Staphylococcus aureus: epidemiology, underlying mechanis ms,
and associated risks". Clin. Micr ob iol. Rev,( 1997); pp. 505–520.
[32] Aarestrup, F. M., Agerso, P. Ahrens, J. C., Jorgensen, M. Madsen,
and Jensen, L. B. Antimicrobial susceptibility and presence of
resistance genes in Staphylococci from poultry. Vet. Microbial, (2000);
pp. 353-364.
[33] Mahato, S. B., Sudip, S. K., and Poddar, G. Triterpenoid saponins.
Review article number 38, Phytochem, (1988); pp. 3037-3067.
[34] Mizutani, K., Osawa,T., Huang, M.T., and Rosen, R.T. Biological
activities, production, and use of chemical constituents of licorice. In
Food Pytochemical for Cancer Prevention II, Chem. Soc. Washington,
(1994); pp 547-551.
[35] Tanaka, O., Ikeda, K. Ohtani, R. Kasai, and K. Yamasaki. Anti yeast
steroidal saponins from Yucca schidigera (Mohave Yucca), a new anti-
food-deteriorating agent. J. Nat. Prod, (2000); pp. 332-338.

86
[36] Price, K. R., Johnson, I. T and Fenwick, G. R. The chemistry and
biological significance of saponins in foods and feedstuffs. CRC Crit.
Rev. Food Sci. Nutr, (1987); pp.127-135.
[37] Rakhimov, R. R., Benetis, A. Lund, Hwang, A. I. Prokofev, and
Lebedev,Y.S. Intramolecular and reorientation dynamics
bis(triphenylphosphine)- 3,6-di-tert-butyl- 4,5-dimethoxy-o-
semiquinone complex of copper (I) in viscous media. Chem. Phys. Lett,
(1996); pp. 156-162.
[38] Oleszek, W. Alfalfa saponins: Structure, Biological, Activity, and
Chemotaxonomy. in Saponins Used in Food and Agriculture, eds. Plenum
Press, NY, (1996); pp. 155-170.
[39] Wang, Y. X., McAllister, L. Yanke, Z. J., Cheeke P. R., and Cheng,
K. J. In vitro effects of steroidal saponins from Yucca schidigera
extract on rumen microbial protein synthesis and ruminal
fermentation. J. Sci. Food Agric, (2000); pp. 2114–2122.
[40] Sen, S., H. Makkar, P. S. Muetzel, S., and Becker, K. Effect of
Quillaja saponaria saponins and Yucca schidigera plant extract on
growth of Escherichia coli. Lett. Appl. Microbiol, (1998); pp. 35-38.
[41] Gagliardo, R., Vignola, A. M. and Mathieu, M. Is there a role for
glucocorticoid receptor beta in asthma. Respiratory Res, (2001); pp.1–4.
[42] Oakenfull, D. Saponins in food. Food Chem,(1981); pp. 19-40.

87
[43] SHERIF.M.H. Texas-A&M-University. ANTIMICROBIAL
ACTIVITIES OF SAPONIN-RICH GUAR MEAL EXTRACT, (2008);
pp.2-5
[44] Onning, G., and Asp, N.G. Effect of oat saponins on plasma and
liver lipids in gerbils and rats. Br. J. Nutr, (1995); pp. 275-286.
[45] Matsuda, H., Li, Y.H., Murakami,T., Yamahara,J., and
Yoshikawa,M., Structure-related inhibitory activity of oleanolic acid
glycosides on gastric emptying in mice. Bioorganic Med. Chem, (1999);
pp. 323–327.
[46] Freeland, W. J., Calcott, P.H., and Geiss, D.P. Allelochemicals,
minerals and herbivore population size. Biochem. Systematic Ecol,
(1985); pp.195-206.
[47] Hussein, M. Z., Tarmizi, R. S. H., Zainal, Z., Ibrahim, R. and Badri,
M. Preparation and Characterization of Active Carbons from Oil
Palm Shells, Carbon, (1996); pp. 1447–1454.
[48] Hassler, J. W. Purification with activated carbon, 3rd
ed., Chemical
Publishing Co, Inc., NewYork, (1974).
[49] Fabian Suarez Garcia, Amelia Martinez Alonso, Juan Manuel Diez
Gascon, Manufacture of activated carbon from Apple pulp, Pat. No. ES
2173032, (2009).
88
[50] Namasivayam, C. & Sangeetha, D . Recycling of agricultural solid
waste, coir pith: Removal of anions, heavy metals, organics and dyes
from water by adsorption onto ZnCl2 activated coir pith carbon.
Journal of Hazardous Materials, ISSN 0304-3894. Vol. 135, No. 1-3,
(2006); pp. (449–452).
[51] Lillo-Ro´denas, M.A. Cazorla-Amoro, D. Linares-Solano, A.
Carbon 41, (2003); pp.267.
[52] Ogasawara, S.; Kuroda, M.; Wakao, N. Preparation of activated
carbon by thermal decomposition of used automotive tires. Ind. Eng.
Chem. Res, (1987); pp. 2552-2556.
[53] Williams, P.T and Reed, A.R. Development of activated carbon
pore structure via physical and chemical activation of biomass fiber
waste, Biomass and Bioenergy, (2006); pp. 144-152.
[54] Coughlin, R.W., Ezra, F.S, Tan, R.N. Influence of chemisorbed
oxygen in adsorption onto carbon from aqueous solution. Journal of
Colloid and Interfacial Science, (1968); pp. 386-396.
[55] Fritzst Oeckli, H. Carbon 28, (1990) ; pp.6-11.
[56] Marsh, H. (Editor). Activated carbon compendium, Elsevier
Science Ltd, ISBN: 0-08- 044030-4, UK, (2001); pp 17-20.
[57] Lyman, W.J. Applicability of Carbon Adsorption to the
Treatment of Hazardous Industrial Waste, Carbon Adsorption

89
Handbook, Cheremisinoff, P.N.; Ellerbusch, F, Ann Arbor Science
Publishers, Michigan, (1987).
[58] Kairvelu, K. Thamaraiselvi, K. Namazivayam, C. Removal of heavy
metals from industrial wastewaters by adsorption onto activated
carbon prepared from an agricultural solid waste. Bioresour. Technol,
(2001); pp. 63-65.
[59] Michael, M., Brittain, M., Nagai, J., et al. Phase II study of
activated charcoal to preventirinotecan-induced diarrhea, J Clin Oncol.
22 (21), 4410–7, (2004); pp.27-34.
[60] Mfanacho, S. M. , Hemang, P. & Manocha, L. M. Enhancement of
microporosity through physical activation. PRAJÑĀ - Journal of Pure
and Applied Sciences, ISSN 0975 – 2595,Vol. 18, (2010); pp. 106 – 109,.
[61] Schatten, H & Pawley, J. Biological low voltage field emission
scanning electron microscopy. Springer Science and Business Media,
New York,(2008); pp. 387-729.
[62] Bac¸ aoui, A., Yaacoubi, A., Dahbi, A., Bennouna, C., Phan Tan Luu,
R., Maldonado-Hodar, F. J., Rivera-Utrilla, J. &Moreno-Castilla, C.
Optimization of conditions for the preparation of activated carbons
from olive-waste cakes. Carbon 39(3), (2001); pp. 425–432 .
[63] ASTM D-3172-89, Standard Practice for proximate analysis of coal
and coke(ASTM, USA), (2002).

90
[64] Cuhadar Cigdem, :"Production and Characterization Of Activated
Carbon from Hazelnut Shell and Hazelnut Husk".(Unpublished
Thesis), Middle East Technical University Ankara, Turkey, (2005).
[65] Li, B.Q. Lin, Z.Y (Eds.), Preparation of advanced activated carbon
with ultra-clean coals, Prospects for Tent International Conference on
Coal Science in the 21st Century, Taiyuen, China, Shanxi, Science and
Technology press, China, (1999).
[66] Izquierdo, M.T., Rubio .B, Mayoral .C, Andres, J.M. Modifications
to the surface chemistry of low-rank coal-based carbon catalysts to
improve flue gas nitric oxide removal. Appl Catal B Environ, (2001); pp.
315-324.
[67] El-Sayed Y, Bandosz T.J. Adsorption of valeric acid from aqueous
solution onto activated carbons: role of surface basic Sites. J Colloid
Interf Sci, (2004); pp. 64-72.
[68] Kurniawan, T. A. and Lo, W.H.. Removal of refractory compounds
from stabilized landfill leachate using an integrated H2O2 oxidation
and granular activated carbon (GAC) adsorption treatment. Water
Research, (2009); pp. 4079-4091.
[69] Gayatri, S. L. Ahmaruzzaman, Md. Adsorption technique for the
removal of phenolic compounds from waste water using low-cost
natural removal adsorbents. Journal of Science & Technology 5, (2010);
pp.156-166.

91
[70] Aly Osman, M and Faust, Samuel D. Adsorption processes for
water treatment. Butterworth Publisher (Boston) , (1987); pp. 509-512.
[71] Liu, Q.S. Zheng, T. Wang, P. Jiang, J.P. and Li, N. Adsorption
isotherm, kinetics and mechanism of some substituted phenols on
activated carbon fibers, Chem. Eng. J., 157, (2010); pp. 348-356.
[72] Haghseresht, F. and Lu, G. Adsorption characteristics of phenolic
compounds onto coal-reject-derived adsorbents, Energy Fuels, 12,
(1998); pp. 101-107.
[73] Hui Qiu, Lu, L.V., Bing-cai P.A., Qing-jian, Wei-ming, Quan-xing.
Critical review in adsorption kinetic models, J. Zhejiang-Unv .Sci. A,
(2009); pp. 716-724.
[74] Mckay, G. The kinetics of sorption of basic dyes from aqueous
solution by sphagnum moss peat. The Canadian Journal of Chemical
Engineering, (1988); pp. 822-827.
[75] Ngamsopasiriskum, C. Charnsethikul, S. Removal of phenol in
aqueous solution by nano crystalline TiO2/ activated carbon composite
catalyst. Kasetsart J. Nat. Sci, (2010); pp. 1176-1182.
[76] Mali, D. Srivastava,V. Agarwall, N. Removal of orange G and
methyl violet dyes by adsorption onto bagasse fly ash kinetics study
and equilibrium isotherm analysis. Dyes Pigments 69, (2006); pp. 210-
223.

92
[77] Hinz, B., Chevts, J. and Renner, B. Bioavailability of diclofenac
potassium at low doses. British Journal of Clinical Pharmacology, (2005);
pp. 80-84.
[78] Ku, E.C., Wasvary, J.M., Cash, W.D. Diclofenac sodium (GP 45840,
Voltaren;, A potent inhibitor of prostaglandin synthetase. J.Biochem.
Pharmacol, (1985); pp. 641–643.
[79] Willis, J.V., Kendall, M.J., Flinn, R.M., Thornhill, D.P and Welling,
P.G. The Pharmacokinetics of diclofenac sodium following intravenous
and oral administration. European Journal of Clinical Pharmacology,
(1979); pp.405-410.
[80] Reddersen, K., Heberer ,Th. Gustav-Meyer-Allee 25, Sekr. TIB 4 /3-
1, 13355 Berlin, Germany- Formation of an artifact of diclofenac during
acidic extraction of, environmental water samples, Journal of
Chromatography A, (2003); pp. 221–226.
[81] Wetzig, R. Removal of selected pharmaceuticals from sewage
water by advanced treatment techniques ,TU Bergakademie Freiberg,
Institut für Biowissen schaften, Leipziger Str, 29,09599 Freiberg,
Germany, (2008); pp. 1-10.
[82] Theres Söderberg. Powdered Activated Carbon used as adsorbent
of Active Pharmaceutical Ingredients and Estrogens in the Biological
Treatment of Wastewater- Master Thesis in Environmental Science-
93
Water and Environmental Engineering Department of Chemical
Engineering-Lund University, (2008); pp.2-8.
[83] Myriam Suarez Benavent, Yong-jun Zhang, SvenUwe Geissen
ADSORPTION OF PHARMACEUTICALS ON A SYNTHESIZED SILICA AND
ITS REGENERATION WITH OZONE. Master student in Chemical
Engineering, Universitat Rovira I Virgili, Tarragona, Spain and Department
of Environmental Technology, Chair of Environmental Process, Technical
University of Berlin,Germany, (2009); pp.2-5.
[84] zhang. y, Geissen. SU, Gal. C, Carbamazepine and diclofenac
removal in wasre water treatment plants and occurance in water
bodies Chemosphere, (2008); pp. 1151-1161.
[85] Karaman. R , Khamis. M, Quried. M, Halabieh. R, Makharzeh.
I, Manassra. A, Abbadi. J , Qtait. A, Bufo. SA, Nasser. A. Removal of
diclofenac potassium from wastewater using clay-micelle complex.
Environ Technol, (2012); pp. 1279-1287.
[86] Wolf, D., Hubner ,M.D., Ewald, H., Moser, ph.D. Charcoal tablet
in the treatment of patients with irritable bowel syndrome, Advances in
Natural Therapy. Volume 19 No.5, (2002); PP. 1-8.
[87] Önal, Y., Akmil-Başar, C., Sar1c1-Özdemir, C. Elucidation of the
naproxen sodium adsorption onto activated carbon prepared from
waste apricot: kinetic, equilibrium and thermodynamic
characterization, J. Hazard Materials, (2007); pp. 727–734.

.
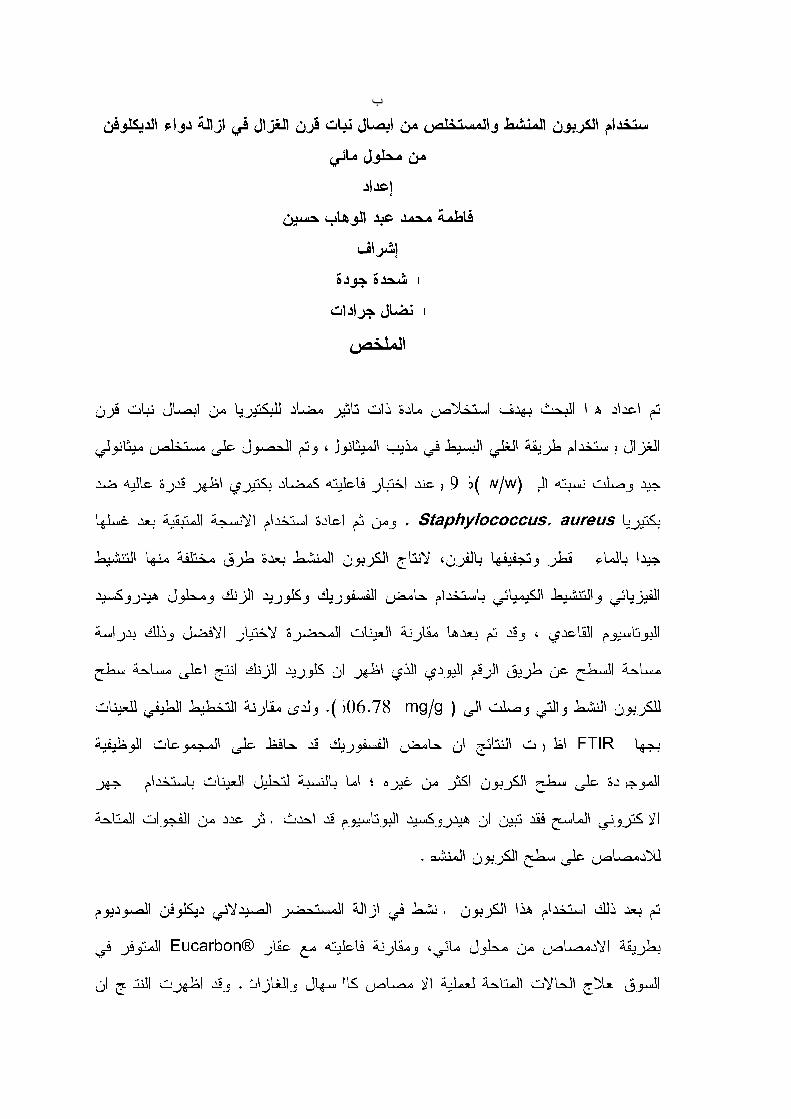
ب

ج
ΔΔΔ
ΔΔ