Embed Size (px)
Citation preview

Vol.:(0123456789)
Annals of Data Sciencehttps://doi.org/10.1007/s40745-021-00349-6
1 3
Action for Action: Mad COVID‑19, Falling Markets and Rising Volatility of SAARC Region
Asima Saleem1
Received: 30 December 2020 / Revised: 5 June 2021 / Accepted: 25 June 2021 © The Author(s), under exclusive licence to Springer-Verlag GmbH Germany, part of Springer Nature 2021
AbstractThe Southern Region has reported a large number of contagious pandemic out-breaks. These epidemics brought threats to human health and resulted in serious economic losses. The COVID-19 is a global virus and has weakened the global financial markets with significant effect on stock returns and market volatilities. The study obtained a dataset about the financial market structure of South Asian Asso-ciation for Regional Cooperation (SAARC) Countries. The purpose of the study is to determine the effect of 2019-nCov on stock market performance of SAARC member states. The study considered indexes of the National Stock Exchanges of each country and applied an event study approach for estimating the impact of Mad COVID-19 on the stock returns and market volatilities with an event window of 25 days of severe pandemic hits. The CAR approach proved the declining effect of Mad COVID-19 on the stock returns of SAARC countries. Asymmetric GJR-GARCH Model estimated the changeable volatility and proved the increase in vola-tility with COVID-19 as a negative shock. SAARC Region significantly reacts to Mad COVID-19 with falling markets and rising volatility.
Keywords COVID-19 · Cumulative abnormal returns · Event study methodology · GJR-GARCH model · South Asian Association for Regional Cooperation (SAARC) · Volatility effect
The manuscript is original and has not been presented, published before and is not currently being considered for publication elsewhere.
* Asima Saleem [email protected]
1 Faculty of Management Sciences, National University of Modern Languages, Islamabad, Pakistan
Annals of Data Science
1 3
1 Introduction
Cheval et al. [1] the evolutionary changes in natural mechanisms and occurrences which may be caused by human practices resulted in environmental hazards that are disastrous to both health, communities and the environment. They conceptu-alized COVID-19 pandemic as a hazard that is a source for outburst of various infectious diseases which increases the rate of mortality and state of morbidity across wide geographical regions and causes significant disruptions in both social, economic and political sectors. Yousef [2] the re-emerging COVID-19 outbursts in Hubei, China in December 2019 and spread all around the globe with approxi-mately 27 million confirmed cases reported and more than 9 lac deaths recorded in 212 countries during May 2020. Ayittey et al. [3] highlighted the economic effects of novel coronavirus: approximately all the affected countries were to shut down their economic infrastructure, quick workout for contingency plans and announcement of emergency economic aid packages, intense disruption in global supply chains, drastic food shortening, imbalanced asset prices, effected MNCs and local business environment with limited trading activities, immense social distancing, lockdowns, curfews, tourism crisis and restricted flight operations. Li et al. [4] COVID-19 has imperilled the world financial market as well as brought devastating effects to the global economy. Emerging economies could experience significant threat from abnormal pandemic outbreaks because of scarce medi-cal resources, poor viral detection technology and less accurate pandemic data. Jian et al. [5] the re-emerging unprecedented pandemic explosions are not only hazardous to human health but also bring severe economic crises, which can be determined through variations in the returns of different stock markets.
Kumar [6] data analytics and relevant techniques are proved useful to track and monitor any pandemic effects like SARS-CoV (2003) and novel COVID-19. He monitored the COVID-19 infections in India through data clustering. Temesgen et al. [7] applied data analytics and estimated relationship between longitudinal CD4 count and survival time of HIV/TB Co-infected Patients through joint mod-eling. Liu et al. [8] the study applied big data mining and determined the transfer-ral patterns and associated risks of coronavirus outburst among six major cities of China through social contacts. Atkins et al. [9] estimation and modelling of changeable volatility is highly focused for mathematical modelling of financial data sets. Yang et al. [10] high frequency financial data i-e trading volumes and trading intervals, mainly highlights two perspectives: stock volatility and finan-cial markets noise. High frequency financial data is highly useful for comprehen-sive research and conception of financial markets behaviour. Yousef [2] studied the spillover effect of novel coronavirus on the indices of major G7 stock markets and proved that coronavirus significantly increases stock market volatility. Atkins et al. [9] implied data analytics and proved data derived from news sources play an important role in predicting stock volatility movement, previously applied for modelling of cancer subtypes, studied by Saddiki et al. [11].
The core objective of the study is to add relevance to the existing studies on the significant effect of pandemic outbreaks on the stock market’s performance.

1 3
Annals of Data Science
Thomas [12] reported COVID-19 as Bad, Mad and Dangerous. The current study determined the impact of Mad COVID-19 breakout on the stock returns of selected SAARC countries: India, Pakistan, Bangladesh, Srilanka and Nepal by applying an event study methodology i-e Cumulative Abnormal Returns (CAR) statistical approach during the event window of 25 days i-e (t = − 25, 25), the period of severe COVID-19 hit to SAARC region. Liu et al. [13] the world stock markets are highly interdependent and interlinked to each other. The events that led to the global financial crisis like the outburst of global pandemic COVID-19 had a significant spillover effect on the stock markets of other countries. Asym-metric GJR-GARCH model is applied to study the volatility effect of COVID-19 on the stock market fluctuations of SAARC Countries.
1.1 SAARC Region
SAARC stands for The South Asian Association for Regional Cooperation, estab-lished in 1985. It is the geopolitical union and intergovernmental organization of 8 member states of Southern Asia including: Afghanistan, Bangladesh, Bhutan, India, Maldives, Nepal, Pakistan and Srilanka documented by Sultana and Reza [14]. SAARC states are highly populated, covering about 23.75percent of the global population and have a significant contribution to more than 15percent of global eco-nomic productivity. SAARC member states consist of nations that share common borders, ethnicity, shared culture and historical common threads like British imperi-alism with a number of socio-political differences. These nations collectively make an integrated “Condominium” of trans-boundary Rivers, ocean with combined eco-logical system and shared mountain ranges. The region also has the same endow-ment for economic productivity proposed in Swamy [15]. SAARC regions located geographically closer to countries suffer from the hardest hit by COVID-19, pro-posed in Kugelman [16]. There were catastrophic consequences of COVID-19 in the South Asian Region with no immediate vaccination. Only lockdowns, social dis-tancing, shutdown of business activities and educational institutions were meant to control the contagious COVID-19.
1.2 Emerging Infectious Diseases and Coronavirus in SAARC Countries
The South Asian Region is the hotspot that reported re-emerging infectious dis-eases as the major cause of deaths, highlighted in Zaidi et al. [17]. In the year 2000, the Southern states reported about 3.7million deaths caused by infectious diseases including: diarrhoea, pneumonia and measles. They reported India as having the second largest infected population in the world with HIV AIDS and hepatitis and tuberculosis continuing to affect millions. Laxminarayan [18] reported signifi-cant increase in the burden of emerging and re-emerging infectious diseases such as Avian influenza (2007), MERs-Cov (2012), Zika and Ebola (2014) in SAARC countries. Karunathilake [19] SAARC Region is greatly affected by the situation created by pandemic COVID-19. Wagner and Scholz [20] reported that the ram-pant COVID-19 outbreak had affected more than 1.9 billion people in South Asian

Annals of Data Science
1 3
Countries. Menon [21] reported in BBC News that the number of coronavirus cases in SAARC states is comparatively very low than surrounding countries such as Denmark, United States, United Kingdom, Russia, Portugal, Australia, Qatar and New Zealand. Babu et al. [22] highlighted that the preparedness of SAARC coun-tries for pandemic COVID-19 was inadequate, measured by Global Health Secu-rity Index (GHSI) in 2019. The maximum possible score is 100 and the score for SAARC countries were: India (46.5), Bhutan (40.3), Pakistan (35.5), Nepal (35.1), Bangladesh (35.0), Srilanka (33.9), Maldives (33.8) and Afghanistan (32.3). The consequential uncertain preventive measures resulted in demand and supply side shocks which negatively impacted the growth prospects of the Southern economies and reported serious fluctuations in Asian stock markets, documented in Mishra and Mishra [23]. Inam [24] International The News reported the post-COVID-19 effects in Southern Asia which include lockdowns, health barriers, social distancing, shutdown of educational institutes, quarantines, curfews, limited business activi-ties, economic downturn, increased trend of protectionism, isolationism, racism, inequality and ethnocentrism. In short, the infectious COVID-19 threatens South Asian Region’s social as well as economic infrastructure [25]. According to The World Bank estimates, the South Asian states experienced about 2.7percent shrink in economic activity in 2020. All these serious economic consequences resulting from Mad COVID-19 have brought attention towards the study of Asian stock mar-kets. Table 1 below shows the detail of novel coronavirus spread in SAARC Region, reported from The World Health Organization Report no.102 [26] on May 1, 2020. The total number of confirmed COVID-19 cases were 62,823 and total deaths were 1,771. India reported the highest hit with 35,043 confirmed cases with 1147 deaths. Pakistan and Bangladesh occupied 2nd and 3rd positions with 16,817 and 7,667 confirmed cases and 385 and 168 deaths respectively. Bhutan had only 7 cases, 57 cases in Nepal and 396 cases in Maldives without any death. In Srilanka only 7 peo-ple died from COVID-19.
United Nations Economic and Social Commission for Asia and the Pacific (ESCAP) [27] highlighted the economic growth outlook of SAARC Region and reported the decrease in trend from + 6.8% (2017), + 6.1% (2018) and − 2.7% (June 2020). Figure 1 below shows the Detail of different sectors affected due to
Table 1 Novel coronavirus spread Situation in SAARC Region. Source: WHO, situation report, 102 [26]
Countries Total Confirmed cases Total Deaths
India 35,043 1147Pakistan 16,817 385Bangladesh 7667 168Afghanistan 2171 64Srilanka 665 7Maldives 396 0Nepal 57 0Bhutan 7 0Total cases 62,823 1771

1 3
Annals of Data Science
COVID-19 in South Asia, tourism is the major sector intensely impacted by COVID-19 in South Asia and contributes about 9percent GDP in Southern Region. Hotel and restaurants were in 2nd position with 44percent weighted score, manufacturing 33percent, agriculture 18percent, trade (14percent) and finance and banking sector (8percent). Mining and quarrying is the least affected sector with only 2percent.
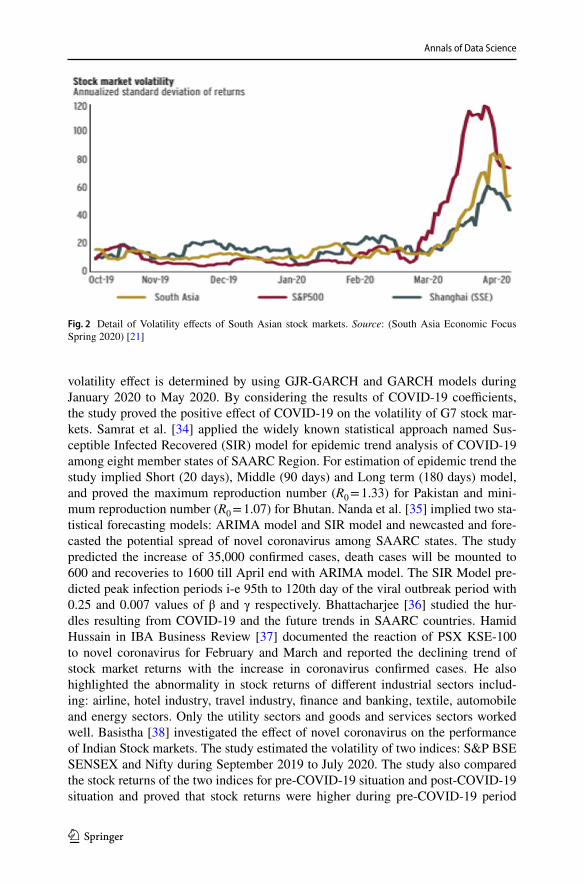
The re-emerging global virus COVID-19 had a significant impact on the stock market performance of SAARC countries [28]. The World Bank in South Asia Eco-nomic Focus Spring 2020 reported the sharp increase in volatility of South Asian equity markets, decline in value of stock market returns with multiplication of the COVID-19 shock effects from surrounding borders. Figure 2 below shows the Vola-tility effects of Southern Region stock markets. S&P 500 shows highest stock mar-ket volatility but there were reasonably less variations in the stock returns of South Asian markets. Shanghai experienced the lowest stock market fluctuations.
2 Literature Review
Rolander [29] COVID-19 pandemic situation has created Madness all around the globe. Baker et al. [30], Fernandes [31], Gormsen and Koijen [32] and Ibrahim Yousef [2] documented that there are very few but rapidly increasing numbers of studies that evidenced the impact of coronavirus on the variations in stock market returns. He et al. [33] estimated the spillover effects of COVID-19 pandemic on daily returns of different stock markets. Yousef [2] investigated the spillover effect of re-emerging COVID-19 on the top G7 stock markets indices by considering the effect of number of everyday new cases and the expected growth rate in new cases on the standard deviations of the top G7 stock indices returns. The time varying
51%44%
33%29%
18%17%
14%8%
5%5%
2%2%
0% 10% 20% 30% 40% 50% 60%
TourismHotel and Restaurant
ManufacturingConstruction and Real estate
AgricultureTransport
TradeFinance and BankingProfessional Services
InfrastructureOthers
Mining and quarrying
Detail of sectors affected due to COVID-19 in South Asia
Fig. 1 Detail of sectors affected due to COVID-19 in South Asia. Source: UNESCAP-SSWA online Sur-vey [27]
Annals of Data Science
1 3
volatility effect is determined by using GJR-GARCH and GARCH models during January 2020 to May 2020. By considering the results of COVID-19 coefficients, the study proved the positive effect of COVID-19 on the volatility of G7 stock mar-kets. Samrat et al. [34] applied the widely known statistical approach named Sus-ceptible Infected Recovered (SIR) model for epidemic trend analysis of COVID-19 among eight member states of SAARC Region. For estimation of epidemic trend the study implied Short (20 days), Middle (90 days) and Long term (180 days) model, and proved the maximum reproduction number (R0 = 1.33) for Pakistan and mini-mum reproduction number (R0 = 1.07) for Bhutan. Nanda et al. [35] implied two sta-tistical forecasting models: ARIMA model and SIR model and newcasted and fore-casted the potential spread of novel coronavirus among SAARC states. The study predicted the increase of 35,000 confirmed cases, death cases will be mounted to 600 and recoveries to 1600 till April end with ARIMA model. The SIR Model pre-dicted peak infection periods i-e 95th to 120th day of the viral outbreak period with 0.25 and 0.007 values of β and γ respectively. Bhattacharjee [36] studied the hur-dles resulting from COVID-19 and the future trends in SAARC countries. Hamid Hussain in IBA Business Review [37] documented the reaction of PSX KSE-100 to novel coronavirus for February and March and reported the declining trend of stock market returns with the increase in coronavirus confirmed cases. He also highlighted the abnormality in stock returns of different industrial sectors includ-ing: airline, hotel industry, travel industry, finance and banking, textile, automobile and energy sectors. Only the utility sectors and goods and services sectors worked well. Basistha [38] investigated the effect of novel coronavirus on the performance of Indian Stock markets. The study estimated the volatility of two indices: S&P BSE SENSEX and Nifty during September 2019 to July 2020. The study also compared the stock returns of the two indices for pre-COVID-19 situation and post-COVID-19 situation and proved that stock returns were higher during pre-COVID-19 period
Fig. 2 Detail of Volatility effects of South Asian stock markets. Source: (South Asia Economic Focus Spring 2020) [21]

1 3
Annals of Data Science
and decreased to the bottom line in the post-COVID-19 situation. He applied the GJR-GARCH model for estimating the spillover effect of COVID-19 on the two indices and proved the presence of time varying volatility effect during the pan-demic period. Mishra et al. [39] estimated the effect of coronavirus on financial mar-kets of India by using the Markov Switching Bayesian Vector Autoregressive model. The study proved that the effect of coronavirus on stock returns is harder than GST (Goods and Services Tax) and Demonetization. Faculties of humanities and social sciences, University of Ruhuna [40] reported the declining trend in stock markets of Srilanka with significant effect on social and economic development due to the coro-navirus outbreak. They also highlighted the negative impact of COVID-19 on differ-ent industrial sectors. Aktar et al. [41] investigated the varied reaction of Bangladesh stock market to the coronavirus outbreak and documented the immediate as well as negative reaction of stock returns to the COVID-19 breakout which varies over time. Asian Development Bank [42] reported that in Nepal the tourism sector is intensely affected by COVID-19 with a significant declining percentage.
2.1 Extreme Value Theory (EVT)
EVT provides a strong theoretical basis for description of extreme events based on statistical modelling. Many studies have estimated extreme variations in financial stock markets e.g. currency rises, economic downturn and the rising credit defaults by applying EVT. Gilli and Kellezi [43] the study applied EVT for estimating risk measures and then determined its effect on major stock market indices i-e S&P 500. Mei-Ping et al. [44] applied EVT and determined the weakening effect of SARS viral breakout on the integration of Asian stock markets. This study applied EVT for determining the effect of Infectious pandemic COVID-19 on the stock market per-formance of SAARC Region.
2.2 Contagion Effect
Lee et al. [45] documented contagion effect as the transmission of market changes in a country to other countries resulting from a major financial event and interde-pendence between countries. Previous studies mostly considered the contagion effect of financial events e.g. Boyer et al. [46], Caporale et al. [47]. Very few studies have focused on the contagion effects of natural disasters like the earthquake, docu-mented in Lee and Wang [48] earthquake in Japan had significant contagion effect on Asian stock markets and tsunami and earthquake in Southeast Asia (2004). Babu et al. [49] proved the significant contagion effect of the US Financial crisis of 2007 on SAARC Nation stock markets. Okorie and Lin [50] the study considered the top 32 countries affected from pandemic including Pakistan and proved the significant contagion effect of Pandemic COVID-19 on both stock returns and market volatili-ties. The current study determined the contagion effect of Mad COVID-19 on South Asian stock returns and market volatilities.

Annals of Data Science
1 3
3 Methodology
The current study examined the impact of novel coronavirus pandemic on the stock market performance of SAARC Countries. The study used event study methodology for eliciting the effect of severe global pandemic on the stock mar-ket returns of SAARC Countries. Selmi and Bouoiyour [51] event study method-ology is the best approach for measuring the steeper changes in the stock mar-ket returns resulting from an uncertain event. In this study the uncertain event is the Mad COVID-19 pandemic. Asymmetric GJR-GARCH Model is implied for determining the variations in the stock market yield of SAARC Region. Each country is assumed to be indicated by their respective National Stock exchanges. India (Bombay Stock Exchange S&P BSE SENSEX), Pakistan (Pakistan Stock Exchange PSX KSE-100), Bangladesh (Dhaka Stock Exchange DSEX), Srilanka (Colombo Stock Exchange ASPI) and Nepal (Nepal Stock Exchange NEPSE). Many studies have examined the Causal Impact of financial shocks in devel-oped economies to the developing economies. Iqbal et al. [52] evidenced differ-ent studies that investigated the stock spillover effect in developed markets and its transmission to South Asian Markets. The study proved strong integration of South Asian markets with the global markets with the resulting volatility effect experienced during financial crises in the developed economies. Abbas and Khan [53] highlighted the volatility spillover effect among Pakistan, Srilanka, India, Singapore, China, USA and UK. They considered the presence of trade relation-ships between South Asian countries and Developed economies as the main rea-son for spillover effect. Golam et al. [54] the best measure for stock market per-formance is the consideration of composite market indexes, first preference will be for broad market indexes e.g. FTSE 100, NYSE Composite Index and S&P 500. Baek et al. [55] COVID-19 outbreak has brought striking fluctuations in the U.S. Stock markets. This study implied the S&P 500 index as a benchmark index for studying the volatility effect. Historical databases of all indices are used for data collection.
3.1 Confirmed case of Novel Coronavirus
As COVID-19 arises from China (Wuhan) in December, 2020 and has cre-ated a threatening situation for the global economy especially for neighbouring developing economies of China including India, Pakistan, Bangladesh, Iran and Afghanistan documented in Yaseen et al. [56]. A Confirmed case of Novel Coro-navirus is one which has “breath-shortness, anosmia, suffering from fever, coryza and infected respiratory tract”. WHO [26] reported 186,040 confirmed cases of COVID-19 and about 9000 death cases in SAARC member states on May 1, 2020.

1 3
Annals of Data Science
3.2 The Estimation Window
Vryghem [57] defined the estimation window as the time duration which describes the information for normal return occurring prior to the event win-dow. In the study the estimation window is of 120 days from August 8, 2019 to December 13, 2019, which is the normal return period occurring pre-COVID-19 pandemic situation.
3.3 The Event Window
The event window is the period specified for studying the impact of stock mar-ket returns of the identified indices of SAARC member states. Monthly returns form the basis for studies involving longer time periods and daily returns form the basis for short-term event studies. Vryghem [57] highlighted from the referenced studies that short-term event windows can be as short as two-days and longer event windows can be as long as sixty-month period, documented in Gregory [58] and Lummer and McConnell [59]. [60] The World Health Organization declared COVID-19 infectious outbreak as a global pandemic on March 11, 2020. Hartwig Schafer, Vice President, Southern Region, The World Bank [61] reported March 11, 2020 the period when novel coronavirus hardly hit South Asian countries. The current study is based on the severe pandemic periods in SAARC states with an event window of 25 days from February 4, 2020 to April 14, 2020 (t = − 25, 25). ‘t−1’ is 25 days pre-COVID-19 declaration as pandemic period and ‘t1’ is 25 days post-COVID-19 declaration as pandemic period.
3.4 S&P 500 Index
The S&P 500 Index (Standard and Poor’s 500 Index), started in 1957 and is a market capitalization weighted index, composed of 500 largest public limited companies listed on US Stock Exchange. The S&P 500 Index is considered as a standardised barometer for measuring the market of US equities and a market-adjusted benchmark for studying many other funds, documented in Asem and Alam [62]. Syed et al. [63] indexes of both developed and developing markets had significant impact on each other. They proved significant short-term and long run linkages between stock markets of South Asia, UK, US and emerging econo-mies. They highlighted that the S&P 500 not only affects emerging stock markets but also had a significant Granger causation effect on stock market indexes of the Southern Region.
3.5 Cumulative Abnormal Returns (CAR) Approach
The study referenced CAR approach from previous studies [64] and applied it for estimation of the impact of re-emerging COVID-19 outbreak on the stock mar-ket performance of selected SAARC Countries. “ARi,t” is the Abnormal return

Annals of Data Science
1 3
component assigned to global pandemic novel coronavirus event, calculated as the deviation of expected return from the actual return of the indices during the event window. COVID-19 is a shock and causes a significant decrease in the stock market returns (value) of the country. For calculating (ARi,t), we need to estimate the Expected returns (ERi,t) of index (i) during time t. Market Model (MM) is applied and stock market returns of each country’s index is regressed against the S&P 500 index for examining benchmark effects. Selmi and Bouoiyour [51] evi-denced that the most commonly used method for determining stock returns is the market model. The equation used for regression analysis:
In Eq. 1, Ri,t is the daily return of identified indexes (i) at time t of selected SAARC countries and Rmf ,t∼ is the daily stock return of the S&P 500 benchmark (a value-weighted) Index for the event period. αi and βi are the regression parameters and εi,t is a random error term. The daily stock returns are estimated as:
The daily stock returns for benchmark S&P 500 Index are estimated as:
Abnormal returns for event time (t = t−1, t1) are calculated by Eqs. 2 and 3:
In Eq. 2, ARi,t is the Abnormal stock returns and in Eq. 3 ERi,t is the Expected Return for identified indexes (i) at time t of selected SAARC countries and ��i and 𝛽i are the error-free estimation parameters computed by using Ordinary Least Square (OLS) statistical analysis.
As (CAR i,t) shows the compounding of daily abnormal returns of stocks of iden-tified indices of SAARC countries and are widely used for measuring the perfor-mance of stock returns in reaction to the zoonotic COVID-19. The expected value for CAR is “0” indicating no abnormal returns. Equation 4 shows the calculation of CAR:
This study used t-statistics for determining the statistical significance of CAR approach during time period t. In Eq. 5, shows t-statistics for CAR i,t and test ʹH0 = CAR has statistically significant difference from zero’. When t-statis-tics > 1.96, indicated acceptance of H0 with strong impact of the Mad COVID-19 outbreak on Southern stock markets tCAR . σCAR shows the standard deviation of CAR.
(1)Ri,t = �i + �iRmf ,t + �i,t
Ri,t = In
(
Pi,t (Closing price of Index(i) at time t)
Pi,t−1 (Closing price of Index(i) at time t − 1)
)
∗ 100,
Rmf ,t = In
(
Pm,tClosing price of Index(m)at time t
Pm,t−1Closing price of Index(m) at time t − 1
)
∗ 100,
(2)ARi,t = Ri,t − ERi,t
(3)ERi,t = ai + 𝛽iRmf ,t
(4)CARi,t = CARi,t−1 + ARi,t

1 3
Annals of Data Science
For determining the statistical significance of our t-test results, i-e H0: CAR i,t =0, P-value is utilized. P-value is determined by using the expression on MS Excel “T.DIST (tCAR , Df, cumulative distribution function)”. If P-value < 0.05, shows the sig-nificant effect of the Mad COVID-19 outbreak on the stock returns of the Southern Region.
3.6 GJR‑GARCH Model
The study applied the GJR-GARCH Model for determining the spillover effect of novel Coronavirus on stock market volatility of selected SAARC countries. Ali [65] documented that the GJR-GARCH Model was introduced by Glosten, Jagannathan and Runkle for determining the time-varying effect of positive and negative shocks on the volatility of stock markets. Sakthivel et al. [66] documented the limitation of GJR-GARCH model i-e the implication of symmetrically volatile reaction to negative and positive shocks. For this the conditional variance can be assumed as the magnitude of the lagged residuals and hence does not make up for their sign. And asymmetric condi-tional volatility responses known as leverage effect to positive and negative information can be determined by squaring �t−1∼ when it is negative (Glosten and Runkle [67] and Ibrahim [2]. The following expression used for estimation of GJR-GARCH Model:
where It−1 = 0 if 𝜖t−1∼ > 0 and It−1 = 1 if 𝜖t−1∼ < 0 , depending upon whether �t−1∼ is below or above the threshold value i-e 0.
In Eq. 6, ht shows conditional variance, �2t−1∼
has differential effects on conditional variance. When �t−1∼ is positive, the total effect is caused by �1∼ �2
t−1∼ , when �t−1∼ is
negative, the total effect is caused by (
�1∼+ ∼ �i∼)
�2t−1∼
. γi is the coefficient of lever-age effect, if γi = 0 no leverage effect, γi > 0, leverage effect is present, indicating high volatility with negative shocks, γi < 0, leverage effect is present, indicating low volatil-ity with negative shocks. α1 and β1 are estimation parameters that can be estimated by maximizing the log likelihood.
Introduction of a dummy variable in conditional mean and conditional variance equation play an important role in determining the effect of COVID-19 on volatility of identified indices of SAARC countries. So GJR-GARCH model implied in the study is modified as:
(5)tCAR =CARi,t
�CAR ∕√
n
(6)ht = �0 +
q∑
j=1
�1�2t−1
+
p∑
i=1
�1ht−1 +
r∑
k=1
�iIt−1�2t−1
(7)yt = � + �t∼
(8)ht = � + �1 ∶ �2t−1
+ �1ht−1 + �iIt−1�2t−1
+ �1Covidt

Annals of Data Science
1 3
Equation 7 is the conditional mean equation, μ is the average return and Eq. 8 is the conditional variance equation and ω is the function of mean volatility. Covidt is the dummy variable which is assumed to be zero for the pre-COVID-19 declaration as pandemic period and 1 for post-COVID-19 declaration as pandemic period.
4 Hypothesis Development
H1a: The Mad COVID-19 outbreak had a significant effect on the stock returns of SAARC Region.H0a: The Mad COVID-19 outbreak had no significant effect on the stock returns of SAARC Region.H1b: The Mad COVID-19 outbreak had a significant effect on the volatility of stock markets of SAARC Region.H0b: The Mad COVID-19 outbreak had no significant effect on the volatility of stock markets of SAARC Region.
5 Results and Interpretation
The study determined the effect of the Novel Coronavirus outbreak on the stock mar-ket performance of SAARC Countries. As the evidence proved that all the zoonotic diseases like HIV AIDS, TB, SARS, Avian Influenza, COVID-19 etc. had a sharp effect on the stock returns of SAARC countries.
5.1 CAR Statistical Analysis
Table 2 above represents the results of CAR for the indices of selected SAARC Countries. CAR i,t values show cumulative abnormal returns for the indices dur-ing t = − 25, 25. For S&P BSE SENSEX and PSX KSE-100 the values were rela-tively stable before COVID-19 pandemic declaration i-e March 11, 2020, but after COVID-19 severe hit there was dramatic decrease in stock returns of Indian markets with values fluctuating between − 32.0939, − 31.4330, − 25.7189, − 19.3569, and − 19.1999. For Pakistan, the peaked negative values of stock returns are − 38.5342, − 36.7238, − 33.3266 and − 29.7360. Bangladesh is in 3rd position among SAARC countries, Srilanka and Nepal hit by COVID-19 after February, 2020. DSEX responded strongly to COVID-19 in initial days, documented in Aktar et al. [41] CAR i,t values were positive before COVID-19 for DSEX and ASPI, but this study considered the periods during COVID-19 pandemic declaration and its severe hit, so values of returns were positive and less negative for t = − 25, 20 and − 15 i-e. − 1.8433, 6.7543 and 4.2521 for DSEX and − 0.7018, − 1.0747 and − 4.2361 for ASPI. DSEX and ASPI faced tough times for a short period after COVID-19 pan-demic declaration with maximum negative values of − 13.8543 and − 9.8851 for Bangladesh, − 27.7124, − 24.7647 and − 19.0917 for Srilanka. Nepal showed least and delayed effect among SAARC states and showed a declining trend with negative

1 3
Annals of Data Science
Tabl
e 2
Res
ults
of C
AR
for t
he in
dice
s of s
elec
ted
SAA
RC C
ount
ries.
Sour
ce: A
utho
r’s C
alcu
latio
ns
Day
sS&
P B
SE S
ENSE
XPS
X K
SE-1
00D
SEX
ASP
IN
EPSE
CARi,t
t-tes
t P-v
alue
CARi,t
t-tes
t P-v
alue
CARi,t
t-tes
t P-v
alue
CARi,t
t-tes
t P-v
alue
CARi,t
t-tes
t P-v
alue
− 2
53.
3652
− 6
.044
40.
0000
1.79
21−
7.5
205
0.00
00−
1.8
433
− 4
.010
90.
0006
− 0
.701
8−
8.1
489
0.00
00−
1.7
771
− 2
.044
30.
0000
− 2
02.
7075
− 6
.617
00.
0000
0.98
74−
8.1
480
0.00
006.
7543
− 4
.192
40.
0003
− 1
.074
7−
8.7
439
0.00
003.
8386
− 2
.132
40.
0000
− 1
50.
0031
− 7
.262
20.
0000
− 4
.380
6−
8.8
563
0.00
004.
2521
− 5
.046
00.
0002
− 4
.236
1−
9.4
197
0.00
0010
.409
2−
2.4
719
0.00
00−
10
− 3
.801
4−
7.9
225
0.00
00−
7.3
731
− 9
.519
70.
0000
− 0
.380
7−
5.8
510
0.00
00−
6.5
328
− 1
0.04
880.
0000
9.78
49−
3.1
754
0.00
00−
5−
10.
9913
− 8
.556
70.
0000
− 2
0.55
86−
10.
2092
0.00
00−
3.5
234
− 6
.402
00.
0000
− 1
6.16
33−
10.
6682
0.00
00−
0.2
935
− 3
.988
00.
0000
− 1
− 1
9.19
99−
8.9
996
0.00
00−
21.
8161
− 1
0.53
050.
0000
− 9
.885
1−
6.7
626
0.00
00−
18.
8350
− 1
0.79
400.
0000
5.65
97−
4.4
146
0.00
000
− 1
4.48
15−
9.1
267
0.00
00−
33.
3266
− 1
0.87
600.
0000
− 5
.566
0−
6.5
009
0.00
00−
24.
7647
− 1
0.75
410.
0000
3.99
59−
5.3
244
0.00
001
− 3
1.43
30−
9.5
703
0.00
00−
36.
7238
− 1
0.73
500.
0000
− 1
3.85
43−
6.7
173
0.00
00−
7.7
124
− −
0.2
031
0.00
00−
1.3
558
− 6
.373
80.
0000
5−
25.
7189
− 8
.987
10.
0000
− 2
5.15
99−
10.
3455
0.00
00−
8.4
333
− 5
.768
30.
0000
− 1
9.09
17−
9.1
785
0.00
00−
7.7
744
− 7
.321
80.
0000
10−
32.
0939
− 8
.645
80.
0000
− 2
9.73
60−
10.
6234
0.00
00−
7.1
556
− 5
.410
90.
0000
− 1
6.73
90−
8.7
613
0.00
00−
10.
9399
− 7
.999
50.
0000
15−
19.
3569
− 7
.471
10.
0000
− 2
6.57
51−
10.
6329
0.00
00−
4.9
545
− 5
.161
00.
0000
− 1
5.07
55−
8.4
825
0.00
00−
10.
7936
− 8
.615
60.
0000
20−
17.
7836
− 7
.278
60.
0000
− 3
8.53
42−
11.
0240
0.00
00−
6.0
553
− 5
.401
80.
0000
− 1
4.48
19−
8.3
451
0.00
00−
17.
9794
− 9
.667
10.
0000
25−
16.
7308
− 7
.220
80.
0000
− 2
9.42
25−
9.6
776
0.00
00−
6.2
246
− 5
.390
30.
0000
− 1
4.56
29−
8.2
454
0.00
00−
19.
6094
− 9
.952
40.
0000

Annals of Data Science
1 3
values of − 19.6094 and − 17.9794 for a very short period. Results of T-statistics shows t-values > 1.96 for all indices stock returns, so ‘H0 = CAR is significantly different from zero’ is accepted. The P-values of all indices are < 0.05 significance level, indicating significant negative effect of Mad COVID-19 outbreak on the stock returns of India, Pakistan, Bangladesh, Srilanka and Nepal. Hence H1a proved. Hamid Hussain in IBA Business Review [37] reported 4.68% (1336.03 points) decline in KSE-100 index stock returns with the increasing number of coronavirus cases in Pakistan.
5.2 Graphical Representation
The Fig. 3 above shows a graph, indicating CAR for S&P BSE SENSEX, PSX KSE-100, DSEX, ASPA and NEPSE during the period of COVID-19 hit SAARC coun-tries. The CAR i,t or the indices during t = − 25, 25 shows relatively stable values before COVID-19 pandemic declaration, but after the severe hit of Mad COVID-19 there was seen a dramatic decrease in the values. S&P BSE SENSEX shows dra-matic decrease in stock returns with fluctuating values moving between − 32.0939, − 31.4330, − 25.7189, − 19.3569, and − 19.1999. The performance of KSE-100 stock returns experienced significant decline with the increase in the hitting intensity of COVID-19 viral outbreak. CAR i,t during COVID-19 shows more negative values of − 38.5342, − 36.7238, − 33.3266 and − 29.7360. DSEX faced a tough time for a short period after COVID-19 pandemic declaration with maximum negative val-ues of − 13.8543 and − 9.8851, clearly indicated with negative peaks. Colombo Stock Exchange ASPI experienced a slight nosedive decrease for short period after COVID-19 pandemic hit with maximum negative values of 27.7124, − 24.7647 and − 19.0917 of CAR i,t. There was immediate recovery in stock returns of ASPI. Nepal experienced less intense and delayed effects of coronavirus among SAARC
-50
-40
-30
-20
-10
0
10
20
-25 -20 -15 -10 -5 -1 0 1 5 10 15 20 25
CAR for SAARC Countries Indices
S&P BSE SENSEX PSX KSE-100 DSEX ASPI NEPSE
Fig. 3 CAR for SAARC Countries indices: S&P BSE SENSEX, PSX KSE-100, DSEX, ASPA and NEPSE. Source: Author’s calculations

1 3
Annals of Data Science
countries. The graph shows a declining trend with negative values of − 19.6094 and − 17.9794 for a very short period.
5.3 GJR‑GARCH Model
5.3.1 Unit root test
The important condition for implication of the GARCH model is the presence of stationarity in the time series. The Augmented-Dickey-Fuller test proposed by two American Statisticians D.A. Dickey and W.A. Fuller (1979), tested ʹH0 = time series has a unit root’. If P-values of ADF test are less than 1percent critical level, we reject H0, indicating that entire time series data is stationary.
In above Table 3, we summarize the results of the ADF test. All indices for SAARC countries have P-values < 1percent critical level. Therefore we reject the null hypothesis for the presence of unit root in time series, indicating stationarity in the entire time series data. Now we can use the series for developing the GJR-GARCH model.
5.3.2 ARCH‑LM Test
For detection of heteroscedasticity in time series data we applied ARCH effect test. The ARCH-LM (Lagrange Multiplier) test proposed by Engle (1982), used for esti-mation of ARCH effect in the time series data. ARCH-LM test examine H0 = there is no ARCH effect in the data series. H0 will be accepted, if the values of chi-square statistics are > 0.05 significance level and if the values are < 5% significant level we reject H0. Hence the ARCH effect is present.
Table 3 Results of Augmented-Dickey-Fuller test for Stationarity of time series. Source: Author’s calculations
Countries T-statistics P-value
S&P BSE SENSEX − 13.29 0.000PSX KSE 100 − 11.07 0.000DSEX − 11.20 0.000ASPI − 6.22 0.000NEPSE − 8.45 0.000
Table 4 Results of ARCH-LM test for ARCH Effect. Source: Author’s Calculations
Countries Chi-square statistics
Lag value(
Chi2)
Df P-value
S&P BSE SENSEX 1 8.838 1 0.003PSX KSE 100 1 41.111 1 0.000DSEX 1 41.153 1 0.000ASPI 1 40.048 1 0.000NEPSE 1 42.398 1 0.000

Annals of Data Science
1 3
Table 4 above shows the results of ARCH-LM test for ARCH Effect using Chi-square statistics. The P-values of ARCH-LM test are < 5% critical level for all the indices. The results indicated rejection of the null hypothesis, so a significant ARCH effect is present in the series which is supportive for further analysis.
5.3.3 Breusch‑Godfrey‑LM Autocorrelation Test
The study applied Breusch-Godfrey-LM Autocorrelation test, proposed by Breusch and Godfrey (1978), used for examining H0 = no serial correlation. If the P-value is > 5% critical level, H0 is accepted.
Table 5 above shows the results of the Breusch-Godfrey-LM Autocorrelation test. The P-values for all the indices are > 0.05 significance level, indicating acceptance of H0 i-e no autocorrelation is present in time series data.
5.3.4 GJR‑GARCH Model Results
GJR-GARCH model is used for estimation of Contagion effect of mad coronavirus on the stock market volatility in the SAARC region.
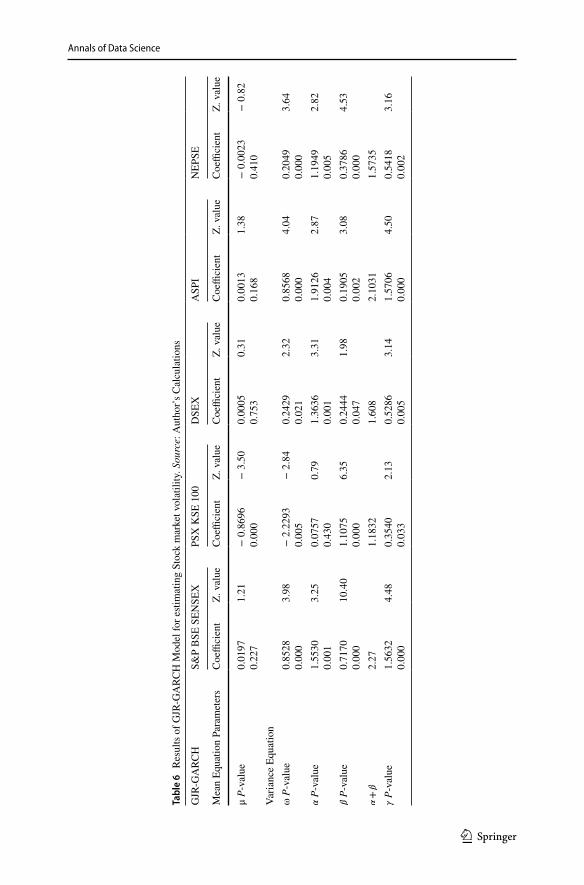
Table 6 above shows the estimation results of GJR-GARCH model for determin-ing the Contagion effect of stock market volatility in the SAARC region. Chen et al. [68] the presence of asymmetric conditional volatility in GARCH models is verified by the asymmetric parameters. Results indicate that the coefficient of ARCH (α) and GARCH (β) for all the indices were positive and statistically significant with P-val-ues < 0.05, indicating existence of ARCH effect and presence of volatility clustering among the indices studied. ‘μ’ represents the mean of returns and ‘ω’ represents the function for mean volatility, ω > 0, α > 0 and β > 0 ensures the positivity of the con-ditional variance. α + β shows the sum of the ARCH and GARCH coefficients with values > 1, indicating persistence in the asymmetric volatility. ‘γ’ represents the coef-ficient of leverage effect, if γ = 0 i-e no asymmetric volatility, if γ < 0 i-e asymmetric volatility is present, indicating low volatility with negative shocks like COVID-19 and if γ > 0 i-e asymmetric volatility is present, indicating more volatility with the negative shocks like Pandemic COVID-19 than positive shocks. The values for coefficient of leverage effect shows γ > 0 for all indices of SAARC member countries with signifi-cant P-values < 0.05 i-e asymmetric volatility is present, indicating that the impact of negative shocks like COVID-19 Pandemic is higher on the volatility of stock indexes of SAARC countries. So H1b is accepted. Mishra and Mishra [23] proved the outbreak
Table 5 Results of Breusch-Godfrey-LM Autocorrelation test. Source: Author’s Calculations
Countries(
Chi2)
Df P-values
S&P BSE SENSEX 0.000 1 0.9980PSX KSE 100 0.402 1 0.5260DSEX 0.027 1 0.8687ASPI 0.000 1 0.9996NEPSE 0.352 1 0.5528
1 3
Annals of Data Science
Tabl
e 6
Res
ults
of G
JR-G
ARC
H M
odel
for e
stim
atin
g St
ock
mar
ket v
olat
ility
. Sou
rce:
Aut
hor’s
Cal
cula
tions
GJR
-GA
RCH
S&P
BSE
SEN
SEX
PSX
KSE
100
DSE
XA
SPI
NEP
SE
Mea
n Eq
uatio
n Pa
ram
eter
sC
oeffi
cien
tZ.
val
ueC
oeffi
cien
tZ.
val
ueC
oeffi
cien
tZ.
val
ueC
oeffi
cien
tZ.
val
ueC
oeffi
cien
tZ.
val
ue
μ P-
valu
e0.
0197
0.22
71.
21−
0.8
696
0.00
0−
3.5
00.
0005
0.75
30.
310.
0013
0.16
81.
38−
0.0
023
0.41
0−
0.8
2
Varia
nce
Equa
tion
ω P-
valu
e0.
8528
0.00
03.
98−
2.2
293
0.00
5−
2.8
40.
2429
0.02
12.
320.
8568
0.00
04.
040.
2049
0.00
03.
64
� P
-val
ue1.
5530
0.00
13.
250.
0757
0.43
00.
791.
3636
0.00
13.
311.
9126
0.00
42.
871.
1949
0.00
52.
82
� P
-val
ue0.
7170
0.00
010
.40
1.10
750.
000
6.35
0.24
440.
047
1.98
0.19
050.
002
3.08
0.37
860.
000
4.53
� +
�2.
271.
1832
1.60
82.
1031
1.57
35� P
-val
ue1.
5632
0.00
04.
480.
3540
0.03
32.
130.
5286
0.00
53.
141.
5706
0.00
04.
500.
5418
0.00
23.
16

Annals of Data Science
1 3
of the corona pandemic had a significant effect on the returns as well as volatilities of Asian stock markets including Pakistan, India and Bangladesh.
6 Conclusion
This study significantly extends the previous studies that proved the negative effect of contagious viral infections on stock market performance. As the re-emerging viral infections are burdening the SAARC countries with serious negative effects on both human health and economic progression. This study estimated the impact of the Mad COVID-19 outbreak on the stock market returns and volatility effects of selected SAARC countries. The number of coronavirus cases were compara-tively low in SAARC economies but due to inadequate preparation, the uncertain preventive measures brought serious economic consequences. SAARC states expe-rienced uncertain spirals of coronavirus which led to variation in stock returns and their volatilities. The study applied CAR approach and proved the declining effect of Mad COVID-19 on the stock returns of SAARC countries. India and Pakistan experienced significant decline in stock returns with the increase in the hitting inten-sity of COVID-19 viral outbreak. Bangladesh and Srilanka face tough times with a slight nosedive only for a short period after COVID-19 pandemic and markets of Nepal were less responsive to the coronavirus. The GJR-GARCH model was applied to determine the volatility effect of the indices and findings indicate the significant increase in volatility of stock indexes of SAARC countries with the negative shocks like COVID-19 Pandemic. Therefore, the study proved significant reactions of SAARC countries to Mad COVID-19 severe hits, with falling markets and rising volatility.
7 Areas of further Study
The study only estimated the effect of Infectious pandemic COVID-19 outbreak on stock market performance of selected SAARC countries. The COVID-19 spread all around the globe, so other geographical zones can be considered for further study. Coronavirus is responsible for causing significant decline in the high level of global economic productivity and a considerable source for setting out its ultimate effect on every perspective related to the financial sector can provide an effective area for fur-ther study Ibrahim [2]. The study used CAR event study methodology, other relevant approaches including symmetric/ asymmetric GARCH models, BHAR approach, Granger Causality analysis can be implied with different event windows.
8 Implications
The study, along with academic contribution, is a source for exploring the finan-cial market behavior of the SAARC member states during re-emerging pandemic outbreaks. The study provides insights to financial advisors, financial investors
1 3
Annals of Data Science
regarding the behavior of stock market returns in reaction to hazards like novel coro-navirus. The study considered re-emerging epidemic diseases like COVID-19 as a negative shock which increased stock market volatility and resulted in falling future markets. The businesses and participants of financial markets must be aware of these negative shocks and their negative effects on the performance of stock markets and they must be prepared to combat the challenges resulting from similar global pandemics.
Acknowledgements We are very thankful to our faculty of Management Sciences department from National University of Modern Languages, Islamabad, Pakistan, who gave us insightful advices and sug-gestions for writing an effective article. We acknowledge their support for relevant data gathering and analysis.
Authors’ Contribution The study has a significant contribution for providing financial outlook of the SAARC member states during pandemics. The study proved re-emerging epidemic diseases like COVID-19 as a negative shock which increases stock market volatility and resulted in falling future markets. The participants of financial markets must be aware of these negative shocks and their negative effects on the performance of stock markets and they must be prepared to combat the challenges resulting from similar global pandemics.
Funding No financial support was received for the research, authorship and publication of the study.
Data Availability Historical databases of all selected indices are used for data collection. The data that support the findings of this study are available on request.
Declarations
Conflict of interest There is no Conflict of Interest regarding the authorship or publication of this article.
Code availability Excel spreadsheet is used for analysis and are available on request.
References
1. Cheval S et al (2020) Observed and potential impacts of the COVID-19 pandemic on the environ-ment. Int J Environ Res Public Health 17(11):4140
2. Yousef I (2020) Spillover of COVID-19: impact on stock market volatility. Int J Psych Rehabil 24(6):18069–18081
3. Ayittey et al (2020) Economic impacts of Wuhan 2019-nCoV on China and the world. J Med Virol 92(5):1–3
4. Li J, Guo K, Herrera Viedma E, Lee H, Liu J, Zhong Z, Gomes L, Filip FG, Fang SC, Ozdemir MS, Liu XH, Lu G, Sh Y (2020) Culture vs policy: more global collaboration to effectively combat COVID-19. The Innov 1(2):100023
5. Jiang Y et al (2017) H7N9 not only endanger human health but also hit stock marketing. Adv Dis Control Prev 2(1):1–7
6. Kumar S (2020) Monitoring novel corona virus (COVID-19) infections in india by cluster analysis. Ann Data Sci 7(3):417–425
7. Temesgen A, Gurmesa A, Getchew Y (2018) Joint modeling of longitudinal CD4 count and time-to-death of HIV/TB co-infected patients: a case of Jimma University Specialized Hospital. Ann Data Sci 5(4):659–678
8. Liu Y, Gu Z, Xia S, Shi B, Zhou X, Shi Y, Liu J (2020) What are the underlying transmission pat-terns of COVID-19 outbreak? An age-specific social contact characterization. EClincialMedicine 22:100354

Annals of Data Science
1 3
9. Atkins A, Niranjan M, Gerding E (2018) Financial news predicts stock market volatility better than close price. J Finance Data Sci 4(2):120–137
10. Yang R et al (2020) Big data analytics for financial Market volatility forecast based on support vec-tor machine. Int J Inf Manage 50:452–462
11. Saddiki H, McAuliffe J, Flaherty P (2015) GLAD: a mixed-membership model for heterogeneous tumor subtype classification. Bioinformatics 31(2):225–232
12. Thomas J (2020) Mad, bad and dangerous: answering COVID-19 conspiracy theories. Retrieved May 28, 2021, from https:// mcdre eamie. medium. com/ mad- bad- and- dange rous- answe ring- COVID- 19- consp iracy- theor ies- 46183 584ef c4
13. Liu HaiYue et al (2020) The COVID-19 outbreak and affected countries stock markets response. Int J Environ Res Public Health 17(8):2800
14. Reza FS (2020) Are SAARC countries prepared to combat COVID-19 to save young, working-age population? AIMS Public Health 7(3):440–449
15. Swamy S (2016) A case for SAARC reforms. The Hindu. Retrieved May 29, 2021, from https:// www. thehi ndu. com/ opini on/ lead/a- case- for- saarc- refor ms/ artic le663 0591. ece
16. Kugelman M (2020) What coronavirus means for South Asia. Retrieved November 10, 2020, from https:// www. wilso ncent er. org/ blog- post/ what- coron avirus- means- south- asia
17. Zaidi AKM, Awasthi S, Desilva H (2004) Burden of infectious diseases in South Asia. BMJ 328(7443):811–815
18. Laxminarayan R (2017) Emerging and re-emerging infectious disease threats in South Asia: status, vulnerability, preparedness, and outlook. The Center for Disease Dynamics, Economics and Policy. Retrieved November 6, 2020, from https:// cddep. org/ publi catio ns/ emerg ing_ and_ re_ emerg ing_ infec tious_ disea se_ threa ts_ south_ asia_ status_ vulne rabil ity/
19. Karunathilake K (2020) Positive and negative impacts of COVID-19, an analysis with special refer-ence to challenges on the supply chain in South Asian countries. J Soc Econ Dev. https:// doi. org/ 10. 1007/ s40847- 020- 00107-z
20. Wagner C, Scholz T (2020) South Asia in the corona crisis: economic and political consequences. Retrieved December 2, 2020, from https:// www. swp- berlin. org/ https:// doi. org/ 10. 18449/ 2020C 19/
21. Menon S (2020) Coronavirus in South Asia: Which countries have rising numbers? BBC News. Retrieved December 3, 2020, from https:// www. bbc. com/ news/ world- asia- 53420 537
22. Babu GR, S. K. (2021) Pandemic preparedness and response to COVID-19 in South Asian coun-tries. Int J Infect Dis 104:169–174
23. Mishra PK (2020) Corona pandemic and stock market behaviour: empirical insights from selected Asian countries. Millennial Asia 11(3):341–365
24. Inam Z (2020) South Asia and COVID-19. International The News. Retrieved November 3, 2020, from https:// www. thene ws. com. pk/ print/ 676775- south- asia- and- COVID- 19
25. The World Bank (2020a) The Global Economic Outlook During the COVID-19 Pandemic: A Changed World. Retrieved May 26, 2021, from https:// www. world bank. org/ en/ news/ featu re/ 2020/ 06/ 08/ the- global- econo mic- outlo ok- during- the- COVID- 19- pande mic-a- chang ed- world
26. WHO (2020a) Coronavirus disease (COVID-19) Situation Report-102. World Health Organization. Retrieved May 24, 2021, from https:// www. who. int/ docs/ defau lt- source/ coron aviru se/ situa tion- repor ts/ 20200 501- COVID- 19- sitrep. pdf? sfvrsn= 742f4 a18_4
27. ESCAP (2020) COVID-19 and South Asia: national strategies and subregional cooperation for accelerating inclusive, sustainable and resilient recovery. United Nations Economic and Social Commission for Asia and the Pacific. Retrieved November 8, 2020, from https:// www. unesc ap. org/ sites/ defau lt/ files/ South% 20Asia% 20COV ID- 19% 20Pap er_5. pdf
28. The World Bank (2020b) South Asia economic focus, spring 2020: the cursed blessing of public banks. The World Bank. Retrieved November 6, 2020, from https:// openk nowle dge. world bank. org/ handle/ 10986/ 33478
29. Rolander N (2020) Sweden’s covid expert says ‘World Went Mad’ with lockdowns. Bloomberg. Retrieved October 28, 2020, from https:// www. bloom berg. com/ news/ artic les/ 2020- 06- 24/ sweden- s- epide miolo gist- says- world- went- mad- impos ing- lockd owns
30. Scott R, Baker NB (2020) COVID-induced economic uncertainty. The National Bureau of Eco-nomic Research, Working Paper No. 26983. Retrieved October 26, 2020, from https:// bfi. uchic ago. edu/ wp- conte nt/ uploa ds/ BFI_ White- Paper_ Davis_4. 2020. pdf
31. Fernandes N (2020) Economic effects of coronavirus outbreak (COVID-19) on the world Economy. Retrieved October 6, 2020, from SSRN 3557504

1 3
Annals of Data Science
32. Koijen NJ (2020) Coronavirus: impact on stock prices and growth expectations. University of Chi-cago, Becker Friedman Institute for Economics Working Paper, (2020–2022). Retrieved November 26, 2020, from https:// www. nber. org/ system/ files/ worki ng_ papers/ w27387/ w27387. pdf
33. Qing He JL (2020) The impact of COVID-19 on stock markets. J Econ Political Stud 8(3):275–288 34. Samrat KD et al (2020) Epidemic trend analysis of SARS-CoV-2 in SAARC Countries using modi-
fied SIR (M-SIR) Predictive Model. Retrieved November 30, 2020, from https:// www. resea rchga te. net/ publi cation/ 34258 5582_ Epide mic_ Trend_ Analy sis_ of_ SARS- CoV-2_ in_ SAARC_ Count ries_ Using_ Modifi ed_ SIR_M- SIR_ Predi ctive_ Model
35. Nanda C et al (2020) Short term nowcasting and forecasting for COVID-19 potential spread in SAARC Country: a modeling study using machine learning approach. Int J Res Appl Sci Eng Tech-nol 8(4):246–256
36. Bhattacharjee D (2020) South Asia and COVID-19: the present challenges and upcoming trends. Indian Council of World Affairs. Retrieved October 27, 2020, from https:// www. resea rchga te. net/ publi cation/ 34053 5271_ South_ Asia_ and_ COVID- 19_ The_ Prese nt_ Chall enges_ and_ Upcom ing_ Trends
37. Hussain H (2020) Pakistan Stock market reaction to COVID-19. IBA Business Review. Retrieved October 22, 2020, from https:// busin essre view. iba. edu. pk/ covid 19/ artic les/ hamid. pdf
38. Basistha DB (2020) The outbreak of COVID-19 pandemic and its impact on stock market volatility: evidence from a worstaffected economy. Retrieved October 24, 2020, from https:// www. resea rchsq uare. com/ artic le/ rs- 57471/ v1
39. Mishra AK, Rath BN, Dash AK (2020) Does the Indian financial market nosedive because of the COVID-19 outbreak, in comparison to after demonetisation and the GST? J Emerg Markets Finance Trade 56(10):2162–2180
40. Faculty of Humanities and Social Sciences (2020) COVID-19: The socio-economic impact on Srilanka. University of Ruhuna, Srilanka
41. Aktar M, Begum H, Sohag AU (2020) Impact of COVID-19 on stock market in Bangladesh. IOSR J Econ Finance 11(4):30–33
42. ADB (2020) Nepal: macroeconomic update, vol 8, No 1. Asian Development Bank. Retrieved December 12, 2020, from https:// www. adb. org/ docum ents/ macro econo mic- update- nepal- april- 2020
43. Gilli M, Kellezi E (2006) An application of extreme value theory for measuring financial risk. Com-put Econ 27(1):1–23
44. Mei-Ping C et al (2018) Did the S.A.R.S. epidemic weaken the integration of Asian stock markets? Evidence from smooth time-varying cointegration analysis. J Econ Res-Ekonomska Istrazivanja 31(1):908–926
45. Kuo-Jung Lee S-LL (2018) Contagion effect of natural disaster and financial crisis events on inter-national stock markets. J Risk Financial Manag 11(2):16
46. Boyer BH, Kumagai T, Yuan K (2006) How do crises spread? evidence from accessible and inac-cessible stock indices. J Financ 61(2):957–1003
47. Caporale GM, Cipollini A, Spagnolo N (2005) Testing for contagion: a conditional correlation anal-ysis. J Empir Financ 12(3):476–489
48. Lee H, Wu H, Wang Y (2009) Contagion effect in financial markets after the South-East Asia Tsu-nami. Res Int Bus Financ 21(2):281–296
49. Babu M, Srinivasan S, Hariharan C (2017) Contagion effect in stock markets-a study on SAARC nations. Asian J Res Bus Econ Manag 7(2):35–44
50. Okorie DI, Lin B (2020) Stock markets and the COVID-19 fractal contagion effects. Financ Res Lett 38(4):101640
51. Selmi R, Bouoiyour J (2020) Global market’s diagnosis on coronavirus: a tug of war between hope and fear. Retrieved November 14, 2020, from hal-02514428
52. Iqbal H, Saeed K, Shah Z (2020) Structural breaks and volatility spillover in South Asian econo-mies. SEISENSE J Manag 3(1):64–77
53. Abbas Q, Khan S (2013) Volatility transmission in regional Asian stock markets. Emerg Markets Rev 16(C):66–77
54. Golam MWU et al (2017) Effect of macroeconomic variables on stock market performance of SAARC countries. Asian Econ Finan Rev 7(8):770–779
55. Baek S, Sunil KM, Mina G (2020) COVID-19 and stock market volatility: an industry level analy-sis. Financ Res Lett 37:101748
Annals of Data Science
1 3
56. Yaseen H et al (2020) COVID-19 in five neighbouring limited resources countries: a financial and health threats. Value in Health Regional Issues. Retrieved November 22, 2020, from https:// www. ncbi. nlm. nih. gov/ pmc/ artic les/ PMC73 24313/#
57. Vryghem A (2017) Analyzing the statistical significance and potential impact of abnormal returns caused by a short squeeze. MSc thesis, Louvain School of Management. Retrieved June 30, 2021, from https:// dial. uclou vain. be/ memoi re/ ucl/ fr/ object/ thesis% 3A103 09/ datas tream/ PDF_ 01/ view
58. Gregory A (1997) An examination of the long run performance of UK acquiring firms. J Bus Financ Acc 24(7–8):971–1002
59. McConnell SL (1989) Further evidence on the bank lending process and the capital-market response to bank loan agreements. J Financ Econ 25(1):99–122
60. WHO (2020b) WHO Director-General’s opening remarks at the media briefing on COVID-19-11 March 2020. World Health Organization. Retrieved December 29, 2020, from https:// www. who. int/ direc tor- gener al/ speec hes/ detail/ who- direc tor- gener al-s- openi ng- remar ks- at- the- media- brief ing- on- COVID- 19--- 11- march- 2020
61. Schafer H (2020) COVID-19 will hit South Asia hard. We are fighting back. The World Bank. Retrieved November 2, 2020, from https:// blogs. world bank. org/ endpo verty insou thasia/ COVID- 19- will- hit- south- asia- hard- we- are- fight ing- back
62. Asem E, Alam S (2012) The role of the S&P 500 index constituents in tracking the U.S. equity mar-ket. Int J Econ Financ 4(12):15–23
63. Syed JHS et al (2014) Relationship between developed, emerging and South Asian equity markets: empirical evidence with a multivariate framework analysis. MPRA Paper No. 60398. Retrieved May 29, 2021, from https:// mpra. ub. uni- muenc hen. de/ 60398/
64. Chen M, Jang S, Kim WG (2007) The impact of the SARS outbreak on Taiwanese hotel stock per-formance: an event-study approach. Int J Hosp Manag 26(1):200–212
65. Ali G (2013) EGARCH, GJR-GARCH, TGARCH, AVGARCH, NGARCH, IGARCH and APARCH models for pathogens at marine recreational sites. J Stat Econ Methods 2(3):57–73
66. Sakthivel P et al (2014) Impact of global financial crisis on stock market volatility: evidence from India. Asian Soc Sci 10(10):86–94
67. Lawrence R, Glosten RJ (1993) On the relation between the expected value and the volatility of the nominal excess return on stocks. J Financ 48(5):1779–1801
68. Chen H, Zhang J, Tao Y, Tan F (2019) Asymmetric GARCH type models for asymmetric volatility characteristics analysis and wind power forecasting. Protect Control Modern Power Syst 29(4):69
Publisher’s Note Springer Nature remains neutral with regard to jurisdictional claims in published maps and institutional affiliations.
Asima Saleem Ph.D. Scholar at National University of Modern Languages, Islamabad, Pakistan. Currently serving as a lecturer Management Sciences at Arid Agriculture University Islamabad, Pakistan. Highly passionate about reading and writing quality research articles involving supply chain management, econometrics and financial markets.