Embed Size (px)
Citation preview

http://asj.sagepub.com
Acta Sociologica
DOI: 10.1177/0001699305059945 2005; 48; 321 Acta Sociologica
Herman G. Van de Werfhorst and Robert Andersen Social Background, Credential Inflation and Educational Strategies
http://asj.sagepub.com/cgi/content/abstract/48/4/321 The online version of this article can be found at:
Published by:
http://www.sagepublications.com
On behalf of: Nordic Sociological Association
can be found at:Acta Sociologica Additional services and information for
http://asj.sagepub.com/cgi/alerts Email Alerts:
http://asj.sagepub.com/subscriptions Subscriptions:
http://www.sagepub.com/journalsReprints.navReprints:
http://www.sagepub.co.uk/journalsPermissions.navPermissions:
http://asj.sagepub.com/cgi/content/refs/48/4/321 Citations
at Universiteit van Amsterdam SAGE on June 25, 2010 http://asj.sagepub.comDownloaded from

ACTA SOCIOLOGICA 2005
Social Background, Credential Inflation andEducational Strategies
Herman G. Van de WerfhorstUniversity of Amsterdam, The Netherlands
Robert AndersenMcMaster University, Canada
abstract: The primary goal of this article is to examine the impact of credentialinflation on educational attainment in twentieth-century United States. To do so,we create a measure of ‘intergenerational credential inflation’ (intergenerationinflation factor) and include it in regression models predicting educational transi-tions. Using the General Social Surveys of 1972–2000, we find that people aregenerally less likely to invest in schooling if its value is relatively low. An exceptionis the final transition to a postgraduate degree, where we find that when its valueis low children of parents with postgraduate education are more likely to take it.This finding supports relative risk aversion theory, which assumes that the maingoal of children is to avoid downward social class mobility. Perhaps mostimportant, we find that credential inflation is particularly influential on transitionprobabilities if parents had made the same transition. This pattern is consistent withthe information differential thesis that children are more informed about the valueof education if their parents acquired it.
keywords: credential inflation ◆ educational inequality ◆ relative risk aversion ◆social change ◆ social class ◆ social stratification ◆ transition models ◆
United States
Introduction
It is well known that educational attainment is largely affected by social background, particu-larly the social class and education of parents (Jencks et al., 1972: Sewell et al., 1976; Halsey etal., 1980). A large body of research also indicates that specific educational transitions can bedifferentiated by social background (Mare, 1980, 1981a; Shavit and Blossfeld, 1993). Less isknown about the effects of macro-level conditions – such as credential inflation – oneducational attainment generally and on separate educational transitions. There has beenresearch examining the extent to which people are over-educated for the labour market (Cloggand Shockey, 1984; Boylan, 1993; Van der Ploeg, 1994; Groot and Maassen van den Brink, 2000;Wolbers et al., 2001), but these studies have not incorporated educational inequality. Moreimportantly, the interaction between macro-level conditions and social background inconstraining educational decisions has received no attention.
This lack of empirical research on the effects of macro-conditions on educational choices
Acta Sociologica ◆ December 2005 ◆ Vol 48(4): 321–340 ◆ DOI: 10.1177/0001699305059945Copyright © 2005 Nordic Sociological Association and SAGE (London, Thousand Oaks, CA and New Delhi)
www.sagepublications.com
at Universiteit van Amsterdam SAGE on June 25, 2010 http://asj.sagepub.comDownloaded from

reflects that sociological theories regarding these issues are underdeveloped. Simply arguingthat children of higher social classes achieve higher grades and levels of education providesonly part of the story. For a more nuanced understanding of educational attainment, we needto construct and test theories about why children of different social origins might strive forparticular educational levels, and whether different macro-conditions have different effects onthe likelihood of making educational transitions for children from different social back-grounds.
Since the sociological study of educational inequality is motivated by the inequality ofopportunities caused by education, it is important to consider the labour market value ofcredentials. This article accomplishes this by exploring the relationship between credentialinflation, parental education and educational decisions. We have three goals: (1) to formulatea measure of credential inflation; (2) to assess the impact of credential inflation on educationaltransitions; and (3) to determine whether this impact differs according to the educationalcareer of parents. Using General Social Survey (GSS) data from the United States collectedacross many cohorts characterized by varying levels of education rewards, we gain insightinto the social inequalities of educational attainment net of credential inflation and educationalexpansion.
Credential inflation and educational strategies
A good starting point for understanding the strategies of children when deciding to pursuefurther education is the theory of ‘relative risk aversion’ first proposed by Boudon (1974), andlater elaborated on by Breen and Goldthorpe (1997; Goldthorpe, 1996a; Breen, 2001). Thistheory argues that the decision to end formal education is based largely on a desire to avoiddownward social class mobility. In fact, this desire is posited as the ‘primary goal’ of indi-viduals when determining educational strategies. Simply put, children typically desire toachieve at least enough education to gain access to the social class of their parents.
Relative risk aversion sheds light on why, relative to working-class children, children ofmore advanced social classes are more ambitious and achieve higher levels of education(Keller and Zavalloni, 1964; Boudon, 1974; Gambetta, 1987; Goldthorpe, 1996a; Need and DeJong, 2001; Davies et al., 2002). At a relatively early point in their educational career, mostworking-class children have already met the goal of avoiding downward mobility. Middle-class children generally need to acquire much higher levels of education to achieve theirparents’ social class. Moreover, working-class children have fewer resources to financeeducation or to overcome potential earnings forgone during their years in school.
All else being equal, children should need only as much education as their parents to enterthe same social class as their parents. If the values of education credentials are not constantover time, however, this simple relationship will not hold. If certain education credentialsincrease in value from one generation to the next, children will typically need less educationthan their parents did. Conversely, if the value of an education decreases, children are likelyto need more education than their parents to achieve the same social class.1
A significant body of research indicates that education credentials have devalued duringthe twentieth century. This devaluation was largely caused by ‘over-schooling’, i.e. a vastexpansion in educational attainment that was not equalled by an upgrading of the labourmarket (Burris, 1983; Clogg and Shockey, 1984; Brown, 1995; Groot and Maassen van denBrink, 2000). This process has implications for individual strategies of educational investment,especially if one prescribes to labour queue theory, which sees education as a relative goodfor which employers compete for employees with the highest credentials in order to reducethe costs of job training (Thurow, 1976; Hirsch, 1977). In an over-qualified labour market,employers will fill the ‘highest’ jobs with those who have the ‘highest’ qualifications. Since
Acta Sociologica 48(4)
322 at Universiteit van Amsterdam SAGE on June 25, 2010 http://asj.sagepub.comDownloaded from

over-schooling means that there are too many workers who are highly educated, some of theseworkers are necessarily allocated to ‘mid-level’ jobs. This process is repeated for those withmid-level qualifications, where, since there are not enough mid-level jobs, many are forced tocompete for low-level jobs. It follows logically that this pattern has its most serious effects onthe labour market opportunities of those with lower levels of education, thus widening thegap between educational levels in their occupational returns (Boylan, 1993; Van der Ploeg,1994; Wolbers et al., 2001). If people wish to avoid downward mobility – as is implied by themechanism of relative risk aversion – they need to achieve a higher level of education if itsvalue decreases.2
Including the labour market value of credentials in the study of educational inequalityprovides further insight into educational stratification than has been known previously.Conventional theories can be used to explain the general pattern that children with highlyeducated parents attain higher educational levels than children of lower social backgrounds(see, for example, Jencks et al., 1972; Bourdieu and Passeron, 1990; Blossfeld and Shavit, 1993).On the other hand, only by incorporating the value of education can we specifically assessrelative risk aversion theory. If relative risk aversion holds, we should see indirect evidenceof it in the impact that credential inflation has on children’s educational choices.
The considerations people make when investing in education may differ as they progressthrough educational transitions. In particular, the decision to acquire postgraduate trainingmay be based on completely different considerations than transitions at other levels. As weshall show later, the additional value of postgraduate training past a college degree isgenerally limited, at least in terms of social class returns. Moreover, the costs of failure arehigh, since it is seen as a bad ‘signal’ to potential employers (Spence, 1973), in effect limitinginitial and future job prospects. Studying at the postgraduate level also usually implies post-ponement of family transitions like marriage and having children (Marini, 1984; Blossfeld andHuinink, 1991). In the event of an unsuccessful completion of a graduate programme afteryears of study, this postponement would not be compensated by higher labour market returns(Becker, 1981). Given that the absolute gains are limited, investment in postgraduate studiesis perhaps best seen, at least in economic terms, as reflecting a desire to secure one’s relativeposition to their parents than investment in other educational levels reflects. In other words,the combined processes of credential inflation and relative risk aversion leading to a negativeimpact of the intergenerational value of education on making the transition to postgraduateeducation should be most evident at this transition.3
Although some authors are sceptical that children have much information on the value ofschooling, and whether they use this information in educational decision-making (Manski andWise, 1983; Manski, 1993), it is possible that there is an information differential based onparental education. The influence of credential inflation on educational decisions might differ,then, according to the education level of parents, with highly educated parents being betterable to transmit accurate information about the value of education on the labour market(Collins, 1979; Manski and Wise, 1983; Gambetta, 1987; Erikson and Jonsson, 1996). Morespecifically, a parent who made the transition that their child is facing should be able to givemore reliable information about the value of that education than parents who did not makethe transition. In other words, the effects of credential inflation on educational decisionsshould be strongest for children whose parents made the transition that they are facingbecause they are more likely to have knowledge about the value of that education.
There is also good reason to believe that the interaction between the value of education andwhether a parent made specific transitions will differ across transitions. At early transitionswhen a large majority remain in school, nearly all children will be provided with informationabout the value of acquiring that education. This might be particularly evident at the tran-sition to complete high school, especially in recent decades, since most people understand that
Van de Werfhorst and Andersen: Credential Inflation and Educational Inequality
323 at Universiteit van Amsterdam SAGE on June 25, 2010 http://asj.sagepub.comDownloaded from

it is difficult to find good employment without a high school diploma. On the other hand,when few people make a transition, and when the labour market rewards of that transitionare relatively high, there may be an information differential between parents who made thetransition and those who did not. In such cases the parents who made the transition have anadvantage in determining the value of an education and thus are able to convey that messageto their children. This should be the case especially for the transition to a college degree, wherea considerable number of people end schooling beforehand, despite the greater returns thanthe other transitions (Pascarella and Terenzini, 1991; McCall, 2000; also see below).
The information differential we address has to do only with knowledge of the value ofeducation. There are, of course, other types of information differentials not addressed here.For example, information concerning the difficulty of making a transition and the importanceof intelligence and effort for success are also potentially important factors (Erikson andJonsson, 1996; Breen, 1999). Breen (1999) argues that children of higher social origins (e.g.children of parents who made a transition) subscribe to the belief that effort is crucial, andmay underestimate the relevance of intelligence. On the other hand, children of lower socialorigins (e.g. children of parents who did not make the transition) overestimate the relevanceof intelligence and underestimate the relevance of effort. Thus, parents who made a transitioncan inform their children on the importance of effort in making a transition, while otherparents may not be able to provide this information, thus discouraging their children frompursuing further education. Similarly, according to reproduction theories, information couldbe seen as a resource (cf. Teachman, 1987). Although important in explaining the generalassociation between parent and children educational careers, these information differentialsdo not directly relate to our hypothesis on the information differential regarding the value ofschooling.
Data and methods
DataData are taken from the pooled General Social Surveys (GSS) of 1972–2000 for two separatebut related analyses. In the first analysis, we develop a measure that we term the Intergener-ational Inflation Factor (IIF) to estimate the value of education. This analysis assesses theimpact of education on social class for men born between 1900 and 1970 (ten 7-year birthcohorts; n = 14,204). We use only men for this analysis since, particularly for earlier cohorts,the investment in education was more strongly associated with labour market returns for menthan for women.
In the second analysis, we incorporate the IIF into educational transition models. Thesemodels use information about both men and women aged 26 or over at the time of the survey.Since we are interested in the value of education for each generation compared to that of theparents’ generation, this analysis is necessarily restricted to seven 7-year birth cohorts bornbetween 1922 and 1970, giving an analytical sample size of 17,058 after missing cases wereomitted.
Background variablesEducation is coded into five categories: (1) primary education; (2) completed high school; (3)some post-secondary training; (4) completed four-year college; (5) and postgraduate training.This classification is used both for child’s education and parents’ education (we use theeducation level of the parent with the highest level).
Following from relative risk aversion theory, we focus on social class as our occupationaloutcome variable (Breen and Goldthorpe, 1997; Goldthorpe, 2000). An alternative outcome ofsignificant interest is income. Unfortunately, however, income data are not available for all
Acta Sociologica 48(4)
324 at Universiteit van Amsterdam SAGE on June 25, 2010 http://asj.sagepub.comDownloaded from

years of the GSS. Nonetheless, as we shall show later, the relationship between education andsocial class, i.e. a negative trend in the effect of education over time, is similar to the relation-ship between education and earnings (e.g. Freeman, 1976; Hartog, 2000) and other occupa-tional outcomes (e.g. Clogg and Shockey, 1984; Wolbers et al., 2001).4 We would expect, then,that our findings regarding the impact of credential inflation on educational decisions wouldbe similar regardless of the occupational outcome used.
Social class is measured using an adaptation of the CASMIN classification widely used ininternational social mobility research (e.g. Ganzeboom et al., 1989; Erikson and Goldthorpe,1992; Ishida et al., 1995). We excluded farmers and the ‘petty bourgeoisie’ (self-employed withno or few employees) from the analysis so that the class variable can be ordered hierarchi-cally.5 For the same reason, we collapsed skilled manual workers, supervisors, technicians androutine non-manual workers into a single class. This results in four classes that are hierarchi-cally ordered: (1) unskilled manual working class, (2) skilled manual, supervisors and routinenon-manual workers, (3) lower managers and professionals, and (4) higher managers andprofessionals. Social class is used both for fathers in the educational transitions models andfor respondents in measuring credential inflation.
Other demographic variables were included as controls in our models. These include race(non-white versus white), region (southern states versus other) and gender. Descriptive statis-tics for the background variables can be seen in Table 1.
Macro-level variables
Per cent at riskIn order to control for the effect of educational expansion, we include a measure of the percent-age of students facing each transition in every cohort. The percentage at risk is 100 for peoplefacing the first transition for every cohort, and drops for every subsequent transition, with a
Van de Werfhorst and Andersen: Credential Inflation and Educational Inequality
325
Table 1 Descriptive statistics for demographic variables
Proportion
Female 0.550Non-white 0.141Southern states 0.290Highest education of parents
Primary school 0.212High school 0.475Some post-secondary 0.115Completed college 0.122Postgraduate degree 0.076
Father’s classUnskilled manual 0.319Skilled manual/routine non-manual 0.387Lower managers and professionals 0.058Higher managers and professionals 0.244
Educational transitions completed(unconditional on previous transitions)
Transition 1 (high school) 0.958Transition 2 (some post-secondary) 0.522Transition 3 (college degree) 0.321Transition 4 (post-graduate degree) 0.129
No. of cases 17,058
at Universiteit van Amsterdam SAGE on June 25, 2010 http://asj.sagepub.comDownloaded from

varying rate across cohorts (see also Rijken, 1999; Sieben, 2001). If we estimated separatemodels for each cohort, the logit model without this variable would be appropriate to studyeducational inequality net of educational expansion (cf. Mare, 1981a). This variable is necess-arily included, however, because we pool data from many cohorts in a single analysis.6
Intergenerational inflation factorPrevious measures of over-education have been developed (Eckhaus, 1964; Scoville, 1966;Clogg and Shockney, 1984), but they are not suitable for our analysis. Eckhaus (1964) andScoville (1966) assess over-education according to whether people are above or below themean level of education needed for an occupation. Clogg and Shockey (1984) classify peopleas over-educated if their education level is at least one standard deviation higher than theaverage in their occupation. These measures are only useful to show trends in over-educationand not to accurately show the level of over-education.7 It is therefore necessary to constructa new measure to assess the value of education.
We start by determining the value of education using four cumulative logit (proportionalodds) models – one for each transition – with social class as the dependent variable (treatedas a four-class ordered-category variable) and education level as the main explanatoryvariable.8 These models take the following form:
(1)
where the �1 to �d are the probabilities of achieving a particular social class d compared to allsocial classes below it (with a total of D = 4 categories representing the four social classes, withcategory 1 being the ‘highest’ class and category 4 the ‘lowest’); EDUC is a binary classificationof educational level with different boundaries for the four separate models; and AGE ismeasured in years. In total, there are K birth cohorts COH, of which K–1 are included asdummy variables in the model. The resulting main effect of education level β1 is an estimateof the value of education for the reference cohort. For cohort k the value of education can becomputed by adding the δ term for the interaction of cohort k with education to the main effectof education β1. The resulting terms, which we call ωk, represent the cohort-specific educationeffects.9
The cohort-specific education effects, ωk, are used to construct the IIF for each cohort andfor each educational transition separately. The IIF is meant to approximate the ratio of thevalue of education achieved by respondents to the value of that education for the parents’generation. The formula for the IIF of the transition from j–1 to j for cohort k is as follows:
(2)
Since individuals can only make informed educational choices on the basis of seen returns toeducation, they must look to the success of individuals going through the schooling systemsome years before them. Reflecting this mechanism, we use ωk-1, (i.e. the estimate of theprevious cohort) rather than ωk, as the value of education for each respondent. In other words,the numerator of this equation represents children’s ‘perceived’ value of education. Thedenominator of the equation represents the value of that same education a generation before.
IIFjkk
k k
j
j j
=+⎛
⎝⎜
⎞
⎠⎟
−
− −
ω
ω ω1
3 4
2
log......
π ππ π
α β β1
11 2
+ ++ +
⎛⎝⎜
⎞⎠⎟
= + ++
d
d Dj EDUC AGGE COH
COH EDUC RACE REGIO
kK
kK
+
+ × + +−
−
∑∑
λ
δ β β1
13 4 NN
Acta Sociologica 48(4)
326 at Universiteit van Amsterdam SAGE on June 25, 2010 http://asj.sagepub.comDownloaded from

Since we do not know the birth year of the parents, we use the average of two cohorts bornroughly 21–28 years before the respondent. If IIF is lower than 1, this particular transition haslost in value compared to the parents’ generation. If IIF is larger than 1, the transition hasgained in value.
Transition modelsFollowing from Mare (1980, 1981a) our main analysis employs educational transition models(see also Shavit and Blossfeld, 1993). We examine four educational transitions: (1) having atleast high school, (2) having obtained at least some post-secondary training given completedhigh school, (3) having completed college given some post-secondary training, and (4) havingentered postgraduate training given completed college.
We report a pooled analysis where all educational transitions are included in a single model.Each individual is represented in the data as many times as he or she faced a transition. Intotal, we study 47,774 transitions for 17,058 individuals.10
Our basic transition model takes the following form:
(3)
where pj is the probability of making the transitions from education level j–1 to education levelj; aj refers to the overall probability of making transition j if all other variables equal zero; Xis a vector of demographic variables that are unrelated to parental background (gender, percent at risk, ethnicity, region); PEDUC is a set of E–1 dummy regressors representing parentaleducation; FCLASS is a set of dummy regressors representing father’s social class. Finally, IIFjkis the intergenerational inflation factor for transition j and cohort k, and λ describes how IIFjkaffects the probability of making a transition. This baseline model is extended with two-wayand three-way interactions between IIFjk, transition, and whether parents made the transition.
Results
Educational expansion and credential inflation in the United StatesTable 2 displays cross-classifications of education level by social class destination for ten 7-year cohorts from 1900 to 1970. Not surprisingly given the findings of others, educationalexpansion is evident (cf. Dresch, 1975; Hauser and Featherman, 1976; Smith, 1986). Of theearliest cohort, 20.6 per cent acquired at least some post-secondary training. This percentageincreased to 58.2 for men born in the mid-1940s and decreased somewhat for later cohorts,possibly reflecting the truncation of unfinished school careers. It is also clear that educationalexpansion has affected occupations in all social classes (cf. Clogg and Shockey, 1984). Forexample, service class occupations have been increasingly filled with university graduates –of the cohort born in the period 1900 to 1907, only slightly more than 40 per cent had universitydegrees; of those born between 1964 and 1970, more than 70 per cent had university degrees.Perhaps most striking is the growing number of unskilled workers with university degrees.Of the early cohort, less than 1 per cent of unskilled workers had a university degree, but morethan 10 per cent of the last cohort had university degrees.
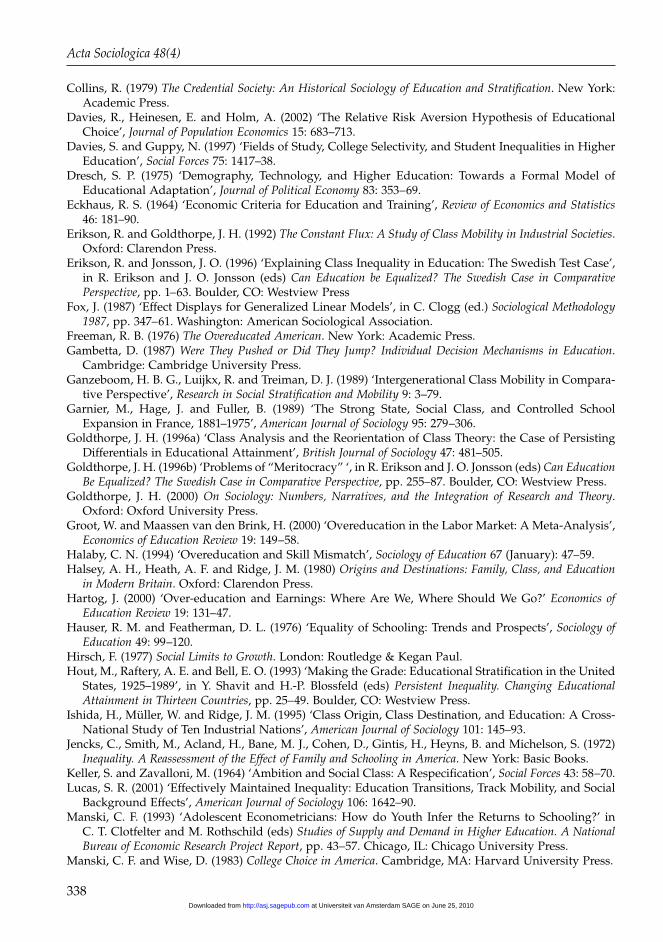
We can better see the social class returns to education in Figure 1, which displays the logodds ratios from the four cumulative logit models for ten 7-year birth cohorts (see Equation 1).This figure provides evidence that the value of each education level has declined significantlyover time. An exception is that high school education increased in value from the 1920s to the1940s birth cohorts, after which time it declined rapidly. The steep rise in the value of a high
logp
pX PEDUC FCLj
jj z z e
EZc1 1−
⎛
⎝⎜
⎞
⎠⎟ = + + +
−∑∑α β β β AASS IIFjk
C
+−
∑ λ1
Van de Werfhorst and Andersen: Credential Inflation and Educational Inequality
327 at Universiteit van Amsterdam SAGE on June 25, 2010 http://asj.sagepub.comDownloaded from

Acta Sociologica 48(4)
328
Table 2 Intercohort change in distribution and allocation of education and social class (column percentageswithin cohorts)
Skilled Lower Highermanual, managers managers
Unskilled routine, and andEducational level manual non-manual professionals professionals Total
Cohort 1 1900–07 (n = 484)Primary 68.9 45.4 16.7 16.8 45.2High school (completed) 29.3 42.1 29.2 29.2 34.1Some post-secondary 1.2 8.7 8.3 13.3 7.2Completed college (4 years) .6 2.2 20.8 20.4 6.8Postgraduate 1.6 25.0 20.4 6.6Total 100.0 100.0 100.0 100.0 100.0
Cohort 2 1908–14 (n = 754)Primary 56.0 34.6 10.9 11.6 34.5High school (completed) 38.5 50.5 34.5 26.8 40.5Some post-secondary 3.8 11.0 21.8 16.5 10.7Completed college (4 years) 1.3 3.0 20.0 24.4 8.4Postgraduate .4 1.0 12.7 20.7 6.0Total 100.0 100.0 100.0 100.0 100.0
Cohort 3 1915–21 (n = 1131)Primary 44.6 22.5 2.5 7.5 23.3High school (completed) 49.7 56.8 32.9 29.4 46.9Some post-secondary 4.8 12.0 17.7 14.0 11.0Completed college (4 years) 1.0 7.1 24.1 24.5 10.8Postgraduate 1.6 22.8 24.5 8.0Total 100.0 100.0 100.0 100.0 100.0
Cohort 4 1922–28 (n = 1356)Primary 36.4 19.1 3.8 7.1 19.5High school (completed) 53.6 55.1 31.1 22.9 44.8Some post-secondary 7.2 14.8 17.0 15.8 13.2Completed college (4 years) 1.9 9.2 18.9 26.5 12.3Postgraduate .8 1.8 29.2 27.7 10.1Total 100.0 100.0 100.0 100.0 100.0
Cohort 5 1929–35 (n = 1284)Primary 33.3 13.4 3.1 3.3 14.3High school (completed) 56.1 57.3 21.9 25.4 44.4Some post-secondary 7.7 15.9 18.8 14.8 13.9Completed college (4 years) 2.9 11.3 26.6 24.6 14.6Postgraduate 2.1 29.7 32.0 12.9Total 100.0 100.0 100.0 100.0 100.0
Cohort 6 1936–42 (n = 1494)Primary 21.6 7.1 .6 1.8 8.1High school (completed) 67.1 54.7 17.8 19.3 42.7Some post-secondary 7.0 23.7 19.0 14.8 16.7Completed college (4 years) 3.2 10.0 31.0 29.9 16.8Postgraduate 1.2 4.5 31.6 34.2 15.7Total 100.0 100.0 100.0 100.0 100.0
Cohort 7 1943–49 (n = 2227)Primary 12.4 4.4 .7 .9 4.6High school (completed) 64.4 47.8 12.5 15.0 37.1Some post-secondary 15.1 25.5 19.8 13.6 19.2Completed college (4 years) 6.6 17.0 34.0 33.1 21.7Postgraduate 1.5 5.2 33.0 37.3 17.3Total 100.0 100.0 100.0 100.0 100.0
continued
at Universiteit van Amsterdam SAGE on June 25, 2010 http://asj.sagepub.comDownloaded from

school diploma can plausibly be explained by increased demands for qualifications due to theincreased complexity of work in the shift from industrial to post-industrial society. Thewidening gap between the lines is most evident for the period after the 1940s birth cohorts,the cohorts that experienced most rapid educational expansion. Finally, the returns of a post-graduate education are almost indistinguishable from the returns of a first college degreethroughout the period under study. On average, then, completing graduate school is no morelikely to improve one’s social class position than ending formal education after obtaining acollege degree.
Figure 2 displays the intergenerational inflation factor of the four educational transitions.The reference line on the graph at IIF=1 represents where the value of the respondents’education is equal to what it was in the previous generation. For the most part, educationalqualifications have gradually devalued from one generation to the next (IIF <1) but there aresome exceptions. For example, high school education increased in value from the 1930s birthcohorts until the early 1950s birth cohorts (IIF >1), reaching a high for the mid-1940s cohorts.Having at least some college for the 1940s cohorts was also worth slightly more than it wasfor the previous generation. Moreover, for the last two cohorts the value of obtaining at leasta college degree increased, perhaps reflecting that educational expansion has been lessdramatic for younger cohorts because of incomplete careers (Hauser and Featherman, 1976;see also Table 2). We shall use this IIF measure in the transition models that follow.
Effects of IIF on educational transitionsWe now turn to the transition models seen in Table 3. These models assess the impact of socialbackground and credential inflation on moving from one education level to the next highest
Van de Werfhorst and Andersen: Credential Inflation and Educational Inequality
329
Table 2 Continued
Skilled Lower Highermanual, managers managers
Unskilled routine, and andEducational level manual non-manual professionals professionals Total
Cohort 8 1950–56 (n = 2371)Primary 5.4 2.0 .3 .2 2.3High school (completed) 65.9 48.7 14.0 15.3 41.2Some post-secondary 18.8 27.3 22.0 17.2 22.2Completed college (4 years) 8.2 17.9 36.0 32.1 20.9Postgraduate 1.6 4.2 27.7 35.2 13.4Total 100.0 100.0 100.0 100.0 100.0
Cohort 9 1957–63 (n = 1918)Primary 3.2 1.5 .8 .2 1.6High school (completed) 73.4 54.6 19.1 16.6 46.2Some post-secondary 17.5 25.3 22.4 14.8 20.7Completed college (4 years) 4.5 15.1 38.2 35.1 19.9Postgraduate 1.3 3.4 19.5 33.3 11.6Total 100.0 100.0 100.0 100.0 100.0
Cohort 10 1964–70 (n = 1185)Primary 2.5 1.3 .8 1.4High school (completed) 66.2 44.6 17.4 12.6 42.5Some post-secondary 20.6 33.2 20.5 20.2 26.3Completed college (4 years) 9.8 16.1 44.7 39.3 21.2Postgraduate .9 4.8 16.7 27.9 8.6Total 100.0 100.0 100.0 100.0 100.0
Source: General Social Surveys, 1972–2000 (men only).
at Universiteit van Amsterdam SAGE on June 25, 2010 http://asj.sagepub.comDownloaded from

Acta Sociologica 48(4)
330
0
0.5
1
1.5
2
2.5
3
3.5
1900–
17
1908–
14
1915–
21
1922–
28
1929–
35
1936–
42
1943–
49
1950–
56
1957–
63
1964–
70
Birth cohort
Lo
g-o
dd
s r
ati
o Transition 1
Transition 2
Transition 3
Transition 4
Figure 1 Trends in the social class returns according to credentials. (Note: Estimates are based on fourseparate cumulative logit models with social class regressed on four distinct binary classifications ofeducation. Models are controlled for age, race and region. Men only. Transition 1: High school, Transition 2: Some post-secondary education, Transition 3: College degree, Transition 4: Somepostgraduate training (smoothed lines).)
Figure 2 Trends in the intergenerational inflation factor (IIF) for each educational transition. (Note: Transition 1:High school, Transition 2: Some post-secondary education, Transition 3: College degree, Transition 4:Some postgraduate training (smoothed lines).)
0.50
0.75
1.00
1.25
1.50
1922–28 1929–35 1936–42 1943–49 1950–56 1957–63 1964–70
Birth cohort
IIF
Transition 1
Transition 2
Transition 3
Transition 4
at Universiteit van Amsterdam SAGE on June 25, 2010 http://asj.sagepub.comDownloaded from

level.11 Model 1 is a baseline model containing only main effects. Nonetheless, there are anumber of noteworthy observations. Parents’ education and social class have the expectedeffect: children of more advantaged backgrounds have a higher probability of making a tran-sition than other children. Also as expected, women have a lower chance of making aneducational transition than men, and people from the southern states are disadvantaged inde-pendently of the composition of parental characteristics. Perhaps less intuitive, educationalexpansion (per cent at risk) has no effect on the probability of making a transition when theeducational and occupational characteristics of parents are taken into account.12
More directly related to the main focus of this article, the intergenerational credential inflationhas a positive effect on transition probabilities, implying that if education is worth less than forthe parents’ generation, people are less likely to acquire it. This finding contradicts the notionderived from the theory of relative risk aversion (Breen and Goldthorpe, 1997; Goldthorpe,
Van de Werfhorst and Andersen: Credential Inflation and Educational Inequality
331
Table 3 Impact of social background and credential inflation on conditional transition probabilities (pooledtransitions, logit models)
1 2 3
Model b se b se b se
Constant 1.327*** 0.235 1.387*** 0.296 1.400*** 0.297Transition 1 (reference) – – – – – –Transition 2 (T2) –3.092*** 0.048 –3.323*** 0.224 –3.521*** 0.235Transition 3 (T3) –2.923*** 0.121 –1.942*** 0.456 –1.807*** 0.495Transition 4 (T4) –4.075*** 0.108 –1.876*** 0.351 –2.450*** 0.394Female –0.313*** 0.024 –0.303*** 0.024 –0.303*** 0.024Percentage at risk 0.003 0.002 0.004 0.003 0.003 0.003Non-white 0.034 0.036 0.033 0.036 0.033 0.036South –0.233*** 0.027 –0.219*** 0.027 –0.219*** 0.027Parents’ education
Primary (reference) – – – – – –Completed high school 0.744*** 0.036 0.463*** 0.038 0.450*** 0.038Some post-secondary 1.219*** 0.047 0.381*** 0.057 0.364*** 0.057Completed college (4 years) 1.516*** 0.048 0.639*** 0.066 0.614*** 0.066Postgraduate level 2.015*** 0.058 1.364*** 0.092 1.336*** 0.093
Father’s classUnskilled manual (reference) – – – – – –Skilled, routine non-manual 0.461*** 0.031 0.436*** 0.031 0.436*** 0.031Lower managers and professionals 0.688*** 0.055 0.674*** 0.056 0.675*** 0.056Higher managers and professionals 0.812*** 0.037 0.789*** 0.037 0.789*** 0.037
Intergenerational Inflation Factor IIF 0.655*** 0.098 0.158 0.141 0.145 0.141IIF � T2 0.744*** 0.218 0.991*** 0.234IIF � T3 –0.216 0.429 –0.345 0.481IIF � T4 –1.366*** 0.385 –0.667 0.440IIF � Parents made transition 1.368*** 0.083 1.443*** 0.087Parents made transition � T2 –0.017 0.090 0.987** 0.362Parents made transition � T3 –0.922*** 0.100 –1.502 0.768Parents made transition � T4 –1.553*** 0.124 0.621 0.697IIF � Parents made transition � T2 –1.179** 0.405IIF � Parents made transition � T3 0.598 0.873IIF � Parents made transition � T4 –2.548** 0.792
–2LL 43386.28 42603.15 42584.03d.f. 16 23 26Nagelkerke’s pseudo-R2 0.397 0.413 0.414
* p < 0.05 , ** p < 0.01, *** p < 0.001 (two-tailed).Source: General Social Surveys 1972–2000, n = 47,774 (individuals � transitions faced).
at Universiteit van Amsterdam SAGE on June 25, 2010 http://asj.sagepub.comDownloaded from

1996a, 2000; Breen, 2001) that education is a relative good necessary for the avoidance ofdownward mobility. From this model it seems that the ‘job queue’ is not the main mechanismexplaining investments in education. As we shall see later, however, including interactionsbetween IIF, parents’ education and the individual transitions gives a different picture.
Model 2 includes three 2-way interactions.13 First, interactions between IIF and transitionnumber are included to test the impact of IIF across transitions. Second, an interaction betweenIIF and whether a parent made the same transition is included to test the information differ-ential hypothesis that the labour market value of a particular level of education is moreimportant to respondents if their parents completed this education. Third, interactionsbetween transitions and whether parents made a transition are included.
We find some interesting results with respect to the differential impact of IIF across transi-tions. There is now a positive impact of the relative value of education only for the secondtransition. Thus, only for entering tertiary education do we find that if education is worth lessthan it was in the previous generation is it less attractive to invest in. Nonetheless, confirm-ing our earlier speculations, this finding does not hold for the postgraduate transition wherewe find no significant effect of the IIF. More importantly, the relative value of education hasa negative impact on the probability of making the transition to postgraduate education. RecallFigure 1, where we saw that the improvement in social class position from continuing past acollege degree to a postgraduate education is generally limited. It seems sensible to suggest,then, that people are most likely to undertake postgraduate studies if it decreases their chancesof downward mobility. If, however, such a high-risk trajectory is unnecessary to avoiddownward mobility, people will finish their formal education beforehand. In other words, wehave found some support for the theory of relative risk aversion with respect to the final tran-sition to postgraduate education.
As expected from the information differential thesis, there is a strong positive interactionbetween the intergenerational value of education and whether parents made specific transi-tions. Respondents seem more likely to consider the value of an education when deciding toacquire it if their parents acquired the same level of education. This finding is especially inter-esting considering that we control for social class, meaning that this relationship is more likelyrelated to an information differential due to parental experience with the education systemthan to other class-related resources (e.g. financial resources).
The findings regarding the interaction terms are also in agreement with previous researchin the United States, showing that the impact of parental declines from one transition to thenext (see, for example, Mare, 1980; Hout et al., 1993). There are generally two explanations forthis: (1) As students grow older they are less influenced by their parents (the so-called ‘lifecourse’ hypothesis); and (2) unmeasured characteristics (such as ability) that can affect tran-sition probabilities may be unevenly distributed among parents of high and low educationallevels (Mare, 1993).
Model 3 includes a three-way interaction between IIF, transition number and whetherparents made a transition, allowing us to test for differences in information differentials acrosstransitions. Because of their complexity, these results are best shown graphically. Figure 3displays the fitted probabilities for students whose parents made the transition and studentswhose parents did not make the transition, according to the IIF for all four transitions.14 Wecan clearly see that children are far more likely to make each transition if their parents hadmade it compared to if their parents had not made it. It is also clear that for the first threetransitions the value of education has a positive effect on the probability of completing thattransition for both groups, regardless of whether parents made the transition.
The most interesting findings from Model 3 relate to the changes in the information differ-ential across transitions. We can see from Figure 3 that there is no discernible informationdifferential at transitions one and two (i.e. the slopes of the two lines are virtually parallel),
Acta Sociologica 48(4)
332 at Universiteit van Amsterdam SAGE on June 25, 2010 http://asj.sagepub.comDownloaded from

Van de Werfhorst and Andersen: Credential Inflation and Educational Inequality
333
Figure 3 Fitted probabilities of completing educational transitions according to the value of education (measuredby IIF). (Note: Probabilities are for the average person and are conditional on making the previoustransition. The solid lines are for those whose parents made the transition; the broken lines represent therelationship for people whose parents did not make the transition. Note that the vertical scales of thegraphs (probabilities) differ.)
Transition 1:High School
Transition 2:Some post-secondary
Transition 3:College degree
Transition 4:Postgraduate
.40
.60
.80
1.00
.50 .75 1.00 1.25 1.50
.000
.005
.010
.015
.020
.025
.50 .75 1.00 1.25 1.50
Intergenerational Inflation Factor
at Universiteit van Amsterdam SAGE on June 25, 2010 http://asj.sagepub.comDownloaded from

but the pattern changes dramatically for the third and fourth transitions. Perhaps mostimportant, by the third transition (i.e. college degree) the value of education has a muchstronger effect for those children whose parents acquired the same level of education than forthose whose parents had less education. This supports our speculation that children get bestparental advice on the value of schooling – or at least pay most attention to it – at the tran-sition to a college degree. The fact that very few make this transition produces a larger gap ininformation than for the previous transitions. As a result, parents who have acquired collegedegrees can provide their children with better information on their value, influencing thedecision to continue schooling or not.
Another noteworthy finding is that this relationship changes for the fourth transition (i.e.postgraduate qualifications). At this point, the value of education apparently has no impacton children of parents who did not make that transition. On the other hand, there is a strongnegative effect of the value of education on the probability of making the transition for thosechildren whose parents made the transition. The greater the value of postgraduate qualifica-tions, the less likely those with parents who have this qualification are of making it. This ishighly suggestive that children of parents who obtained a graduate degree are more likely toconsider the relative pay-off for a graduate degree compared to a bachelor’s degree when thevalue of education has increased. What is most remarkable in this figure, however, is thatchildren whose parents did not make a particular transition seem to be virtually unaware of– or at least unaffected by – the value of that education for all but the secondary school level.
Discussion and conclusion
Our analysis consisted of two parts. We began by assessing credential inflation in the UnitedStates, finding that most levels of education have generally lost value in terms of social classoutcomes during the twentieth century. There has also been a widening gap in social classreturns between educational levels from the 1940s onwards: despite a decrease in values forall qualification levels, the relative advantage of higher educational levels has increased,particularly since the 1940s. These findings are consistent with labour queue theory, whichstates that an increase in over-schooling leads to relative advantages of the better educated(e.g. Thurow, 1976; Hirsch, 1977; Wolbers et al. 2001).
We then constructed a measure – we call it the ‘intergenerational inflation factor’ (IIF) – tocompare the labour market value of specific educational transitions for each generationcompared to the parents’ generation. We included this measure in models predictingeducational transitions to test the mechanism of ‘relative risk aversion’, which holds thatchildren invest in education to avoid downward class mobility (Breen and Goldthorpe, 1997;Goldthorpe, 2000). According to this theory, if a level of education declines in value comparedto the parents’ generation, children should be more likely to invest in this level of educationto maintain their relative position in society. At the very least, our results contradict this theoryfor the second and third transitions (i.e. into tertiary education and completion of university),where we found that children were more likely to invest in education if it increased in value.For the first transition (high school completion) we found no evidence of any effect of thevalue of schooling. Only for the last transition (postgraduate degree) did we find support forthe theory of relative risk aversion.
We further showed that the value of education is particularly influential on children’spropensity to stay in school at a specific branching point if their parents made the same tran-sition. This finding can be explained by an information differential, between parents whocompleted a transition and those who did not, regarding the value of education (cf. Eriksonand Jonsson, 1996). It implies that information about the labour market influences thecost–benefit calculation concerning educational decisions. We found most support for this
Acta Sociologica 48(4)
334 at Universiteit van Amsterdam SAGE on June 25, 2010 http://asj.sagepub.comDownloaded from

information differential hypothesis for the transition to a college degree. We have two expla-nations for this: (1) most people end schooling at this transition, so the information differen-tial can make a difference, and (2) parental information about college education is strongly infavour of staying in education rather than leaving because its value is very high. We alsoshowed, however, that the effect was in the opposite direction for the postgraduate studiestransition.
Why, then, are there differential effects of the value of education across transitions? Weprovide a simple explanation. For the first three transitions, additional schooling is generallyregarded as beneficial to one’s career prospects. It follows from human capital theory that, ifeducation is worth less, people are less likely to invest in it (Freeman, 1976; Mare, 1981b;Becker, 1993). Additionally, if education is worth less, it becomes less attractive as an invest-ment to avoid downward mobility. In such cases, other ways of transmitting inequality, suchas class-related personality characteristics and social skills (Goldthorpe, 1996b; Arrow et al.,2000; Breen and Goldthorpe, 2001) could take effect. Similarly, within education, the field ofstudy or the quality of educational institutions may play a role (Hirsch, 1977; Davies andGuppy, 1997; Van de Werfhorst, 2002).
Postgraduate education fits less well into this framework. The labour market benefits associ-ated with postgraduate training are somewhat obscure (Pascarella and Terenzini, 1991), andthe risks are relatively high. Parents who made this transition are aware of these risks andperhaps discourage their children from pursuing postgraduate education unless it is necessaryto avoid downward mobility. In other words, class position is more likely to be secured at theprevious transition when education has a higher value. Furthermore, there are only limitedopportunities of upward mobility for this group because of a ceiling effect. These two factorstogether suggest that the ‘primary goal’ of avoiding downward mobility largely explainsinvestments in postgraduate training.
Of course, this finding should not go without qualifications. Firstly, because of the ceilingeffect we might expect the IIF to have different impacts on the probability of entering post-graduate education depending on the type of postgraduate education. For many occupations,for example physicians and lawyers, the level of education required to achieve them hasremained fairly constant. As a result, children of people with such high-level occupationsmight be likely to pursue the necessary qualifications to achieve these jobs regardless ofwhether the class returns have decreased. Although outside the bounds of this article, thisspeculation is interesting enough to deserve further research.
Secondly, this article provides only an indirect test of the impact of information differentialsresulting from parental education background with respect to the value of education. A directtest of relative risk aversion would include direct measures of how much parents know aboutthe value of education and whether they pass this information on to their children. Unfortu-nately, there are no suitable over time data that contain this information, which means that itcould not be included in models containing information about the changing value ofeducation. Nonetheless, although we do not have a direct test of the underlying mechanism,we are confident that we have tapped the consequences of these mechanisms.
The implications of these findings are quite clear. Our model shows that information differ-entials play an important role in explaining educational stratification, particularly at the higherlevels of education. If the value of education varies across time, as it does in most Westernsocieties, parents who made a transition to college or higher are advantaged in terms ofproviding accurate judgements of the value of that education and can advise their childrenaccordingly. This information differential between social groups serves to establish andmaintain social inequality. One way to reduce educational stratification would be to increasepublic knowledge of the benefits of higher education. If all children had the same quality ofinformation at their disposal, this could plausibly reduce educational inequality. The likelihood
Van de Werfhorst and Andersen: Credential Inflation and Educational Inequality
335 at Universiteit van Amsterdam SAGE on June 25, 2010 http://asj.sagepub.comDownloaded from

of investing in schooling would still depend on the value of education, but to a degree morelike that for children whose parents made a transition than for those whose parents did not.
A second related implication of the findings concerns the wider issue of meritocracy (Arrowet al., 2000). Our findings on the information differentials between social groups suggest that,in as far as education is an indication of one’s merits, access to merit-enhancing attributes isunevenly distributed across groups of different information levels. Thus, although our resultsare not conclusive about this because our data did not contain a measure of ability, socialgroups seem to differ in their educational attainment not only because of ‘meritocratic’ factors,but also according to available information. It is widely known that social networks and class-related personality characteristics aid access to good jobs, and disproportionately benefitchildren of the higher social strata (e.g. Breen and Goldthorpe, 2001). In other words, providinginformation to the wider public may enhance investments in higher education for childrenwhose parents have lower education, but it is less clear how this would affect their finalposition in the social class structure. If employers do select largely on non-education basedcharacteristics, educational policy is unlikely to have the desired effect.
NotesThis research project was initiated when the authors were affiliated to Nuffield College and theDepartment of Sociology, University of Oxford. We thank John Goldthorpe, Richard Breen, Maarten Buisand John Fox for comments on an earlier version, as well as the Editor and two anonymous reviewersof Acta Sociologica. Mike Hout is thanked for providing us with the STATA code to translate United Statesoccupational classifications into CASMIN class categories.
1. It could be argued that if education is worth more than for the parents’ generation, children will notstop at the point where they have avoided downward mobility, but rather strive for the ‘second goal’of upward mobility (Goldthorpe, 2000). In the more frequently observed case of a negative trend in theeffects of education, however, more education is needed (ceteris paribus) to avoid downward mobility.
2. We do not claim that children directly assess the relative value of education at the time they areconsidering acquiring with the value of that same education during the time when their parents’generation acquired it. Still, even if we assume that people evaluate only the educational value oftheir own cohort for reaching a certain occupational level (or, to be more precise, of those who leftschool immediately before them), according to the mechanisms of relative risk aversion we wouldstill expect children to reach for higher levels of education if its value has decreased compared totheir parents’ generation.
3. A similar argument has been put forward by Garnier et al. (1989), who claim that the cost–benefitevaluation is more important for students entering selective schooling systems than mass schoolingsystems. Analogously, postgraduate courses are more highly selective than lower levels of schooling.
4. This finding is indirectly derived from Clogg and Shockey (1984) and Hartog (2000) from the factthat over-education increased and, on average, overschooled years had lower wage returns thanrequired years of schooling.
5. This omission is acceptable in studying trends in educational inequality, since education is of limitedimportance in the ‘mobility strategy’ for children of farmers and of self-employed people (Ishida etal., 1995; Goldthorpe, 2000).
6. Another advantage of including ‘per cent at risk’ is that it is a time-varying covariate and thus variesacross transitions. Cameron and Heckman (1998) argue that the standard educational transitionmodel – which allows only for the error terms to vary across transitions – produces biased differen-tial effects across transitions for time-invariant variables. In other words, the model unrealisticallyassumes that people make decisions sequentially only as they move from one transition to the next,i.e. they do not look further ahead than the transition to be taken. Lucas (2001) argues, however, thatincluding a time-covariate in the transition model limits this bias.
7. A more detailed critique of previous measures of over-education can be seen in Halaby (1994).8. More details about cumulative logit models are given in Agresti (1990).
Acta Sociologica 48(4)
336 at Universiteit van Amsterdam SAGE on June 25, 2010 http://asj.sagepub.comDownloaded from

9. Using the pooled data and modelling the changing value of education over cohorts with interactionterms is equivalent to constraining the cut-points separating the underlying latent social classcategories to be equal across cohorts. In other words, this model gives a consistent metric for classreturns over time, thus ensuring that the education effects are comparable.
10. Although not reported here, we also analysed transitions separately, finding substantively similarresults. The results from these models are available from the authors upon request.
11. Separate analyses for men and women showed almost no differences in the effects of our centralvariables. The only noteworthy difference was that the IIF had a stronger effect on transition 2 formen than for women. The overwhelming similarities in results suggested presentation of the moreparsimonious pooled data results. Results from the separate analyses for men and women areavailable from the authors upon request.
12. A model excluding parental characteristics showed a positive impact of ‘per cent at risk’ on transitionprobabilities. Thus, the increasing likelihood of making a transition is largely due to changing distri-butions in social origins (cf. Mare, 1979).
13. Including the three two-way interactions separately confirms the results shown here.14. The fitted probabilities were calculated with all other variables (i.e. those not included in the three-
way interaction) set to their means, which means that they apply to the ‘typical’ person. See Fox(1987) for more information on how to construct these graphs, also referred to as effect displays.
ReferencesAgresti, A. (1990) Categorical Data Analysis. New York: Wiley.Arrow, K. J., Bowles, S. and Durlauf, S. N. (eds) (2000) Meritocracy and Economic Inequality. Princeton, NJ:
Princeton University Press.Becker, G. S. (1981) A Treatise on the Family. Cambridge, MA: Harvard University Press.Becker, G. S. (1993) Human Capital: A Theoretical and Empirical Analysis, With Special Reference to Education.
Chicago, IL: Chicago University Press.Blossfeld, H.-P. and Huinink, J. (1991) ‘Human Capital Investments or Norms of Role Transition? How
Women’s Schooling and Career Affects the Process of Family Formation’, American Journal of Sociology97: 143–68.
Blossfeld, H.-P. and Shavit, Y. (1993) ‘Persisting Barriers. Changes in Educational Opportunities inThirteen Countries’, in Y. Shavit and H.-P. Blossfeld (eds) Persistent Inequality. A Comparative Study ofEducational Attainment in Thirteen Countries, pp. 1–23. Boulder, CO: Westview Press.
Boudon, R. (1974) Education, Opportunity, and Social Inequality. New York: Wiley.Bourdieu, P. and Passeron, J. C. (1990) [1977] Reproduction in Education, Society, and Culture. London and
Newbury Park, CA: Sage in association with Theory Culture & Society Department of Administrativeand Social Studies Teesside Polytechnic.
Boylan, R. D. (1993) ‘The Effect of the Number of Diplomas on Their Value’, Sociology of Education 66:206–21.
Breen, R. (1999) ‘Beliefs, Rational Choice and Bayesian Learning’, Rationality & Society 11: 463–79.Breen, R. (2001) ‘A Rational Choice Model of Educational Inequality’, Juan March Institute Working
Paper 2001/166.Breen, R. and Goldthorpe, J. H. (1997) ‘Explaining Educational Differentials: Towards a Formal Rational
Action Theory’, Rationality & Society 9: 275–305.Breen, R. and Goldthorpe, J. H. (2001) ‘Class, Mobility and Merit: The Experience of Two British Birth
Cohorts’, European Sociological Review 17: 81–101.Brown, D. K. (1995) Degrees of Control. A Sociology of Educational Expansion and Occupational Credentialism.
New York: Teachers College Press.Burris, V. (1983) ‘The Social and Political Consequences of Overeducation’, American Sociological Review
48: 454–67.Cameron, S. V. and Heckman, J. J. (1998) ‘Life Cycle Schooling and Dynamic Selection Bias: Models and
Evidence for Five Cohorts of American Males’, Journal of Political Economy 106: 262–333.Clogg, C. C. and Shockey, J. W. (1984) ‘Mismatch Between Occupation and Schooling: A Prevalence
Measure, Recent Trends and Demographic Analysis’, Demography 21: 235–57.
Van de Werfhorst and Andersen: Credential Inflation and Educational Inequality
337 at Universiteit van Amsterdam SAGE on June 25, 2010 http://asj.sagepub.comDownloaded from
Collins, R. (1979) The Credential Society: An Historical Sociology of Education and Stratification. New York:Academic Press.
Davies, R., Heinesen, E. and Holm, A. (2002) ‘The Relative Risk Aversion Hypothesis of EducationalChoice’, Journal of Population Economics 15: 683–713.
Davies, S. and Guppy, N. (1997) ‘Fields of Study, College Selectivity, and Student Inequalities in HigherEducation’, Social Forces 75: 1417–38.
Dresch, S. P. (1975) ‘Demography, Technology, and Higher Education: Towards a Formal Model ofEducational Adaptation’, Journal of Political Economy 83: 353–69.
Eckhaus, R. S. (1964) ‘Economic Criteria for Education and Training’, Review of Economics and Statistics46: 181–90.
Erikson, R. and Goldthorpe, J. H. (1992) The Constant Flux: A Study of Class Mobility in Industrial Societies.Oxford: Clarendon Press.
Erikson, R. and Jonsson, J. O. (1996) ‘Explaining Class Inequality in Education: The Swedish Test Case’,in R. Erikson and J. O. Jonsson (eds) Can Education be Equalized? The Swedish Case in ComparativePerspective, pp. 1–63. Boulder, CO: Westview Press
Fox, J. (1987) ‘Effect Displays for Generalized Linear Models’, in C. Clogg (ed.) Sociological Methodology1987, pp. 347–61. Washington: American Sociological Association.
Freeman, R. B. (1976) The Overeducated American. New York: Academic Press.Gambetta, D. (1987) Were They Pushed or Did They Jump? Individual Decision Mechanisms in Education.
Cambridge: Cambridge University Press.Ganzeboom, H. B. G., Luijkx, R. and Treiman, D. J. (1989) ‘Intergenerational Class Mobility in Compara-
tive Perspective’, Research in Social Stratification and Mobility 9: 3–79.Garnier, M., Hage, J. and Fuller, B. (1989) ‘The Strong State, Social Class, and Controlled School
Expansion in France, 1881–1975’, American Journal of Sociology 95: 279–306.Goldthorpe, J. H. (1996a) ‘Class Analysis and the Reorientation of Class Theory: the Case of Persisting
Differentials in Educational Attainment’, British Journal of Sociology 47: 481–505.Goldthorpe, J. H. (1996b) ‘Problems of “Meritocracy” ‘, in R. Erikson and J. O. Jonsson (eds) Can Education
Be Equalized? The Swedish Case in Comparative Perspective, pp. 255–87. Boulder, CO: Westview Press.Goldthorpe, J. H. (2000) On Sociology: Numbers, Narratives, and the Integration of Research and Theory.
Oxford: Oxford University Press.Groot, W. and Maassen van den Brink, H. (2000) ‘Overeducation in the Labor Market: A Meta-Analysis’,
Economics of Education Review 19: 149–58.Halaby, C. N. (1994) ‘Overeducation and Skill Mismatch’, Sociology of Education 67 (January): 47–59.Halsey, A. H., Heath, A. F. and Ridge, J. M. (1980) Origins and Destinations: Family, Class, and Education
in Modern Britain. Oxford: Clarendon Press.Hartog, J. (2000) ‘Over-education and Earnings: Where Are We, Where Should We Go?’ Economics of
Education Review 19: 131–47.Hauser, R. M. and Featherman, D. L. (1976) ‘Equality of Schooling: Trends and Prospects’, Sociology of
Education 49: 99–120.Hirsch, F. (1977) Social Limits to Growth. London: Routledge & Kegan Paul.Hout, M., Raftery, A. E. and Bell, E. O. (1993) ‘Making the Grade: Educational Stratification in the United
States, 1925–1989’, in Y. Shavit and H.-P. Blossfeld (eds) Persistent Inequality. Changing EducationalAttainment in Thirteen Countries, pp. 25–49. Boulder, CO: Westview Press.
Ishida, H., Müller, W. and Ridge, J. M. (1995) ‘Class Origin, Class Destination, and Education: A Cross-National Study of Ten Industrial Nations’, American Journal of Sociology 101: 145–93.
Jencks, C., Smith, M., Acland, H., Bane, M. J., Cohen, D., Gintis, H., Heyns, B. and Michelson, S. (1972)Inequality. A Reassessment of the Effect of Family and Schooling in America. New York: Basic Books.
Keller, S. and Zavalloni, M. (1964) ‘Ambition and Social Class: A Respecification’, Social Forces 43: 58–70.Lucas, S. R. (2001) ‘Effectively Maintained Inequality: Education Transitions, Track Mobility, and Social
Background Effects’, American Journal of Sociology 106: 1642–90.Manski, C. F. (1993) ‘Adolescent Econometricians: How do Youth Infer the Returns to Schooling?’ in
C. T. Clotfelter and M. Rothschild (eds) Studies of Supply and Demand in Higher Education. A NationalBureau of Economic Research Project Report, pp. 43–57. Chicago, IL: Chicago University Press.
Manski, C. F. and Wise, D. (1983) College Choice in America. Cambridge, MA: Harvard University Press.
Acta Sociologica 48(4)
338 at Universiteit van Amsterdam SAGE on June 25, 2010 http://asj.sagepub.comDownloaded from

Mare, R. D. (1979) ‘Social Background Composition and Educational Growth’, Demography 16: 55–71.Mare, R. D. (1980) ‘Social Background and School Continuation Decisions’, Journal of the American Statisti-
cal Association 75: 295–305.Mare, R. D. (1981a) ‘Change and Stability in Educational Stratification’, American Sociological Review 46:
72–87.Mare, R. D. (1981b) ‘Market and Institutional Sources of Educational Growth’, Research in Social Stratifi-
cation and Mobility 1: 205–45.Mare, R. D. (1993) ‘Educational Stratification on Observed and Unobserved Components of Family
Background’, in Y. Shavit and H.-P. Blossfeld (eds) Persistent Inequality. Changing EducationalAttainment in Thirteen Countries, pp. 351–76. Boulder, CO: Westview Press.
Marini, M. M. (1984) ‘Women’s Educational Attainment and the Timing of Entry into Parenthood’,American Sociological Review 49: 491–511.
McCall, L. (2000) ‘Gender and the New Inequality: Explaining the College/Non-College Wage Gap’,American Sociological Review 65: 234–55.
Need, A. and De Jong, U. (2000) ‘Educational Differentials in the Netherlands: Testing Rational ActionTheory’, Rationality & Society 13: 71–98.
Pascarella, E. T. and Terenzini, P. T. (1991) How College Affects Students. Findings and Insights from TwentyYears of Research. San Francisco, CA: Jossey-Bass.
Rijken, S. (1999) Educational Expansion and Status Attainment. A Cross-national and Over-time Comparison.Utrecht: ICS Dissertation.
Scoville, J. G. (1966) ‘Education and Training Requirements for Occupations’, Review of Economics andStatistics 48: 387–94.
Sewell, W. H., Hauser, R. M. and Featherman, D. L. (eds) (1976) Schooling and Achievement in AmericanSociety. New York: Academic Press.
Shavit, Y. and Blossfeld, H.-P. (eds) (1993) Persistent Inequality. Changing Educational Attainment in ThirteenCountries. Boulder, CO: Westview Press.
Sieben, I. (2001) Sibling Similarities and Social Stratification. The Impact of Family Background across Countriesand Cohorts. Nijmegen, The Netherlands: ICS Dissertation.
Smith, H. L. (1986) ‘Overeducation and Underemployment: An Agnostic View’, Sociology of Education 59:85–99.
Spence, M. (1973) ‘Job Market Signaling’, Quarterly Journal of Economics 87: 355–74.Teachman, J. D. (1987) ‘Family Background, Educational Resources, and Educational Attainment’,
American Sociological Review 52: 548–57.Thurow, L. (1976) Generating Inequality. New York: Basic Books.Van de Werfhorst, H. G. (2002) ‘A Detailed Examination of the Role of Education in Intergenerational
Social Class Mobility’, Social Science Information 41: 407–38.Van der Ploeg, S. (1994) ‘Educational Expansion and Returns on Credentials’, European Sociological Review
10: 63–78.Wolbers, M. H. J., De Graaf, P. M. and Ultee, W. C. (2001) ‘Trends in the Occupational Returns to
Educational Credentials in the Dutch Labor Market: Changes in Structures and in the Association?’Acta Sociologica 44: 5–19.
Biographical Note: Herman Van de Werfhorst is Assistant Professor in the Department of Sociology andAnthropology of the University of Amsterdam, The Netherlands, and is also affiliated to theAmsterdam School for Social Science Research (ASSR) and the Amsterdam Institute for AdvancedLabour Studies (AIAS) of that university. Currently, he is involved, together with Robert Erikson fromStockholm University, in the coordination of an EU-funded Network of Excellence called ‘EconomicChange, Quality of Life and Social Cohesion (EQUALSOC)’.Address: Department of Sociology and Anthropology, University of Amsterdam, Oudezijds Achter-burgwal 185, 1012 DK Amsterdam, The Netherlands. [email: [email protected]]
Van de Werfhorst and Andersen: Credential Inflation and Educational Inequality
339 at Universiteit van Amsterdam SAGE on June 25, 2010 http://asj.sagepub.comDownloaded from

Biographical Note: Robert Andersen is Senator William McMaster Chair in Political Sociology in theSociology Department at McMaster University, Canada and Associate Member of Nuffield College,University of Oxford. He is also a member of the regular teaching staff at the ICPSR Summer Programin Quantitative Methods, University of Michigan. His research interests are in political sociology, socialinequality, survey methods and social statistics.Address: Department of Sociology, 1280 Main Street West, Hamilton, Ontario, Canada L8S 4M4.
Acta Sociologica 48(4)
340 at Universiteit van Amsterdam SAGE on June 25, 2010 http://asj.sagepub.comDownloaded from


![Acta Sociologica 1959 Aubert 1 16[1]](https://img.dokumen.tips/doc/110x75/5529b1f54a79599a158b47e6/acta-sociologica-1959-aubert-1-161.jpg)