Embed Size (px)
Citation preview

Acoustophoretic Synchronization of MammalianCells in Microchannels
Patrick Thevoz,†,‡ Jonathan D. Adams,§ Herbert Shea,‡ Henrik Bruus,| and H. Tom Soh*,†,⊥
Department of Mechanical Engineering, University of California, Santa Barbara, California 93106, Microsystems for SpaceTechnologies Laboratory, Ecole Polytechnique Federale de Lausanne (EPFL), CH-2002 Neuchatel, Switzerland,Department of Physics, University of California, Santa Barbara, California 93106, Department of Micro- andNanotechnology, Technical University of Denmark, DTU Nanotech Building 345 East, DK-2800 Kongens Lyngby, Denmark,and Materials Department, University of California, Santa Barbara, California 93106
We report the first use of ultrasonic standing waves toachieve cell cycle phase synchronization in mammaliancells in a high-throughput and reagent-free manner. Theacoustophoretic cell synchronization (ACS) device utilizesvolume-dependent acoustic radiation force within a mi-crochannel to selectively purify target cells of desiredphase from an asynchronous mixture based on cell cycle-dependent fluctuations in size. We show that ultrasonicseparation allows for gentle, scalable, and label-freesynchronization with high G1 phase synchrony (∼84%)and throughput (3 × 10⁶ cells/h per microchannel).
The capability to synchronize a population of asynchronouscells into a particular phase in their cell cycle is of paramountimportance in biomedical research. For example, synchronization-based studies of cancer cells have enabled the discovery of cellularproliferation factors1 and cell-cycle regulation factors.2,3 For cancertherapeutics development, achieving effective synchrony of tumorcell samples is critical to understanding their response to che-motherapeutics, because many anticancer drugs target cells in aparticular phase.4,5 The cell cycle generally consists of fourphasessG1 (gap 1), S (synthesis), G2 (gap 2), and M(mitosis)sand it is well-known that for almost all cell types,their size is highly correlated to their phase.6,7 Currently, themost prevalent method for cell synchronization is the chemicalarrest and release technique,8-10 wherein cells are treated withmetabolic agents that block the cell cycle at a particular point,
driving phase-specific accumulation, after which a second reagentis used to release the cells and thereby achieve synchrony.Though effective, this method suffers from a critical drawback inthat it affects the physiology of the cells in ways that couldundermine their usefulness as accurate models of normal cellularevents.11,12 Centrifugal elutriation9,13 offers a less invasive ap-proach,14 but it requires time-consuming sample preparation,suffers from low throughput, and imposes mechanical stress onthe cells.15
Microfluidics technology offers a promising alternative toconventional methods of cell synchronization because it allowsaccurate control of fluidic and separation forces in a reproduciblemanner.16 Recent efforts have explored a number of differentseparation forces in microchannels for cell synchronization,including dielectrophoresis17 and hydrophoresis,18 but the lowthroughput of both approaches (<400 µL/h, ∼2.5 × 10⁵ cells/h per microchannel) have limited their utility. In an effort todevelop a noninvasive, high purity method that can also operateat a higher throughput, we report here the first use of ultrasonicstanding waves for cell synchronization. The acoustophoreticcell synchronization (ACS) device uses a volume-dependentacoustic radiation force to isolate and purify mammalian cellsbased on cell-cycle phase into independent outlets at both highG1 phase synchrony (∼84%) and high throughput (3 × 10⁶
cells/h per microchannel).
MATERIALS AND METHODSDevice Fabrication. Standard microfabrication techniques
were used to fabricate the ACS device. Briefly, a 500-µm-thick,100-mm-diameter silicon wafer was coated with a 1.4-µm-thicklayer of AZ5214E-IR negative photoresist (Clariant, Somerville,NJ). Standard photolithography was utilized to pattern the micro-channels. The channels were etched to a depth of 50 µm usingthe Bosch deep reactive-ion etching process (770 SLR, Plas-
* To whom correspondence should be addressed. E-mail: [email protected].
† Department of Mechanical Engineering, University of California.‡ Ecole Polytechnique Federale de Lausanne (EPFL).§ Department of Physics, University of California.| Technical University of Denmark.⊥ Materials Department, University of California.
(1) Nagel, W. W.; Vallee, B. L Proc. Natl. Acad. Sci. U.S.A. 1995, 92, 579–583.
(2) Hartwell, L. H.; Kastan, M. B. Science 1994, 266, 1821–1828.(3) Hunter, T.; Pines, J. Cell 1994, 79, 573–582.(4) Jolivet, J.; Cowan, K. H.; Curt, G. A.; Clendeninn, N. J.; Chabner, B. A
N. Engl. J. Med 1983, 309, 1094–1104.(5) Schiff, P. B.; Fant, J.; Horwitz, S. B. Nature 1979, 277, 665–667.(6) Jorgensen, P.; Tyers, M. Curr. Biol. 2004, 14, R1014–R1027.(7) Ramirez, O. T.; Mutharasan, R. Biotechnol. Bioeng. 1990, 36, 839–848.(8) Jackman, J.; O’Connor, P. M. Curr. Prot. Cell Biol. 1998, 8.3.18.3.20.(9) Davis, P. K.; Ho, A.; Dowdy, S. F. Biotechniques 2001, 30, 1322–1324.
(10) Kumagai-Sano, F.; Hayashi, T.; Sano, T.; Hasezawa, S. Nat. Protoc. 2006,1, 2621–2627.
(11) Ji, C.; Marnett, L. J.; Pietenpol, J. A. Oncogene 1997, 15, 2749–2753.(12) Cooper, S. Cell. Mol. Life Sci. 2003, 60, 1099–1106.(13) Banfalvi, G. Nat. Protoc. 2008, 3, 663–673.(14) Zickert, P.; Wejde, J.; Skog, S.; Zetterberg, A.; Larsson, O. Exp. Cell Res.
1993, 207, 115–121.(15) Hohmann, L. K.; Shows, T. B. Somatic Cell Genet. 1979, 5, 1013–1029.(16) Adams, J. D.; Kim, U.; Soh, H. T Proc. Natl. Acad. Sci. U.S.A. 2008, 105,
18165–18170.(17) Kim, U.; Shu, C. W.; Dane, K. Y.; Daugherty, P. S.; Wang, J. Y. J.; Soh,
H. T. Proc. Natl. Acad. Sci. U.S.A. 2007, 104, 20708–20712.(18) Choi, S.; Song, S.; Choi, C.; Park, J. K. Anal. Chem. 2009, 81, 1964–1968.
Anal. Chem. 2010, 82, 3094–3098
10.1021/ac100357u 2010 American Chemical Society3094 Analytical Chemistry, Vol. 82, No. 7, April 1, 2010Published on Web 03/03/2010

matherm, St. Petersburg, FL) using photoresist as a mask. Afterstripping the photoresist, inlet and outlet access holes were drilledusing a CNC drill (Flashcut CNC, Deerfield, IL) equipped with a1.1-mm-diameter diamond bit (Triple Ripple, Abrasive Technology,Lewis Center, OH). The wafers were subsequently diced using asemiautomatic dicing saw (Disco, Tokyo, Japan). A borofloat glasslid was then anodically bonded onto the silicon chip by applyinga 1000 V bias at 375 °C for 5 min (SB6, Suss Microtec AG,Garching, Germany). Finally, inlet and outlet tubing were gluedto the device with 5 min epoxy (Devcon, Danvers, MA), and thepiezoactuator (26051, Ferroperm Piezoceramics, Kvistgaard, Den-mark) was attached to the silicon side of the device with superglue(Ross Super Glue Gel, Elmer’s Products, Inc., Columbus, OH).
Numerical Simulation. At sufficiently low concentrations, thehydrodynamic interaction between cells or particles does notsignificantly impact their motion in microfluidic systems.19 Wetherefore used a simplified single-particle acoustophoretic modelto simulate the particle motion in the ACS device. More specifi-cally, in the direction transverse to the flow (i.e., y-direction), theacoustic radiation force Fac(y) is balanced by the viscous Stokesdrag Fdrag ) 6πηa dy/dt for a spherical particle of radius a,where η is the viscosity of the medium. If we furthermore makethe approximation that the flow velocity along the channel isconstant and equal to its mean value, the resulting differentialequation Fac(y) ) 6πηa dy/dt can be integrated to yield anexpression for the transverse position y(t) of a particle in theultrasound field as a function of time t,20
y(t) ) 1ky
arctan{tan[kyy(0)]exp[Φη
(2kya)2⟨Eac⟩t]} (1)
Here y(0) is the starting position of the particle of radius a, ky )2π/λ is the wavenumber, and ⟨Eac⟩ is the time-averaged energydensity of the ultrasound wave of wavelength λ inside thechannel. Notably, the a2t factor in eq 1 governs the relationshipbetween particle volume and the necessary time to focus theparticle into a particular flow stream. This formula was used tomodel of the trajectories of particles of different sizes. We foundthat it was sufficient to plot the paths of the outermost andinnermost particle in each band at the inlets, because the pathsof all other particle paths fell in between these extremes.
Bead Separation. Red fluorescent 2-µm-diameter and greenfluorescent 5-µm-diameter polystyrene beads (R0200 and G0500,Duke Scientific, Fremont, CA) were suspended in ultrapure waterto form a mixture with a total concentration of 0.5 × 10⁹ beads/mL. For separation, a 2.044 MHz 30 Vpp sinusoidal signal wasapplied to the ultrasonic transducer. The bead mixture andbuffer flow, consisting of ultrapure water, were injected intothe ACS device at flow rates of 3 and 6 mL/h, respectively, viadual programmable syringe pumps (PhD 2000, Harvard Ap-paratus, Holliston, MA). Outlet fractions were collected inmicrocentrifuge tubes and subsequently analyzed via flowcytometry (FACSAria, BD Biosciences, San Jose, CA). Follow-ing bead separation, the device was rinsed thoroughly withultrapure water.
Cell Preparation and Separation. MDA-MB-231 cells werecultured at 37 °C and 5% CO2 in Dulbecco’s Modified Eagle’sMedium (DMEM) supplemented with 10% fetal bovine serum(FBS) and 1% penicillin-streptomycin. Cells were harvestedfrom the culture dish with 0.05% trypsin-EDTA before reaching70% confluency, to avoid abnormal cell sizes due to confine-ment. All cell culture media and reagents were purchased fromATCC (Manassas, VA).
Harvested cells were pelleted and resuspended at a concentra-tion of approximately 1.2 × 10⁶ cells/mL in a 1× phosphatebuffered saline (PBS) solution containing 2% bovine serumalbumin (BSA) (Fraction V, Sigma-Aldrich, St. Louis, MO) and1 mM EDTA (Sigma-Aldrich, St. Louis, MO) to avoid celladhesion and the formation of aggregates. The cell mixtureand buffer (also 1× PBS, 2% BSA, 1 mM EDTA) were injectedinto the device via at flow rates of 3 and 6 mL/h, respectively,and a sinusoidal signal at 2.044 MHz was applied to thepiezoactuator. To account for the different focusing rate of thecells versus the beads, the signal amplitude was set to 11.6Vpp. Because the actuation frequency determines the inducedpressure field, the shape of the acoustic field was not alteredcompared with the bead experiments. The device was moni-tored during operation using an inverted microscope (TE2000-S, Nikon Inc., Melville, NY) connected to a CCD camera(CoolSNAP HQ2, Photometrics, Tuscon, AZ). To help reducecell loss, sample inlet tubing was oriented vertically and leadingdirectly into the device. A small amount of cell adhesion tothe walls of the device was observed, chiefly at the fork betweenthe separation channel and the outlet channels. Outlet fractionswere collected in microcentrifuge tubes during separation.Following cell separation, the device was cleaned with asolution of 10% bleach, followed by thorough rinsing withultrapure water.
Propidium Iodide Staining and FACS Analysis. The cellcycle populations were determined by analyzing the cellular DNAcontent via propidium iodide DNA staining and flow cytometry.21
After synchronizing the cells in the ACS device, the collected cellfractions were pelleted and resuspended in 200 µL of 1× PBS,then fixed in 70% ethanol on ice for at least 2 h. Fixed cells werethen centrifuged at 650g for 8 min and resuspended in 200 µL ofstaining solution (1× PBS, 0.1% vol/vol Triton X-100, 200 µg/mLRNase A and 10 µg/mL propidium iodide, a DNA-intercalatingdye21). Cells were incubated for 30 min at room temperature andsubsequently analyzed with flow cytometry. Cell cycle populationswere obtained from the data using ModFit LT DNA cell-cycleanalysis software (Verity Software House, Topsham, ME).
RESULTS AND DISCUSSIONSAs described in seminal work by Laurell and co-workers,22-25
microfluidic acoustophoresis operates by generating an ultrasonicstanding wave (typically in the 0.1-10 MHz range) that imposes
(19) Mikkelsen, C.; Bruus, H. Lab Chip 2005, 5, 1293–1297.(20) Barnkob, R.; Augustsson, P.; Laurell, T.; Bruus, H. Lab Chip 2010, 10,
563–570.
(21) Darzynkiewicz, Z.; Juan, G.; Bedner, E. Curr. Prot. Cell Biol. 2001,8.4.18.4.18.
(22) Laurell, T.; Petersson, F.; Nilsson, A. Chem. Soc. Rev. 2007, 36, 492–506.(23) Nilsson, A.; Petersson, F.; Jonsson, H.; Laurell, T. Lab Chip 2004, 4, 131–
135.(24) Petersson, F.; Aberg, L.; Sward-Nilsson, A.-M.; Laurell, T. Anal. Chem.
2007, 79, 5117–5123.(25) Petersson, F.; Nilsson, A.; Holm, C.; Jonsson, H.; Laurell, T. Lab Chip 2005,
5, 20–22.
3095Analytical Chemistry, Vol. 82, No. 7, April 1, 2010

an acoustic radiation force on the cells such that they are attractedtoward the nodes or antinodes of the standing pressure wave.More specifically, the acoustic radiation force Fac in the transversey-direction can be approximated by
Fac ) -πp1
2V�0
2λφ(�, F) sin(4πy
λ ) (2)
with the contrast factor φ(�, F) defined as φ(�, F) ) (5Fp - 2F0)/(2Fp + F0) - �p/�0, where p1 is the ultrasonic pressureamplitude; λ is the wavelength of the standing wave; V is thevolume, Fp is the density; �p is the compressibility of the cell;and F0 and �0 are the density and compressibility, respectively,of the suspension medium. From eq 2, it is apparent that theacoustophoretic force strongly depends on the transverse dimen-sion of the separation channel and the volume of the cell, as wellas the cell density and compressibility with respect to thesuspension medium.
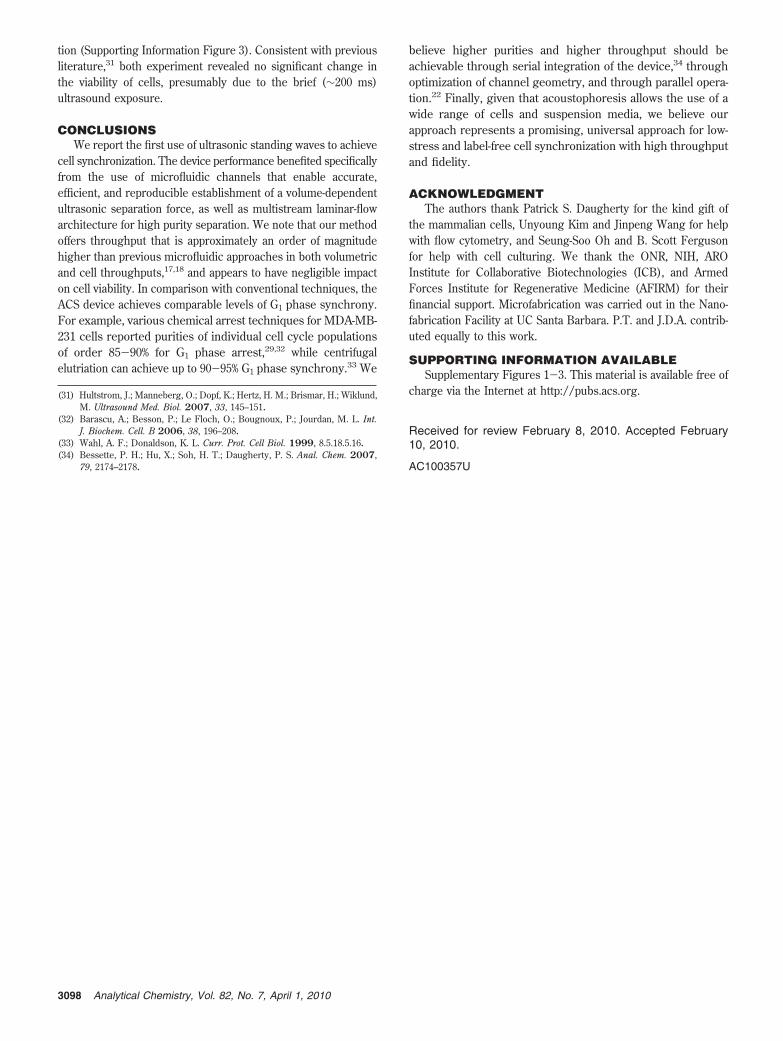
The acoustophoretic cell synchronization (ACS) device wasdesigned to exploit this volume-dependent force to purify cellsin a particular phase from an asynchronous mixture, such thatthey are eluted into independent outlets (Figure 1A). Theacoustic standing waves are generated in the 3-cm-long, 350-µm-wide, and 50-µm-deep separation channel within the ACSdevice (Figure 1B), which is patterned in a silicon substrateand sealed with a glass cap. Sample and buffer solutions areinjected with two independent syringe pumps, and the piezo-electric ultrasonic transducer is attached to the backside of thedevice and driven by amplifier circuitry based on an LT1210operational amplifier (Linear Technologies, Milpitas, CA) anda radiofrequency function generator (33120A, Hewlett-Packard,Palo Alto, CA). The thickness of the piezoactuator was chosensuch that its resonant frequency matched the fundamentalharmonic of the standing pressure wave in the microchannel(∼2 MHz).
Without piezoactuation, the low Reynolds number fluidicconditions (Re ∼ 13) generate a steady laminar flow consisting oftwo peripheral sample streams and one central buffer streamwithin the microchannel (Figure 1C, left). When the piezotrans-ducer is actuated, the stronger acoustic radiation force on largercells (e.g., those in G2/M and S phases) directs them to thecentral stream more rapidly compared to smaller cells (e.g.,those in the G1 phase), thereby allowing efficient separationat the outlets (Figure 1C, right). Quantitatively, assuming twocells (a and b) of different sizes but possessing the same densityand compressibility, the relationship between the their volumes
Figure 1. Acoustophoretic cell synchronization (ACS) device andexperimental setup. (A) Asynchronous mixture of cells and buffervolumetrically pumped into the ACS device. Synchronization isachieved by fractionating the cells according to size such that largercells (e.g., G2) elute through outlet A whereas smaller cells (e.g., G1)elute through outlet B. (B) Photograph of the device with attachedpiezoactuator on its backside (scale bar ) 5 mm). (C) Fluorescencemicrographs of the ACS device in operation. A binary mixture of green(5-µm-diameter) and red (2-µm-diameter) polystyrene beads entersthe inlet area (left) and are acoustophoretically separated to elutethrough outlet 1 and 2, respectively (right). Scale bars are 50 µm inboth images. (D) Two-dimensional numerical simulation of separationalong the channel, showing buffer (gray) with bands of particletrajectories. Larger particles (green) are subject to a greater acousticradiation force and thus converge faster to the nodal plane at thecenter of the channel (dashed line) and elute through outlet A. Smallerparticles (red) do not reach the nodal plane and elute throughoutlet B.
Figure 2. Validation study through separation of beads. A mixtureof 2 and 5 µm polystyrene beads were separated in the ACS deviceat a sample flow rate of 3 mL/h. Flow cytometry analysis shows thatthe initial mixture consisted of 91.87% 2-µm beads (red) and 8.13%5-µm beads (green). After a single pass through the ACS device,the sample retrieved from outlet A contained 98.92% 5-µm beadsand that from outlet B contained 99.99% 2-µm beads.
3096 Analytical Chemistry, Vol. 82, No. 7, April 1, 2010

(Va and Vb) and the required duration for them to focus at anode (τa and τb) can be expressed as
τa
τb) [Vb
Va]2/3
(3)
On the basis of this relationship, the channel geometry and theflow rates were chosen such that larger G2/M and S phase cellselute through outlet A and smaller G1 phase cells elute throughoutlet B (Figure 1D).
To validate the operating conditions, the ACS device was firstcharacterized with two kinds of fluorescent polystyrene beads, 2(red) and 5 µm (green) in diameter. The initial sample containeda binary mixture of red (91.87%) and green (8.13%) beads asmeasured with flow cytometry (Figure 2). We note that this ratioof beads was chosen to mimic the typical proportion of mammaliancells in the G1 and G2 phases.17,18 By monitoring bead separationwhile adjusting the piezo driving signal, the optimum operationalfrequency for the device was found to be 2.044 MHz. After a singlepass through the device at a sample flow rate of 3 mL/h (1.5 ×10⁹ beads/h), flow cytometry data shows highly efficient, label-free, size-based separation: 98.92% of green beads elutedthrough outlet A and 99.99% of red beads eluted through outletB (Figure 2).
The MDA-MB-231 human breast ductal carcinoma cell line wasused as a model for mammalian cell synchronization. Via opticalmicroscopy, we confirmed that their size is highly correlated withtheir phase; we found that cells typically have a volume of ∼400µm3 in the early G1 phase, reaching approximately twice thatvolume when entering the G2/M phase (data not shown).Studies of variations in the cell density throughout the cell cycleof representative mammalian cells are minor (<2%) and wouldnot significantly affect the acoustic separation.26,27 The distribu-tion of elastic coefficients (i.e., compressibility) is wider withchange in mean value of up to 20% through the cell cycle.28
However, such variability would have significantly smaller impacton the acoustic forces than the volume doubling through the cellcycle. Thus, assuming constant density Fp and compressibility
�p, eq 3 predicts that cells in G2/M phase will move toward thecentral node approximately 1.6 times faster than those in G1
phase (i.e., τG2/M < τG1). On the basis of these calculations, theACS device was configured to enrich G1 cells in outlet B anddeplete those in S and G2/M phases via outlet A. Thisconfiguration was chosen because the duration of G1 (∼16-24h) is significantly longer than G2/M (2.5-3 h), reducing theprobability that cells will undergo division during operation.Cells were separated at a sample throughput of 3 mL/h (3 ×10⁶ cells/h). Compared with the bead validation experiment,the concentration is reduced to limit the presence of cellularaggregates, and no significant difference in separation perfor-mance was observed for a wide range of concentrations ofbeads (Supporting Information Figure 1).
To determine cell cycle phase after separation, the collectedcells were fixed and stained with propidium iodide and analyzedwith flow cytometry, and the resulting histograms were modeledusing ModFit LT DNA cell cycle analysis software. The numberof cells modeled in each histogram was 21 115, 9739, and 4399,for the initial, outlet A, and outlet B samples, respectively. Beforeseparation, the distribution of G1, S, and G2/M cells in the samplepopulation was 59%, 30%, and 11%, respectively, which isconsistent with the residence time in their respective phasesand with previously reported values (Figure 3, initial sample).29,30
After a single pass through the device, in outlet A, the populationof G1, S, and G2/M cells was 57%, 33%, and 10%, respectively(Figure 3, outlet A), while at outlet B the population was 84% G1,14% S, and 2% G2/M phase cells (Figure 3, outlet B), or 84% G1
phase synchrony. We note that to elute only G1 cells out ofoutlet B, we are necessarily biasing our selection toward onlythe smallest cells from the early part of the G1 phase. Thus,although many late-stage cells in the G1 phase elute throughoutlet A, a high level of G1 phase synchrony at outlet B maybe achieved.
The effect of acoustophoretic separation on cell viability wasinvestigated via trypan blue-based dye exclusion experimentsimmediately after separation (Supporting Information Figure 2)and through long-term reculturing of cells collected after separa-
(26) Loken, M. R.; Kubitschek, H. E. J. Cell. Physiol. 1984, 118, 22–26.(27) Anderson, E. C.; Petersen, D. F.; Tobey, R. A Biophys. J. 1970, 10, 630–
645.(28) Zhang, G.; Long, M.; Wu, Z. Z.; Yu, W. Q. World J. Gastroent. 2002, 8,
243–246.
(29) Pervin, S.; Singh, R.; Chaudhuri, G Proc. Natl. Acad. Sci. U.S.A. 2001, 98,3583–3588.
(30) Li, Z.; Li, J.; Mo, B.; Hu, C.; Liu, H.; Qi, H.; Wang, X.; Xu, J. Cell Biol.Toxicol. 2008, 24, 401–409.
Figure 3. Flow cytometry histograms showing cell cycle distributions before and after synchronization, based on measurements of redfluorescence (centered at 576 nm) after staining the cellular DNA with propidium iodide. The populations in each phase of the cell cycle weredetermined by fitting cell cycle models to the histograms (ModFit LT). The synchronized cell population at outlet B shows 84% of all cells in theG1 phase, with 14% in the S phase and 2% in G2/M phase.
3097Analytical Chemistry, Vol. 82, No. 7, April 1, 2010
tion (Supporting Information Figure 3). Consistent with previousliterature,31 both experiment revealed no significant change inthe viability of cells, presumably due to the brief (∼200 ms)ultrasound exposure.
CONCLUSIONSWe report the first use of ultrasonic standing waves to achieve
cell synchronization. The device performance benefited specificallyfrom the use of microfluidic channels that enable accurate,efficient, and reproducible establishment of a volume-dependentultrasonic separation force, as well as multistream laminar-flowarchitecture for high purity separation. We note that our methodoffers throughput that is approximately an order of magnitudehigher than previous microfluidic approaches in both volumetricand cell throughputs,17,18 and appears to have negligible impacton cell viability. In comparison with conventional techniques, theACS device achieves comparable levels of G1 phase synchrony.For example, various chemical arrest techniques for MDA-MB-231 cells reported purities of individual cell cycle populationsof order 85-90% for G1 phase arrest,29,32 while centrifugalelutriation can achieve up to 90-95% G1 phase synchrony.33 We
believe higher purities and higher throughput should beachievable through serial integration of the device,34 throughoptimization of channel geometry, and through parallel opera-tion.22 Finally, given that acoustophoresis allows the use of awide range of cells and suspension media, we believe ourapproach represents a promising, universal approach for low-stress and label-free cell synchronization with high throughputand fidelity.
ACKNOWLEDGMENTThe authors thank Patrick S. Daugherty for the kind gift of
the mammalian cells, Unyoung Kim and Jinpeng Wang for helpwith flow cytometry, and Seung-Soo Oh and B. Scott Fergusonfor help with cell culturing. We thank the ONR, NIH, AROInstitute for Collaborative Biotechnologies (ICB), and ArmedForces Institute for Regenerative Medicine (AFIRM) for theirfinancial support. Microfabrication was carried out in the Nano-fabrication Facility at UC Santa Barbara. P.T. and J.D.A. contrib-uted equally to this work.
SUPPORTING INFORMATION AVAILABLESupplementary Figures 1-3. This material is available free of
charge via the Internet at http://pubs.acs.org.
Received for review February 8, 2010. Accepted February10, 2010.
AC100357U
(31) Hultstrom, J.; Manneberg, O.; Dopf, K.; Hertz, H. M.; Brismar, H.; Wiklund,M. Ultrasound Med. Biol. 2007, 33, 145–151.
(32) Barascu, A.; Besson, P.; Le Floch, O.; Bougnoux, P.; Jourdan, M. L. Int.J. Biochem. Cell. B 2006, 38, 196–208.
(33) Wahl, A. F.; Donaldson, K. L. Curr. Prot. Cell Biol. 1999, 8.5.18.5.16.(34) Bessette, P. H.; Hu, X.; Soh, H. T.; Daugherty, P. S. Anal. Chem. 2007,
79, 2174–2178.
3098 Analytical Chemistry, Vol. 82, No. 7, April 1, 2010