Embed Size (px)
Citation preview
Dept of Speech, Music and Hearing
ACOUSTICS FOR
VIOLIN AND GUITAR
MAKERS
Erik Jansson
Chapter III:
Sound and the Room
Fourth edition 2002 http://www.speech.kth.se/music/acviguit4/part3.pdf
Index of chapters Preface/Chapter I Sound and hearing
Chapter II Resonance and resonators
Chapter III Sound and the room
Chapter IV Properties of the violin and guitar string
Chapter V Vibration properties of the wood and tuning of violin plates
Chapter VI The function, tone, and tonal quality of the guitar
Chapter VII The function of the violin
Chapter VIII The tone and tonal quality of the violin
Chapter IX Sound examples and simple experimental material – under preparation
Webpage: http://www.speech.kth.se/music/acviguit4/index.html
Jansson: Acoustics for the violin and guitarmaker 3.2
ACOUSTICS FOR VIOLIN AND GUITAR MAKERS Chapter 3 – Fundamentals of Acoustics SOUND AND THE ROOM Part 1: FUNDAMENTAL ROOM ACOUSTICS 3.1 Propagation of sound 3.2 Sound radiation 3.3 Reception of sound 3.4. Summary 3.5. Key words Part 2: THE SOUND IN THE ROOM 3.6. The influence of the room 3.7 Properties for rooms 3.8 Acoustics of the podium 3.9. Summary 3.10. Key words
3.11 APPENDIX. Relations between sound pressure level and sound pressure.
Jansson: Acoustics for the violin and guitarmaker 3.3
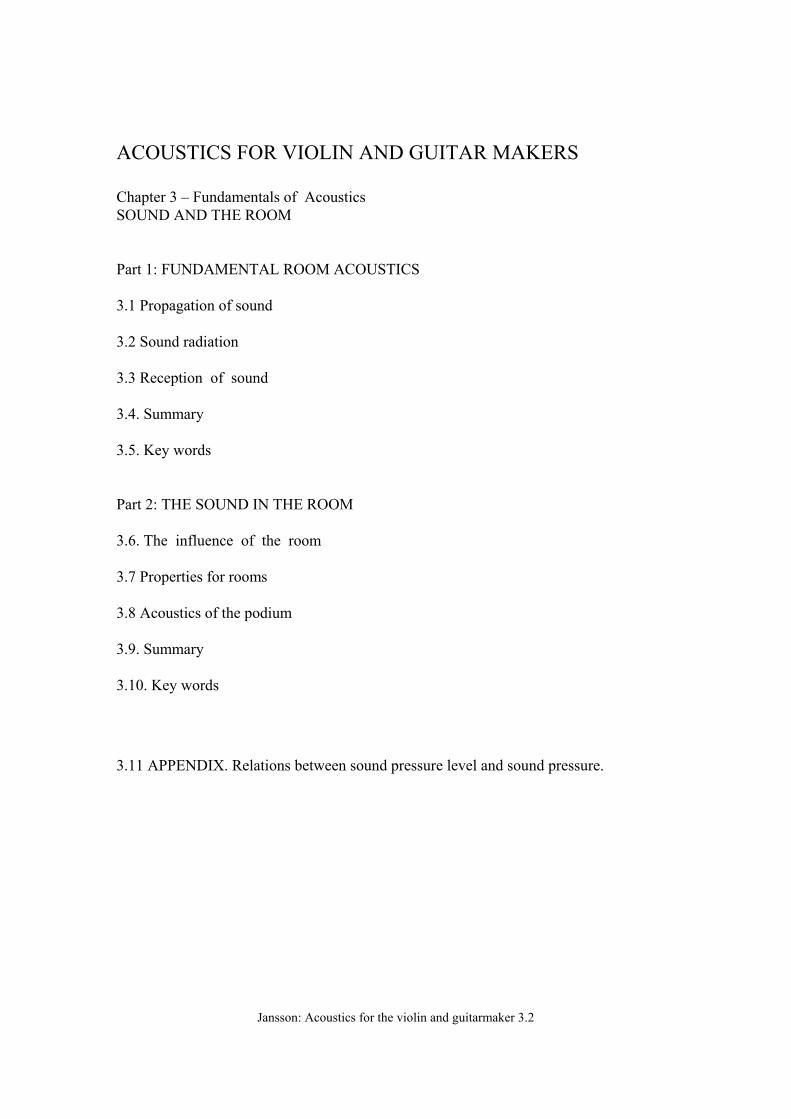
Chapter 3. FUNDAMENTALS OF ACOUSTICS - SOUND AND THE ROOM First part: FUNDAMENTAL ROOM ACOUSTICS INTRODUCTION The sound is spread in a room roughly as sketched in Fig. 3.1. It is spread in all directions from the violin and reaches the ear of the player first. Soon thereafter the earliest reflected "sound ray" reaches the ear of the player. The direct "sound ray" from the violin first reaches the listener, followed soon after by reflected sound rays. It is the reflected sound that gives the characteristic sound of the room.
Figure 3.1. Spread of sound in a room. In this part we shall talk about the sound and the room, i.e. the propagation of sound, musical instruments as sound sources, the ear as a sound receiver. We start with the Propagation of Sound, continues with Sound Radiation and concludes with Reception of Sound. 3.1 PROPAGATION OF SOUND (TIME AND LEVEL) TIME (distance and sound velocity) The sound travels through the air with a velocity of slightly less than 345 m/s (the sound velocity is somewhat dependant on temperature). The fact that time is needed for the sound to spread means that the listeners in the auditorium do not hear the tones at the same time as they are played. Furthermore they reach the different listeners at slightly different times. The played tones also reach the different members of the orchestra at different times. How much the tones are delayed by the distances is illustrated by the following examples. Fundamental formula: time x velocity = distance
Jansson: Acoustics for the violin and guitarmaker 3.4
Example 3.1. At a park concert one listener is sitting 5 m from the solo singer and
another listener 100 m away on the lawn. How much later do the two listeners hear the tones than the singer? time x velocity = distance, i.e., time = distance / velocity
The distance from mouth to ear of the singer is approx. 15 cm = 0.15 m i.e. time = (0.15 m) / (345 m/s) = 0.000 43 s. Thus the singer hears himself with a very short delay, in practice no delay. For the close listener, time = (5 m) / (345 m/s) = 0.015 s, and for the distant listener, time = (100 m) / (345 m/s) = 0.29 s. The example shows that fairly short distances gives measurable time delays from source to listener.
Table 3.1. Time table for some distances time = distance /sound velocity (sound velocity 345 m/s) 1/1000 s = 1 ms (millisecond). DISTANCE TIME m ms 1 3 2 6 5 14 10 29 15 43 20 58 30 87 40 116 50 145 i.e., distance increased 4 times 100 290 takes 4 times longer time LEVEL (distance) The sound level decreases with the distance from the sound source. We shall treat the simple case of levels for spherical radiation in this part. The simplest case is equally strong radiation in all directions (spherical waves). In the appendix to this chapter there is a table, which can be used for "translation" between sound level and sound pressure. Formula: sound pressure = a constant / distance The formula says that the sound pressure decreases to half when the distance is doubled, which means that the sound level decreases 6 dB.
Jansson: Acoustics for the violin and guitarmaker 3.5
Example 3.2. Assume that a violin gives a sound level of 85 dB at the distance of 1 m. What is the level at the distances of 5 and 100 m respectively (assume spherical waves)? a) 5 m: The sound pressure amplitude at 5 m distance is 1/5 of the amplitude at 1 m. This can be translated by the appendix table, which shows that the ratio (1:5.0) corresponds to a level decrease of 14 dB. The sound level at 5 m is thus 85 - 14 = 71 dB sound level (SPL). The violin tones should be weak but easily heard. b) 100 m: The sound pressure amplitude at a distance of 100 m is 1/100 of that at 1 m, i.e., translated from 1:100 to -40 dB. The sound level at the distance 100 m becomes 85 - 40 = 45 dB. The violin tones will only be heard under quiet conditions.
Example 3.3. If one stands at a distance of 10 m, how much closer should one walk to
make the violin sound twice as loud? A level increase of 10 dB makes the sound twice as loud (rule of thumb). A 10 dB increase corresponds in the appendix table to an increase of the amplitude ratio of 3.2:1, i.e., the distance should be decreased to 10/3.2, which is close to 3 m. Note that twice as strong corresponds to a distance decrease to one third (not one half).
Table 3.2. The level change at different distances relative to 1 m. Distance m Level change dB 1 - 0 2 - 6 5 -14 10 -20 15 -24 20 -26 30 -30 i.e., 3 times longer distance gives 40 -32 10 dB lower level, and 50 -34 10 times longer distance gives 100 -40 20 dB lower level For further calculations (translations) the reader is referred to the appendix. 3.2 SOUND RADIATION (spherical radiation, directional radiation, reflection, and size-frequency limit DG) Sound radiation is as a rule very complicated, but some simple rules of thumb can be made. The radiation properties are determined by two characteristics of the sound source: its size (area or diameter) and the frequency of the sound. It is the relation between the two measures that largely determines the radiation properties. Let us introduce a size/frequency measure DG to be able to simplify the properties of sound sources. The measure DG equals 100/frequency. For a diameter of the sound source
Jansson: Acoustics for the violin and guitarmaker 3.6
smaller than DG the sound is radiated with equal strength in all directions. A sound source with a diameter larger than DG gives a more directed and complex radiation. When sound hits an object, parts of the sound sneak round it, parts are spread around the object and parts are reflected. Again the same factors are involved, the size of the object and the frequency of the sound. At low frequencies most sound sneaks around the object and little is spread or reflected. With increasing frequency more and more of the sound is spread and reflected. At high frequencies most sound is reflected. We can again use the measure DG. A DG larger than 100/frequency gives mainly reflection and smaller DG gives little disturbance. Example 3.4. Can the head substantially influence the timbre of the singer's voice and if
so from what frequency?
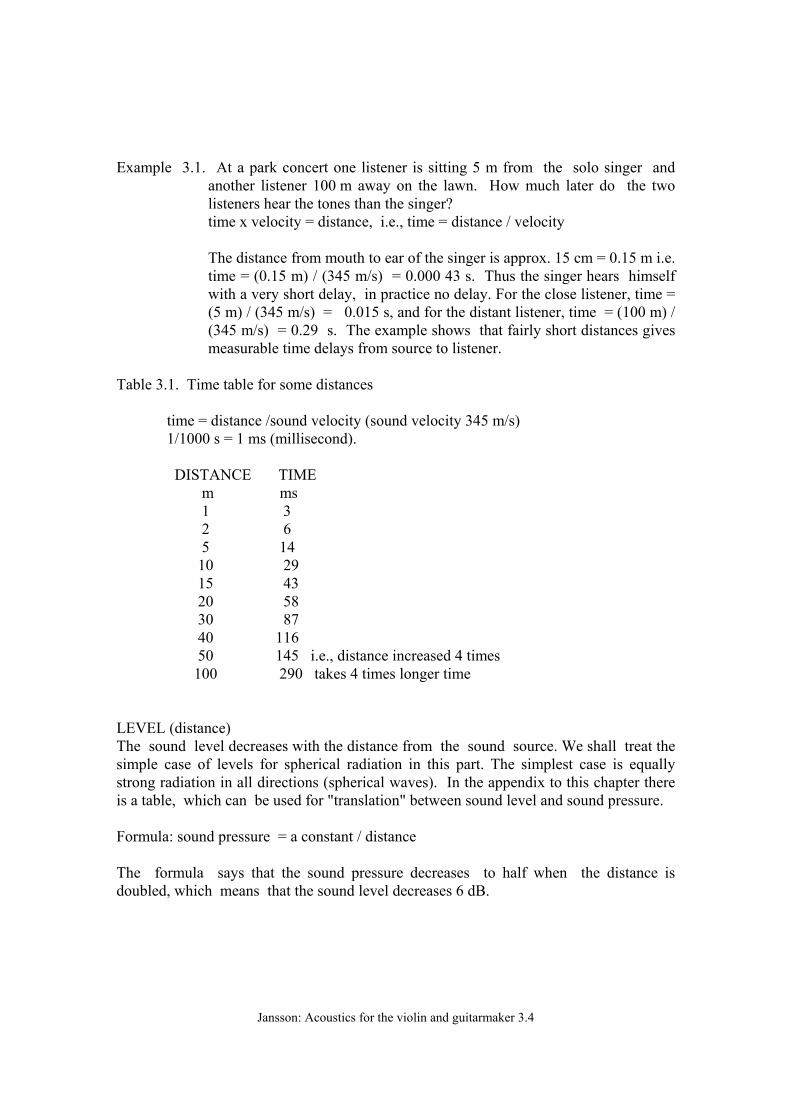
At 1000 Hz DG = 100/1000 m = 10 cm. 500 100/500 20 cm The diameter of the head is slightly less than 20 cm, i.e., we should expect directional radiation above 500 Hz. Measurements support the prediction, see Fig. 3.2. The radiation is between 5 to 15 dB lower behind the head than in front for the range of appropriate frequencies, and thus the head influences the timbre.
Figure 3.2. Directional properties of the radiation around the human head for speech a) in the horizontal plane and b) in the vertical plane. The arrow marks the forward direction (the nose direction and the shaded areas level differences of less than 5 dB, after Kuttruff). An object of certain size in comparison with the sound frequency will influence the sound radiation. This occurs when the size of the object D > DG (= 100/frequency). In table 3.3 some of these size-frequency limits are given.
Jansson: Acoustics for the violin and guitarmaker 3.7
Table 3.3. Size-frequency limit DG for some frequencies Frequency Hz Diameter m 20 5 at low frequencies even large 50 2 objects give little influence 100 1 200 0.5 500 0.2 1 000 0.1 2 000 0.05 5 000 0.02 10 000 0.01 at high frequencies even small 20 000 0.005 objects give large influence Example 3.5. Do the traditional string instruments radiate equally strongly in all
directions at the fundamental of the lowest string? A little arithmetic on the tuning, DG, and the instruments sizes gives:
Instrument Lowest fundamental DG corpus length Violin G 196 Hz 0.56 m 0.36 m Viola C 131 0.83 0.43 Cello C 65.4 1.7 0.75 Bass E 41.2 2.7 1.15 Guitar E 82.4 1.3 0.48 i.e., the corpus length is much smaller than DG and the instruments radiate the lowest fundamental equally strong in all directions.
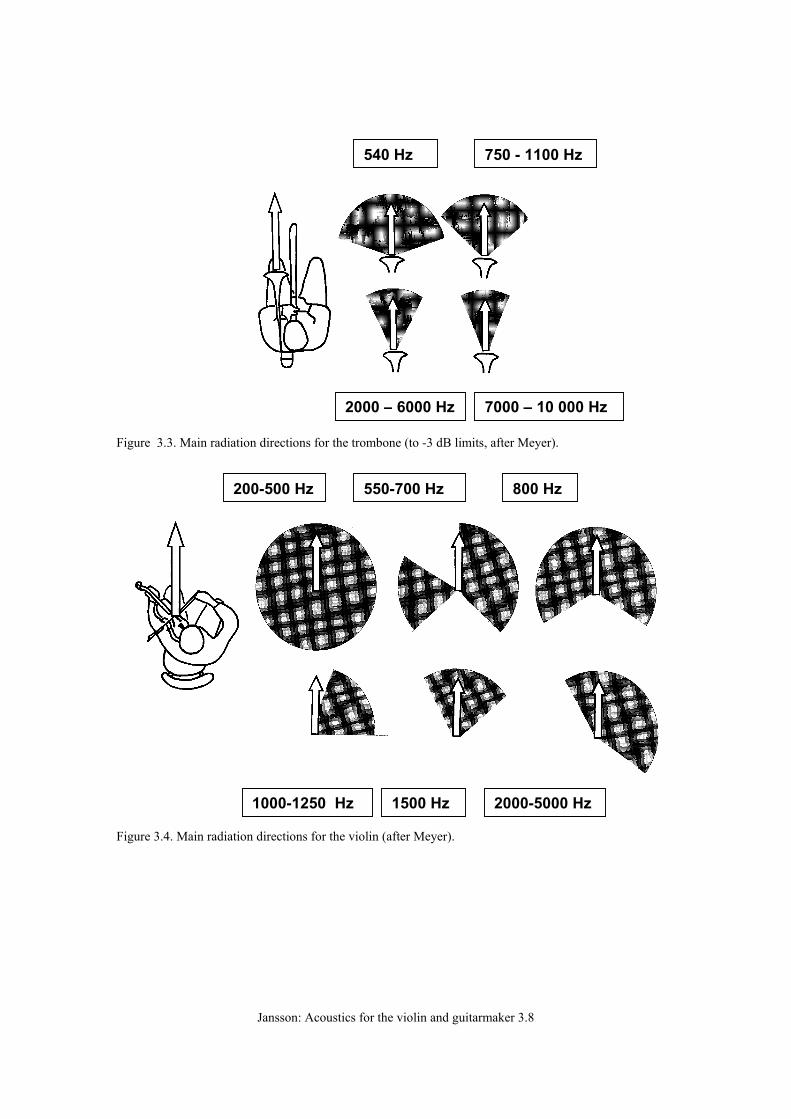
Let us show examples on radiation of musical instruments and start with the simplest, the brass instruments. For the brass instruments and especially the trombone the following radiation properties are found. The sound is radiated via the bell in a wide angle (a wide lobe) at low frequencies, cf., Fig. 3.3. The angle (the lobe) becomes narrower with increasing frequency. The violin radiates somewhat similarly, in all directions for low frequencies, but the radiation is split into more complicated patterns for higher frequencies. A tendency for increased sound radiation from the top plate is found, cf., Fig. 3.4. The differences in radiation make spectra obtained in different directions look different. To demonstrate this, played music has been analysed with filters corresponding to the so called critical bands of hearing, cf., Fig. 3.5. It is easily seen that the spectra are different in the different directions, especially at high frequencies. The spectrum corresponding to radiation in the neck direction gives the highest levels,
Jansson: Acoustics for the violin and guitarmaker 3.8
Figure 3.3. Main radiation directions for the trombone (to -3 dB limits, after Meyer).
Figure 3.4. Main radiation directions for the violin (after Meyer).
540 Hz 750 - 1100 Hz
2000 – 6000 Hz 7000 – 10 000 Hz
200-500 Hz 550-700 Hz 800 Hz
1000-1250 Hz 1500 Hz 2000-5000 Hz
Jansson: Acoustics for the violin and guitarmaker 3.9
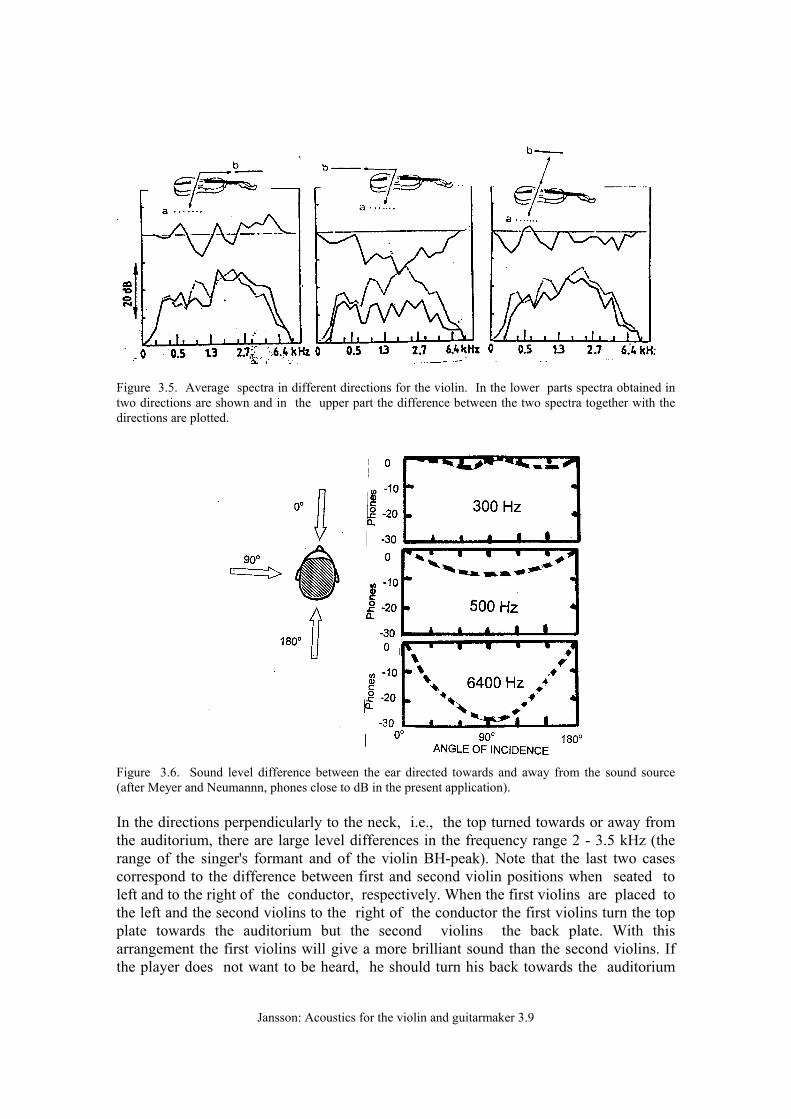
Figure 3.5. Average spectra in different directions for the violin. In the lower parts spectra obtained in two directions are shown and in the upper part the difference between the two spectra together with the directions are plotted.
Figure 3.6. Sound level difference between the ear directed towards and away from the sound source (after Meyer and Neumannn, phones close to dB in the present application). In the directions perpendicularly to the neck, i.e., the top turned towards or away from the auditorium, there are large level differences in the frequency range 2 - 3.5 kHz (the range of the singer's formant and of the violin BH-peak). Note that the last two cases correspond to the difference between first and second violin positions when seated to left and to the right of the conductor, respectively. When the first violins are placed to the left and the second violins to the right of the conductor the first violins turn the top plate towards the auditorium but the second violins the back plate. With this arrangement the first violins will give a more brilliant sound than the second violins. If the player does not want to be heard, he should turn his back towards the auditorium
Jansson: Acoustics for the violin and guitarmaker 3.10
(note the obvious connection between vision and hearing). A practical interpretation is the following. A soloist, who really wants to be heard should aim with the violin neck at his listeners. 3.3. RECEPTION OF SOUND (head with ears, directional and room hearing) THE HEAD The ears (the pinnae) are on opposite sides of the head and slightly behind the middle. This arrangement gives a microphone system that can recognise directions by means of "spacial filtering". We should expect a marked influence on the sound by the head. Measurements also show that there are differences in sound level between the left and the right ears starting from 500 Hz. The level differences depend on the direction of the sound, cf., Fig. 3.6.
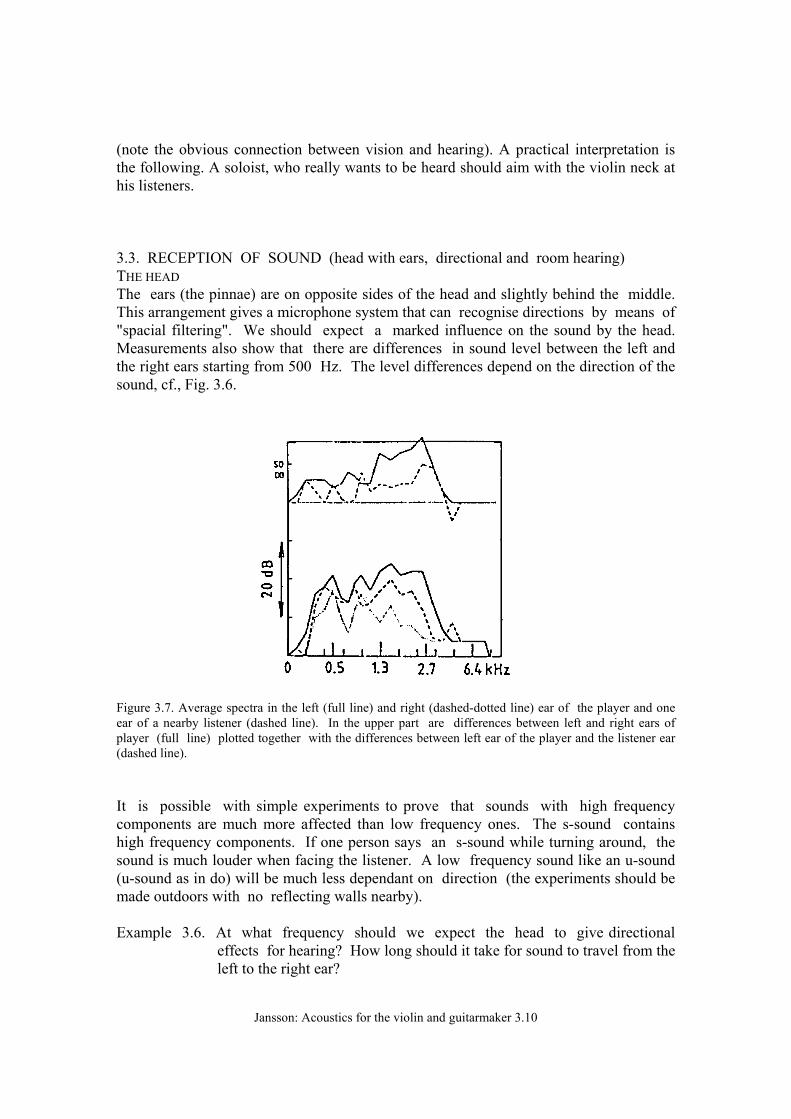
Figure 3.7. Average spectra in the left (full line) and right (dashed-dotted line) ear of the player and one ear of a nearby listener (dashed line). In the upper part are differences between left and right ears of player (full line) plotted together with the differences between left ear of the player and the listener ear (dashed line). It is possible with simple experiments to prove that sounds with high frequency components are much more affected than low frequency ones. The s-sound contains high frequency components. If one person says an s-sound while turning around, the sound is much louder when facing the listener. A low frequency sound like an u-sound (u-sound as in do) will be much less dependant on direction (the experiments should be made outdoors with no reflecting walls nearby). Example 3.6. At what frequency should we expect the head to give directional
effects for hearing? How long should it take for sound to travel from the left to the right ear?
Jansson: Acoustics for the violin and guitarmaker 3.11
Say that the human head has a diameter of 15 cm. A little calculation shows that we should expect different levels in the left and the right ear from approximately 700 Hz. Say that the distance between the ears equals half the circumference of the head, i.e., 3.14 x radius = 25 cm (approximately) and with the sound velocity of 345 m/s a maximum time difference of 0.7 ms can be obtained.
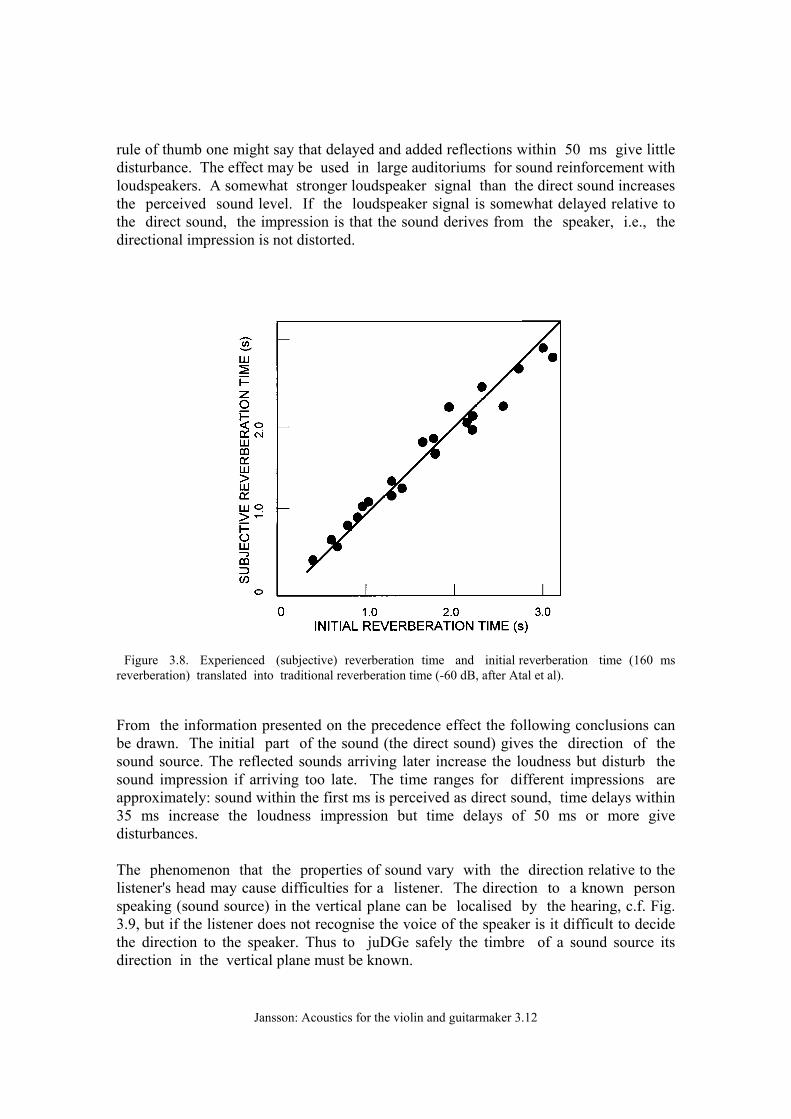
The player listens to his own instrument while playing and therefore a natural question is: How does the violin sound "look" in the two ears of the violin player? Measurements with small microphones inserted the ears of a player and the ears of a listener are shown in Fig. 3.7. The diagram shows that there are large differences between the left and right ears of the player, the left being approximately 10 dB above at 1.3 kHz (a replay with headphones sounds natural for a violin player but seems silent in the right ear of a non-player). The level for the listener was about 5 dB lower than the left ear of the player, somewhat more at high frequencies. THE PINNAE – DIRECTIONAL ANTENNAS The pinna also gives directional effects. Its diameter is about 4 cm, corresponding to a frequency limit for the directional effects of 3 kHz, which corresponds to the first resonance of the auditory canal. Above this frequency the pinna starts working as a direction sensitive antenna, and gives us possibilities to separate sound arriving from the front, back and above. THE BRAIN – THE COMPUTER Connected to the ears we have a powerful computer, the brain. By means of this computer we can store and compare sound impressions. The differences of arrival times can be used and are of great importance for the hearing impression. Time differences larger than 1 ms makes it possible to separate sound sources such as loudspeakers at the cinema. A time differences of 17 to 35 ms between your own instrument and that of your fellow players is optimal for playing together. A time difference between the direct sound and the first reflection of 50 to 80 ms, results in disturbing reverberation and echoes. The audio signals of music and speech include very fast changes within a hundredth of a second, while the reverberation time of a room is about 1 second. Experiments show that for the subjectively experienced reverberation the initial part is the most important, cf., Fig. 3.8. A listener uses only the first 160 ms and not a full second to experience the reverberation of a room. He or she can also use the first 10 dB decay but not the 60 dB decay of the classical reverberation time. Another important effect is the so-called precedence effect, which predicts that the reflected sound close after the direct sound is not disturbing. The reflected sound may even be 10 dB stronger than the direct sound and still gives little disturbance. As a
Jansson: Acoustics for the violin and guitarmaker 3.12
rule of thumb one might say that delayed and added reflections within 50 ms give little disturbance. The effect may be used in large auditoriums for sound reinforcement with loudspeakers. A somewhat stronger loudspeaker signal than the direct sound increases the perceived sound level. If the loudspeaker signal is somewhat delayed relative to the direct sound, the impression is that the sound derives from the speaker, i.e., the directional impression is not distorted.
Figure 3.8. Experienced (subjective) reverberation time and initial reverberation time (160 ms reverberation) translated into traditional reverberation time (-60 dB, after Atal et al). From the information presented on the precedence effect the following conclusions can be drawn. The initial part of the sound (the direct sound) gives the direction of the sound source. The reflected sounds arriving later increase the loudness but disturb the sound impression if arriving too late. The time ranges for different impressions are approximately: sound within the first ms is perceived as direct sound, time delays within 35 ms increase the loudness impression but time delays of 50 ms or more give disturbances. The phenomenon that the properties of sound vary with the direction relative to the listener's head may cause difficulties for a listener. The direction to a known person speaking (sound source) in the vertical plane can be localised by the hearing, c.f. Fig. 3.9, but if the listener does not recognise the voice of the speaker is it difficult to decide the direction to the speaker. Thus to juDGe safely the timbre of a sound source its direction in the vertical plane must be known.
Jansson: Acoustics for the violin and guitarmaker 3.13
100 % 50 %
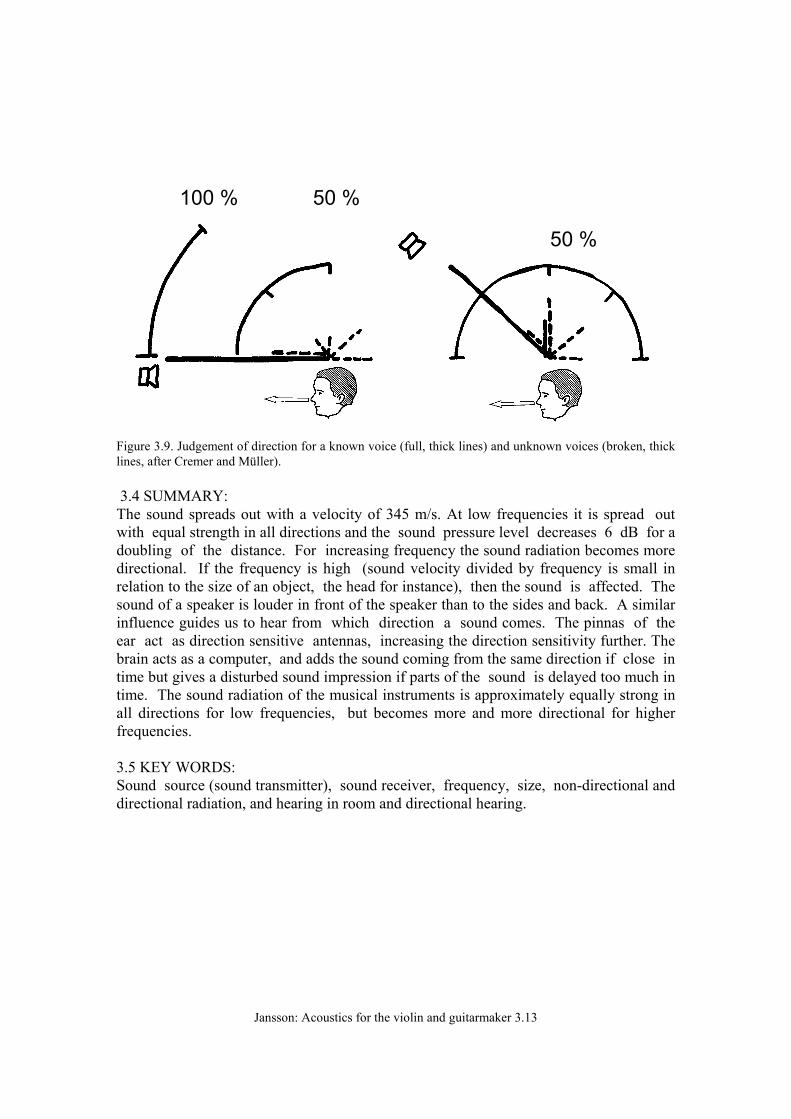
Figure 3.9. Judgement of direction for a known voice (full, thick lines) and unknown voices (broken, thick lines, after Cremer and Müller). 3.4 SUMMARY: The sound spreads out with a velocity of 345 m/s. At low frequencies it is spread out with equal strength in all directions and the sound pressure level decreases 6 dB for a doubling of the distance. For increasing frequency the sound radiation becomes more directional. If the frequency is high (sound velocity divided by frequency is small in relation to the size of an object, the head for instance), then the sound is affected. The sound of a speaker is louder in front of the speaker than to the sides and back. A similar influence guides us to hear from which direction a sound comes. The pinnas of the ear act as direction sensitive antennas, increasing the direction sensitivity further. The brain acts as a computer, and adds the sound coming from the same direction if close in time but gives a disturbed sound impression if parts of the sound is delayed too much in time. The sound radiation of the musical instruments is approximately equally strong in all directions for low frequencies, but becomes more and more directional for higher frequencies. 3.5 KEY WORDS: Sound source (sound transmitter), sound receiver, frequency, size, non-directional and directional radiation, and hearing in room and directional hearing.
50 %

Jansson: Acoustics for the violin and guitarmaker 3.14
Chapter 3. Second part: THE SOUND IN THE ROOM INTRODUCTION The information presented below is mainly textbook knowledge supplemented with experience from a research project "Speech and Music in Rooms". We start with the influence of the room on the sound (reverberation time), summarises properties of typical rooms, and ends with acoustics of the concert podium. 3.4. THE INFLUENCE OF THE ROOM (reflection, absorption, resonances, reverberation time and reverberation distance).
Figure 3.10. Time courses of a spoken message as registered by ear properties modelled by computer, a) at an ear of the speaker, and b) at an ear of a listener at a distance of 8 m in a lecture hall with poor acoustics. In our project work a "computer ear" was developed. The computer ear contained known major properties of the human ear, the so called critical bands of hearing. The analysis of a spoken sentence is shown in Fig. 3.10. The two upmost wavy lines correspond to the sound level in the 2000 Hz critical band of the hearing, the two middle ones the sound level in the 500 Hz critical band. The lowest two wavy lines show the sound level without any filtering. The analysis was made of the same speech signal but obtained at the left ear of the speaker (it is shown in the upper lines, a, in the three
Jansson: Acoustics for the violin and guitarmaker 3.15
frames) and a listening position 8 m out in the lecture hall (shown by the lower lines, b, in the frames). The influence of the room is large. The sound level curves at the speaker have clear peaks and dips. At the listener the peaks are smoothed out
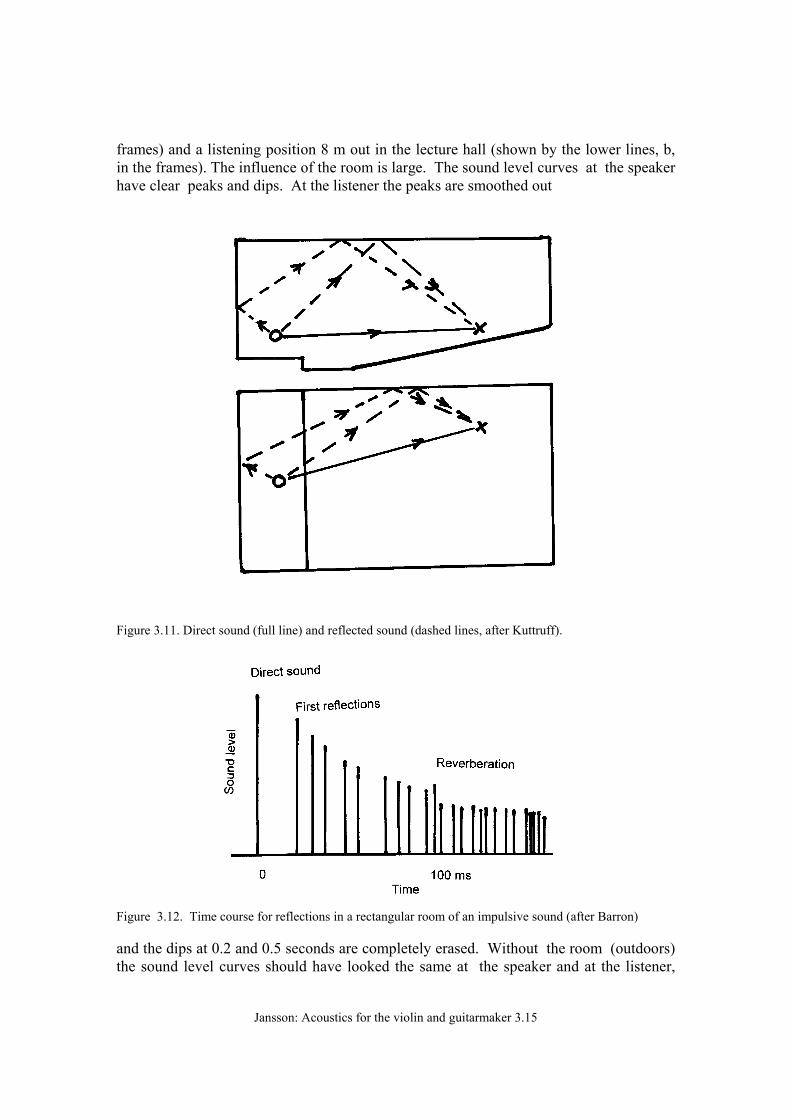
Figure 3.11. Direct sound (full line) and reflected sound (dashed lines, after Kuttruff).
Figure 3.12. Time course for reflections in a rectangular room of an impulsive sound (after Barron) and the dips at 0.2 and 0.5 seconds are completely erased. Without the room (outdoors) the sound level curves should have looked the same at the speaker and at the listener,
Jansson: Acoustics for the violin and guitarmaker 3.16
although the levels would have been lower at the listener. The room gives a higher sound level but smears out the sound. It can also be seen that the level of the disturbing reverberant sound increases all the time. The cause for this influence of the room will be discussed in the following. The walls of the room (including ceiling and floor) reflect the sound rays back into the room. By using ray tracing techniques, the magnitude of the sound reaching a listener is the combination of the direct sound and the sound reflected from the walls can be predicted as shown in Fig. 3.11. The sound distribution as a function of time, direct sound and reflections can also be calculated and is shown schematically in Fig. 3.12 for an impulsive sound.
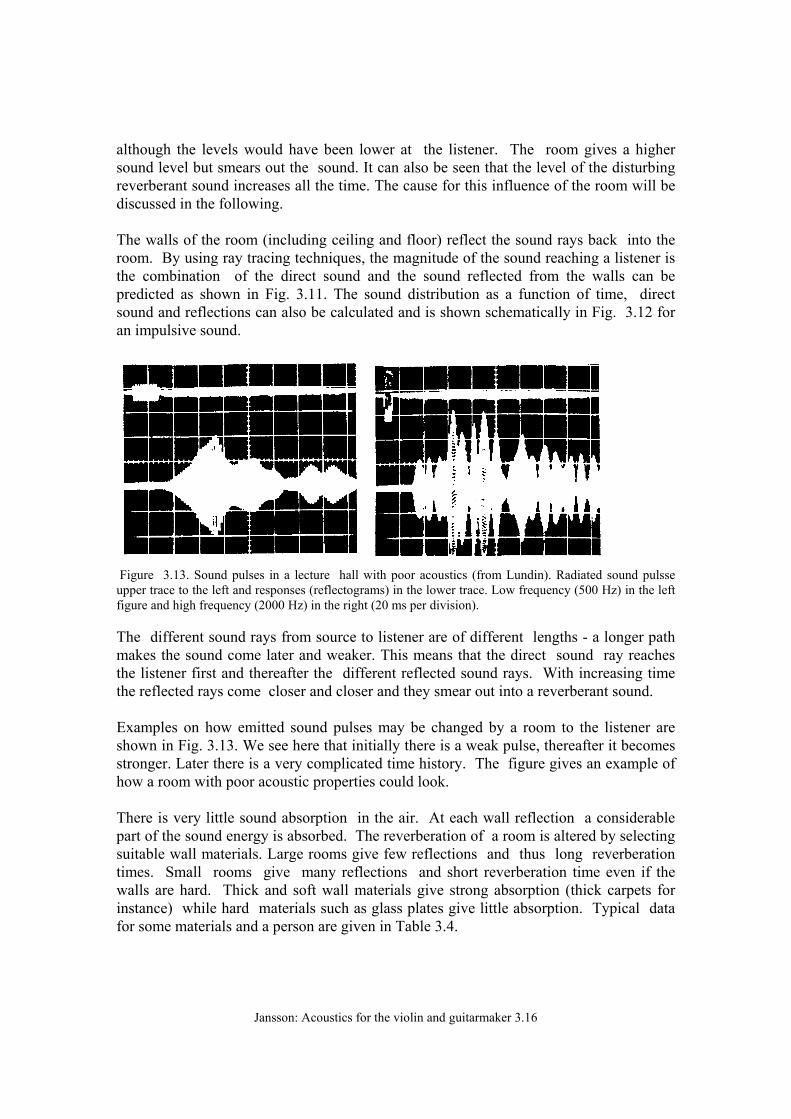
Figure 3.13. Sound pulses in a lecture hall with poor acoustics (from Lundin). Radiated sound pulsse upper trace to the left and responses (reflectograms) in the lower trace. Low frequency (500 Hz) in the left figure and high frequency (2000 Hz) in the right (20 ms per division). The different sound rays from source to listener are of different lengths - a longer path makes the sound come later and weaker. This means that the direct sound ray reaches the listener first and thereafter the different reflected sound rays. With increasing time the reflected rays come closer and closer and they smear out into a reverberant sound. Examples on how emitted sound pulses may be changed by a room to the listener are shown in Fig. 3.13. We see here that initially there is a weak pulse, thereafter it becomes stronger. Later there is a very complicated time history. The figure gives an example of how a room with poor acoustic properties could look. There is very little sound absorption in the air. At each wall reflection a considerable part of the sound energy is absorbed. The reverberation of a room is altered by selecting suitable wall materials. Large rooms give few reflections and thus long reverberation times. Small rooms give many reflections and short reverberation time even if the walls are hard. Thick and soft wall materials give strong absorption (thick carpets for instance) while hard materials such as glass plates give little absorption. Typical data for some materials and a person are given in Table 3.4.
Jansson: Acoustics for the violin and guitarmaker 3.17
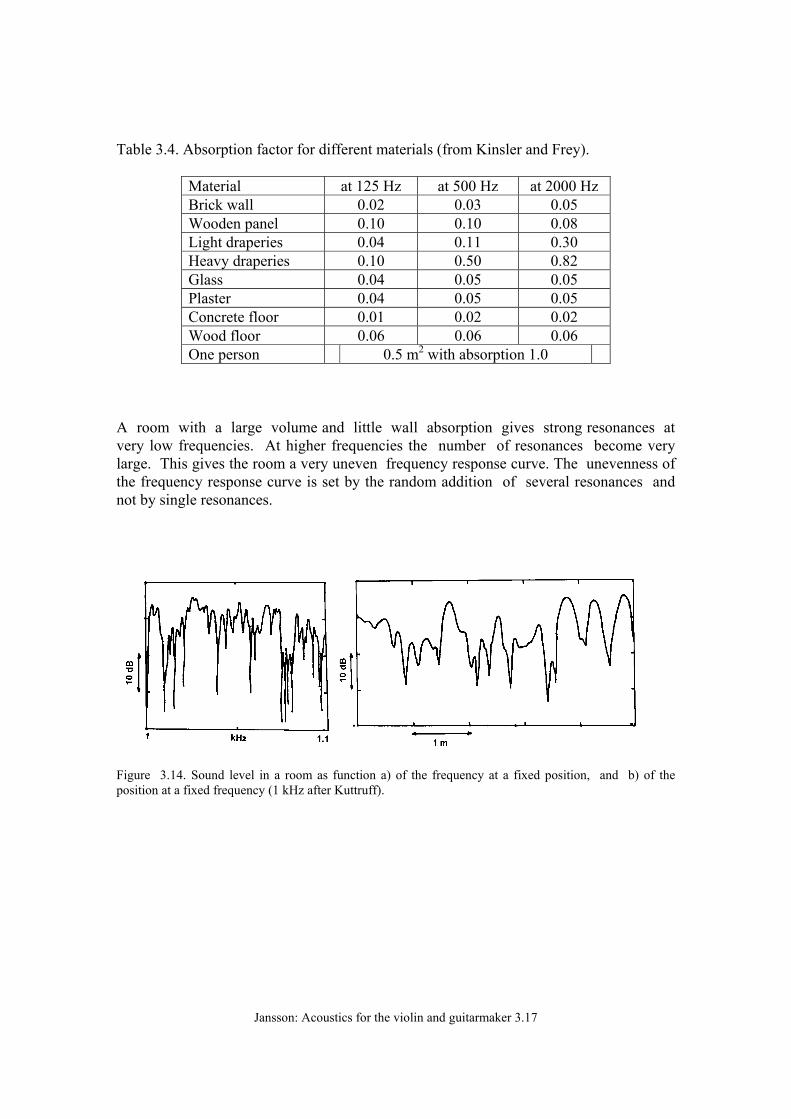
Table 3.4. Absorption factor for different materials (from Kinsler and Frey).
Material at 125 Hz at 500 Hz at 2000 Hz Brick wall 0.02 0.03 0.05 Wooden panel 0.10 0.10 0.08 Light draperies 0.04 0.11 0.30 Heavy draperies 0.10 0.50 0.82 Glass 0.04 0.05 0.05 Plaster 0.04 0.05 0.05 Concrete floor 0.01 0.02 0.02 Wood floor 0.06 0.06 0.06 One person 0.5 m2 with absorption 1.0
A room with a large volume and little wall absorption gives strong resonances at very low frequencies. At higher frequencies the number of resonances become very large. This gives the room a very uneven frequency response curve. The unevenness of the frequency response curve is set by the random addition of several resonances and not by single resonances.
Figure 3.14. Sound level in a room as function a) of the frequency at a fixed position, and b) of the position at a fixed frequency (1 kHz after Kuttruff).
Jansson: Acoustics for the violin and guitarmaker 3.18
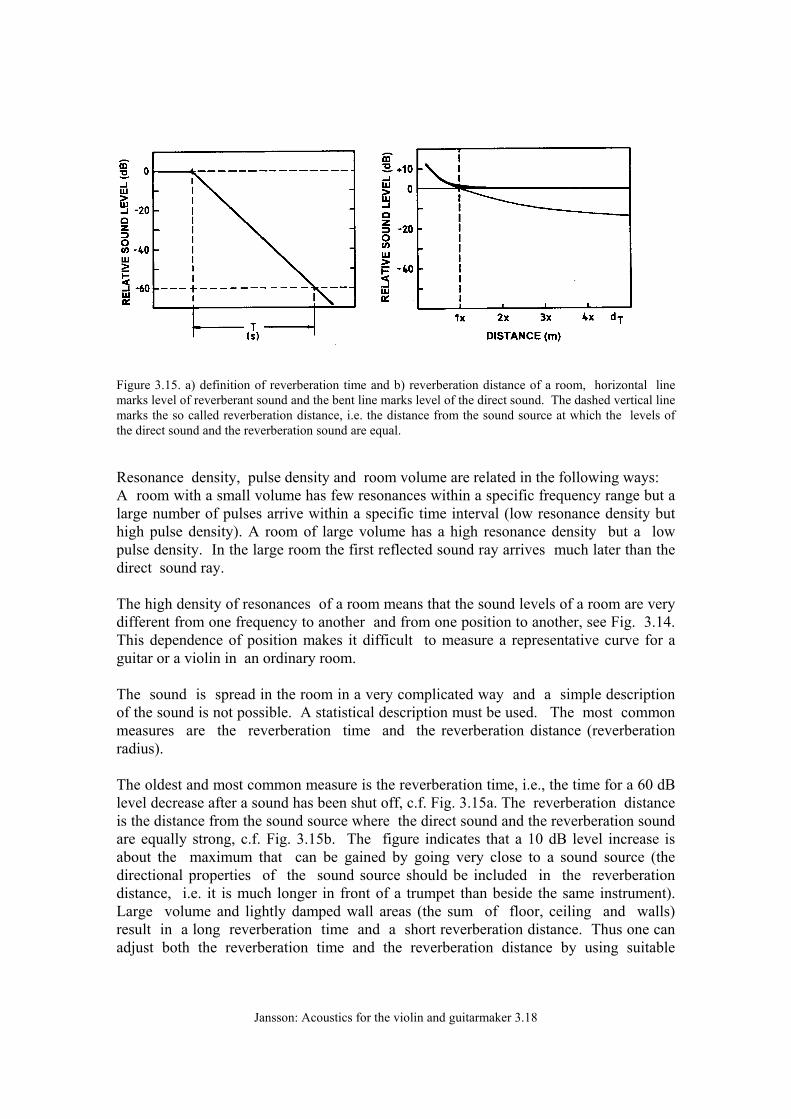
Figure 3.15. a) definition of reverberation time and b) reverberation distance of a room, horizontal line marks level of reverberant sound and the bent line marks level of the direct sound. The dashed vertical line marks the so called reverberation distance, i.e. the distance from the sound source at which the levels of the direct sound and the reverberation sound are equal. Resonance density, pulse density and room volume are related in the following ways: A room with a small volume has few resonances within a specific frequency range but a large number of pulses arrive within a specific time interval (low resonance density but high pulse density). A room of large volume has a high resonance density but a low pulse density. In the large room the first reflected sound ray arrives much later than the direct sound ray. The high density of resonances of a room means that the sound levels of a room are very different from one frequency to another and from one position to another, see Fig. 3.14. This dependence of position makes it difficult to measure a representative curve for a guitar or a violin in an ordinary room. The sound is spread in the room in a very complicated way and a simple description of the sound is not possible. A statistical description must be used. The most common measures are the reverberation time and the reverberation distance (reverberation radius). The oldest and most common measure is the reverberation time, i.e., the time for a 60 dB level decrease after a sound has been shut off, c.f. Fig. 3.15a. The reverberation distance is the distance from the sound source where the direct sound and the reverberation sound are equally strong, c.f. Fig. 3.15b. The figure indicates that a 10 dB level increase is about the maximum that can be gained by going very close to a sound source (the directional properties of the sound source should be included in the reverberation distance, i.e. it is much longer in front of a trumpet than beside the same instrument). Large volume and lightly damped wall areas (the sum of floor, ceiling and walls) result in a long reverberation time and a short reverberation distance. Thus one can adjust both the reverberation time and the reverberation distance by using suitable
Jansson: Acoustics for the violin and guitarmaker 3.19
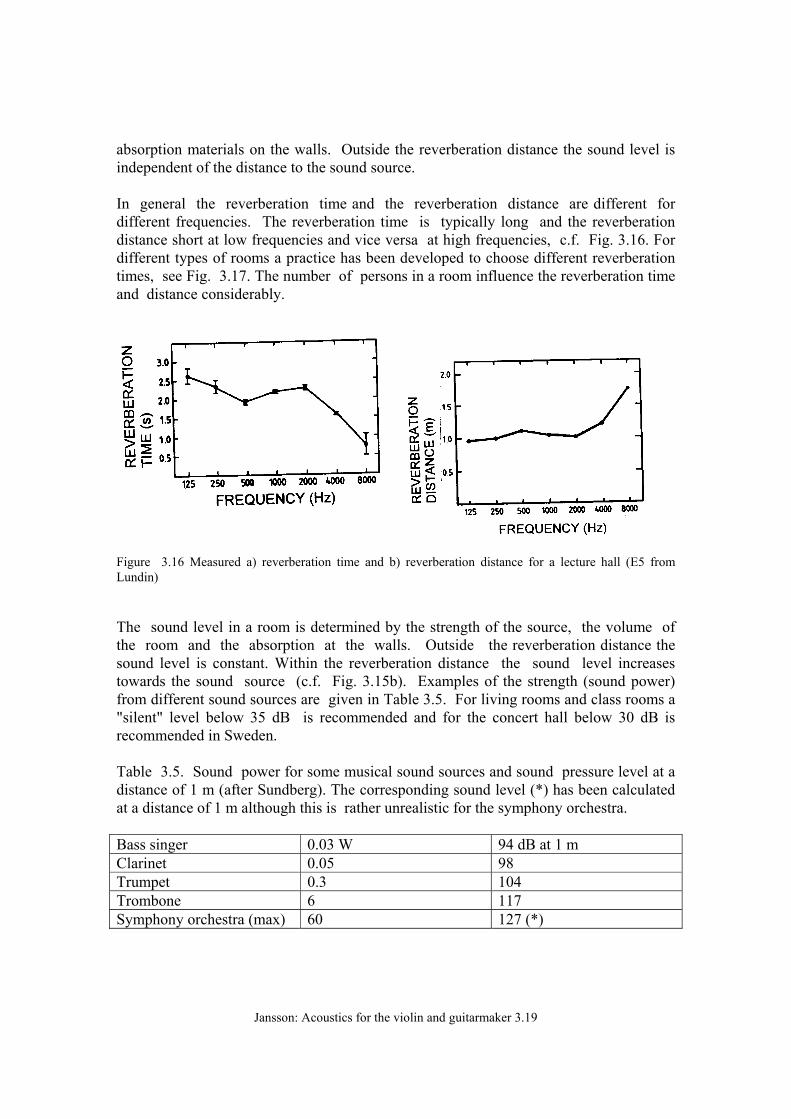
absorption materials on the walls. Outside the reverberation distance the sound level is independent of the distance to the sound source. In general the reverberation time and the reverberation distance are different for different frequencies. The reverberation time is typically long and the reverberation distance short at low frequencies and vice versa at high frequencies, c.f. Fig. 3.16. For different types of rooms a practice has been developed to choose different reverberation times, see Fig. 3.17. The number of persons in a room influence the reverberation time and distance considerably.
Figure 3.16 Measured a) reverberation time and b) reverberation distance for a lecture hall (E5 from Lundin) The sound level in a room is determined by the strength of the source, the volume of the room and the absorption at the walls. Outside the reverberation distance the sound level is constant. Within the reverberation distance the sound level increases towards the sound source (c.f. Fig. 3.15b). Examples of the strength (sound power) from different sound sources are given in Table 3.5. For living rooms and class rooms a "silent" level below 35 dB is recommended and for the concert hall below 30 dB is recommended in Sweden. Table 3.5. Sound power for some musical sound sources and sound pressure level at a distance of 1 m (after Sundberg). The corresponding sound level (*) has been calculated at a distance of 1 m although this is rather unrealistic for the symphony orchestra. Bass singer 0.03 W 94 dB at 1 m Clarinet 0.05 98 Trumpet 0.3 104 Trombone 6 117 Symphony orchestra (max) 60 127 (*)
Jansson: Acoustics for the violin and guitarmaker 3.20
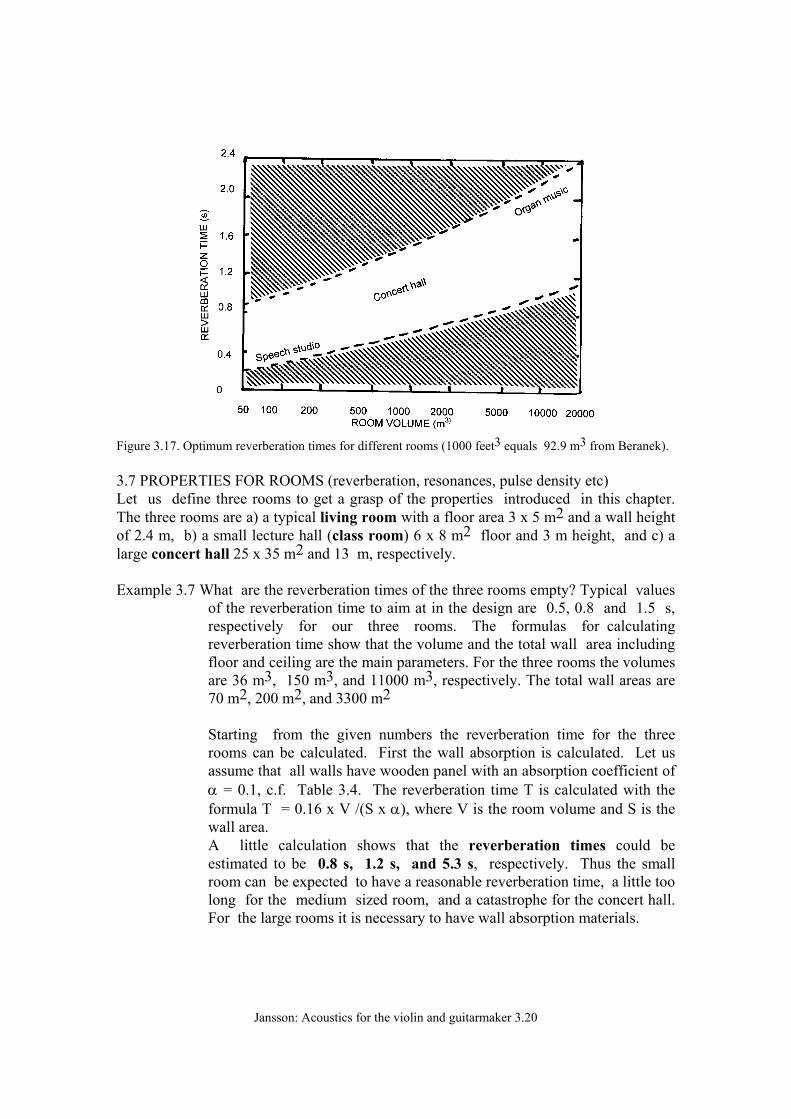
Figure 3.17. Optimum reverberation times for different rooms (1000 feet3 equals 92.9 m3 from Beranek). 3.7 PROPERTIES FOR ROOMS (reverberation, resonances, pulse density etc) Let us define three rooms to get a grasp of the properties introduced in this chapter. The three rooms are a) a typical living room with a floor area 3 x 5 m2 and a wall height of 2.4 m, b) a small lecture hall (class room) 6 x 8 m2 floor and 3 m height, and c) a large concert hall 25 x 35 m2 and 13 m, respectively. Example 3.7 What are the reverberation times of the three rooms empty? Typical values
of the reverberation time to aim at in the design are 0.5, 0.8 and 1.5 s, respectively for our three rooms. The formulas for calculating reverberation time show that the volume and the total wall area including floor and ceiling are the main parameters. For the three rooms the volumes are 36 m3, 150 m3, and 11000 m3, respectively. The total wall areas are 70 m2, 200 m2, and 3300 m2
Starting from the given numbers the reverberation time for the three rooms can be calculated. First the wall absorption is calculated. Let us assume that all walls have wooden panel with an absorption coefficient of α = 0.1, c.f. Table 3.4. The reverberation time T is calculated with the formula T = 0.16 x V /(S x α), where V is the room volume and S is the wall area. A little calculation shows that the reverberation times could be estimated to be 0.8 s, 1.2 s, and 5.3 s, respectively. Thus the small room can be expected to have a reasonable reverberation time, a little too long for the medium sized room, and a catastrophe for the concert hall. For the large rooms it is necessary to have wall absorption materials.
Jansson: Acoustics for the violin and guitarmaker 3.21
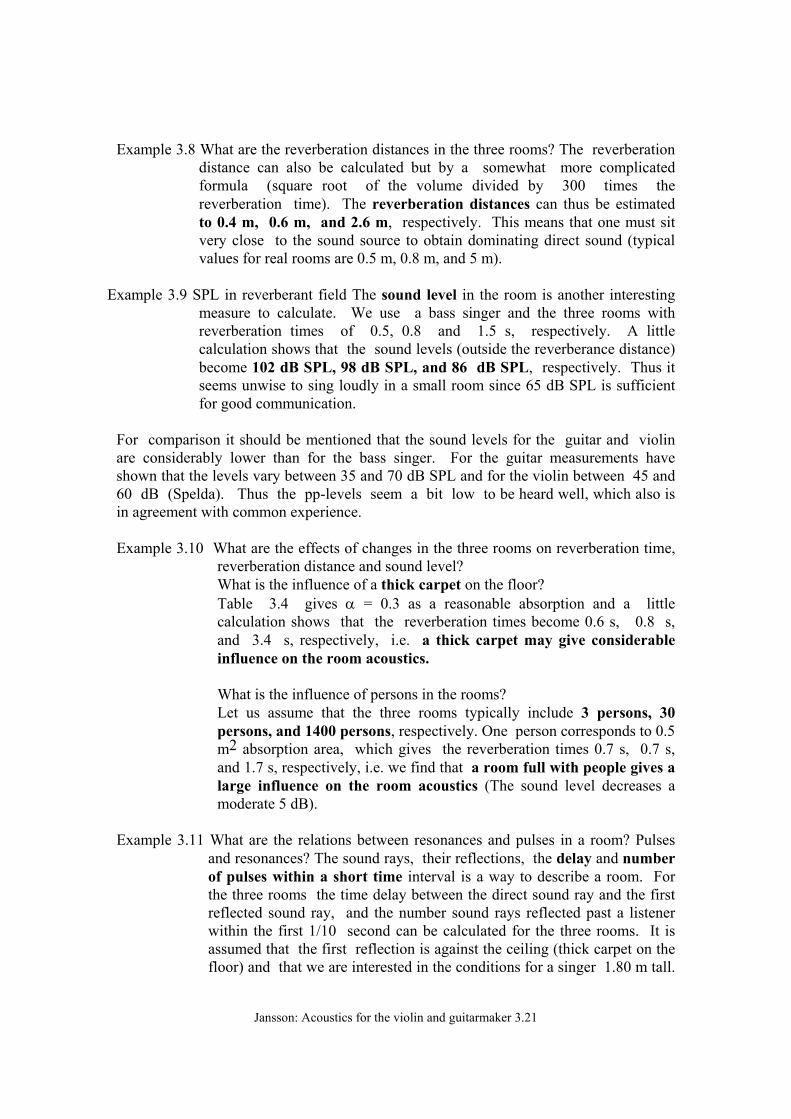
Example 3.8 What are the reverberation distances in the three rooms? The reverberation distance can also be calculated but by a somewhat more complicated formula (square root of the volume divided by 300 times the reverberation time). The reverberation distances can thus be estimated to 0.4 m, 0.6 m, and 2.6 m, respectively. This means that one must sit very close to the sound source to obtain dominating direct sound (typical values for real rooms are 0.5 m, 0.8 m, and 5 m).
Example 3.9 SPL in reverberant field The sound level in the room is another interesting
measure to calculate. We use a bass singer and the three rooms with reverberation times of 0.5, 0.8 and 1.5 s, respectively. A little calculation shows that the sound levels (outside the reverberance distance) become 102 dB SPL, 98 dB SPL, and 86 dB SPL, respectively. Thus it seems unwise to sing loudly in a small room since 65 dB SPL is sufficient for good communication.
For comparison it should be mentioned that the sound levels for the guitar and violin are considerably lower than for the bass singer. For the guitar measurements have shown that the levels vary between 35 and 70 dB SPL and for the violin between 45 and 60 dB (Spelda). Thus the pp-levels seem a bit low to be heard well, which also is in agreement with common experience. Example 3.10 What are the effects of changes in the three rooms on reverberation time,
reverberation distance and sound level? What is the influence of a thick carpet on the floor? Table 3.4 gives α = 0.3 as a reasonable absorption and a little calculation shows that the reverberation times become 0.6 s, 0.8 s, and 3.4 s, respectively, i.e. a thick carpet may give considerable influence on the room acoustics. What is the influence of persons in the rooms? Let us assume that the three rooms typically include 3 persons, 30 persons, and 1400 persons, respectively. One person corresponds to 0.5 m2 absorption area, which gives the reverberation times 0.7 s, 0.7 s, and 1.7 s, respectively, i.e. we find that a room full with people gives a large influence on the room acoustics (The sound level decreases a moderate 5 dB).
Example 3.11 What are the relations between resonances and pulses in a room? Pulses
and resonances? The sound rays, their reflections, the delay and number of pulses within a short time interval is a way to describe a room. For the three rooms the time delay between the direct sound ray and the first reflected sound ray, and the number sound rays reflected past a listener within the first 1/10 second can be calculated for the three rooms. It is assumed that the first reflection is against the ceiling (thick carpet on the floor) and that we are interested in the conditions for a singer 1.80 m tall.

Jansson: Acoustics for the violin and guitarmaker 3.22
Using the given measures shows that the first reflected sound ray will arrive 3 ms, 7 ms and 68 ms, respectively after the direct sound ray. Within the first 0.1 seconds 4800 pulses, 1150 pulses, and 14 pulses, respectively will have passed. We can thus see that in the small room the sound comes back quickly and many times within a short time. In the large hall the opposite conditions occur. It takes long time for the first reflected sound ray to arrive and there are few pulses within the first 0.1 seconds.
Another way to describe a room is by means of its resonances, the frequencies of the resonances and the density of resonances. A little calculation shows that the lowest resonant frequency is at 35 Hz, 22 Hz, and 5 Hz, respectively, Below 100 Hz the rooms have 7, 50 and 3700 resonances respectively. The numbers clearly show that the small room has a high first resonance frequency and few resonances while the concert hall has a very low first resonance frequency and a large number of resonances below 100 Hz.
With increased damping of the room the pulses and resonances become less clear but the numbers remain the same.
It has been shown that when the number of resonances are densely spaced compared to their bandwidths, then the room properties are determined by the density of the resonances and the reverberation time of the room. There exists a lower limit fg above which the room properties are so determined. Let us assume that the reverberation times for the three rooms are 0.5 seconds, 0.8 seconds and 1.5 seconds respectively. By using the formula for fg we find that fg equals 224 Hz, 139 Hz and 21 Hz, respectively. Thus the frequency limit is below the important frequency range for sound communication. 3.8 ACOUSTICS OF THE PODIUM (time delays, distance to walls and sound levels) The sound from the instruments of the fellow musicians is very important to be able to play together. Experiments have shown that the travel time for the sound from the fellow musician's instrument should if possible be within 0.03 s. The sound travels with a velocity of 345 m/s, which corresponds to 10 m in 0.03 s. The musicians of an orchestra thus should sit within a distance of 10 m from each others. For the symphony orchestra it is not possible to meet such a condition . Also the sounds that are reflected by reflectors lowered from the ceiling should give a travelling distance of less than 10 m. Some examples from Swedish investigations on acoustics for the symphony orchestra are presented in the following. Example 3.12. How long time does it take for the sound to travel between the players in
the Stockholm Concert Hall?

Jansson: Acoustics for the violin and guitarmaker 3.23
The travelling time for the sound can easily be calculated from the size of the podium ( time = (distance m)/ (345 m/s) ), c.f. Example 3.1 (or estimated from Table 3.1). The podium is approximately 17 m wide, 12 m deep and has reflectors 7 m above. The width measure gives a travelling time of 0.05 s, the depth 0.035 s and 0.06 s along the diagonal. The sound path via the ceiling reflectors varies from 0.02 to 0.07 s. The distances to the conductor position are more favourable: 0.025 s to the side walls, 0.04 s to the farthest corner and a maximum of 0.05 s via the ceiling reflectors. This means that the sound paths and the corresponding delays between extreme positions are too long, but are more reasonable for a central position.
The example 3.12 shows that fairly short distances give measurable time delays from source to listener. As a rule of thumb one may say that time differences of 0.01 s give noticeable sound effects. The position of the instrument groups in the orchestra can thus be most important for the players. The reverberation time is the most traditional measure of the acoustics of a room. Long reverberation time gives loud but non distinct sound. The reverberation of a sound disturbs the sound starting later. The reverberation time is set by the sound absorption at walls, ceilings and floors. On the podium the musicians of the orchestra should provide most of the absorption. From the reverberation time the reverberation distance also can be calculated, i.e., the distance within which the direct sound is stronger than the reverberation sound. Within this distance the sound level increases the closer one sits to the sound source. Example 3.13. What is the reverberation distance in the Stockholm Concert Hall?
The reverberation time for the concert hall is approximately 2 s (below 2 kHz), which gives a reverberation distance of 5 m. This means that the direct sound dominates within 5 m.
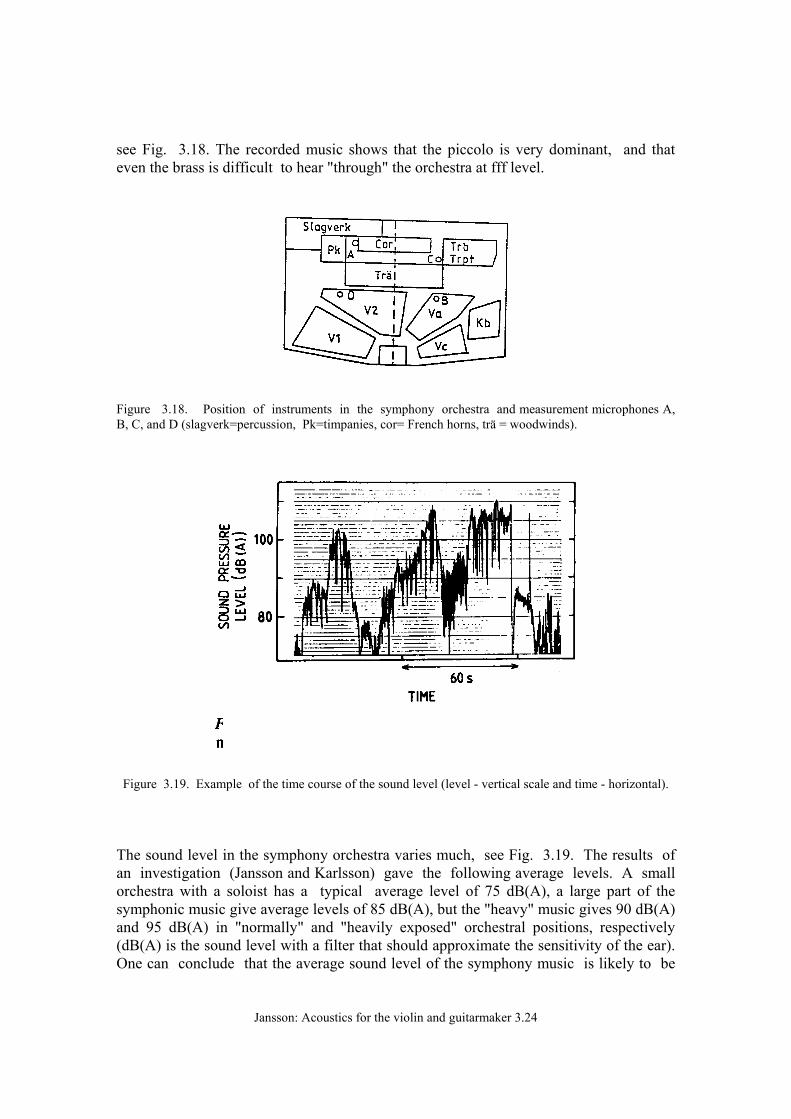
The musical instruments radiate the sound with different strengths in different directions, especially at high frequencies. The bell of the brass instruments act as a directional antenna and give a stronger sound straight ahead. Such a property affects the reverberation distance. For the trombone the reverberation distance should increase from approximately 7 m at 500 Hz to 20 m at 2500 Hz. A similar increase in reverberation distance should be expected for the trumpet from 900 Hz to 3500 Hz. This means that for high partial tones the "direct sound" will dominate "straight ahead" over the whole podium, while for the low partial tones the direct sound will dominate over a shorter distance. As a part of a series of experiments with the Stockholm Philharmonic Orchestra microphones were placed close to musicians with loud instruments: at the French horns before the timpanis (position A), at violas in front of oboes (position B), at bassoons in front of trumpets (position C) and at the second violins besides the piccolo (position D),
Jansson: Acoustics for the violin and guitarmaker 3.24
see Fig. 3.18. The recorded music shows that the piccolo is very dominant, and that even the brass is difficult to hear "through" the orchestra at fff level.
Figure 3.18. Position of instruments in the symphony orchestra and measurement microphones A, B, C, and D (slagverk=percussion, Pk=timpanies, cor= French horns, trä = woodwinds).
Figure 3.19. Example of the time course of the sound level (level - vertical scale and time - horizontal). The sound level in the symphony orchestra varies much, see Fig. 3.19. The results of an investigation (Jansson and Karlsson) gave the following average levels. A small orchestra with a soloist has a typical average level of 75 dB(A), a large part of the symphonic music give average levels of 85 dB(A), but the "heavy" music gives 90 dB(A) and 95 dB(A) in "normally" and "heavily exposed" orchestral positions, respectively (dB(A) is the sound level with a filter that should approximate the sensitivity of the ear). One can conclude that the average sound level of the symphony music is likely to be
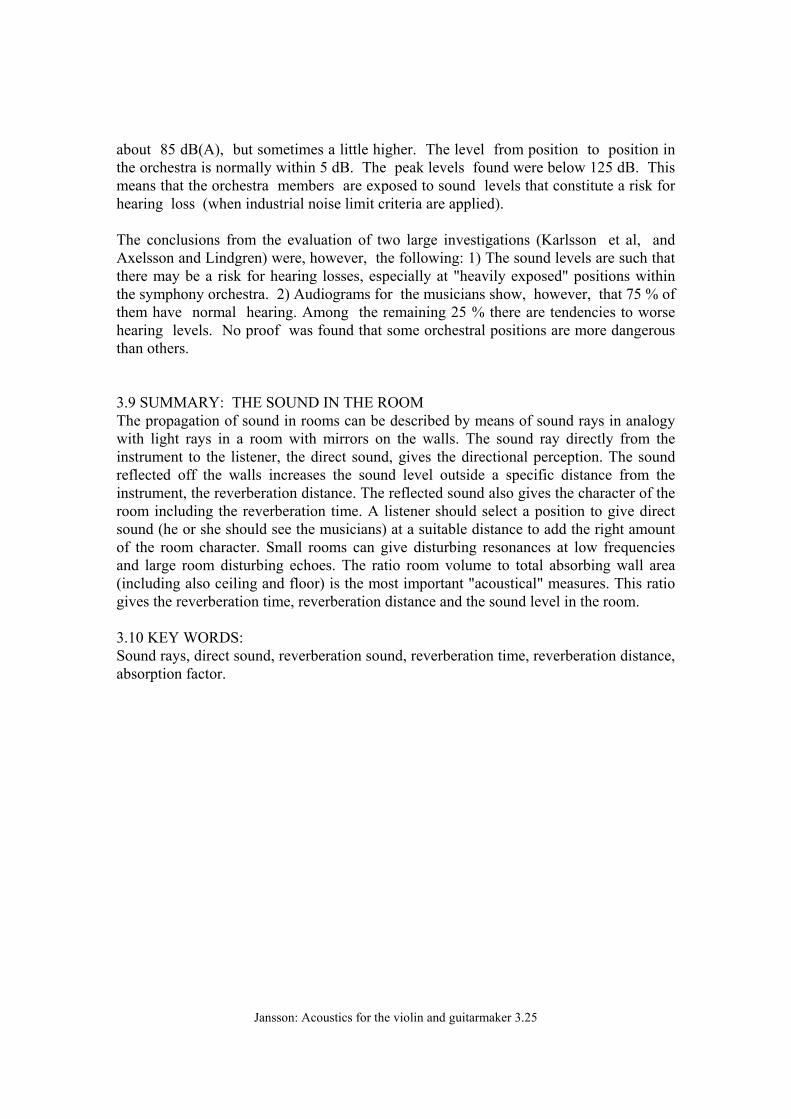
Jansson: Acoustics for the violin and guitarmaker 3.25
about 85 dB(A), but sometimes a little higher. The level from position to position in the orchestra is normally within 5 dB. The peak levels found were below 125 dB. This means that the orchestra members are exposed to sound levels that constitute a risk for hearing loss (when industrial noise limit criteria are applied). The conclusions from the evaluation of two large investigations (Karlsson et al, and Axelsson and Lindgren) were, however, the following: 1) The sound levels are such that there may be a risk for hearing losses, especially at "heavily exposed" positions within the symphony orchestra. 2) Audiograms for the musicians show, however, that 75 % of them have normal hearing. Among the remaining 25 % there are tendencies to worse hearing levels. No proof was found that some orchestral positions are more dangerous than others. 3.9 SUMMARY: THE SOUND IN THE ROOM The propagation of sound in rooms can be described by means of sound rays in analogy with light rays in a room with mirrors on the walls. The sound ray directly from the instrument to the listener, the direct sound, gives the directional perception. The sound reflected off the walls increases the sound level outside a specific distance from the instrument, the reverberation distance. The reflected sound also gives the character of the room including the reverberation time. A listener should select a position to give direct sound (he or she should see the musicians) at a suitable distance to add the right amount of the room character. Small rooms can give disturbing resonances at low frequencies and large room disturbing echoes. The ratio room volume to total absorbing wall area (including also ceiling and floor) is the most important "acoustical" measures. This ratio gives the reverberation time, reverberation distance and the sound level in the room. 3.10 KEY WORDS: Sound rays, direct sound, reverberation sound, reverberation time, reverberation distance, absorption factor.

Jansson: Acoustics for the violin and guitarmaker 3.26
3.11 APPENDIX. RELATIONS BETWEEN SOUND PRESSURE LEVEL AND SOUND PRESSURE Generally the strength of a sound is given in sound pressure level, dB. But in many cases the strength is given in sound pressure. The relation between sound pressure P and the sound pressure level L is given by the relation L = 20 log ( P / Po ), where Po is the reference for sound pressure = 0.000 02 Pa ( Pa is Pascal = N/m2 ). Differences in sound pressure level corresponds to ratios in sound pressure. To convert differences of sound pressure level to ratios of sound pressure (and vice versa) the following transformation table has been calculated Table 3.9: Relations between sound pressure level and sound pressure
Level difference dB Sound pressure ratio Level difference dB Sound pressure ratio 0 1:1 + 1 (-1) 1.1:1 (1:1.1) +11 (-11) 3.5:1 (1:3.5) + 2 (-2) 1.3:1 (1:1.3) +12 (-12) 4.0:1 (1:4.0) + 3 etc 1.4:1 etc +13 etc 4.5:1 etc + 4 1.6:1 +14 5.0:1 + 5 1.8:1 +15 5.6:1 + 6 2.0:1 +16 6.3:1 + 7 2.2:1 +17 7.1:1 + 8 2.5:1 +18 7.9:1 + 9 2.8:1 +19 8.9:1 +10 3.2:1 +20 10:1
Level difference dB Sound pressure ratio + 20 (-20) 10:1 (1:10) + 40 (-40) 100:1 (1:100) + 60 etc 1 000:1 (1:1000)etc + 80 10 000:1 +100 100 000:1 +120 1 000 000:1 Example 3.20: Which sound pressure corresponds to 67 dB sound pressure level? +67 dB = 60 + 7 dB i.e. (1 000:1) x (2.2:1) = 2 200:1 and 2 200 x 0.000 02 = 0.044 Pa Example 3.21: Which sound pressure corresponds to -26 dB sound pressure level? -26 dB = -20 - 6 dB i.e. (1:10) x (1:2) = 1:20 and 0.000 02 x (1:20) = 0.000 001 Pa Example 3.22: Which sound pressure level corresponds to the sound pressure 3.6 Pa? 3.6 Pa i.e. (3.6:0.000 02) = 180 000 = 1.8 x (100 000:1) and 5 + 100 dB = 105 dB


![28860546 Contemporary Czech Violin Makers 08 2007[1]](https://img.dokumen.tips/doc/110x75/54800302b4795955578b45a5/28860546-contemporary-czech-violin-makers-08-20071.jpg)