Embed Size (px)
Citation preview

Acoustical studies of ternary liquid mixtures of 2-aminothiazole in DMF-Water at different temperatures
P. B. Morey1, A. B. Naik2
Department of Chemistry, Vidya Bharti Science College, Karanja (Lad), (M.S.) ,India
Department of Chemical Technology, S.G.B .Amravati University. Amravati, (M.S), India
Email: [email protected]; [email protected]
Keywords: Thermo-acoustic, 2-aminothiazole, ultrasonic velocity, density, adiabatic compressibility, ternary mixture, DMF, molecular interaction.
ABSTRACT. The nature and the relative strength of the intermolecular interaction between the
components of the liquid mixtures have been successfully investigated by ultrasonic method. In
present study, the densities (ρ), ultrasonic velocities (u), viscosity(ɳ) and refractive index(nD) in a
ternary liquid mixture of 2-aminothiazole with N,N-dimethylformamide (DMF) in water have been
measured at 303.15, 308.15, 313.15,318.15 and 323.15 K respectively, over the entire composition
range by using densitometer, ultrasonic interferometer, viscometer and refractmeter respectively.
The measured data have been used to compute the various thermo-acoustic parameters using the
standard relations namely, adiabatic compressibility (βs), intermolecular free length (Lf), specific
acoustic Impedance (Z),Wada constant (W), molar sound velocity(R), relative association (RA),
apparent molar compressibility( ),apparent molar volume( V )viscosity relaxation time(Г),
absorption coefficient,
internal pressure (ᴨ),free volume (Vf),Gibb̓ s free energy(∆G) and specific
refraction (r), etc. The results have been analyzed on the basis of variation in thermodynamic
parameters. These parameters are useful for explaining the molecular association and interaction
between the components of ternary liquid mixtures. The variation in densities and ultrasonic
velocities with concentrations in the system show similar trends for evaluated parameters of the
constituents in ternary mixture at different temperatures. The results have been interpreted in terms
of solute-solvent and solvent-solvent interaction.
1. INTRODUCTION In the historical development of organic chemistry, nitrogen and sulphur heterocyclic
compounds have maintained the interest of researchers in the last decades, some most common
nitrogen heterocycles are thiazoles and thiadiazoles. The wide spread applications of thiazole in the
agrochemical industries and medicinal chemistry proves this moiety is an important bioactive class
of heterocycles 1. Different methods like di-electric, magnetic resonance, infrared and Raman effect
are used to study molecular interaction and different solution properties. Likewise, ultrasonic
method has been extensively used by many workers to study the molecular interactions and
physicochemical behavior in liquid mixtures2-3
. The study of thermodynamic properties of mixtures
provides good measure of solute –solvent interactions. The experimental data of thermo acoustical
properties of liquid and liquid mixtures are fascinating and highly fundamental and practically
important in chemical industry and engineering design 4. In continuation of our research work,
present study reported the results of ultrasonic study of the ternary mixture of 2-aminothiazole with
DMF-water solvent in entire composition range, at five different temperatures. 2-aminothiazole is
used as an intermediate for dyestuff, in photographic chemicals, in medicinal chemistry and its
derivatives can find application for treatment gastric ulcer and cancer etc5. DMF is an aprotic
protophilic and polar solvent used widely in industrial processes, including manufacturing of
synthetic fibers, leather, films and in surface coating6-8
. DMF is of particular interest solvents
because any significant structural affects are absent due to lack of hydrogen bond. DMF is a stable
compound having strong electron-pair donating and accepting capacity, It has large dipole moment
and high dielectric constant (μ=3.24 Debey and ε=36.71at 298K) 9
. It is widely used in studies of
solvent reactivity relationships 10-11
. An exhaustic survey of literature has shown that a few attempts
International Letters of Chemistry, Physics and Astronomy Online: 2015-09-14ISSN: 2299-3843, Vol. 59, pp 188-198doi:10.18052/www.scipress.com/ILCPA.59.1882015 SciPress Ltd, Switzerland
SciPress applies the CC-BY 4.0 license to works we publish: https://creativecommons.org/licenses/by/4.0/

have been made for ultrasonic velocity data for ternary liquid mixtures in DMF solvent.12
.
However, no effort have been made for the ultrasonic and thermodynamic studies for ternary
mixture of 2-aminothiazole with DMF in water. The present study was undertaken in order to have
deeper understanding of the intermolecular interaction between the components of ternary liquid
mixtures. Using the experimental values of ultrasonic velocity (u), density (ρ),viscosity(ɳ) various
thermo acoustical parameters such adiabatic compressibility (βs), Intermolecular free length (Lf),
Specific acoustic Impedance (Z),Wada constant (W), molar sound velocity(R), relative association
(RA), apparent molar compressibility ( ), apparent molar volume ( V )viscosity relaxation
time(Г), absorption coefficient,
internal pressure (ᴨ),free volume (Vf),Gibb̓ s free energy(∆G) and
specific refraction (r),have been estimated using standard relations. These thermo-acoustic
parameters of pure components and mixtures are being used to investigate the molecular packing,
molecular motions and various intermolecular interactions and their strength, influenced by the size
in pure components and in the mixtures13
. The results are interpreted in predicting nature and
strength of molecular association between the components of the liquid mixtures.
2. MATERIALS AND METHODS Materials: In present study, used solute 2-aminothiazole ( Hi-Media) and solvent DMF( Fisher
Scientific) were analytical (AR) and spectroscopic reagent (SR) grade. They were used without
further purification.
Method: The mass of sample was measured using digital electronic balance (Model SHIMADZU
AUY-220, Japan,) with precision of ±0.1 mg. The required ternary mixtures were prepared over the
entire range of compositions in DMF -water solvent and kept in air tight flask.The densities of pure
liquids and ternary mixtures were measured with portable digital densitometer (Anton Paar, DMA-
35, Austria).The average uncertainty in measurement in the measured density is ± 5x10⁻³
kgm-3
.
The ultrasonic velocity of pure and liquid mixtures was measured using multi-frequency ultrasonic
interferometer (Model: F-81S, Mittal Enterprises, New Delhi,) operating at 2 MHz’s frequency at
five different temperatures and overall accuracy of ±2 m/s.The instruments was calibrated by
measuring the celocity of benzene and carbon tetrachloride. In the present work, Ostwald
viscometer (10 ml) is used to measure the viscosity of pure liquid and mixtures and efflux time was
measured using a RACER digital chronometer within a precision of ± 0.01 sec. R.I. was measured
with Abbe refractometer (Atago DR-A-1 Japan). The measured values are agreed closely with
literature values.
The density (ρ), ultrasonic velocity (u) viscosity (ɳ) and R.I. of pure liquids and ternary mixtures
were measured at 303.15, 308.15, 313.15, 318.15 and 323.15K temperatures. The temperature was
controlled through the water circulating around the liquid cell using thermostatically controlled
High Precision water bath MSW-274(Macro scientific work pvt. Ltd. Delhi) with an uncertainty of
±0.3oc.
3. THEORY AND CALCULATIONS:
The data of density (ρ), ultrasonic velocity (u) viscosity (ɳ) and R.I. has been used to evaluate
many acoustical parameters by using the following standard expressions for understanding
solute-solvent, solvent-solvent interaction and structural changes.
(i) Adiabatic compressibility:- 2
1s
s su
(1)
Where s density of solution, su sound velocity.
(ii) Intermolecular free length )( fL :- f sL K (2)
Where ‘K’ is a temperature dependent constant known as Jacobson constant (m)
.
(iii) Specific acoustic impedance(Z):- s sZ u (3)
International Letters of Chemistry, Physics and Astronomy Vol. 59 189

(iv) Wada’s constant )(W :-1
7s
s
MW
(4)
Where ‘M’ molar mass of the solution.
(v) Molar sound velocity or Rao’s constant )(R :- 13s
s
MR u
(5)
(vi) Relative association )( AR :- 1
3
s oA
o s
d uR
d u
(6)
Where o = density of solvent, uo = velocity of solvent
(vii) Apparent molar compressibility ( ): 00
0
1000( )o
o
M
m
(7)
(viii) Apparent molar volume ( V ):- 0
1000( )V o
o
M
m
(8)
(ix) Relative viscosity (ɳ):- .s s
r w
w w
d t
d t
(9)
(x) Viscosity relaxation time:-
2
4
3 .u
(10)
(xi)Absorption coefficient:
2
2
8( / 2)
3coeffAbs a f
u
(11)
(xii) Internal pressure ( i ):-
2132
76
.i
eff
KbRT
u M
(12)
(xiii) Free volume (fV ):-
32
.
eff
f
M uV
K
(13)
‘k’ is temperature independent constant equal to 4.28x10 9 for all liquids.
(xiv) Gibb’s free energy ( G ) was calculated from the relation;
. .log
K TG KT
(14)
‘K’ Boltzmann constant, ‘ħ’ is Planck constant and Γ relaxation time.
(xv)The specific refraction is defined and calculated by the following equation; 2
2
1 1
2
nr
n
(15)
5. RESULTS AND DISCUSSION
The experimental values of density, ultrasonic velocity, viscosity and R.I. for 2-amino
thiazole with DMF in water are presented in Table 1. The some of the calculated thermo-acoustics
parameters are given in Table 2-3.In order to understand reaction kinetics of ternary mixture,
tabulated values of thermo-acoustic parameters are graphically represented in Figures 1-17.
190 ILCPA Volume 59

Table 1 Density, velocity, viscosity, refractive index of 2-amino thiazole with DMF in water at 303.15,
308.15, 313.15, 318.15 and 323.15 k. Conc. (ρ) kg m-3 (u) m s-1 ɳ x10-3 Nsm-2) nD
T=303.15K
0.000 985.47 1627.6 1.7451 1.4073
0.002 985.9 1629.6 1.8523 1.4071
0.004 986.5 1631.4 1.7891 1.4072
0.006 987.4 1633.8 1.7556 1.4072
0.008 987.9 1635.3 1.7262 1.4075
0.01 988.6 1636.8 1.6806 1.4077
T=308.15K
0.000 979.9 1605.5 1.69 1.4054
0.002 981.9 1610.3 1.73 1.4052
0.004 982.92 1612.8 1.71 1.4055
0.006 983.58 1614.9 1.67 1.4056
0.008 984.31 1617.2 1.61 1.4056
0.01 984.96 1618.9 1.58 1.4057
T=313.15K
0.000 974.78 1580.6 1.4443 1.404
0.002 975.97 1583.2 1.4943 1.4035
0.004 976.92 1587.2 1.4796 1.4037
0.006 977.65 1591.6 1.4478 1.4038
0.008 978.32 1595.6 1.4158 1.4039
0.01 978.89 1598.8 1.3684 1.4044
T=318.15K
0.000 968.8 1576.5 1.2006 1.4021
0.002 969.89 1579.6 1.2621 1.4018
0.004 970.93 1584.2 1.2626 1.4019
0.006 971.78 1586.3 1.2333 1.4021
0.008 972.4 1587.6 1.1888 1.4022
0.01 972.97 1588.7 1.1295 1.4023
T=323.15K
0.000 964.27 1569.6 1.1351 1.4008
0.002 964.87 1577.2 1.1661 1.3993
0.004 965.93 1580.6 1.1512 1.3994
0.006 966.89 1582 1.1221 1.3996
0.008 967.98 1585.6 1.0782 1.3997
0.01 968.84 1586.6 1.049 1.4001
Table 2 Adiabatic compressibility, free length, acoustic impedance, Wada const., molar sound velocity,
relative association and app. mol. compressibility of 2-aminothiozole with DMF in water at different
temperatures. Conc. βs x
10-10 N-1 m-2
Lf x
10-11 m
Z x
10 6 kgm2s-1
Wx10-1
m3Pas-8/7 mol-1
R (m3/mol)
(m/s)1/3
RA Φβ
T=303.15K
0.000 3.8306
4.0611 1.6040 9.8988 0.5258 1.0000 _-
0.002 3.8195
4.0553 1.6066 9.8985 0.5258 1.0000 -6.3941x10⁻⁷
0.004 3.8087
4.0496 1.6094 9.8965 0.5257 1.0003 -3.6901x10⁻⁷
0.006 3.7941
4.0418 1.6132 9.8929 0.5255 1.0007 -3.6837x10⁻⁷
0.008 3.7852
4.0371 1.6155 9.8912 0.5254 1.0009 -2.2741 x10⁻⁷
0.010 3.7756 4.0319 1.6181 9.8878 0.5252 1.0013 -2.1601x10⁻⁶
T=308.15K
International Letters of Chemistry, Physics and Astronomy Vol. 59 191

0.000 3.959 4.1665 1.5732 9.9082 0.5264 1.0010 -_ 0.002 3.928 4.1499 1.5812 9.8993 0.5259 1.0010 -1.9997x10
-6 0.004 3.911 4.1413 1.5853 9.8949 0.5256 1.0016 -7.1225 x10
-7 0.006 3.899 4.1345 1.5884 9.8929 0.5255 1.0018 -4.5965 x10
-7 0.008 3.885 4.1271 1.5918 9.8906 0.5253 1.0021 3.9841 x10
-11 0.010 3.874 4.1214 1.5946 9.8880 0.5252 1.0024 -3.0840 x10
-6
T=313.15K
0.000 4.1063 4.2757 1.5407 9.9084 0.5264 1.0007 -_ 0.002 4.0878 4.2661 1.5452 9.9027 0.5261 1.0007 -1.1909x10
-6 0.004 4.0633 4.2533 1.5506 9.9016 0.5260 1.0008 -8.4748 x10
-7 0.006 4.0378 4.2399 1.5560 9.9031 0.5261 1.0006 -6.2983x10
-7 0.008 4.0149 4.2278 1.5610 9.9044 0.5262 1.0005 2.5540 x10
-11 0.01 3.9965 4.2181 1.5650 9.9051 0.5262 1.0004 -3.5610x10
-6
T=318.15K
0.000 4.1532 4.3408 1.5273 9.9534 0.5292 1.0005 -_ 0.002 4.1322 4.3298 1.5320 9.9494 0.5290 1.0005 -1.3070x10
-6 0.004 4.1039 4.3149 1.5381 9.9486 0.5289 1.0006 -8.3454 x10
-7 0.006 4.0894 4.3073 1.5415 9.9449 0.5287 1.0010 -3.0534 x10
-7 0.008 4.0801 4.3024 1.5438 9.9418 0.5285 1.0014 4.2270 x10
-11 0.010 4.0721 4.2982 1.5458 9.9387 0.5283 1.0017 -2.5970x10
-6
T=323.15K
0.000 4.2094 4.4111 1.5135 9.9810 0.5309 0.9990 - 0.002 4.1664 4.3885 1.5218 9.9894 0.5315 0.9990 -2.3438 x10
-6 0.004 4.1439 4.3767 1.5267 9.9862 0.5313 0.9994 -6.9154 x10
-7 0.006 4.1325 4.3706 1.5296 9.9802 0.5309 1.0001 -2.6476 x10
-7 0.008 4.1091 4.3582 1.5348 9.9771 0.5307 1.0005 4.2916x10
-11 0.010 4.1003 4.3536 1.5372 9.9713 0.5303 1.0011 -2.8830 x10
-6
Table 3 app. Molar volume, viscosity relaxation time, Abs. coefficient, internal pressure, free volume,
Gibb’s free energy and specific refraction of 2-aminothiozole with DMF in water at different
temperatures Conc. ΦV x 10-3m3
mol-1
Abs Coeff(a)
x10-10
∏I x
107 Nm-2 V f x10-8m3
mol -1
X10-20 r x10-4
ᴦx 10-10s np.m-1 KJ mol-1
T=303.15K
0.000 _ 8.9129 8.9127 1.2703 1.6506 1.5698 2.4996 0.002 -2.1900x10 2 9.4331 9.4329 1.3084 2.7249 1.5801 2.4974 0.004 -1.5233x10 2 9.0856 9.0854 1.2857 2.8753 1.5733 2.4964 0.006 -1.5197x10 2 8.8812 8.8810 1.2734 2.9645 1.5691 2.4941 0.008 -6.3079x10 1 8.7121 8.7119 1.2625 3.0448 1.5656 2.4945 0.010 -7.0745x10 2 8.4604 8.4602 1.2458 3.1739 1.5603 2.4938
T=308.15K
0.000 _ 8.9254 8.9252 1.2543 3.0554 1.5989 2.5034 0.002 -1.0289x10 3 9.0406 9.0404 1.2672 2.9747 1.6013 2.4972 0.004 -2.6104x10 2 8.9178 8.9175 1.2611 3.0246 1.5988 2.4963 0.006 -1.1225x10 2 8.6547 8.6545 1.2441 3.1542 1.5932 2.4952
192 ILCPA Volume 59

From the table 1 and fig. 1, 2 and 3 noted that density, ultrasonic velocity increases and
viscosity decreases with increase in concentration of solute. The linear behavior with increase in
velocity with concentration indicates the interaction between unlike molecule, which suggests
powerful solute-solvent interaction between the component molecules. As density increases number
of solute particles in the given region increases, this leads to quick transfer of sound velocity and
hence ultrasonic velocity increases with increase in concentration14
. It shows reverse trends with
increase in temperatures in ultrasonic velocity and density, it indicate molecular forces are
weakening at high temperature. The change in ultrasonic velocity can be explained by a model
presented by Eyring and Kincaid15
. The increase in ultrasonic velocity is structure making type.
From table 2 and fig.4-5. Increase in concentration of thiazole results the linearly decreases in
adiabatic compressibility and free length. This trend supports strong solute-solvent interaction and
suggests aggregation of solvent molecules around solute molecules16-17
. The magnitude of adiabatic
compressibility and free length increases with increase in temperature, it clearly reveal that
interaction become weaker at higher temperature18
. The decreases in free length with increase in
molar concentration suggest there are good agreements with model of Eyring and Kincaid. The
specific acoustic impedance is the parameter related to the elastic properties of the medium. The
specific acoustic impedance is the impedance offered to the sound wave by the components of the
mixture.In our present investigation (Fig.6), specific acoustic impedance increase with increase in
concentration. This trend further supports the possibility of molecular interaction due to H-bonding
between solute-solvents and solvent-solvent molecules which restrict the free flow of sound
waves19
. The specific acoustic impedance is directly proportional to density, ultrasonic velocity and
inversely proportional adiabatic compressibility 20
.
From Fig. 7-8, the molar compressibility and Molar sound velocity nonlinearly decreases with
increase in concentration which indicates that the magnitude of molecular interaction is enhanced in
the system, which indicate interaction between solute-solvent molecule increases. This leads to tight
packing of the medium by increases the molecular interactions21
.
0.008 1.0181 x10⁻¹ 8.3435 8.3433 1.2235 3.3215 1.5865 2.4933
0.010 -6.6174x10 2 8.1537 8.1534 1.2111 3.4294 1.5822 2.4922
T=313.15K
0.000 _ 7.9076 7.9074 1.1643 3.7805 1.6052 2.5089
0.002 -6.1913x10 2 8.1446 8.1444 1.1842 3.6012 1.6107 2.5031
0.004 -2.4610x10 2 8.0161 8.0159 1.1777 3.6688 1.6077 2.5018
0.006 -1.2569x10 2 7.7946 7.7944 1.1639 3.8061 1.6025 2.5005
0.008 1.0243 x10⁻¹ 7.5790 7.5788 1.1501 3.9508 1.5972 2.4993
0.010 -5.8746x10 2 7.2917 7.2915 1.1299 4.1703 1.5899 2.5006
T=318.15K
0.000 _ 6.6484 6.6482 1.0585 4.9687 1.6008 2.5139
0.002 -5.7417x10 2 6.9537 6.9535 1.0850 4.6236 1.6093 2.5094
0.004 -2.7279x10 2 6.9087 6.9085 1.0845 4.6410 1.6081 2.5073
0.006 -1.4816x10 2 6.7246 6.7245 1.0717 4.8170 1.6030 2.5062
0.008 1.0305 x10⁻¹ 6.4673 6.4671 1.0522 5.0962 1.5955 2.5052
0.010 -5.9463x10 2 6.132 6.1324 1.0257 5.5085 1.5854 2.5042
T=323.15K
0.000 - 6.3708 6.3707 1.0283 5.3695 1.6207 2.5185
0.002 -3.1915x10 2 6.4779 6.4777 1.0401 5.1943 1.6239
0.004 -2.8093x10 2 6.3606 6.3605 1.0331 5.3126 1.6203 2.5064
0.006 -1.6907x10 2 6.1827 6.1826 1.0202 5.5279 1.6149 2.5050
0.008 1.0357 x10⁻¹ 5.9072 5.9071 9.9967 5.8890 1.6060 2.5028
0.010 -9.0515x10 2 5.7349 5.7348 9.8631 6.1424 1.6003 2.5028
International Letters of Chemistry, Physics and Astronomy Vol. 59 193

Relative association is the measure of extent of association of components in the medium. The
relative association is depends on either breaking up of the solvent molecules on addition of solute
to it or the salvation of present ions. From Fig. 9 the relative association increases with increase in
concentration. The increasing trend indicates there is a salvation of present solute ions22
.
From Fig.10-11, the apparent molar compressibility and apparent molar volume nonlinearly
decreases and increases with increase in concentration which indicate interaction between solute-
solvent molecules enhanced. Some values are positive due to the compressibility of solvent due to
the weak electrostatic force in the vicinity of ions. This trends supports that the availability of more
number of components in a given regions of space. This leads to tight packing of the medium and
there by increases the interactions23
.
The viscosity relaxation time is the time required for the excitation energy to appear as
translational energy. In present work (fig.12) viscosity relaxation time non-linearly varies with
increase in molar concentration and decreases with increases in temperature. Where, with increase
in temperature, it shows the instantaneous conversion of excitation energy to translational energy.
This indicates strong molecular interaction between the solute and solvent molecules, where it show
the instantaneous conversion of excitation energy to translational energy24
. From table 3 and fig.13
absorption coefficient decreases with increase in concentration and this trend suggest that the extent
of complexity decreases with increase in concentration25
.
The internal pressure is a measure of cohesive forces between the constituent’s molecules in
liquids. The internal pressure is an inverse function of free volume. The internal pressure for a
given system (fig.14) decreases with increase in concentration of solute, which indicate decrease in
London force (cohesive forces) which leading to breaking the structure of solute. This suggests
there is a weak interaction between the solute and solvent moleculesor there is an decrease in the
extent of complexation with increase in concentration 26
.
The free volume increases (fig.15) with increase in concentration of solute and temperature.
This increasing trend is due to stronger intramolecular interaction than intermolecular interaction
which attribute to lose packing of molecules inside the shield, this suggest weak molecular
interaction in components of mixtures 27
. The Gibbs free energy (fig.16) decrease with increase in
molar concentrations of 2-aminothiazole and increases with increase in temperatures. The increase
in Gibbs free energy (∆G) with temperature suggests longer time for rearrangement of molecules in
the mixture 28
. The decreasing positive values of Gibbs free energy (∆G) suggest the molecular
dissociations 29
.
Specific refraction depends on molecular weight and nature of liquids. The specific refraction
fig.17 decreases with increase in molar concentration and with increase in temperatures. That means
inter molecular interactions among the components are very weak30
.
Figure 1.Density Vs Concentration Figure 2.Velocity Vs Concentration
960
965
970
975
980
985
990
0.000 0.010 0.020
De
nsi
ty k
gm-3
Mol.conc.
303.15K
308.15K
313.15K
318.15K
323.15K1560157015801590160016101620163016401650
0.000 0.005 0.010 0.015
Vel
oci
ty,
m/s
Mol. Conc.
303.15K
308.15K
313.15K
318.15K
323.15K
194 ILCPA Volume 59

Figure 3. Viscosity Vs Concentration Figure 4. Adiab. Comp. Vs Concentration
Figure 5. Free length Vs Concentration Figure 6. Acoustic impd. Vs Concentration
Figure 7.Molar compr. Vs Concentration Figure 8. Mol. S. velocity Vs Concentration
9.88E-019.90E-019.92E-019.94E-019.96E-019.98E-011.00E+00
0.000 0.020
Mo
l.C
om
p.m
3 P
a-8
/7 m
ol-1
Mol,Conc.
303.15K
308.15K
313.15K
318.15K
323.15K0.5240.5250.5260.5270.5280.5290.53
0.5310.532
0.000 0.010 0.020
Mo
l.So
un
d V
el.
(m3 /
mo
l)
(m/s
)1/3
Mol.Conc.
303.15K
308.15K
313.15K
318.15K
323.15K
00.20.40.60.81
1.21.41.61.82
0.000 0.010 0.020
Vis
cosi
ty,
Nsm
-2
Mol.Conc.
303.15K
308.15K
313.15K
318.15K
323.15K
3.70E-10
3.80E-10
3.90E-10
4.00E-10
4.10E-10
4.20E-10
4.30E-10
0.000 0.010 0.020
Ad
ib.C
om
p.,
N-1
m2
Mol.Conc
303.15K
308.15K
313.15K
318.15K
323.15K
4.00E-114.05E-114.10E-114.15E-114.20E-114.25E-114.30E-114.35E-114.40E-114.45E-11
0.000 0.010 0.020
Fre
e L
en
gth
, m
Mol.Conc.
303.15K
308.15K
313.15K
318.15K
323.15K1.50E+061.52E+061.54E+061.56E+061.58E+061.60E+061.62E+061.64E+06
0.000 0.010 0.020Aco
ust
ic im
pe
de
nce
Mol. conc.
303.15K
308.15K
313.15K
318.15K
323.15K
International Letters of Chemistry, Physics and Astronomy Vol. 59 195
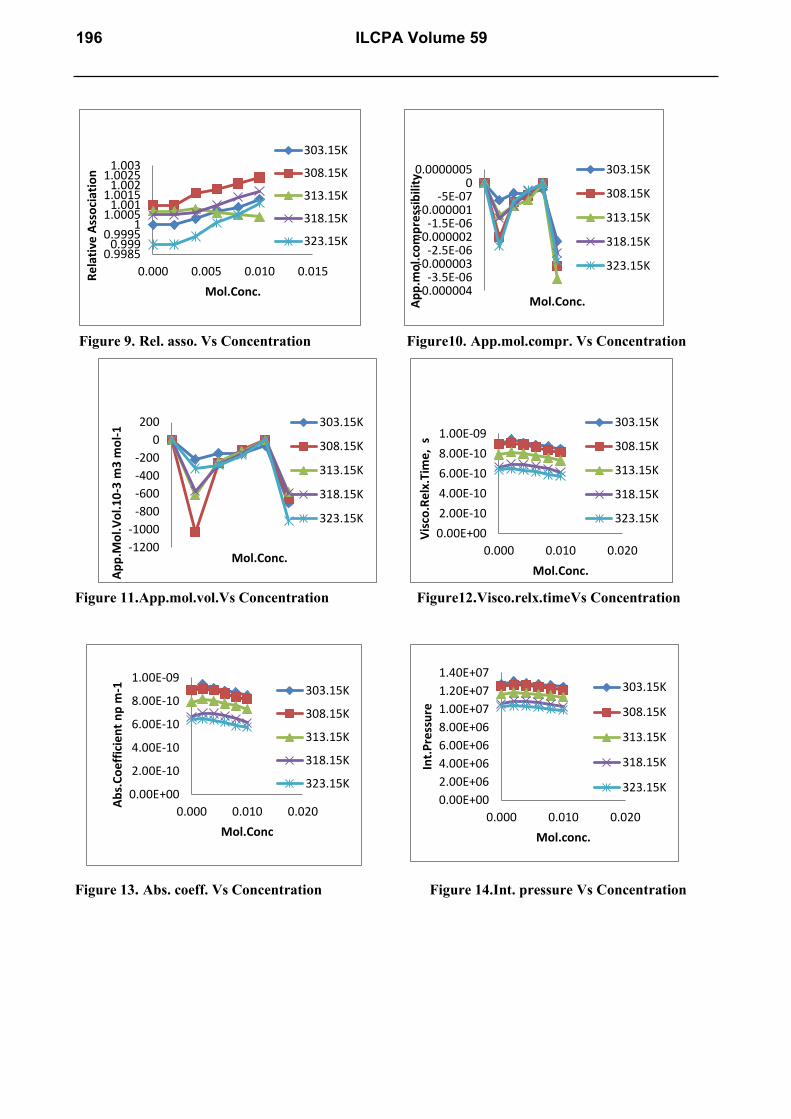
Figure 9. Rel. asso. Vs Concentration Figure10. App.mol.compr. Vs Concentration
Figure 11.App.mol.vol.Vs Concentration Figure12.Visco.relx.timeVs Concentration
Figure 13. Abs. coeff. Vs Concentration Figure 14.Int. pressure Vs Concentration
0.99850.999
0.99951
1.00051.001
1.00151.002
1.00251.003
0.000 0.005 0.010 0.015Re
lati
ve A
sso
ciat
ion
Mol.Conc.
303.15K
308.15K
313.15K
318.15K
323.15K
-1200
-1000
-800
-600
-400
-200
0
200
Ap
p.M
ol.
Vo
l.1
0-3
m3
mo
l-1
Mol.Conc.
303.15K
308.15K
313.15K
318.15K
323.15K0.00E+00
2.00E-10
4.00E-10
6.00E-10
8.00E-10
1.00E-09
0.000 0.010 0.020
Vis
co.R
elx
.Tim
e,
s
Mol.Conc.
303.15K
308.15K
313.15K
318.15K
323.15K
0.00E+00
2.00E-10
4.00E-10
6.00E-10
8.00E-10
1.00E-09
0.000 0.010 0.020
Ab
s.C
oe
ffic
ien
t n
p m
-1
Mol.Conc
303.15K
308.15K
313.15K
318.15K
323.15K0.00E+00
2.00E+06
4.00E+06
6.00E+06
8.00E+06
1.00E+07
1.20E+07
1.40E+07
0.000 0.010 0.020
Int.
Pre
ssu
re
Mol.conc.
303.15K
308.15K
313.15K
318.15K
323.15K
-0.000004-3.5E-06
-0.000003-2.5E-06
-0.000002-1.5E-06
-0.000001-5E-07
00.0000005
Ap
p.m
ol.
com
pre
ssib
ility
Mol.Conc.
303.15K
308.15K
313.15K
318.15K
323.15K
196 ILCPA Volume 59

Figure 15. Free vol. Vs Concentration Figure 16. Gibbs energy Vs Concentration
Fig. 17. Specific refraction Vs Concentration
6. CONCLUSIONS
In the present investigation experimental values of density, ultrasonic velocity, viscosity and
R.I. and related acoustic parameter values indicate that thermodynamic parameters are sensitive to
molecular interactions for ternary liquid mixtures at different concentrations and at varying
temperatures. Thus it is conclude that in mixture of studied compound, both solute-solute and
solute-solvent interaction is existing. Some parameters specially, free length and adiabatic
compressibility indicate strong interaction between solute-solvent molecules in the studied system.
Acknowledgments:
The author thanks Head, Department of Chemical Technology, SGBA University, Amravati, India,
for providing necessary facilities and also thanks Principal Dr. G. P. Patil, Vidya Bharti College,
Karanja (Lad) for their constant support.
References:
[1] S.Baluja, R.Talaviya, K. Bhesaniya, J. Chem. Bio. Phy. Sci. Sec .A 3(4) (2013) 2438-2445.
[2] V. Kannappan , S.Xavier, Jaya Santi, Indian J.pure Appl.Phys.41(2003) 690.
[3] A.B. Naik, M.L. Narwade, P. S. Bodakhe, G.G. Muley, Russ.J.Physical Chem. 88 (1) (2014)
37-41.
[4] Attri Pankaj, P.Reddy, Madhusudhanand Venkatesu, Ind. J. chem..49A (2010)736-742.
[5] T.F. Cruz, A. Mogon, W. Min, Mol. Bio-chem. 153(1995)161.
2.49E-04
2.50E-04
2.50E-04
2.51E-04
2.51E-04
2.52E-04
2.52E-04
0.0000.0050.0100.015
Spe
cifi
c R
efr
acti
on
Mol.Conc.
303.15K
308.15K
313.15K
318.15K
323.15K
0.00E+00
1.00E-08
2.00E-08
3.00E-08
4.00E-08
5.00E-08
6.00E-08
7.00E-08
0.000 0.010 0.020
fre
e v
olu
me
m3
/mo
le
mol. conc.
303.15K
308.15K
313.15K
318.15K
323.15K 1.55E-201.56E-201.57E-201.58E-201.59E-201.60E-201.61E-201.62E-201.63E-20
0.000 0.010 0.020
Gib
b’s
En
erg
y K
j/m
ol
Mol.Conc
303.15K
308.15K
313.15K
318.15K
323.15K
International Letters of Chemistry, Physics and Astronomy Vol. 59 197

[6] S.S.J.Srinivas, B.Tulsi Koteswari Bai, K.Babu Rao, K.Narendra, M.Sarath Babu,
International Letters of Chemistry,Physics and Astronomy 10(2)(2013) 33-40.
[7] E. Zagar and M. Zigon, Polymer,41(2000) 3513.
[8 ] Y.K. Kang and H.S. Park, J.Mol Struct(Theochem) 676 (2004)171
[9 ] J.Dean, A. Lange’s, Hand Book of Chemistry,McGraw-Hill,NewYork 1956
[10] Y.Umebayashi, K.Matsumoto, M.Watanabe, S.Ishiguro, J.Chem.Phys, 3(2001)5475.
[11] P. Venkesu, M.J.Lee ,H.M. Lin, J. chem. Thermo, 53 (2005) 996)
[12] C.H.Srinivasu , K.Anil Kumar, S. K.Fakruddin, K.Narendra, T. Anjaneyul, International
Letters of Chemistry,Physics and Astronomy 13 (2013) 1-7.
[13] A.N.Kannapan,Thirumaran.,Palanichammy, J.of Physical sci,vol.20(2),(2009) 97-108.
[14] C.Gopi and N. Santhi, International Letters of Chemistry,Physics and Astronomy 17(1) (2014)
50-66.
[15] H. Eyrin, J.F. Kincad, J.Chem.Phys,6(1938) 620-629.
[16] K.C. Patil and V.D. Umare, Int.J.Resh.in Pure app. Phys,2(4);(2012) 25-27.
[17] A. Pal, H. Kumar, R. Mann, H. K. Sharma, J. Chem. Eng. Data 58 (2013) 3190-200.
[18] R. K. Bachu, M. K. Patwari, S. Boodida, S. J. Tangeda, S. Nallani, Ind. J. Chem. 47A (2008)
1026.
[19] S. J. Kharat, Physics Chemistry liqs. 51 (2013) 1-10.
[20] S.Padma, There., Rasayan J.Chem 6(2)(2013) 111.
[21] G.R. Bedare, V.D.Bhandakkar and B. M. Suryvanshi, Ind. J. Res. Pure & Appl. Phys. 3(3)
(2013) 20-25.
[22] R. Mohanty and R. Paikaray, Res. J. of Chem. Sci. 3(5) (2013) 71-73.
[23] S.Nithiyanantham and Palaniappan chem. sci. Trans., 2(1) (2013) 35-40.
[24] Zareena Begaum, et.al., J.Mol.Liqs, 178 (2013) 99-112.
[25] G.Pavan Kumar, Ch.Pravin Babu,K.Samatha, N. Jyosthna,K. Showrilu, International Letters of
Chemistry,Physics and Astronomy 10 (2014) 25-37.
[26] N. Santhi, P.L. Sabarathinam, J. Madhumita, G.Alanelumangai,M.Emayavaramban,
International Letters of Chemistry, Physics and Astronomy 2 (2013) 18-35.
[27] N.Santi, J.Madhumita. Int. J.Adv.Chem. 2(1),(2014) 12-16.
[28] S.Baluja and A. Shah, Russ.J.Phys. Chem.80 (7) (2006) 1-5.
[29] S. Pal and S. Kumar, J. Mol. Lids., 109 (2004) 23-31.
[30] K.Narendra, P.Narayanamurthy and Ch.Srinivasu. Asian J. of Appl. Sci., 10 (2011)1-7.
198 ILCPA Volume 59


![Simultaneous titration of ternary mixtures of Pb(II), Cd ...in the titration resolving mixtures of two or more components. The pioneers in this sense were Calvo et al. [17]; in this](https://img.dokumen.tips/doc/110x75/5e88634d054c654079303612/simultaneous-titration-of-ternary-mixtures-of-pbii-cd-in-the-titration-resolving.jpg)