Embed Size (px)
Citation preview

ORIGINAL PAPER
Acoustic evaluation of loblolly pine tree- and lumber-length logsallows for segregation of lumber modulus of elasticity,not for modulus of rupture
Mark Alexander Butler1 & Joseph Dahlen1& Thomas L. Eberhardt2 & Cristian Montes1 &
Finto Antony1 & Richard F. Daniels1
Received: 29 March 2016 /Accepted: 28 December 2016 /Published online: 15 February 2017# INRA and Springer-Verlag France 2017
Abstract& Key message Loblolly pine (Pinus taeda) logs can be eval-uated using acoustic velocity whereby threshold acousticvelocity values can be set to ensure lumber meets specifiedmechanical property design values for modulus ofelasticity.
& Context There is a need to better sort logs according tolumber quality for improved decision making and wood utili-zation because merchantable logs are being harvested fromdifferent stand types including natural forests, conventionalplantations, and intensively managed plantations, all with dif-ferences in rotation ages, growth rates, and wood quality traits.& Aims This study aimed to link tree- and lumber-length logacoustic velocity with the resulting lumber properties as testedin static bending from five intensively managed loblolly pinestands in the Atlantic Coastal Plain of Georgia.& Methods Acoustic velocity was measured using theresonance-based approach on 87 tree-length logs and 244lumber-length logs. The logs were then processed into 797pieces of 38 mm by 89 mm (2×4), 140 mm (2×6), 184 mm(2×8), and 235 mm (2×10) dimension lumber, dried, and test-ed in static bending.& Results Mean MOE of the lumber had moderate relation-ships with acoustic velocity of the logs (R2 = 0.49) whereasMOR and acoustic velocity did not have a strong relationship(R2 = 0.20). Accounting for log position increased the perfor-mance of the mean lumberMOEmodel (R2 = 0.62) which wasfurther increased by adding green density and small-end di-ameter (R2 = 0.67). Utilization of acoustics was effective forsegregating logs based on lumber modulus of elasticity anddid not depend on knowing tree or stand information such asage, site quality, and silviculture history.& Conclusion Acoustic velocity evaluation of tree- andlumber-length logs could be employed to segregate logs with-in the supply chain to ensure that lumber would meet specifieddesign values.
Keywords Design values . Intensively managed plantations .
Mechanical properties .Modulus of elasticity . Modulus ofrupture . Nondestructive technology . Southern pine .Woodquality
Acoustic evaluation loblolly pine logs and lumber
Handling Editor: Jean-Michel Leban
Contribution of the co-authors Mark Alexander Butler: experimentaldesign, fieldwork and data analysis; Joseph Dahlen: research projectcoordinator, experimental design, fieldwork, data analysis and writingthe paper; Thomas L. Eberhardt: writing the paper; Cristian Montes:data analysis and writing the paper; Finto Antony: experimental design,fieldwork and writing the paper; Richard F Daniels: experimental designand fieldwork.
* Joseph [email protected]
Mark Alexander [email protected]
Thomas L. [email protected]
Cristian [email protected]
Finto [email protected]
Richard F. [email protected]
1 Warnell School of Forestry and Natural Resource, University ofGeorgia, 180 E Green Street, Athens, GA 30602-2152, USA
2 Forest Products Laboratory, USDA Forest Service, One GiffordPinchot Drive, Madison, WI 53726, USA
Annals of Forest Science (2017) 74: 20DOI 10.1007/s13595-016-0615-9

1 Introduction
Loblolly pine (Pinus taeda), the most important southern pine(P. taeda, Pinus palustris, Pinus echinata, and Pinus elliottii)in terms of utilization, is widely planted as a forest crop in theSoutheastern United States and has been extensively im-proved through genetic selection (McKeand et al. 2003).One of the most important products produced from loblollypine is dimension lumber. The National Design Specifications(NDS), or design values, for visually graded southern pinewere revised in 2013 following testing conducted by theSouthern Pine Inspection Bureau (SPIB) (SPIB 2013).Bending strength (Fb) design values decreased for all gradesand sizes, the modulus of elasticity (MOE) design value forthe Select Structural grade was left unchanged at 12.4 GPa,but the No. 1 grade MOE decreased from 11.7 to 11.0 GPa,and the No. 2 grade MOE decreased from 11.0 to 9.7 GPa(SPIB 2013). The prior design values for southern pine dateback to testing on full-sized lumber in the 1980s (Green et al.1989). The 1980 tests were the first time that design values inNorth America were based on actual lumber testing and nottesting of small clear specimens with resultant data scaled upto lumber sizes (Green et al. 1989).
Over the past 30 years, the acceleration of the growthrate in plantations has increased both the sustainability offorest plantations in the South and their financial attrac-tiveness (Munsell and Fox 2010). Plantation growth hasaccelerated because of improved genetics, intensive sitepreparations, weed control, decreased planting densities,and the use of multiple fertilizer applications (Borders andBailey 2001). These treatments have combined to de-crease the time it takes to grow loblolly pine sawtimberfrom 35–40 down to 20–25 years (Clark et al. 2008) withmerchantable size for the chip-n-saw being reached in aslittle as 16 years (Clark et al. 2008; Vance et al. 2010).The benefits of accelerated growth are often offset bychanges to the quality of the wood of standing timber.Specifically, faster grown trees will typically contain ahigh proportion of juvenile wood which has low stiffnessand strength (USDA 1988; McAlister and Clark 1991;Larson et al. 2001).
Nondestructive evaluation (NDE) via acoustics hasproven useful for measuring different physical and me-chanical properties of materials and to sort logs with vary-ing MOE (Carter et al. 2006; Ross 2015). The relationshipbetween dynamic MOE and acoustic velocity is as fol-lows:
MOEdyn ¼ pV2
where MOEdyn is the dynamic MOE, p is the density, and V isthe acoustic velocity. Distinctly different approaches are usedfor standing trees and logs. To evaluate the acoustic velocityof standing trees, transducers are positioned along the bole, at
a known distance in between, and time-of-flight informationrecorded (Grabianowski et al. 2006;Wessels et al. 2011). Logsare instead evaluated by a resonance-based approach that mea-sures the frequency of numerous acoustic pulses from thelarger end of the log, and giving a weighted mean acousticvelocity value (VR) via:
VR ¼ 2 f 0L
where VR is the weighted mean acoustic velocity of the log(m/s), f0 is the first harmonic frequency of an acoustic wavesignal (Hz), and L is the length of the log (m) (Wang 2013).Significant differences in the recorded velocities exist betweenthe two techniques, with the resonance-based approach onlogs being more accurate because it measures hundreds ofwaves instead of just the fastest wave (Mora et al. 2009;Wang 2013).
Ross et al. (1997) found moderate relationships betweenlog and lumber MOE in balsam fir (Abies balsamea)(R2 = 0.33) but found excellent relationships for white spruce(Picea glauca) (R2 = 0.82).Wang et al. (2002) foundmoderatecorrelations between whole log MOE as determined by staticbending and dynamic logMOE as determined using acousticsfor jack pine (Pinus banksiana) (R2 = 0.60) and red pine(Pinus resinosa) (R2 = 0.53). Vikram et al. (2011) found inDouglas-fir (Pseudotsuga menziesii) a moderate correlation(R2 = 0.42) between static bending MOE and log acousticvelocity in 2 × 4 Douglas-fir lumber. Wang et al. (2013) founda similar relationship in Douglas-fir (R2 = 0.40) between dy-namic lumber MOE and log acoustic velocity. Zhi-ru et al.(2013) found in poplar (Populus euramericana) laminatedveneer lumber (LVL) that log velocity was significantly cor-related to dynamic MOE of veneer (R2 = 0.88). Achim et al.(2011) found in trembling aspen (Populus tremuloides) thatsorting logs using acoustics prior to processing logs into ve-neer would be useful in culling logs that produce veneer un-suitable for LVL.
Research has been conducted to improve the accuracy ofthe acoustic velocity models. One method is to measure greendensity instead of assuming that it is constant (Lasserre et al.2009; Wang 2013). For felled logs, measuring green densitycan be estimated by collecting disks and determining specificgravity and moisture content (ASTM D2395 2014c); howev-er, it is obvious that this cannot be done for standing trees.Density and moisture content information could be estimatedfrom collecting cores from standing trees following ASTMD2395 (2014c) or utilizing X-ray densitometry to estimatebasic density. Drilling resistance has shown good correlationswith wood density (Isik and Li 2003; Ratcliffe et al. 2014) ashas Pilodyn penetration depth (Chen et al. 2015). Wang et al.(2013) increased the accuracy of the acoustic models by in-corporating log height information (i.e., log 1) into their modeland the linear model improved from R2 = 0.40 to 0.67. Time-
20 Page 2 of 15 Annals of Forest Science (2017) 74: 20

domain reflectometry (TDR) could be used to rapidly predictwood moisture content (Dahlen et al. 2015) on both standingtrees and felled logs; however, TDR requires that probes besemi-permanently installed deeply into the wood and thus it isbetter suited for applications where multiple measurementsover time are of interest as opposed to quick singledeterminations.
Loblolly pine is a commercially important species; yet, nopublished studies are available that link acoustic velocity oflogs to lumber quality. Studies are available that link acousticvelocity to small clear samples (Mora et al. 2009); however,we recently found poor correlations between the mechanicalproperties of small clear samples and full sized lumber sam-ples (Butler et al. 2016b) further prompting studies that linkacoustic velocity of logs to lumber. Given the decline in thedesign values for southern pine, of which loblolly pine is themajor species harvested, there is a need to better sort logs byquality (Murphy and Cown 2015). Acoustic velocity is alsocurrently used in breeding programs for loblolly pine, andbreeders are interested in knowing what additional variablescould be incorporated into breeding decisions for improvedlumber quality. Hence, the primary goals of this study were to
1. Determine the relationships between acoustic velocity,green density, and basic density of logs.
2. Investigate the relationship between acoustic velocity oflogs to lumberMOE and modulus of rupture (MOR) fromintensively managed loblolly pine trees.
3. Compare models developed using acoustic velocity ver-sus models developing using tree characteristics to
determine which is more effective at predicting lumbermechanical properties.
4. Set acoustic velocity thresholds for logs in order to meetthe lumber MOE design values.
2 Materials and methods
2.1 Tree selection
Trees used in the present study were harvested in 2013within the Lower Coastal Plain near Brunswick, Georgia(Butler et al. 2016a). The stand and tree characteristics arelisted in Table 1. A total of 93 trees fell from 5 standswith ages ranging from 24 to 33 with SI25 from 25.3 to27.4 m. The total volume of lumber within each stand wasestimated from measured tree dimensions in each 0.4 haplot. The total volume of lumber was then distributed into5-cm diameter classes. Tree selection across the diameterclasses was conducted as a percentage of the volumewithin a given diameter class compared to the overallvolume within the stand; thus, more large trees were sam-pled from diameter classes that contain more lumber vol-ume than small trees. Trees with major defects such ascankers and forks were not included in the sampling pro-cess. The trees sampled from the stands were relativelysimilar with minor statistical differences in height, no dif-ferences in diameter at breast height, and some differencesin live crown ratio.
Table 1 Stand and fell tree characteristics
Stand Fell trees
Stand Latitude Longitude Age Siteindex(m)
Quadratic meandiameter (cm)
Trees perhectare
Basal area(m2/ha)
Treesfell
Meanheight(m)
Mean diameter atbreast height (cm)
Livecrownratio
1 31.118729 −81.757379 24 27.4 29.2 721 49 21 27.4(1.19)a
31.3 (3.11)a 0.63(0.06)-ab
2 31.408185 −81.772966 25 27.1 30.1 415 30 19 27.3(1.17)a
31.5 (3.49)a 0.58(0.07)b
3 31.189826 −81.750544 26 25.6 31.9 442 35 18 27.3(0.98)a
32.0 (2.69)a 0.61(0.06)b
4 31.322529 −81.595399 27 26.2 30.4 442 32 20 26.2(1.70)b
31.8 (3.32)a 0.63(0.05)-ab
5 31.344459 v81.652424 33 25.3 33.0 208 18 9 27.5(0.64)a
33.2 (3.20)a 0.69(0.04)a
Overall 87 27.1(1.31)
31.8 (3.22) 0.62(0.07)
Standard deviations are given in parenthesis
Letters denote significant differences (α < 0.05) by Tukey test for height, diameter at breast height, and live crown ratio
Annals of Forest Science (2017) 74: 20 Page 3 of 15 20
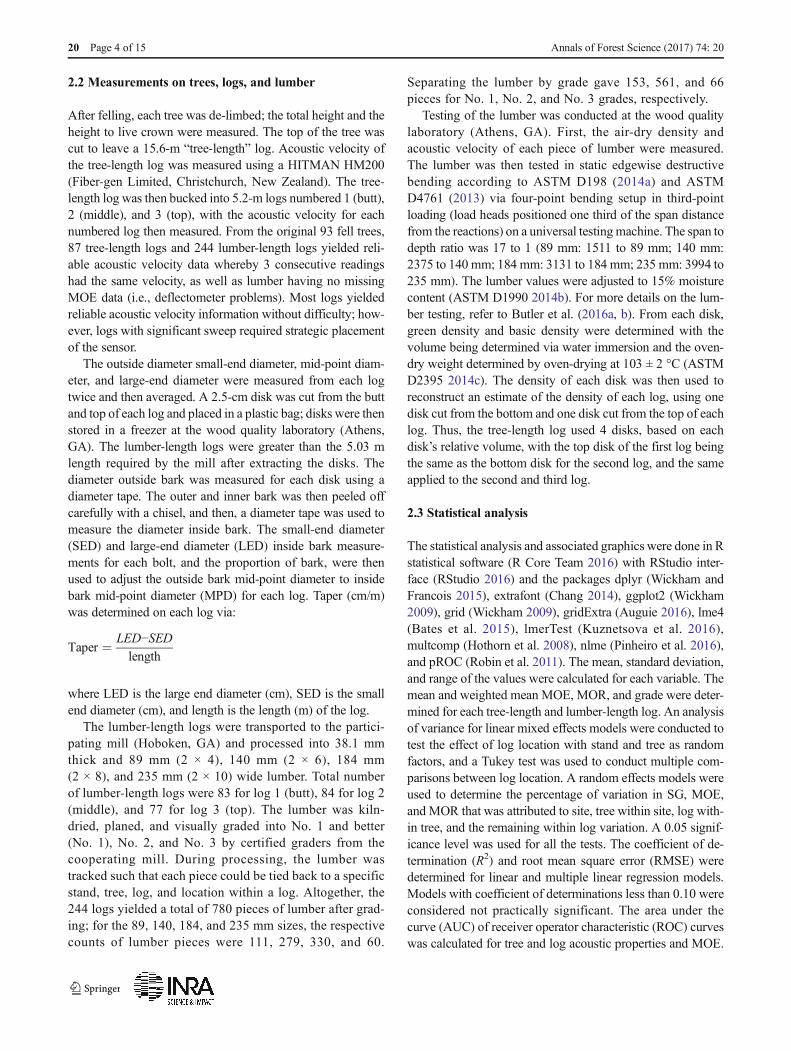
2.2 Measurements on trees, logs, and lumber
After felling, each tree was de-limbed; the total height and theheight to live crown were measured. The top of the tree wascut to leave a 15.6-m “tree-length” log. Acoustic velocity ofthe tree-length log was measured using a HITMAN HM200(Fiber-gen Limited, Christchurch, New Zealand). The tree-length log was then bucked into 5.2-m logs numbered 1 (butt),2 (middle), and 3 (top), with the acoustic velocity for eachnumbered log then measured. From the original 93 fell trees,87 tree-length logs and 244 lumber-length logs yielded reli-able acoustic velocity data whereby 3 consecutive readingshad the same velocity, as well as lumber having no missingMOE data (i.e., deflectometer problems). Most logs yieldedreliable acoustic velocity information without difficulty; how-ever, logs with significant sweep required strategic placementof the sensor.
The outside diameter small-end diameter, mid-point diam-eter, and large-end diameter were measured from each logtwice and then averaged. A 2.5-cm disk was cut from the buttand top of each log and placed in a plastic bag; disks were thenstored in a freezer at the wood quality laboratory (Athens,GA). The lumber-length logs were greater than the 5.03 mlength required by the mill after extracting the disks. Thediameter outside bark was measured for each disk using adiameter tape. The outer and inner bark was then peeled offcarefully with a chisel, and then, a diameter tape was used tomeasure the diameter inside bark. The small-end diameter(SED) and large-end diameter (LED) inside bark measure-ments for each bolt, and the proportion of bark, were thenused to adjust the outside bark mid-point diameter to insidebark mid-point diameter (MPD) for each log. Taper (cm/m)was determined on each log via:
Taper ¼ LED−SEDlength
where LED is the large end diameter (cm), SED is the smallend diameter (cm), and length is the length (m) of the log.
The lumber-length logs were transported to the partici-pating mill (Hoboken, GA) and processed into 38.1 mmthick and 89 mm (2 × 4), 140 mm (2 × 6), 184 mm(2 × 8), and 235 mm (2 × 10) wide lumber. Total numberof lumber-length logs were 83 for log 1 (butt), 84 for log 2(middle), and 77 for log 3 (top). The lumber was kiln-dried, planed, and visually graded into No. 1 and better(No. 1), No. 2, and No. 3 by certified graders from thecooperating mill. During processing, the lumber wastracked such that each piece could be tied back to a specificstand, tree, log, and location within a log. Altogether, the244 logs yielded a total of 780 pieces of lumber after grad-ing; for the 89, 140, 184, and 235 mm sizes, the respectivecounts of lumber pieces were 111, 279, 330, and 60.
Separating the lumber by grade gave 153, 561, and 66pieces for No. 1, No. 2, and No. 3 grades, respectively.
Testing of the lumber was conducted at the wood qualitylaboratory (Athens, GA). First, the air-dry density andacoustic velocity of each piece of lumber were measured.The lumber was then tested in static edgewise destructivebending according to ASTM D198 (2014a) and ASTMD4761 (2013) via four-point bending setup in third-pointloading (load heads positioned one third of the span distancefrom the reactions) on a universal testing machine. The span todepth ratio was 17 to 1 (89 mm: 1511 to 89 mm; 140 mm:2375 to 140 mm; 184 mm: 3131 to 184 mm; 235 mm: 3994 to235 mm). The lumber values were adjusted to 15% moisturecontent (ASTM D1990 2014b). For more details on the lum-ber testing, refer to Butler et al. (2016a, b). From each disk,green density and basic density were determined with thevolume being determined via water immersion and the oven-dry weight determined by oven-drying at 103 ± 2 °C (ASTMD2395 2014c). The density of each disk was then used toreconstruct an estimate of the density of each log, using onedisk cut from the bottom and one disk cut from the top of eachlog. Thus, the tree-length log used 4 disks, based on eachdisk’s relative volume, with the top disk of the first log beingthe same as the bottom disk for the second log, and the sameapplied to the second and third log.
2.3 Statistical analysis
The statistical analysis and associated graphics were done in Rstatistical software (R Core Team 2016) with RStudio inter-face (RStudio 2016) and the packages dplyr (Wickham andFrancois 2015), extrafont (Chang 2014), ggplot2 (Wickham2009), grid (Wickham 2009), gridExtra (Auguie 2016), lme4(Bates et al. 2015), lmerTest (Kuznetsova et al. 2016),multcomp (Hothorn et al. 2008), nlme (Pinheiro et al. 2016),and pROC (Robin et al. 2011). The mean, standard deviation,and range of the values were calculated for each variable. Themean and weighted mean MOE, MOR, and grade were deter-mined for each tree-length and lumber-length log. An analysisof variance for linear mixed effects models were conducted totest the effect of log location with stand and tree as randomfactors, and a Tukey test was used to conduct multiple com-parisons between log location. A random effects models wereused to determine the percentage of variation in SG, MOE,and MOR that was attributed to site, tree within site, log with-in tree, and the remaining within log variation. A 0.05 signif-icance level was used for all the tests. The coefficient of de-termination (R2) and root mean square error (RMSE) weredetermined for linear and multiple linear regression models.Models with coefficient of determinations less than 0.10 wereconsidered not practically significant. The area under thecurve (AUC) of receiver operator characteristic (ROC) curveswas calculated for tree and log acoustic properties and MOE.
20 Page 4 of 15 Annals of Forest Science (2017) 74: 20

The AUC is the probability that the lumber produced from atree or log will be correctly assigned to meeting the designvalues (0) or not meeting the design values (1). When AUC is1, it indicates a perfect prediction, and when the AUC is 0.5, itindicates a random prediction (Hanley andMcNeil 1982). TheSelect Structural (12.4 GPa), No. 1 grade (11.0 GPa), and No.2 grade (9.7 GPa) MOE design values were used for the ROCanalysis and demonstrating the effect of acoustic velocity seg-regation via specified threshold values on the lumber MOEvalues, and the proportion of the logs that meet these acousticvelocity values.
3 Results and discussion
3.1 Log properties
The small end diameter, acoustic velocity, green density, andbasic density measurements for the tree-length and lumber-length logs are presented in Table 2. This data shows thatlog 3 (top) had significantly lower (p value <0.0001) acousticvelocity (3219 m/s) compared to log 1 (3425 m/s) and log 2(3423 m/s). The tree-length log reading encompasses the thirdlog and thus will also generally have a lower acoustic velocitythan from the combined data from logs 1 and 2 (not shown), aswell as logs 1 or 2 on an individual basis. As to be expected,the mean acoustic velocity of the tree-length logs (3352 m/s)was very similar to the mean acoustic velocity when the datafrom all the lumber-length logs were pooled (3358 m/s).
The data for the green density showed differences betweenlog 1 and logs 2 and 3. Logs were significantly different withregard to basic density. Plotting the data for the tree-length(Fig. 1) and lumber-length logs (Fig. 2) showed considerablevariation in the scatterplots of acoustic velocity, green density,and basic density. Green density was not correlated withacoustic velocity for either the tree-length (R2 = 0.01) orlumber-length logs (R2 = 0.02), nor was it well correlated withbasic density for the tree-length (R2 = 0.11) or the lumber-length logs (R2 = 0.13). With basic density, a moderate rela-tionship to acoustic velocity was evident for both tree-lengthlogs (R2 = 0.50) and lumber-length logs (R2 = 0.42).
3.2 Lumber properties
The breakdown of lumber produced by stand and log numberis shown in Table 3. For each stand, approximately the samenumber of lumber pieces were produced from the first(N = 292) and second log (N = 290) with the third log produc-ing a lower piece count (N = 198). The larger logs at the buttproduced wider lumber than the second or third log. Thebreakdown of lumber grade by log shows that lumber gradedecreases moving away from the butt log. Log 1 producedlumber with 35% No. 1 grade, 61% No. 2 grade, and 4% T
able2
Diameter,taper,acoustic
velocity,and
density
inform
ationfrom
tree-lengthandlumber-length
logs
Small-enddiam
eter
(cm)
Large-end
diam
eter
(cm)
Log
taper(cm
m−1)
Acoustic
velocity
(ms−
1)
Green
density
(kgm
−3)
Basicdensity
(kgm
−3)
NMean
SDRange
Mean
SDRange
Mean
SDRange
Mean
SDRange
Mean
SDRange
Mean
SD
Range
Tree-LengthLog
8719.0
2.7
12.3–23.4
31.1
3.6
22.1–38.5
0.78
0.13
0.39–1.07
3352
193
2990–3771
974
36846–1040
510
30441–595
Log
183
25.6
3.0
17.1–31.2
31.1
3.6
22.1–38.5
1.08
0.31
0.35–1.83
3425a
217
3060–3910
980a
37873–1057
535a
32464–616
Log
284
22.6
3.0
15.0–28.2
25.5
3.2
17.1–32.8
0.56
0.18
0.11–0.93
3423a
194
3060–3931
964b
45796–1063
481b
35407–576
Log
377
19.0
2.7
12.3–23.4
22.7
3.1
15.0–28.2
0.70
0.17
0.35–1.17
3219b
188
2820–3671
965b
45799–1042
465c
38394–582
AllLum
ber-LengthLogs
244
22.5
3.9
12.3–31.2
26.5
4.8
15.0–38.5
0.78
0.32
0.11–1.83
3358
221
2820–3931
970
43796–1063
494
46394–616
Lettersdenotesignificantd
ifferences
(α<0.05)by
Tukey
testforacousticvelocity,green
density,and
basicdensity
Annals of Forest Science (2017) 74: 20 Page 5 of 15 20

No. 3 grade. Log 2 produced lumber with 12% No. 1 grade,80%No. 2 grade, and 8%No. 3 grade. Log 3 produced lumberwith 9%No. 1 grade, 76% No. 2 grade, and 15% No. 3 grade.Stand 3 (age 26, 11.6 GPa) and stand 5 (age 33, 11.9 GPa) hadcomparable MOE values and were higher than stand 1 (age24, 10.2 GPa), stand 2 (age 25, 10.1 GPa), and stand 4 (age 27,10.6 GPa).
The MOE histogram by lumber grade (Nos. 1, 2, and 3) isshown in Fig. 3. The mean and weighted mean acoustic veloc-ity, air dry density, MOE, and MOR lumber properties werecalculated on the basis of the tree-length logs, the lumber-length logs, and pooled data for the lumber-length logs. Themean and weighted mean properties were similar, and onlymean values will be discussed. The general trend for all lumberproperties, except for acoustic velocity, is a reduction in lumberquality when moving up the stem (Table 4). The lumber fromthe log 2 had significantly higher acoustic velocity (4646 m/s)than log 1 (4537 m/s) while the lumber from log 1 was notsignificantly different from log 3 (4535 m/s).
Regarding the sources of variation for the tree-length logs,for basic density, 17% of the variation was due to the stand,15% was due to tree within the stand, and the remaining 68%was attributed to the within log variation. For MOE, 11% ofthe variation was due to the stand, 13% was due to tree withinthe stand, and the remaining 76% was attributed to the withinlog variation. For MOR, 5% of the variation was due to thestand, 8% was due to tree within the stand, and the remaining87%was attributed to the within log variation. For the lumber-length logs, for basic density, 23% of the variation was due tothe stand, 27%was due to tree within the stand, 4%was due tothe log within the tree, and the remaining 46% was attributedto the within log variation. For MOE, 14% of the variationwas due to the stand, 17% was due to tree within the stand,10%was due to the log within the tree, and the remaining 59%was attributed to the within log variation. ForMOR, 6% of thevariation was due to the stand, 10% was due to tree within thestand, 0%was due to the log within the tree, and the remaining84% was attributed to the within log variation.
Fig. 2 Relationships between lumber-length log acoustic velocity, green density, and basic density. The regression line (solid black line) is shown alongwith the 95% confidence interval of the mean (gray polygon around black line)
Fig. 1 Relationships betweentree-length log acoustic velocity,green density, and basic density.The regression line (solid blackline) is shown along with the 95%confidence interval of the mean(gray polygon around black line)
20 Page 6 of 15 Annals of Forest Science (2017) 74: 20

3.3 Modeling mean lumber modulus of elasticity from logproperties
The relationships between mean lumber MOE with acousticvelocity and basic density are presented in Table 5 for the tree-length logs and Table 6 for the lumber-length logs. Overall,a cous t i c ve loc i ty o f a t r ee - l eng th (R 2 = 0 .53 ,RMSE = 0.90 GPa) or lumber-length log (R2 = 0.49,RMSE = 1.37 GPa) had a reasonably good fit with predictingthe mean lumber MOE (Fig. 4). Measured basic density of thelog also resulted in a model that also had a reasonably good fitfor tree-length MOE (R2 = 0.32, RMSE = 1.08 GPa) orlumber-length MOE (R2 = 0.42, RMSE = 1.45 GPa), but themodel was not as accurate as the acoustic velocity model.Green density was not effective at predicting mean lumberMOE for tree-length (R2 = 0.11) or lumber-length(R2 = 0.10) models. Modeling mean lumber MOE solely withlog position had similar results to basic density and was lessa c c u r a t e t h a n a c o u s t i c v e l o c i t y (R 2 = 0 . 3 3 ,RMSE = 1.55 GPa). Incorporating log position into the acous-tic velocity or basic density model improved both the lumber-length acoustic velocity model (R2 = 0.62, RMSE = 1.18) andthe basic density model (R2 = 0.48, RMSE = 1.37). The logposition was the only tree variable that had a regression modelwith decent performance (R2 > 0.20). For the tree-length logs,no tree variable was practically significant, and for the lumber-length logs, only the diameter of the logs (small-end, mid-point, and large-end diameter) yielded semi-effective linearmodels (R2 = 0.12 to 0.17). Other tree attributes such asheight, DBH, live crown ratio, height to live crown, and larg-est branch diameter were not practically significant or notsignificant variables. Incorporating basic density of the loginto the acoustic velocity model did not result in significantimprovement over just using acoustic velocity for the tree-length model; however, green density and acoustic velocitydid result in an improved model for the tree-length logs(R2 = 0.59, RMSE = 0.83). Incorporating basic density in amodel with acoustic velocity resulted in an improved model(R2 = 0.55, RMSE = 1.27) as did green density (R2 = 0.53,RMSE = 1.30). The most accurate tree-length MOE modelutilized the combination of acoustic velocity, green density,and mid-point diameter of the stem (R2 = 0.62, RMSE = 0.80).The most accurate lumber-length MOE model was similar tothe tree-length model with the added variable of log number,and the small-end diameter led to a better fit than mid-pointdiameter (R2 = 0.67, RMSE = 1.09).
The relationships between mean lumber MOR with acous-tic velocity and basic density are presented in Table 5 for tree-length and Table 6 lumber-length logs. Overall, measuringacous t i c ve loc i ty on a t r ee - l eng th (R 2 = 0 .16 ,RMSE = 5.80 MPa) or lumber-length log (R2 = 0.20,RMSE = 8.6 MPa) did not result in a model with a good fitfor explaining mean lumber MOR (Fig. 5). Similarly, poorT
able3
Breakdownof
lumbersize,grade,and
modulus
ofelasticity
produced
bystandandlogheight
Stand
Num
berof
logs
(num
berof
lumber)
Num
berof
89,140,184,and
235-mm
width
lumber(89mm/
140mm/184
mm/235
mm)
Num
berof
lumbergraded
No.1,2and3(N
o.1/No.2/No.3)
Modulus
ofelasticity
ofthe
lumber(G
Pa)
Log
1Log
2Log
3Overall
Log
1Log
2Log
3Overall
Log
1Log
2Log
3Overall
Log
1Log
2Log
3Overall
S119
(70)
20(70)
20(49)
59(189)8:18:34:10
12:24:31:3
6:31:12:0
26:73:77:13
21:46:3
5:60:5
1:41:7
27:147:15
11.4
10.1
8.7
10.2
S219
(63)
19(67)
15(42)
53(172)9:15:28:11
7:22:34:4
13:15:14:0
29:52:76:15
22:37:4
8:51:8
1:36:5
31:124:17
11.4
9.9
8.6
10.1
S318
(62)
18(59)
16(36)
52(157)5:16:30:11
6:25:28:0
9:20:7:0
20:61:65:11
21:36:5
48:6:4
4:24:8
30:108:19
12.8
11.7
9.5
11.6
S418
(60)
18(60)
17(42)
53(162)7:13:34:6
6:28:20:6
10:22:10:0
23:63:64:12
15:45:0
4:52:4
0:33:9
19:130:13
11.7
10.4
9.2
10.6
S59(37)
9(34)
9(29)
27(100)5:4:23:5
4:11:15:4
4:15:10:0
13:30:48:9
23:14:0
12:21:1
11:17:1
46:52:2
13.2
11.8
10.6
11.9
Overall83
(292)84
(290)77
(198)244(780)34:66:149:43
35:110:128:17
42:103:53:0
111:279:330:60
102:178:12
34:232:24
17:151:30
153:561:66
12.0
10.6
9.2
10.8
Annals of Forest Science (2017) 74: 20 Page 7 of 15 20

results with basic density for tree-length (R2 = 0.08,RMSE = 6.04 MPa) or lumber-length log (R2 = 0.27,RMSE = 8.21 MPa) were obtained. The basic density tree-length model was not practically significant (R2 < 0.10).Modeling mean lumber MOR solely with log position hadslightly improved results compared to the acoustic velocityand basic density models (R2 = 0.31, RMSE = 7.93 MPa).Incorporating log position into the model improved thelumber-length acoustic velocity model (R2 = 0.40,RMSE = 7.41) and the basic density model (R2 = 0.35,RMSE = 7.70). Similar to the MOE models, use of non-wood quality data was not useful for predicting MOR fortree-length logs and not useful for predicting lumber-lengthlogs. The most accurate tree-length MOR model utilized thecombination of acoustic velocity and green density (R2 = 0.18,RMSE = 5.63); however, the model performance was notgood. The most accurate lumber-length MORmodel was sim-ilar to the tree-length model with the added variable of logheight (R2 = 0.42, RMSE = 7.26).
3.4 Acoustic velocity threshold values formeetingmodulusof elasticity design values
For the tree-length logs, 10 out of 87 (11%) logs met the MOEdesign value for the Select Structural grade (12.4 GPa), 40 outof 87 (46%) met the No. 1 grade (11.0 GPa), and 66 out of 87
(76%) met the No. 2 grade (9.7 GPa). Using the regressioncoefficients for the tree-length logs found in Table 4(MOE = −5.94 * 0.005 * AV), we predicted the MOE usingacoustic velocity and compared the results to the actual MOEmeasured, and then, we calculated the area under the curve forthe receiver operator characteristic plots. The AUC for theSelect Structural grade (AUC = 0.95), No. 1 grade (0.87),and No. 2 grade (0.85) indicates that these measures havegood accuracy at segregating tree-length logs that meet(0 = yes) or do not meet the design values (1 = no) for therespective grades. Setting a threshold velocity of 3170 m/swould result in the remaining tree-length logs to produce lum-ber that met the No. 1 (11.0 GPa) MOE design value (Fig. 6).The 3170 m/s threshold would exclude 19% of the tree-lengthlogs, and not all of the remaining trees would produce lumberthat meets the 11.0 GPa design value; however, it does resultin excluding a sufficient number of trees that produced lowerMOE lumber that the mean value would increase from10.7 GPa to the 11.0 GPa value. Setting this threshold didnot result in excluding any tree-length logs that producedlumber that exceed the 11.0 GPa design value. Setting athreshold of 3600 m/s would result in the lumber meetingthe Select Structural (12.4 GPa) MOE design value, whichwould exclude 86% of the tree-length logs and 6% of theexcluded logs did produce lumber that exceeded the12.4 GPa MOE value and thus were improperly excluded.
Fig. 3 Density histogramshowing No. 1 grade (solid line),No. 2 grade (dashed line), andNo. 3 grade (dotted line)distribution for modulus ofelasticity (MOE) (GPa)
Table 4 Physical and mechanical properties of the lumber from the tree-length and lumber-length logs
Acoustic velocity (m/s) Basic density (kg/m3) Modulus of elasticity (GPa) Modulus of rupture (MPa)
N Mean SD Range Mean SD Range Mean SD Range Mean SD Range
Tree-length log 89 4584 204 4135–5006 574 36 496–675 10.7 1.3 8.1–13.7 40.1 6.6 27.7–57.1
Log 1 83 4537b 289 3829–5077 614a 42 506–717 11.9a 1.9 7.9–16.1 46.3a 9.2 25.3–67.1
Log 2 84 4646a 226 4025–5100 561b 40 483–692 10.6b 1.4 7.7–14.6 37.3b 6.7 25.1–56.1
Log 3 77 4535b 224 4035–5090 534c 38 439–653 9.1c 1.4 5.7–12.7 33.6c 8.1 16.8–56.8
All lumber-length logs 244 4573 253 3829–5100 570 52 439–717 10.5 1.9 5.7–16.1 39.1 9.7 16.8–67.1
Letters denote significant differences (α < 0.05) for log means by Tukey test
20 Page 8 of 15 Annals of Forest Science (2017) 74: 20
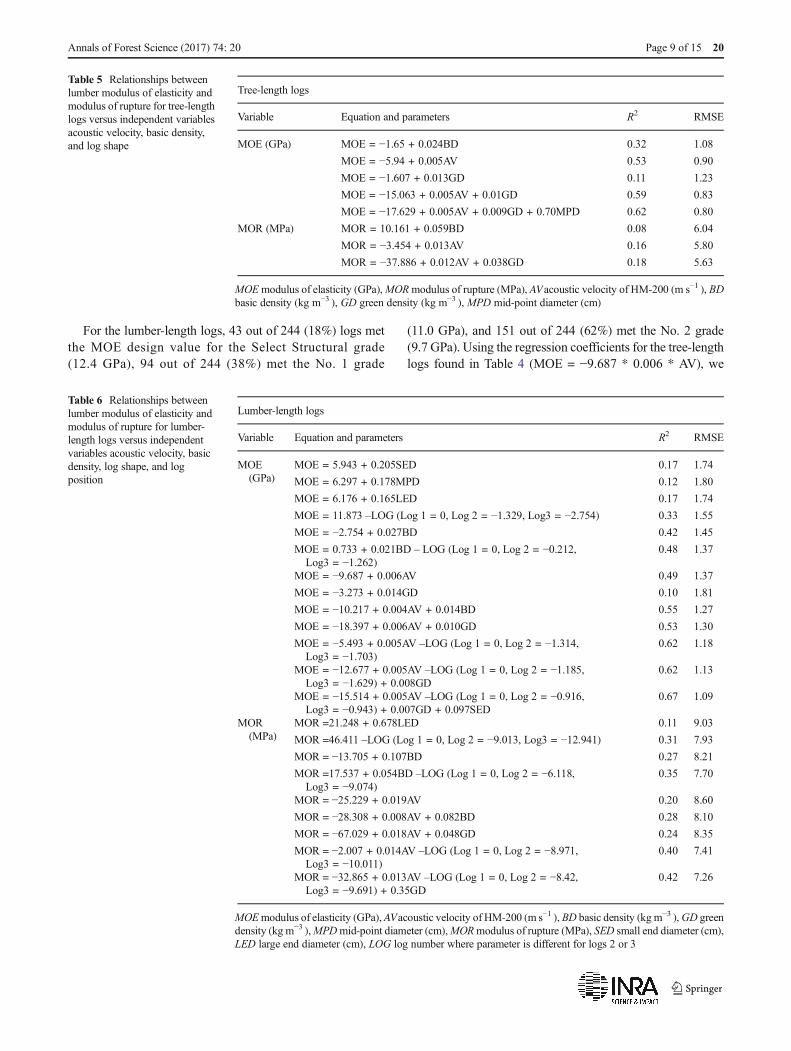
For the lumber-length logs, 43 out of 244 (18%) logs metthe MOE design value for the Select Structural grade(12.4 GPa), 94 out of 244 (38%) met the No. 1 grade
(11.0 GPa), and 151 out of 244 (62%) met the No. 2 grade(9.7 GPa). Using the regression coefficients for the tree-lengthlogs found in Table 4 (MOE = −9.687 * 0.006 * AV), we
Table 6 Relationships betweenlumber modulus of elasticity andmodulus of rupture for lumber-length logs versus independentvariables acoustic velocity, basicdensity, log shape, and logposition
Lumber-length logs
Variable Equation and parameters R2 RMSE
MOE(GPa)
MOE = 5.943 + 0.205SED 0.17 1.74
MOE = 6.297 + 0.178MPD 0.12 1.80
MOE = 6.176 + 0.165LED 0.17 1.74
MOE = 11.873 –LOG (Log 1 = 0, Log 2 = −1.329, Log3 = −2.754) 0.33 1.55
MOE = −2.754 + 0.027BD 0.42 1.45
MOE = 0.733 + 0.021BD – LOG (Log 1 = 0, Log 2 = −0.212,Log3 = −1.262)
0.48 1.37
MOE = −9.687 + 0.006AV 0.49 1.37
MOE = −3.273 + 0.014GD 0.10 1.81
MOE = −10.217 + 0.004AV + 0.014BD 0.55 1.27
MOE = −18.397 + 0.006AV + 0.010GD 0.53 1.30
MOE = −5.493 + 0.005AV –LOG (Log 1 = 0, Log 2 = −1.314,Log3 = −1.703)
0.62 1.18
MOE = −12.677 + 0.005AV –LOG (Log 1 = 0, Log 2 = −1.185,Log3 = −1.629) + 0.008GD
0.62 1.13
MOE = −15.514 + 0.005AV –LOG (Log 1 = 0, Log 2 = −0.916,Log3 = −0.943) + 0.007GD + 0.097SED
0.67 1.09
MOR(MPa)
MOR =21.248 + 0.678LED 0.11 9.03
MOR =46.411 –LOG (Log 1 = 0, Log 2 = −9.013, Log3 = −12.941) 0.31 7.93
MOR = −13.705 + 0.107BD 0.27 8.21
MOR =17.537 + 0.054BD –LOG (Log 1 = 0, Log 2 = −6.118,Log3 = −9.074)
0.35 7.70
MOR = −25.229 + 0.019AV 0.20 8.60
MOR = −28.308 + 0.008AV + 0.082BD 0.28 8.10
MOR = −67.029 + 0.018AV + 0.048GD 0.24 8.35
MOR = −2.007 + 0.014AV –LOG (Log 1 = 0, Log 2 = −8.971,Log3 = −10.011)
0.40 7.41
MOR = −32.865 + 0.013AV –LOG (Log 1 = 0, Log 2 = −8.42,Log3 = −9.691) + 0.35GD
0.42 7.26
MOEmodulus of elasticity (GPa), AVacoustic velocity of HM-200 (m s−1 ), BD basic density (kgm−3 ),GD greendensity (kg m−3 ),MPDmid-point diameter (cm),MORmodulus of rupture (MPa), SED small end diameter (cm),LED large end diameter (cm), LOG log number where parameter is different for logs 2 or 3
Table 5 Relationships betweenlumber modulus of elasticity andmodulus of rupture for tree-lengthlogs versus independent variablesacoustic velocity, basic density,and log shape
Tree-length logs
Variable Equation and parameters R2 RMSE
MOE (GPa) MOE = −1.65 + 0.024BD 0.32 1.08
MOE = −5.94 + 0.005AV 0.53 0.90
MOE = −1.607 + 0.013GD 0.11 1.23
MOE = −15.063 + 0.005AV + 0.01GD 0.59 0.83
MOE = −17.629 + 0.005AV + 0.009GD + 0.70MPD 0.62 0.80
MOR (MPa) MOR = 10.161 + 0.059BD 0.08 6.04
MOR = −3.454 + 0.013AV 0.16 5.80
MOR = −37.886 + 0.012AV + 0.038GD 0.18 5.63
MOEmodulus of elasticity (GPa),MORmodulus of rupture (MPa), AVacoustic velocity of HM-200 (m s−1 ), BDbasic density (kg m−3 ), GD green density (kg m−3 ), MPD mid-point diameter (cm)
Annals of Forest Science (2017) 74: 20 Page 9 of 15 20

predicted the MOE using acoustic velocity and compared theresults to the actual MOE measured, and then, we calculatedthe area under the curve for the receiver operator characteristicplots. The AUC for the Select Structural grade (AUC = 0.88),No. 1 grade (0.83), and No. 2 grade (0.84) indicates that thesemeasures have good accuracy at segregating lumber-lengthlogs that meet (0 = yes) or do not meet the design values(1 = no) for the respective grades. A threshold of 3210 m/swould result in the lumber meeting the No. 1 (11.0 GPa) MOEdesign value, which would exclude 27% of the lumber-lengthlogs (Fig. 6) of which 3% of the logs did produce lumber witha MOE greater than or equal to 11.0 GPa and thus were im-properly excluded. A threshold of 3520 m/s would result inthe lumber meeting the Select Structural (12.4 GPa) MOEdesign value, which would exclude 76% of the lumber-length logs of which 5% of the logs did produce lumber witha MOE greater than or equal to 12.4 GPa and thus were im-properly excluded. Because the MOE of the lumber decreaseswith increasing log number, the threshold approach is alsouseful when looking at the individual log heights since a millcould saw lumber differently if the log came from the buttversus the top (Fig. 7). For log 1, to meet the Select
Structural MOE design value (12.4 GPa), an acoustic velocitythreshold of 3250 m/s is needed which would exclude 25% ofthe logs of which 1% of the logs would be improperly exclud-ed. For log 2, to meet the No. 1 grade MOE (11.0 GPa), anacoustic velocity threshold of 3330 m/s is needed whichwould exclude 33% of the logs of which 4% of the logs wouldbe improperly excluded. For log 2, to meet the SelectStructural grade, an acoustic velocity threshold of 3720 m/sis needed which would exclude 92% of the logs of which 6%of the logs would be improperly excluded. For log 3, to meetthe No. 2 grade, an acoustic velocity threshold of 3280 m/s isneeded which would exclude 61% of the logs of which 8% ofthe logs would be improperly excluded. For log 3, to meet theNo. 1 grade, an acoustic velocity threshold of 3520 m/s isneeded which would exclude 93% of the logs of which 4%of the logs would be improperly excluded.
4 Discussion
Log 1 acoustic velocity ranged from 3060 to 3910 m/s whichis much higher than the range found byMora et al. (2009) who
Fig. 4 Mean lumber static modulus of elasticity within tree-length and lumber-length log versus acoustic velocity or basic density. The regression line(solid black line) is shown along with the 95% confidence interval of the mean (gray polygon around black line)
20 Page 10 of 15 Annals of Forest Science (2017) 74: 20
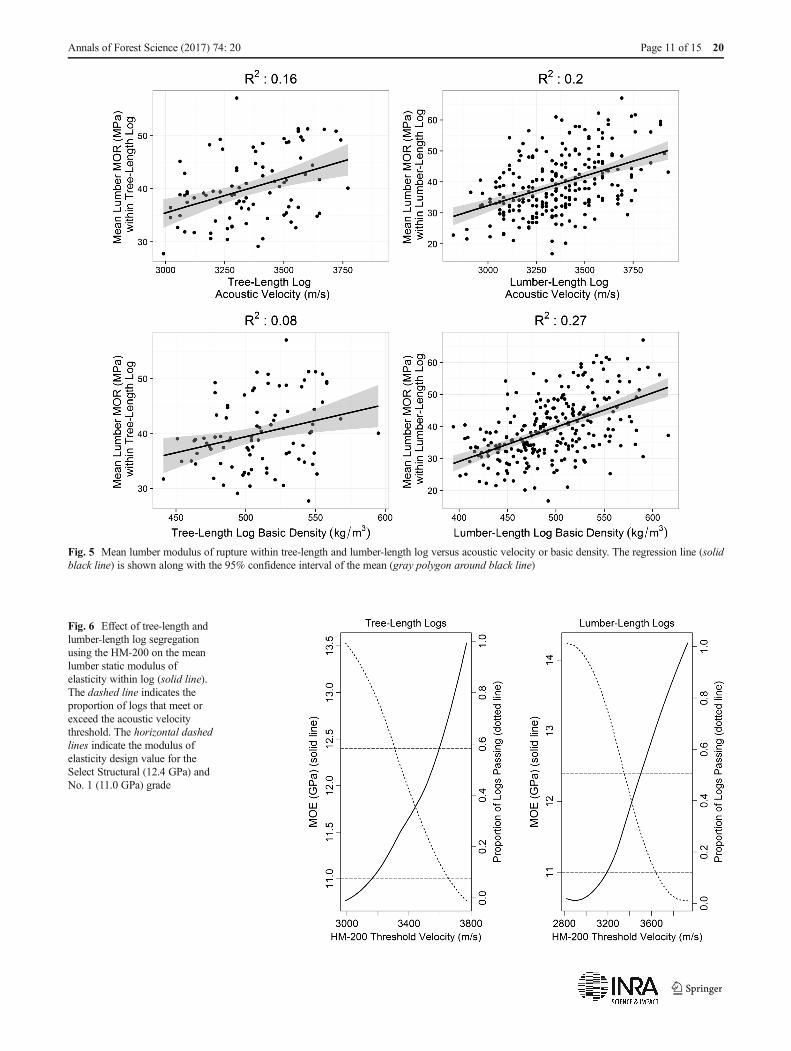
Fig. 5 Mean lumber modulus of rupture within tree-length and lumber-length log versus acoustic velocity or basic density. The regression line (solidblack line) is shown along with the 95% confidence interval of the mean (gray polygon around black line)
Fig. 6 Effect of tree-length andlumber-length log segregationusing the HM-200 on the meanlumber static modulus ofelasticity within log (solid line).The dashed line indicates theproportion of logs that meet orexceed the acoustic velocitythreshold. The horizontal dashedlines indicate the modulus ofelasticity design value for theSelect Structural (12.4 GPa) andNo. 1 (11.0 GPa) grade
Annals of Forest Science (2017) 74: 20 Page 11 of 15 20

found velocities from 1909 to 3228m/s. The difference can beattributed to age whereby trees in this study were from 24 to33 years old, whereas Mora et al. (2009) examined 15- to 19-year-old loblolly pine trees. Mora et al. (2009) found strongrelationships between tree and log velocity (R2 = 0.81). Mooreet al. (2013) found for Sitka spruce good relationships be-tween tree and log velocity (R2 = 0.71) at the stand level. Itwould have been interesting to know if the strong relationshipheld true for older loblolly pine trees with greater diameters,but unfortunately, our tree acoustic velocity meter failed dur-ing field sampling and there was not sufficient time to repairthe instrument for use in the study.
The acoustic velocity of logs 1 (3425m/s) and 2 (3423m/s)were not significantly different from each other but were dif-ferent from log 3 (3219 m/s). The lower acoustic velocity forlog 3 is expected due to larger proportions of knots and juve-nile wood in log 3; in this study, 26% of the top logs (log 3)contained the live crown. However, the acoustic velocity ofthe lumber sawn from log 2 was significantly higher (4646 m/s) than log 1 (4537 m/s). The lower acoustic velocity of thelumber from the butt log (log 1) may be due to processing thelogs into lumber and the relatively high taper present near thebutt of the stem. Thus, much of the higher density wood withlower microfibril angles was chipped instead of being convert-ed into lumber. While the acoustic velocity of the lumber waslower from log 1 than log 2, the opposite was true for MOE ofthe lumber. Specifically, lumber from the butt log (11.9 GPa)had a mean MOE that was 1.3 GPa higher than lumber from
the middle log (10.6 GPa). The difference in lumber MOE islikely due to both the higher lumber specific gravity for log 1(0.61 vs 0.56) as well as the smaller knots typically found inlog 1. The lumber results are similar to results found byWanget al. (2013) where MOE had a negative relationship withvertical log position (R2 = 0.58) in Douglas-fir (Pseudotsugamenziesii), meaning that logMOE decreased from the butt logto the crown.
We found considerable differences in the sources of varia-tion of the lumber compared to whatMoore et al. (2013) foundfor Sitka spruce (Table 7). Overall, we found more variationdue to log position and variation within log than Moore et al.(2013) found, and less variation due to site and tree within site.The differences could be due to the sampling scheme wherewe harvested trees from stands that had little geographicvariation and slight differences in age, whereas Moore et al.(2013) selected stands based on standing tree stiffness and hada greater range of ages (26 to 47). It could also be due todifferences in Sitka spruce versus loblolly pine.
The results of the mean MOE lumber models show thatacoustic velocity is a useful method for sorting tree-(R2 = 0.53, RMSE = 0.90 GPa) and lumber-length logs(R2 = 0.49, RMSE = 1.37 GPa). A mill could randomly sam-ple logs on trucks to determine if logs met the predicted designvalues or values need for other mill products. Additionally, amill could install an acoustic system prior to the headrig withthe results influencing the sawing solution; alternatively, or inconjunction, a similar system could be installed at the gang
Fig. 7 Effect of lumber-length log segregation using the HM-200 on themean lumber static modulus of elasticity within the first, second, and thirdlog (solid line). The dashed line indicates the proportion of logs that meet
or exceed the acoustic velocity threshold. The horizontal dashed linesindicate the modulus of elasticity design value for the Select Structural(12.4 GPa), No. 1 (11.0 GPa) grade, and No. 2 (9.7 GPa) grade
20 Page 12 of 15 Annals of Forest Science (2017) 74: 20

saw to account for the differences in log quality compared tocant quality. Thus, logs or cants with low acoustic velocitycould be turned into posts, and higher acoustic velocity logscould be sawn in dimension lumber. The MOE design valuesfor visually graded No. 1 and No. 2 southern pine lumber are11.0 and 9.7 GPa, respectively. Based on these data, incomingtree-length logs would need to exceed 4150 and 3825 m/s,respectively, to meet the No. 1 and No. 2 MOE design values.For lumber-length logs, the acoustic velocity values wouldneed to exceed 3400 and 3180 m/s, respectively, to meet thedesign values for MOE. This study was conducted in the sum-mer on intensively managed material in the Lower CoastalPlain of Georgia, and thus, the equations would likely needto be modified to reflect a higher diversity of material that isutilized at mills, differences in sawing solutions, as well asseasonal differences in the wood moisture content.Prediction ofMORwas more difficult because of the complexinteractions that exist within a piece of lumber due to knotsizes, shapes, locations, and differences in slope of grain andspecific gravity.
Both the mean MOE and MOR models were improved byadding log position to the acoustic velocity equation; howev-er, where log position explained more of the variation inMORthan acoustic velocity, the opposite was true for MOE. Logposition and log dimensions were the only useful non-woodquality type variables that were useful in predicting lumberMOE which differed from the Moore et al. (2013) study.Again, this could be due to species differences and the rangeof trees sampled in that study versus this one. Green densitywas useful for predicting lumber stiffness when combinedwith acoustic velocity and log position (R2 = 0.64,RMSE = 1.14 GPa). The addition of green density is interest-ing given that it was so poorly correlated with basic density,MOE, and MOR. A constant green density value of 1000 kg/m3 is typically used when acoustic tools are applied to eitherstanding trees or logs, when calculating dynamic MOE. Thedifferences observed in green density illustrate that this prac-tice is not entirely appropriate. In this study, green and basicdensity of the logs were estimated from disks cut from theends of the logs or 4 disks from the tree-length log, and thus,it is not known how accurate the estimate of basic density was
throughout the entire log. Future tests that examine drillingresistance or Pilodyn penetration would be of value in loblollypine given that they are both rapid measurements that relate towood density.
Incorporating wood property evaluation into studies can bedifficult given the relative cost associated with transportingsamples back to the laboratory and performing any subsequentmeasurement on the samples. Comparatively, measuringacoustic velocity on logs is rapid and provides valuable infor-mation on the quality of the log. Overall, the acoustic velocitymodels had improved prediction performance compared to thebasic density models. These factors suggest that many foreststudies could incorporate acoustic velocity of tree-length andlumber-length logs at relatively little expense.
For the multiple regression models, log diameter measure-ments are typically measured in the field and thus feasible toincorporate into models. In mills, diameter measurements areroutinely conducted via lasers which yield a complete pictureof the log dimensions, and thus, mill equipment would likelyyield more accurate models than the models developed here.In the field, measurements of live crown are routine but are notfeasible at a mill. Mills could determine green density viaweight measurements linked to the volume as determined byscanning, and thus, the accuracy would likely be increasedover our predicted green density based on disks. In the field,measuring green density will likely continue to be relied onestimates based on disk information. The largest branch isrelatively easy to collect in the field; however, there is a needto develop accurate, low cost, and rapid techniques for mea-suring branch characteristics in the field. At mills, branch in-formation could be included into models based on the volumescans in logs where the branches have not been covered overby wood growth.
Of the variables examined here, acoustic velocity provedthe most useful for segregating logs based on the resultingMOE of the lumber produced from them. However, theMOE mode l s f o r t h e t r e e - l e ng t h (R 2 = 0 . 5 3 ,RMSE = 0.90 GPa) and lumber-length logs (R2 = 0.49,RMSE = 1.37 GPa) suggest that 53 and 49% of the variationin lumber MOE is being accounted for by acoustic velocity;however, this is not the case because of the within log
Table 7 Comparison of variation sources for loblolly pine and Sitka spruce lumber (Moore et al. 2013)
Density Modulus of Elasticity Modulus of RuptureVariation Source (kg m-3) (GPa) (MPa)
Loblolly pine Sitka spruce Loblolly pine Sitka spruce Loblolly pine Sitka spruce
Site 23% 23% 14% 26% 6% 18%
Tree within site 27% 51% 17% 36% 10% 25%
Log within tree 4% 1% 10% 2% 0% 5%
Within log 46% 25% 59% 36% 84% 52%
Annals of Forest Science (2017) 74: 20 Page 13 of 15 20

variation that exist because of pith to bark and stump to tipchanges in wood properties. For the tree-length logs, 76% ofvariation for tree-length logs is found within the log; thus,segregation is only explaining 13% (53% * (100%-76%)) ofthe variation in lumber properties. Likewise, for the lumber-length logs, 59% of the variation is found within the log, andthus, segregation is only explaining 20% of the total variation.Thus, any segregation strategy needs to balance the fact thatlumber produced within logs will contain a mixture of lumberthat will meet or not meet specified design values.
The segregation acoustic velocity values differ greatly fromusing the models to predict lumber MOE because of the var-iability in the prediction equation. For the tree-length models,a velocity value of 4150 m/s is needed for the tree-length logto meet the 11.0 GPa MOE design value for the No. 1 grade.However, for the logs sampled, a threshold value of 3170 m/swould result in the remaining logs that were not excluded toproduce lumber that overall met the 11.0 GPa design value.The first approach would exclude 41% of the logs of which31% were excluded improperly, whereas the segregation ap-proach would exclude 19% of the logs and 0% of the logswere improperly excluded. For the lumber-length models, avelocity value of 3400 m/s is needed for the lumber-lengthlogs to meet the 11.0 GPa MOE design value for the No. 1grade. However, for the logs sampled, a threshold value of3210 m/s would result in the remaining logs to produce lum-ber that overall met the 11.0 GPa design value. The first ap-proach would exclude 36% of the logs of which 33% wereexcluded improperly, whereas the segregation approachwould exclude 27% of the logs and 3% of the logs wereimproperly excluded. Given variation from pith to bark andstump to tip that exists in logs, and the differences found in thelumber stiffness between log heights, perhaps the most prac-tical situation would be to buck the stem into logs, and thenchange the sawing pattern for the top logs if theymet specifiedthresholds. Over time, a mill could collect enough data tomake informed decisions about the lumber properties of thelogs prior to sawing which when coupled with information onthe age and stand history of the logs could result in betterinformed procurement decisions.
5 Conclusions
The results from this study show that evaluating acoustic ve-locity of loblolly pine tree-length and lumber-length logs canbe used to segregate logs for lumber modulus of elasticity. Theutilization of acoustics is not dependent on knowing tree orstand information such as age, site quality, and silviculturehistory. The relatively ease of use means that tree-length andlumber-length logs for loblolly pine could be evaluatedthroughout the supply chain to give a better indicator of theresulting product quality. Wood properties have traditionally
been expensive to measure and most tests are destructive. Formills, acoustics could be factored into sawing solution deci-sions thereby identifying higher velocity logs that could besawn specifically to make smaller width machine stress ratedlumber. Consequently, lower velocity logs could be turnedinto timbers that are then treated. Product sorting by millscould result in paying premium or reduced prices for logs thatexceed or do not meet specifications, respectively.
Acknowledgements This research was possible through support fromthe Plum Creek Timber Company, the National Science Foundation(NSF) Center for Advanced Forest Systems (CAFS), McIntire-Stennis,and the Wood Quality Consortium (WQC) at the University of Georgia.The authors wish to thank Plum Creek Timber Company, NSF CAFS,and the WQC for funding this project. We gratefully acknowledge VarnWood Products LLC for processing the logs into structural lumber. Theauthors gratefully thank the editor and reviewers at Annals of ForestScience for their helpful and insightful comments.
References
Achim A, Paradis N, Carter P, Hernández RE (2011) Using acousticsensors to improve the efficiency of the forest value chain inCanada: a case study with laminated veneer lumber. Sensors 11:5716–5728
ASTM International (2013) ASTMD4761–13: Standard test methods formechanical properties of lumber and wood-base structural material.West Conshohocken, PA
ASTM International (2014a) ASTM D198–14: Standard test methods ofstatic tests of lumber in structural sizes. West Conshohocken, PA
ASTM International (2014b) ASTM D1990–14: Standard practice forestablishing allowable properties for visually-graded dimensionlumber from in-grade tests of full-size specimens. WestConshohocken, PA
ASTM International (2014c) ASTM D2395–14: Stand test methods fordensity and specific gravity (relative density) of wood and wood-based materials. West Conshohocken, PA
Auguie B (2016) gridExtra: Miscellaneous functions for “grid” graphics.R package version 2.2.1. https://CRAN.Rproject.org/package=gridExtra
Bates D, Maechler M, Bolker B, Walker S (2015) Fitting linear mixed-effects models using lme4. J Stat Softw 67:1–48
Borders BE, Bailey RL (2001) Loblolly pine – pushing the limits ofgrowth. South J Appl For 25:69–74
Butler A, Dahlen J, Daniels RF, Eberhardt TL, Antony F (2016a)Bending strength and stiffness of loblolly pine lumber from inten-sively managed stands located on the Georgia lower coastal plain.Eur J Wood Prod 47:91–100
Butler A, Dahlen J, Antony F, KaneM, Eberhardt TL, Jin H, Love-MyersK, McTague JP (2016b) Relationships between loblolly pine smallclear specimens and dimension lumber tested in static bending.Wood Fiber Sci. In press
Carter P, Chauhan S, Walker J (2006) Sorting logs and lumber for stiff-ness using director HM200. Wood Fiber Sci 38:49–54
ChangW (2014) extrafont: Tools for using fonts. R package version 0.17.http://CRAN.R-project.org/package=extrafont
Chen ZQ, Karlsson B, Lundqvist SO, Gil MRC, Olsson L, Wu HX(2015) Estimating solid wood properties using Pilodyn and acousticvelocity on standing trees of Norway spruce. Ann For Sci 72:499–508
20 Page 14 of 15 Annals of Forest Science (2017) 74: 20

Clark A III, Jordan L, Schimleck L, Daniels RF (2008) Effect of initialplanting spacing on wood properties of unthinned loblolly pine atage 21. Forest Prod J 58:78–83
Dahlen J, Antony F, Li A, Love-Myers K, Schimleck L, Schilling EB(2015) Time-domain reflectometry for the prediction of loblolly pineand sweetgum moisture content. Bioresources 10:4947–4960
Grabianowski M, Manley B, Walker JCF (2006) Acoustic measurementson standing trees, logs and green lumber.Wood Sci Technol 40:205–216
Green DW, Shelley BE, Vokey HP (1989) In-grade testing of structurallumber. In: Proceedings of workshop sponsored by In-grade TestingCommittee and Forest Products Society. Proceedings 47363.Madison, WI: Forest Products Society
Hanley JA, McNeil BJ (1982) The meaning and use of the area under areceiver operating characteristic (ROC) curve. Radiology 143:29–36
Hothorn T, Bretz F, Westfall P (2008) Simultaneous inference in generalparametric models. Biometrical J 50:346–363
Isik F, Li B (2003) Rapid assessment of wood density of live trees usingthe Resistograph for selection in tree improvement programs. Can JFor Res 33:2426–2435
KuznetsovaA, Brockhoff PB, ChristensenRHB (2016) lmerTest: Tests inlinear mixed effects models. R package version 2.0–30.https://CRAN.R-project.org/package=lmerTest
Larson PR, KretschmannDE, Clark III A, Isebrands JG (2001) Formationand properties of juvenile wood in southern pines. US For Serv.Forest Products Laboratory. FPL-TR-129
Lasserre JP, Mason EG, Watt MS, Moore JR (2009) Influence of initialplanting spacing and genotype on microfibril angle, wood density,fibre properties and modulus of elasticity in Pinus radiata D. Doncorewood. Forest Ecol Manag 258:1924–1931
McAlister RH, Clark A III (1991) Effect of geographic location and seedsource on the bending properties of juvenile and mature loblollypine. Forest Prod J 41:39–42
McKeand S, Mullin T, Bryam T, White T (2003) Deployment of genet-ically improved loblolly and slash pines in the south. J Forest 101:32–37
Moore JR, Lyon AJ, Searles GJ, Lehneke SA, Ridley-Ellis DJ (2013)Within- and between-stand variation in selected properties of Sitkaspruce sawn timber in the UK: implications for segregation andgrade recovery. Ann For Sci 70:403–415. doi:10.1007/s13595-013-0275-y
Mora CR, Shimleck LR, Isik F, Mahon JM Jr, Clark A III, Daniels RF(2009) Relationships between acoustic variables and different mea-sures of stiffness in standing Pinus taeda trees. Can J For Res 39:1421–1429
Munsell JF, Fox TR (2010) An analysis of the feasibility for increasingwoody biomass production from pine plantations in the southernUnited States. Biomass Bioenerg 34:1631–1642
Murphy G, Cown D (2015) Stand, stem and log segregation based onwood properties: a review. Scan J For Res 30:8, 757–8, 770
Pinheiro J, Bates D, DebRoy S, Sarkar D, R Core Team (2016) nlme:Linear and nonlinear mixed effects models_. R package version 3.1-127. http://CRAN.R-project.org/package=nlme
R Core Team (2016) R: A language and environment for statistical com-puting. R Foundation for Statistical Computing, Vienna, Austria.URL http://www.R-project.org/
Ratcliffe B, Hart FJ, Klápště J, Jaquish B, Mansfield SD, El-Kassaby YA(2014) Genetics of wood quality attributes in western larch. Ann ForSci 71:415–424
Robin X, Turck N, Hainard A, Tiberti N, Lisacek F, Sanchez JC, MüllerM (2011) pROC: An open-source package for R and S+ to analyzeand compare ROC curves. BMC Bioinformatics, 12, p. 77
Ross RJ (2015) Nondestructive evaluation of wood: second edition.USDA Forest Service, Forest Products Laboratory. FPL-GTR-238
Ross RJ, McDonald KA, Green DW, Schad KC (1997) Relationshipbetween log and lumber modulus of elasticity. Forest Prod J 47:89–92
RStudio (2016) RStudio: Integrated development environment for R.Boston, MA. https://www.rstudio.com/
Southern Pine InspectionBureau (SPIB) (2013) Supplement No. 13 to theSouthern Pine Inspection Bureau Grading Rules 20012 Edition. 11February 2013. Southern Pine Inspection Bureau, Pensacola, FL.11 pp
USDA Forest Service (1988) The South’s fourth forest; alternative for thefuture. US For Serv., Forest Resou. Rept. 24. U.S. Gov. Print. Office.Washington, D.C. 512 pp
Vance ED, Maguire DA, Zalesney RS Jr (2010) Research strategies forincreasing productivity of intensively managed Forest plantations. JForest 108:183–192
Vikram V, Cherry ML, Briggs D, Cress DW, Evans R, Howe GT (2011)Stiffness of Douglas-fir lumber: effects of wood properties and ge-netics. Can J For Res 41:1160–1173
Wang X (2013) Acoustic measurements on trees and logs: a review andanalysis. Wood Sci Technol 47:965–975
Wang X, Ross RJ, Mattson JA, Erickson JR, Forsman JW, Geske EA,Wehr MA (2002) Nondestructive evaluation techniques forassessing modulus of elasticity and stiffness of small-diameter logs.Forest Prod J 52:79–85
Wang X, Verrill S, Lowell E, Ross RJ, Herian VL (2013) Acoustic sortingmodels for improved log segregation. Wood Fiber Sc 45:343–352
Wessels CB, Malan FS, Rypstra T (2011) A review of measurementmethods used on standing trees for the prediction of some mechan-ical properties of timber. Eur J Forest Res 130:881–893
Wickham, H (2009) ggplot2: Elegant graphics for data analysis. Springer-Verlag, New York
Wickham H, Francois R (2015) dplyr: A grammar of data manipulation.R package version 0.4.3. https://CRAN.Rproject.org/package=dplyr
Zhi-ru Z, Zhao M-C, Wang Z, Wang BJ, Guan X (2013) Acoustic testingand sorting of Chinese poplar logs for structural LVL products.Bioresources 8:4101–4116
Annals of Forest Science (2017) 74: 20 Page 15 of 15 20