Embed Size (px)
Citation preview

_____________________________________________________________________________________________________ *Corresponding author: E-mail: [email protected], [email protected];
Journal of Energy Research and Reviews 5(1): 16-33, 2020; Article no.JENRR.57258 ISSN: 2581-8368
Acoustic Energy Harvesting in Nigeria: Prospects, Technical Problems and Socio-Economic Obstacles
Michael U. Onuu1*
1Engineering Physics Research Group, Department of Physics/Geology/Geophysics, Alex Ekwueme
Federal University, Ndufu-Alike, Ebonyi State, Nigeria.
Author’s contribution
The sole author designed, analysed, interpreted and prepared the manuscript.
Article Information
DOI: 10.9734/JENRR/2020/v5i130139 Editor(s):
(1) Dr. Huan-Liang Tsai, Professor, Da-Yeh University, Taiwan. Reviewers:
(1) Alice Elizabeth González, Universidad de la República, Uruguay. (2) Bankole Adebanji, Ekiti State University, Nigeria.
(3) Jan Warczek, Silesian University of Technology, Poland. Complete Peer review History: http://www.sdiarticle4.com/review-history/57258
Received 02 May 2020 Accepted 21 May 2020
Published 27 May 2020
ABSTRACT
Aims: To investigate the prospects or potentials of acoustic energy harvesting in Nigeria as well as highlight technical problems and socio-economic obstacles. Study Design: The study re-examined existing data, noise levels and noise power, from road traffic, aircraft, industrial/occupational, outdoor and indoor noise sources. Noise levels and noise power obtained from recent measurements of such noise sources were also examined and analyzed. The data were compared with values from noise sources used for electricity in other countries of the world. Technical problems and socio-economic obstacles have been highlighted. Place and Duration of Study: The study was carried out in Abakaliki, Ebonyi State, Nigeria. The duration was one year: April, 2019 and April, 2020. Methodology: Wide range noise level measurements, analysis and re-examination of existing data on road traffic, aircraft, industrial/occupational, outdoor and indoor noise were conducted, in line with the objectives of the study, in cities, industries as well as homes with different noise features. Measurements were carried out using sound level meter, SLM, (Bruel and Kjaer 2203) with �
� –
octave band filter and SLM, EXTECH 407750 with RS232, sound level recorder (B & K 7005), and noise level (statistical) analyzer (B & K 2121) to obtain noise levels and indices. Also, noise power was subsequently obtained for each of the various noise levels and indices. Results: Maximum noise levels, Lmax.; noise power, Wmax.; octave band pressure levels, BPLs; and other indices for the different noise sources were determined. Lmax. and Wmax for aircraft were as
Original Research Article

Onuu; JENRR, 5(1): 16-33, 2020; Article no.JENRR.57258
17
high as 116 dB and 0.4 W, respectively, while those for industry and road traffic ranged from 104.0 dB-131.0 dB and 67.5 dB-85.6 dB corresponding to 0.025 W-12.59 W and 0.0000056 W-0.00036 W, respectively. Spectral power of road traffic noise varied between 5.17 x 10
-5 W and 9.69 x 10
-3
W. Outdoor and household noise sources had Lmax. of up to 48.5 dB and 88.0 dB, that is, 0.000000071 W and 0.00063 W, for quiet and noisy periods, respectively. It was observed that road traffic noise has the highest potential for acoustic energy harvesting in Nigeria being reasonably steady over time, especially, on intra-city roads. Availability of tricycles/motorcycles in abundance and frequent use of horn by motorists support this assertion. The noise levels and noise power from these sources obtained in this investigation are higher than those that have been used as input to acoustic energy harvesters (AEHs) such as piezoelectric based and triboelectric nanogenerators (TRENGs) to achieve known efficiencies as reported elsewhere. Conclusion: The noise power is such that it could be used in powering microelectronic components, devices and in lighting light emitting diodes (LEDs). Power supply (PS) audio noise harvesters (ANHs) have been identified as potential noise energy sources since there is wide range use of air-conditioned by the political class, elites and government agencies in Nigeria where maximum temperature of 47.2°C is attainable. These findings show the viability of AEH in Nigeria and their addition to the existing body of knowledge in the emerging area of AEH will open a new window of research in AEH in this part of the world. Other prospects of AEH in Nigeria, technical problems and socio-economic obstacles are highlighted.
Keywords: Acoustic energy; Nigeria; global energy demand; noise power; conversion efficiency;
challenges; technical problems; socio-economic obstacles. 1. INTRODUCTION
1.1 Overview: Global Energy Demand and Popular Energy Sources
It has long been known that there is global energy crisis. Solar, nuclear and renewable sources of energy such as photovoltaic energy, wind energy, geothermal energy and wave energy were hitherto identified as possible resources to match the anticipated demand. Others are hydroelectric, wet geothermal, tidal and ocean energies. Gholap [1] had estimated that the contribution of these renewable sources of energy was 1 TW at maximum feasible expectation. This is equivalent to 3.15 x 10⁶ J/annum and represented only about 0.001% of world energy consumption then. It was asserted then that the consumption of energy in the world was 2.30 x 10
23 Jyear
-1, which is equivalent to
the energy produced when 1.84 x 10¹⁵ kg of coal is burnt [1]. Still on world energy demand, Gholap [1] posited that in 2030, the world consumption of energy will be 6.23 x 10
23 Jyear
-
1. It was estimated that with nuclear (fission)
source of energy, available ore (uranium and thorium) can supply energy for the next 50 years [2] when the annual energy consumption of 1.00 x 10
24 Jyear
-1 or more for the year 2050 is taken
into account [3]; and that the global demand of energy of 3.35 x 1024 Jyear-1 is expected by the year 2100 when the world population would grow to about 13 billion. Global population was later
projected to increase from 6.7 billion in 2008 to 9.2 billion in 2050 [4]. Rapid population growth, industrialization and urbanization have been identified as reasons for the rapid increase in the global energy demand; and unless a radical energy policy is taken and implemented by every country of the world, there will be a serious problem of energy crisis in the future [5,6]. Onuu [5] re-examining existing data on energy, obtained an empirical relationship between world energy demand, E(t), as a function of time, t, in years. The exponential equation is of the form [5]: E(t) = Eo exp bt (1) where Eo is energy in joules/annum. Analysis of the data points yielded values for the regression coefficients, Eo and b as 433.3 x 10²² and 0.024, respectively. Hence, eqn. (1) becomes E(t) = 433.3x10
22exp (0.024)t (2)
Eo and b characterize the energy demand curve. Although energy supply in many countries of the world comes from oil and coal reserves which stand at about 274 and 76,000 billion tons,
Onuu; JENRR, 5(1): 16-33, 2020; Article no.JENRR.57258
18
respectively, their rapid depletion for electricity generation and the fact that they are impure sources of energy have necessitated the vigorous search for alternative sources. Also, the anthropogenic emission of CO into the atmosphere arising from the extensive use of coal, and other sources of CO, will bring about an increase in mean temperature of the earth’s surface by 2-3 K, and will in turn cause recession of the polar ice cap by 100 of latitude [1,7].
1.2 Problems of Popular Energy Sources Although conventional, nuclear and other sources of energy have some advantages, they also have some problems as highlighted below. 1.2.1 Conventional and nuclear sources of
energy I. Oil and coal: The major problem of oil and
coal is that their reserves are being depleted [4,8-11]. In addition, they pollute the environment and also cause global warming [7,12,13].
II. Nuclear fuels: Schlissel and Biewald [14] reported that there is high capital cost of nuclear power stations, particularly. Apart from life of nuclear fuels being short, confinement problem of the plasma is difficult to solve even with the TOKOMAK, the Russian acronym for toroidal chamber with magnetic coils, in the area of magnetic confinement [15].
1.2.2 Renewable energy sources
I. Solar energy: Solar energy is difficult to
exploit because of its intermittence, irregularity and storage problem and the fact that it requires a large series of measurements. Other problems are reliability and distribution of instruments in solar radiation measurement: climatic data (aerosols, visibility, etc.), choice and follow-up of installations as well as socio-economic obstacles [16]. Solar energy has very low thermodynamic energy of thermal converters compared with fossil fuels and nuclear sources. It has large size of converters which arises from the bulky materials used [1]. Low efficiency of photovoltaic modules based on amorphous silicon (a-Si)/crystalline Si is the major problem of such modules.
II. Wind energy: For maximum power to be generated, the area swept by the rotor, A, in m2, in the turbine of wind energy conversion systems (WECS) is much which means bulky materials are required [17]. Also, wind speed should be high enough, which may not be obtainable because of environmental factors.
III. Hydroelectric energy: Although hydroelectric power is a very important source renewable energy, it has some environmental consequences as it can destroy the ecosystems. It is expensive to build and maintain because of the draining expenses; has potential for droughts and takes long time, in years, to build a new hydroelectric power plant.
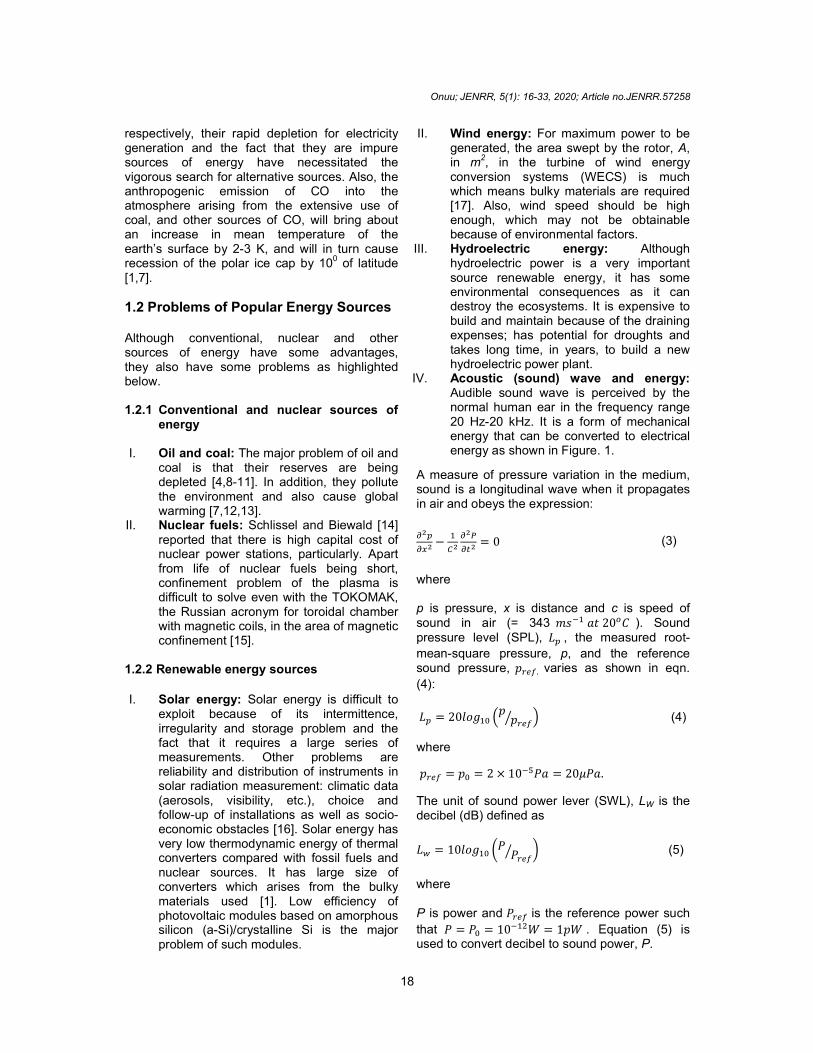
IV. Acoustic (sound) wave and energy: Audible sound wave is perceived by the normal human ear in the frequency range 20 Hz-20 kHz. It is a form of mechanical energy that can be converted to electrical energy as shown in Figure. 1.
A measure of pressure variation in the medium, sound is a longitudinal wave when it propagates in air and obeys the expression:
���
��� −�
��
���
��� = 0 (3)
where p is pressure, x is distance and c is speed of sound in air (= 343 ���� �� 20�� ). Sound pressure level (SPL), �� , the measured root-
mean-square pressure, p, and the reference sound pressure, ����. varies as shown in eqn.
(4):
�� = 20����� ��
����� � (4)
where
���� = �� = 2 × 10���� = 20���.
The unit of sound power lever (SWL), LW is the decibel (dB) defined as
�� = 10����� ������
� � (5)
where P is power and ���� is the reference power such
that � = �� = 10���� = 1�� . Equation (5) is used to convert decibel to sound power, P.
Onuu; JENRR, 5(1): 16-33, 2020; Article no.JENRR.57258
19
Figure. 1. Schematic diagram of a typical acoustic energy-harvesting (AEH) system [18] Sound propagating through narrow tubes or small-scale structures has viscous loss which contributes to acoustic damping and the thickness of the viscous layer, d, related to the frequency by [19]:
� = �2�
��� (6)
where � is the dynamic viscosity (=1.81 x 10
-5
kgms = 18.1 ���) , ρo is the density of air (= 1.225kgm-3) and � is the angular frequency (� = 2��). Therefore, effort should be made to decrease the effect of viscous layer when low frequency sound is propagated in air. For example, for a 100 Hz sound in air, d = 0.22mm. Africa needs renewable energy very badly. It is projected that more than half a billion people would be added to Africa’s urban population by 2040; and this is much higher than the growth in China’s urban population between 1990 and 2010, the period when China witnessed the largest production of materials such as steel and cement in order to cope with the challenge and tried to battle with the consequent energy crisis [20]. As at now, there is no deliberate policy by any African country to address the energy challenge despite the fact that Africa has the richest resources in the world to harness solar energy using PV. Africa has installed only about 5 GW of solar PV which is less than the 1% of the global total [20]. Solar PV, it is expected, would provide the cheapest source of electricity for many of the 600 billion people who do not have access to electricity today [20,21]. According to Birol [20], wind and solar PV have been identified as star performers all over the world with hydropower (15% of total generation in 2040) and nuclear (8%) retaining major shares. Research on the new field of AEH has been conducted in some countries of the world, including a few African countries beside Nigeria, in the quest towards addressing the energy challenge. This is despite the fact that Nigeria is
one of the countries in Africa that has the highest potentials for the production of acoustic/noise energy. The objectives of this study are, therefore, to investigate the prospects of AEH in Nigeria, highlight the technical problems and socio-economic obstacles in the quest towards solving the global energy problem. 1.3 Cost of Generated Electricity
In Nigeria, it is difficult to access electricity as electricity supply is unreliable. It is estimated that households spend ₦4.34 trillion ($12 billion) annually on self-generated power where ₦ is the symbol for the Nigerian Naira. International Monetary FUND (IMF), in a survey asserts that the economic loss is about ₦10.5 trillion ($29 billion)/annum. While 27% of Nigerian firms identified electricity as the main obstacle to doing business according to the survey, households that have access to on-grid electricity had an average power supply of only 9.2 hours a day in the first half of 2019 [22]. IMF further stated that electricity production per capita in Nigeria is less than 15% of the average of emerging- market economies and less than 25% of the sub-Saharan Africa average.
Generally, for all systems, the cost of generated electricity per kWh which depends on a number of variables is given as [17]:
C = (I x F + O & M) E-1
(7)
where I is the total investment cost in dollars, F is the fixed charge rate, O & M is the annually generated energy in kWh. The depreciation of our money, naira, in terms of dollar therefore constitutes a serious problem in our quest to be energy sufficient.
1.3.1 Cost of power supply from electric generators
Cost of power supply from electric generators in Nigeria is high. Prices of electric generators vary
Onuu; JENRR, 5(1): 16-33, 2020; Article no.JENRR.57258
20
depending on the model and capacity or power rating. For example, Honda EM650Z 450 VA Portable Low Noise Generator costs between ₦50,000 ($138) and ₦57,000 ($157.5) while the price of Honda EU65iS 5.5 kVA Compact Low Noise Generator with built-in inverter is in the range ₦630,000 ($1,740.3)- ₦668,000 ($1,845.3). For the Fireman model, the prices are in the ranges: ₦31,000 ($85.6)-₦45,000 ($124.3) for Fireman 720 VA SPG 1200 and ₦215,000 ($594)-₦350,000 ($967) for Fireman 7 kVA 10990 ES. Fueling of the generators is a very expensive project with the attendant noise and air pollution. Petrol (PMS) costs ₦145 ($0.4) per litre while the price of diesel, Automotive Gas Oil (AGO) is between ₦241.88 ($0.67). 1.3.2 Cost of solar energy Some Nigerians are now managing to cope with the challenge of epileptic power supply by using alternative power sources. Solar panel and a 12 V battery of 200 AH rating that can charge panels that have power rating that range from 125 W-400W to full capacity are available. A combination of a solar panel with a power wall inverter and a controller cost as much as ₦725,000.00 ($2,002.8) depending on the
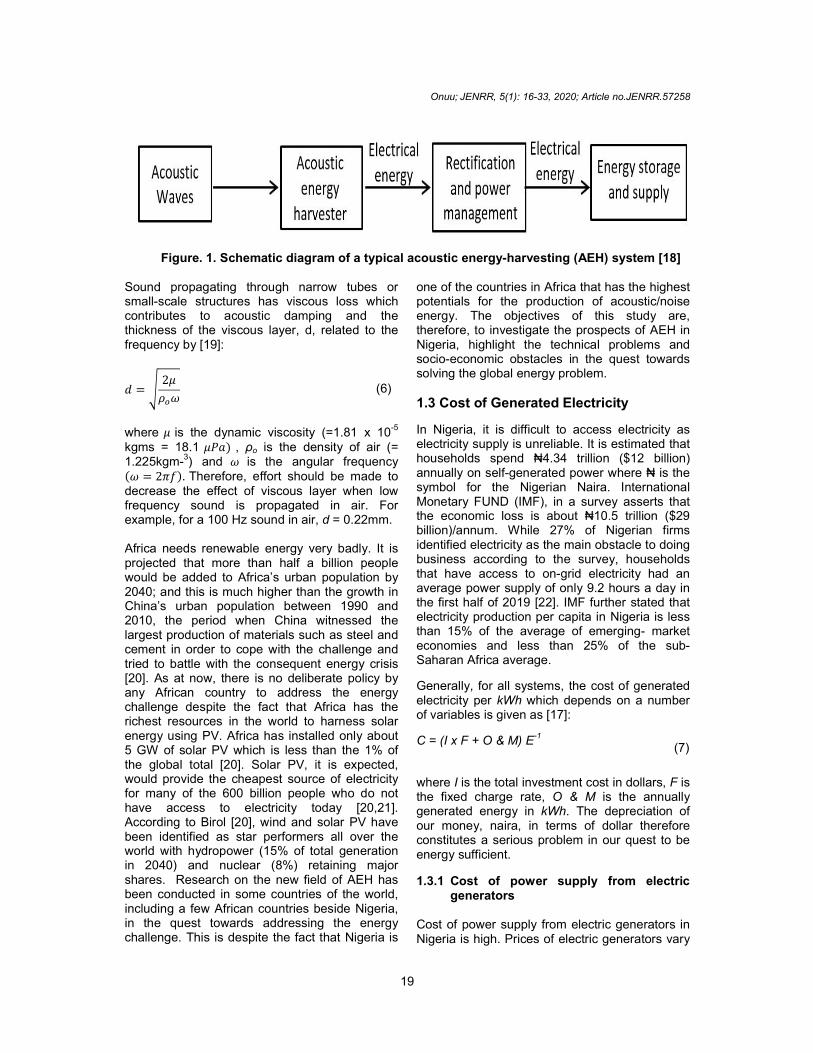
number of batteries. For example, a 5 kVA inverter with four 200 AH batteries and eight 250 W solar panel cost ₦1,450,000 ($4,005.5). A solar panel costs as much as ₦120,000 ($331.5) per unit. Although, these prices depend on the various solar panel brands and type of battery in Nigeria, the price difference is not much. 1.3.3 Cost of harvesting acoustic energy A simple cost-effective approach for the construction of high performance triboelectric nano generator (TRENG) to convert ambient noise into electricity that enables self-powered sensing applications with potential applications in military surveillance, artificial intelligence, Internet of Things (IoT) and jet engine noise reduction was developed by Chen [23]. Although wind energy, geothermal, biogas and photovoltaic (PV) when used alone as renewable sources is not fully promising economically, Rahman [24] proposed a technique which improved power production using a combination of renewable sources like solar PV, speed breaker (roller) and sound of traffic for hybrid electricity generation for street light application (Figure. 2).
Figure. 2. Block diagram for the working of the proposed integrated system [24]
Onuu; JENRR, 5(1): 16-33, 2020; Article no.JENRR.57258
21
2. METHODOLOGY AND ANALYSIS Noise level measurements of road traffic noise, aircraft noise, industrial/occupational noise, outdoor and indoor noise were made using the precision sound level meter, SLM, (Bruel and Kjaer 2203) with ½-octave band filter and sound level recorder (B & K 7005) which has frequency modulation for clarity. SLM, EXTECH 407750 with RS232 was also used for in situ measurements of noise levels. The B & K SLM and EXTECH SLM were placed on a tripod stand and held in the hand, respectively, with the microphone pointed to the noise source during measurements. In all the measurements, preliminary surveys were undertaken to identify points with high noise levels or “intolerable” noise levels in the case of the industries. The microphone was calibrated each time that field measurements were to be made. The noise source determined the type of physical measurements to be conducted. Generally, measurements were similar to other noise monitoring programmes in Ontario [25] and U.S.A. [26] and was in conformity with International Electrotechnical Commission (IEC), British Standards Institute (BSI) and International Standards Organization (ISO).
2.1 Road Traffic Noise The microphone was placed 1.0 m from the facades of houses/offices and from any reflecting surface and 1.2 m above the ground corresponding to the ear of an average human height. Counting was done for 20 minutes with the help of field assistants to estimate hourly volume of vehicles and composition. Approximate number of vehicles which included the “heavies”, buses, cars, tricycles and motorcycles were then counted and recorded from where hourly traffic volume and composition were determined. The survey covered 60 sites in eight (8) major cities in Nigeria with a wide range of urban conditions. At some of the sites, measurements were made each day for 24 hours: during daytime (0700-2200) and nighttime (2200-0700) periods, Monday to Friday [27].
2.2 Aircraft Noise Survey of aircraft noise was conducted in three (3) of the major Nigerian airports. The environmental noise climate at the airports and maximum noise levels LAmax. at landing and take-off were measured at 50-100 m from the aircraft.
2.3 Industrial Noise At any particular industrial plant, measurements were made at various points between 1 and 2 m from the source. To determine the point having the highest noise level, several measurements were made within a particular industrial plant and noise levels were recorded. There were 27 industries in southeastern Nigeria where measurements were made [28] apart from the five (5) quarries located in Old Netim and Obung communities in Akamkpa Local Government Area of Cross River State [29]. These comprised: Cross River State (12), Akwa Ibom State (7) and River State (8).
2.4 Indoor/Household Noise Indoor or household noise measurements were made during the nighttime period (2200-0700) in over 20 homes with varying noise features. Apartments chosen for measurements were spacious enough to drastically reduce the effect of reverberant sound. Measurements were made at such times when the background noise level due to aircraft, industries, humans, animals and other outdoor noise was less than the indoor noise being measured by, at least, 10 dB [30]. Unless in cases where in situ measurements of noise levels were made, the tapes were subsequently played back sampled at two (2) seconds and analyzed using the noise level (statistical) analyzer (B & K 2121) within the audio frequency range (20 Hz to 20 kHz) in the Applied Acoustics Laboratory of the Department of Physics, University of Calabar, Cross River State, Nigeria to determine the required noise levels, indices and descriptors. Thereafter, the needed/corresponding noise power was computed using equation (5).
3. NOISE-(SOUND-) ENERGY CONVER-SION AND RESULTS
3.1 Perspective Sound being a form of mechanical energy can therefore be changed to another form of energy, say, electrical energy in accordance with the law of conservation of energy or the third law of thermodynamics mainly through the principle of electromagnetic induction. Vibration or structure-borne noise can generate enough electricity to power nearby phone-charging stations and illuminate electronic signage and advertising.
Onuu; JENRR, 5(1): 16-33, 2020; Article no.JENRR.57258
22
Cohen-Tanugi [31] noted that though still in the research phase, the technology of harvesting acoustic noise is more about mechanical vibrations than sound itself. The idea is definitely there, and it is quite promising [31]. Although this is feasible, the loudest noise is only equivalent to about a hundredth of watts per square metre (Table 1) [32]. The four main approaches to convert sound energy to electrical energy are by heating, by using diaphragm, through piezoelectric materials and an acoustic grating [31,32-35] demonstrated the possibility of converting sound into electrical energy by using a speaker and a transformer to convert noise produced by a car horn. A similar set up was used to demonstrate that vibration produced by noise can be converted into electrical energy. They also placed a speaker and a transformer at the distance of 1 metre from the exhaust pipe of 350 cubic centimeter engine of a motorcycle and harvested the energy. Farghaly and Hemeida [36] produced electrical energy from an area of 1.45 m2 containing 690 piezoelectric QB220-503YB transducers. Electrical energy produced by noise from the piezoelectric material from each of the selected stations was about 0.024 Watt-hr [36]. The suggested maximization of this application was hundreds of square metres in order to produce useful energy that can light 1 LED street lamp or it can be stored and used when needed for applications that need more energy. Road traffic noise level index, LDEN, was calculated for each of three locations in Alexandria [36]. The study was conducted during weekdays and weekends in order to study the noise produced in the selected stations and the amount of electric energy that could be produced and utilized in street lighting (Table 2). Choi and Kang [37] has pointed out recently that sound energy harvesting is one of the promising technologies due to the abundant and clean sound sources. It can be the semi-permanent alternative power supplies for wireless sensor networks (WSNs), which is significant in the Internet of Things. A comprehensive review of sound energy harvesting, focusing on presenting principles, examples and enhancement methods of sound energy harvesters has been conducted recently [37] while a comprehensive assessment of development of acoustic energy harvesting has been done [38]. There is, therefore, a clarion call
to researchers all over the world, especially developing countries such as Nigeria, where noise is adjudged by many as the necessary consequence of urbanization and industrialization, to join in the research towards the exploitation of noise as a source of clean sound energy.
3.2 Efficiency of Acoustic Energy
Conversion Systems Experimental results obtained by Noh (Table 3) [39] show that approximately 0.7 V was generated when sound pressure level (SPL) of 100 dB was incident on a large rectangular piezoelectric plate. Tables 3 and 4 [23,40] show the efficiency analysis from various types of piezoelectric unit and acoustic energy harvesting conversion efficiency, respectively.
3.3 Noise-energy Conversion in Nigeria Commencement of research in the area of environmental acoustics and noise pollution in Nigeria dates back to the late 1970s [41] and was continued in the 1980s [42-44] when it was observed that noise levels well exceeded recommended limits in Nigeria. This appears to be the very first set of studies conducted in this area of study in Nigeria and in West Africa. Later, different researchers of Nigerian nationalities have joined in the study making significant progress in advancing the frontiers of environmental acoustics and vibration or structure-borne noise in this part of the world [27-30,45-55]. A chronicle of work in environmental acoustics in Nigeria could be found in [52], a paper in honour of Professor Alex I. Menkiti where the status of acoustics in Nigeria was assessed. Some of these studies have identified road traffic noise as the major form of environmental noise pollution in Nigeria being persistent over time with measured maximum levels, Lmax. as high as 110 dB(A) (i.e. Wmax.= 0.1 W) in some cases with indiscriminate use of horn by motorists [27,45].
Researches bothering, in part, on levels of household noise, industrial/occupational noise, quarry noise, outdoor noise, aerodynamic noise and aircraft noise have been conducted with measurements and analyses undertaken [27-30,45,48,50,51,53]. Measured values of Lmax.as high as 131 dB (Wmax.= 12.59 W) were reported in most cases.

Onuu; JENRR, 5(1): 16-33, 2020; Article no.JENRR.57258
23
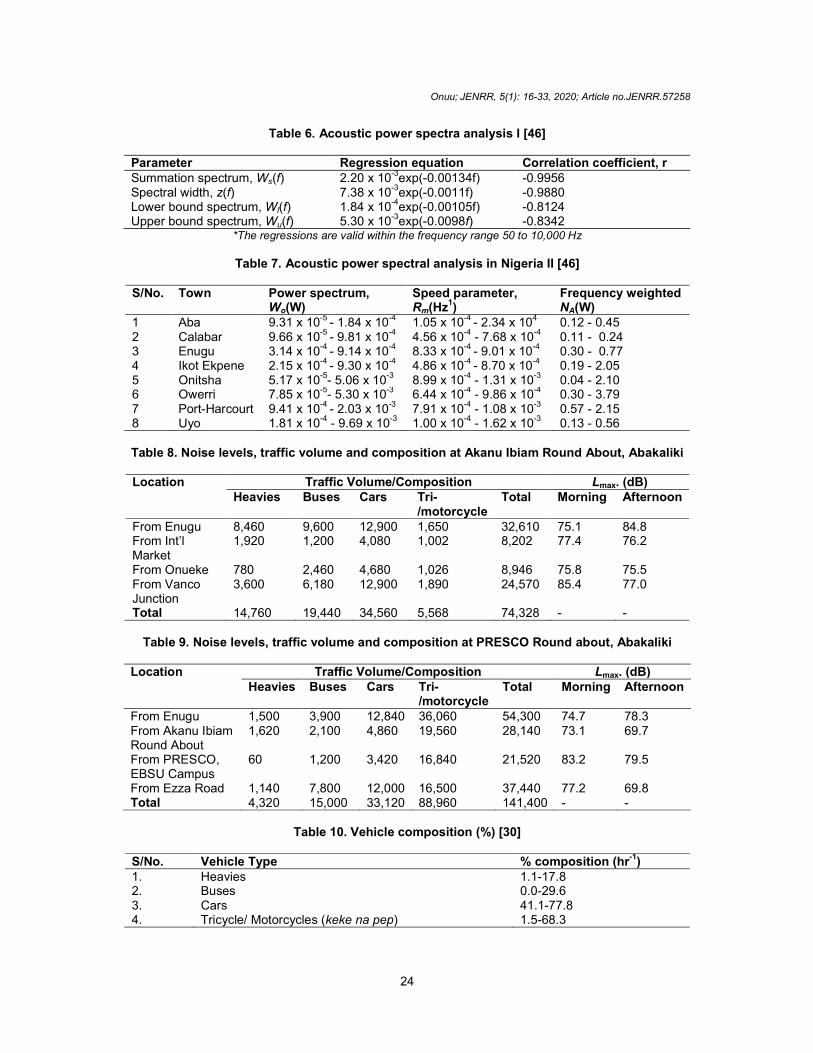
Data obtained from the wide-range measurements and physical surveys have been assessed and re-examined towards determining the prospects of acoustic energy harvesting or noise-(sound-) energy conversion in Nigeria (Tables 5-17). Table 5 shows data for aircraft
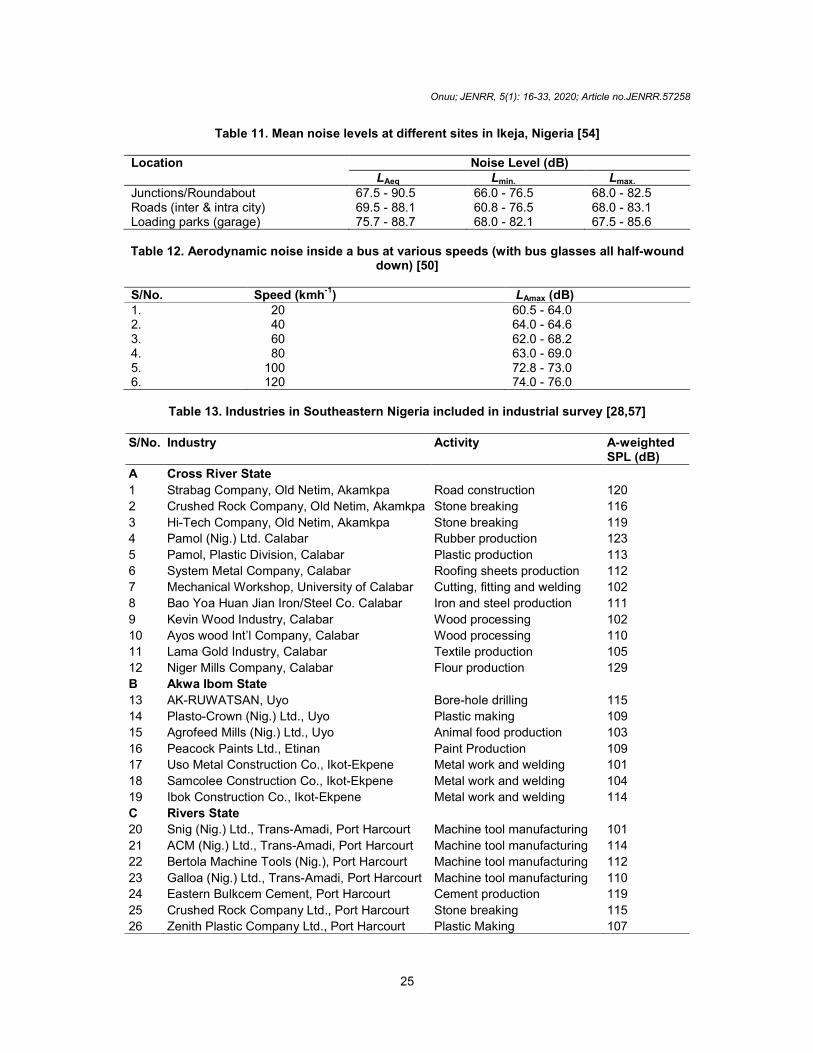
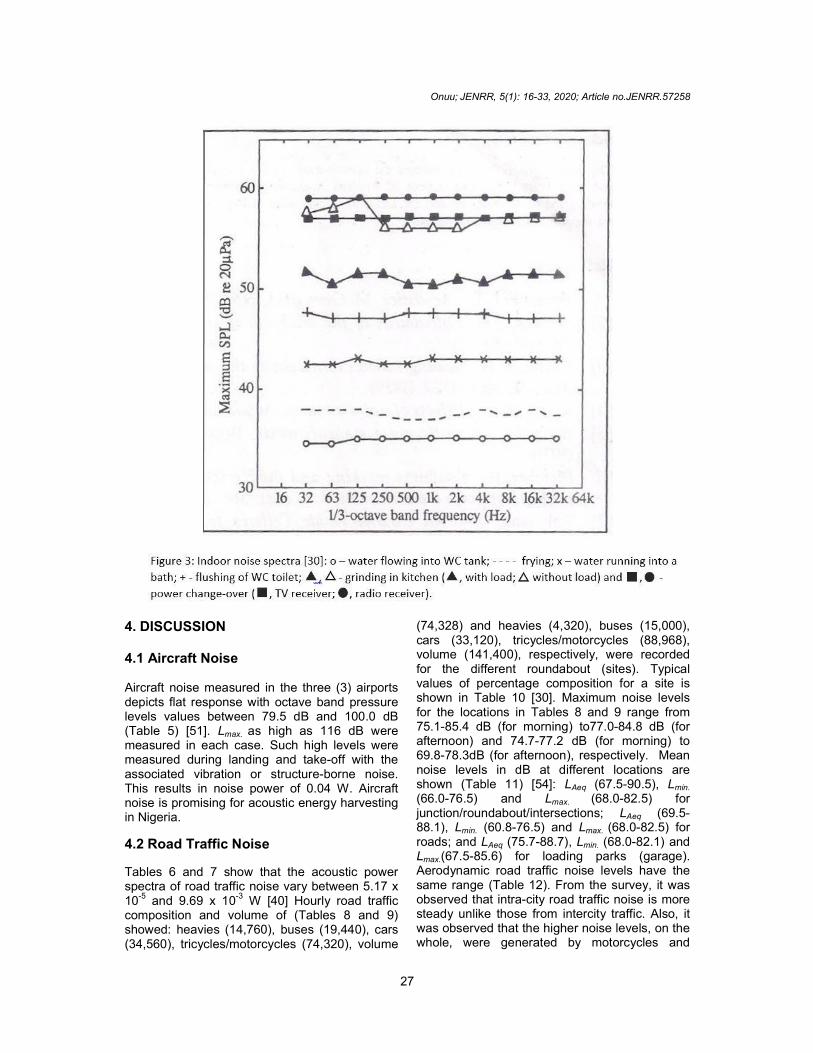
noise. Road traffic noise (Tables 6-11), aerodynamic noise in buses (Table 12), industrial/occupational noise (Tables 13-16) and outdoor noise (Table 17) are also shown while Figure. 3 shows levels and spectra of household noise.
Table 1. Typical sound power levels [32]
Source LW re 10
-12 W (1 pW (dB) Sound power (W)
Jet engine Loudspeaker rock 2 pneumatic hammers Pneumatic hammer Outboard motor Dishwasher Office Fridge Whisper Threshold
160 140 123 120 100 80 60 40 20 0
10,000 100 2 1 0.01 0.0001 0.000001 0.00000001 0.0000000001 10
-12
Table 2. Equivalent noise level, LAeq, in Alexandria, Egypt in three locations [36]
Timing Equivalent noise level, LAeq (dB) Level exceeding permissible limit (dB) Daytime Evening Night
75-85 80-85 75-80
10-20 20-25 20-25
Table 3. Efficiency analysis from various types of piezoelectric unit [39]
Model Area (������) Max. voltage (V) Efficiency(�������) Rectangular plate Large Circular plate Small Circular plate Cantilever beans
3.500 0.527 0.314 0.130
0.70 0.43 0.37 0.19
0.20 0.82 1.18 1.46
Table 4. Acoustic energy harvesting conversion efficiency [23,40]
Acoustic energy harvester Power range/Max. output power
density Resonant frequency
Piezoelectric based Electromagnetic based Triboelectric nanogenerators (TRENGs)
0.66 pW-30 mW 1.5mW-1.96 mW 7 W/m
2 at 170 Hz and 115 dB
146 Hz-6.7 kHz 143 Hz-470 Hz 20 Hz-1000 Hz
Table 5. Octave band pressure levels, BPL, in some Nigerian airports [51] *
Airport Octave band pressure level, BPL (dB) 31.5 63 125 250 500 1k 2k 4k 8k 16k 32k
Margaret Ekpo Int’l Airport, Calabar.
81.0 82.0 80.0 80.5 82.0 81.0 79.5 79.0 83.0 80.0 82.0
Port Harcourt Int’l Airport.
95.0 92.0 90.0 89.5 85.0 86.0 95.0 80.6 86.0 84.0 81.0
Murtala Mohammed Int’l Airport, Lagos.
99.0 98.0 100.0 94.0 95.0 100.0 88.5 90.0 82.0 90.0 84.0
*Lmax. was as high as 116 dB(A) (= 0.4 W) in each case
Onuu; JENRR, 5(1): 16-33, 2020; Article no.JENRR.57258
24
Table 6. Acoustic power spectra analysis I [46]
Parameter Regression equation Correlation coefficient, r Summation spectrum, Ws(f) Spectral width, z(f) Lower bound spectrum, Wl(f) Upper bound spectrum, Wu(f)
2.20 x 10⁻³exp(-0.00134f) 7.38 x 10
-3exp(-0.0011f)
1.84 x 10⁻⁴
exp(-0.00105f) 5.30 x 10⁻³exp(-0.0098f)
-0.9956 -0.9880 -0.8124 -0.8342
*The regressions are valid within the frequency range 50 to 10,000 Hz
Table 7. Acoustic power spectral analysis in Nigeria II [46]
S/No. Town Power spectrum, Wo(W)
Speed parameter, Rm(Hz
1)
Frequency weighted NA(W)
1 Aba 9.31 x 10⁻⁵ - 1.84 x 10⁻⁴ 1.05 x 10⁻⁴ - 2.34 x 10⁴ 0.12 - 0.45 2 Calabar 9.66 x 10
-5 - 9.81 x 10
-4 4.56 x 10
-4 - 7.68 x 10
-4 0.11 - 0.24
3 Enugu 3.14 x 10⁻⁴
- 9.14 x 10⁻⁴
8.33 x 10⁻⁴
- 9.01 x 10⁻⁴
0.30 - 0.77 4 Ikot Ekpene 2.15 x 10⁻⁴ - 9.30 x 10⁻⁴ 4.86 x 10⁻⁴ - 8.70 x 10⁻⁴ 0.19 - 2.05 5 Onitsha 5.17 x 10
-5- 5.06 x 10
-3 8.99 x 10
-4 - 1.31 x 10
-3 0.04 - 2.10
6 Owerri 7.85 x 10⁻⁵- 5.30 x 10⁻³ 6.44 x 10⁻⁴ - 9.86 x 10⁻⁴ 0.30 - 3.79 7 Port-Harcourt 9.41 x 10
-4 - 2.03 x 10
-3 7.91 x 10
-4 - 1.08 x 10
-3 0.57 - 2.15
8 Uyo 1.81 x 10⁻⁴
- 9.69 x 10⁻³
1.00 x 10⁻⁴
- 1.62 x 10⁻³
0.13 - 0.56
Table 8. Noise levels, traffic volume and composition at Akanu Ibiam Round About, Abakaliki
Location
Traffic Volume/Composition Lmax. (dB) Heavies Buses Cars Tri-
/motorcycle Total Morning Afternoon
From Enugu 8,460 9,600 12,900 1,650 32,610 75.1 84.8 From Int’l Market
1,920 1,200 4,080 1,002 8,202 77.4 76.2
From Onueke 780 2,460 4,680 1,026 8,946 75.8 75.5 From Vanco Junction
3,600 6,180 12,900 1,890 24,570 85.4 77.0
Total 14,760 19,440 34,560 5,568 74,328 - -
Table 9. Noise levels, traffic volume and composition at PRESCO Round about, Abakaliki
Location
Traffic Volume/Composition Lmax. (dB) Heavies Buses Cars Tri-
/motorcycle Total Morning Afternoon
From Enugu 1,500 3,900 12,840 36,060 54,300 74.7 78.3 From Akanu Ibiam Round About
1,620 2,100 4,860 19,560 28,140 73.1 69.7
From PRESCO, EBSU Campus
60 1,200 3,420 16,840 21,520 83.2 79.5
From Ezza Road 1,140 7,800 12,000 16,500 37,440 77.2 69.8 Total 4,320 15,000 33,120 88,960 141,400 - -
Table 10. Vehicle composition (%) [30]
S/No. Vehicle Type % composition (hr
-1)
1. 2. 3. 4.
Heavies Buses Cars Tricycle/ Motorcycles (keke na pep)
1.1-17.8 0.0-29.6 41.1-77.8 1.5-68.3
Onuu; JENRR, 5(1): 16-33, 2020; Article no.JENRR.57258
25
Table 11. Mean noise levels at different sites in Ikeja, Nigeria [54]
Location Noise Level (dB) LAeq Lmin. Lmax.
Junctions/Roundabout Roads (inter & intra city) Loading parks (garage)
67.5 - 90.5 69.5 - 88.1 75.7 - 88.7
66.0 - 76.5 60.8 - 76.5 68.0 - 82.1
68.0 - 82.5 68.0 - 83.1 67.5 - 85.6
Table 12. Aerodynamic noise inside a bus at various speeds (with bus glasses all half-wound
down) [50]
S/No. Speed (kmh-1
) LAmax (dB) 1. 2. 3. 4. 5. 6.
20 40 60 80 100 120
60.5 - 64.0 64.0 - 64.6 62.0 - 68.2 63.0 - 69.0 72.8 - 73.0 74.0 - 76.0
Table 13. Industries in Southeastern Nigeria included in industrial survey [28,57]
S/No. Industry Activity A-weighted SPL (dB)
A Cross River State
1 Strabag Company, Old Netim, Akamkpa Road construction 120
2 Crushed Rock Company, Old Netim, Akamkpa Stone breaking 116
3 Hi-Tech Company, Old Netim, Akamkpa Stone breaking 119
4 Pamol (Nig.) Ltd. Calabar Rubber production 123
5 Pamol, Plastic Division, Calabar Plastic production 113
6 System Metal Company, Calabar Roofing sheets production 112
7 Mechanical Workshop, University of Calabar Cutting, fitting and welding 102
8 Bao Yoa Huan Jian Iron/Steel Co. Calabar Iron and steel production 111
9 Kevin Wood Industry, Calabar Wood processing 102
10 Ayos wood Int’l Company, Calabar Wood processing 110
11 Lama Gold Industry, Calabar Textile production 105
12 Niger Mills Company, Calabar Flour production 129
B Akwa Ibom State
13 AK-RUWATSAN, Uyo Bore-hole drilling 115
14 Plasto-Crown (Nig.) Ltd., Uyo Plastic making 109
15 Agrofeed Mills (Nig.) Ltd., Uyo Animal food production 103
16 Peacock Paints Ltd., Etinan Paint Production 109
17 Uso Metal Construction Co., Ikot-Ekpene Metal work and welding 101
18 Samcolee Construction Co., Ikot-Ekpene Metal work and welding 104
19 Ibok Construction Co., Ikot-Ekpene Metal work and welding 114
C Rivers State
20 Snig (Nig.) Ltd., Trans-Amadi, Port Harcourt Machine tool manufacturing 101
21 ACM (Nig.) Ltd., Trans-Amadi, Port Harcourt Machine tool manufacturing 114
22 Bertola Machine Tools (Nig.), Port Harcourt Machine tool manufacturing 112
23 Galloa (Nig.) Ltd., Trans-Amadi, Port Harcourt Machine tool manufacturing 110
24 Eastern Bulkcem Cement, Port Harcourt Cement production 119
25 Crushed Rock Company Ltd., Port Harcourt Stone breaking 115
26 Zenith Plastic Company Ltd., Port Harcourt Plastic Making 107

Onuu; JENRR, 5(1): 16-33, 2020; Article no.JENRR.57258
26
Table 14. Noise levels generated by 63 kVA caterpillar power generator
�Distance from power house
door (m) Noise Levels
Lmax (dB Ldn (dB) Leq (dB) 4.0 90.2 88.0 97.4 7.0 84.0 80.5 87.0 14.0 81.5 81.7 91.0 15.0 74.0 72.0 89.5 25.0 70.0 67.5 75.0 50.0 60.5 60.0 70.0
4m and 7m are outside power house and radio room, respectively
Table 15. Summary of occupational noise levels in Nigeria [28]
State Noise level (dB)
Background A – weighted Lmax.
Cross River Akwa Ibom Rivers
42.5 - 61.0 45.5 - 64.0 45.5 - 68.5
101.5-129.0 101.0-115.0 100.5-127.0
108.5-131.0 108.0-119.5 104.0-130.5
Table 16. Summary of results of noise level measurements in some industries in Nigeria [57]
Type Noise level (dB) Background A - weighted Lmax.
44.5 - 68.0 100.5 - 127.0 104.0 - 131.0
Table 17. Maximum noise levels at various locations in a University in Nigeria [53]*
S/No Location Lmax. (for quiet period) (dB) Lmax. (for noisy period) (dB)
Indoor Outdoor Indoor Outdoor
1 Physics Lab. 1 44.0 46.0 74.2 77.0
2 Chemistry Lab. 1 44.0 45.0 64.5 68.0
3 Geology Lab. 1. 43.5 43.7 65.0 67.0
4 Biological Science (Room 222)
43.5 43.9 68.0 75.0
5 New Science Lecture Theatre (NSLT)
45.5 48.0 65.5 77.0
6 NSLT 2 46.0 47.5 66.0 75.0
7 New Library (NL) (Room 201)
46.5 48.0 67.0 75.5
8 NL (Room 202) 43.5 44.0 74.0 75.0 9 Law Lecture Room 46.5 47.5 76.0 79.0
10 Physiology Lab 43.0 44.0 75.0 77.0
11 Faculty of Arts Lecture Complex
45.0 46.5 64.0 69.5
12 New Art Theatre (NAT) 43.8 44.2 65.0 69.0
13 Lecture Room 202, Main campus
45.5 48.5 67.0 35.0
14 DBA Lecture Hall 43.5 44.0 74.0 88.0
15 Theatre Arts Display Hall, Main Campus
43.5 44.0 33.5 69.5
16 ETF Lecture Complex 43.8 44.0 57.0 66.0
17 Computer Centre, open space
- 46.5 - 84.0
*All indoor measurements were made with windows open
Onuu; JENRR, 5(1): 16-33, 2020; Article no.JENRR.57258
27
4. DISCUSSION 4.1 Aircraft Noise Aircraft noise measured in the three (3) airports depicts flat response with octave band pressure levels values between 79.5 dB and 100.0 dB (Table 5) [51]. Lmax. as high as 116 dB were measured in each case. Such high levels were measured during landing and take-off with the associated vibration or structure-borne noise. This results in noise power of 0.04 W. Aircraft noise is promising for acoustic energy harvesting in Nigeria.
4.2 Road Traffic Noise
Tables 6 and 7 show that the acoustic power spectra of road traffic noise vary between 5.17 x 10
-5 and 9.69 x 10
-3 W [40] Hourly road traffic
composition and volume of (Tables 8 and 9) showed: heavies (14,760), buses (19,440), cars (34,560), tricycles/motorcycles (74,320), volume
(74,328) and heavies (4,320), buses (15,000), cars (33,120), tricycles/motorcycles (88,968), volume (141,400), respectively, were recorded for the different roundabout (sites). Typical values of percentage composition for a site is shown in Table 10 [30]. Maximum noise levels for the locations in Tables 8 and 9 range from 75.1-85.4 dB (for morning) to77.0-84.8 dB (for afternoon) and 74.7-77.2 dB (for morning) to 69.8-78.3dB (for afternoon), respectively. Mean noise levels in dB at different locations are shown (Table 11) [54]: LAeq (67.5-90.5), Lmin. (66.0-76.5) and Lmax. (68.0-82.5) for junction/roundabout/intersections; LAeq (69.5-88.1), Lmin. (60.8-76.5) and Lmax. (68.0-82.5) for roads; and LAeq (75.7-88.7), Lmin. (68.0-82.1) and Lmax.(67.5-85.6) for loading parks (garage). Aerodynamic road traffic noise levels have the same range (Table 12). From the survey, it was observed that intra-city road traffic noise is more steady unlike those from intercity traffic. Also, it was observed that the higher noise levels, on the whole, were generated by motorcycles and
Onuu; JENRR, 5(1): 16-33, 2020; Article no.JENRR.57258
28
tricycles. The fact that road traffic noise is steady along major intra city roads with cumulative noise levels and wide range use of horn by motorists which can increase the environmental noise climate of a city to a level as high as 95 dB makes road traffic noise more promising in the acoustic energy harvesting project in Nigeria. This is more promising particularly because of the in the purchase and acquisition of motorcycles and tricycles also known as keke na pep for transport business in Nigeria. McNulty [56], former adviser to WHO on noise and vibration had observed that the competitive climate of the motorcycle industry has obviated any possible noise reduction measures despite clarion calls reduce output noise levels of motorcycles.
4.3 Industrial/Occupational Noise Occupational noise levels that vary between 101 and 127 dB were measured in the 27 industries that vary in activities (Table 13). Table 14 shows the measured noise levels and indices, generated by a 63 kVA caterpillar power generator, as a function of distance. Lmax., equivalent continuous noise level, Leq, and day-night levels vary from 88.0-60.0 dB, 88.0-60.0 dB and 98.0-70.0 dB, respectively, for the distances indicated. Background and ambient noise levels as high as 68.5 dB and 131.0 dB, respectively, are summarized in (Tables 15 and 16) [28,57]. This corresponds to the highest noise power of 10
1.1 W. Also, industrial or occupational noise is
promising in the acoustic energy harvesting project in Nigeria except its intermittence and the fact operating period of most industries is between the hours of 8.00 and 17.00, Monday to Friday.
4.4 Outdoor Noise Maximum outdoor noise measurements at various locations (Table 17) show noise levels for indoor/outdoor as high as 46.5 dB(A)/75.0 dB for quiet/noisy periods. This gives noise power of 0.00000005 W/0.000032 W for quiet/noisy periods.
4.5 Household/Indoor Noise Household noise spectra presented (Figur. 3) is for water flowing into WC tank; frying; water running into a bath; flushing of WC toilet; grinding in the kitchen and during power changeover for TV and radio receivers. Lmax. As high as 60 dB
corresponding to noise power of 10-6 W (1 µW) during power changeover for radio receiver was obtained [30]. Generally, noise levels measured in rooms with windows open were higher than the corresponding values obtained when windows were closed by about 5-10 dB. Also, noise levels and noise power obtained in the study involving various acoustical (noise) measurements in Nigeria are higher than those used as input for AEHs elsewhere. For example, data obtained from measurements of noise levels and indices at different sites in Nigeria which are higher than those obtained in noise measurements in Alexandria, Egypt and elsewhere in the study of AEH lend credence to this assertion. Therefore, the noise power obtained in the wide range of acoustical/noise measurements in Nigeria will produce higher efficiencies than those reported in literature which are (Table 4) [23,40]: 0.66 pW-30 mW for piezoelectric based AEH at resonant frequencies of 146 Hz-6.7 kHz and 1.5 mW-1.96 mW for electromagnetic based power harvester at resonant frequencies between 143 Hz and 470 Hz as well as triboelectric nanogenerators (TRENGs) at resonant frequencies in the range of 20 Hz-1000 Hz with maximum output power of 7 W/m
2 at 170 Hz and
115 dB. Existing literature on AEH has so far been concerned only with results of road traffic noise surveys. The addition of the findings from data on road traffic noise and other noises in Nigeria to the body of knowledge in the emerging area of AEH and the possibility of obtaining higher efficiencies, shows the viability of AEH in Nigeria; and will therefore open a new window of research in AEH in this part of the world. This is so notwithstanding the limitations of this study which are: intrusive noise during measurements; reflections from hard surfaces; wide range of conditions of the measurement sites being open, congested or closely built-up, error in the determination of road traffic composition and volume, and uncertainty in the measurement of the distance between the aircraft and microphone caused by the occasional disruption by staff of Federal Aviation Authority (FAA). 5. OTHER PROSPECTS Further, there is hope for the acoustic energy project in Nigeria. This assertion is predicated upon the following:
Onuu; JENRR, 5(1): 16-33, 2020; Article no.JENRR.57258
29
5.1 Availability and Market for PS Audio Noise Harvesters
PS audio noise harvesters convert all the noise into light and are now in the market. These devices, which have cumulative effect, convert air-conditioned (AC) line noise into light for cleaner power. All that is required is to simply plug the harvester into an AC outlet, and it begins converting unwanted noise into light. Many harvesters can be used simultaneously for even cleaner power. Any system will reap the benefits of the noise harvester.
5.2 High Environmental Noise Climate Environmental noise climate in most cities in Nigeria is high with road traffic and industrial noise levels being reasonably steady over a period of time in a day with relatively high power (Tables 5, 6 and 9). This is so because of road traffic noise which composition is dominated motorcycles and tricycles (keke na pep) with high output noise levels and frequent use of horn by motorists. In most parts of South Eastern Nigeria, for example, road traffic noise dominates low frequency spectrum because of wide range use of low gear since most roads are bad and some of the cities are located on hills. Also, high noise levels emanate from worship centres such as churches and mosques, discothèques, markets, music shops and street traders advertising their goods.
5.3 Frequent use of Electric Generators Power supply by the Power Holdings Company of Nigeria (PHCN) is far from being constant. Therefore, solar energy and electric generators are fast becoming good alternative sources of power supply. Frequent use of electric generators in Nigeria with high noise levels, occasioned by incessant power outage, is yet another incentive for the possibility of the noise-(sound-) energy conversion project in Nigeria. 5.4 Greater Use of Airconditioner There is greater use of air conditioner by ministries and government agencies, political class, elites, business men and those who can afford them in Nigeria. This is so because, Nigeria, located in the tropics, has climate that is seasonally damp and very humid. For example, Sokoto in North West, Nigeria is the hottest State with an annual average temperature of 28.3°C.
The State had the highest recorded temperature of 47.2°C in the year 2010 - the highest in the country. In Nigeria, the maximum daytime temperatures are a little below 40°C most of the year. Greater use of air conditioner will in Nigeria, therefore, attract the use of PS audio noise harvesters and make the noise- (sound-) energy conversion project in the country very attractive. 6. TECHNICAL PROBLEMS There are some technical problems that need to be addressed/overcome in the quest for the conversion of noise energy into electrical energy, particularly, in Nigeria. Such problems are highlighted below.
6.1 Noise (or noisy) Farm Noise farm is very important in the search for appreciable noise levels for acoustic energy harvesting in Nigeria. Expects will be needed to plan for the establishment of noise (or noisy) farms all over the country, ensure that adequate noise energy is generated for conversion to electrical energy. As at now, there may not be available manpower to plan and undertake any noise farm project. 6.2 Noise Collectors Building noise collectors has been a challenge that should be surmounted the world over. How should noise from various sources be collected? Should dish be used and if yes what should be the size? How will the noise so collected be piped from the focus (focal point)? These and other questions need answers on how to collect or concentrate the noise (sound) energy in an attempt to convert it into electrical energy.
6.3 Reverberant Chambers or Rooms Sine noise is to be harvested, we would need reverberant chambers or rooms rather than soundproof or anechoic chambers. Reverberant chambers or rooms are important as they enable incident sound to be involved in successive reflections in order to build the acoustic energy. In this case, materials such as non-acoustic panels are needed for padding the interior of the rooms. Again, there may not be experts to be used in the construction of such reverberant or echoic rooms necessary for the harvest of

Onuu; JENRR, 5(1): 16-33, 2020; Article no.JENRR.57258
30
enough acoustic energy for any meaningful energy conversion project.
6.4 Coupling of the Vibration Produced The vibration produced by the noise or sound has to be necessarily coupled or channeled to the output from where it will be tapped as electrical energy. this technology requires special thin membrane or cantilever beams to actualize. They are made of piezoelectric crystals as a transducer mechanism. When the transducer is put under strain by the kinetic energy of the vibration a small amount of current is produced – piezoelectric effect. This, again, requires technical know-how which may be lacking.
6.5 Transmission and Storage Transmission of the electrical power that has been obtained from acoustic energy to the load and storage device without losses is yet another technical problem that will greatly affect acoustic energy harvesting in Nigeria. As at now, all transmission lines in Nigeria are lossy as superconducting cables are not yet in use in this country [58]. The problem is that since noise or acoustic power is low, it cannot be transmitted to the load or storage device without becoming evanescent after being greatly attenuated. We need lossless medium for the transmission of acoustic power if the acoustic energy harvesting in Nigeria is to be feasible.
7. SOCIO-ECONOMIC OBSTACLES Despite some prospects in harvesting electrical energy from noise in Nigeria, there are some socio-economic obstacles that have to be overcome. These socio-economic obstacles are highlighted hereunder.
7.1 Lethargy of Researchers There is likely going to be lack of enthusiasm on the part of researchers on noise- (sound-) energy conversion project not only in Nigeria but the world over. This will result due to the fact that electrical power of only a fraction of watts is realizable in this project. It should be borne in mind, however, that no additional amount of electrical energy added to the system is small. It has been observed, and rightly too, that the ability of piezoelectric generators on such a small scale to generate electricity, is the main advantage of this method over electromagnetic
generators, especially when the generator is being developed to power microelectronic devices [34]. To increase the interest of researchers on AEH, Governments, agencies and individuals should be encouraged to sponsor researches on AEH. Apart from other incentives, researchers should be encouraged to delve into AEH by giving them grants and providing the enabling environment for them to conduct their research.
7.2 Lack of Patronage by Consumers In this part of the world, and particularly Nigeria, people like to patronize big projects that have wide margin gain or benefits. Therefore, consumers may not see the need to patronize acoustic energy harvesting projects that will only result in low electrical energy output. Efforts should be made by researchers to increasing the efficiency and cost effectiveness of AEHs to be able to attract consumers.
7.3 Lack of interest by Governments and Other Envisaged Sponsors
Governments and anticipated sponsors of acoustic energy harvesting projects may not be interested and forthcoming. They may likely see the project as not viable and unnecessary. Governments and sponsors should be encouraged to show interest and participate in the project. After all, the beauty of research is in producing positive results, no matter how little, that will, in future, completely impact on the society positively. Governments and sponsors should be encouraged researches more on acoustic energy harvesting. It should be made clear to them that dividend of research efforts is not at the early stage. After all, this is barely five years of serious research on AEH.
7.4 High Cost of Acoustic Energy Harvesting
Although annually generated electricity from acoustic energy will be relatively small, the total investment cost in dollars, I, and the fixed charge rate, F (equation 10) will be very high. This is because exchange rate is very high and Nigerian currency (Naira) can buy only very little commodity, especially outside the country. This is considered a great severe setback for the acoustic energy harvesting project in Nigeria. With increased sponsorship and research on
Onuu; JENRR, 5(1): 16-33, 2020; Article no.JENRR.57258
31
AEH, acoustic energy harvesting is expected to be more cost-effective.
8. CONCLUSION This study has appraised global energy demand, highlighted sources of energy and their drawbacks. Levels and power of various environmental noises in Nigeria from analysis of data obtained from in situ and recorded measurements, analysis and re-examination of some existing data, typical harvesting or conversion efficiency of acoustic energy and cost effectiveness of AEH project have been presented. Findings show that noise sources in Nigeria produce output power as high as 0.36 mW for road traffic, 0.63 mW in the homes, 0.4 mW for aircraft and 12.59 W for industry, which can power microelectronic components, light LEDs and power other devices in this era of wireless communication and internet of things (IoT). These values are higher than those applied as input to AEHs in other countries of the world. At this stage, therefore, it is clear that acoustic energy harvesting in Nigeria has prospects as is viable. Technical problems and socio-economic obstacles to be encountered in this quest and recommendations to overcome such obstacles have been highlighted.
ACKNOWLEDGEMENTS The author is grateful to all the researchers whose data have been used in this study. The efforts of Professor Chidi E. Akujor, FAS, President, Renewable and Alternative Energy Society of Nigeria and Host, One Day Public Lecture/Workshop On Environmentally Sustainable Energy Use in Honour of Professor Ikenna Onyido, FAS, @ 70 held at Gregory University, Uturu, Abia State, Nigeria, on 24
th
October, 2019 in encouraging me to write this paper, is also gratefully acknowledged.
COMPETING INTERESTS
Author has declared that no competing interests exist.
REFERENCES 1. Gholap AV. Prospects of laser induced
fusion. in 1983 School on Lasers Their Applications. Department of Physics, Rivers State University of Science and Technology, Port-Harcourt, Nigeria. 1983; 198-216.
2. OECD/NEA. Organization for economic cooperation and development/ Organization American States: Uranium 2007: Resources, Production and Demand in Nuclear Energy; 2007.
3. WWP. World population prospects. Data from united nations department of economic and social affairs, population division; 2006.
4. Stephens E, Ross IL, Mussgnug JH, Wagner LD, Borowitzka MA, Posten C, Kruse O, Hankamer B. Future Prospects of Microalgal Biofuel Production Systems. Trends in Plant Science. 2010;6. DOI:10.1016/J.TPLANTS.2010.06.003
5. Onuu MU. The Challenges of the Global Energy Demand. Global Journal of Pure and Applied Sciences. 1996;4:311-318.
6. EIA. International energy outlook, energy information administration, office of integrated analysis and forecasting, U.S., Department of Energy; 2009.
7. Terry A. Fossil fuels cause global warming: Renewables are crucial; 2018. Available:www.onehome.org.uk/the-bigger-picture/
8. Mohr SH, Evans GM. forecasting coal production until 2100. Fuel. 2009;88,2059–2067.
9. Shaflee S, Topal E. When will fossil fuel reserves be diminished? Energy Policy. 2009;37:181–189.
10. Molyneaux, L, Wagner LD, Froome C, Foster J. Energy Policy; 2012. DOI:10.1016/J.ENPOL.2012.04.057
11. Wagner LD. Australian renewable energy policy: barriers and challenges. Renewable Energy; 2013. DOI:10.1016/J. RENENE2013.06.024
12. Kjarstad J, Johnson F. Resources and future supply of oil. Energy. Policy. 2009; 37:441–464.
13. Wagner LD, Ross IL, Foster J, Hankamer BD. Trading off global fuel supply, CO2
Emissions and Sustainable Development. Published in PLOS ONE; 2016. DOI:10.1371/JOURNAL.PONE.0149406
14. Schlissel D, Biewald B. Nuclear Power Plant Construction Costs. Synapse, Energy, Economics, Inc; 2008.
15. Metcalfe T. Nuclear fusion power could be here by 2030, One Company Says; 2018. Available:www.livescience.com/62929-plasma-fusion-reactor-tokomak.html
16. Tofighi A. Solar energy balance in yamoussoukro. Renewable Energy. 1993; 3:919-922.
Onuu; JENRR, 5(1): 16-33, 2020; Article no.JENRR.57258
32
17. Hasan A. Wind energy in west bank and gaza strip. Renewable Energy. 1992;2: 637-639.
18. Ming Y, Ziping C, Jun L, Xiujian C. Recent developments of acoustic energy harvesting: A Review. Micromachines. 2019;10:1-21.
19. Ang LYL, Koh YK, Lee HP. A note on the viscous boundary layer in plate-type acoustic metamaterials with an internal tonraum resonator. Applied Acoustics. 2018;140:160-166.
20. Birol F. IEA Executive Director.org/report/world-energy-outlook-2029#; 2019.
21. Ahmed M. Energy crisis, different energy sources and role of power electronics, engineering, dec. 22, 2015. slideshare. net/mafazahmed/
22. Osae-Brown A, Olurounbi R. nigeria runs of generators and nine hours of power a day. Bloomerg; 2019. com/news/article/2019-09-23.
23. Chen F, Wu Y, Ding Z, Xia X, Li SZH, Diao C, Yue G, Zi Y. A novel triboelectric nanogenerator based on electrospun polyvinylidene fluoride nanofibres for effective acoustic energy harvesting and self-powered multifunctional sensing. Nano Energy. 2019;56:241-251.
24. Rahman R, Alwadie A, Khan FA. Generation of electricity using renewable energy resources and power quality. Renewable and Power Quality Journal. 2017;1:114-118.
25. Hajek JJ. Research report 197, downsview, ontario ministry of transport and communication. Ontario highway noise prediction method; 1975.
26. National cooperative highway research programme, washington: Transportation board. highway noise – A Research Guide to Engineers; 1981.
27. Onuu MU. Road traffic noise in Nigeria: measurements, analysis and evaluation of nuisance. Journal of Sound and Vibration. 2000;233:391-405.
28. Onuu MU, Akpan AO. Industrial noise in Nigeria: Measurements, analysis, dose and effects. Journal of Building Acoustics. 2006;13:69-80.
29. Onuu MU, Taiwo AN. Industrial noise studies in quarries and neighbouring communities. International Journal of Natural and Applied Sciences. 2005;1:124-130.
30. Onuu MU. A new set of empirical relationships between sound pressure levels and objectionable qualities of noise, Acoustics letters. 1999;22:208-211.
31. Available:https://engineering.mit.edu/engage/ask-an-engineer/can-sound-be-converted-to-useful-energy/,
32. Available:www.acoustic-glossary.co.uk/soundpower.html
33. Alankrit G, Vivek G, Vivek Y. Conversion of sound to electrical energy. International Journal of Scientific and Engineering Research. 2014;5.
34. Pulkit T, Pavanesh K, Neyaz A, Sandeep K, Tahseen M, Pramod K. Conversion of Noise Pollution to Electrical Energy. International Journal of Advanced Research in Science and Engineering. 2016;5.
35. Garg M, Gera D, Bansal A, Kumar A. Generation of electrical energy from sound energy. Proceedings of the International Conference on Signal Processing and Communication (ICSC) 16-18 March, Noida, India, Published by IEEE. 2011; 410-412.
36. Farghaly YA, Hemeida FAA. Noise utilization as an approach for reducing energy consumption in street lighting. PLOS- A peer-reviewed, Open Access Journal. 2019;14.
37. Choi J, Jung I, Kang C-Y. A brief review of sound energy harvesting. Nano Energy. 2019;56:169-183.
38. Yuan M, Cao Z, Luo J, Chou X. Recent developments of acoustic energy harvesting: A Review. Micromachines. 2019;10:1-21.
39. Noh H-M. Acoustic energy harvesting using piezoelectric generator for railway environmental noise. Advances in Mechanical Engineering. 2018;10:1-9. DOI:10.1177/1687814018785058
40. Khan FU, Izhar. State-of-the-art in acoustic energy harvesting. Journal of Microelectronics and Micro engineering. 2015;25:023001. DOI:1088/0960 – 1317/25/2/023001
41. Menkiti AI. Combating the Menace of Noise. Daily Times. 1976;28:28-29.
42. Menkiti AI. Housing, community development and environment, being a memorandum on submitted to house of representatives, federal republic of Nigeria; 1982.
Onuu; JENRR, 5(1): 16-33, 2020; Article no.JENRR.57258
33
43. Menkiti AI. Noise studies in oil drilling environment. Nigerian Journal of Physics. 1987;6:16-26.
44. Menkiti AI. Analysis of noise-bother by survey method. Journal of West African Science Association. 1989;32.
45. Onuu MU, Menkiti AI. Spectral analysis of road traffic noise in pars of southeastern Nigeria. Nigerian Journal of Physics. 1993; 5:1-9.
46. Onuu MU, Menkiti AI. Acoustic power spectra of (mixed) road traffic noise sources in south eastern Nigeria. Nigerian Journal of Physics. 1997;9:15-19.
47. Onuu MU. Presidential Jet: Noise levels and anti-noise laws. National Times. 2000; 13-30.
48. Akpan AO, Onuu MU, Menkiti AI, Asuquo UE. Measurements and Analysis of Industrial Noise and Its Impact on Workers in Akwa Ibom State, Southeastern Nigeria, Nigerian Journal of Physics. 2003;15:41-45.
49. Onuu MU. Measurements and prediction of road traffic noise along Nigerian Highways: Effects of Atmospheric Attenuation and Shielding. Nigerian Journal of Physics. 2003;15:16-27.
50. Davies-Ekpo CS. Measurements and analysis of aerodynamic noise in vehicles in Calabar, Cross River State, Nigeria. M.SC. thesis submitted to the department of physics, University of Calabar, Calabar, Nigeria; 2005.
51. Obisung EO, Onuu MU, Menkiti AI. Levels and spectra of aircraft noise and people’s reactions in some Nigerian Cities. Nigerian Journal of Physics. 2007;19:223-236.
52. Onuu MU. The status of acoustics in nigeria: a paper in honour of professor Alex I. Menkiti Nigerian Journal of Physics. 2007;19:139-179.
53. Onuu MU, Inyang A. Environmental Noise pollution in Nigerian Universities: A case study of the University of Calabar, Calabar, Nigeria. Journal of Nigerian Environmental Society (JNES). 2004;2:100-109.
54. Oluwasegun OO, Onuu MU, Oyenekan OE. Study of road traffic noise pollution and impacts on residents of ikeja local government area of Lagos State, Nigeria. International Journal of Scientific and Engineering Research. 2015;6:1108-1117.
55. Onuu MU. Statistics of road traffic noise sources. Global Journal of Pure and Applied Sciences. 1999;5:571-575.
56. McNulty GJ. Impact of transportation noise in some new industrial countries. Applied Acoustics. 1987;21:81-87.
57. Akpan AO, Onuu MU. Levels and spectra of industrial noise in southeastern Nigeria, African Journal of Environmental Pollution and Health. 2004;3:26-32.
58. Onuu MU, Uko O. Towards Solving the Problem of Transmission and via Semiconductor Power Cables. Global Journal of Pure and Applied Sciences. 2012;18:169-177.
_________________________________________________________________________________ © 2020 Onuu; This is an Open Access article distributed under the terms of the Creative Commons Attribution License (http://creativecommons.org/licenses/by/4.0), which permits unrestricted use, distribution, and reproduction in any medium, provided the original work is properly cited.
Peer-review history: The peer review history for this paper can be accessed here:
http://www.sdiarticle4.com/review-history/57258