Embed Size (px)
Citation preview

International Journal of English Linguistics; Vol. 8, No. 5; 2018 ISSN 1923-869X E-ISSN 1923-8703
Published by Canadian Center of Science and Education
27
Acoustic Characteristics of Pakistani English Vowel Sounds
Abdul M. Abbasi1, Mansoor A. Channa2, Masood A. Memon3, Stephen John4, Irtaza Ahmed5 & Kamlesh5 1 Department of Allied Subjects, Sindh Madressatul Islam University, Karachi, Pakistan 2 Department of Basic Sciences, Quaid-e-Awam University, Nawab Shah Sindh, Pakistan 3 Department of English, Cadet College Petaro, Hyderabad, Sindh, Pakistan 4 Department of Education, Sindh Madressatul Islam University, Karachi, Pakistan 5 Department of Computer Sciences, Sindh Madressatul Islam University, Karachi, Pakistan
Correspondence: Abdul M. Abbasi, Department of Allied Subjects, Sindh Madressatul Islam University, Karachi, Pakistan. E-mail: [email protected]
Received: December 28, 2017 Accepted: January 26, 2018 Online Published: May 5, 2018
doi:10.5539/ijel.v8n5p27 URL: https://doi.org/10.5539/ijel.v8n5p27
Abstract The purpose of this investigation was to document acoustic characteristics of Pakistani English (PaKE) vowel sounds. The experiment was designed to examine the properties of ten vowels produced by Pakistani ESL learners. The analysis is based on the voice samples of recorded 50 CVC words. Total 5000 (10× 10 × 50=5000) voiced samples were analyzed. The data consisted of 50 words of ten English vowel sounds [i: ɪ e ɔ: æ ə ɑ: u: ɒ ʊ]. Ten ESL speakers recorded their voice samples on Praat speech processing tool installed on laptop. Three parameters were considered i.e., fundamental frequency (F0), vowel quality (F1-F2) and duration. Formant patterns were judged manually by visual inspection on Praat Speech Processing Tool. Analysis of formant frequency shows numerous differences between male and female of F1 and F2, fundamental frequency and duration of English vowels. The voice samples provide evidence for higher and lower frequency of vowel sounds. Additionally, the data analysis illustrates that there were statistical differences in the values of short and long vowels coupled with vowel space plot showing explicit differences in locating the production of vowels of male & female vowel space acoustic realizations.
Keywords: acoustic characteristics, vowel sounds, frequencies, Pakistani ESL
1. Introduction This study is based on 5000 voice samples (10× 10 × 50=5000) which were analyzed in a very careful manner. The experiment was designed to document English vowel properties produced by Pakistani English speakers. To analyze PaKE vowels, three phonetic exponents were considered as parameters for the analysis e.g., duration, fundamental frequency and first and second formant frequency. The study focuses on the characterization of vowel sounds produced by English as Second Language (ESL) learners and the positions of Pakistani vowels space in vowel space plot of mouth cavity. The objectives behind this study are to document the variations in frequencies of 10 different English vowels by ESL learners. Every vowel has different frequency and the vowel space plot when it is pronounced by different people it contains a different frequency, plot, and duration coupled with different pitch. Praat speech processing tool was utilized to analyze the sounds with the help of spectrographic view. Praat calculated the average of all 5000 sounds. The measurements were categorized in terms of male, female and third their measurements were compared with each other. The study tests the hypothesis that if ESL learners pronounce English vowels, then their placement of vowels on vowel space will be differently placed by male and female Pakistani ESL learners. Based on the research questions as follows: What are the acoustic realizations of PaKE English vowel sounds? What is difference in placement of acoustic vowel space plot between male and female?
Additionally, the study focuses on acoustic properties of English vowel sounds and their acoustic vowel space in vowel inventory plot. The vowels are basically categorized referencing three phonetic factors i.e., height of the vowel, back-ness and lip rounding. Olive, Greenwood, & Coleman (1993) contends “An acoustic analysis of vowels stresses the different formant configurations that are characteristic of each vowel. The relationship among the vowels can be examined by comparing their formant values”. Front-back and high-low differences are

ijel.ccsenet.org International Journal of English Linguistics Vol. 8, No. 5; 2018
28
characterized by the second and the first formants, illustrating on spectrographic images. If the formant value is high, the closer the vowel becomes to the front point. In so far as front vowel is concerned frequency F1 turns out to be lower and contraction escalates in the vocal track. F1 and F2 frequencies are regarded as a vowel quality in acoustic speech terms. Generally unstressed vowels are reduced in quality; whereas the stressed vowels have higher frequencies. There are several features in the production of sounds, i.e., reduction of vowel quality, vowel lengthening followed by the voiced sound. Another important factor is absence and presence of lexical stress which affects the vowel quality. The unstressed syllables in American English are reduced in quality therefore, they involve in vowel centralization to schwa vowel sound, the chiefly produced sound in English language. F1 and F2 formants have greater distance when there occurs in between the highest vocal sounds. Whereas, for back vowel, F2 is much closer and lower to F1 for the back vowels than for the front vowels (Parson, 1987).
2. Methods 2.1 Procedures of Data Collection
The data was collected from 10 subjects (5 male and 5 female). Their age ranged from 17 to 22 years. The recordings were made in a silent zone where there was no background noise. ESL learners were given 50 indexing cards written on them the token phrase in between the token words, all ten vowels were placed as illustrating Table 1. Ten vowels were selected as follows: /i:, ɑ:, ɪ, ɔ:, æ, ə, u:, ɒ, e, ʊ/. Then five words from each vowel sound and then written them on the cards. Then we have given those cards to our respected subjects and then well requested them to pronounce each word three times. Each subject pronounces the 50 words three times like I say token word.
2.2 Speech Material
Five words from each vowel sound were chosen for the experiment. Total chosen words were mono-syllable words. The words frequency in daily use was highly familiar to ESL learners. Table 1 illustrates the fifty mono-syllable words which were used as the data tool as follows:
Table 1. Token words produced by ESL learners
Vowels Words Words Words Words Words
i: Peep Sheep Meet Seat Neat e Pet Set Get Wet Net ɑ: Car Far Jar Part Half ɔ: Core Four Snore Score Saw ɒ Pot Cot Short Lot Sort ɪ Fit Bit Sit Pit Kit æ Fat Back Bad Cat Sat u: Boot Food Soon Moon Tooth ə Dug But Bus Cut Bud ʊ Should Could Good Put Food
2.3 Recordings
Recordings were made of /hVd/ utterances recorded by ten male and female speakers. Measurements were analyzed of vowel duration, F0 contours (fundamental frequency), and formant frequency contours (F1-F2). A set of 50 cards with each word written on them was provided among the participating subjects. Total fifty words (25 for short & 25 for long vowels) were involved. The word structure was selected where each vowel sound was amid the word. There was a total of 50 cards, i.e., one card for each word inscribing “I say token word now” in a phrase. In addition, the set of 50 cards was read with 03 repetitions by each ESL learners. The cards were reshuffled after each recording, and the subjects read aloud the word on each card in sequence with no break between repetitions. In addition, the participants were provided a quiet and calm environment, with no background noise, in a closed room far from the noise of city traffic. The voice recorder used faced them at a distance of around six inches. They were instructed to maintain a normal speech rate and to read the given words using a neutral focus, as in ordinary talking conditions. Subjects voiced were recorded on sound recorder and analyzed on computer Dell Core 2 dual system using the Praat speech processing tool (Boersma & Weenink, 2017) and a voice recorder.

ijel.ccsenet.
2.4 Data A
The recorparameterstaken as mwere on puthe data fcarefully. duration acalculated belongs togot the plo
3. Discuss3.1 Measu
All measuexaminatiowere measusing the frequency mid-point in the spedisplay onMeasuremmilliseconas below.
Figure 1 ilred F2. Frand the voHz) of F2
.org
Analysis
rdings of voics for the analy
means of acousut on excel shefrom the subjeWe have taken
and F0 of evertheir average
o a vowel sounot of vowels.
sion urements of Fre
urements of fron of widebansured in millis
speech proceF0 of male anof the target vctrogram was
n computer screments were taknds from the en
F
llustrates the from this graphowel i: has the while ɔ: vowe
Fig
In
ce samples wysis. All three stic realizationeet for developects, we haven F1, F2 threery subject verye and then wend. Then we pu
equency F1 an
requency formnd spectrograpseconds on theessing tool Prnd female wervowel. Whenev
detected, the een. The pitch
ken at the visund of the prece
Figure 1. Englis
frequencies F1hical representa
lowest value (el has the lowe
gure 2. English
nternational Jou
were analyzed repetitive freq
ns of F1, F2, Fpment of vowee analyzed it e times of eacy carefully. Ae took the netut the net valu
nd F2
mants, pitch anhic display on
e spectrographraat (Boersmare taken manuver a mismatcformants wer
h contours werually located meding vowel to
sh ten vowels
1 and F2 of thation which sh(464 Hz) of F1st value (1257
h ten vowels d
urnal of English
29
on Praat softquencies wereF0 and duratioel space plots fvery carefully
ch word and thfter taking all t averages of ues of F1, F2 a
nd duration ofn computer scrhic displays. Ba & Weenink,ually recognizeh between the
re checked by e manually exmid-point of eo the stating. T
duration by ac
e male subjecthows that the v1 among 10 vo Hz) of F2 am
duration by acr
Linguistics
ftware for F1,e calculated, anon. The same vfor male and fey. We have anhen took theirthe frequenci
F1, F2, F0 anand F0 in the J
f the vowels wreen. Start and
Both starting an, 2017). Frequed on formant e tracks and the
visual inspectxtracted using teach target voThese measure
cross male ESL
ts. Where the vowel ɑ: has t
owels. The vowmong the 10 vow
ross female ES
, F2, F0 and nd the averagvocalic measuremale separatenalyzed everyr average. We ies from Praatnd duration ofJ plot software
were taken md end points ond ending poinuency F1, F2tracks at the
e visually apption of widebathe Praat autocowel. Durationements are illu
L speakers
blue color repthe highest valwel i: has the hwel sounds.
SL speakers
Vol. 8, No. 5;
duration as e frequencies rement frequen
ely. After colley single word
have analyzet software we f every five we and then we
manually by opf the target vonts were restra
2 and fundamvisually positiarent formant and spectrogracorrelation men was measureustrated graphi
presents the F1lue (698 Hz) ohighest value (
2018
basic were ncies cting very
d the have
words have
ptical owels ained
mental ioned band aphic thod. ed in ically
1 and of F1 1959

ijel.ccsenet.
Figure 2 ilred F2. Frand the vovalue (184
3.2 Funda
All valuesvalues foumale and recorded v
Figure 3 iland red femvowel andhave the hamongst thfrequenciedifference including m
3.3 Statisti
Table 2. Pa
Table 3. Pa
VoFre
F0 F0 DuDu
3.4 Statisti
Table 4 illdeviation female vow
.org
llustrates the frrom this graphowel i: has the46 Hz) of F2 w
mental Freque
s have been taund between m
female speakvoice samples a
llustrates the fmale. From th
d they have lowhighest value he 10 vowel s
es and their sstatistics of
mean and df 3
ics of Long Vo
aired sample s
Vowel
F0 F0 DuratiDurati
aired differenc
wel equencies
G
MF
uration Muration F
ics of Short Vo
lustrates the pand standard wel frequencie
In
frequencies F1 hical representae lowest value while ɔ: vowel h
ency (F0)
aken from themale and femakers. The averare represented
Figure 3. Eng
frequency F0 ohis graphical rewest value (14(169 Hz) of Fsounds. Table standard deviamale and fem.
wels
tatistics
l Frequencies
ion ion
ce
Gender Mean
Male 1.9 Female Male -.0175 Female
owels
paired sample error includin
es and their sta
nternational Jou
and F2 of theation which sh(463 Hz) of Fhas the lowest
same data. Tale speakers, hage F0 valuesd in Figure 3 a
glish ten vowel
of the male anepresentation, t42 Hz) of F0 oF0 of ɪ vowel
2 illustrates tation and stanmale vowel fr
Gender Mea
Male 155.Female 153.Male .405Female .387
Std. Deviation
5.666 .015
statistics of mng mean. Tablandard deviatio
urnal of English
30
e female subjechows that the vF1 among the t value (1304 H
The data indicahowever, theres were obtainas follows:
ls F0 by across
nd female subjthe male subjef ɑ: vowel amwhile they ha
the paired samndard error inequencies and
an N
.425 4
.525 4 50 4 75 4
Std. Error Mean
9C
2.833 L U.0075 L U
male and female 5 illustrateson and standar
Linguistics
cts. Where thevowel ɑ: has t10 vowel sounHz) of F2 amon
ates that theree is a relativeled from 10 sp
s female ESL s
ects. Where thects have the h
mong the 10 voave lowest val
mple statistics ncluding meand their standa
Std. Deviation
10.2727 7.6843 .01291 .00500
95% Confidence
Lower -7.115 Upper 10.954 Lower -.0414 Upper .00637
ale long vowes the paired dd error includi
e blue color repthe highest valnds. The voweng the 10 vow
e is statisticallly significant dpeakers for al
speakers
he blue color rhighest value (owel sounds. Tlue (144 Hz) of male and f
n. Table 3 illuard deviation a
Std. Error
5.1364 3.8422 .00645 .00250
t df S
.671 3 . 2.333 3 .
el frequencies difference stating mean and d
Vol. 8, No. 5;
presents the F1lue (727 Hz) oel i: has the hig
wel sounds.
ly difference idifference betwll ten vowels.
represents the 161 Hz) of F0
The female subof F0 of vowfemale long vustrates the pand standard
Sig. (2-tailed)
550
102
and their stantistics of maledf 5.
2018
1 and of F1 ghest
in F0 ween The
male of ʊ
bjects el ɑ:
vowel aired error
ndard e and
ijel.ccsenet.
Table 4. Pa
Table 5. Pa
VoFre
F0 F0 DuDu
3.5 Durati
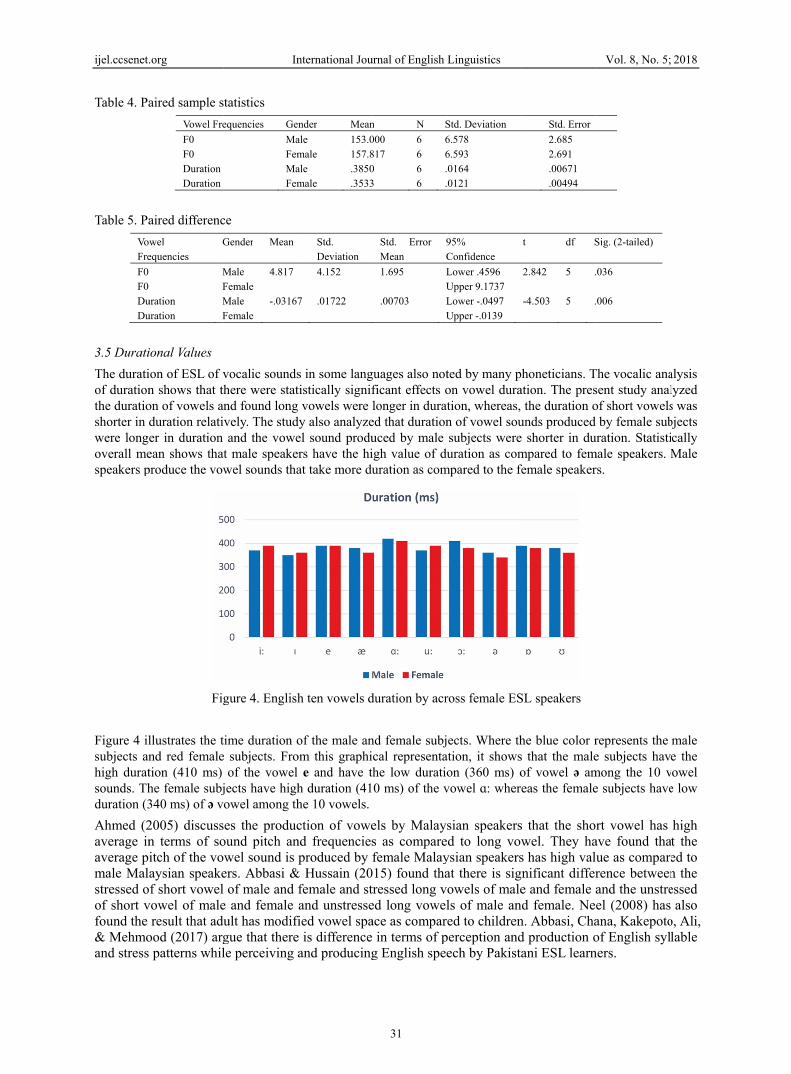
The duratiof durationthe duratioshorter in dwere longoverall mespeakers p
Figure 4 ilsubjects anhigh duratsounds. Thduration (3
Ahmed (2average inaverage pmale Malstressed oof short vfound the & Mehmoand stress
.org
aired sample s
Vowel Fre
F0 F0 Duration Duration
aired differenc
wel equencies
G
MF
uration Muration F
ional Values
ion of ESL of vn shows that thon of vowels anduration relatier in duration ean shows thatproduce the vow
Fig
llustrates the tnd red femaletion (410 ms) he female subj340 ms) of ə v2005) discussn terms of soitch of the voaysian speakef short vowel
vowel of maleresult that adu
ood (2017) arg patterns whil
In
tatistics
equencies Ge
MaFemMaFem
ce
Gender Mean
Male 4.817 Female Male -.03167Female
vocalic soundshere were statnd found longvely. The studand the vowe
t male speakewel sounds tha
gure 4. English
time duration oe subjects. Fro
of the vowel jects have highowel among th
es the producound pitch anwel sound is ers. Abbasi & of male and f
e and female ult has modifigue that therele perceiving a
nternational Jou
nder Mean
ale 153.0male 157.8ale .3850male .3533
Std. Deviation
4.152
7 .01722
s in some langtistically signif vowels were l
dy also analyzeel sound produrs have the hiat take more du
h ten vowels d
of the male anom this graphi
e and have thh duration (41he 10 vowels.
ction of vowend frequenciesproduced by f
& Hussain (20female and stand unstresse
fied vowel spae is difference and producing
urnal of English
31
n N S
000 6 6817 6 60 6 .3 6 .
Std. Error Mean
9C
1.695 L U.00703 L U
guages also notficant effects olonger in durat
ed that durationuced by male igh value of duuration as com
duration by acr
nd female subjcal representahe low duratio0 ms) of the v
els by Malayss as comparefemale Malay15) found tha
tressed long ved long vowelace as compar
in terms of pg English spee
Linguistics
Std. Deviation
6.578 6.593 0164 0121
95% Confidence
Lower .4596 Upper 9.1737 Lower -.0497 Upper -.0139
ted by many pon vowel duration, whereas, n of vowel sousubjects wereuration as com
mpared to the fe
ross female ES
ects. Where thation, it showson (360 ms) ovowel ɑ: where
sian speakersd to long vow
ysian speakersat there is sigowels of malels of male aned to children
perception andech by Pakista
Std. Error
2.685 2.691 .00671 .00494
t df S
2.842 5 . -4.503 5 .
honeticians. Tation. The pres
the duration ounds produced shorter in du
mpared to femfemale speaker
SL speakers
he blue color rs that the maleof vowel ə ameas the female
s that the shorwel. They has has high valunificant differe and female ad female. Nee
n. Abbasi, Chad production oani ESL learn
Vol. 8, No. 5;
Sig. (2-tailed)
036
006
The vocalic anasent study analof short vowels
by female suburation. Statistimale speakers. rs.
represents the e subjects havmong the 10 ve subjects have
rt vowel has ave found thaue as comparrence betweenand the unstreel (2008) hasana, Kakepotoof English sylners.
2018
alysis lyzed s was bjects ically Male
male e the
vowel e low
high at the ed to n the essed
also o, Ali, lable
ijel.ccsenet.
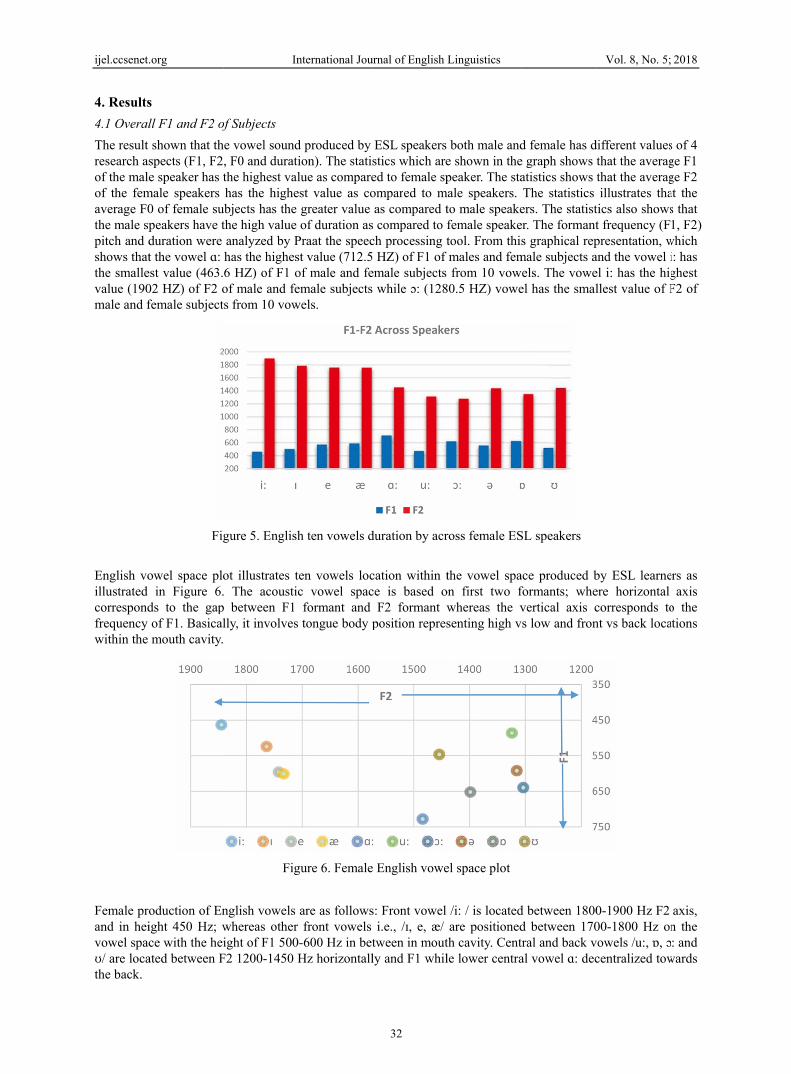
4. Results4.1 Overal
The result research asof the maleof the femaverage F0the male sppitch and dshows thatthe smallevalue (190male and f
English voillustrated correspondfrequency within the
Female proand in heivowel spacʊ/ are locathe back.
.org
s ll F1 and F2 of
shown that thspects (F1, F2e speaker has t
male speakers 0 of female supeakers have tduration were t the vowel ɑ:
est value (463.02 HZ) of F2 ofemale subject
Fig
owel space ploin Figure 6.
ds to the gapof F1. Basicalmouth cavity.
oduction of Enight 450 Hz; wce with the heiated between F
In
of Subjects
he vowel sound, F0 and duratithe highest valhas the highe
ubjects has the the high value analyzed by Phas the highes6 HZ) of F1 oof male and fes from 10 vow
gure 5. English
ot illustrates t. The acoustic
p between F1 lly, it involves
Fig
nglish vowels whereas other ight of F1 500
F2 1200-1450 H
nternational Jou
d produced by ion). The statislue as compare
est value as cogreater value of duration as
Praat the speecst value (712.5of male and feemale subjectswels.
h ten vowels d
ten vowels locc vowel spacformant and
tongue body p
gure 6. Female
are as followsfront vowels
0-600 Hz in betHz horizontall
urnal of English
32
ESL speakers stics which areed to female spompared to mas compared t
s compared to fch processing t HZ) of F1 of
emale subjects while ɔ: (128
duration by acr
cation within tce is based o
F2 formant wposition repres
e English vowe
s: Front vowel i.e., /ɪ, e, æ/
tween in moutly and F1 whil
Linguistics
both male ande shown in thepeaker. The sta
male speakers. to male speakefemale speaketool. From thismales and femfrom 10 vow
80.5 HZ) vowe
ross female ES
the vowel spaon first two fwhereas the vsenting high v
el space plot
/i: / is locatedare positioned
th cavity. Centle lower centra
d female has de graph shows atistics shows The statistics
ers. The statister. The formants graphical rep
male subjects aels. The vowe
el has the smal
SL speakers
ace produced bformants; whevertical axis cs low and fron
d between 1800d between 170tral and back val vowel ɑ: dec
Vol. 8, No. 5;
different valuesthat the averagthat the averagillustrates tha
tics also showst frequency (Fpresentation, wand the vowel iel i: has the higllest value of F
by ESL learneere horizontal corresponds tont vs back loca
0-1900 Hz F2 00-1800 Hz onvowels /u:, ɒ, ɔcentralized tow
2018
s of 4 ge F1 ge F2 at the s that 1, F2)
which i: has ghest F2 of
ers as axis
o the ations
axis, n the : and
wards

ijel.ccsenet.
5. ConclusThe study variety spoview of sparametersmale subjesubject ha(170 Hz) acompared PaKE prodspace acou
ReferenceAbbasi, A
Mülle
Abbasi, AIntern
Abbasi, A.
Abbasi, AIntern
Abbasi, AJourn
Abbasi, AJourn
Abbasi, AposteEduca
.org
sion concludes afteoken in Pakisstandards of as for the analyect has the highas higher valueas compared toto female subj
duced by maleustic realizatio
es . M. (2010). Ter. Germany.
A. M. (2012). Anational Journ
. M. (2017). Th
A. M., & Husnational Journ
A. M., & Hussanal, 47(4), 749
. M., & Hussanal of English L
. M., & Kimbar session preation (SLATE
In
Fi
Figure 8.
er the acoustictan in terms oacoustic-phone
ysis of acousticher value (713e (1902 Hz) aso male speaker
bjects. Additione and female Ens.
The production
A phonetic-aconal of Social Sc
The stress patte
ssain, S. (201nal of Research
ain, S. (2015)9-756.
ain, S. (2015). TLanguage For
all, A. (2014). sented at the
E) Graduate R
nternational Jou
igure 7. Male E
. Overall Engli
c documentatioof acoustic difetic propertiesc characteristic3 Hz) as compas compared tors. The durationally, there areESL learners i
n of English co
oustic study ociences & Edu
rn of Sindhi an
12). Syllable hers, 1(4), 120
. Phonetic ana
The role of pitrum, 17, 9-24.
Word stress in meeting of
Research Sym
urnal of English
33
English vowel
ish vowel spac
on of PaKE vofference. All as of speech scs of English vared to female
o male speakeron of productioe clear differenin terms of loc
onsonants by S
of Sindhi-accenucation, 2(2), 1
nd English. Mu
structure and 0-134.
alysis of lexic
tch between st
n Sindhi and ESixth Annual
mposium. Dep
Linguistics
space plot
ce across speak
owels propertieacoustic measusounds of anyvowels were m
speakers betwrs. F0 of the fon of vowel sonces of Engliscating the prod
Sindhi ESL lea
nted English f146-157.
unich. Lincom
syllabification
al stress in Si
tress and inton
English: ImplicSecond Lang
artment of li
kers
es that PaKE eurements werey language in
measured and foween the groupfemale speakeround of male ssh vowel spaceduction of vow
arners. Munich
for better Eng
m Europa, Germ
n in Sindhi-E
indhi. Sindh U
ation in Sindh
cations for learguage Acquisinguistics & f
Vol. 8, No. 5;
exists as a diffe taken keepinn the world. found that F1 ops. F2 of the fers has higher vsubject is longe on vowel plowels and the v
h. VDM Verla
glish pronuncia
many.
English loanw
University Rese
hi. Annual Rese
rners of Englissition and Teaforeign langu
2018
ferent ng in Four
of the emale value ger as ots of vowel
g Dr.
ation.
words.
earch
earch
sh. In acher ages,

ijel.ccsenet.org International Journal of English Linguistics Vol. 8, No. 5; 2018
34
University of Illinois, Urbana-Champaign, USA.
Abbasi, A. M., Channa, M. A., John, S., Memon., M. A., Anwar, R. (2018). An acoustic investigation of Pakistani and American English vowels. International Journal of English Linguistics, 8(4), 115-121. https://doi.org/10.5539/ijel.v8n4p115
Abbasi, A. M., Channa, M. A., Kakepoto, I., Ali, R., & Mehmood, M. (2017). A perceptual study of phonological variations in Pakistani English. International Journal of English Linguistics, 8, 91-100. https://doi.org/10.5539/ijel.v8n2p92
Abbasi, A. M., Memon, M. A., Channa, M. A., & Stephen, J. (2018). Awareness of L2 American English word stress: Implications for teaching speakers of Indo-Aryan languages. International Journal of English Linguistics, 8(3). https://doi.org/10.5539/ijel.v8n3p101
Abercrombie, D. (1965). Studies in phonetics and linguistics. London: Oxford University Press.
Ahmed, W. A. S. (2005). Vowel length discrimination among Malay speakers of Malaysian English: An Instrumental Study.
Bauer, L. (2002). An introduction to international varieties of English. Edinburgh: Edinburgh University Press.
Boersma, P., & Weenink, D. (2017). Praat: Doing phonetics by computer (Version 5.3.35) [Computer software]. Retrieved from http://www.praat.org/
Crystal, D. (1999). Dictionary of English and phonetics. Cambridge: Cambridge University Press.
Dušan, N. (2016). Acoustic analysis of English vowels produced by American speakers and highly competent Serbian L2 speaker.
Ladefoged, P. (2001). Vowels and consonants: an introduction to the sounds of languages. Oxford: Blackwell.
Lindblom, B. (1963). Spectrographic study of vowel reduction. JASA, 35, 1773-1781. https://doi.org/10.1121/1.2142410
McMahon, A. (2002). An introduction to English phonology. Edinburgh: Edinburgh University Press.
Neel, A. (2008). Vowel space characteristics and vowel identification accuracy. Journal of Speech, Language, and Hearing Research, 51. https://doi.org/10.1044/1092-4388(2008/041)
Olive, J. P., Greenwood, A., & Coleman, J. S. (1993). Acoustics of American English speech: a dynamic approach. New York: Springer-Verlag. Review by T. Rossing in Physics Today March 1994, p. 59. http://dx.doi.org/10.1063/1.2808444/
Parsons, T. W. (1987). Voice and speech processing. New York: McGraw-Hill.
Rehman, M., Abbasi, A. M., & Lashari, A. A. (2017). Speech variations in Pakistani English and Singaporean English. Journal of Social Sciences & Media Studies, 1(1), 36-49.
Appendix A Vowels i: e ɑ: ɔ: ɒ 1 Peep Pet Car Core Pot 2 Sheep Set Far Four Cot 3 Meet Get Jar Snore Short 4 Seat Wet Part Score Lot 5 Neat Net Half Saw Sort
Vowels ɪ æ u: ə ʊ 6 Fit Fat Boot Dug Should 7 Bit Back Food But Could 8 Sit Bad Soon Bus Good 9 Pit Cat Moon Cut Put 10 Kit Sat Tooth Bud Food
Copyrights Copyright for this article is retained by the author(s), with first publication rights granted to the journal.
This is an open-access article distributed under the terms and conditions of the Creative Commons Attribution license (http://creativecommons.org/licenses/by/4.0/).


![[PPT]Long and Short Vowel Sounds - ALEX | Alabama … and Short... · Web viewLong and Short Vowel Sounds Presented by: Lisa F. Garner Short Vowel Sounds There are five Short Vowel](https://img.dokumen.tips/doc/110x75/5aa780c17f8b9aee748c2567/pptlong-and-short-vowel-sounds-alex-alabama-and-shortweb-viewlong-and.jpg)