Embed Size (px)
Citation preview
Proceedings of the Institute of Acoustics
Vol. 37. Pt.3 2015
ACOUSTIC ANALYSIS OF THE GOTHENBURG KONSERTHUS A Wagner Müller-BBM GmbH, Planegg, Germany A Berntson Artifon AB, Gothenburg, Sweden Kh Müller Müller-BBM GmbH, Planegg, Germany
1 HISTORY
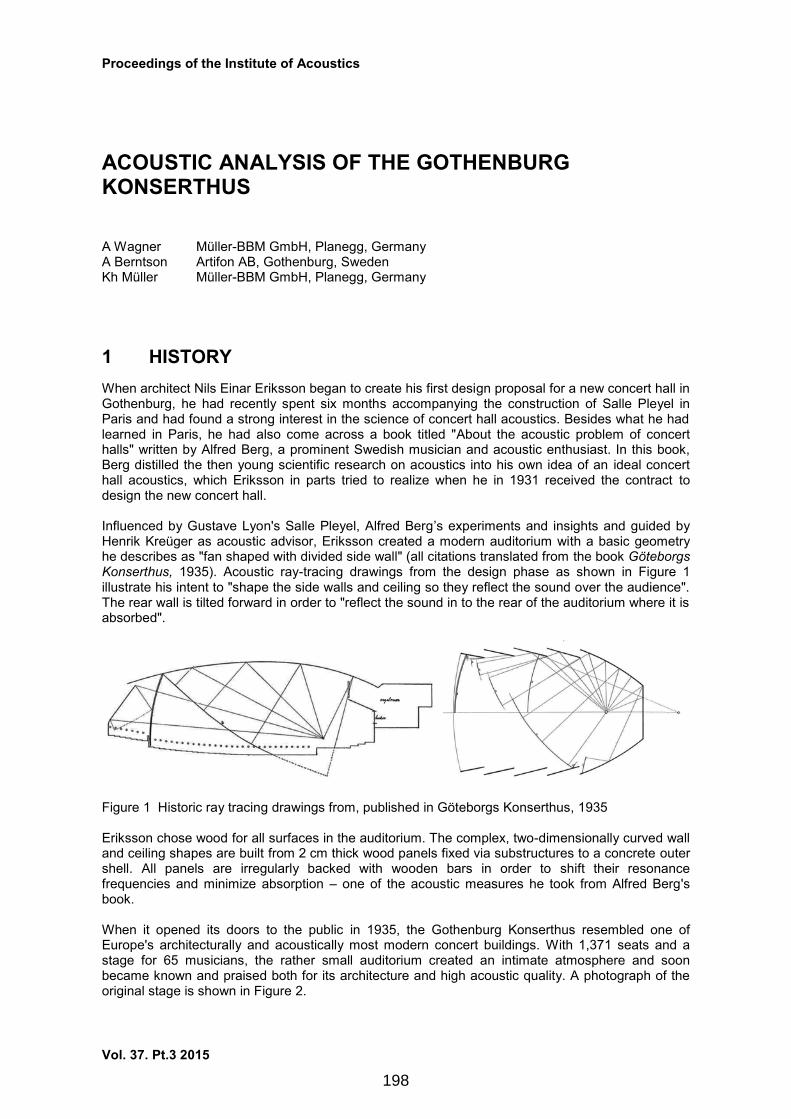
When architect Nils Einar Eriksson began to create his first design proposal for a new concert hall in Gothenburg, he had recently spent six months accompanying the construction of Salle Pleyel in Paris and had found a strong interest in the science of concert hall acoustics. Besides what he had learned in Paris, he had also come across a book titled "About the acoustic problem of concert halls" written by Alfred Berg, a prominent Swedish musician and acoustic enthusiast. In this book, Berg distilled the then young scientific research on acoustics into his own idea of an ideal concert hall acoustics, which Eriksson in parts tried to realize when he in 1931 received the contract to design the new concert hall. Influenced by Gustave Lyon's Salle Pleyel, Alfred Berg’s experiments and insights and guided by Henrik Kreüger as acoustic advisor, Eriksson created a modern auditorium with a basic geometry he describes as "fan shaped with divided side wall" (all citations translated from the book Göteborgs Konserthus, 1935). Acoustic ray-tracing drawings from the design phase as shown in Figure 1 illustrate his intent to "shape the side walls and ceiling so they reflect the sound over the audience". The rear wall is tilted forward in order to "reflect the sound in to the rear of the auditorium where it is absorbed".
Figure 1 Historic ray tracing drawings from, published in Göteborgs Konserthus, 1935 Eriksson chose wood for all surfaces in the auditorium. The complex, two-dimensionally curved wall and ceiling shapes are built from 2 cm thick wood panels fixed via substructures to a concrete outer shell. All panels are irregularly backed with wooden bars in order to shift their resonance frequencies and minimize absorption – one of the acoustic measures he took from Alfred Berg's book. When it opened its doors to the public in 1935, the Gothenburg Konserthus resembled one of Europe's architecturally and acoustically most modern concert buildings. With 1,371 seats and a stage for 65 musicians, the rather small auditorium created an intimate atmosphere and soon became known and praised both for its architecture and high acoustic quality. A photograph of the original stage is shown in Figure 2.
198

Proceedings of the Institute of Acoustics
Vol. 37. Pt.3 2015
Fifty years later, larger orchestras demanded for an increased stage size, which was realized in 1985 together with an enlarged and now curved canopy. New seats completed the renovation works and the hall opened again with about 1,290 seats and a stage now holding more than 100 musicians.
Figure 2 View of the original stage in 1935 (top left), after the renovation 1985 (top right) and in 2014 (bottom) After the renovation works in the 1980s, repeated complaints about the balance of instrument groups both in the auditorium and on the stage sparked an acoustic analysis by Jordan and Gade in 1993. The most prominent outcome of this analysis was a change of the curved stage canopy to an acoustically transparent design with vertical elements, which was realized in 2000. The photograph in Figure 2 shows the stage in this configuration, which at the time of writing reflects the current situation. In 2013, plans for a new renovation of the auditorium substantiated. The renovation works were to be prepared by a thorough acoustic analysis of the current situation – both to determine and conserve the acoustical status quo and also to use the analysis to maybe identify room for further improvements. In 2014, Artifon AB together with Müller-BBM won the competition for this acoustic analysis.
199

Proceedings of the Institute of Acoustics
Vol. 37. Pt.3 2015
2 ACOUSTIC ANALYSIS
2.1 ORCHESTRA INTERVIEWS
The acoustic analysis was initiated with a series of interviews with members of the orchestra as well as musical and technical administration staff. The interviews were organized as open discussions revolving around the musician's current and past experience with the acoustics in the auditorium. The key results of the interview sessions can be summarized as follows.
All interviewed musicians praised the acoustics of the Konserthus as high class and unique. Any change to the auditorium would have to be investigated thoroughly and weighed carefully.
The last major renovation in the 1980s is considered to have had some detrimental effects on the brilliance of the sound and the overall musical balance.
Even after the last renovation in 2000, mutual hearing and ease of ensemble are still not ideal, especially for strings sitting in the last desks on both sides of the stage. Various measures have been tested to improve the mutual hearing on stage but without any clear conclusion.
The auditorium's geometry seems to create an imbalance of instrument groups especially towards the rear of the auditorium. In the elevated rear section of the auditorium, wind and percussion instruments clearly dominate the sound with high clarity. The small strings have a more muffled sound with lack of brilliance and low clarity. While the effect is well known amongst the resident musicians and although they try to balance it with their play, guest conductors often tend to push wind and percussion instruments too much.
Another side effect of this imbalance is a rather weak soloist position, which compared to the position on the previous, smaller stage is reported to have lost considerably in strength and clarity.
In some seats there are disturbing late reflections from the focusing surfaces 2.2 Acoustic Measurements
2.2.1 Auditorium
In order to support the subjective impressions of the musicians with objective figure, detailed room acoustic measurements were carried out in the unoccupied and occupied auditorium. Figure 3 shows a floor plan of the auditorium with selected source and receiver positions along the center axis of the room. In total, the measurements comprised 14 positions in the auditorium and 7 positions on the stage.
Figure 3 Floor plan with exemplary source (S) and receiver (R) positions along the center axis of the room.
200

Proceedings of the Institute of Acoustics
Vol. 37. Pt.3 2015
The measurement results could confirm the reported imbalance of instrument groups towards the rear of the auditorium. The diagram in Figure 4 compares the measured early sound strength index G80 for different (omni directional) source positions on the stage and a series of receiver positions. It can be seen that instrument groups from the rear part of the stage appear disproportionately strong in the rear of the auditorium.
0
1
2
3
4
5
6
7
8
9
10
R1 R2 R3 R4 R5
Str
en
gth
In
dex
G80
[s
B]
Receiver position
S1 concert master S2 viola S3 flute S4 timpani
Figure 4 Measured early sound strength index G80 at mid frequencies (500 Hz and 1000 Hz octave average) for different source positions on the stage. The measured reverberation time in the auditorium is shown in Figure 5. Overall, the reverberation suits the size and intimacy of the auditorium. A slight increase in reverberation at high frequencies could be desirable in order to increase brilliance and clarity of the string instruments. Absorption measurements of the chairs in the auditorium have shown potential for reduction of high frequency absorption by optimizing the new chair model, i.e. reducing sound absorbing surfaces, especially on the backside and armrests. The planned new ventilation and air conditioning system will also have an influence, as the humidity in the auditorium is currently rather low during the cold period.
frequency f /Hz
125 250 500 1000 2000 4000
reve
rbe
ratio
n t
ime
T
30
/s
0.0
0.5
1.0
1.5
2.0
2.5
3.0
2.30
2.20
1.90
1.95
1.85
1.75
1.80
1.75
1.60
1.70
1.60
1.50
1.60
1.55
1.45
1.35
1.30
1.25
T30 - Unoccupied Auditorium
T30 - Rehearsal Situation
T30 - Occupied Auditorium
Figure 5 Measured reverberation time for three auditorium configurations, averaged over all source and receiver positions, rounded to 0.05 s
frequency f /Hz
125 250 500 1000 2000 4000
reve
rbe
ratio
n t
ime
T
30
/s
0.0
0.5
1.0
1.5
2.0
2.5
3.0
2.30
2.20
1.90
1.95
1.85
1.75
1.80
1.75
1.60
1.70
1.60
1.50
1.60
1.55
1.45
1.35
1.30
1.25
T30 - Unoccupied Auditorium
T30 - Rehearsal Situation
T30 - Occupied Auditorium
201

Proceedings of the Institute of Acoustics
Vol. 37. Pt.3 2015
2.2.2 Stage
Additional, detailed measurements were taken between source and receiver positions on the stage with an orchestra arrangement for Bruckner’s Symphony No. 5 as shown in the photograph in Figure 6.
Figure 6 Left: View of the instrument setup for Bruckner’s Symphony No. 5 with annotated measurement positions. Each position was used as source and receiver position. Right: Relative quality of acoustic contact on the stage between measurement positions rated from strong (+) to weak (–) The table in Figure 6 summarizes an evaluation of the acoustic contact quality between the measurement positions. The relative ratings between strong (+) and weak (–) were derived from the measured values of Gearly, Glate and C80. Strong early reflections were rated positively; a strong late energy portion was rated negatively. Again, the results of the measurements corresponded well to the subjective impressions of the musicians. 2.3 Binaural Recordings
Binaural recordings at the same positions as used for the measurements allowed for a further subjective evaluation of the measurement results. The recordings were taken using small, custom built, binaural recording devices. These were distributed in the auditorium and on the stage during several rehearsals and one concert and thus created comparable, calibrated recordings of the same musical excerpt in parallel at multiple locations. The recordings were later compared to the measurement results. An important tool used to evaluate the recordings was a small HTML application, which allowed listening to the same musical excerpt at different locations in the hall. A screen shot of the application is shown in Figure 7. The listening position can be changed in the application without interrupting the playback thus allowing for a seamless A/B comparison of different seats and situations.
cm vla fl ti vl vc kb
cm + + – o – –
vla + + + + + –
fl + + + + + o
ti – + + + – –
vl o + + + – –
vc – + + – – +
kb – – o – – +
202

Proceedings of the Institute of Acoustics
Vol. 37. Pt.3 2015
Figure 7 HTML application used for A/B testing playback The application was made accessible to all members of the orchestra and musical management. This deepened their involvement in the analysis process and helped to re-transform the abstract measurement results into audible form. For the auditorium, the recordings again clearly demonstrated the increasing strength of wind and percussion instruments towards the rear of the auditorium. They also revealed a slight instability in the perceived instrument position with increasing distance from the stage. On the stage, the recordings allowed the orchestra members to experience the orchestra sound from positions different than their own instrument's location.
203

Proceedings of the Institute of Acoustics
Vol. 37. Pt.3 2015
3 EVALUATION
3.1 Acoustic Model
Based on the acoustic measurements, an acoustic computer model was created and calibrated in CATT Acoustics to closely match the measurement results. In order to recreate the curved and angled geometry of the auditorium, a laser scan of the auditorium was used as a basis for the modeling process. An image of the acoustic model is shown in Figure 8.
Figure 8 Acoustic computer model used for the investigation In order to improve the calculation times of the model, most evaluations were done using an abstracted version of the model with fully reflecting or absorbing surfaces. Due to the absence of scattering structures on most surfaces in the auditorium, scattering was also ignored in this model. While the calculation results from the simplified model were of course incorrect in their absolute values, they allowed to identify the three dimensional geometric reflection paths and their temporal relations. 3.2 Stage Acoustics
It was the stated goal of the architect to shape the stage walls so they would project the sound into the auditorium. The wide opening angle, slight concave curvature and inclination of these walls do indeed project most of the energy outwards, leaving only few reflections that could help the musicians' mutual contact. This leaves the ceiling as the only helpful surface for the orchestra. Its inclined and double-concave geometry is not ideal but does project helpful reflections back onto the stage. The evaluation has shown that additional reflections in the stage area would be desirable in order to support the acoustic contact with early reflections and mask late energy portions coming back from the hall. Also the orchestra layout and riser arrangement have to be regarded as an important point to improve the visual and acoustic contact amongst the musicians. 3.3 Auditorium Acoustics
While the historic, two dimensional ray-tracings from the original design of the hall show an even distribution of sound, a three dimensional analysis in the computer model did identify several reflection paths that seem to be responsible for the strong acoustic contact between the rear half of the stage and the rear of the auditorium. Side and rear walls of the stage project the sound of the wind and percussion instruments into the concave ceiling, which then guides most of the energy into the rear of the auditorium. The strongly inclined rear wall intensifies this effect by projecting all energy into the last, raised audience section. The mappings in Figure 9 compare the distribution of early sound reflections for two exemplary source positions A1 (first violin) in the front of the stage and A3 (flute) further back.
204

Proceedings of the Institute of Acoustics
Vol. 37. Pt.3 2015
Figure 9 Early sound reflection distribution for two source positions in the front (A1, first violin) and rear part (A3, flute) of the stage. 3.4 Conclusions
The evaluation of the acoustic model has shown that the large, unstructured wall surfaces, which enclose the stage, guide large parts of the sound energy into the auditorium. In connection with the concave ceiling and rear wall, this leads to the perceived imbalance in the rear of the hall. The absence of reflections back onto the stage also hinders the acoustic contact between instrument groups and thus the ease of ensemble, especially for strings across the front of the stage.
4 SUMMARY
From the outset, the main goal of the acoustic analysis of Gothenburg's Konserthus was to preserve the outstanding room acoustic quality during the upcoming renovation process. The analysis additionally revealed two acoustic flaws – an imbalance of instrument groups in the auditorium and difficulties in ensemble play – which both seem to be rooted in the design of the stage. The process of the analysis relied on a combination of objective measurements and subjective evaluations, which led to a good understanding of the acoustic situation. The close collaboration between acoustic consultants, members of the orchestra and project management helped strongly to deepen this understanding. Acoustic measures to help improve the situation have been discussed in detail and have been transformed into first architectural design proposals. At the date writing, no decision has been made regarding the further development of these measures.
205