Embed Size (px)
Citation preview
Acordos Preferenciais de
Comércio:
da multiplicação de novas
regras aos mega-acordos
comerciais
2013
Prof. Vera Thorstensen
2
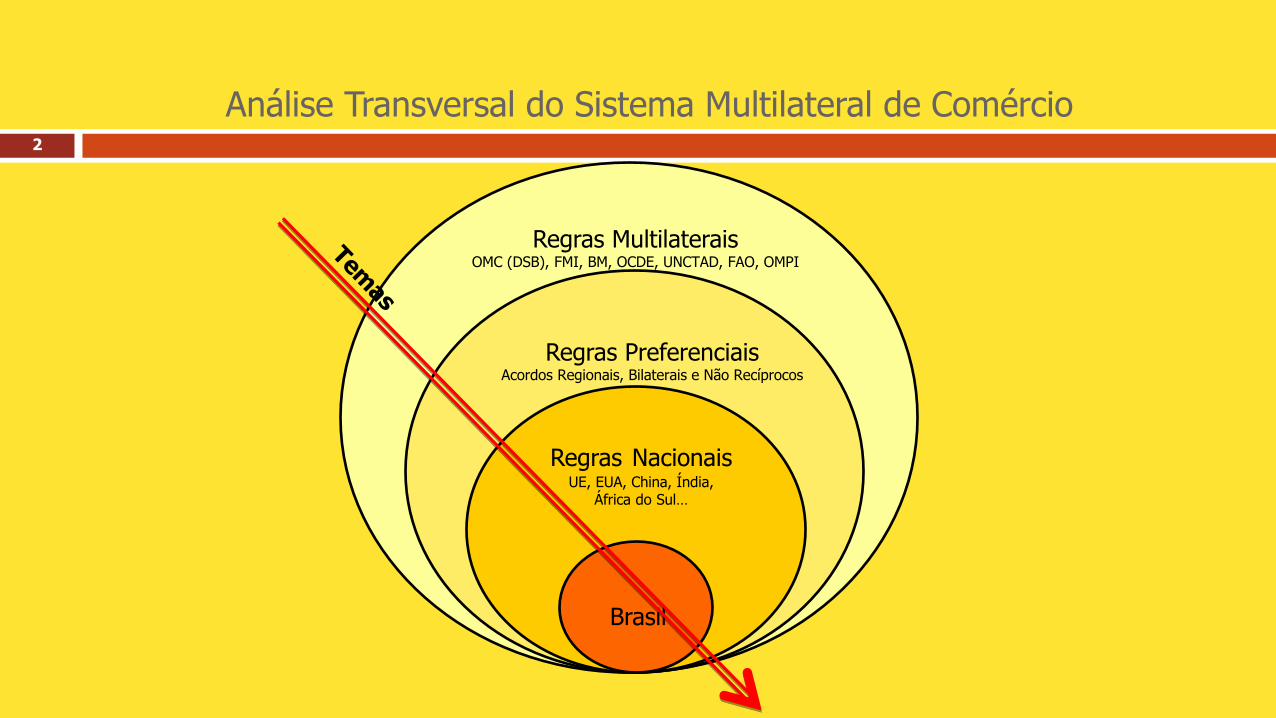
Brasil
Regras Nacionais UE, EUA, China, Índia,
África do Sul…
Regras Preferenciais Acordos Regionais, Bilaterais e Não Recíprocos
Regras Multilaterais OMC (DSB), FMI, BM, OCDE, UNCTAD, FAO, OMPI
Análise Transversal do Sistema Multilateral de Comércio
3
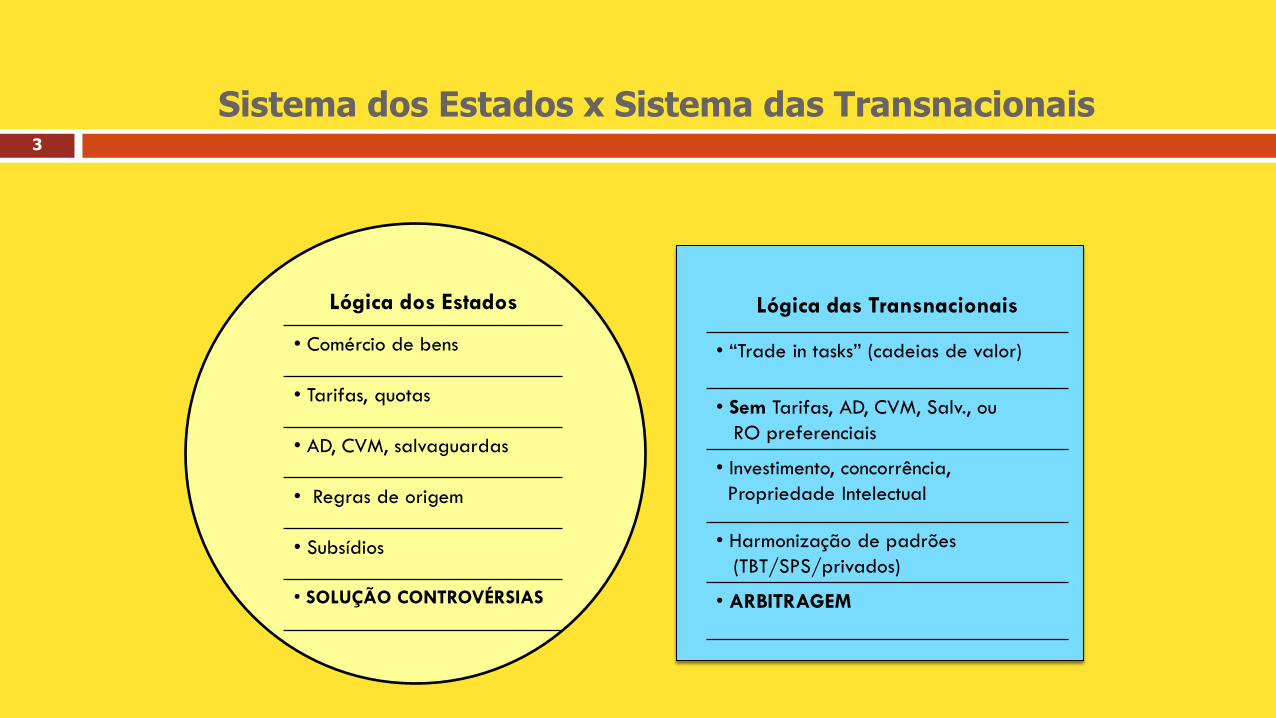
Lógica das Transnacionais
• “Trade in tasks” (cadeias de valor)
• Sem Tarifas, AD, CVM, Salv., ou
RO preferenciais
• Investimento, concorrência,
Propriedade Intelectual
• Harmonização de padrões
(TBT/SPS/privados)
• ARBITRAGEM
Lógica dos Estados
• Comércio de bens
• Tarifas, quotas
• AD, CVM, salvaguardas
• Regras de origem
• Subsídios
• SOLUÇÃO CONTROVÉRSIAS
Sistema dos Estados x Sistema das Transnacionais

DESAFIOS
ACORDOS PREFERENCIAIS
4
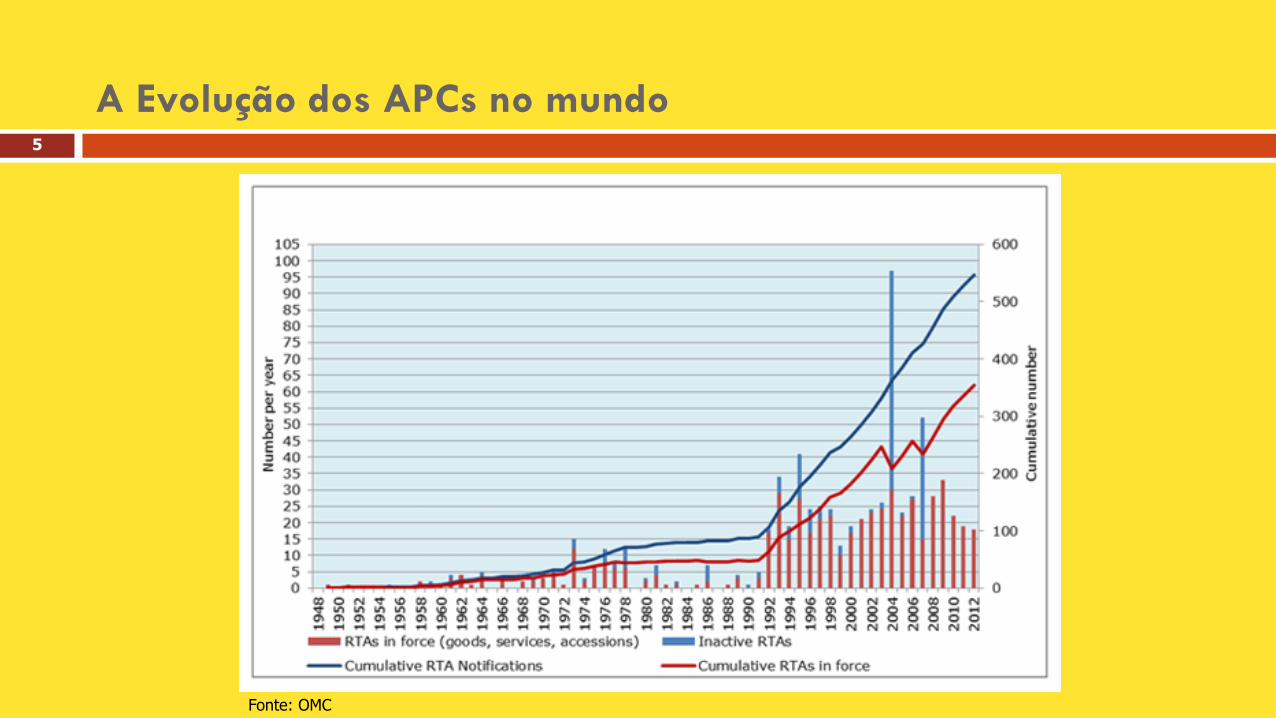
A Evolução dos APCs no mundo
Fonte: OMC
5
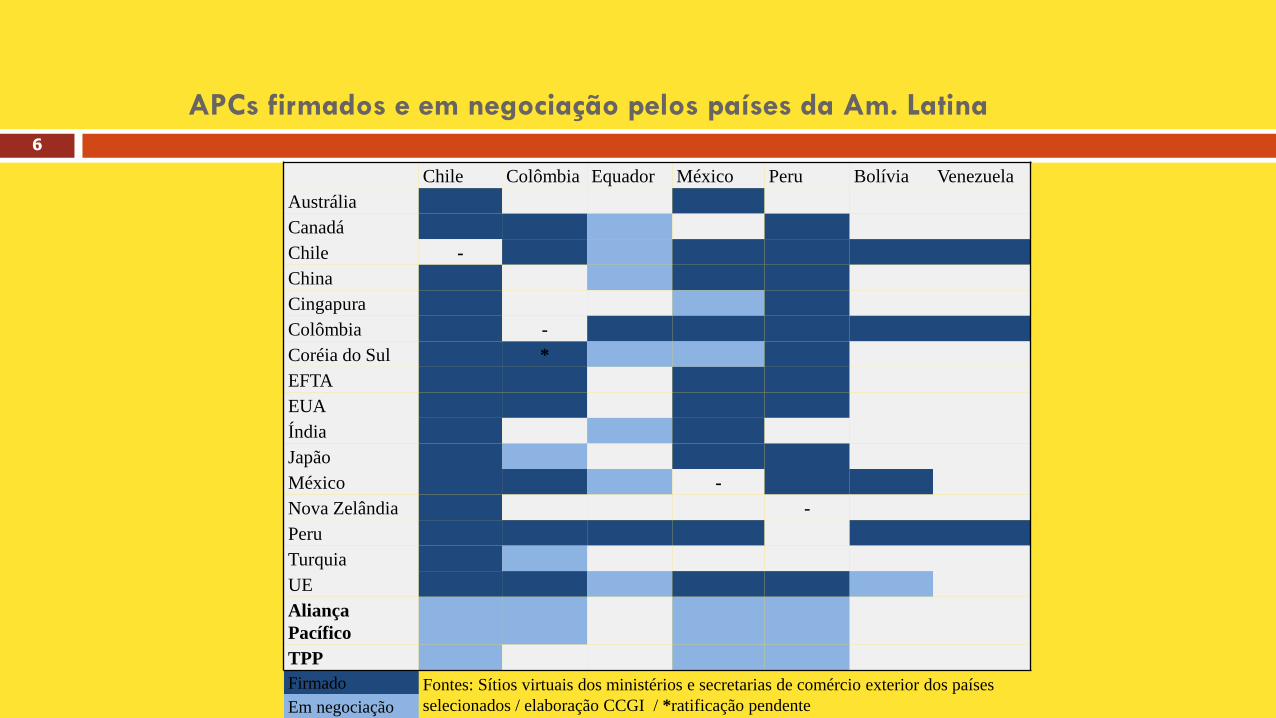
APCs firmados e em negociação pelos países da Am. Latina
6
Chile Colômbia Equador México Peru Bolívia Venezuela
Austrália
Canadá
Chile -
China
Cingapura
Colômbia -
Coréia do Sul *
EFTA
EUA
Índia
Japão
México -
Nova Zelândia -
Peru
Turquia
UE
Aliança
Pacífico
TPP
Firmado Fontes: Sítios virtuais dos ministérios e secretarias de comércio exterior dos países
selecionados / elaboração CCGI / *ratificação pendente Em negociação
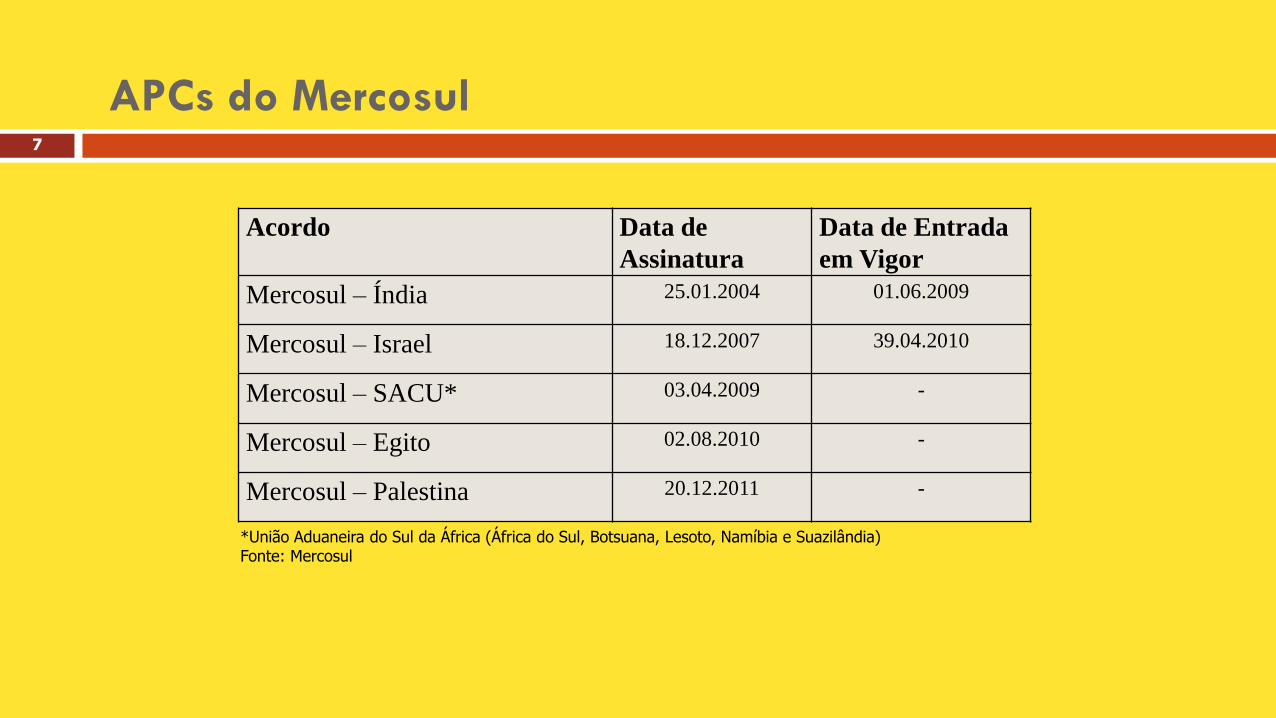
APCs do Mercosul
Acordo Data de
Assinatura
Data de Entrada
em Vigor
Mercosul – Índia 25.01.2004 01.06.2009
Mercosul – Israel 18.12.2007 39.04.2010
Mercosul – SACU* 03.04.2009 -
Mercosul – Egito 02.08.2010 -
Mercosul – Palestina 20.12.2011 -
*União Aduaneira do Sul da África (África do Sul, Botsuana, Lesoto, Namíbia e Suazilândia) Fonte: Mercosul
7
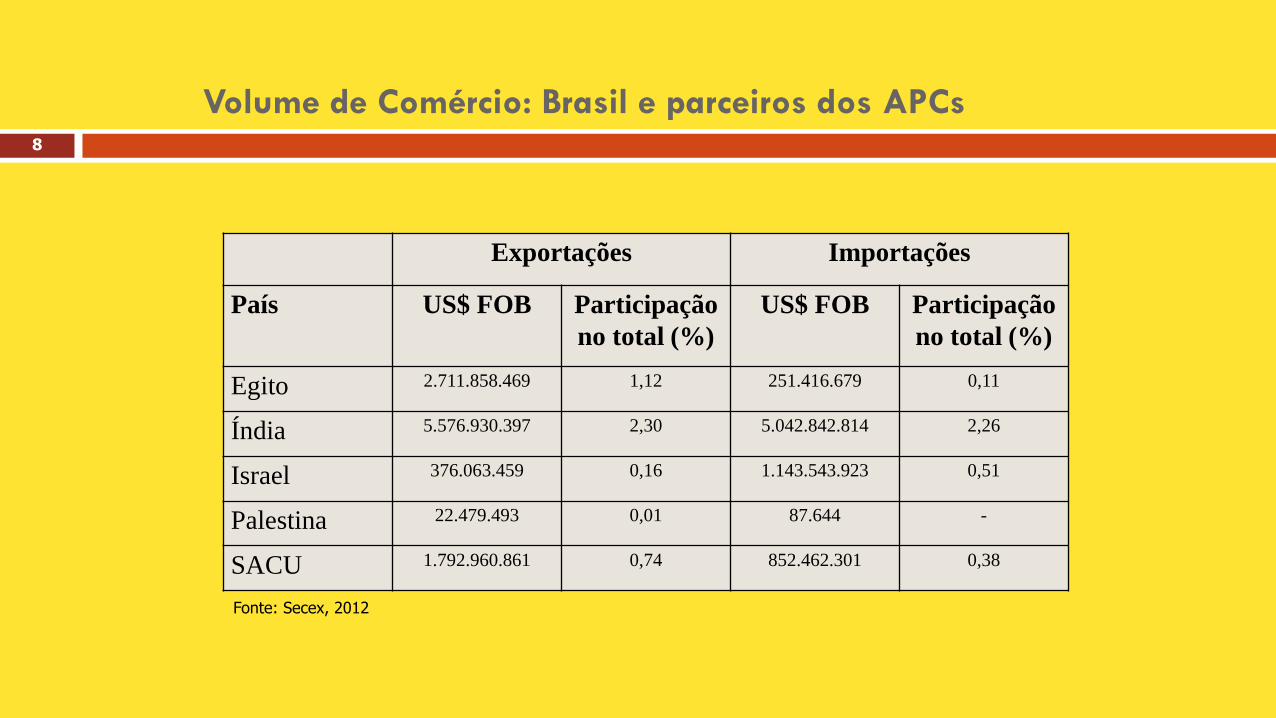
Volume de Comércio: Brasil e parceiros dos APCs
Exportações Importações
País US$ FOB Participação
no total (%)
US$ FOB Participação
no total (%)
Egito 2.711.858.469 1,12 251.416.679 0,11
Índia 5.576.930.397 2,30 5.042.842.814 2,26
Israel 376.063.459 0,16 1.143.543.923 0,51
Palestina 22.479.493 0,01 87.644 -
SACU 1.792.960.861 0,74 852.462.301 0,38
Fonte: Secex, 2012
8
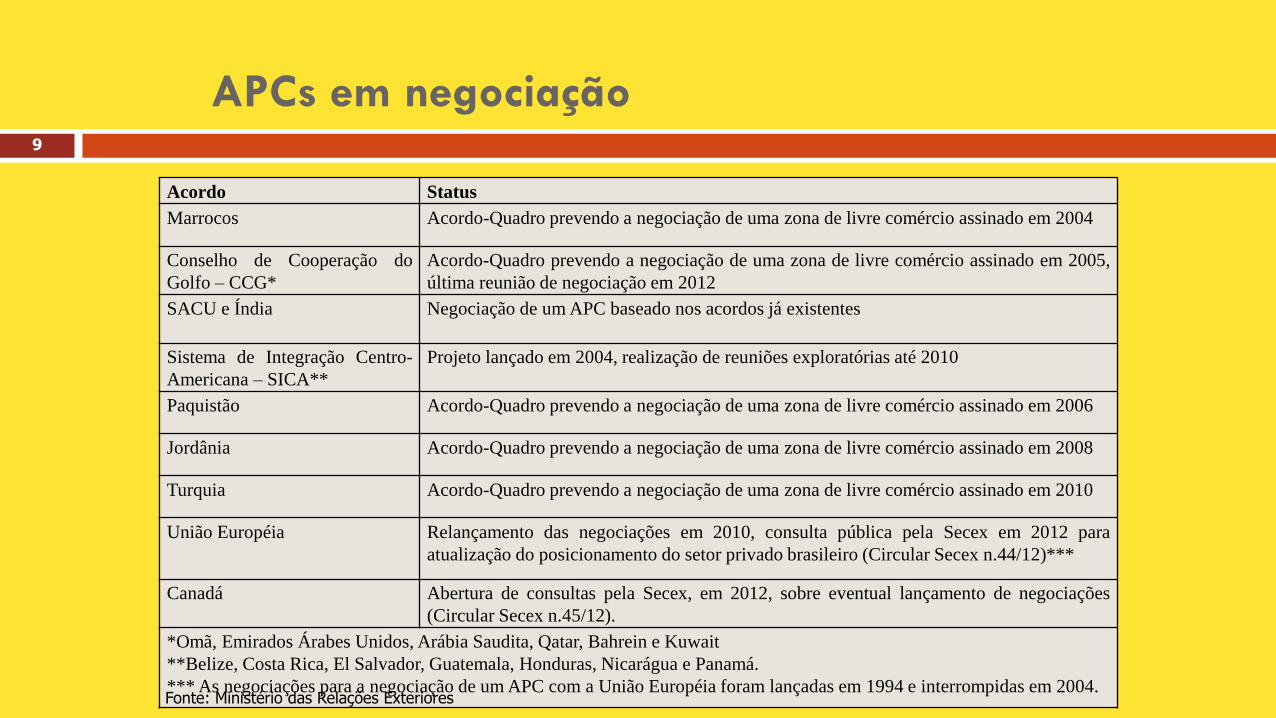
APCs em negociação
Acordo Status
Marrocos Acordo-Quadro prevendo a negociação de uma zona de livre comércio assinado em 2004
Conselho de Cooperação do
Golfo – CCG*
Acordo-Quadro prevendo a negociação de uma zona de livre comércio assinado em 2005,
última reunião de negociação em 2012
SACU e Índia Negociação de um APC baseado nos acordos já existentes
Sistema de Integração Centro-
Americana – SICA**
Projeto lançado em 2004, realização de reuniões exploratórias até 2010
Paquistão Acordo-Quadro prevendo a negociação de uma zona de livre comércio assinado em 2006
Jordânia Acordo-Quadro prevendo a negociação de uma zona de livre comércio assinado em 2008
Turquia Acordo-Quadro prevendo a negociação de uma zona de livre comércio assinado em 2010
União Européia Relançamento das negociações em 2010, consulta pública pela Secex em 2012 para
atualização do posicionamento do setor privado brasileiro (Circular Secex n.44/12)***
Canadá Abertura de consultas pela Secex, em 2012, sobre eventual lançamento de negociações
(Circular Secex n.45/12).
*Omã, Emirados Árabes Unidos, Arábia Saudita, Qatar, Bahrein e Kuwait
**Belize, Costa Rica, El Salvador, Guatemala, Honduras, Nicarágua e Panamá.
*** As negociações para a negociação de um APC com a União Européia foram lançadas em 1994 e interrompidas em 2004. Fonte: Ministério das Relações Exteriores
9
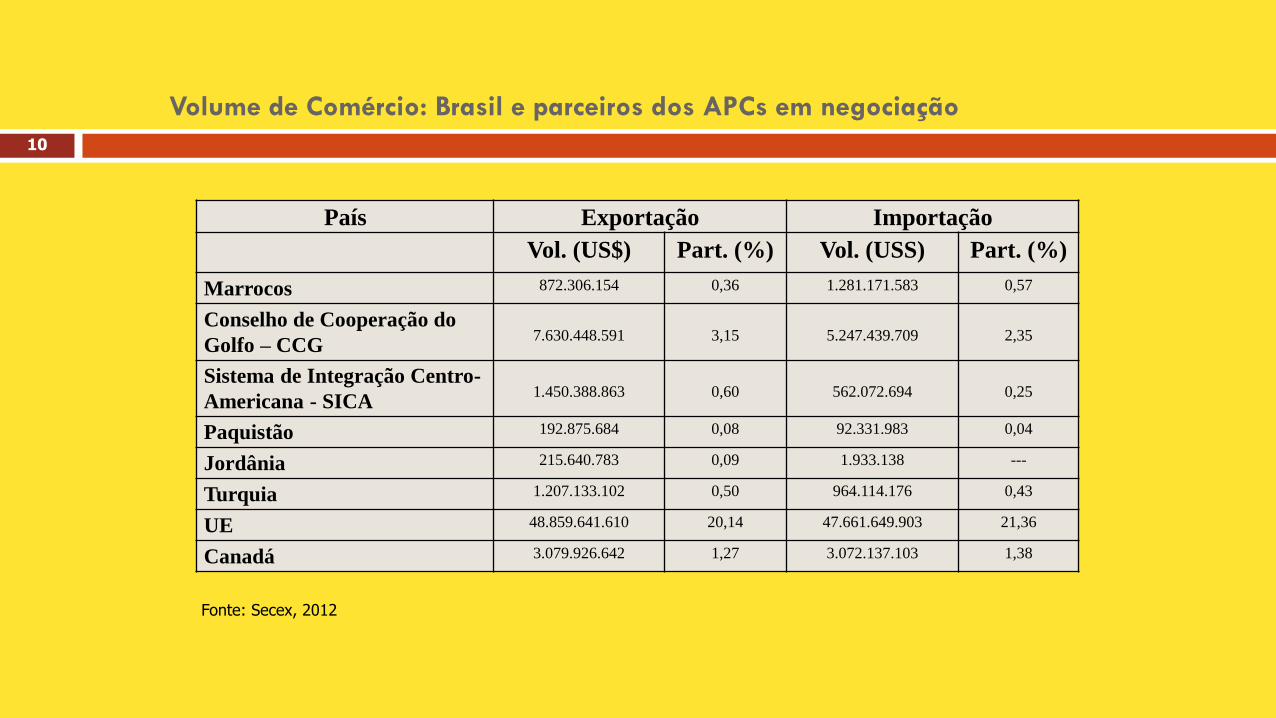
Volume de Comércio: Brasil e parceiros dos APCs em negociação
País Exportação Importação
Vol. (US$) Part. (%) Vol. (USS) Part. (%)
Marrocos 872.306.154 0,36 1.281.171.583 0,57
Conselho de Cooperação do
Golfo – CCG
7.630.448.591
3,15
5.247.439.709
2,35
Sistema de Integração Centro-
Americana - SICA
1.450.388.863
0,60
562.072.694
0,25
Paquistão 192.875.684 0,08 92.331.983 0,04
Jordânia 215.640.783 0,09 1.933.138 ---
Turquia 1.207.133.102 0,50 964.114.176 0,43
UE 48.859.641.610 20,14 47.661.649.903 21,36
Canadá 3.079.926.642 1,27 3.072.137.103 1,38
Fonte: Secex, 2012
10
EXCHANGE RATES AND
TRADE
OBSERVATORY ON EXCHANGE RATES SÃO PAULO SCHOOL OF ECONOMICS
FGV-SP 2013
Prof. Vera Thorstensen, Prof. Emerson Marçal, Prof. Lucas Ferraz
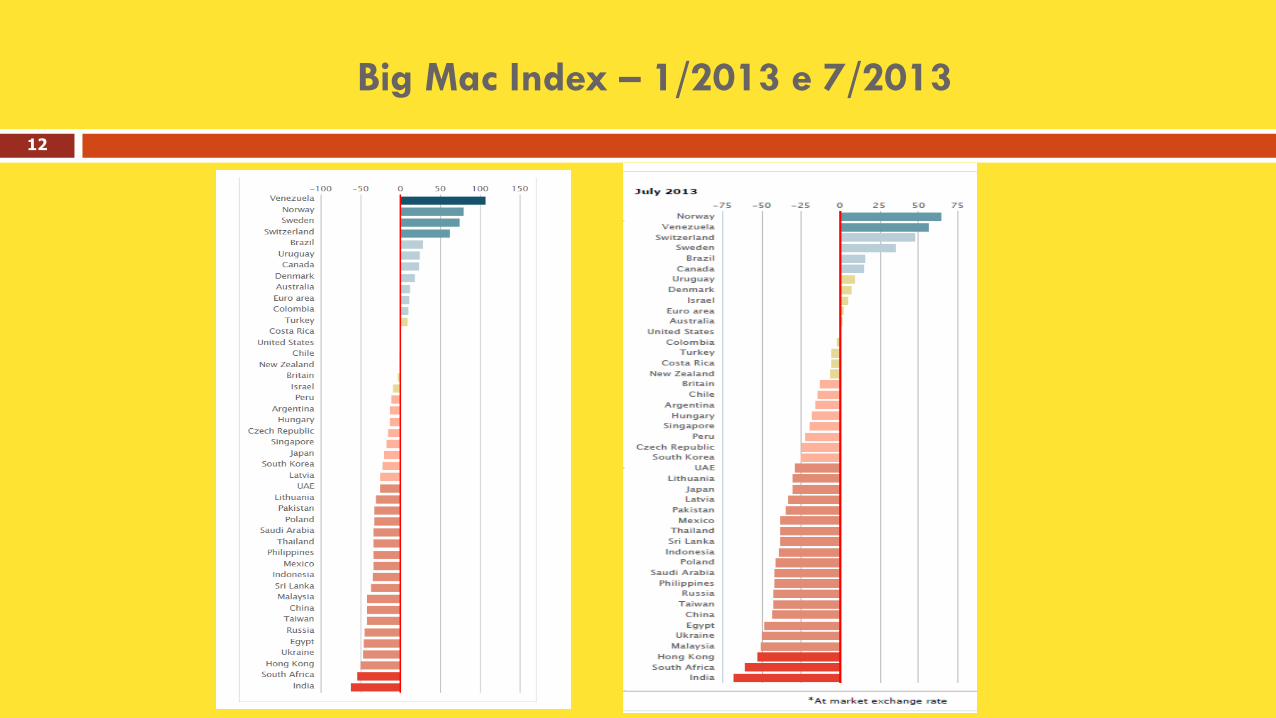
Big Mac Index – 1/2013 e 7/2013
12
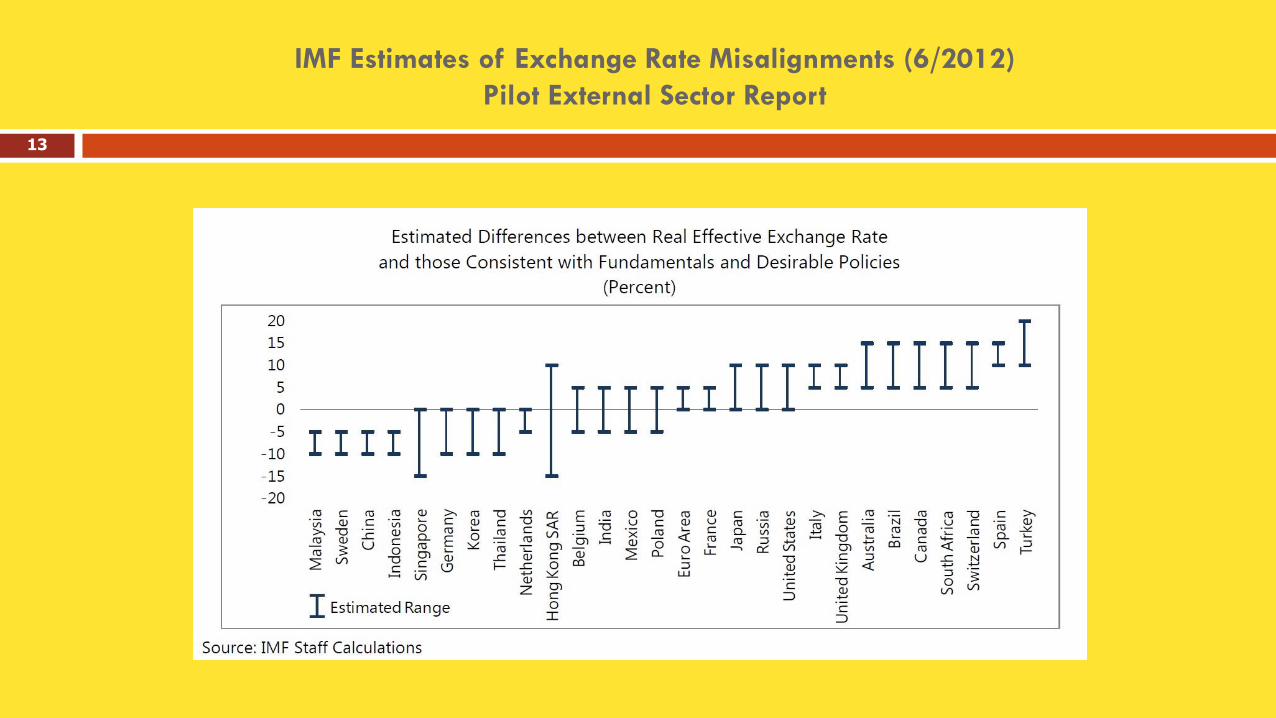
IMF Estimates of Exchange Rate Misalignments (6/2012)
Pilot External Sector Report
13
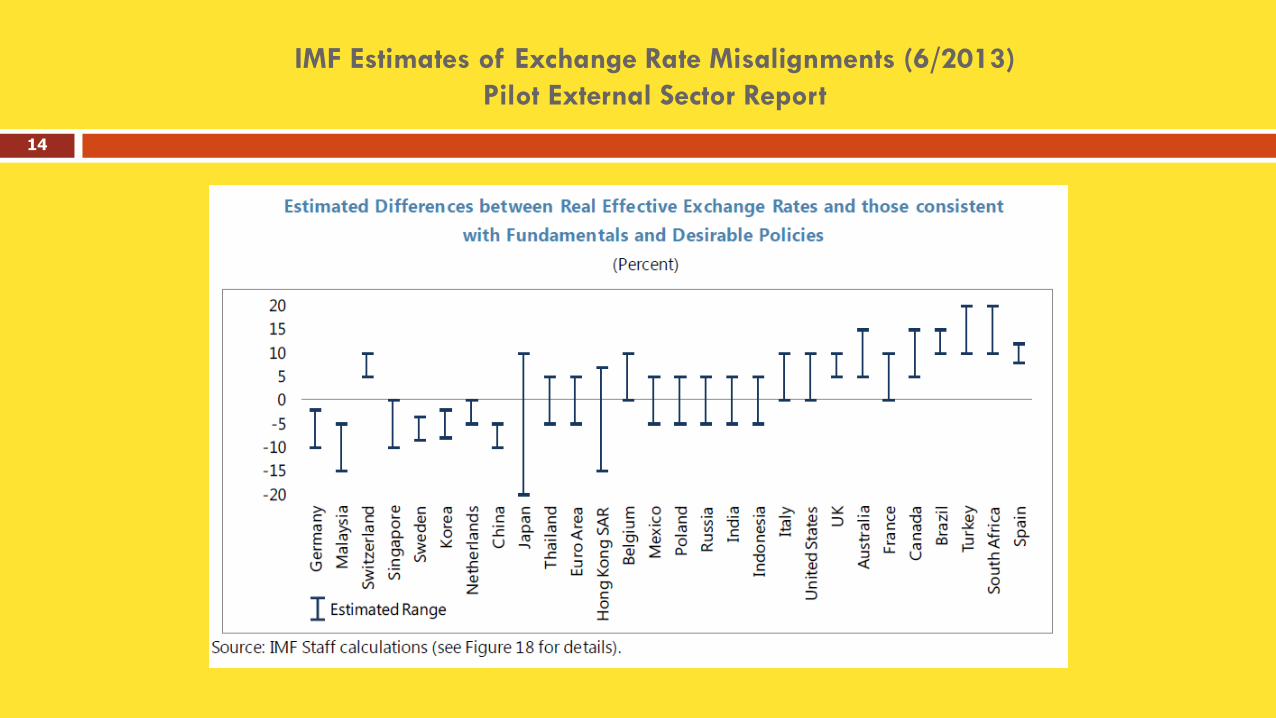
IMF Estimates of Exchange Rate Misalignments (6/2013)
Pilot External Sector Report
14
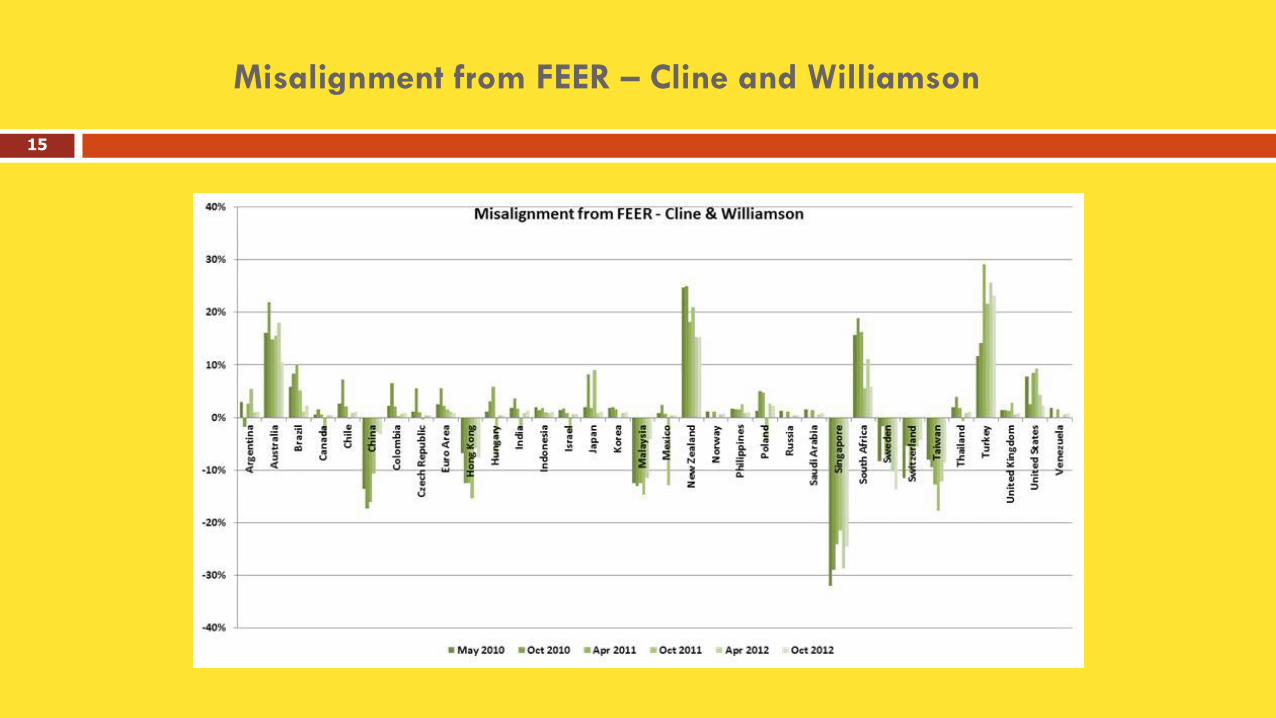
Misalignment from FEER – Cline and Williamson
15
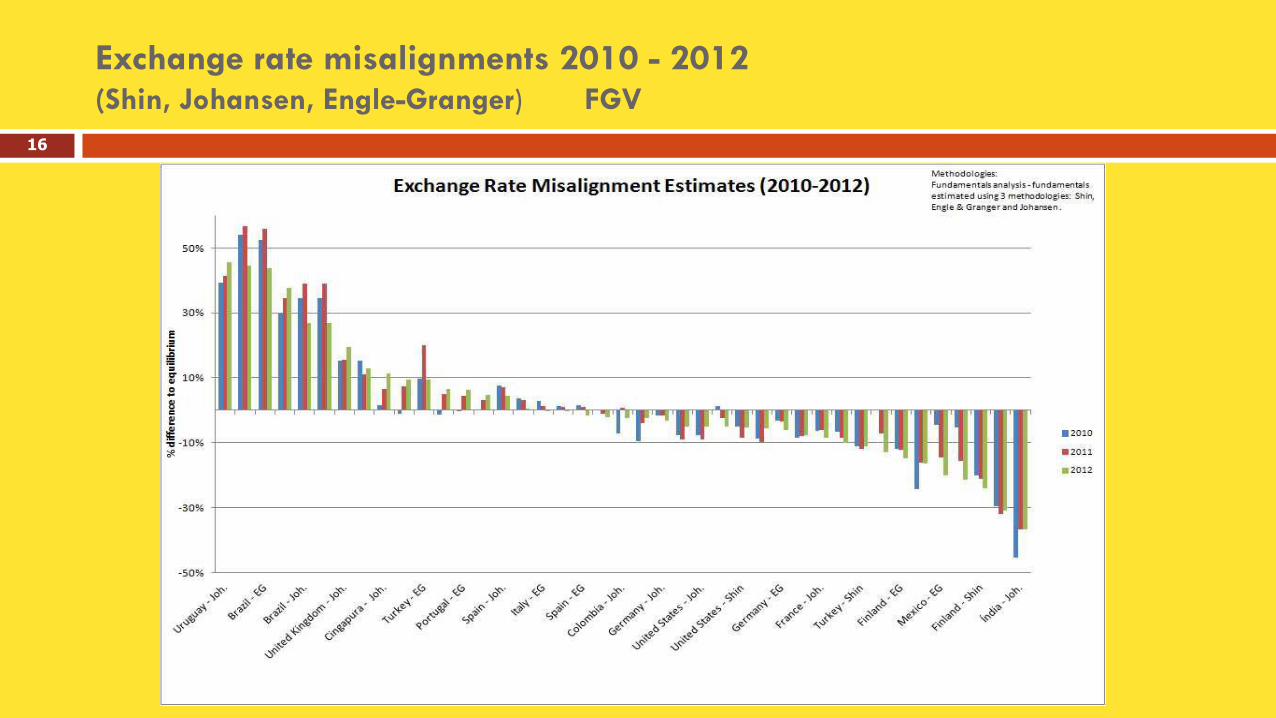
Exchange rate misalignments 2010 - 2012 (Shin, Johansen, Engle-Granger) FGV
16
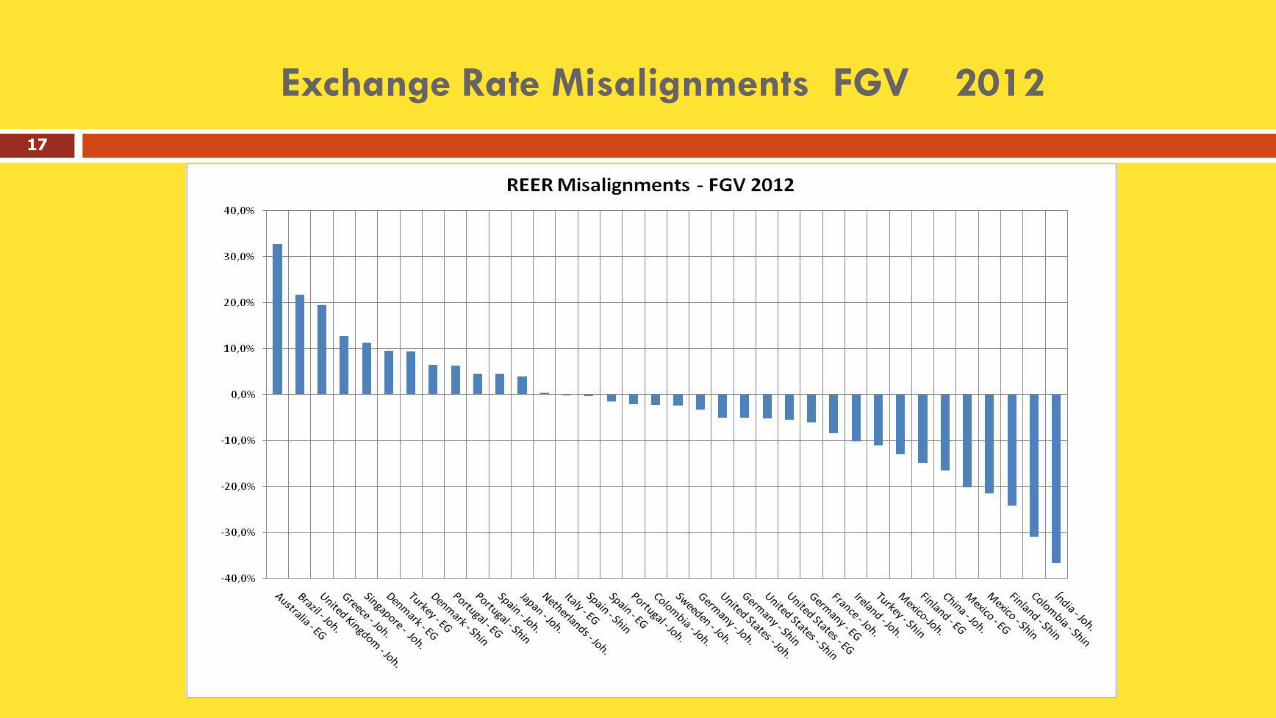
Exchange Rate Misalignments FGV 2012
17
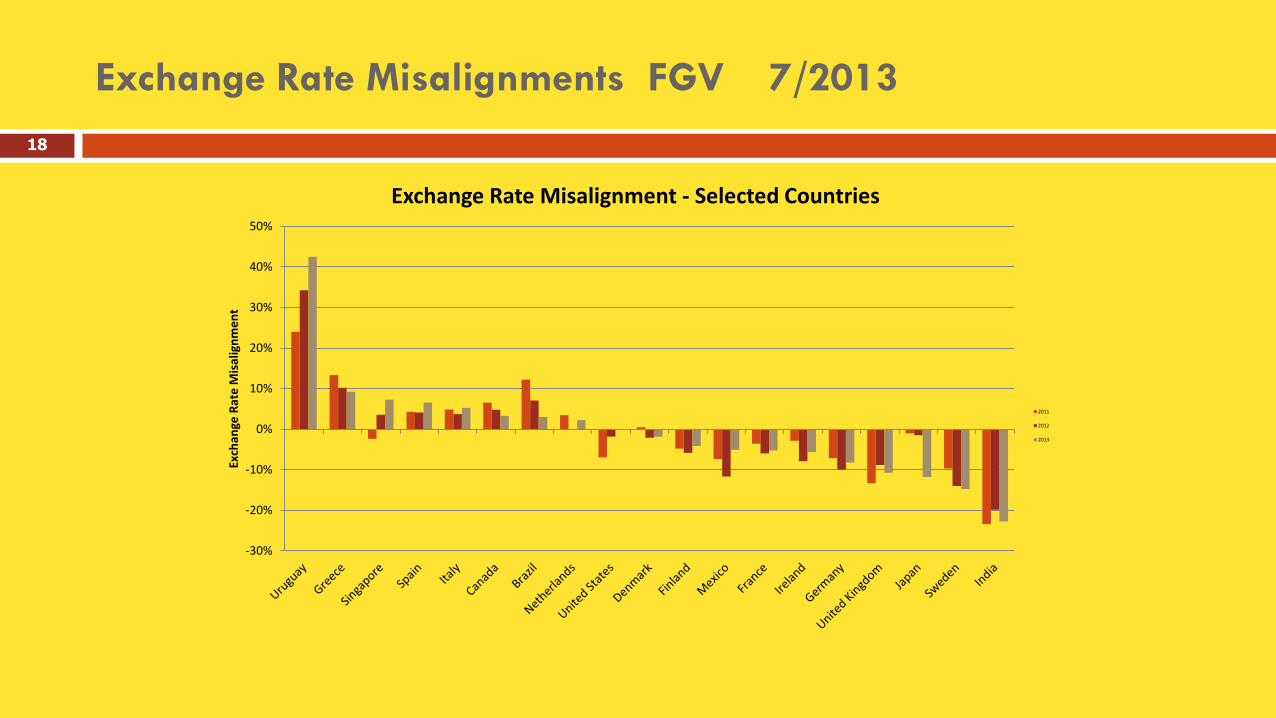
Exchange Rate Misalignments FGV 7/2013
18
-30%
-20%
-10%
0%
10%
20%
30%
40%
50%Ex
chan
ge R
ate
Mis
alig
nm
en
t
Exchange Rate Misalignment - Selected Countries
2011
2012
2013
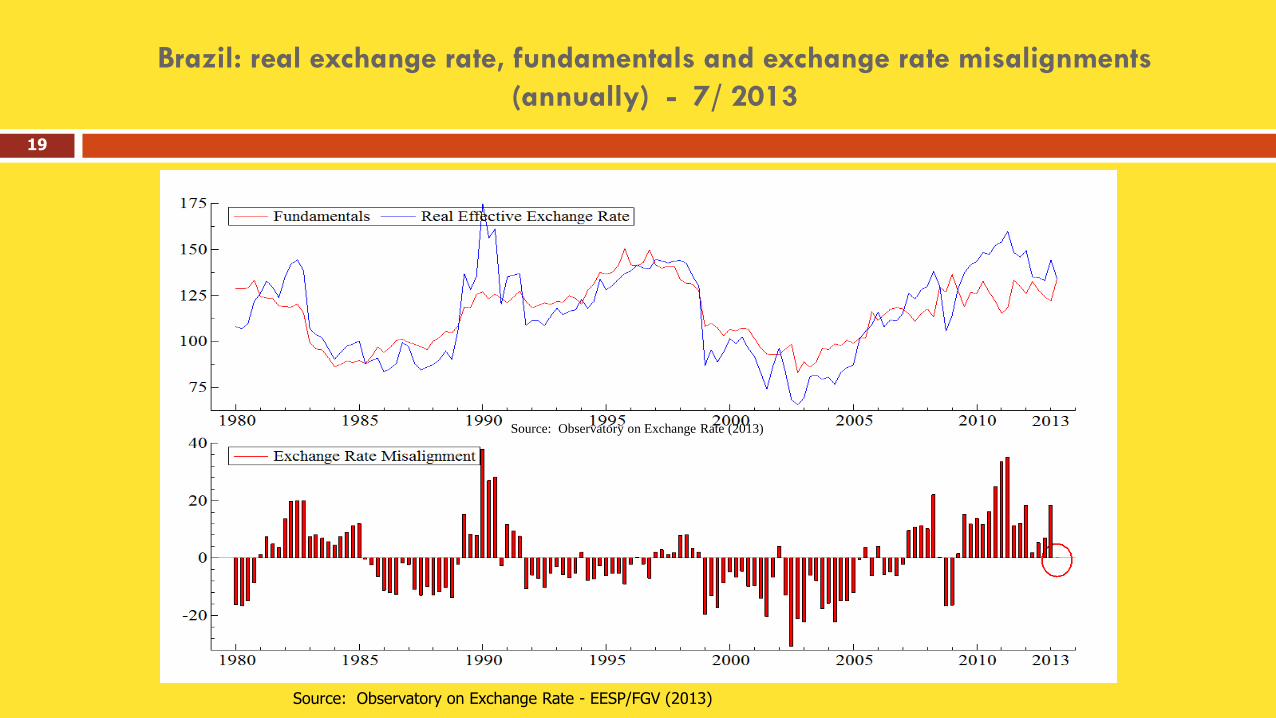
Brazil: real exchange rate, fundamentals and exchange rate misalignments
(annually) - 7/ 2013
19
Source: Observatory on Exchange Rate - EESP/FGV (2013)
Source: Observatory on Exchange Rate (2013)
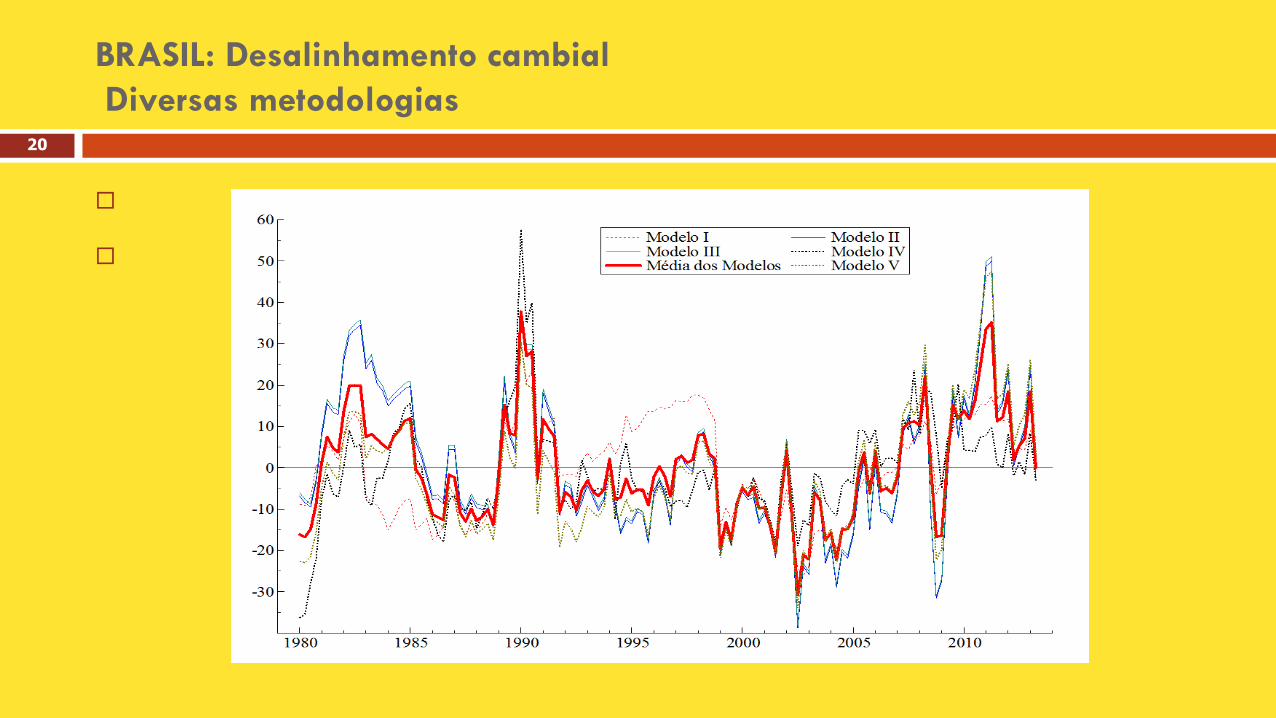
BRASIL: Desalinhamento cambial
Diversas metodologias
20
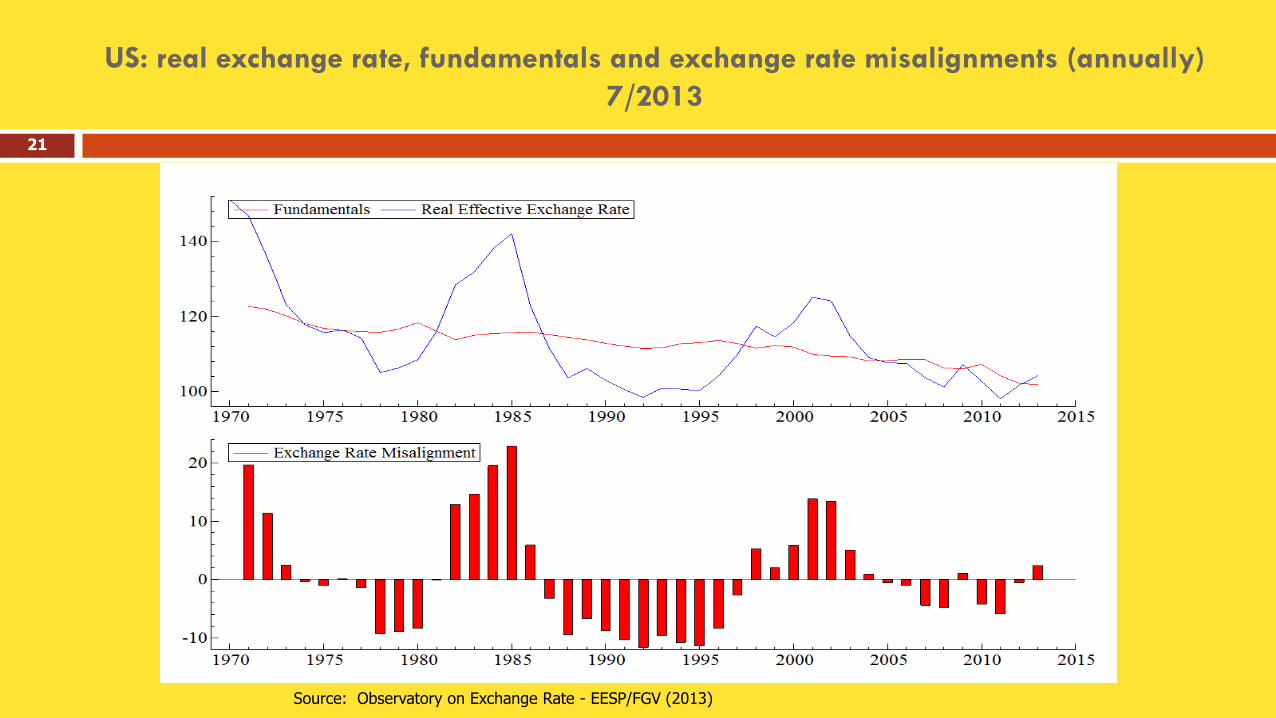
US: real exchange rate, fundamentals and exchange rate misalignments (annually)
7/2013
21
Source: Observatory on Exchange Rate - EESP/FGV (2013)
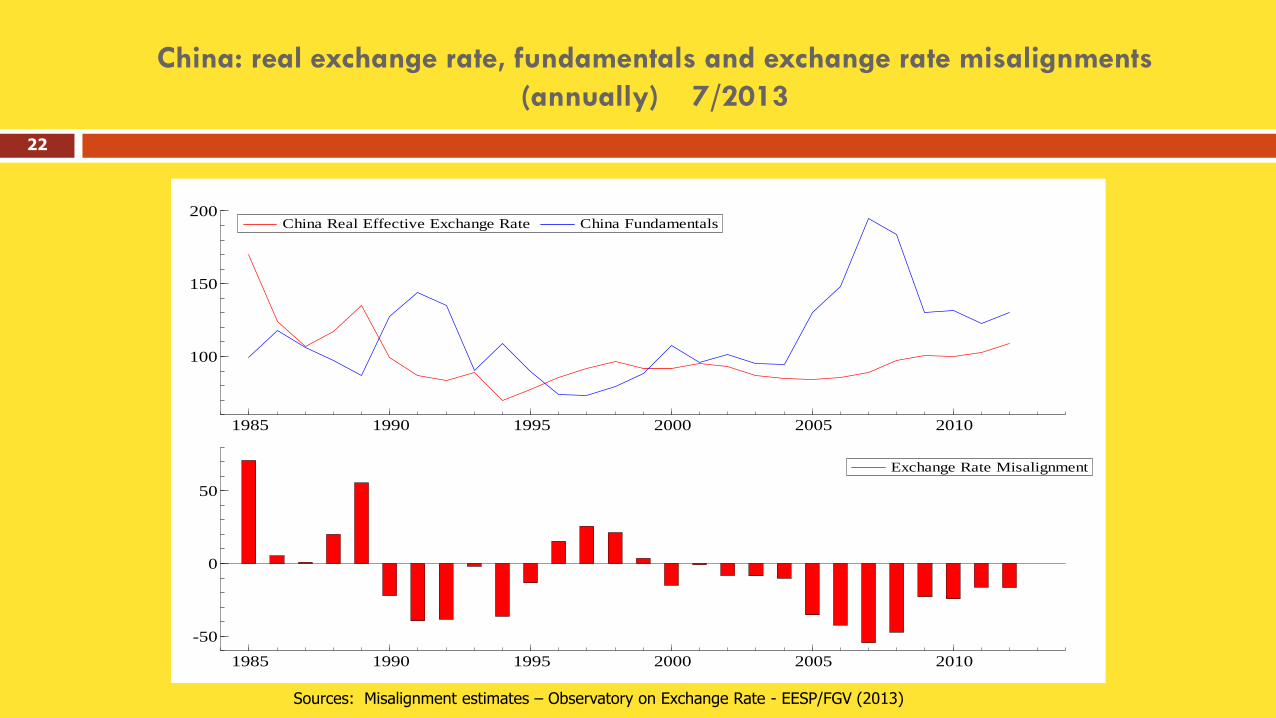
China: real exchange rate, fundamentals and exchange rate misalignments
(annually) 7/2013
22
Sources: Misalignment estimates – Observatory on Exchange Rate - EESP/FGV (2013)
China Real Effective Exchange Rate China Fundamentals
1985 1990 1995 2000 2005 2010
100
150
200China Real Effective Exchange Rate China Fundamentals
Exchange Rate Misalignment
1985 1990 1995 2000 2005 2010
-50
0
50
Exchange Rate Misalignment
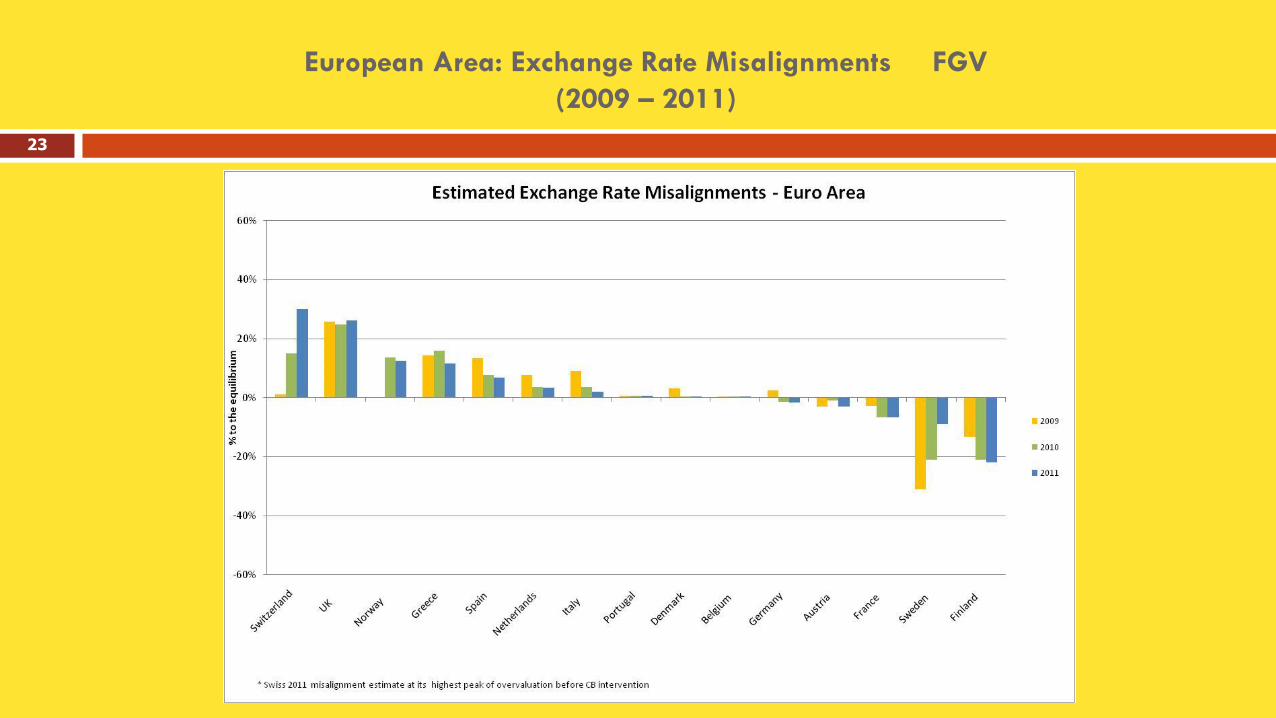
European Area: Exchange Rate Misalignments FGV
(2009 – 2011)
23
“Tariffication” of exchange rate misalignments
To exam the impact of exchange rate misalignments on trade, one possibility is to transform a misaligment into a tariff and then
to adjust the import tariff of each country, through a “tariffication” exercise.
An overvalued exchange rate has the effect of reducing or nullifying the import tariffs of the overvalued country, creating an
incentive to imports from third countries.
An undervalued exchange rate, on the other hand, will give an incentive to exports from the undervalued country. A country’s
undervalued currency will have the effect of increasing its import tariffs, sometimes above the bound levels at the WTO.
The equation used to “tarifficate” the effects of exchange rate misalignments is presented in the next slide
24
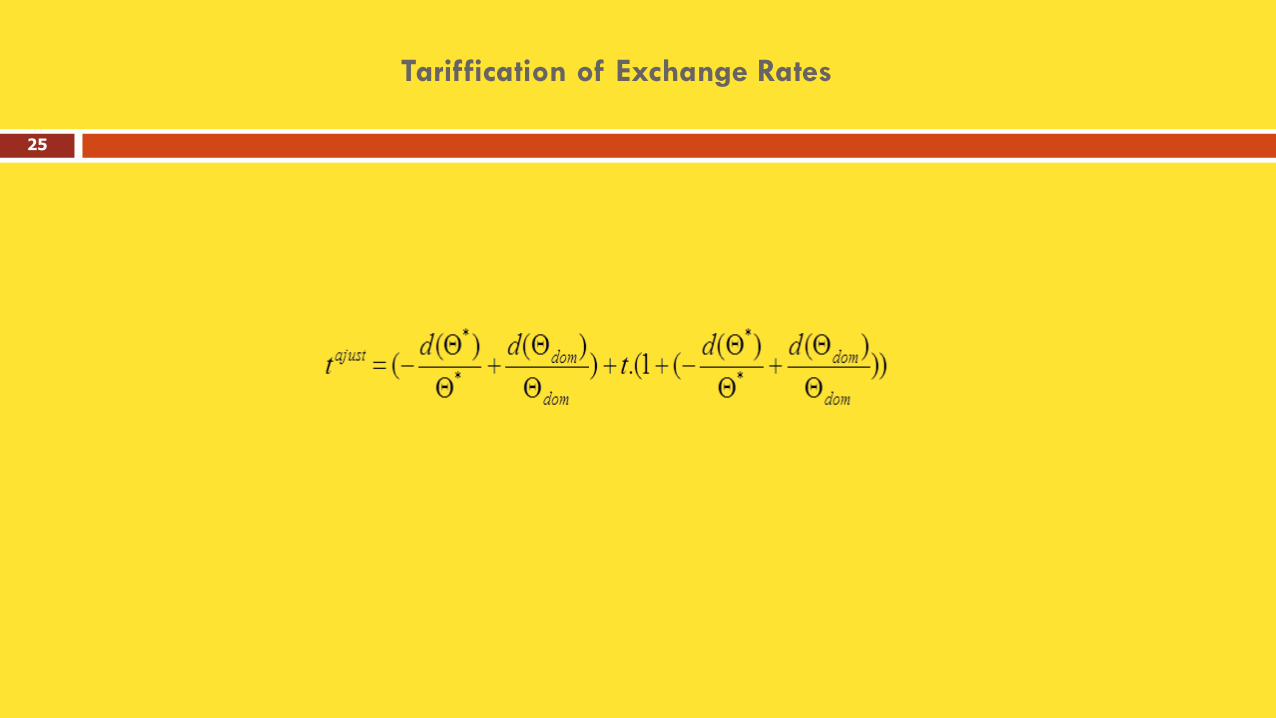
Tariffication of Exchange Rates
25
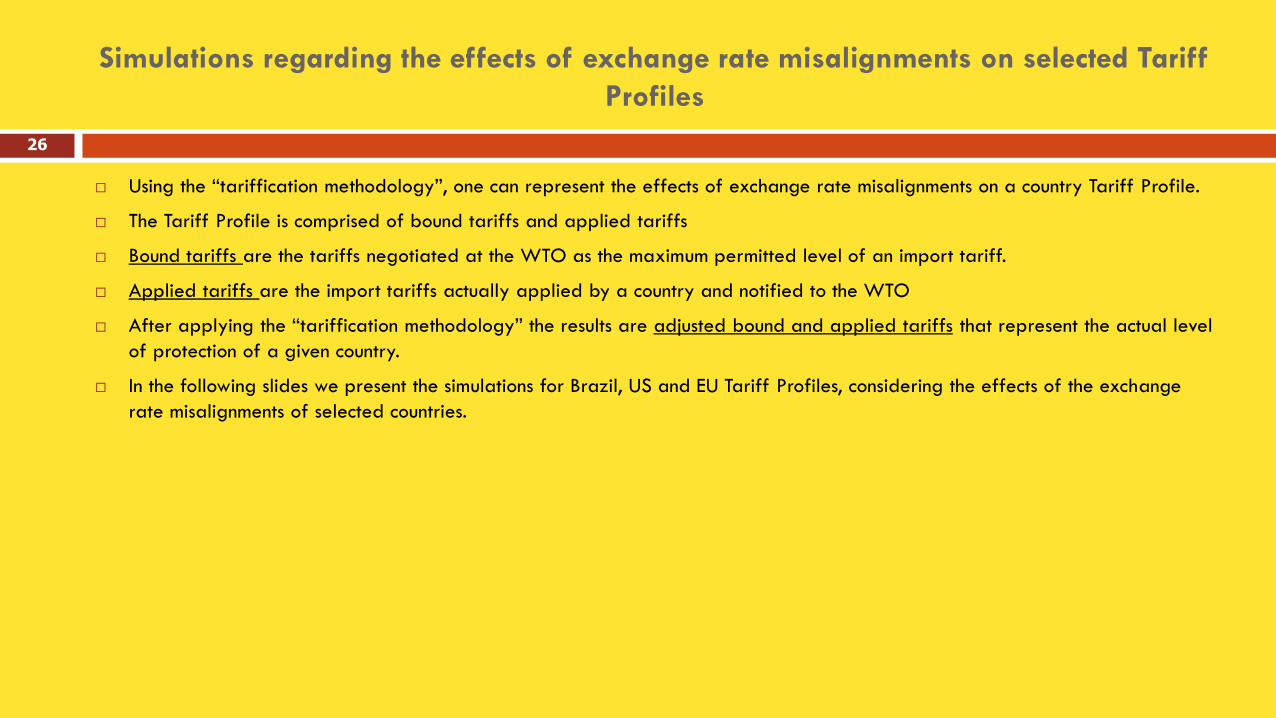
Simulations regarding the effects of exchange rate misalignments on selected Tariff
Profiles
Using the “tariffication methodology”, one can represent the effects of exchange rate misalignments on a country Tariff Profile.
The Tariff Profile is comprised of bound tariffs and applied tariffs
Bound tariffs are the tariffs negotiated at the WTO as the maximum permitted level of an import tariff.
Applied tariffs are the import tariffs actually applied by a country and notified to the WTO
After applying the “tariffication methodology” the results are adjusted bound and applied tariffs that represent the actual level
of protection of a given country.
In the following slides we present the simulations for Brazil, US and EU Tariff Profiles, considering the effects of the exchange
rate misalignments of selected countries.
26
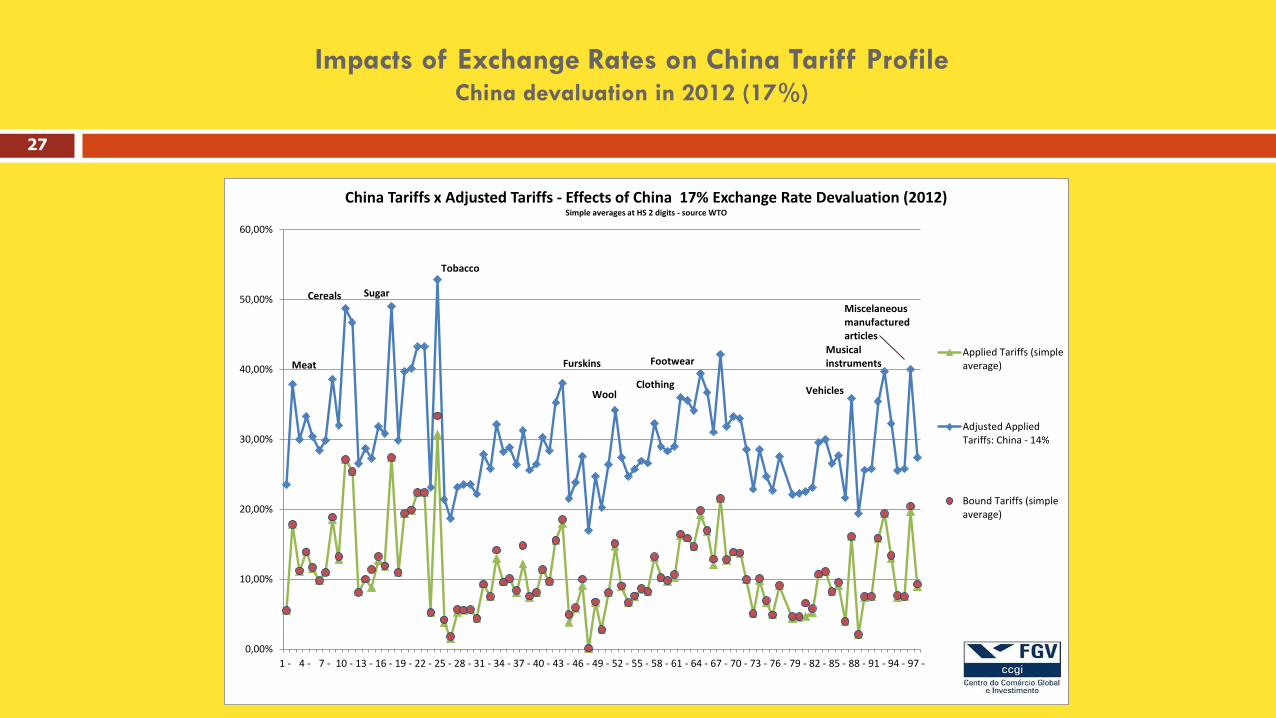
Impacts of Exchange Rates on China Tariff Profile China devaluation in 2012 (17%)
0,00%
10,00%
20,00%
30,00%
40,00%
50,00%
60,00%
1 - 4 - 7 - 10 - 13 - 16 - 19 - 22 - 25 - 28 - 31 - 34 - 37 - 40 - 43 - 46 - 49 - 52 - 55 - 58 - 61 - 64 - 67 - 70 - 73 - 76 - 79 - 82 - 85 - 88 - 91 - 94 - 97 -
China Tariffs x Adjusted Tariffs - Effects of China 17% Exchange Rate Devaluation (2012) Simple averages at HS 2 digits - source WTO
Applied Tariffs (simpleaverage)
Adjusted AppliedTariffs: China - 14%
Bound Tariffs (simpleaverage)
Cereals Sugar
Wool
Meat Footwear
Vehicles
Musical instruments
Miscelaneous manufactured articles
Furskins
Clothing
Tobacco
27
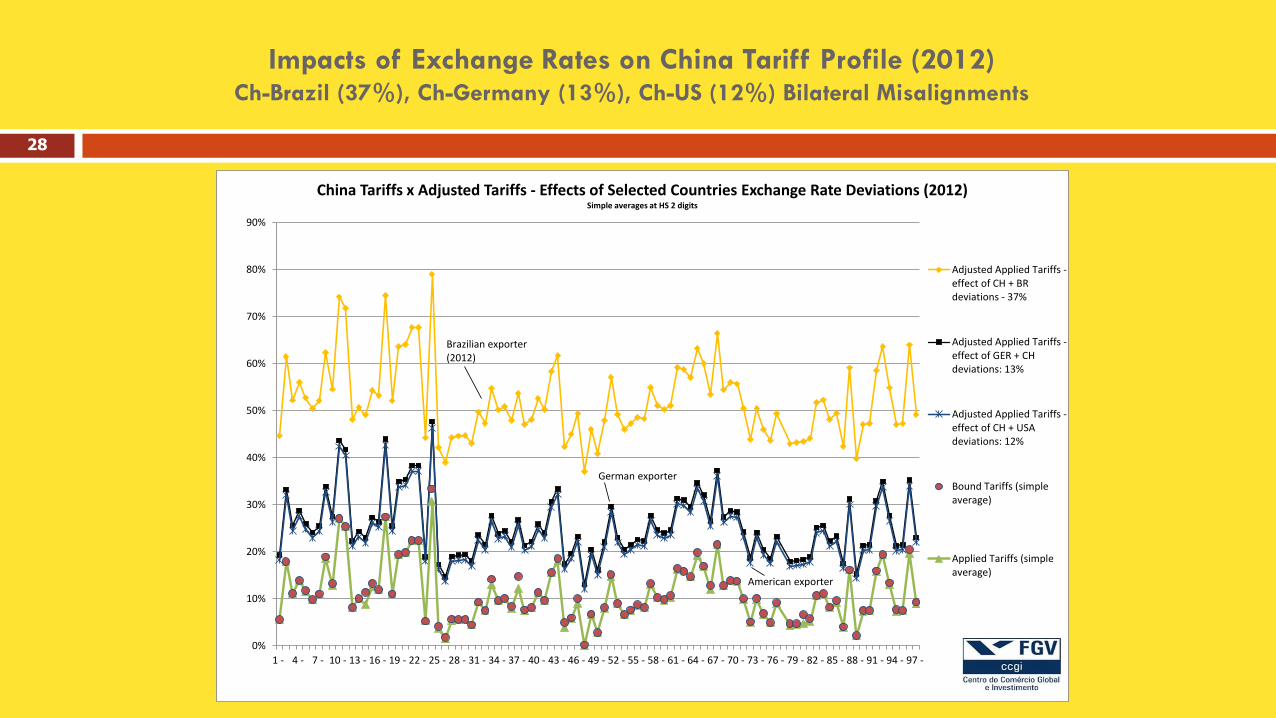
Impacts of Exchange Rates on China Tariff Profile (2012) Ch-Brazil (37%), Ch-Germany (13%), Ch-US (12%) Bilateral Misalignments
0%
10%
20%
30%
40%
50%
60%
70%
80%
90%
1 - 4 - 7 - 10 - 13 - 16 - 19 - 22 - 25 - 28 - 31 - 34 - 37 - 40 - 43 - 46 - 49 - 52 - 55 - 58 - 61 - 64 - 67 - 70 - 73 - 76 - 79 - 82 - 85 - 88 - 91 - 94 - 97 -
China Tariffs x Adjusted Tariffs - Effects of Selected Countries Exchange Rate Deviations (2012) Simple averages at HS 2 digits
Adjusted Applied Tariffs -effect of CH + BRdeviations - 37%
Adjusted Applied Tariffs -effect of GER + CHdeviations: 13%
Adjusted Applied Tariffs -effect of CH + USAdeviations: 12%
Bound Tariffs (simpleaverage)
Applied Tariffs (simpleaverage)
Brazilian exporter (2012)
American exporter
German exporter
28
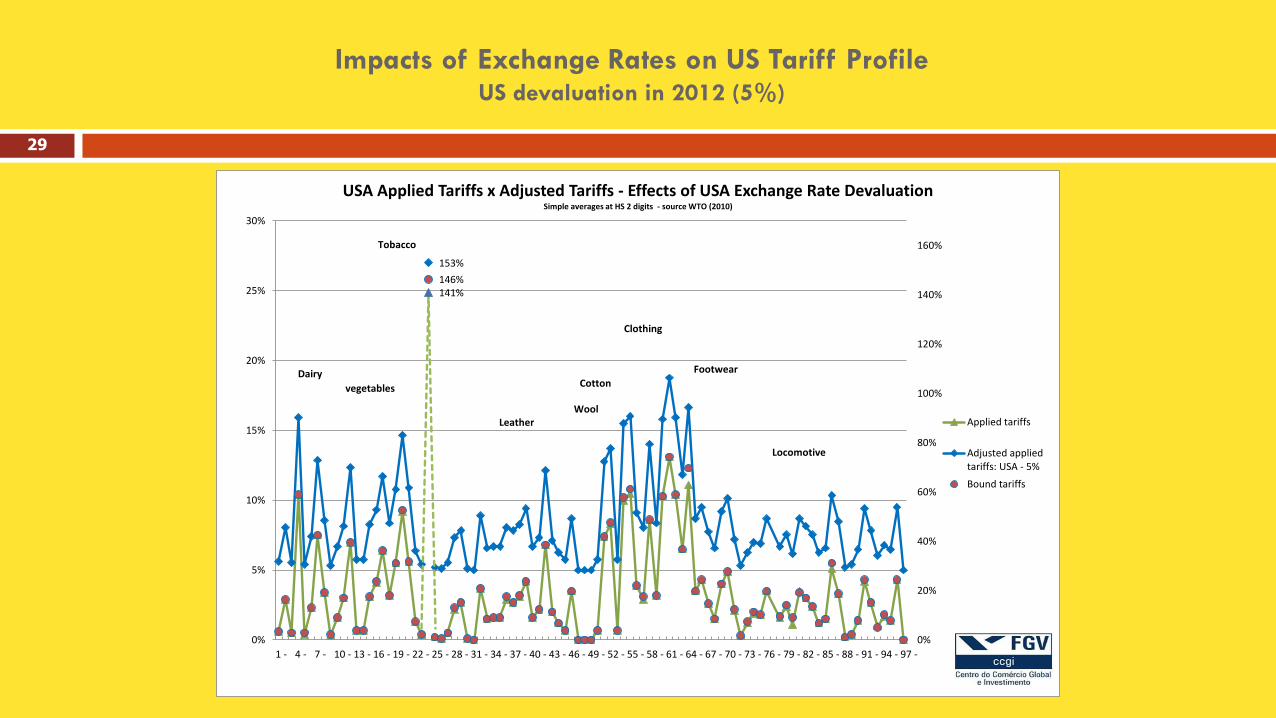
Impacts of Exchange Rates on US Tariff Profile US devaluation in 2012 (5%)
141%
153%
146%
0%
20%
40%
60%
80%
100%
120%
140%
160%
0%
5%
10%
15%
20%
25%
30%
1 - 4 - 7 - 10 - 13 - 16 - 19 - 22 - 25 - 28 - 31 - 34 - 37 - 40 - 43 - 46 - 49 - 52 - 55 - 58 - 61 - 64 - 67 - 70 - 73 - 76 - 79 - 82 - 85 - 88 - 91 - 94 - 97 -
USA Applied Tariffs x Adjusted Tariffs - Effects of USA Exchange Rate Devaluation Simple averages at HS 2 digits - source WTO (2010)
Applied tariffs
Adjusted appliedtariffs: USA - 5%
Bound tariffs
Dairy
Tobacco
vegetables
LeatherWool
Cotton
Clothing
Footwear
Locomotive
29
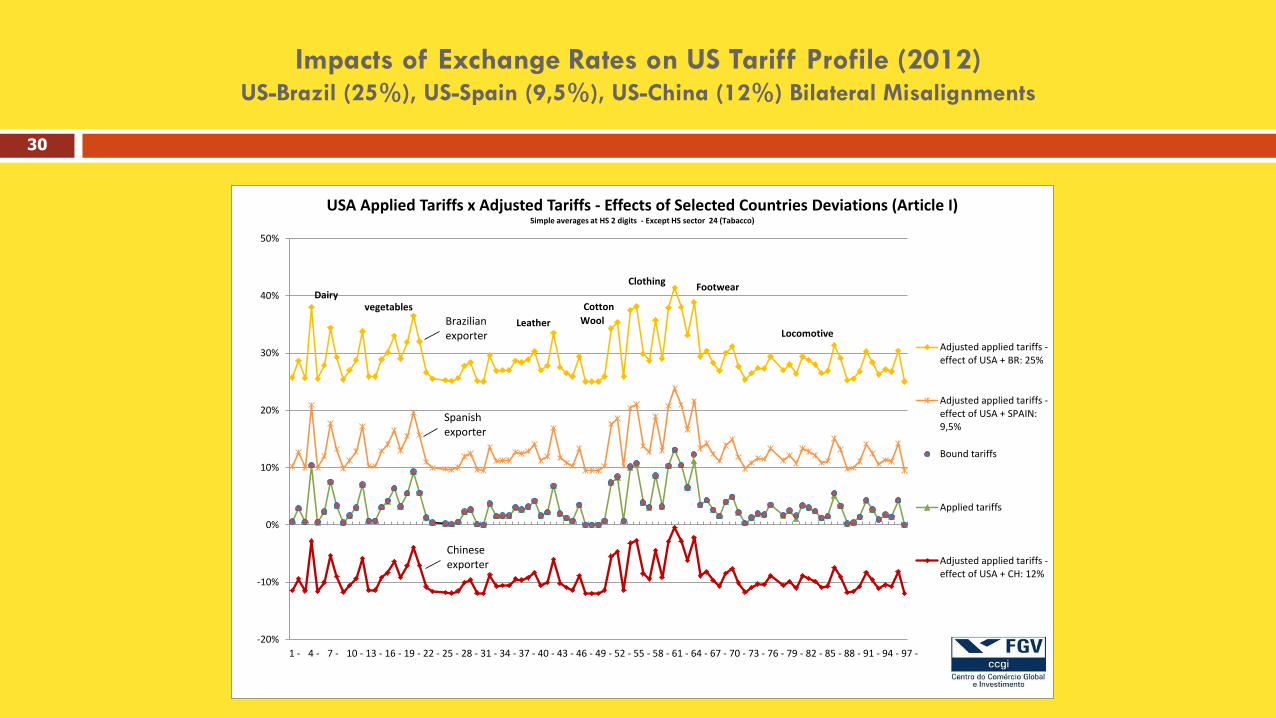
Impacts of Exchange Rates on US Tariff Profile (2012) US-Brazil (25%), US-Spain (9,5%), US-China (12%) Bilateral Misalignments
-20%
-10%
0%
10%
20%
30%
40%
50%
1 - 4 - 7 - 10 - 13 - 16 - 19 - 22 - 25 - 28 - 31 - 34 - 37 - 40 - 43 - 46 - 49 - 52 - 55 - 58 - 61 - 64 - 67 - 70 - 73 - 76 - 79 - 82 - 85 - 88 - 91 - 94 - 97 -
USA Applied Tariffs x Adjusted Tariffs - Effects of Selected Countries Deviations (Article I)Simple averages at HS 2 digits - Except HS sector 24 (Tabacco)
Adjusted applied tariffs -effect of USA + BR: 25%
Adjusted applied tariffs -effect of USA + SPAIN:9,5%
Bound tariffs
Applied tariffs
Adjusted applied tariffs -effect of USA + CH: 12%
Dairy vegetables
Leather Wool
Cotton
ClothingFootwear
LocomotiveBrazilianexporter
Spanishexporter
Chineseexporter
30
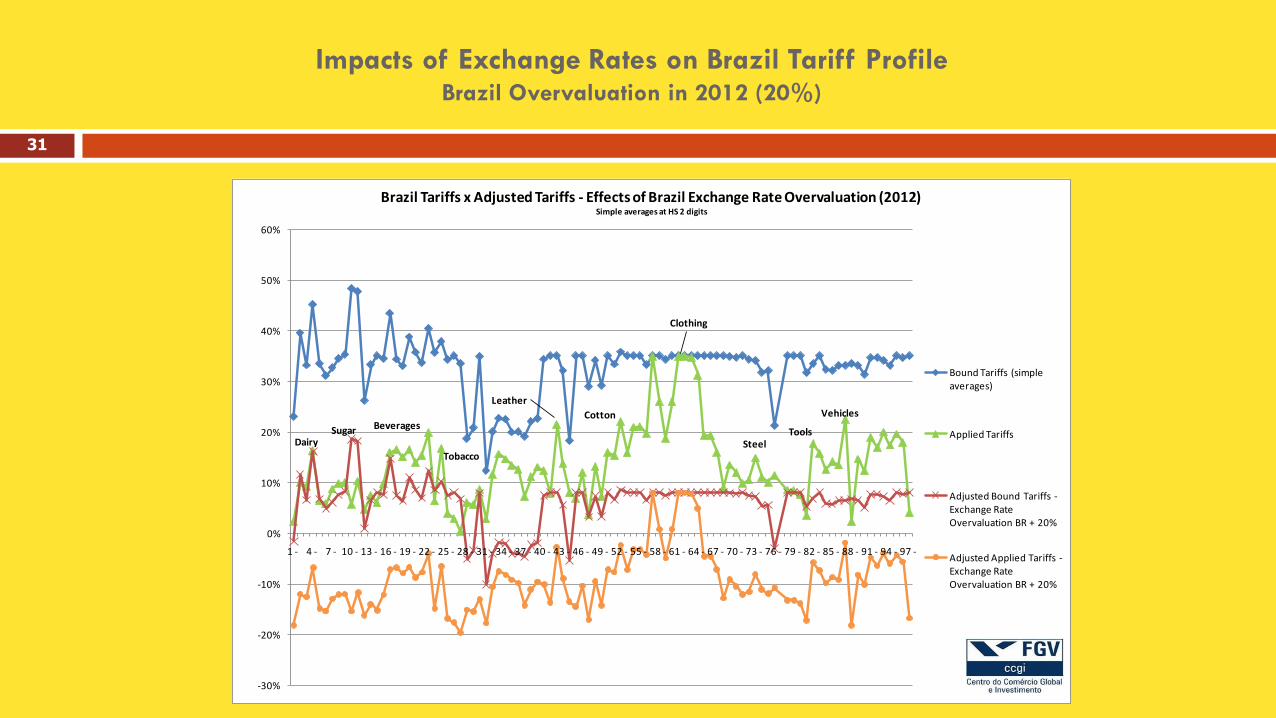
Impacts of Exchange Rates on Brazil Tariff Profile Brazil Overvaluation in 2012 (20%)
-30%
-20%
-10%
0%
10%
20%
30%
40%
50%
60%
1 - 4 - 7 - 10 - 13 - 16 - 19 - 22 - 25 - 28 - 31 - 34 - 37 - 40 - 43 - 46 - 49 - 52 - 55 - 58 - 61 - 64 - 67 - 70 - 73 - 76 - 79 - 82 - 85 - 88 - 91 - 94 - 97 -
Brazil Tariffs x Adjusted Tariffs - Effects of Brazil Exchange Rate Overvaluation (2012) Simple averages at HS 2 digits
Bound Tariffs (simple averages)
Applied Tariffs
Adjusted Bound Tariffs -Exchange Rate Overvaluation BR + 20%
Adjusted Applied Tariffs -Exchange Rate Overvaluation BR + 20%
DairySugar Beverages
Tobacco
Leather
Cotton
Clothing
SteelTools
Vehicles
31
32
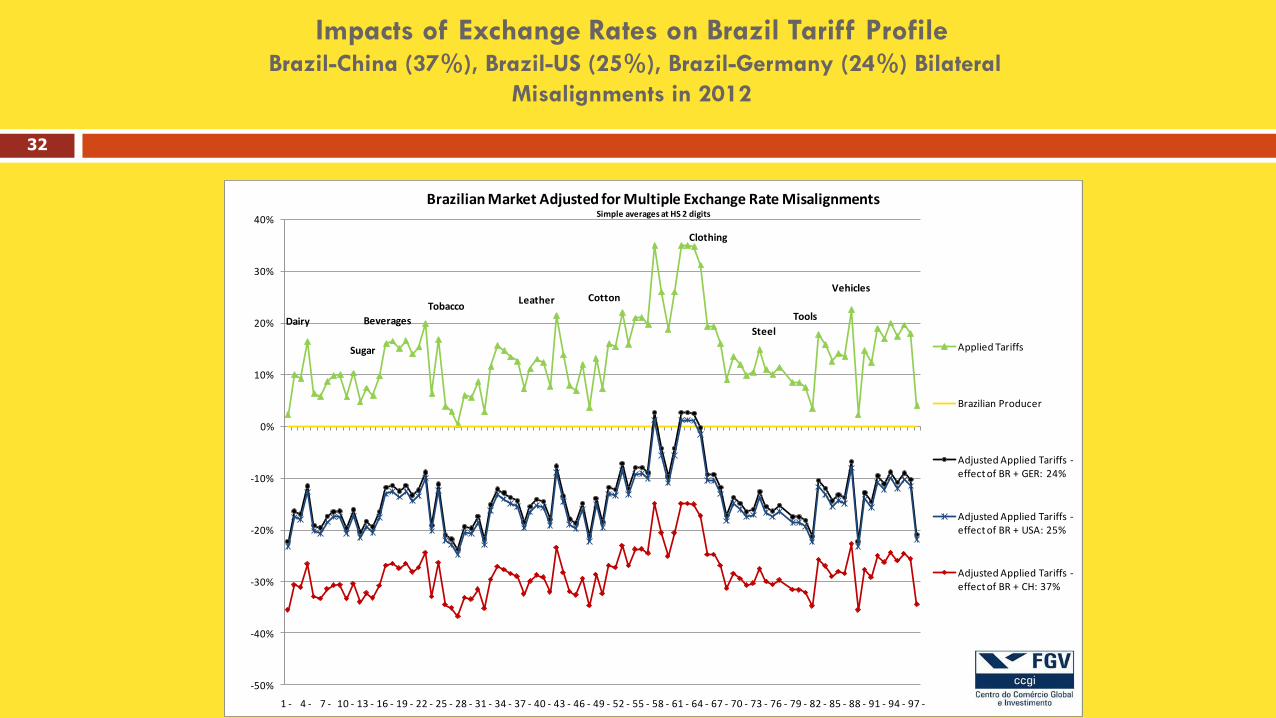
Impacts of Exchange Rates on Brazil Tariff Profile Brazil-China (37%), Brazil-US (25%), Brazil-Germany (24%) Bilateral
Misalignments in 2012
-50%
-40%
-30%
-20%
-10%
0%
10%
20%
30%
40%
1 - 4 - 7 - 10 - 13 - 16 - 19 - 22 - 25 - 28 - 31 - 34 - 37 - 40 - 43 - 46 - 49 - 52 - 55 - 58 - 61 - 64 - 67 - 70 - 73 - 76 - 79 - 82 - 85 - 88 - 91 - 94 - 97 -
Brazilian Market Adjusted for Multiple Exchange Rate Misalignments Simple averages at HS 2 digits
Applied Tariffs
Brazilian Producer
Adjusted Applied Tariffs -effect of BR + GER: 24%
Adjusted Applied Tariffs -effect of BR + USA: 25%
Adjusted Applied Tariffs -effect of BR + CH: 37%
Dairy
Sugar
Beverages
TobaccoLeather Cotton
Clothing
Steel
Tools
Vehicles
33
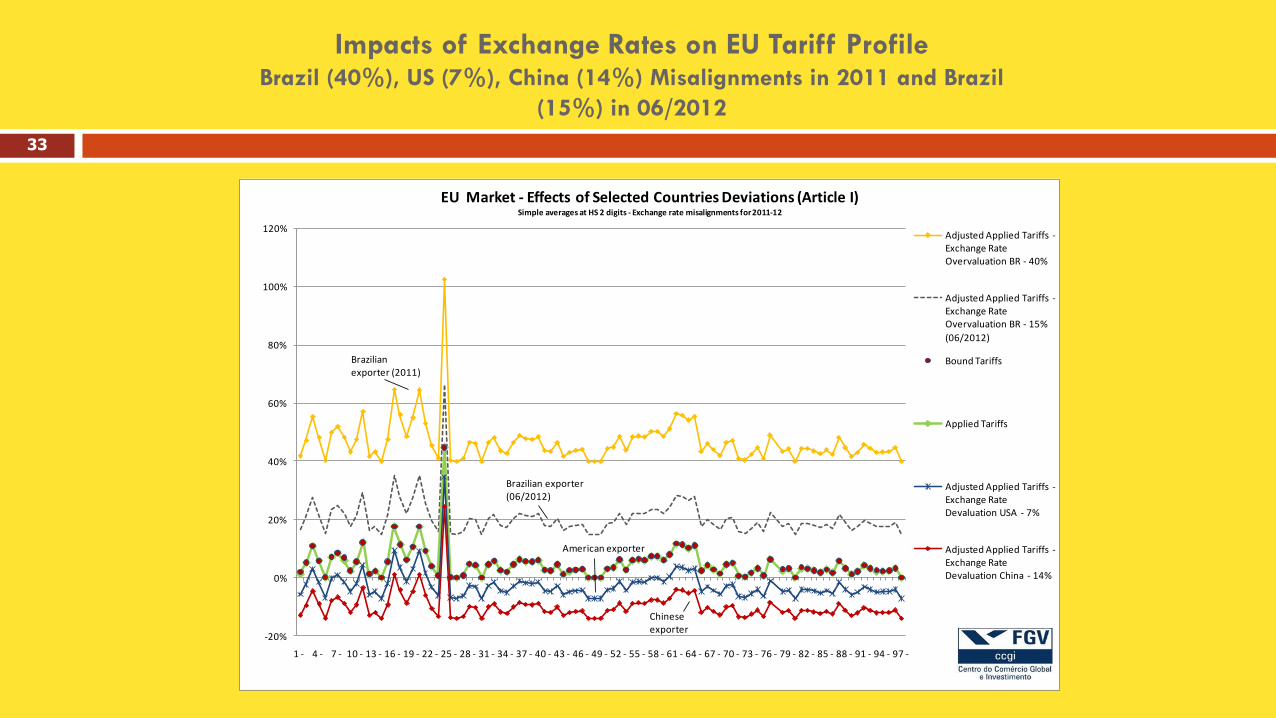
Impacts of Exchange Rates on EU Tariff Profile Brazil (40%), US (7%), China (14%) Misalignments in 2011 and Brazil
(15%) in 06/2012
-20%
0%
20%
40%
60%
80%
100%
120%
1 - 4 - 7 - 10 - 13 - 16 - 19 - 22 - 25 - 28 - 31 - 34 - 37 - 40 - 43 - 46 - 49 - 52 - 55 - 58 - 61 - 64 - 67 - 70 - 73 - 76 - 79 - 82 - 85 - 88 - 91 - 94 - 97 -
EU Market - Effects of Selected Countries Deviations (Article I) Simple averages at HS 2 digits - Exchange rate misalignments for 2011-12
Adjusted Applied Tariffs -Exchange Rate Overvaluation BR - 40%
Adjusted Applied Tariffs -Exchange Rate Overvaluation BR - 15%
(06/2012)
Bound Tariffs
Applied Tariffs
Adjusted Applied Tariffs -Exchange Rate Devaluation USA - 7%
Adjusted Applied Tariffs -Exchange Rate Devaluation China - 14%
Brazilianexporter (2011)
Brazilian exporter (06/2012)
American exporter
Chineseexporter
Conclusions
- Countries with overvalued exchange rates (Brazil) have their negotiated
tariffs reduced or nullified.
- Countries with undervalued exchange rates (USA, China) grant subsidies to
their exports and their applied tariffs surpass the bound levels agreed at the
WTO.
- Substantial and persistent exchange rate misalignments significantly affect
or nullify most WTO rules:
tariffs, antidumping, countervailing measures, safeguards, rules of origin,
regional agreements, DSB retaliations…
- Problem:
the WTO does not have adequate rules to address the exchange rate issue
34
- Create a world currency
- Negotiate a fluctuation band
- Solve the conflict bilaterally
A NEW PROPOSAL
35
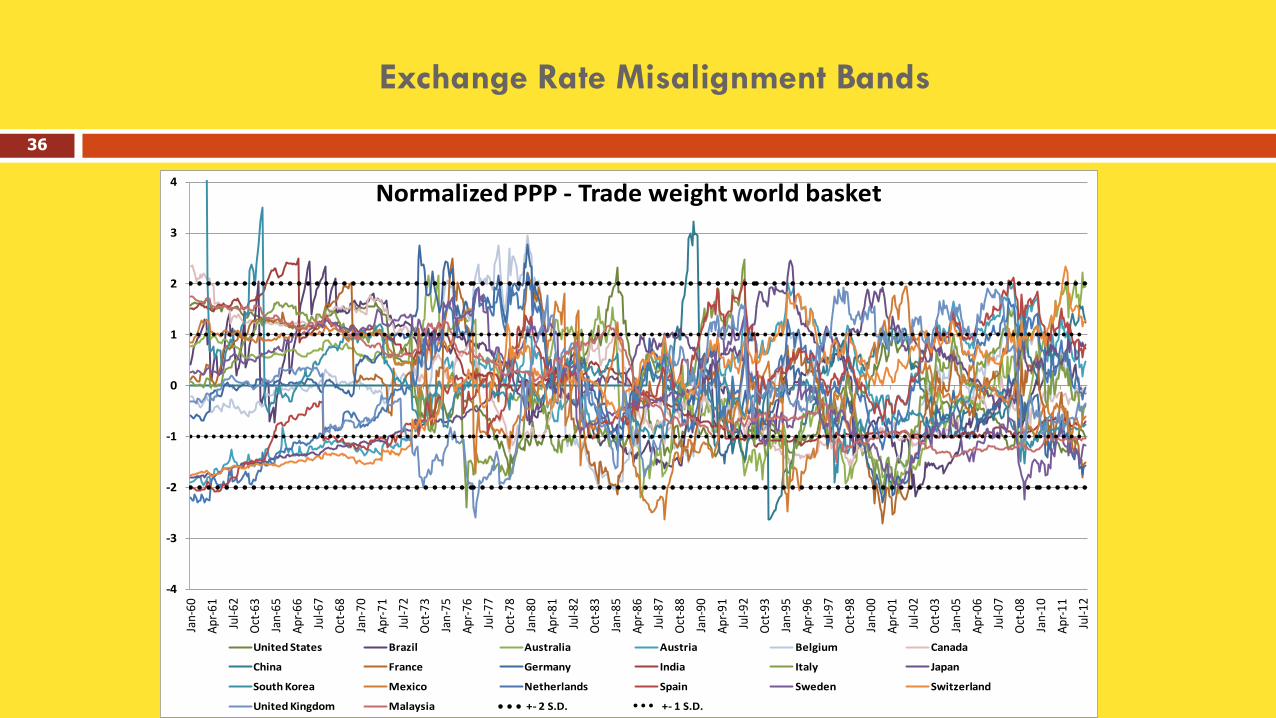
Exchange Rate Misalignment Bands
-4
-3
-2
-1
0
1
2
3
4Ja
n-60
Apr
-61
Jul-6
2
Oct
-63
Jan-
65
Apr
-66
Jul-6
7
Oct
-68
Jan-
70
Apr
-71
Jul-7
2
Oct
-73
Jan-
75
Apr
-76
Jul-7
7
Oct
-78
Jan-
80
Apr
-81
Jul-8
2
Oct
-83
Jan-
85
Apr
-86
Jul-8
7
Oct
-88
Jan-
90
Apr
-91
Jul-9
2
Oct
-93
Jan-
95
Apr
-96
Jul-9
7
Oct
-98
Jan-
00
Apr
-01
Jul-0
2
Oct
-03
Jan-
05
Apr
-06
Jul-0
7
Oct
-08
Jan-
10
Apr
-11
Jul-1
2
Normalized PPP - Trade weight world basket
United States Brazil Australia Austria Belgium Canada
China France Germany India Italy Japan
South Korea Mexico Netherlands Spain Sweden Switzerland
United Kingdom Malaysia +- 2 S.D. +- 1 S.D.
36
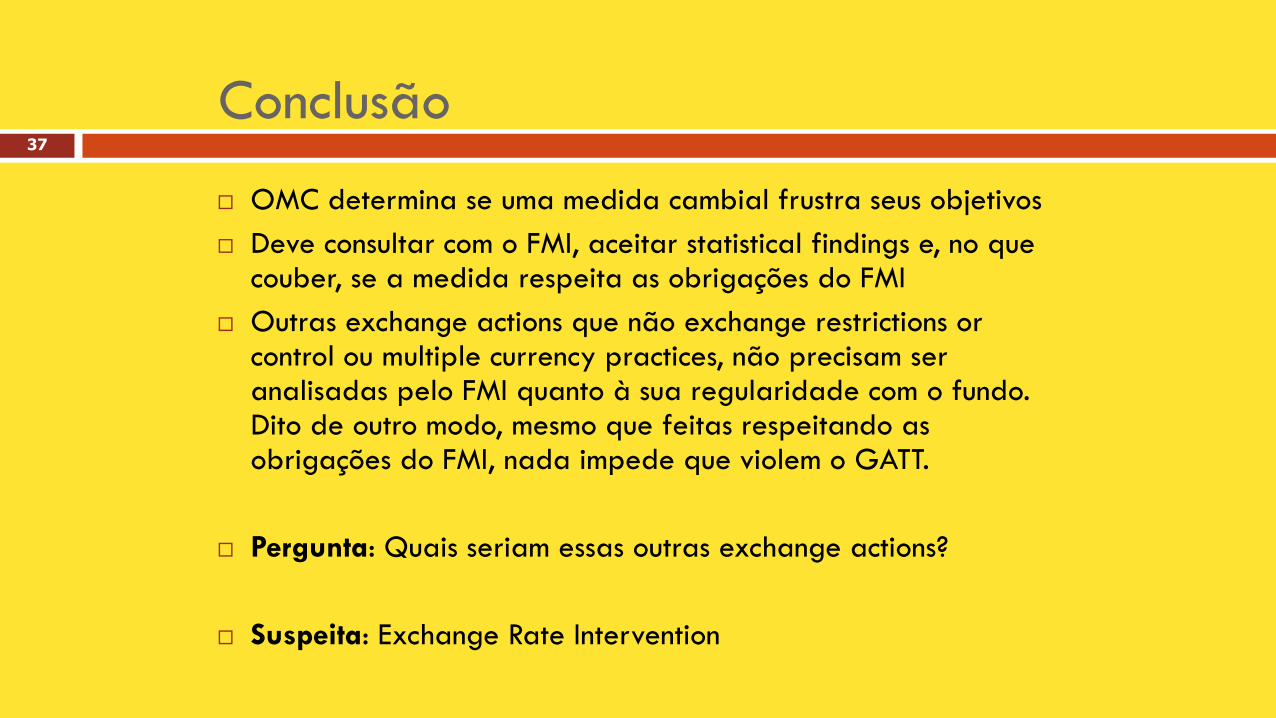
Conclusão
OMC determina se uma medida cambial frustra seus objetivos
Deve consultar com o FMI, aceitar statistical findings e, no que couber, se a medida respeita as obrigações do FMI
Outras exchange actions que não exchange restrictions or control ou multiple currency practices, não precisam ser analisadas pelo FMI quanto à sua regularidade com o fundo. Dito de outro modo, mesmo que feitas respeitando as obrigações do FMI, nada impede que violem o GATT.
Pergunta: Quais seriam essas outras exchange actions?
Suspeita: Exchange Rate Intervention
37
Brazil and new PTAs Which one:
US, EU, Ch, Ind, Can, Mex, … or
only SA? Results of the Simulations
Prof. Vera Thorstensen e Prof. Lucas Ferraz
Center on Global Trade
EESP/FGV
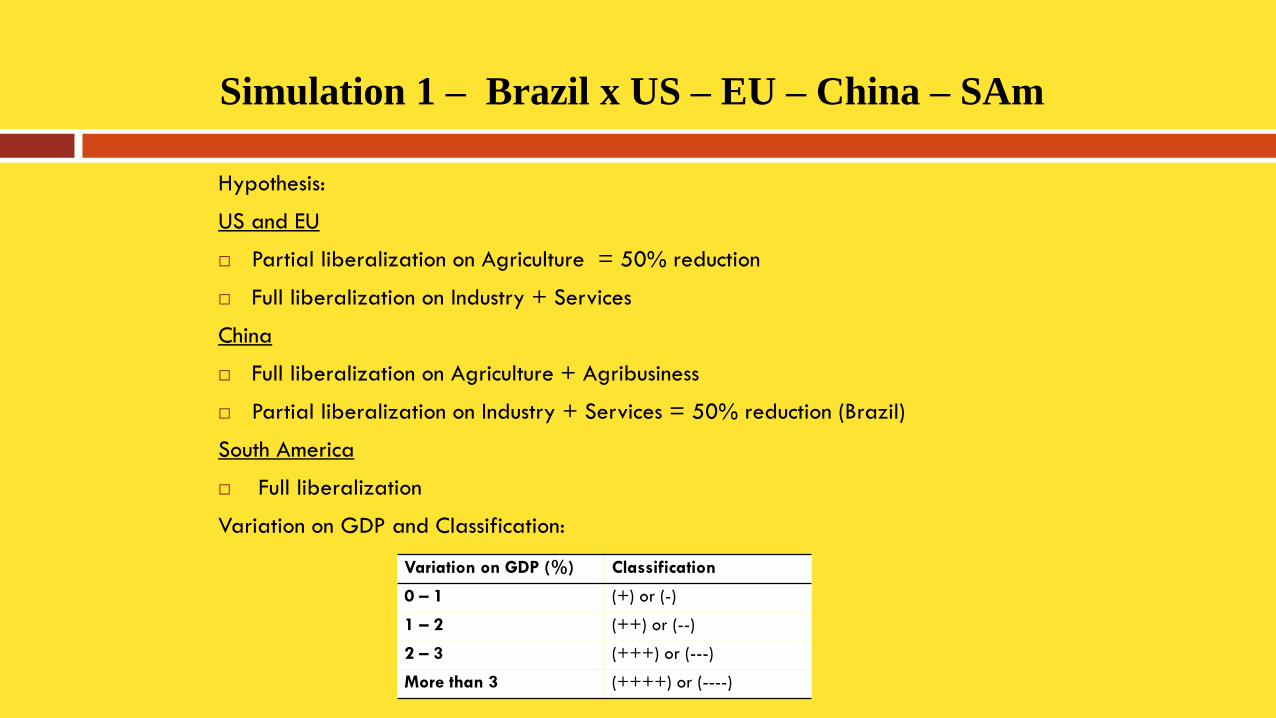
Simulation 1 – Brazil x US – EU – China – SAm
Hypothesis:
US and EU
Partial liberalization on Agriculture = 50% reduction
Full liberalization on Industry + Services
China
Full liberalization on Agriculture + Agribusiness
Partial liberalization on Industry + Services = 50% reduction (Brazil)
South America
Full liberalization
Variation on GDP and Classification:
Variation on GDP (%) Classification
0 – 1 (+) or (-)
1 – 2 (++) or (--)
2 – 3 (+++) or (---)
More than 3 (++++) or (----)
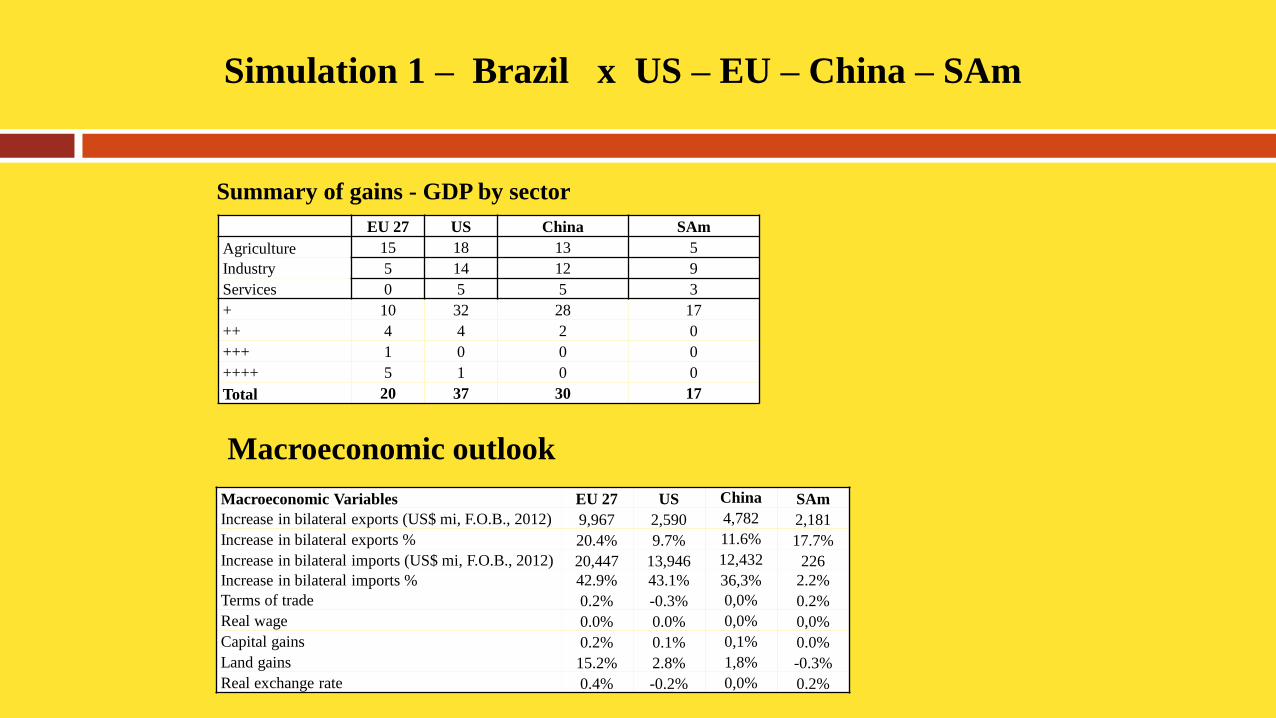
Simulation 1 – Brazil x US – EU – China – SAm
Summary of gains - GDP by sector
EU 27 US China SAm
Agriculture 15 18 13 5
Industry 5 14 12 9
Services 0 5 5 3
+ 10 32 28 17
++ 4 4 2 0
+++ 1 0 0 0
++++ 5 1 0 0
Total 20 37 30 17
Macroeconomic outlook
Macroeconomic Variables EU 27 US China SAm
Increase in bilateral exports (US$ mi, F.O.B., 2012) 9,967 2,590 4,782 2,181
Increase in bilateral exports % 20.4% 9.7% 11.6% 17.7%
Increase in bilateral imports (US$ mi, F.O.B., 2012) 20,447 13,946 12,432 226
Increase in bilateral imports % 42.9% 43.1% 36,3% 2.2%
Terms of trade 0.2% -0.3% 0,0% 0.2%
Real wage 0.0% 0.0% 0,0% 0,0%
Capital gains 0.2% 0.1% 0,1% 0.0%
Land gains 15.2% 2.8% 1,8% -0.3%
Real exchange rate 0.4% -0.2% 0,0% 0.2%
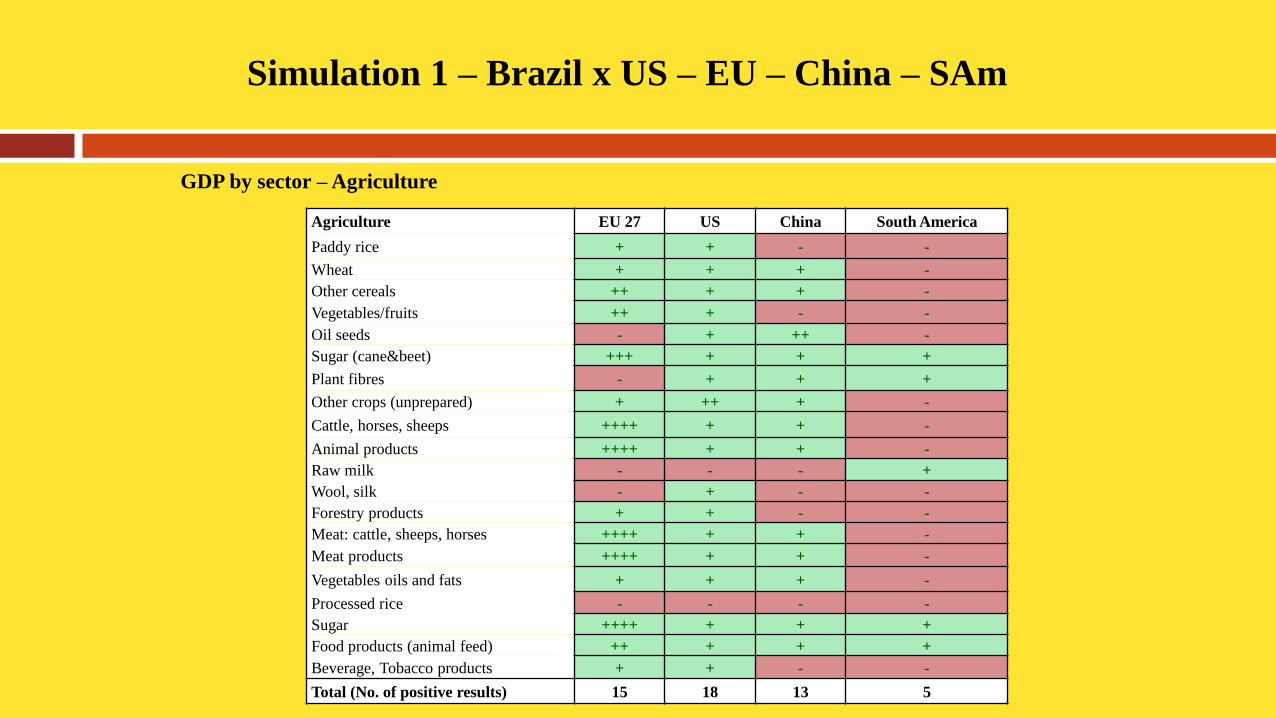
Simulation 1 – Brazil x US – EU – China – SAm
GDP by sector – Agriculture
Agriculture EU 27 US China South America
Paddy rice + + - -
Wheat + + + -
Other cereals ++ + + -
Vegetables/fruits ++ + - -
Oil seeds - + ++ -
Sugar (cane&beet) +++ + + +
Plant fibres - + + +
Other crops (unprepared) + ++ + -
Cattle, horses, sheeps ++++ + + -
Animal products ++++ + + -
Raw milk - - - +
Wool, silk - + - -
Forestry products + + - -
Meat: cattle, sheeps, horses ++++ + + -
Meat products ++++ + + -
Vegetables oils and fats + + + -
Processed rice - - - -
Sugar ++++ + + +
Food products (animal feed) ++ + + +
Beverage, Tobacco products + + - -
Total (No. of positive results) 15 18 13 5
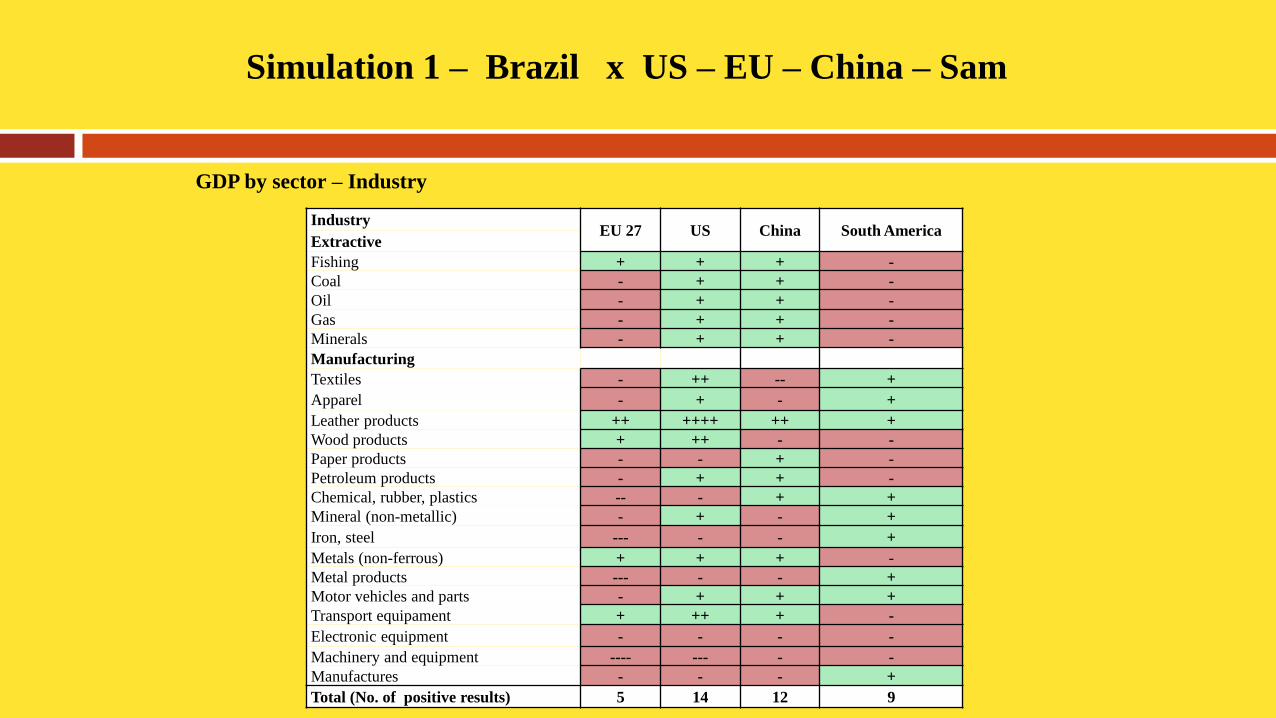
Simulation 1 – Brazil x US – EU – China – Sam
GDP by sector – Industry
Industry EU 27 US China South America
Extractive
Fishing + + + -
Coal - + + -
Oil - + + -
Gas - + + -
Minerals - + + -
Manufacturing
Textiles - ++ -- +
Apparel - + - +
Leather products ++ ++++ ++ +
Wood products + ++ - -
Paper products - - + -
Petroleum products - + + -
Chemical, rubber, plastics -- - + +
Mineral (non-metallic) - + - +
Iron, steel --- - - +
Metals (non-ferrous) + + + -
Metal products --- - - +
Motor vehicles and parts - + + +
Transport equipament + ++ + -
Electronic equipment - - - -
Machinery and equipment ---- --- - -
Manufactures - - - +
Total (No. of positive results) 5 14 12 9
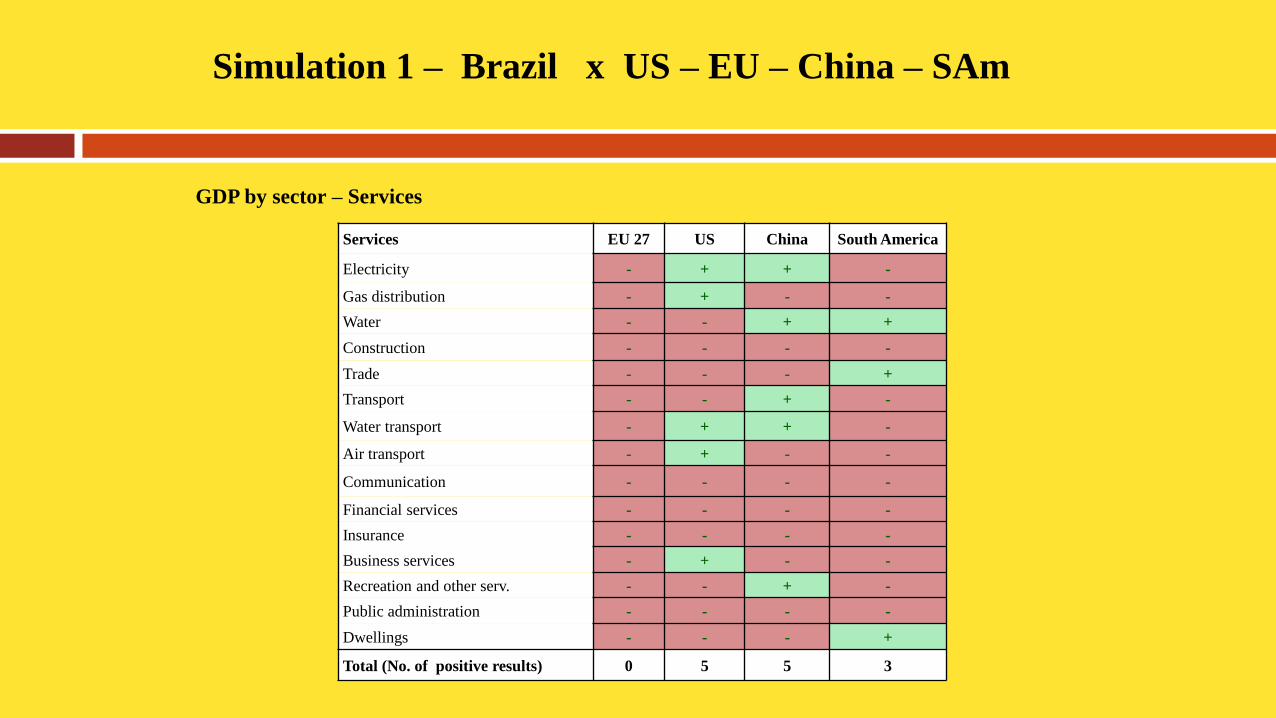
Simulation 1 – Brazil x US – EU – China – SAm
GDP by sector – Services
Services EU 27 US China South America
Electricity - + + -
Gas distribution - + - -
Water - - + +
Construction - - - -
Trade - - - +
Transport - - + -
Water transport - + + -
Air transport - + - -
Communication - - - -
Financial services - - - -
Insurance - - - -
Business services - + - -
Recreation and other serv. - - + -
Public administration - - - -
Dwellings - - - +
Total (No. of positive results) 0 5 5 3
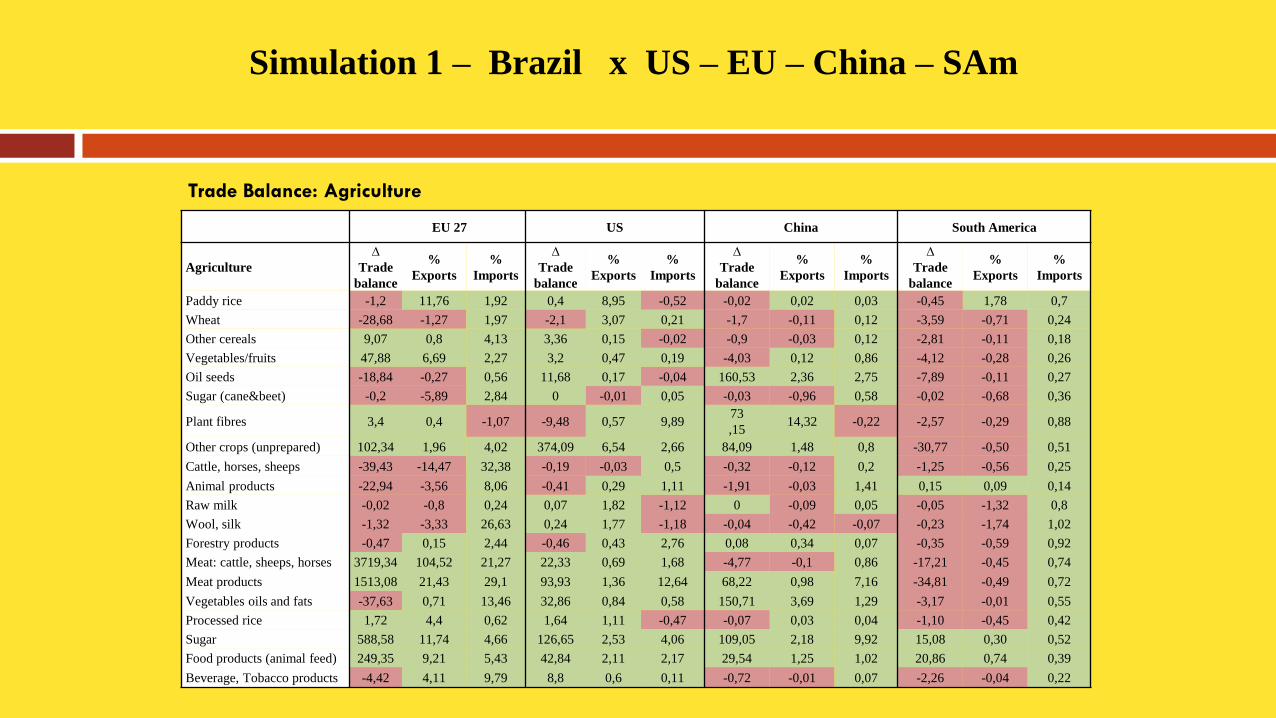
Simulation 1 – Brazil x US – EU – China – SAm
EU 27 US China South America
Agriculture
∆
Trade
balance
%
Exports
%
Imports
∆
Trade
balance
%
Exports
%
Imports
∆
Trade
balance
%
Exports
%
Imports
∆
Trade
balance
%
Exports
%
Imports
Paddy rice -1,2 11,76 1,92 0,4 8,95 -0,52 -0,02 0,02 0,03 -0,45 1,78 0,7
Wheat -28,68 -1,27 1,97 -2,1 3,07 0,21 -1,7 -0,11 0,12 -3,59 -0,71 0,24
Other cereals 9,07 0,8 4,13 3,36 0,15 -0,02 -0,9 -0,03 0,12 -2,81 -0,11 0,18
Vegetables/fruits 47,88 6,69 2,27 3,2 0,47 0,19 -4,03 0,12 0,86 -4,12 -0,28 0,26
Oil seeds -18,84 -0,27 0,56 11,68 0,17 -0,04 160,53 2,36 2,75 -7,89 -0,11 0,27
Sugar (cane&beet) -0,2 -5,89 2,84 0 -0,01 0,05 -0,03 -0,96 0,58 -0,02 -0,68 0,36
Plant fibres 3,4 0,4 -1,07 -9,48 0,57 9,89 73
,15 14,32 -0,22 -2,57 -0,29 0,88
Other crops (unprepared) 102,34 1,96 4,02 374,09 6,54 2,66 84,09 1,48 0,8 -30,77 -0,50 0,51
Cattle, horses, sheeps -39,43 -14,47 32,38 -0,19 -0,03 0,5 -0,32 -0,12 0,2 -1,25 -0,56 0,25
Animal products -22,94 -3,56 8,06 -0,41 0,29 1,11 -1,91 -0,03 1,41 0,15 0,09 0,14
Raw milk -0,02 -0,8 0,24 0,07 1,82 -1,12 0 -0,09 0,05 -0,05 -1,32 0,8
Wool, silk -1,32 -3,33 26,63 0,24 1,77 -1,18 -0,04 -0,42 -0,07 -0,23 -1,74 1,02
Forestry products -0,47 0,15 2,44 -0,46 0,43 2,76 0,08 0,34 0,07 -0,35 -0,59 0,92
Meat: cattle, sheeps, horses 3719,34 104,52 21,27 22,33 0,69 1,68 -4,77 -0,1 0,86 -17,21 -0,45 0,74
Meat products 1513,08 21,43 29,1 93,93 1,36 12,64 68,22 0,98 7,16 -34,81 -0,49 0,72
Vegetables oils and fats -37,63 0,71 13,46 32,86 0,84 0,58 150,71 3,69 1,29 -3,17 -0,01 0,55
Processed rice 1,72 4,4 0,62 1,64 1,11 -0,47 -0,07 0,03 0,04 -1,10 -0,45 0,42
Sugar 588,58 11,74 4,66 126,65 2,53 4,06 109,05 2,18 9,92 15,08 0,30 0,52
Food products (animal feed) 249,35 9,21 5,43 42,84 2,11 2,17 29,54 1,25 1,02 20,86 0,74 0,39
Beverage, Tobacco products -4,42 4,11 9,79 8,8 0,6 0,11 -0,72 -0,01 0,07 -2,26 -0,04 0,22
Trade Balance: Agriculture
Simulation 1 – Brazil x US – EU – China – SAm
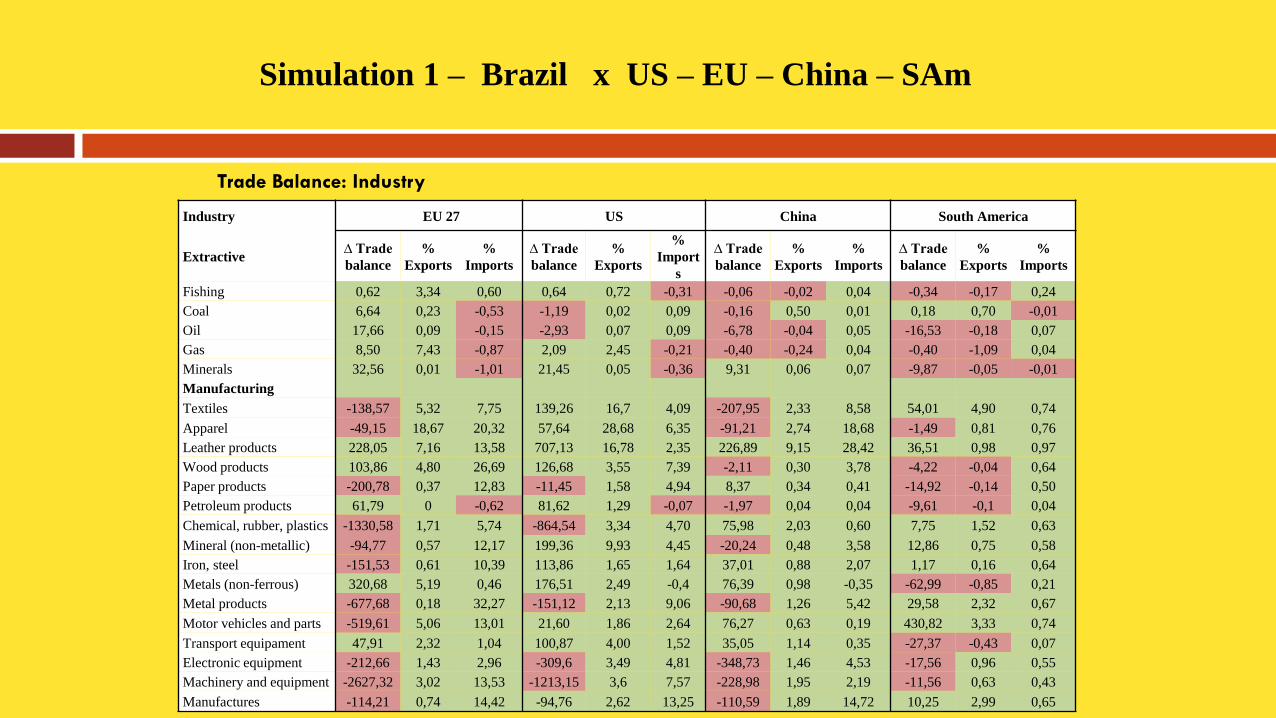
Trade Balance: Industry
Industry EU 27 US China South America
Extractive ∆ Trade
balance
%
Exports
%
Imports
∆ Trade
balance
%
Exports
%
Import
s
∆ Trade
balance
%
Exports
%
Imports
∆ Trade
balance
%
Exports
%
Imports
Fishing 0,62 3,34 0,60 0,64 0,72 -0,31 -0,06 -0,02 0,04 -0,34 -0,17 0,24
Coal 6,64 0,23 -0,53 -1,19 0,02 0,09 -0,16 0,50 0,01 0,18 0,70 -0,01
Oil 17,66 0,09 -0,15 -2,93 0,07 0,09 -6,78 -0,04 0,05 -16,53 -0,18 0,07
Gas 8,50 7,43 -0,87 2,09 2,45 -0,21 -0,40 -0,24 0,04 -0,40 -1,09 0,04
Minerals 32,56 0,01 -1,01 21,45 0,05 -0,36 9,31 0,06 0,07 -9,87 -0,05 -0,01
Manufacturing
Textiles -138,57 5,32 7,75 139,26 16,7 4,09 -207,95 2,33 8,58 54,01 4,90 0,74
Apparel -49,15 18,67 20,32 57,64 28,68 6,35 -91,21 2,74 18,68 -1,49 0,81 0,76
Leather products 228,05 7,16 13,58 707,13 16,78 2,35 226,89 9,15 28,42 36,51 0,98 0,97
Wood products 103,86 4,80 26,69 126,68 3,55 7,39 -2,11 0,30 3,78 -4,22 -0,04 0,64
Paper products -200,78 0,37 12,83 -11,45 1,58 4,94 8,37 0,34 0,41 -14,92 -0,14 0,50
Petroleum products 61,79 0 -0,62 81,62 1,29 -0,07 -1,97 0,04 0,04 -9,61 -0,1 0,04
Chemical, rubber, plastics -1330,58 1,71 5,74 -864,54 3,34 4,70 75,98 2,03 0,60 7,75 1,52 0,63
Mineral (non-metallic) -94,77 0,57 12,17 199,36 9,93 4,45 -20,24 0,48 3,58 12,86 0,75 0,58
Iron, steel -151,53 0,61 10,39 113,86 1,65 1,64 37,01 0,88 2,07 1,17 0,16 0,64
Metals (non-ferrous) 320,68 5,19 0,46 176,51 2,49 -0,4 76,39 0,98 -0,35 -62,99 -0,85 0,21
Metal products -677,68 0,18 32,27 -151,12 2,13 9,06 -90,68 1,26 5,42 29,58 2,32 0,67
Motor vehicles and parts -519,61 5,06 13,01 21,60 1,86 2,64 76,27 0,63 0,19 430,82 3,33 0,74
Transport equipament 47,91 2,32 1,04 100,87 4,00 1,52 35,05 1,14 0,35 -27,37 -0,43 0,07
Electronic equipment -212,66 1,43 2,96 -309,6 3,49 4,81 -348,73 1,46 4,53 -17,56 0,96 0,55
Machinery and equipment -2627,32 3,02 13,53 -1213,15 3,6 7,57 -228,98 1,95 2,19 -11,56 0,63 0,43
Manufactures -114,21 0,74 14,42 -94,76 2,62 13,25 -110,59 1,89 14,72 10,25 2,99 0,65
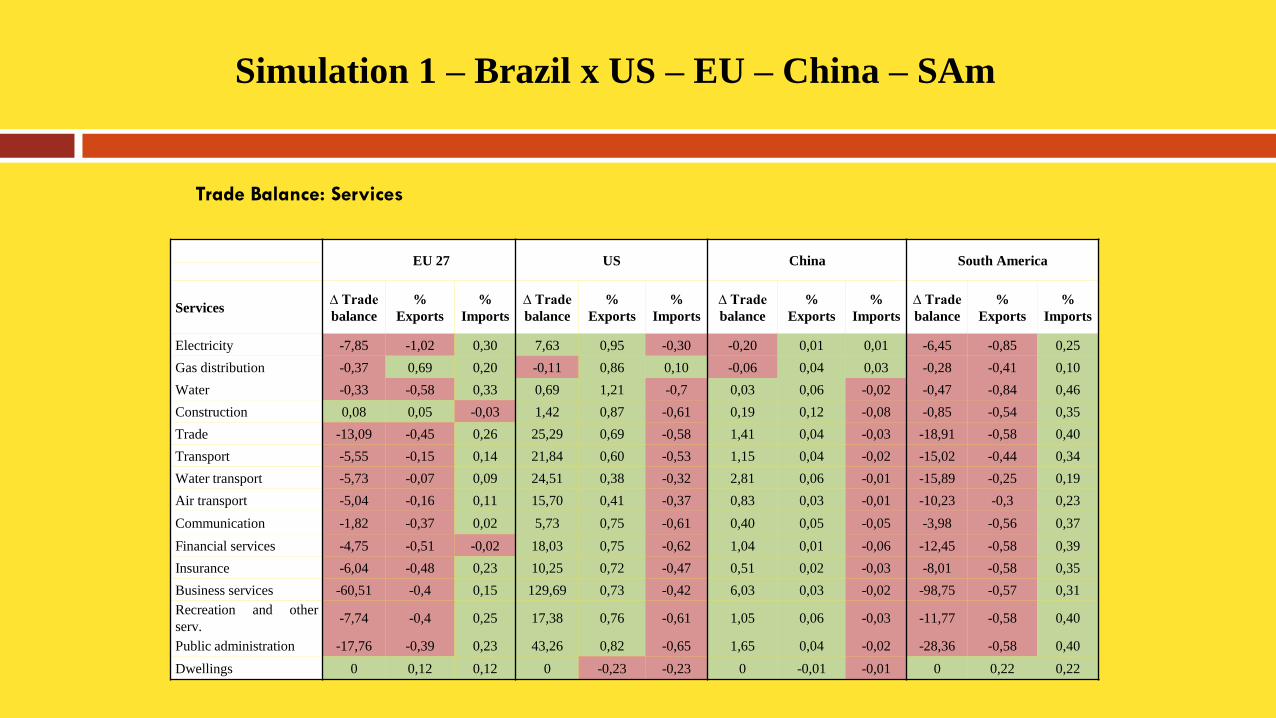
Simulation 1 – Brazil x US – EU – China – SAm
EU 27 US China South America
Services ∆ Trade
balance
%
Exports
%
Imports
∆ Trade
balance
%
Exports
%
Imports
∆ Trade
balance
%
Exports
%
Imports
∆ Trade
balance
%
Exports
%
Imports
Electricity -7,85 -1,02 0,30 7,63 0,95 -0,30 -0,20 0,01 0,01 -6,45 -0,85 0,25
Gas distribution -0,37 0,69 0,20 -0,11 0,86 0,10 -0,06 0,04 0,03 -0,28 -0,41 0,10
Water -0,33 -0,58 0,33 0,69 1,21 -0,7 0,03 0,06 -0,02 -0,47 -0,84 0,46
Construction 0,08 0,05 -0,03 1,42 0,87 -0,61 0,19 0,12 -0,08 -0,85 -0,54 0,35
Trade -13,09 -0,45 0,26 25,29 0,69 -0,58 1,41 0,04 -0,03 -18,91 -0,58 0,40
Transport -5,55 -0,15 0,14 21,84 0,60 -0,53 1,15 0,04 -0,02 -15,02 -0,44 0,34
Water transport -5,73 -0,07 0,09 24,51 0,38 -0,32 2,81 0,06 -0,01 -15,89 -0,25 0,19
Air transport -5,04 -0,16 0,11 15,70 0,41 -0,37 0,83 0,03 -0,01 -10,23 -0,3 0,23
Communication -1,82 -0,37 0,02 5,73 0,75 -0,61 0,40 0,05 -0,05 -3,98 -0,56 0,37
Financial services -4,75 -0,51 -0,02 18,03 0,75 -0,62 1,04 0,01 -0,06 -12,45 -0,58 0,39
Insurance -6,04 -0,48 0,23 10,25 0,72 -0,47 0,51 0,02 -0,03 -8,01 -0,58 0,35
Business services -60,51 -0,4 0,15 129,69 0,73 -0,42 6,03 0,03 -0,02 -98,75 -0,57 0,31
Recreation and other
serv. -7,74 -0,4 0,25 17,38 0,76 -0,61 1,05 0,06 -0,03 -11,77 -0,58 0,40
Public administration -17,76 -0,39 0,23 43,26 0,82 -0,65 1,65 0,04 -0,02 -28,36 -0,58 0,40
Dwellings 0 0,12 0,12 0 -0,23 -0,23 0 -0,01 -0,01 0 0,22 0,22
Trade Balance: Services
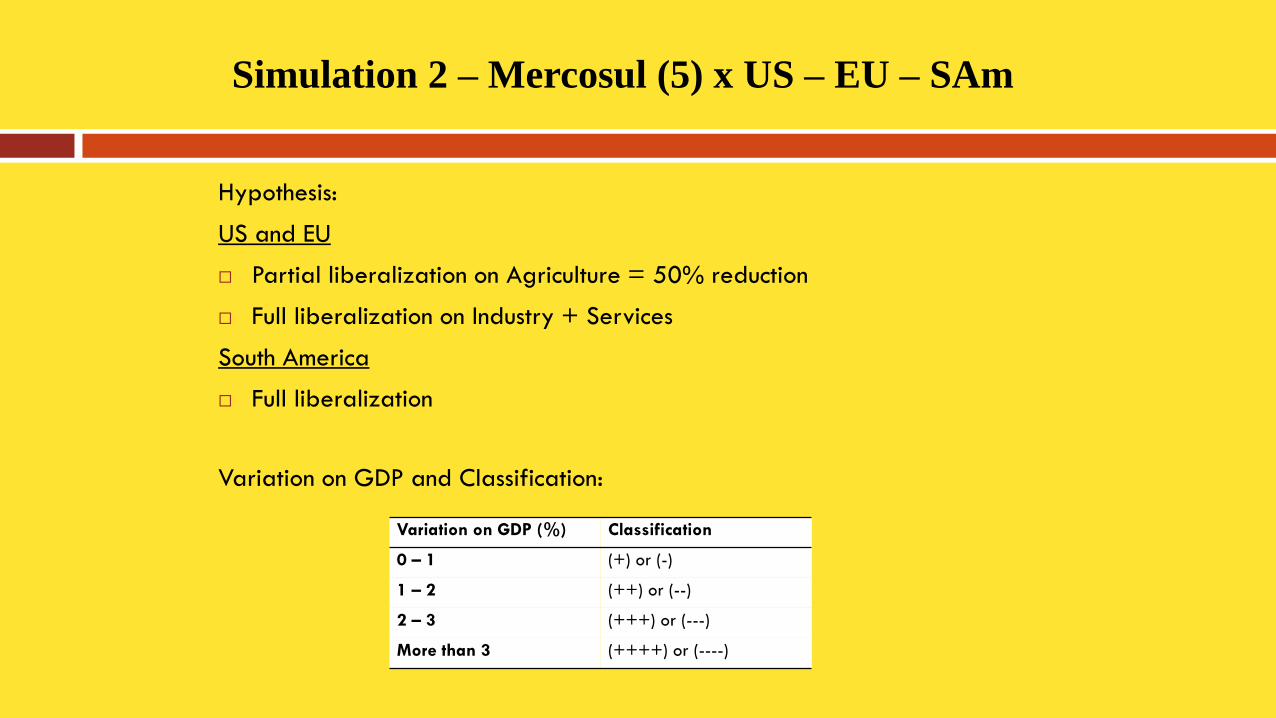
Simulation 2 – Mercosul (5) x US – EU – SAm
Hypothesis:
US and EU
Partial liberalization on Agriculture = 50% reduction
Full liberalization on Industry + Services
South America
Full liberalization
Variation on GDP and Classification:
Variation on GDP (%) Classification
0 – 1 (+) or (-)
1 – 2 (++) or (--)
2 – 3 (+++) or (---)
More than 3 (++++) or (----)
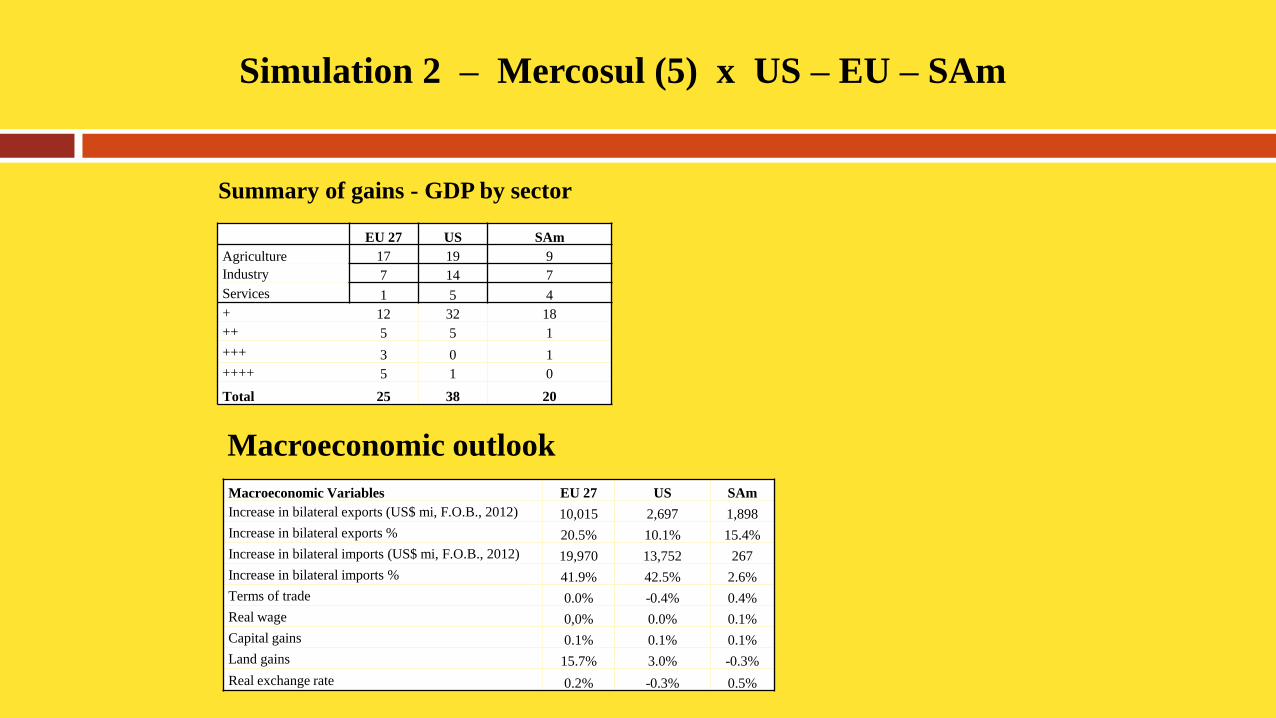
Simulation 2 – Mercosul (5) x US – EU – SAm
Summary of gains - GDP by sector
Macroeconomic outlook
EU 27 US SAm
Agriculture 17 19 9
Industry 7 14 7
Services 1 5 4
+ 12 32 18
++ 5 5 1
+++ 3 0 1
++++ 5 1 0
Total 25 38 20
Macroeconomic Variables EU 27 US SAm
Increase in bilateral exports (US$ mi, F.O.B., 2012) 10,015 2,697 1,898
Increase in bilateral exports % 20.5% 10.1% 15.4%
Increase in bilateral imports (US$ mi, F.O.B., 2012) 19,970 13,752 267
Increase in bilateral imports % 41.9% 42.5% 2.6%
Terms of trade 0.0% -0.4% 0.4%
Real wage 0,0% 0.0% 0.1%
Capital gains 0.1% 0.1% 0.1%
Land gains 15.7% 3.0% -0.3%
Real exchange rate 0.2% -0.3% 0.5%
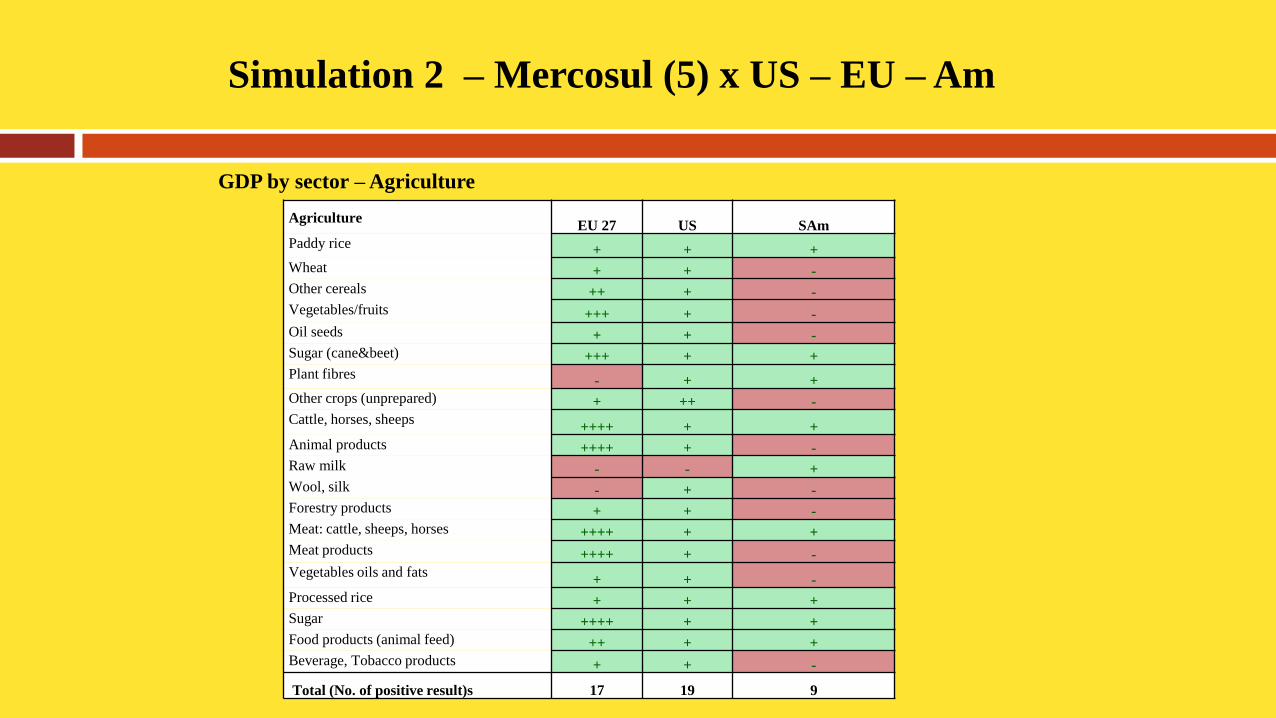
Simulation 2 – Mercosul (5) x US – EU – Am
GDP by sector – Agriculture
Agriculture EU 27 US SAm
Paddy rice + + +
Wheat + + -
Other cereals ++ + -
Vegetables/fruits +++ + -
Oil seeds + + -
Sugar (cane&beet) +++ + +
Plant fibres - + +
Other crops (unprepared) + ++ -
Cattle, horses, sheeps ++++ + +
Animal products ++++ + -
Raw milk - - +
Wool, silk - + -
Forestry products + + -
Meat: cattle, sheeps, horses ++++ + +
Meat products ++++ + -
Vegetables oils and fats + + -
Processed rice + + +
Sugar ++++ + +
Food products (animal feed) ++ + +
Beverage, Tobacco products + + -
Total (No. of positive result)s 17 19 9
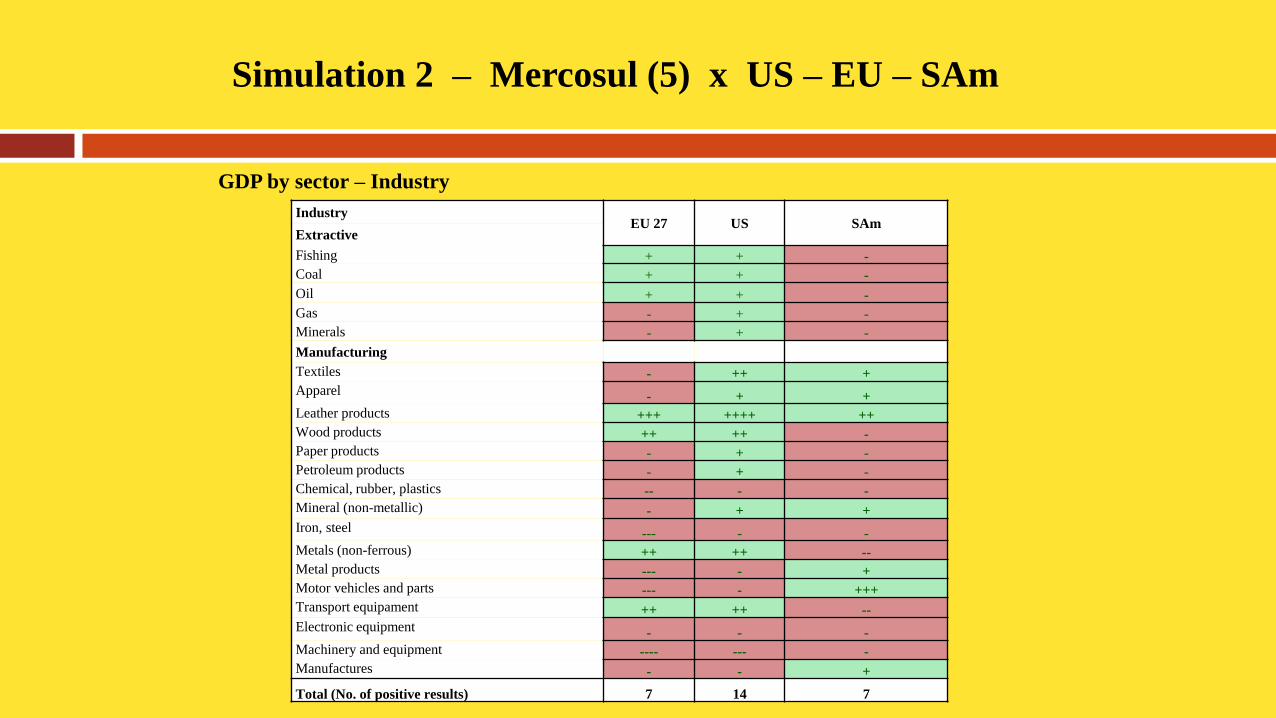
Simulation 2 – Mercosul (5) x US – EU – SAm
GDP by sector – Industry
Industry EU 27 US SAm
Extractive
Fishing + + -
Coal + + -
Oil + + -
Gas - + -
Minerals - + -
Manufacturing
Textiles - ++ +
Apparel - + +
Leather products +++ ++++ ++
Wood products ++ ++ -
Paper products - + -
Petroleum products - + -
Chemical, rubber, plastics -- - -
Mineral (non-metallic) - + +
Iron, steel --- - -
Metals (non-ferrous) ++ ++ --
Metal products --- - +
Motor vehicles and parts --- - +++
Transport equipament ++ ++ --
Electronic equipment - - -
Machinery and equipment ---- --- -
Manufactures - - +
Total (No. of positive results) 7 14 7
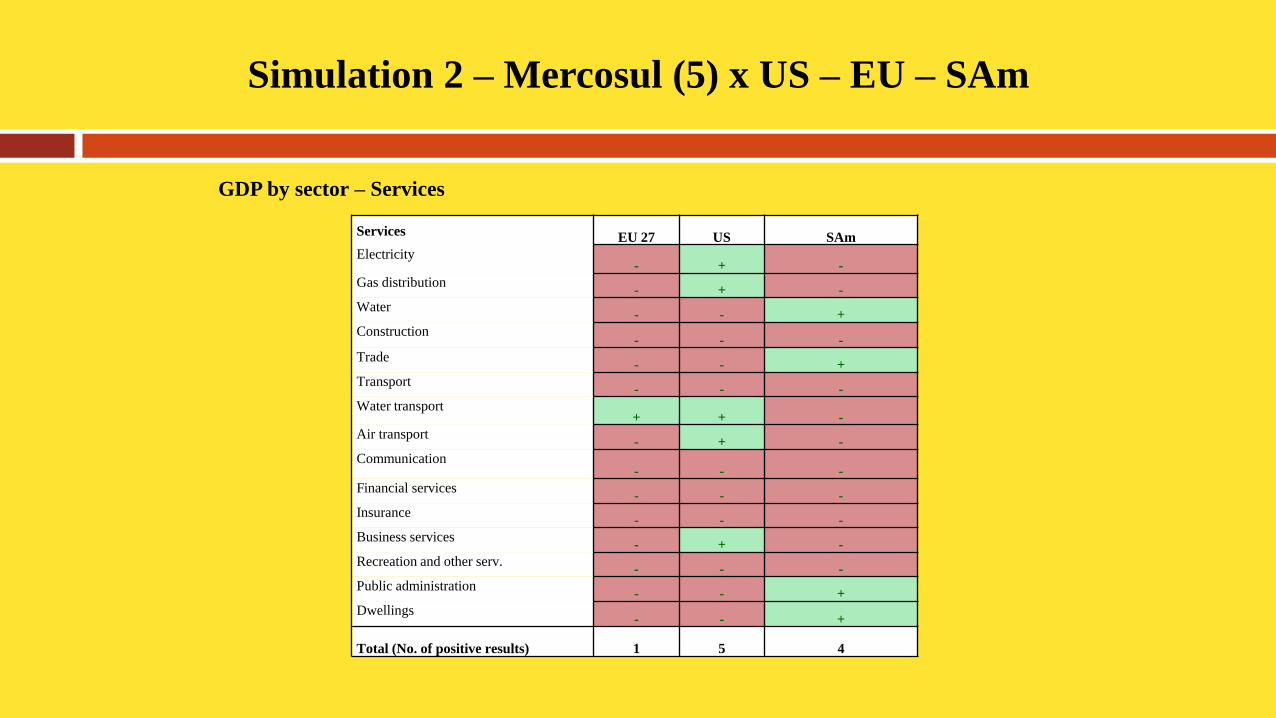
Simulation 2 – Mercosul (5) x US – EU – SAm
GDP by sector – Services
Services EU 27 US SAm
Electricity - + -
Gas distribution - + -
Water - - +
Construction - - -
Trade - - +
Transport - - -
Water transport + + -
Air transport - + -
Communication - - -
Financial services - - -
Insurance - - -
Business services - + -
Recreation and other serv. - - -
Public administration - - +
Dwellings - - +
Total (No. of positive results) 1 5 4
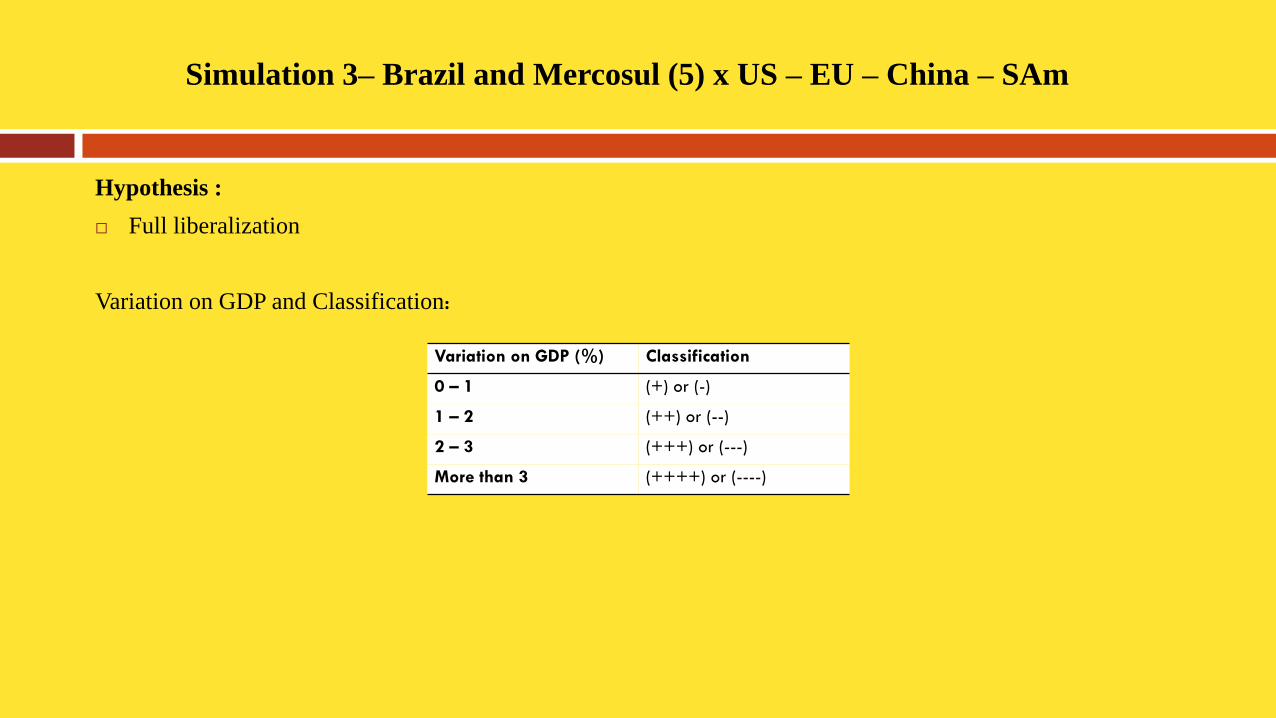
Simulation 3– Brazil and Mercosul (5) x US – EU – China – SAm
Hypothesis :
Full liberalization
Variation on GDP and Classification:
Variation on GDP (%) Classification
0 – 1 (+) or (-)
1 – 2 (++) or (--)
2 – 3 (+++) or (---)
More than 3 (++++) or (----)
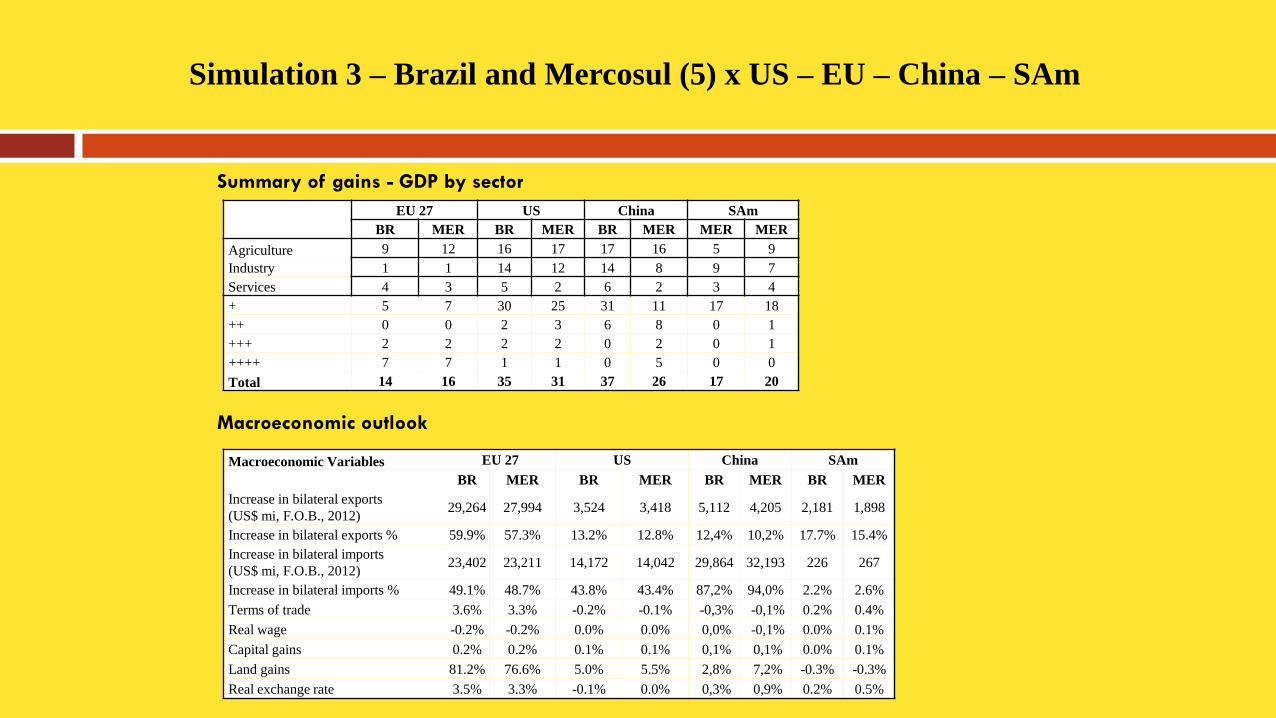
Simulation 3 – Brazil and Mercosul (5) x US – EU – China – SAm
Summary of gains - GDP by sector
Macroeconomic outlook
EU 27 US China SAm
BR MER BR MER BR MER MER MER
Agriculture 9 12 16 17 17 16 5 9
Industry 1 1 14 12 14 8 9 7
Services 4 3 5 2 6 2 3 4
+ 5 7 30 25 31 11 17 18
++ 0 0 2 3 6 8 0 1
+++ 2 2 2 2 0 2 0 1
++++ 7 7 1 1 0 5 0 0
Total 14 16 35 31 37 26 17 20
Macroeconomic Variables EU 27 US China SAm
BR MER BR MER BR MER BR MER
Increase in bilateral exports
(US$ mi, F.O.B., 2012) 29,264 27,994 3,524 3,418 5,112 4,205 2,181 1,898
Increase in bilateral exports % 59.9% 57.3% 13.2% 12.8% 12,4% 10,2% 17.7% 15.4%
Increase in bilateral imports
(US$ mi, F.O.B., 2012) 23,402 23,211 14,172 14,042 29,864 32,193 226 267
Increase in bilateral imports % 49.1% 48.7% 43.8% 43.4% 87,2% 94,0% 2.2% 2.6%
Terms of trade 3.6% 3.3% -0.2% -0.1% -0,3% -0,1% 0.2% 0.4%
Real wage -0.2% -0.2% 0.0% 0.0% 0,0% -0,1% 0.0% 0.1%
Capital gains 0.2% 0.2% 0.1% 0.1% 0,1% 0,1% 0.0% 0.1%
Land gains 81.2% 76.6% 5.0% 5.5% 2,8% 7,2% -0.3% -0.3%
Real exchange rate 3.5% 3.3% -0.1% 0.0% 0,3% 0,9% 0.2% 0.5%
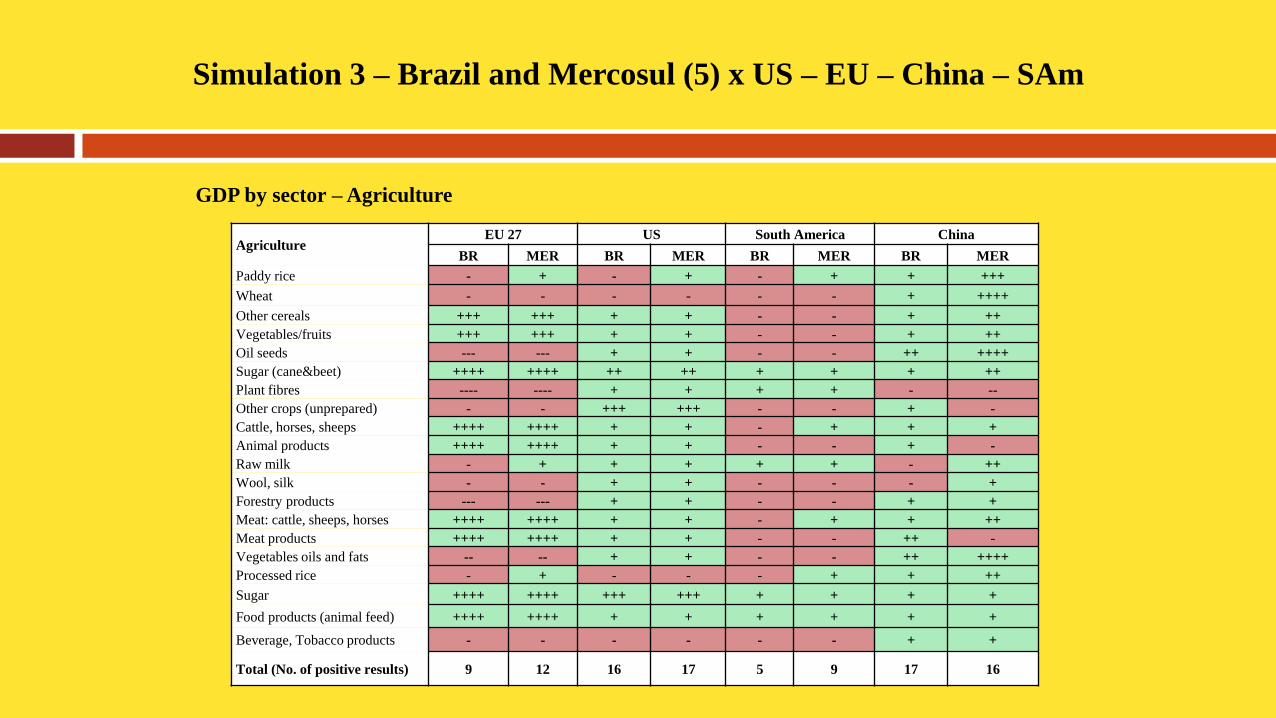
Simulation 3 – Brazil and Mercosul (5) x US – EU – China – SAm
Agriculture EU 27 US South America China
BR MER BR MER BR MER BR MER
Paddy rice - + - + - + + +++
Wheat - - - - - - + ++++
Other cereals +++ +++ + + - - + ++
Vegetables/fruits +++ +++ + + - - + ++
Oil seeds --- --- + + - - ++ ++++
Sugar (cane&beet) ++++ ++++ ++ ++ + + + ++
Plant fibres ---- ---- + + + + - --
Other crops (unprepared) - - +++ +++ - - + -
Cattle, horses, sheeps ++++ ++++ + + - + + +
Animal products ++++ ++++ + + - - + -
Raw milk - + + + + + - ++
Wool, silk - - + + - - - +
Forestry products --- --- + + - - + +
Meat: cattle, sheeps, horses ++++ ++++ + + - + + ++
Meat products ++++ ++++ + + - - ++ -
Vegetables oils and fats -- -- + + - - ++ ++++
Processed rice - + - - - + + ++
Sugar ++++ ++++ +++ +++ + + + +
Food products (animal feed) ++++ ++++ + + + + + +
Beverage, Tobacco products - - - - - - + +
Total (No. of positive results) 9 12 16 17 5 9 17 16
GDP by sector – Agriculture
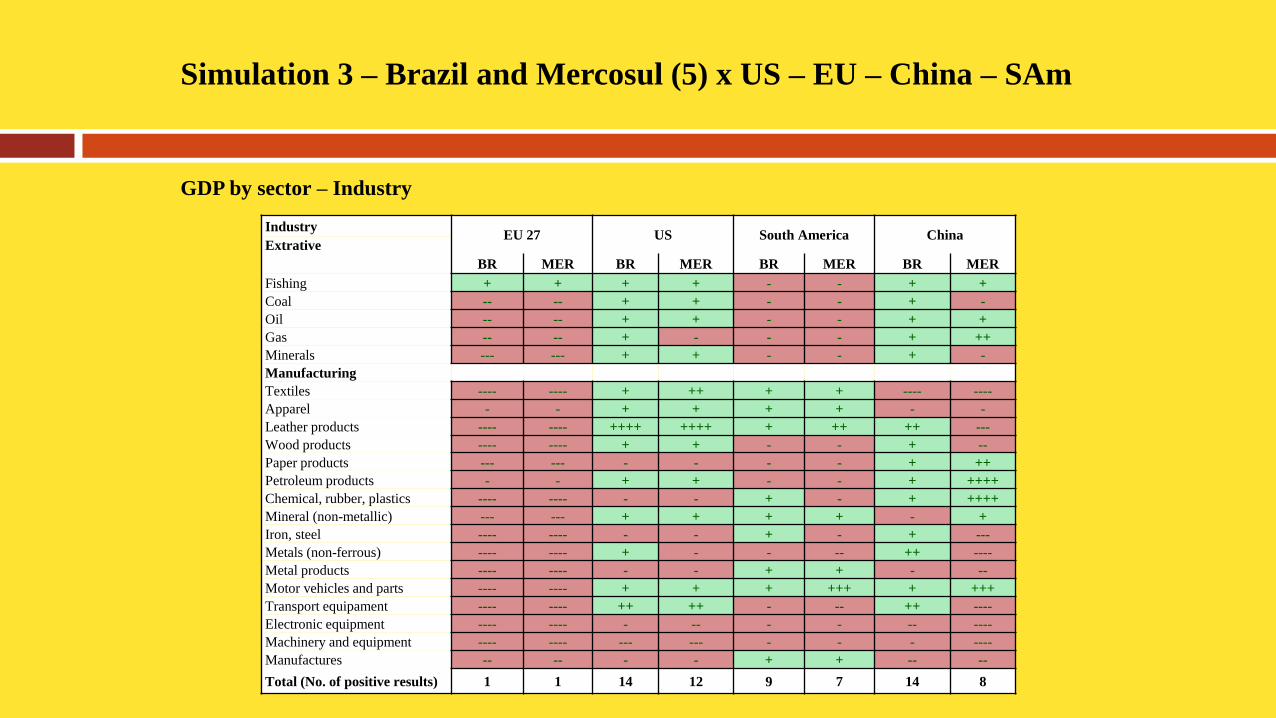
Simulation 3 – Brazil and Mercosul (5) x US – EU – China – SAm
Industry EU 27 US South America China
Extrative
BR MER BR MER BR MER BR MER
Fishing + + + + - - + +
Coal -- -- + + - - + -
Oil -- -- + + - - + +
Gas -- -- + - - - + ++
Minerals --- --- + + - - + -
Manufacturing
Textiles ---- ---- + ++ + + ---- ----
Apparel - - + + + + - -
Leather products ---- ---- ++++ ++++ + ++ ++ ---
Wood products ---- ---- + + - - + --
Paper products --- --- - - - - + ++
Petroleum products - - + + - - + ++++
Chemical, rubber, plastics ---- ---- - - + - + ++++
Mineral (non-metallic) --- --- + + + + - +
Iron, steel ---- ---- - - + - + ---
Metals (non-ferrous) ---- ---- + - - -- ++ ----
Metal products ---- ---- - - + + - --
Motor vehicles and parts ---- ---- + + + +++ + +++
Transport equipament ---- ---- ++ ++ - -- ++ ----
Electronic equipment ---- ---- - -- - - -- ----
Machinery and equipment ---- ---- --- --- - - - ----
Manufactures -- -- - - + + -- --
Total (No. of positive results) 1 1 14 12 9 7 14 8
GDP by sector – Industry
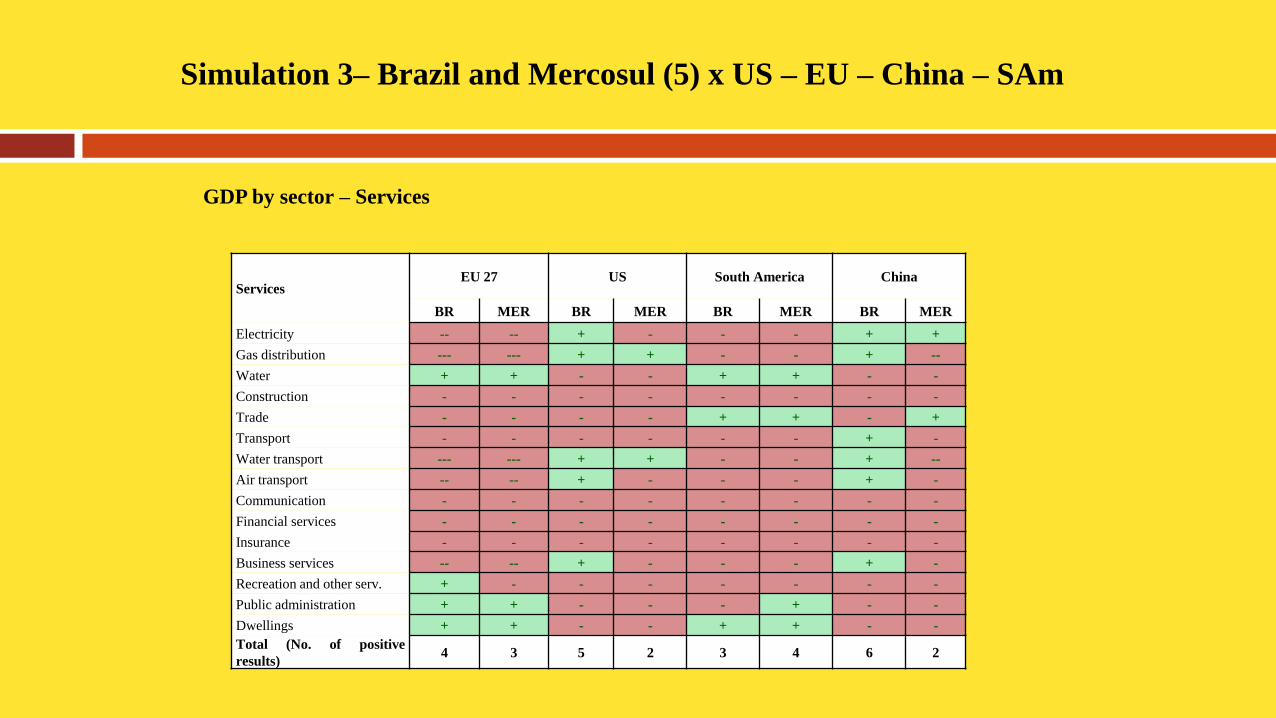
Simulation 3– Brazil and Mercosul (5) x US – EU – China – SAm
Services EU 27 US South America China
BR MER BR MER BR MER BR MER
Electricity -- -- + - - - + +
Gas distribution --- --- + + - - + --
Water + + - - + + - -
Construction - - - - - - - -
Trade - - - - + + - +
Transport - - - - - - + -
Water transport --- --- + + - - + --
Air transport -- -- + - - - + -
Communication - - - - - - - -
Financial services - - - - - - - -
Insurance - - - - - - - -
Business services -- -- + - - - + -
Recreation and other serv. + - - - - - - -
Public administration + + - - - + - -
Dwellings + + - - + + - -
Total (No. of positive
results) 4 3 5 2 3 4 6 2
GDP by sector – Services
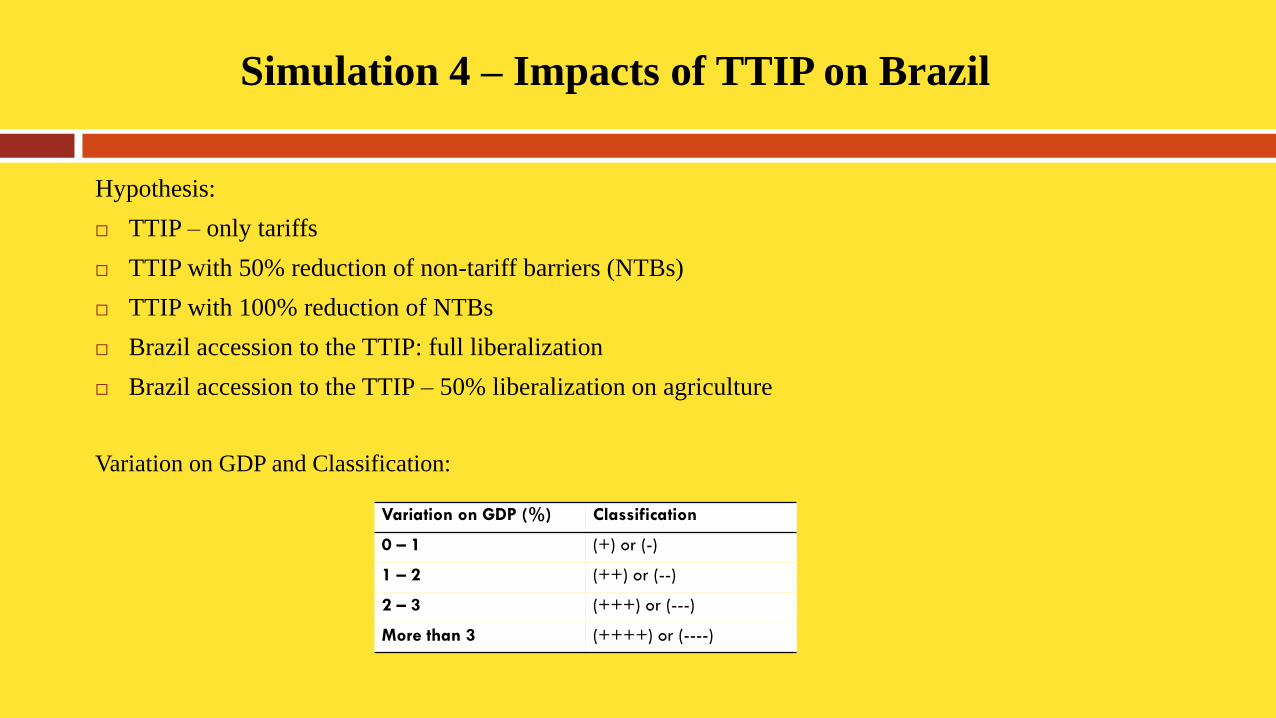
Simulation 4 – Impacts of TTIP on Brazil
Hypothesis:
TTIP – only tariffs
TTIP with 50% reduction of non-tariff barriers (NTBs)
TTIP with 100% reduction of NTBs
Brazil accession to the TTIP: full liberalization
Brazil accession to the TTIP – 50% liberalization on agriculture
Variation on GDP and Classification:
Variation on GDP (%) Classification
0 – 1 (+) or (-)
1 – 2 (++) or (--)
2 – 3 (+++) or (---)
More than 3 (++++) or (----)
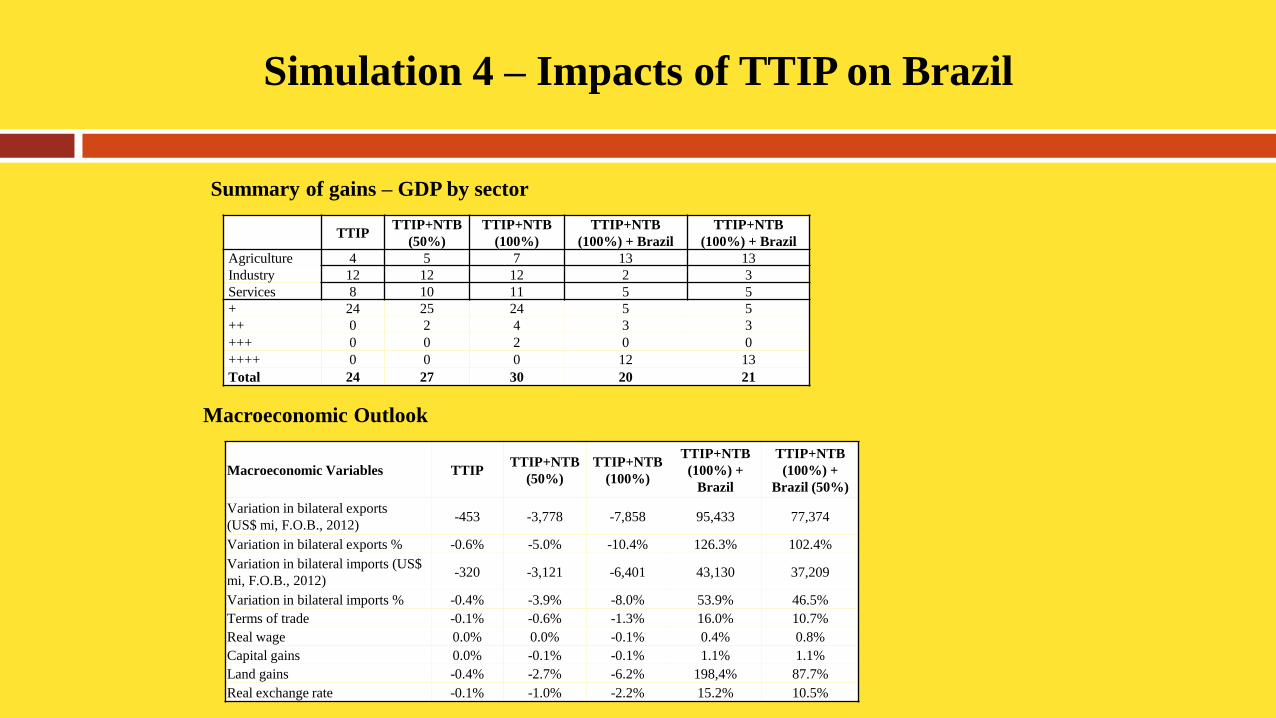
Simulation 4 – Impacts of TTIP on Brazil
TTIP
TTIP+NTB
(50%)
TTIP+NTB
(100%)
TTIP+NTB
(100%) + Brazil
TTIP+NTB
(100%) + Brazil
Agriculture 4 5 7 13 13
Industry 12 12 12 2 3
Services 8 10 11 5 5
+ 24 25 24 5 5
++ 0 2 4 3 3
+++ 0 0 2 0 0
++++ 0 0 0 12 13
Total 24 27 30 20 21
Macroeconomic Variables TTIP TTIP+NTB
(50%)
TTIP+NTB
(100%)
TTIP+NTB
(100%) +
Brazil
TTIP+NTB
(100%) +
Brazil (50%)
Variation in bilateral exports
(US$ mi, F.O.B., 2012) -453 -3,778 -7,858 95,433 77,374
Variation in bilateral exports % -0.6% -5.0% -10.4% 126.3% 102.4%
Variation in bilateral imports (US$
mi, F.O.B., 2012) -320 -3,121 -6,401 43,130 37,209
Variation in bilateral imports % -0.4% -3.9% -8.0% 53.9% 46.5%
Terms of trade -0.1% -0.6% -1.3% 16.0% 10.7%
Real wage 0.0% 0.0% -0.1% 0.4% 0.8%
Capital gains 0.0% -0.1% -0.1% 1.1% 1.1%
Land gains -0.4% -2.7% -6.2% 198,4% 87.7%
Real exchange rate -0.1% -1.0% -2.2% 15.2% 10.5%
Summary of gains – GDP by sector
Macroeconomic Outlook
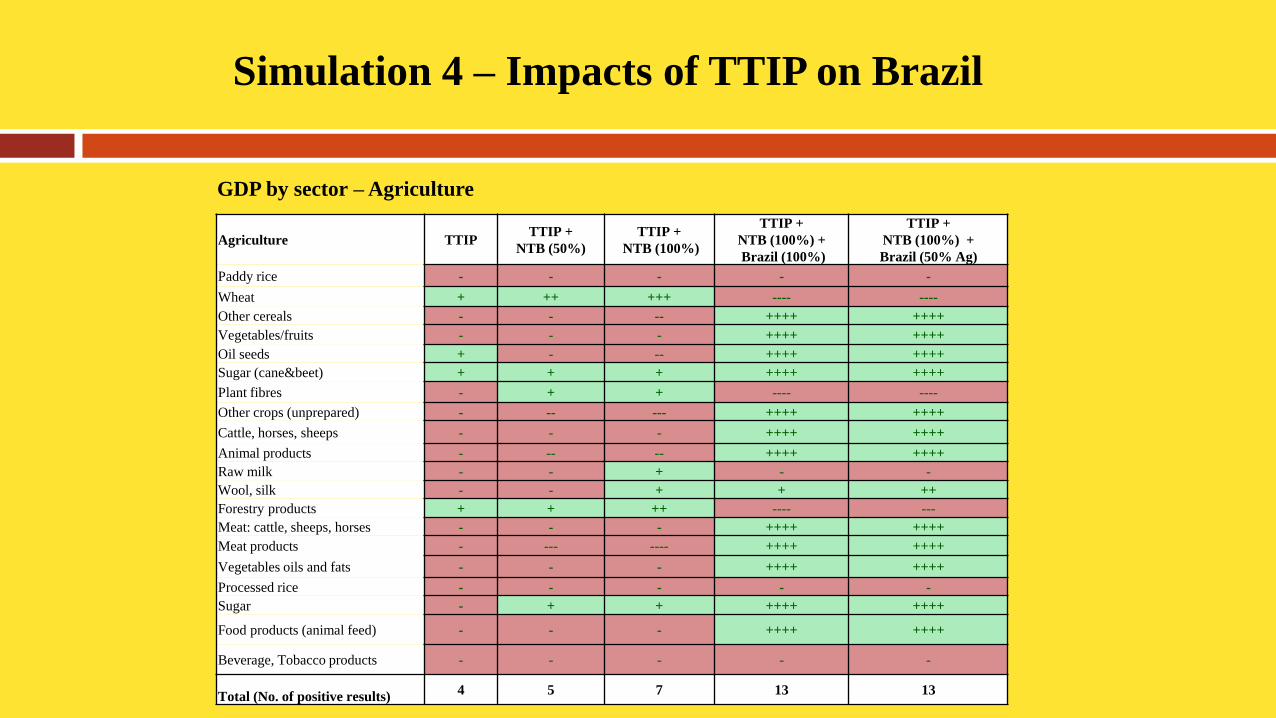
Simulation 4 – Impacts of TTIP on Brazil
GDP by sector – Agriculture
Agriculture TTIP
TTIP +
NTB (50%)
TTIP +
NTB (100%)
TTIP +
NTB (100%) +
Brazil (100%)
TTIP +
NTB (100%) +
Brazil (50% Ag)
Paddy rice - - - - -
Wheat + ++ +++ ---- ----
Other cereals - - -- ++++ ++++
Vegetables/fruits - - - ++++ ++++
Oil seeds + - -- ++++ ++++
Sugar (cane&beet) + + + ++++ ++++
Plant fibres - + + ---- ----
Other crops (unprepared) - -- --- ++++ ++++
Cattle, horses, sheeps - - - ++++ ++++
Animal products - -- -- ++++ ++++
Raw milk - - + - -
Wool, silk - - + + ++
Forestry products + + ++ ---- ---
Meat: cattle, sheeps, horses - - - ++++ ++++
Meat products - --- ---- ++++ ++++
Vegetables oils and fats - - - ++++ ++++
Processed rice - - - - -
Sugar - + + ++++ ++++
Food products (animal feed) - - - ++++ ++++
Beverage, Tobacco products - - - - -
Total (No. of positive results) 4 5 7 13 13
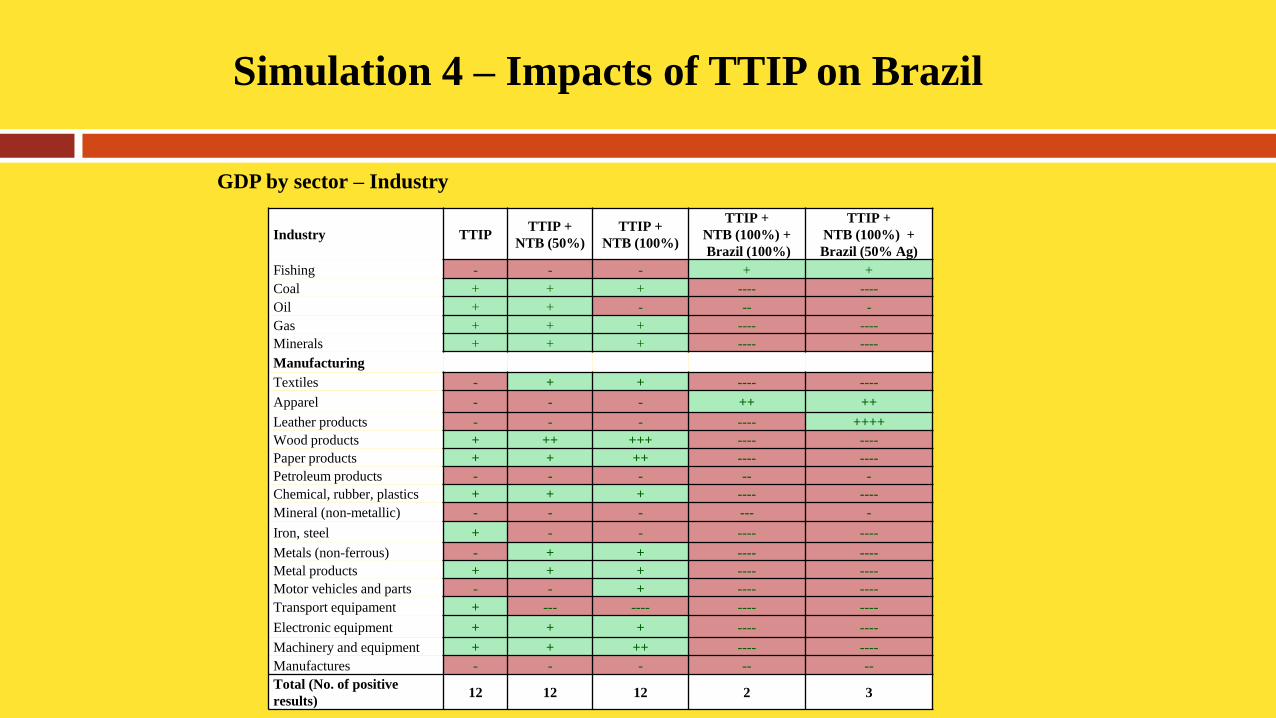
Simulation 4 – Impacts of TTIP on Brazil
GDP by sector – Industry
Industry TTIP
TTIP +
NTB (50%)
TTIP +
NTB (100%)
TTIP +
NTB (100%) +
Brazil (100%)
TTIP +
NTB (100%) +
Brazil (50% Ag)
Fishing - - - + +
Coal + + + ---- ----
Oil + + - -- -
Gas + + + ---- ----
Minerals + + + ---- ----
Manufacturing
Textiles - + + ---- ----
Apparel - - - ++ ++
Leather products - - - ---- ++++
Wood products + ++ +++ ---- ----
Paper products + + ++ ---- ----
Petroleum products - - - -- -
Chemical, rubber, plastics + + + ---- ----
Mineral (non-metallic) - - - --- -
Iron, steel + - - ---- ----
Metals (non-ferrous) - + + ---- ----
Metal products + + + ---- ----
Motor vehicles and parts - - + ---- ----
Transport equipament + --- ---- ---- ----
Electronic equipment + + + ---- ----
Machinery and equipment + + ++ ---- ----
Manufactures - - - -- --
Total (No. of positive
results) 12 12 12 2 3
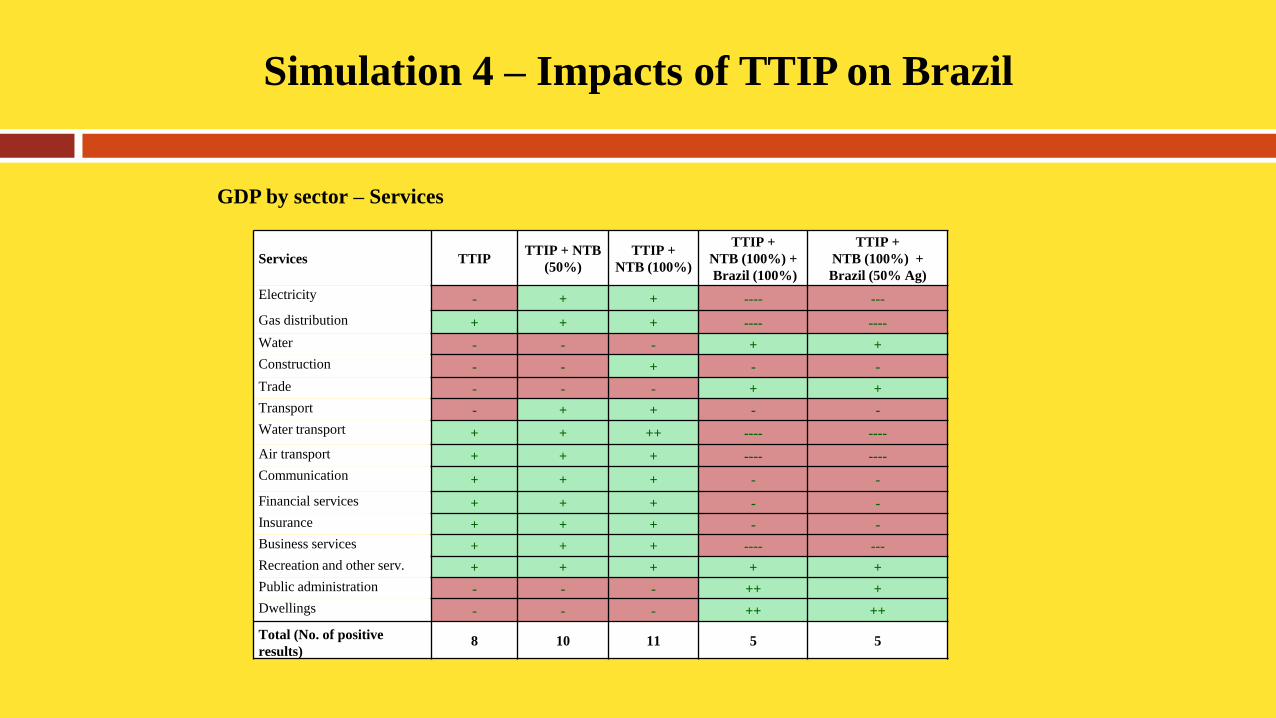
Simulation 4 – Impacts of TTIP on Brazil
GDP by sector – Services
Services TTIP
TTIP + NTB
(50%)
TTIP +
NTB (100%)
TTIP +
NTB (100%) +
Brazil (100%)
TTIP +
NTB (100%) +
Brazil (50% Ag)
Electricity - + + ---- ---
Gas distribution + + + ---- ----
Water - - - + +
Construction - - + - -
Trade - - - + +
Transport - + + - -
Water transport + + ++ ---- ----
Air transport + + + ---- ----
Communication + + + - -
Financial services + + + - -
Insurance + + + - -
Business services + + + ---- ---
Recreation and other serv. + + + + +
Public administration - - - ++ +
Dwellings - - - ++ ++
Total (No. of positive
results) 8 10 11 5 5
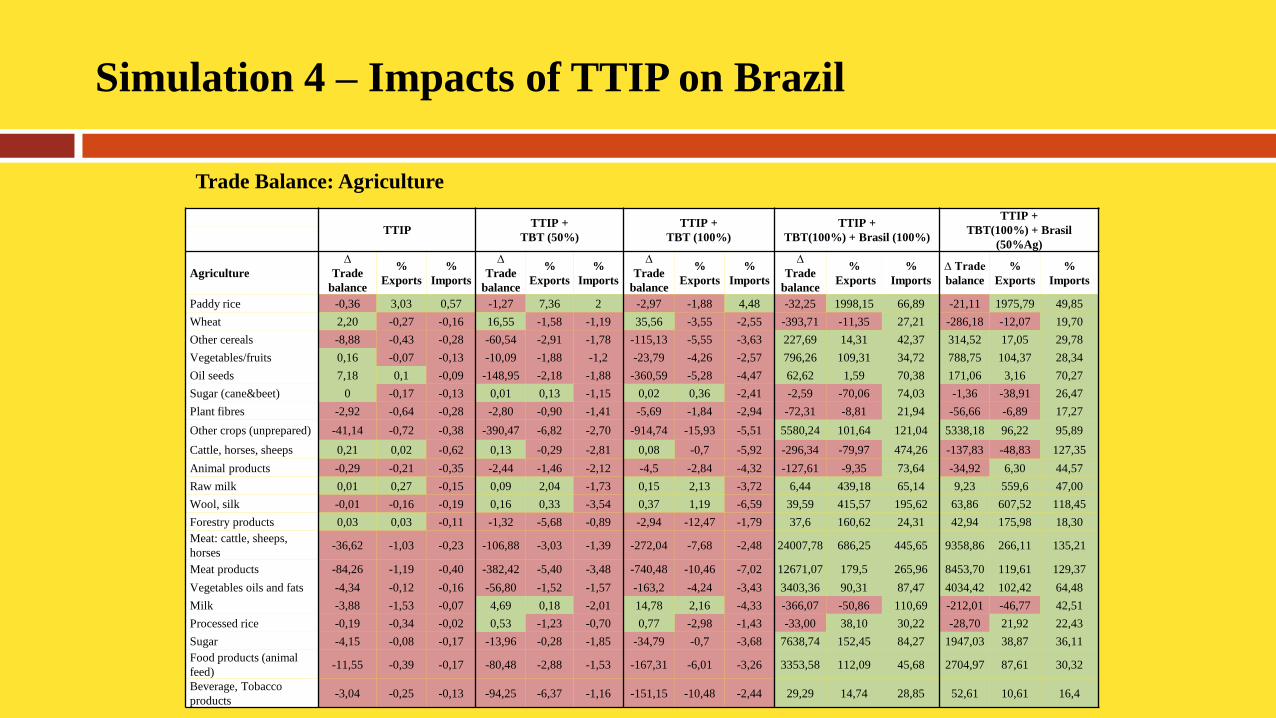
Simulation 4 – Impacts of TTIP on Brazil
Trade Balance: Agriculture
TTIP TTIP +
TBT (50%)
TTIP +
TBT (100%)
TTIP +
TBT(100%) + Brasil (100%)
TTIP +
TBT(100%) + Brasil
(50%Ag)
Agriculture
∆
Trade
balance
%
Exports
%
Imports
∆
Trade
balance
%
Exports
%
Imports
∆
Trade
balance
%
Exports
%
Imports
∆
Trade
balance
%
Exports
%
Imports
∆ Trade
balance
%
Exports
%
Imports
Paddy rice -0,36 3,03 0,57 -1,27 7,36 2 -2,97 -1,88 4,48 -32,25 1998,15 66,89 -21,11 1975,79 49,85
Wheat 2,20 -0,27 -0,16 16,55 -1,58 -1,19 35,56 -3,55 -2,55 -393,71 -11,35 27,21 -286,18 -12,07 19,70
Other cereals -8,88 -0,43 -0,28 -60,54 -2,91 -1,78 -115,13 -5,55 -3,63 227,69 14,31 42,37 314,52 17,05 29,78
Vegetables/fruits 0,16 -0,07 -0,13 -10,09 -1,88 -1,2 -23,79 -4,26 -2,57 796,26 109,31 34,72 788,75 104,37 28,34
Oil seeds 7,18 0,1 -0,09 -148,95 -2,18 -1,88 -360,59 -5,28 -4,47 62,62 1,59 70,38 171,06 3,16 70,27
Sugar (cane&beet) 0 -0,17 -0,13 0,01 0,13 -1,15 0,02 0,36 -2,41 -2,59 -70,06 74,03 -1,36 -38,91 26,47
Plant fibres -2,92 -0,64 -0,28 -2,80 -0,90 -1,41 -5,69 -1,84 -2,94 -72,31 -8,81 21,94 -56,66 -6,89 17,27
Other crops (unprepared) -41,14 -0,72 -0,38 -390,47 -6,82 -2,70 -914,74 -15,93 -5,51 5580,24 101,64 121,04 5338,18 96,22 95,89
Cattle, horses, sheeps 0,21 0,02 -0,62 0,13 -0,29 -2,81 0,08 -0,7 -5,92 -296,34 -79,97 474,26 -137,83 -48,83 127,35
Animal products -0,29 -0,21 -0,35 -2,44 -1,46 -2,12 -4,5 -2,84 -4,32 -127,61 -9,35 73,64 -34,92 6,30 44,57
Raw milk 0,01 0,27 -0,15 0,09 2,04 -1,73 0,15 2,13 -3,72 6,44 439,18 65,14 9,23 559,6 47,00
Wool, silk -0,01 -0,16 -0,19 0,16 0,33 -3,54 0,37 1,19 -6,59 39,59 415,57 195,62 63,86 607,52 118,45
Forestry products 0,03 0,03 -0,11 -1,32 -5,68 -0,89 -2,94 -12,47 -1,79 37,6 160,62 24,31 42,94 175,98 18,30
Meat: cattle, sheeps,
horses -36,62 -1,03 -0,23 -106,88 -3,03 -1,39 -272,04 -7,68 -2,48 24007,78 686,25 445,65 9358,86 266,11 135,21
Meat products -84,26 -1,19 -0,40 -382,42 -5,40 -3,48 -740,48 -10,46 -7,02 12671,07 179,5 265,96 8453,70 119,61 129,37
Vegetables oils and fats -4,34 -0,12 -0,16 -56,80 -1,52 -1,57 -163,2 -4,24 -3,43 3403,36 90,31 87,47 4034,42 102,42 64,48
Milk -3,88 -1,53 -0,07 4,69 0,18 -2,01 14,78 2,16 -4,33 -366,07 -50,86 110,69 -212,01 -46,77 42,51
Processed rice -0,19 -0,34 -0,02 0,53 -1,23 -0,70 0,77 -2,98 -1,43 -33,00 38,10 30,22 -28,70 21,92 22,43
Sugar -4,15 -0,08 -0,17 -13,96 -0,28 -1,85 -34,79 -0,7 -3,68 7638,74 152,45 84,27 1947,03 38,87 36,11
Food products (animal
feed) -11,55 -0,39 -0,17 -80,48 -2,88 -1,53 -167,31 -6,01 -3,26 3353,58 112,09 45,68 2704,97 87,61 30,32
Beverage, Tobacco
products -3,04 -0,25 -0,13 -94,25 -6,37 -1,16 -151,15 -10,48 -2,44 29,29 14,74 28,85 52,61 10,61 16,4
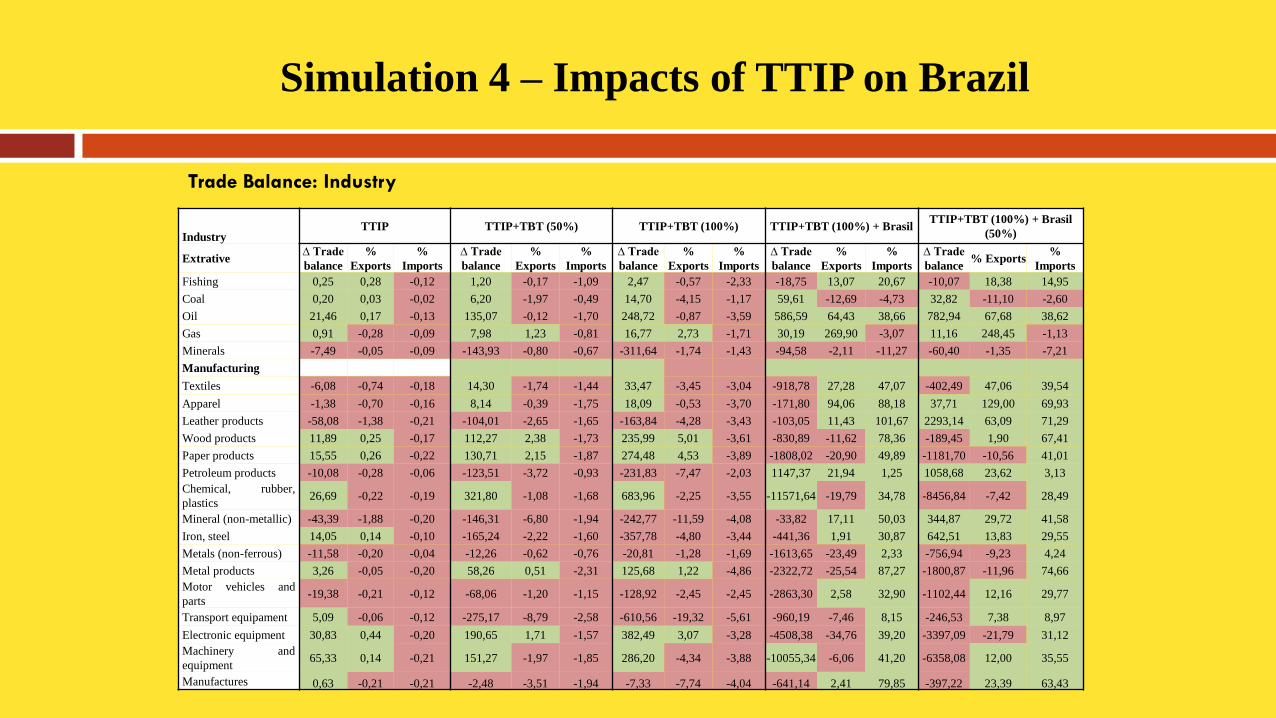
Simulation 4 – Impacts of TTIP on Brazil
Trade Balance: Industry
Industry TTIP TTIP+TBT (50%) TTIP+TBT (100%) TTIP+TBT (100%) + Brasil
TTIP+TBT (100%) + Brasil
(50%)
Extrative ∆ Trade
balance
%
Exports
%
Imports
∆ Trade
balance
%
Exports
%
Imports
∆ Trade
balance
%
Exports
%
Imports
∆ Trade
balance
%
Exports
%
Imports
∆ Trade
balance % Exports
%
Imports
Fishing 0,25 0,28 -0,12 1,20 -0,17 -1,09 2,47 -0,57 -2,33 -18,75 13,07 20,67 -10,07 18,38 14,95
Coal 0,20 0,03 -0,02 6,20 -1,97 -0,49 14,70 -4,15 -1,17 59,61 -12,69 -4,73 32,82 -11,10 -2,60
Oil 21,46 0,17 -0,13 135,07 -0,12 -1,70 248,72 -0,87 -3,59 586,59 64,43 38,66 782,94 67,68 38,62
Gas 0,91 -0,28 -0,09 7,98 1,23 -0,81 16,77 2,73 -1,71 30,19 269,90 -3,07 11,16 248,45 -1,13
Minerals -7,49 -0,05 -0,09 -143,93 -0,80 -0,67 -311,64 -1,74 -1,43 -94,58 -2,11 -11,27 -60,40 -1,35 -7,21
Manufacturing
Textiles -6,08 -0,74 -0,18 14,30 -1,74 -1,44 33,47 -3,45 -3,04 -918,78 27,28 47,07 -402,49 47,06 39,54
Apparel -1,38 -0,70 -0,16 8,14 -0,39 -1,75 18,09 -0,53 -3,70 -171,80 94,06 88,18 37,71 129,00 69,93
Leather products -58,08 -1,38 -0,21 -104,01 -2,65 -1,65 -163,84 -4,28 -3,43 -103,05 11,43 101,67 2293,14 63,09 71,29
Wood products 11,89 0,25 -0,17 112,27 2,38 -1,73 235,99 5,01 -3,61 -830,89 -11,62 78,36 -189,45 1,90 67,41
Paper products 15,55 0,26 -0,22 130,71 2,15 -1,87 274,48 4,53 -3,89 -1808,02 -20,90 49,89 -1181,70 -10,56 41,01
Petroleum products -10,08 -0,28 -0,06 -123,51 -3,72 -0,93 -231,83 -7,47 -2,03 1147,37 21,94 1,25 1058,68 23,62 3,13
Chemical, rubber,
plastics 26,69 -0,22 -0,19 321,80 -1,08 -1,68 683,96 -2,25 -3,55 -11571,64 -19,79 34,78 -8456,84 -7,42 28,49
Mineral (non-metallic) -43,39 -1,88 -0,20 -146,31 -6,80 -1,94 -242,77 -11,59 -4,08 -33,82 17,11 50,03 344,87 29,72 41,58
Iron, steel 14,05 0,14 -0,10 -165,24 -2,22 -1,60 -357,78 -4,80 -3,44 -441,36 1,91 30,87 642,51 13,83 29,55
Metals (non-ferrous) -11,58 -0,20 -0,04 -12,26 -0,62 -0,76 -20,81 -1,28 -1,69 -1613,65 -23,49 2,33 -756,94 -9,23 4,24
Metal products 3,26 -0,05 -0,20 58,26 0,51 -2,31 125,68 1,22 -4,86 -2322,72 -25,54 87,27 -1800,87 -11,96 74,66
Motor vehicles and
parts -19,38 -0,21 -0,12 -68,06 -1,20 -1,15 -128,92 -2,45 -2,45 -2863,30 2,58 32,90 -1102,44 12,16 29,77
Transport equipament 5,09 -0,06 -0,12 -275,17 -8,79 -2,58 -610,56 -19,32 -5,61 -960,19 -7,46 8,15 -246,53 7,38 8,97
Electronic equipment 30,83 0,44 -0,20 190,65 1,71 -1,57 382,49 3,07 -3,28 -4508,38 -34,76 39,20 -3397,09 -21,79 31,12
Machinery and
equipment 65,33 0,14 -0,21 151,27 -1,97 -1,85 286,20 -4,34 -3,88 -10055,34 -6,06 41,20 -6358,08 12,00 35,55
Manufactures 0,63 -0,21 -0,21 -2,48 -3,51 -1,94 -7,33 -7,74 -4,04 -641,14 2,41 79,85 -397,22 23,39 63,43
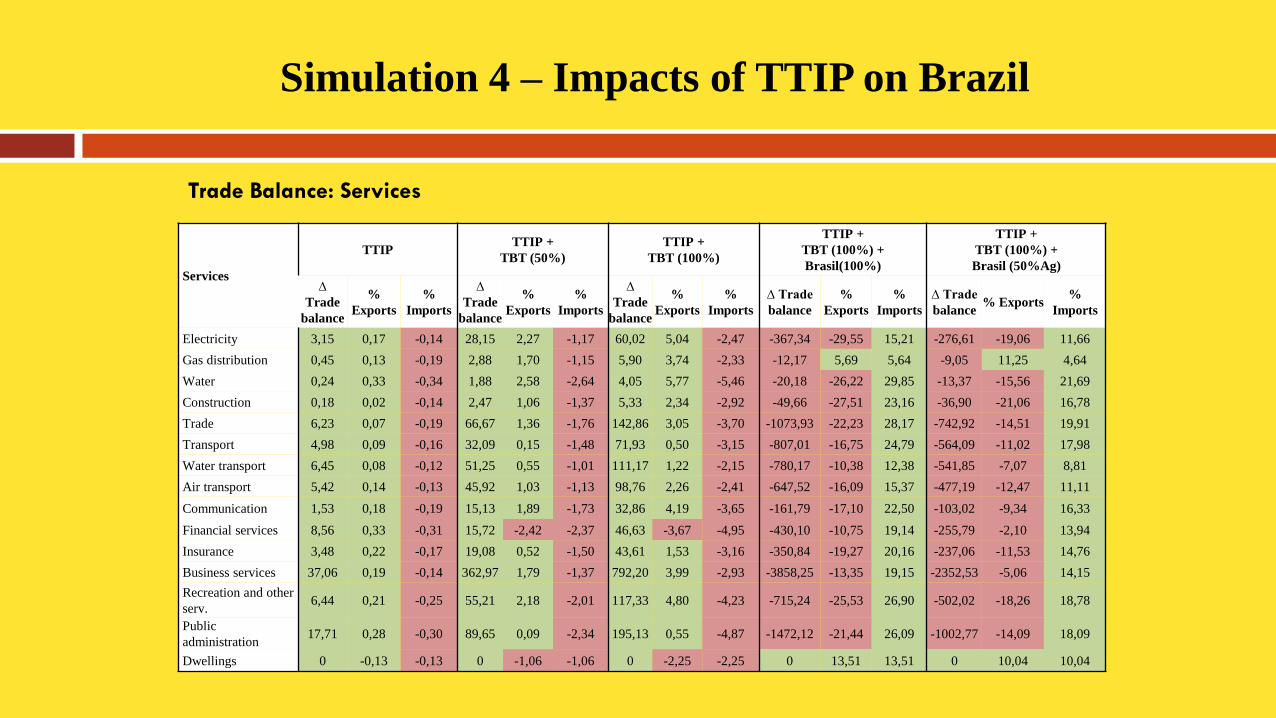
Simulation 4 – Impacts of TTIP on Brazil
Trade Balance: Services
Services
TTIP TTIP +
TBT (50%)
TTIP +
TBT (100%)
TTIP +
TBT (100%) +
Brasil(100%)
TTIP +
TBT (100%) +
Brasil (50%Ag)
∆
Trade
balance
%
Exports
%
Imports
∆
Trade
balance
%
Exports
%
Imports
∆
Trade
balance
%
Exports
%
Imports
∆ Trade
balance
%
Exports
%
Imports
∆ Trade
balance % Exports
%
Imports
Electricity 3,15 0,17 -0,14 28,15 2,27 -1,17 60,02 5,04 -2,47 -367,34 -29,55 15,21 -276,61 -19,06 11,66
Gas distribution 0,45 0,13 -0,19 2,88 1,70 -1,15 5,90 3,74 -2,33 -12,17 5,69 5,64 -9,05 11,25 4,64
Water 0,24 0,33 -0,34 1,88 2,58 -2,64 4,05 5,77 -5,46 -20,18 -26,22 29,85 -13,37 -15,56 21,69
Construction 0,18 0,02 -0,14 2,47 1,06 -1,37 5,33 2,34 -2,92 -49,66 -27,51 23,16 -36,90 -21,06 16,78
Trade 6,23 0,07 -0,19 66,67 1,36 -1,76 142,86 3,05 -3,70 -1073,93 -22,23 28,17 -742,92 -14,51 19,91
Transport 4,98 0,09 -0,16 32,09 0,15 -1,48 71,93 0,50 -3,15 -807,01 -16,75 24,79 -564,09 -11,02 17,98
Water transport 6,45 0,08 -0,12 51,25 0,55 -1,01 111,17 1,22 -2,15 -780,17 -10,38 12,38 -541,85 -7,07 8,81
Air transport 5,42 0,14 -0,13 45,92 1,03 -1,13 98,76 2,26 -2,41 -647,52 -16,09 15,37 -477,19 -12,47 11,11
Communication 1,53 0,18 -0,19 15,13 1,89 -1,73 32,86 4,19 -3,65 -161,79 -17,10 22,50 -103,02 -9,34 16,33
Financial services 8,56 0,33 -0,31 15,72 -2,42 -2,37 46,63 -3,67 -4,95 -430,10 -10,75 19,14 -255,79 -2,10 13,94
Insurance 3,48 0,22 -0,17 19,08 0,52 -1,50 43,61 1,53 -3,16 -350,84 -19,27 20,16 -237,06 -11,53 14,76
Business services 37,06 0,19 -0,14 362,97 1,79 -1,37 792,20 3,99 -2,93 -3858,25 -13,35 19,15 -2352,53 -5,06 14,15
Recreation and other
serv. 6,44 0,21 -0,25 55,21 2,18 -2,01 117,33 4,80 -4,23 -715,24 -25,53 26,90 -502,02 -18,26 18,78
Public
administration 17,71 0,28 -0,30 89,65 0,09 -2,34 195,13 0,55 -4,87 -1472,12 -21,44 26,09 -1002,77 -14,09 18,09
Dwellings 0 -0,13 -0,13 0 -1,06 -1,06 0 -2,25 -2,25 0 13,51 13,51 0 10,04 10,04
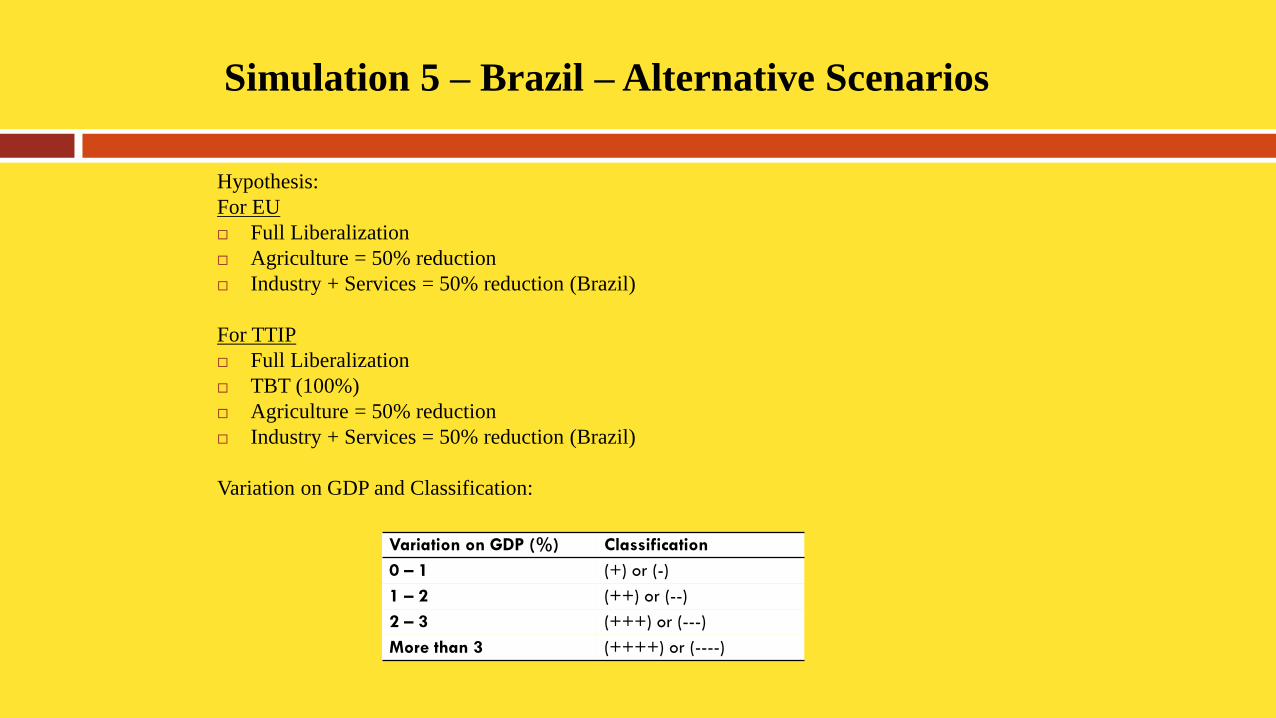
Simulation 5 – Brazil – Alternative Scenarios
Hypothesis:
For EU
Full Liberalization
Agriculture = 50% reduction
Industry + Services = 50% reduction (Brazil)
For TTIP
Full Liberalization
TBT (100%)
Agriculture = 50% reduction
Industry + Services = 50% reduction (Brazil)
Variation on GDP and Classification:
Variation on GDP (%) Classification
0 – 1 (+) or (-)
1 – 2 (++) or (--)
2 – 3 (+++) or (---)
More than 3 (++++) or (----)
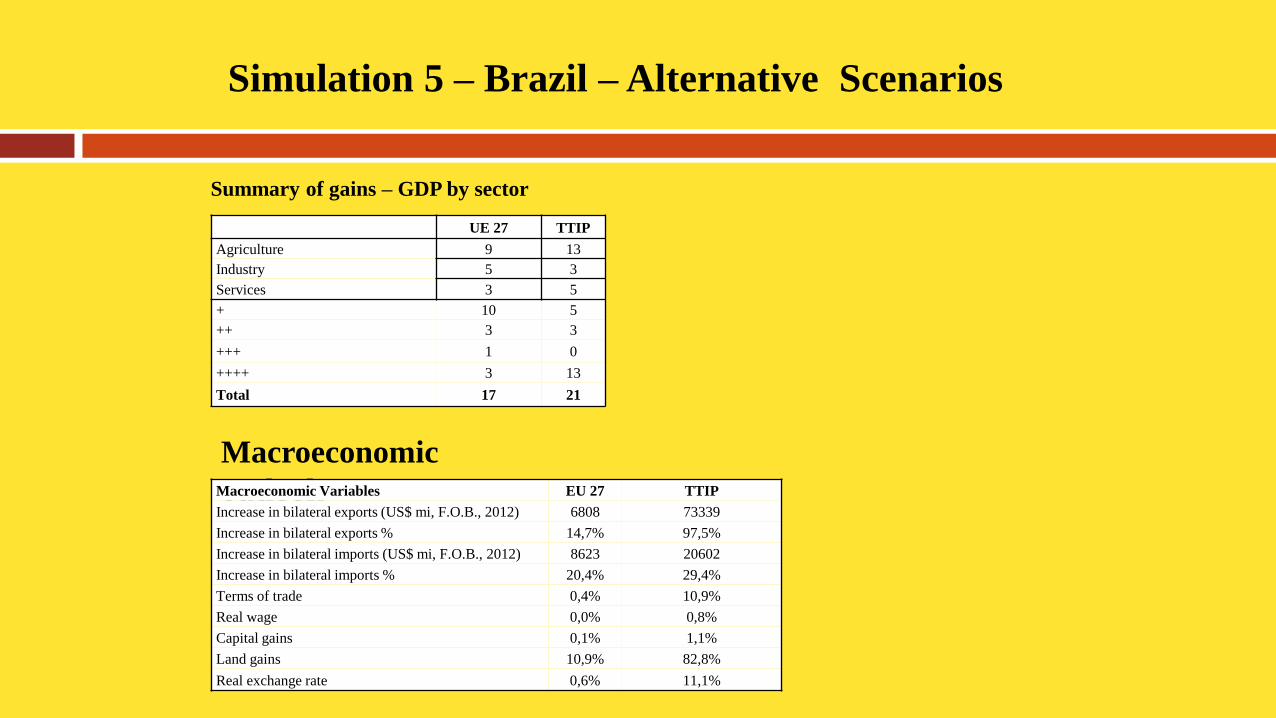
Simulation 5 – Brazil – Alternative Scenarios
Summary of gains – GDP by sector
UE 27 TTIP
Agriculture 9 13
Industry 5 3
Services 3 5
+ 10 5
++ 3 3
+++ 1 0
++++ 3 13
Total 17 21
Macroeconomic
outlook
Macroeconomic Variables EU 27 TTIP
Increase in bilateral exports (US$ mi, F.O.B., 2012) 6808 73339
Increase in bilateral exports % 14,7% 97,5%
Increase in bilateral imports (US$ mi, F.O.B., 2012) 8623 20602
Increase in bilateral imports % 20,4% 29,4%
Terms of trade 0,4% 10,9%
Real wage 0,0% 0,8%
Capital gains 0,1% 1,1%
Land gains 10,9% 82,8%
Real exchange rate 0,6% 11,1%
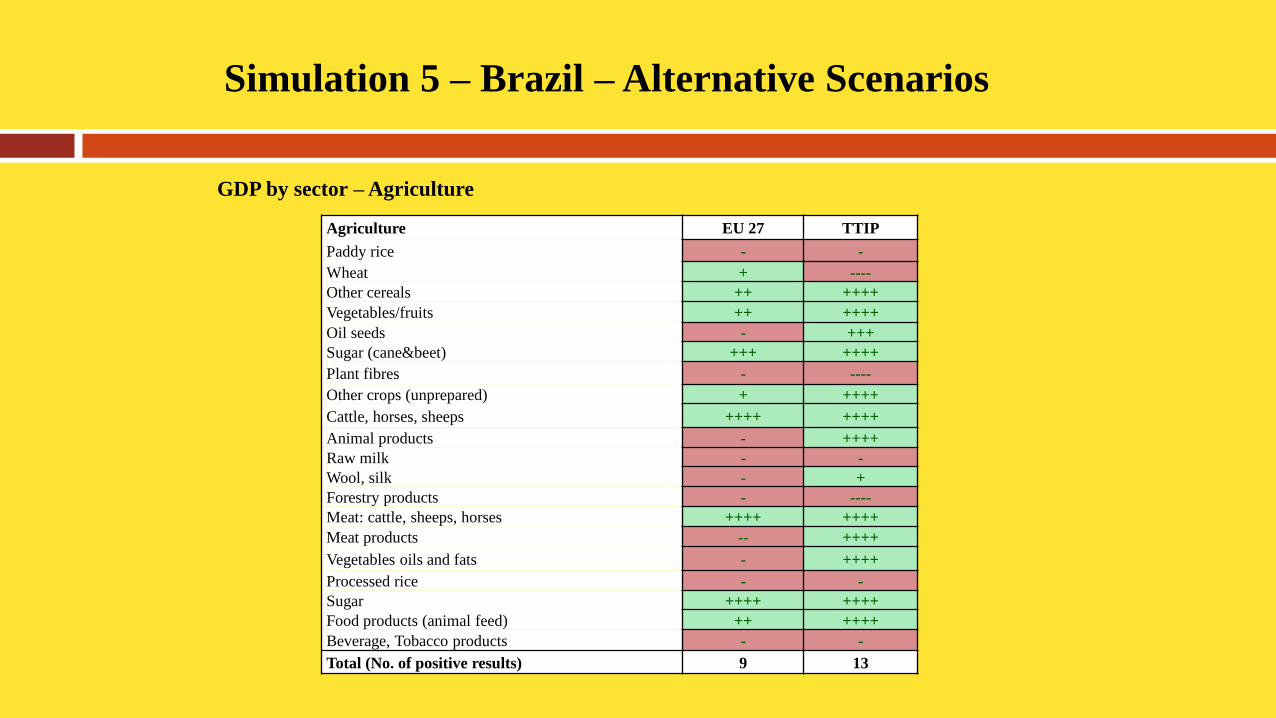
Simulation 5 – Brazil – Alternative Scenarios
GDP by sector – Agriculture
Agriculture EU 27 TTIP
Paddy rice - -
Wheat + ----
Other cereals ++ ++++
Vegetables/fruits ++ ++++
Oil seeds - +++
Sugar (cane&beet) +++ ++++
Plant fibres - ----
Other crops (unprepared) + ++++
Cattle, horses, sheeps ++++ ++++
Animal products - ++++
Raw milk - -
Wool, silk - +
Forestry products - ----
Meat: cattle, sheeps, horses ++++ ++++
Meat products -- ++++
Vegetables oils and fats - ++++
Processed rice - -
Sugar ++++ ++++
Food products (animal feed) ++ ++++
Beverage, Tobacco products - -
Total (No. of positive results) 9 13
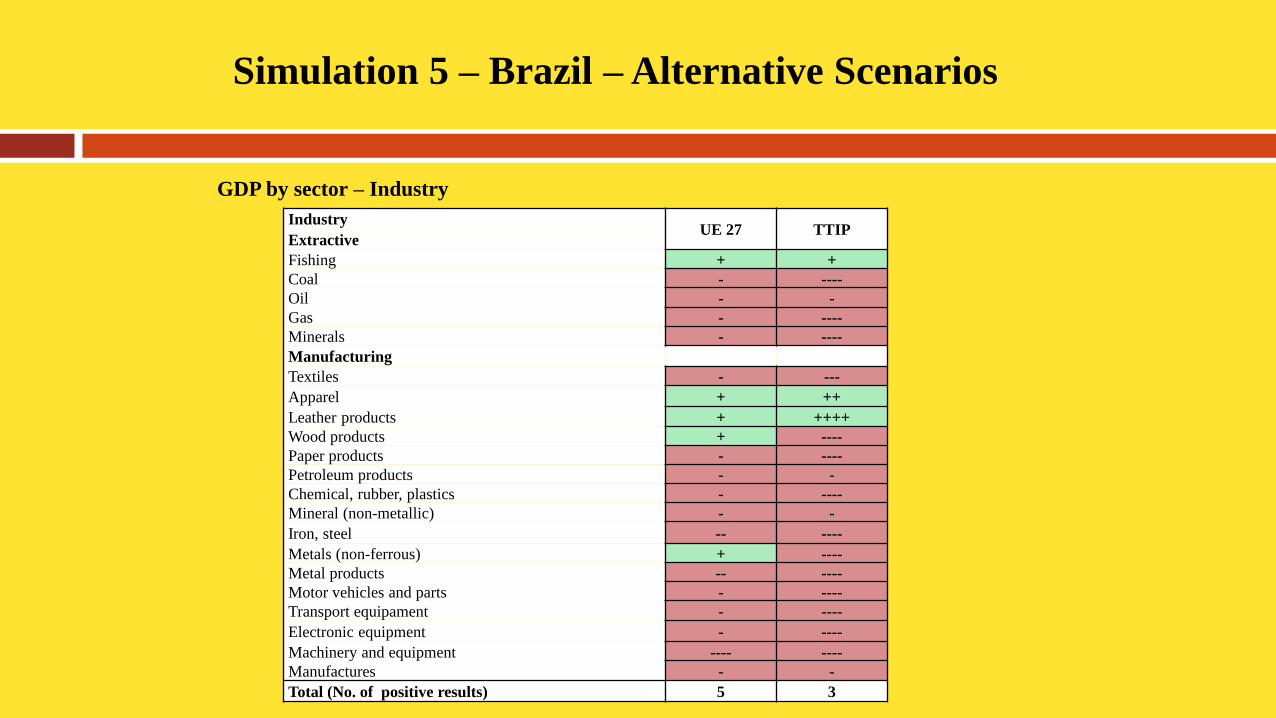
Simulation 5 – Brazil – Alternative Scenarios
GDP by sector – Industry
Industry
UE 27 TTIP Extractive
Fishing + +
Coal - ----
Oil - -
Gas - ----
Minerals - ----
Manufacturing
Textiles - ---
Apparel + ++
Leather products + ++++
Wood products + ----
Paper products - ----
Petroleum products - -
Chemical, rubber, plastics - ----
Mineral (non-metallic) - -
Iron, steel -- ----
Metals (non-ferrous) + ----
Metal products -- ----
Motor vehicles and parts - ----
Transport equipament - ----
Electronic equipment - ----
Machinery and equipment ---- ----
Manufactures - -
Total (No. of positive results) 5 3
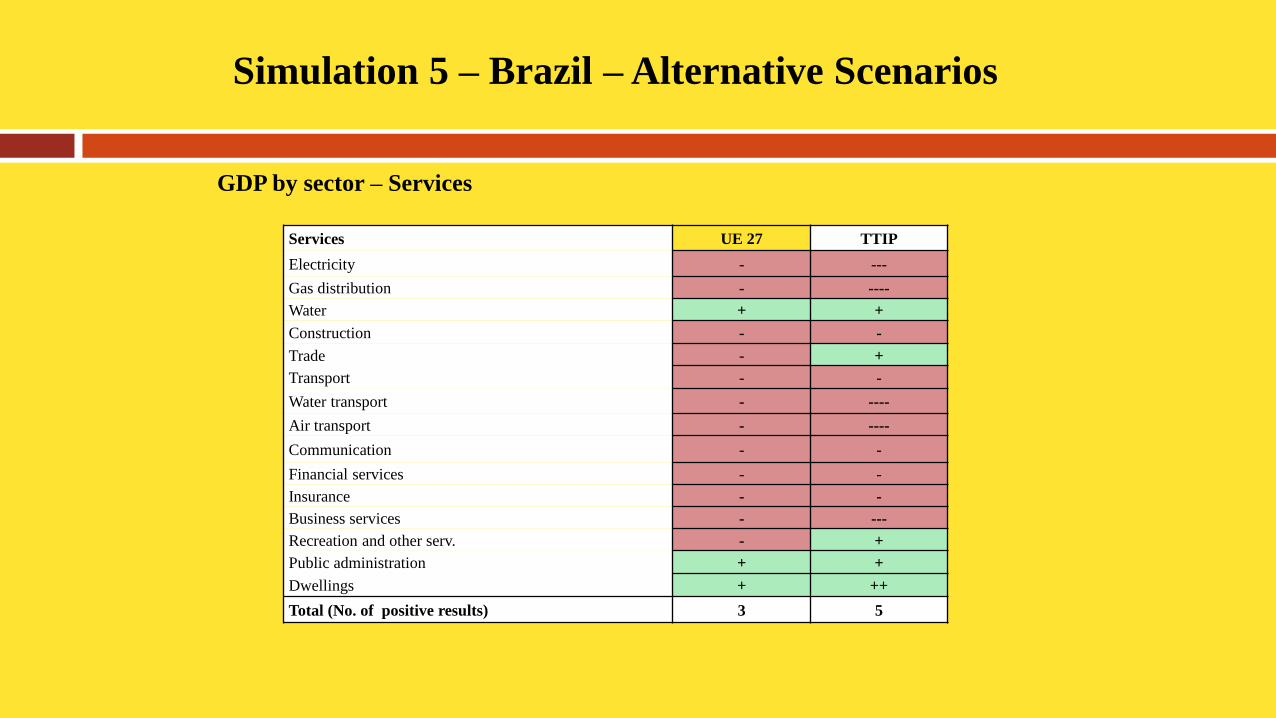
Simulation 5 – Brazil – Alternative Scenarios
GDP by sector – Services
Services UE 27 TTIP
Electricity - ---
Gas distribution - ----
Water + +
Construction - -
Trade - +
Transport - -
Water transport - ----
Air transport - ----
Communication - -
Financial services - -
Insurance - -
Business services - ---
Recreation and other serv. - +
Public administration + +
Dwellings + ++
Total (No. of positive results) 3 5
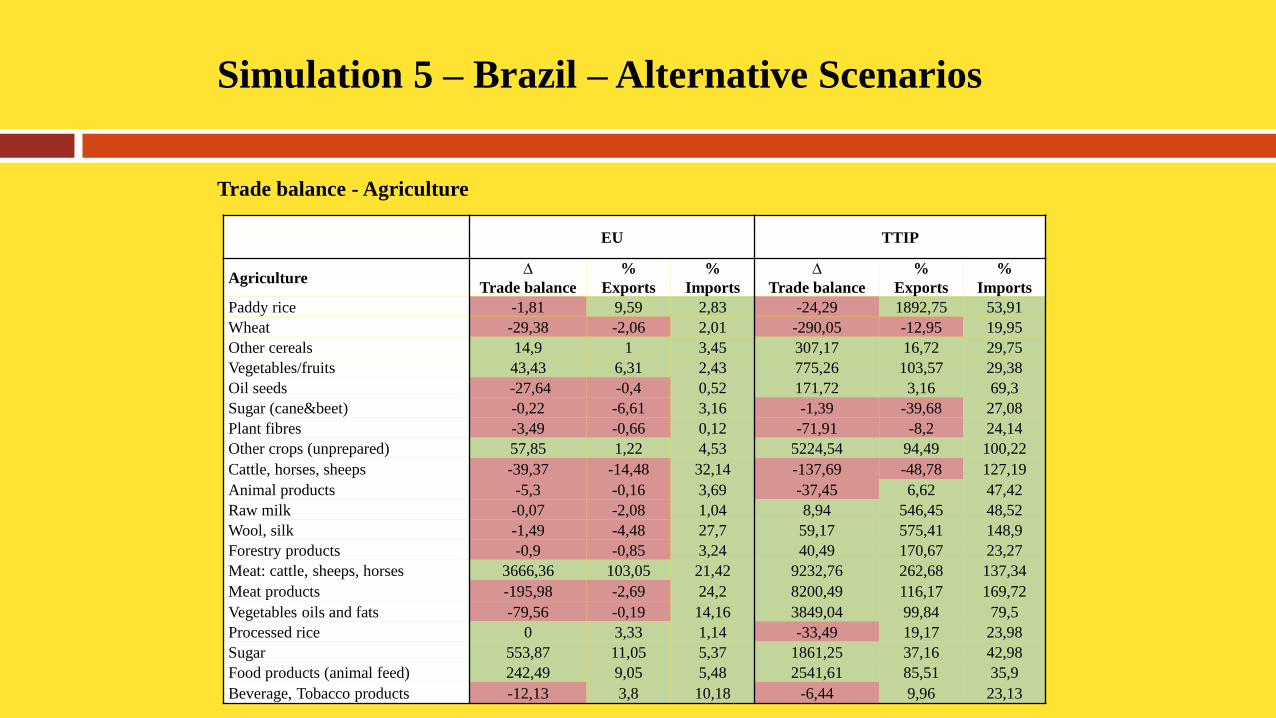
Simulation 5 – Brazil – Alternative Scenarios
Trade balance - Agriculture
EU TTIP
Agriculture ∆
Trade balance
%
Exports
%
Imports
∆
Trade balance
%
Exports
%
Imports
Paddy rice -1,81 9,59 2,83 -24,29 1892,75 53,91
Wheat -29,38 -2,06 2,01 -290,05 -12,95 19,95
Other cereals 14,9 1 3,45 307,17 16,72 29,75
Vegetables/fruits 43,43 6,31 2,43 775,26 103,57 29,38
Oil seeds -27,64 -0,4 0,52 171,72 3,16 69,3
Sugar (cane&beet) -0,22 -6,61 3,16 -1,39 -39,68 27,08
Plant fibres -3,49 -0,66 0,12 -71,91 -8,2 24,14
Other crops (unprepared) 57,85 1,22 4,53 5224,54 94,49 100,22
Cattle, horses, sheeps -39,37 -14,48 32,14 -137,69 -48,78 127,19
Animal products -5,3 -0,16 3,69 -37,45 6,62 47,42
Raw milk -0,07 -2,08 1,04 8,94 546,45 48,52
Wool, silk -1,49 -4,48 27,7 59,17 575,41 148,9
Forestry products -0,9 -0,85 3,24 40,49 170,67 23,27
Meat: cattle, sheeps, horses 3666,36 103,05 21,42 9232,76 262,68 137,34
Meat products -195,98 -2,69 24,2 8200,49 116,17 169,72
Vegetables oils and fats -79,56 -0,19 14,16 3849,04 99,84 79,5
Processed rice 0 3,33 1,14 -33,49 19,17 23,98
Sugar 553,87 11,05 5,37 1861,25 37,16 42,98
Food products (animal feed) 242,49 9,05 5,48 2541,61 85,51 35,9
Beverage, Tobacco products -12,13 3,8 10,18 -6,44 9,96 23,13
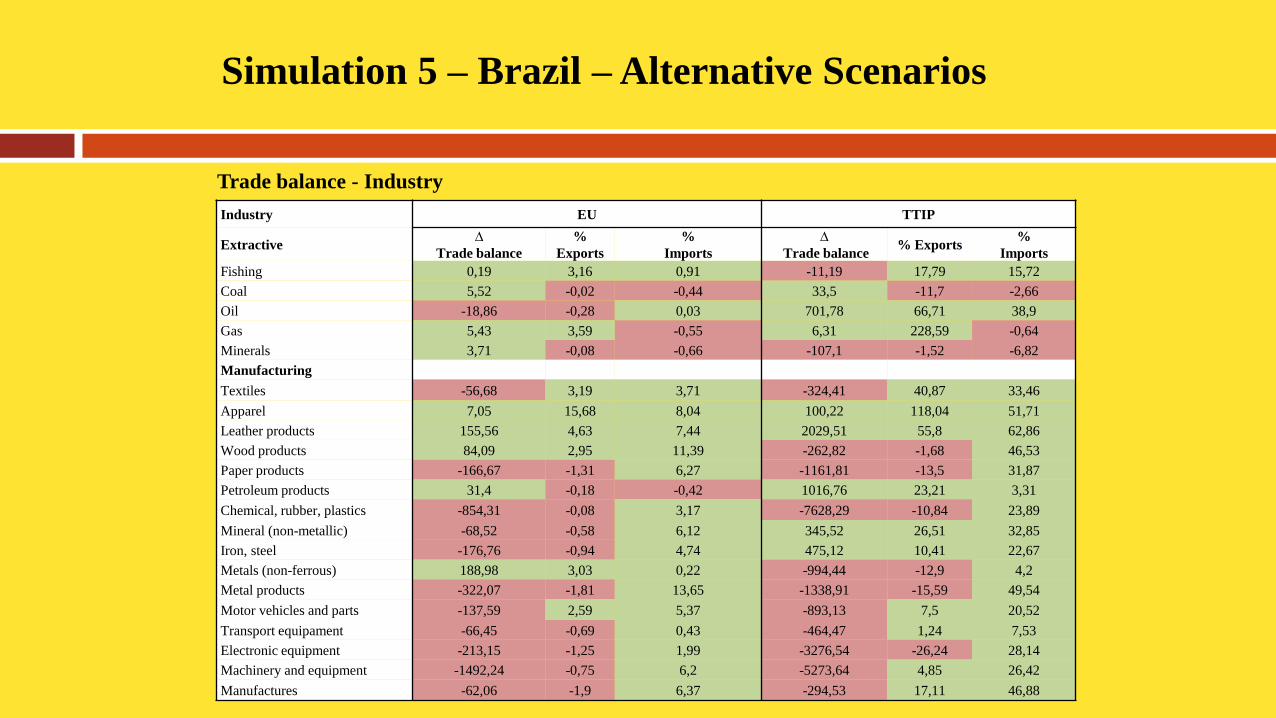
Simulation 5 – Brazil – Alternative Scenarios
Trade balance - Industry
Industry EU TTIP
Extractive ∆
Trade balance
%
Exports
%
Imports
∆
Trade balance % Exports
%
Imports
Fishing 0,19 3,16 0,91 -11,19 17,79 15,72
Coal 5,52 -0,02 -0,44 33,5 -11,7 -2,66
Oil -18,86 -0,28 0,03 701,78 66,71 38,9
Gas 5,43 3,59 -0,55 6,31 228,59 -0,64
Minerals 3,71 -0,08 -0,66 -107,1 -1,52 -6,82
Manufacturing
Textiles -56,68 3,19 3,71 -324,41 40,87 33,46
Apparel 7,05 15,68 8,04 100,22 118,04 51,71
Leather products 155,56 4,63 7,44 2029,51 55,8 62,86
Wood products 84,09 2,95 11,39 -262,82 -1,68 46,53
Paper products -166,67 -1,31 6,27 -1161,81 -13,5 31,87
Petroleum products 31,4 -0,18 -0,42 1016,76 23,21 3,31
Chemical, rubber, plastics -854,31 -0,08 3,17 -7628,29 -10,84 23,89
Mineral (non-metallic) -68,52 -0,58 6,12 345,52 26,51 32,85
Iron, steel -176,76 -0,94 4,74 475,12 10,41 22,67
Metals (non-ferrous) 188,98 3,03 0,22 -994,44 -12,9 4,2
Metal products -322,07 -1,81 13,65 -1338,91 -15,59 49,54
Motor vehicles and parts -137,59 2,59 5,37 -893,13 7,5 20,52
Transport equipament -66,45 -0,69 0,43 -464,47 1,24 7,53
Electronic equipment -213,15 -1,25 1,99 -3276,54 -26,24 28,14
Machinery and equipment -1492,24 -0,75 6,2 -5273,64 4,85 26,42
Manufactures -62,06 -1,9 6,37 -294,53 17,11 46,88
Simulation 5 – Brazil – Alternative Scenarios
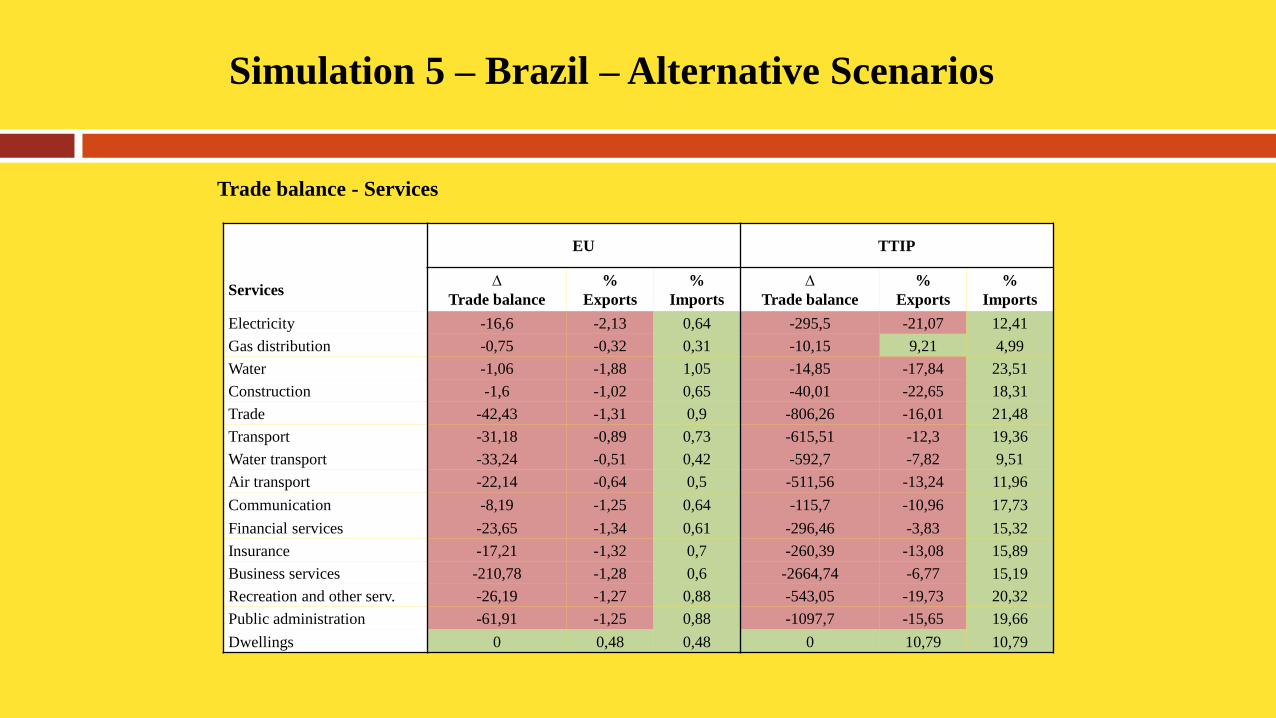
Trade balance - Services
EU TTIP
Services ∆
Trade balance
%
Exports
%
Imports
∆
Trade balance
%
Exports
%
Imports
Electricity -16,6 -2,13 0,64 -295,5 -21,07 12,41
Gas distribution -0,75 -0,32 0,31 -10,15 9,21 4,99
Water -1,06 -1,88 1,05 -14,85 -17,84 23,51
Construction -1,6 -1,02 0,65 -40,01 -22,65 18,31
Trade -42,43 -1,31 0,9 -806,26 -16,01 21,48
Transport -31,18 -0,89 0,73 -615,51 -12,3 19,36
Water transport -33,24 -0,51 0,42 -592,7 -7,82 9,51
Air transport -22,14 -0,64 0,5 -511,56 -13,24 11,96
Communication -8,19 -1,25 0,64 -115,7 -10,96 17,73
Financial services -23,65 -1,34 0,61 -296,46 -3,83 15,32
Insurance -17,21 -1,32 0,7 -260,39 -13,08 15,89
Business services -210,78 -1,28 0,6 -2664,74 -6,77 15,19
Recreation and other serv. -26,19 -1,27 0,88 -543,05 -19,73 20,32
Public administration -61,91 -1,25 0,88 -1097,7 -15,65 19,66
Dwellings 0 0,48 0,48 0 10,79 10,79
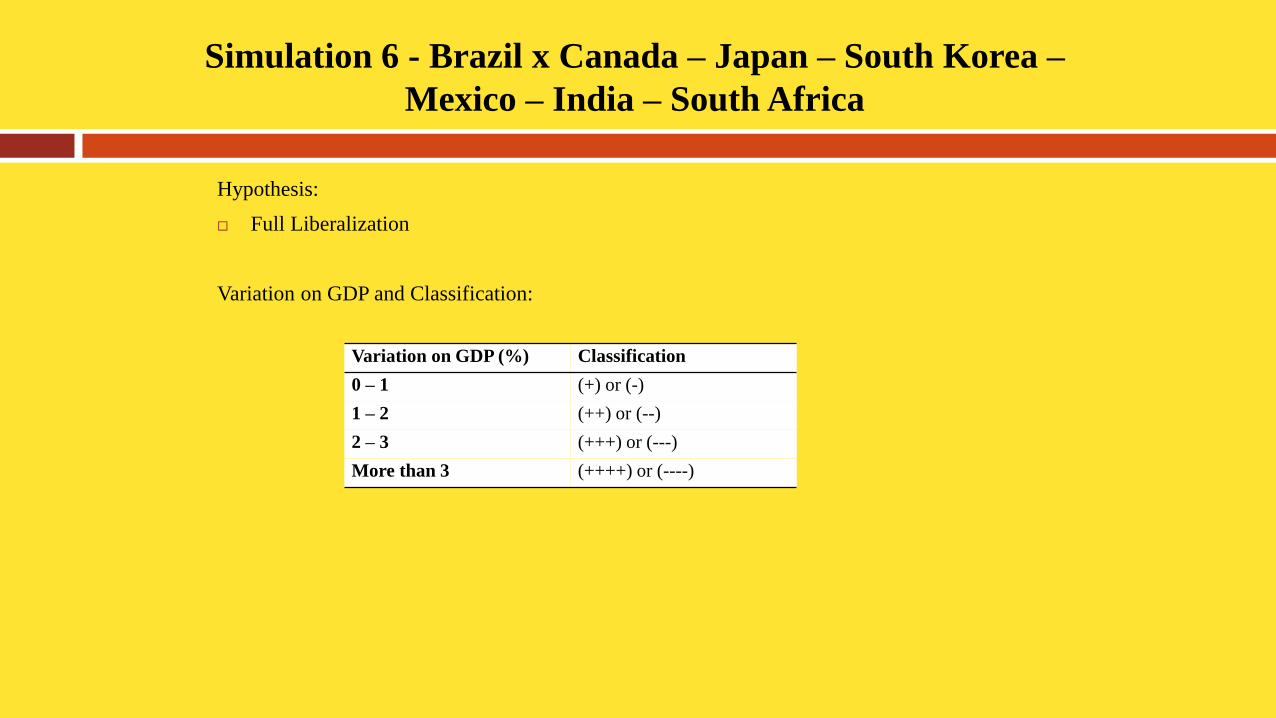
Simulation 6 - Brazil x Canada – Japan – South Korea –
Mexico – India – South Africa
Hypothesis:
Full Liberalization
Variation on GDP and Classification:
Variation on GDP (%) Classification
0 – 1 (+) or (-)
1 – 2 (++) or (--)
2 – 3 (+++) or (---)
More than 3 (++++) or (----)
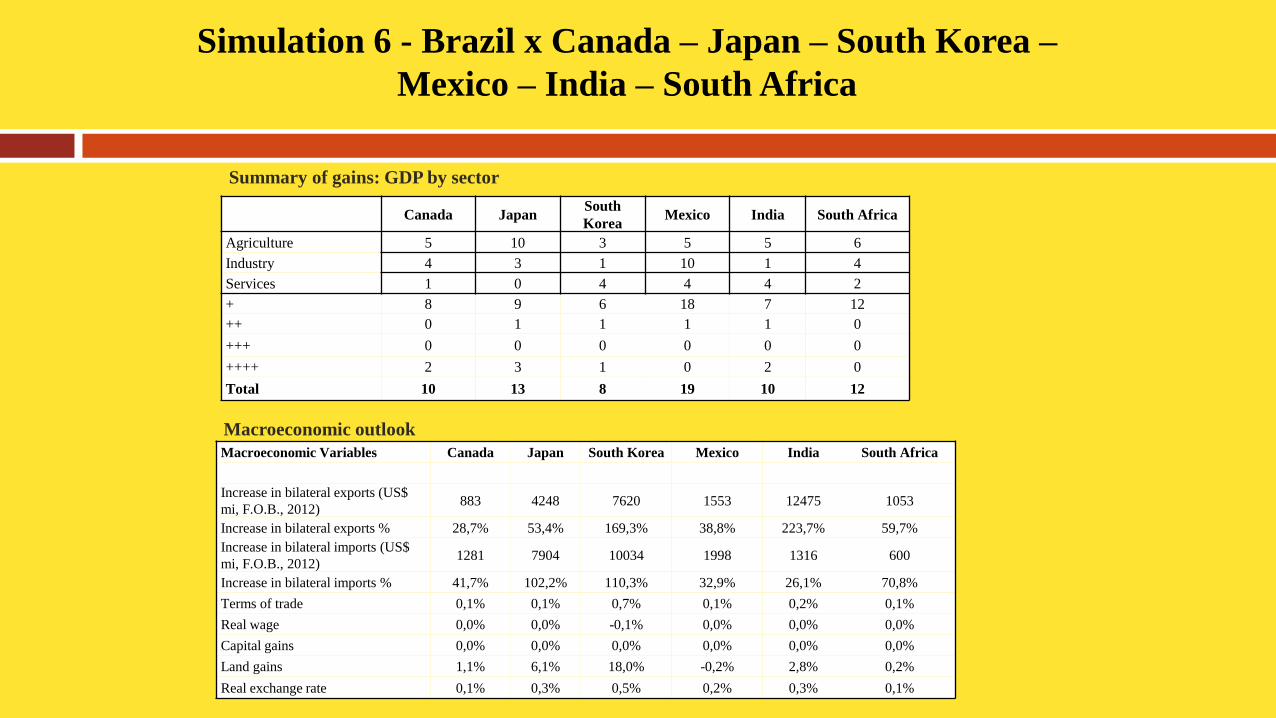
Simulation 6 - Brazil x Canada – Japan – South Korea –
Mexico – India – South Africa
Canada Japan South
Korea Mexico India South Africa
Agriculture 5 10 3 5 5 6
Industry 4 3 1 10 1 4
Services 1 0 4 4 4 2
+ 8 9 6 18 7 12
++ 0 1 1 1 1 0
+++ 0 0 0 0 0 0
++++ 2 3 1 0 2 0
Total 10 13 8 19 10 12
Summary of gains: GDP by sector
Macroeconomic outlook Macroeconomic Variables Canada Japan South Korea Mexico India South Africa
Increase in bilateral exports (US$
mi, F.O.B., 2012) 883 4248 7620 1553 12475 1053
Increase in bilateral exports % 28,7% 53,4% 169,3% 38,8% 223,7% 59,7%
Increase in bilateral imports (US$
mi, F.O.B., 2012) 1281 7904 10034 1998 1316 600
Increase in bilateral imports % 41,7% 102,2% 110,3% 32,9% 26,1% 70,8%
Terms of trade 0,1% 0,1% 0,7% 0,1% 0,2% 0,1%
Real wage 0,0% 0,0% -0,1% 0,0% 0,0% 0,0%
Capital gains 0,0% 0,0% 0,0% 0,0% 0,0% 0,0%
Land gains 1,1% 6,1% 18,0% -0,2% 2,8% 0,2%
Real exchange rate 0,1% 0,3% 0,5% 0,2% 0,3% 0,1%
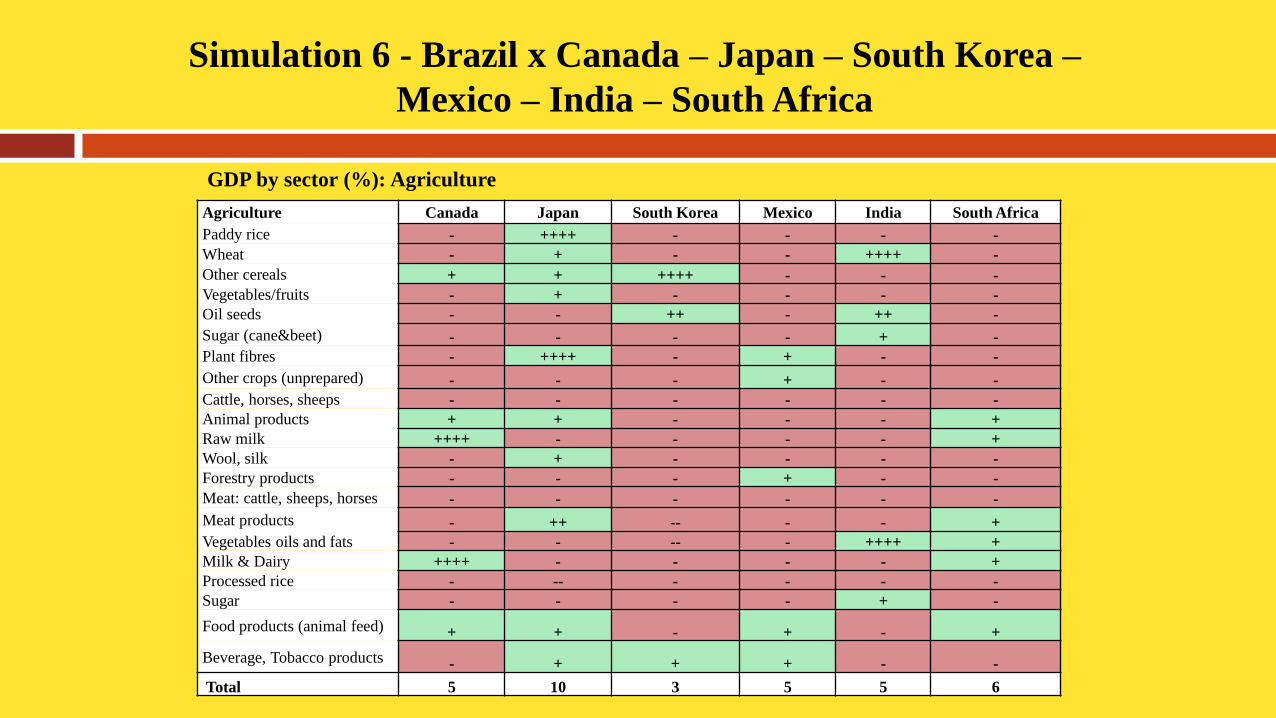
Simulation 6 - Brazil x Canada – Japan – South Korea –
Mexico – India – South Africa
Agriculture Canada Japan South Korea Mexico India South Africa
Paddy rice - ++++ - - - -
Wheat - + - - ++++ -
Other cereals + + ++++ - - -
Vegetables/fruits - + - - - -
Oil seeds - - ++ - ++ -
Sugar (cane&beet) - - - - + -
Plant fibres - ++++ - + - -
Other crops (unprepared) - - - + - -
Cattle, horses, sheeps - - - - - -
Animal products + + - - - +
Raw milk ++++ - - - - +
Wool, silk - + - - - -
Forestry products - - - + - -
Meat: cattle, sheeps, horses - - - - - -
Meat products - ++ -- - - +
Vegetables oils and fats - - -- - ++++ +
Milk & Dairy ++++ - - - - +
Processed rice - -- - - - -
Sugar - - - - + -
Food products (animal feed) + + - + - +
Beverage, Tobacco products - + + + - -
Total 5 10 3 5 5 6
GDP by sector (%): Agriculture
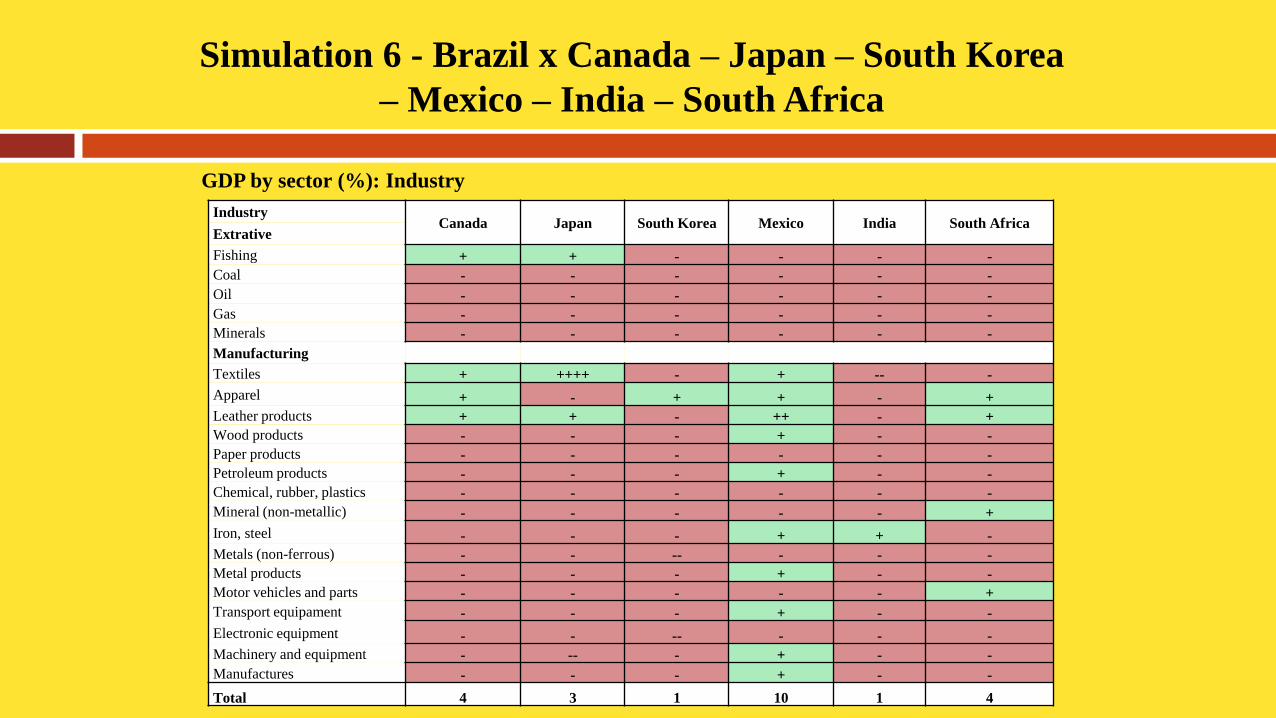
Simulation 6 - Brazil x Canada – Japan – South Korea
– Mexico – India – South Africa
Industry Canada Japan South Korea Mexico India South Africa
Extrative
Fishing + + - - - -
Coal - - - - - -
Oil - - - - - -
Gas - - - - - -
Minerals - - - - - -
Manufacturing
Textiles + ++++ - + -- -
Apparel + - + + - +
Leather products + + - ++ - +
Wood products - - - + - -
Paper products - - - - - -
Petroleum products - - - + - -
Chemical, rubber, plastics - - - - - -
Mineral (non-metallic) - - - - - +
Iron, steel - - - + + -
Metals (non-ferrous) - - -- - - -
Metal products - - - + - -
Motor vehicles and parts - - - - - +
Transport equipament - - - + - -
Electronic equipment - - -- - - -
Machinery and equipment - -- - + - -
Manufactures - - - + - -
Total 4 3 1 10 1 4
GDP by sector (%): Industry
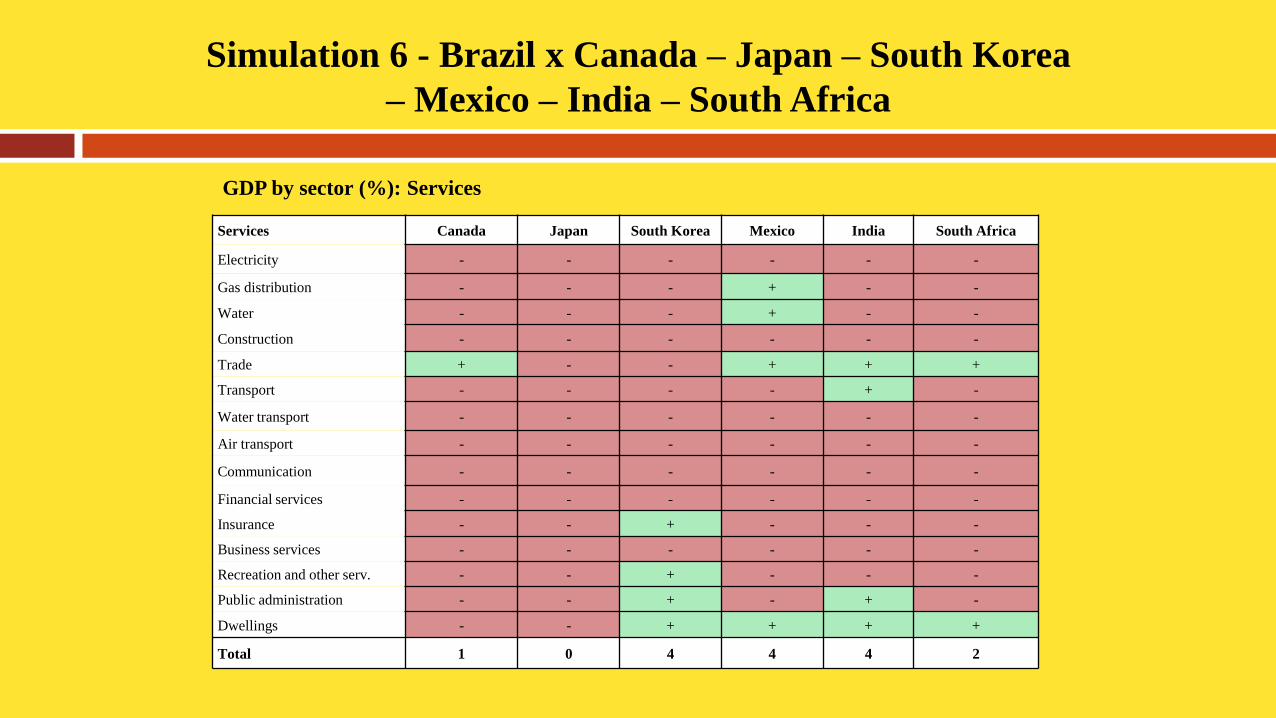
Simulation 6 - Brazil x Canada – Japan – South Korea
– Mexico – India – South Africa
Services Canada Japan South Korea Mexico India South Africa
Electricity - - - - - -
Gas distribution - - - + - -
Water - - - + - -
Construction - - - - - -
Trade + - - + + +
Transport - - - - + -
Water transport - - - - - -
Air transport - - - - - -
Communication - - - - - -
Financial services - - - - - -
Insurance - - + - - -
Business services - - - - - -
Recreation and other serv. - - + - - -
Public administration - - + - + -
Dwellings - - + + + +
Total 1 0 4 4 4 2
GDP by sector (%): Services
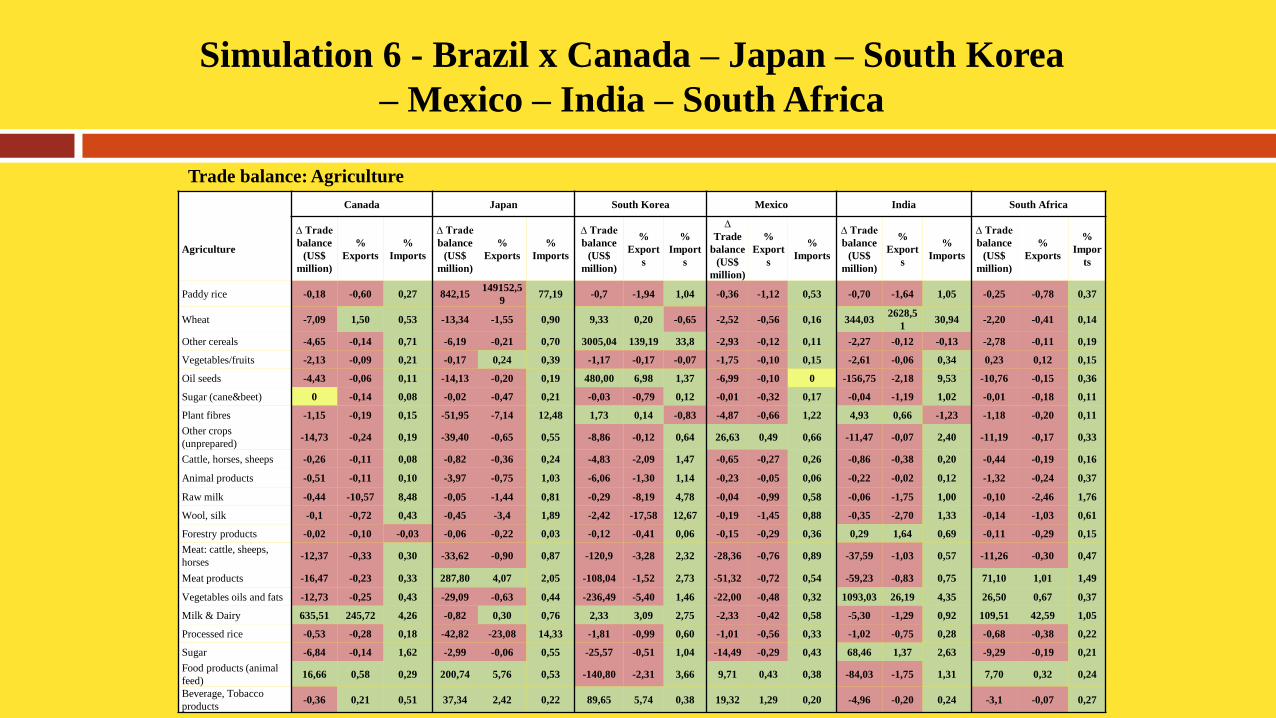
Simulation 6 - Brazil x Canada – Japan – South Korea
– Mexico – India – South Africa
Canada Japan South Korea Mexico India South Africa
Agriculture
∆ Trade
balance
(US$
million)
%
Exports
%
Imports
∆ Trade
balance
(US$
million)
%
Exports
%
Imports
∆ Trade
balance
(US$
million)
%
Export
s
%
Import
s
∆
Trade
balance
(US$
million)
%
Export
s
%
Imports
∆ Trade
balance
(US$
million)
%
Export
s
%
Imports
∆ Trade
balance
(US$
million)
%
Exports
%
Impor
ts
Paddy rice -0,18 -0,60 0,27 842,15 149152,5
9 77,19 -0,7 -1,94 1,04 -0,36 -1,12 0,53 -0,70 -1,64 1,05 -0,25 -0,78 0,37
Wheat -7,09 1,50 0,53 -13,34 -1,55 0,90 9,33 0,20 -0,65 -2,52 -0,56 0,16 344,03 2628,5
1 30,94 -2,20 -0,41 0,14
Other cereals -4,65 -0,14 0,71 -6,19 -0,21 0,70 3005,04 139,19 33,8 -2,93 -0,12 0,11 -2,27 -0,12 -0,13 -2,78 -0,11 0,19
Vegetables/fruits -2,13 -0,09 0,21 -0,17 0,24 0,39 -1,17 -0,17 -0,07 -1,75 -0,10 0,15 -2,61 -0,06 0,34 0,23 0,12 0,15
Oil seeds -4,43 -0,06 0,11 -14,13 -0,20 0,19 480,00 6,98 1,37 -6,99 -0,10 0 -156,75 -2,18 9,53 -10,76 -0,15 0,36
Sugar (cane&beet) 0 -0,14 0,08 -0,02 -0,47 0,21 -0,03 -0,79 0,12 -0,01 -0,32 0,17 -0,04 -1,19 1,02 -0,01 -0,18 0,11
Plant fibres -1,15 -0,19 0,15 -51,95 -7,14 12,48 1,73 0,14 -0,83 -4,87 -0,66 1,22 4,93 0,66 -1,23 -1,18 -0,20 0,11
Other crops
(unprepared) -14,73 -0,24 0,19 -39,40 -0,65 0,55 -8,86 -0,12 0,64 26,63 0,49 0,66 -11,47 -0,07 2,40 -11,19 -0,17 0,33
Cattle, horses, sheeps -0,26 -0,11 0,08 -0,82 -0,36 0,24 -4,83 -2,09 1,47 -0,65 -0,27 0,26 -0,86 -0,38 0,20 -0,44 -0,19 0,16
Animal products -0,51 -0,11 0,10 -3,97 -0,75 1,03 -6,06 -1,30 1,14 -0,23 -0,05 0,06 -0,22 -0,02 0,12 -1,32 -0,24 0,37
Raw milk -0,44 -10,57 8,48 -0,05 -1,44 0,81 -0,29 -8,19 4,78 -0,04 -0,99 0,58 -0,06 -1,75 1,00 -0,10 -2,46 1,76
Wool, silk -0,1 -0,72 0,43 -0,45 -3,4 1,89 -2,42 -17,58 12,67 -0,19 -1,45 0,88 -0,35 -2,70 1,33 -0,14 -1,03 0,61
Forestry products -0,02 -0,10 -0,03 -0,06 -0,22 0,03 -0,12 -0,41 0,06 -0,15 -0,29 0,36 0,29 1,64 0,69 -0,11 -0,29 0,15
Meat: cattle, sheeps,
horses -12,37 -0,33 0,30 -33,62 -0,90 0,87 -120,9 -3,28 2,32 -28,36 -0,76 0,89 -37,59 -1,03 0,57 -11,26 -0,30 0,47
Meat products -16,47 -0,23 0,33 287,80 4,07 2,05 -108,04 -1,52 2,73 -51,32 -0,72 0,54 -59,23 -0,83 0,75 71,10 1,01 1,49
Vegetables oils and fats -12,73 -0,25 0,43 -29,09 -0,63 0,44 -236,49 -5,40 1,46 -22,00 -0,48 0,32 1093,03 26,19 4,35 26,50 0,67 0,37
Milk & Dairy 635,51 245,72 4,26 -0,82 0,30 0,76 2,33 3,09 2,75 -2,33 -0,42 0,58 -5,30 -1,29 0,92 109,51 42,59 1,05
Processed rice -0,53 -0,28 0,18 -42,82 -23,08 14,33 -1,81 -0,99 0,60 -1,01 -0,56 0,33 -1,02 -0,75 0,28 -0,68 -0,38 0,22
Sugar -6,84 -0,14 1,62 -2,99 -0,06 0,55 -25,57 -0,51 1,04 -14,49 -0,29 0,43 68,46 1,37 2,63 -9,29 -0,19 0,21
Food products (animal
feed) 16,66 0,58 0,29 200,74 5,76 0,53 -140,80 -2,31 3,66 9,71 0,43 0,38 -84,03 -1,75 1,31 7,70 0,32 0,24
Beverage, Tobacco
products -0,36 0,21 0,51 37,34 2,42 0,22 89,65 5,74 0,38 19,32 1,29 0,20 -4,96 -0,20 0,24 -3,1 -0,07 0,27
Trade balance: Agriculture

Simulation 6 - Brazil x Canada – Japan – South Korea
– Mexico – India – South Africa
Industry Canada Japan South Korea Mexico India South Africa
Extrative
∆ Trade
balance
(US$
million)
%
Export
s
%
Imports
∆ Trade
balance
(US$
million)
%
Export
s
%
Import
s
∆ Trade
balance
(US$
million)
%
Export
s
%
Imports
∆ Trade
balance
(US$
million)
%
Export
s
%
Imports
∆ Trade
balance
(US$
million)
%
Export
s
%
Import
s
∆ Trade
balance
(US$
million)
%
Exports
%
Imports
Fishing -0,17 -0,1 0,11 -0,42 -0,13 0,32 -1,22 -0,2 0,99 -0,30 -0,16 0,20 -0,33 -0,16 0,23 -0,21 -0,11 0,14
Coal 0,81 0 -0,06 2,74 0 -0,22 3,42 0 -0,27 -0,75 -0,19 0,06 -0,03 -0,12 0 0,70 -0,02 -0,06
Oil -3,76 -0,05 0,01 -8,74 -0,12 0,02 -13,11 0,01 0,16 -36,71 -0,32 0,21 -20,49 -0,21 0,09 -7,48 -0,09 0,03
Gas 0,74 0,47 -0,08 1,33 0,86 -0,14 3,79 2,52 -0,39 -0,57 -0,78 0,06 0,42 0,02 -0,04 0,67 0,34 -0,07
Minerals 0,32 -0,02 -0,11 8,20 -0,01 -0,36 -0,12 -0,06 -0,39 -7,60 -0,04 -0,02 24,68 0,10 -0,13 -2,41 -0,02 -0,07
Manufacturing
Textiles 4,17 0,93 0,35 1216,89 87,36 4,22 -151,26 -0,45 5,09 80,88 6,86 0,85 -175,07 0,60 6,49 -8,37 0,80 0,73
Apparel 0,38 0,90 0,47 -3,57 0,62 1,04 -7,25 -0,46 1,08 29,92 10,65 0,76 -27,31 0,23 5,24 4,40 3,05 1,00
Leather products 37,14 0,92 0,4 98,40 2,41 0,91 -58,72 -1,18 1,40 202,00 4,85 1,08 -34,72 -0,69 0,86 55,62 1,41 0,85
Wood products -7,7 -0,12 0,62 -50,18 -0,69 4,91 -40,92 -0,85 0,88 20,52 0,56 1,05 -41,63 -0,87 0,79 0,49 0,04 0,34
Paper products -67,49 -0,14 3,61 -44,15 -0,64 0,87 -55,14 -1 0,55 -28,97 -0,48 0,42 -39,66 -0,71 0,42 -20,26 -0,32 0,32
Petroleum products 2,30 -0,03 -0,04 9,25 -0,07 -0,14 0,81 -0,16 -0,10 33,03 0,66 0,05 -9,71 -0,04 0,07 4,14 0,02 -0,03
Chemical, rubber,
plastics -65,68 -0,15 0,18 -310,76 -0,54 0,93 -308,54 -0,79 0,81 -133,62 0,91 0,90 -152,35 0,55 0,81 -103,37 -0,16 0,32
Mineral (non-metallic) -3,39 0,01 0,42 -22,05 -0,55 1,00 -24,44 -0,68 0,91 2,97 0,68 1,51 -15,98 -0,24 1,14 6,30 0,43 0,46
Iron, steel -24,03 -0,25 0,08 -66,66 -0,48 1,20 -91,37 -0,78 1,10 37,48 0,56 0,63 132,97 1,76 1,15 -71,83 -0,26 2,48
Metals (non-ferrous) -25,77 -0,36 0,06 -27,28 -0,62 -0,35 -57,61 -1,21 -0,57 -23,29 -0,18 0,32 -66,25 -0,99 0,05 -38,49 -0,47 0,21
Metal products -24,12 -0,17 0,99 -147,8 -0,86 6,23 -76,22 -1,34 2,42 34,90 3,09 1,10 -44,82 -0,51 1,67 -7,40 0,16 0,49
Motor vehicles and parts -13,7 0,05 0,21 -420,58 0,32 4,73 -460,52 0,22 4,99 -2,15 0,17 0,29 -83,50 -0,32 0,35 342,28 2,82 0,85
Transport equipament -14,22 -0,06 0,16 -13,84 0,83 0,81 -38,49 -0,63 0,08 27,91 0,97 0,32 -43,52 -0,82 0,01 -20,62 -0,39 0,01
Electronic equipment -49,29 -0,33 0,45 -100,99 -0,71 0,90 -487,47 -0,31 5,48 -54,04 0,14 0,67 -83,20 -1,00 0,60 -39,58 -0,49 0,28
Machinery and
equipment -164,31 -0,31 0,55 -788,59 -0,18 3,41 -424,13 -0,67 1,49 180,76 2,25 0,54 -64,63 0,72 0,72 -56,64 0,02 0,27
Manufactures -5,94 -0,14 0,64 -20,69 -0,86 1,98 -23,06 -1,37 1,95 14,35 4,64 1,20 -21,75 -0,26 2,49 -6,36 -0,24 0,62
Trade balance: Industry
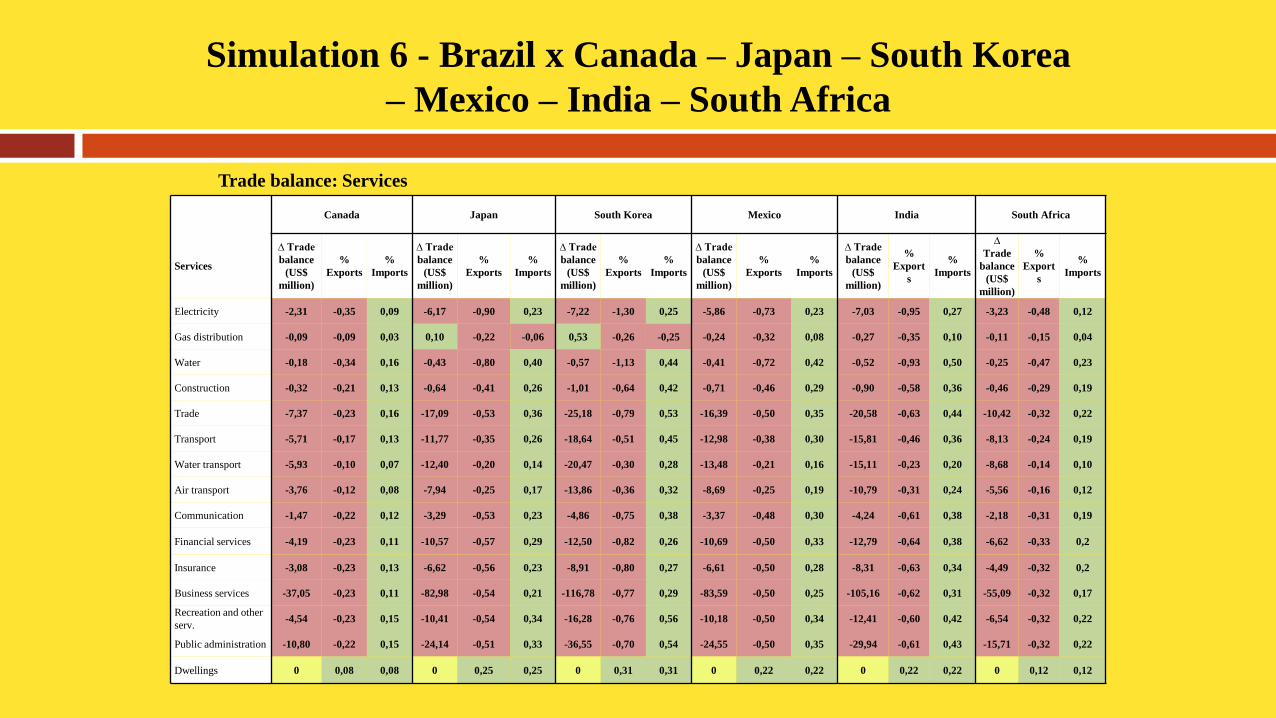
Simulation 6 - Brazil x Canada – Japan – South Korea
– Mexico – India – South Africa
Canada Japan South Korea Mexico India South Africa
Services
∆ Trade
balance
(US$
million)
%
Exports
%
Imports
∆ Trade
balance
(US$
million)
%
Exports
%
Imports
∆ Trade
balance
(US$
million)
%
Exports
%
Imports
∆ Trade
balance
(US$
million)
%
Exports
%
Imports
∆ Trade
balance
(US$
million)
%
Export
s
%
Imports
∆
Trade
balance
(US$
million)
%
Export
s
%
Imports
Electricity -2,31 -0,35 0,09 -6,17 -0,90 0,23 -7,22 -1,30 0,25 -5,86 -0,73 0,23 -7,03 -0,95 0,27 -3,23 -0,48 0,12
Gas distribution -0,09 -0,09 0,03 0,10 -0,22 -0,06 0,53 -0,26 -0,25 -0,24 -0,32 0,08 -0,27 -0,35 0,10 -0,11 -0,15 0,04
Water -0,18 -0,34 0,16 -0,43 -0,80 0,40 -0,57 -1,13 0,44 -0,41 -0,72 0,42 -0,52 -0,93 0,50 -0,25 -0,47 0,23
Construction -0,32 -0,21 0,13 -0,64 -0,41 0,26 -1,01 -0,64 0,42 -0,71 -0,46 0,29 -0,90 -0,58 0,36 -0,46 -0,29 0,19
Trade -7,37 -0,23 0,16 -17,09 -0,53 0,36 -25,18 -0,79 0,53 -16,39 -0,50 0,35 -20,58 -0,63 0,44 -10,42 -0,32 0,22
Transport -5,71 -0,17 0,13 -11,77 -0,35 0,26 -18,64 -0,51 0,45 -12,98 -0,38 0,30 -15,81 -0,46 0,36 -8,13 -0,24 0,19
Water transport -5,93 -0,10 0,07 -12,40 -0,20 0,14 -20,47 -0,30 0,28 -13,48 -0,21 0,16 -15,11 -0,23 0,20 -8,68 -0,14 0,10
Air transport -3,76 -0,12 0,08 -7,94 -0,25 0,17 -13,86 -0,36 0,32 -8,69 -0,25 0,19 -10,79 -0,31 0,24 -5,56 -0,16 0,12
Communication -1,47 -0,22 0,12 -3,29 -0,53 0,23 -4,86 -0,75 0,38 -3,37 -0,48 0,30 -4,24 -0,61 0,38 -2,18 -0,31 0,19
Financial services -4,19 -0,23 0,11 -10,57 -0,57 0,29 -12,50 -0,82 0,26 -10,69 -0,50 0,33 -12,79 -0,64 0,38 -6,62 -0,33 0,2
Insurance -3,08 -0,23 0,13 -6,62 -0,56 0,23 -8,91 -0,80 0,27 -6,61 -0,50 0,28 -8,31 -0,63 0,34 -4,49 -0,32 0,2
Business services -37,05 -0,23 0,11 -82,98 -0,54 0,21 -116,78 -0,77 0,29 -83,59 -0,50 0,25 -105,16 -0,62 0,31 -55,09 -0,32 0,17
Recreation and other
serv. -4,54 -0,23 0,15 -10,41 -0,54 0,34 -16,28 -0,76 0,56 -10,18 -0,50 0,34 -12,41 -0,60 0,42 -6,54 -0,32 0,22
Public administration -10,80 -0,22 0,15 -24,14 -0,51 0,33 -36,55 -0,70 0,54 -24,55 -0,50 0,35 -29,94 -0,61 0,43 -15,71 -0,32 0,22
Dwellings 0 0,08 0,08 0 0,25 0,25 0 0,31 0,31 0 0,22 0,22 0 0,22 0,22 0 0,12 0,12
Trade balance: Services
Simulation 7 - Brazil x Canada – Japan – South Korea –
Mexico – India – South Africa
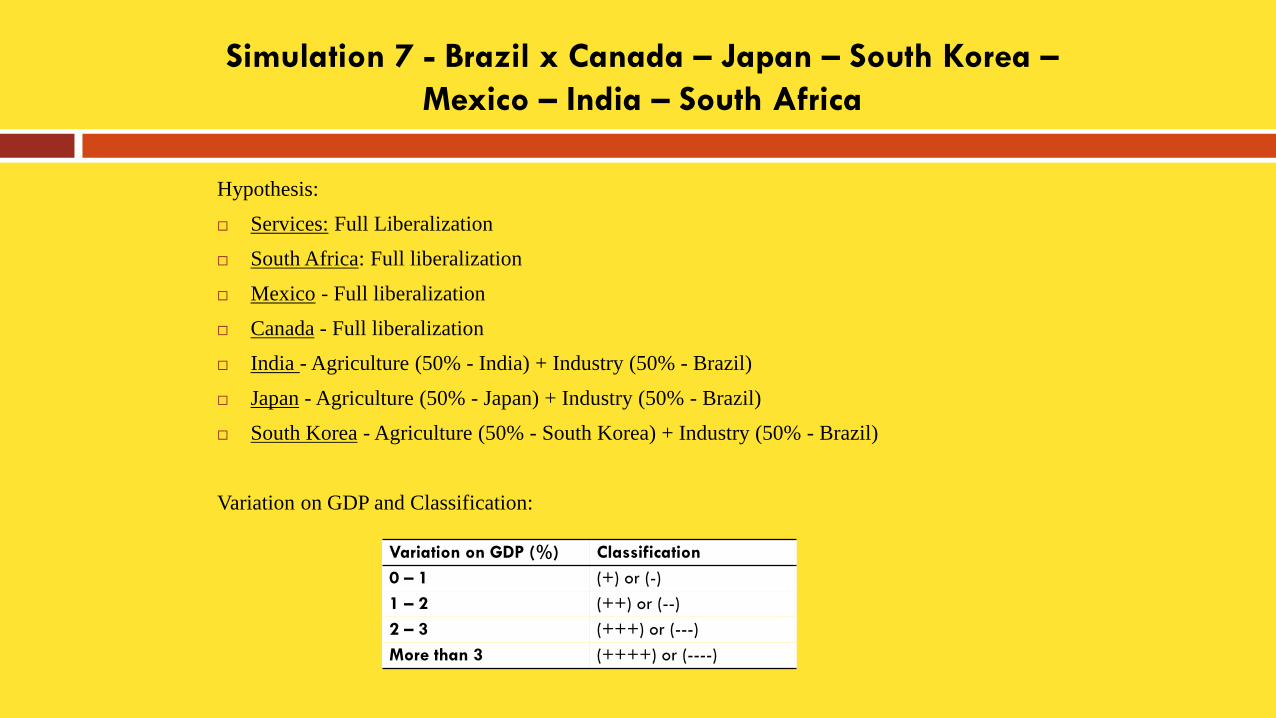
Hypothesis:
Services: Full Liberalization
South Africa: Full liberalization
Mexico - Full liberalization
Canada - Full liberalization
India - Agriculture (50% - India) + Industry (50% - Brazil)
Japan - Agriculture (50% - Japan) + Industry (50% - Brazil)
South Korea - Agriculture (50% - South Korea) + Industry (50% - Brazil)
Variation on GDP and Classification:
Variation on GDP (%) Classification
0 – 1 (+) or (-)
1 – 2 (++) or (--)
2 – 3 (+++) or (---)
More than 3 (++++) or (----)
Simulation 7 - Brazil x Canada – Japan – South
Korea – Mexico – India – South Africa
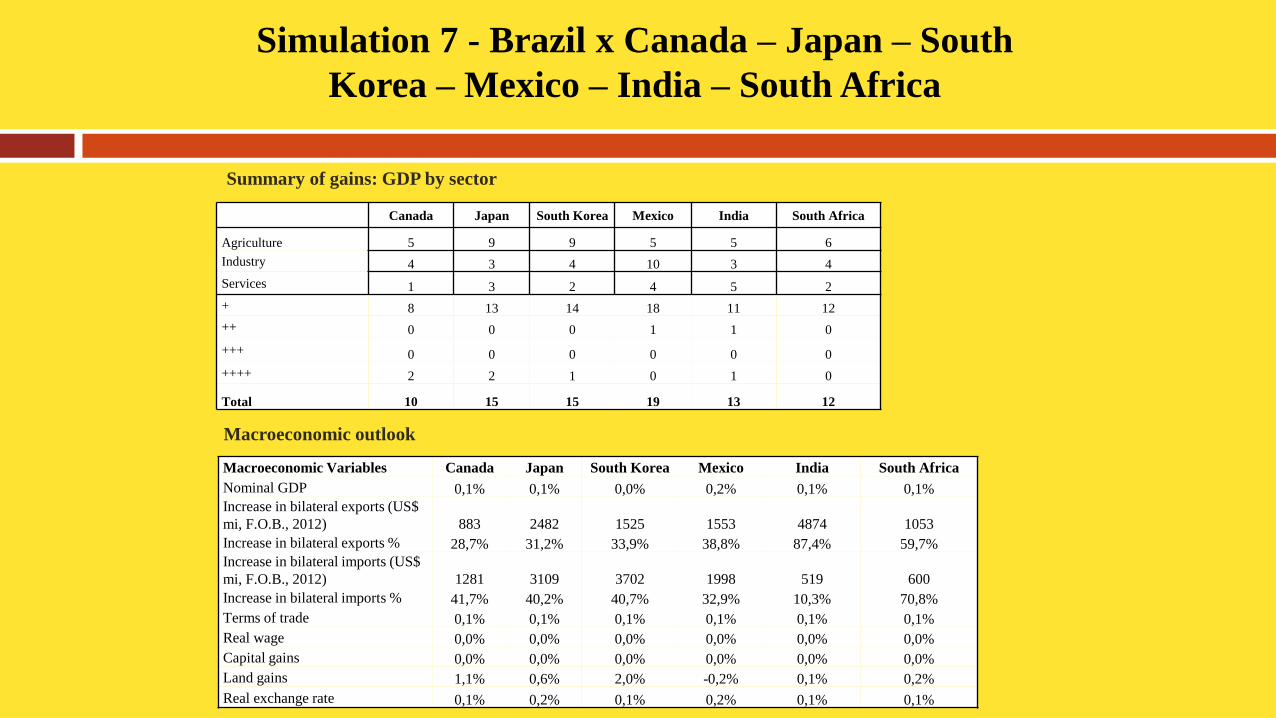
Canada Japan South Korea Mexico India South Africa
Agriculture 5 9 9 5 5 6
Industry 4 3 4 10 3 4
Services 1 3 2 4 5 2
+ 8 13 14 18 11 12
++ 0 0 0 1 1 0
+++ 0 0 0 0 0 0
++++ 2 2 1 0 1 0
Total 10 15 15 19 13 12
Summary of gains: GDP by sector
Macroeconomic outlook
Macroeconomic Variables Canada Japan South Korea Mexico India South Africa
Nominal GDP 0,1% 0,1% 0,0% 0,2% 0,1% 0,1%
Increase in bilateral exports (US$
mi, F.O.B., 2012) 883 2482 1525 1553 4874 1053
Increase in bilateral exports % 28,7% 31,2% 33,9% 38,8% 87,4% 59,7%
Increase in bilateral imports (US$
mi, F.O.B., 2012) 1281 3109 3702 1998 519 600
Increase in bilateral imports % 41,7% 40,2% 40,7% 32,9% 10,3% 70,8%
Terms of trade 0,1% 0,1% 0,1% 0,1% 0,1% 0,1%
Real wage 0,0% 0,0% 0,0% 0,0% 0,0% 0,0%
Capital gains 0,0% 0,0% 0,0% 0,0% 0,0% 0,0%
Land gains 1,1% 0,6% 2,0% -0,2% 0,1% 0,2%
Real exchange rate 0,1% 0,2% 0,1% 0,2% 0,1% 0,1%
Simulation 7 - Brazil x Canada – Japan – South Korea
– Mexico – India – South Africa
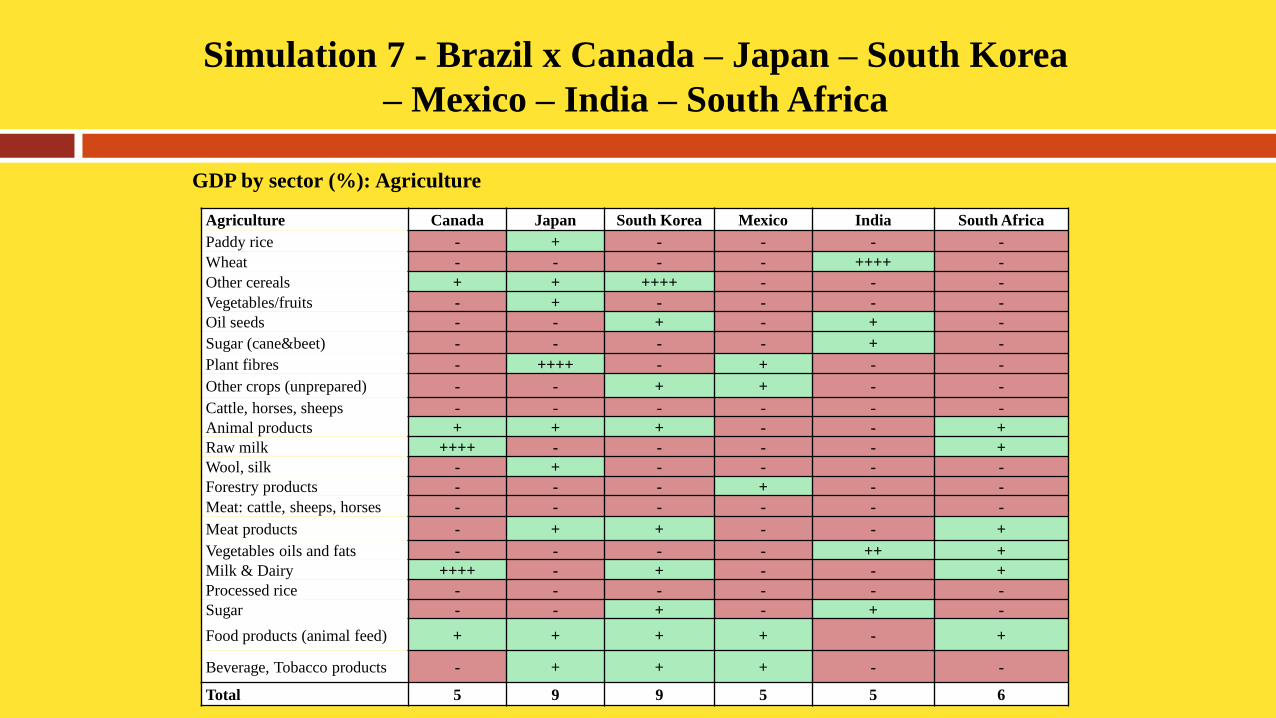
Agriculture Canada Japan South Korea Mexico India South Africa
Paddy rice - + - - - -
Wheat - - - - ++++ -
Other cereals + + ++++ - - -
Vegetables/fruits - + - - - -
Oil seeds - - + - + -
Sugar (cane&beet) - - - - + -
Plant fibres - ++++ - + - -
Other crops (unprepared) - - + + - -
Cattle, horses, sheeps - - - - - -
Animal products + + + - - +
Raw milk ++++ - - - - +
Wool, silk - + - - - -
Forestry products - - - + - -
Meat: cattle, sheeps, horses - - - - - -
Meat products - + + - - +
Vegetables oils and fats - - - - ++ +
Milk & Dairy ++++ - + - - +
Processed rice - - - - - -
Sugar - - + - + -
Food products (animal feed) + + + + - +
Beverage, Tobacco products - + + + - -
Total 5 9 9 5 5 6
GDP by sector (%): Agriculture
Simulation 7 - Brazil x Canada – Japan – South Korea
– Mexico – India – South Africa
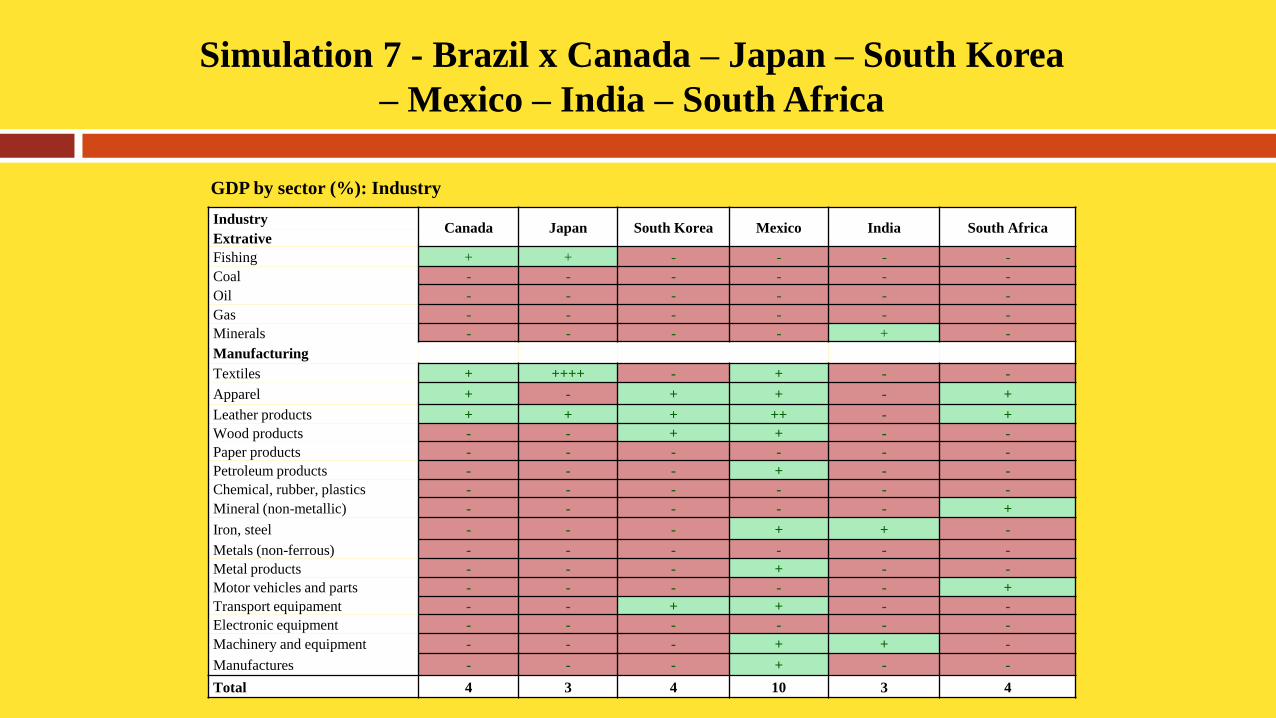
Industry Canada Japan South Korea Mexico India South Africa
Extrative
Fishing + + - - - -
Coal - - - - - -
Oil - - - - - -
Gas - - - - - -
Minerals - - - - + -
Manufacturing
Textiles + ++++ - + - -
Apparel + - + + - +
Leather products + + + ++ - +
Wood products - - + + - -
Paper products - - - - - -
Petroleum products - - - + - -
Chemical, rubber, plastics - - - - - -
Mineral (non-metallic) - - - - - +
Iron, steel - - - + + -
Metals (non-ferrous) - - - - - -
Metal products - - - + - -
Motor vehicles and parts - - - - - +
Transport equipament - - + + - -
Electronic equipment - - - - - -
Machinery and equipment - - - + + -
Manufactures - - - + - -
Total 4 3 4 10 3 4
GDP by sector (%): Industry
Simulation 7 - Brazil x Canada – Japan – South Korea
– Mexico – India – South Africa
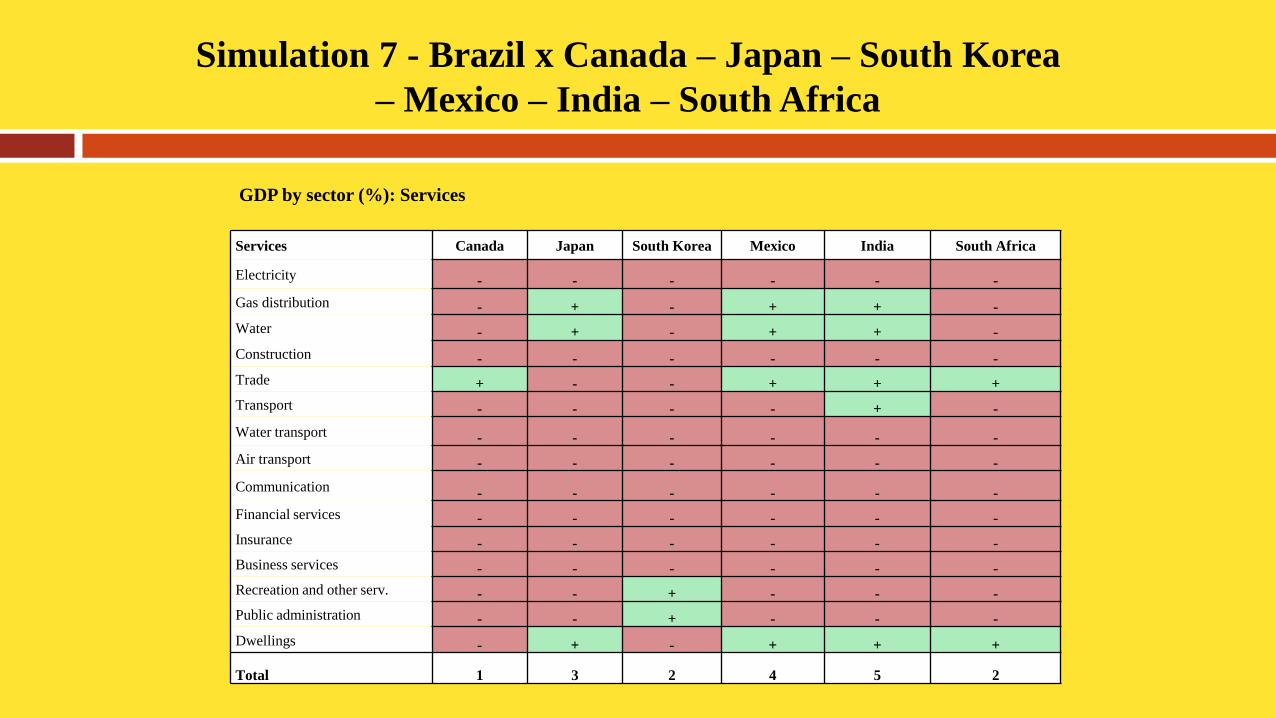
Services Canada Japan South Korea Mexico India South Africa
Electricity - - - - - -
Gas distribution - + - + + -
Water - + - + + -
Construction - - - - - -
Trade + - - + + +
Transport - - - - + -
Water transport - - - - - -
Air transport - - - - - -
Communication - - - - - -
Financial services - - - - - -
Insurance - - - - - -
Business services - - - - - -
Recreation and other serv. - - + - - -
Public administration - - + - - -
Dwellings - + - + + +
Total 1 3 2 4 5 2
GDP by sector (%): Services
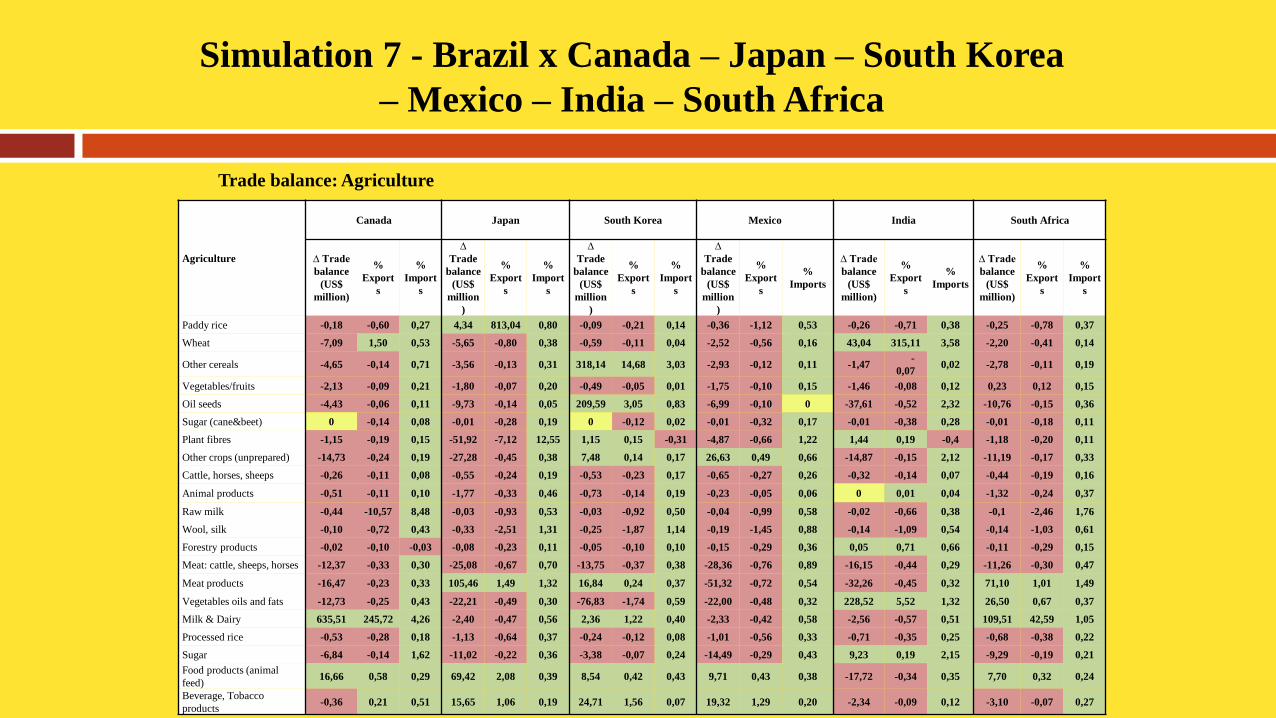
Simulation 7 - Brazil x Canada – Japan – South Korea
– Mexico – India – South Africa
Agriculture
Canada Japan South Korea Mexico India South Africa
∆ Trade
balance
(US$
million)
%
Export
s
%
Import
s
∆
Trade
balance
(US$
million
)
%
Export
s
%
Import
s
∆
Trade
balance
(US$
million
)
%
Export
s
%
Import
s
∆
Trade
balance
(US$
million
)
%
Export
s
%
Imports
∆ Trade
balance
(US$
million)
%
Export
s
%
Imports
∆ Trade
balance
(US$
million)
%
Export
s
%
Import
s
Paddy rice -0,18 -0,60 0,27 4,34 813,04 0,80 -0,09 -0,21 0,14 -0,36 -1,12 0,53 -0,26 -0,71 0,38 -0,25 -0,78 0,37
Wheat -7,09 1,50 0,53 -5,65 -0,80 0,38 -0,59 -0,11 0,04 -2,52 -0,56 0,16 43,04 315,11 3,58 -2,20 -0,41 0,14
Other cereals -4,65 -0,14 0,71 -3,56 -0,13 0,31 318,14 14,68 3,03 -2,93 -0,12 0,11 -1,47 -
0,07 0,02 -2,78 -0,11 0,19
Vegetables/fruits -2,13 -0,09 0,21 -1,80 -0,07 0,20 -0,49 -0,05 0,01 -1,75 -0,10 0,15 -1,46 -0,08 0,12 0,23 0,12 0,15
Oil seeds -4,43 -0,06 0,11 -9,73 -0,14 0,05 209,59 3,05 0,83 -6,99 -0,10 0 -37,61 -0,52 2,32 -10,76 -0,15 0,36
Sugar (cane&beet) 0 -0,14 0,08 -0,01 -0,28 0,19 0 -0,12 0,02 -0,01 -0,32 0,17 -0,01 -0,38 0,28 -0,01 -0,18 0,11
Plant fibres -1,15 -0,19 0,15 -51,92 -7,12 12,55 1,15 0,15 -0,31 -4,87 -0,66 1,22 1,44 0,19 -0,4 -1,18 -0,20 0,11
Other crops (unprepared) -14,73 -0,24 0,19 -27,28 -0,45 0,38 7,48 0,14 0,17 26,63 0,49 0,66 -14,87 -0,15 2,12 -11,19 -0,17 0,33
Cattle, horses, sheeps -0,26 -0,11 0,08 -0,55 -0,24 0,19 -0,53 -0,23 0,17 -0,65 -0,27 0,26 -0,32 -0,14 0,07 -0,44 -0,19 0,16
Animal products -0,51 -0,11 0,10 -1,77 -0,33 0,46 -0,73 -0,14 0,19 -0,23 -0,05 0,06 0 0,01 0,04 -1,32 -0,24 0,37
Raw milk -0,44 -10,57 8,48 -0,03 -0,93 0,53 -0,03 -0,92 0,50 -0,04 -0,99 0,58 -0,02 -0,66 0,38 -0,1 -2,46 1,76
Wool, silk -0,10 -0,72 0,43 -0,33 -2,51 1,31 -0,25 -1,87 1,14 -0,19 -1,45 0,88 -0,14 -1,09 0,54 -0,14 -1,03 0,61
Forestry products -0,02 -0,10 -0,03 -0,08 -0,23 0,11 -0,05 -0,10 0,10 -0,15 -0,29 0,36 0,05 0,71 0,66 -0,11 -0,29 0,15
Meat: cattle, sheeps, horses -12,37 -0,33 0,30 -25,08 -0,67 0,70 -13,75 -0,37 0,38 -28,36 -0,76 0,89 -16,15 -0,44 0,29 -11,26 -0,30 0,47
Meat products -16,47 -0,23 0,33 105,46 1,49 1,32 16,84 0,24 0,37 -51,32 -0,72 0,54 -32,26 -0,45 0,32 71,10 1,01 1,49
Vegetables oils and fats -12,73 -0,25 0,43 -22,21 -0,49 0,30 -76,83 -1,74 0,59 -22,00 -0,48 0,32 228,52 5,52 1,32 26,50 0,67 0,37
Milk & Dairy 635,51 245,72 4,26 -2,40 -0,47 0,56 2,36 1,22 0,40 -2,33 -0,42 0,58 -2,56 -0,57 0,51 109,51 42,59 1,05
Processed rice -0,53 -0,28 0,18 -1,13 -0,64 0,37 -0,24 -0,12 0,08 -1,01 -0,56 0,33 -0,71 -0,35 0,25 -0,68 -0,38 0,22
Sugar -6,84 -0,14 1,62 -11,02 -0,22 0,36 -3,38 -0,07 0,24 -14,49 -0,29 0,43 9,23 0,19 2,15 -9,29 -0,19 0,21
Food products (animal
feed) 16,66 0,58 0,29 69,42 2,08 0,39 8,54 0,42 0,43 9,71 0,43 0,38 -17,72 -0,34 0,35 7,70 0,32 0,24
Beverage, Tobacco
products -0,36 0,21 0,51 15,65 1,06 0,19 24,71 1,56 0,07 19,32 1,29 0,20 -2,34 -0,09 0,12 -3,10 -0,07 0,27
Trade balance: Agriculture
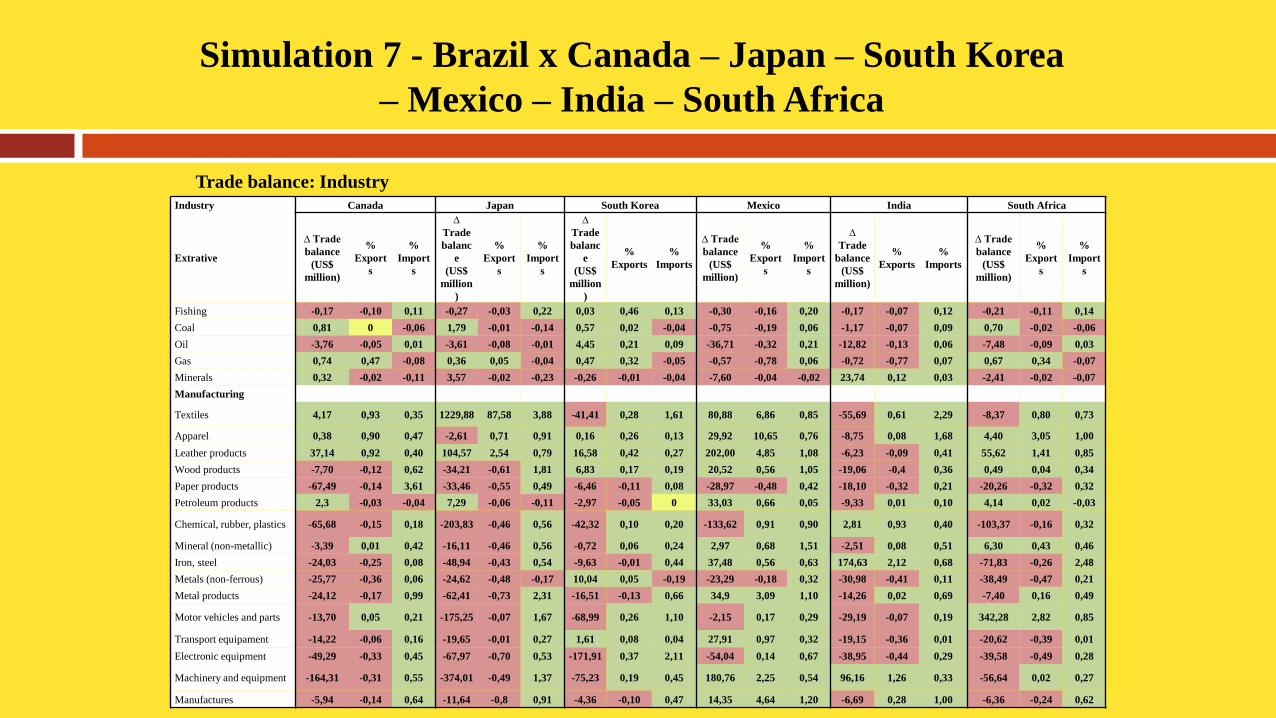
Simulation 7 - Brazil x Canada – Japan – South Korea
– Mexico – India – South Africa
Industry Canada Japan South Korea Mexico India South Africa
Extrative
∆ Trade
balance
(US$
million)
%
Export
s
%
Import
s
∆
Trade
balanc
e
(US$
million
)
%
Export
s
%
Import
s
∆
Trade
balanc
e
(US$
million
)
%
Exports
%
Imports
∆ Trade
balance
(US$
million)
%
Export
s
%
Import
s
∆
Trade
balance
(US$
million)
%
Exports
%
Imports
∆ Trade
balance
(US$
million)
%
Export
s
%
Import
s
Fishing -0,17 -0,10 0,11 -0,27 -0,03 0,22 0,03 0,46 0,13 -0,30 -0,16 0,20 -0,17 -0,07 0,12 -0,21 -0,11 0,14
Coal 0,81 0 -0,06 1,79 -0,01 -0,14 0,57 0,02 -0,04 -0,75 -0,19 0,06 -1,17 -0,07 0,09 0,70 -0,02 -0,06
Oil -3,76 -0,05 0,01 -3,61 -0,08 -0,01 4,45 0,21 0,09 -36,71 -0,32 0,21 -12,82 -0,13 0,06 -7,48 -0,09 0,03
Gas 0,74 0,47 -0,08 0,36 0,05 -0,04 0,47 0,32 -0,05 -0,57 -0,78 0,06 -0,72 -0,77 0,07 0,67 0,34 -0,07
Minerals 0,32 -0,02 -0,11 3,57 -0,02 -0,23 -0,26 -0,01 -0,04 -7,60 -0,04 -0,02 23,74 0,12 0,03 -2,41 -0,02 -0,07
Manufacturing
Textiles 4,17 0,93 0,35 1229,88 87,58 3,88 -41,41 0,28 1,61 80,88 6,86 0,85 -55,69 0,61 2,29 -8,37 0,80 0,73
Apparel 0,38 0,90 0,47 -2,61 0,71 0,91 0,16 0,26 0,13 29,92 10,65 0,76 -8,75 0,08 1,68 4,40 3,05 1,00
Leather products 37,14 0,92 0,40 104,57 2,54 0,79 16,58 0,42 0,27 202,00 4,85 1,08 -6,23 -0,09 0,41 55,62 1,41 0,85
Wood products -7,70 -0,12 0,62 -34,21 -0,61 1,81 6,83 0,17 0,19 20,52 0,56 1,05 -19,06 -0,4 0,36 0,49 0,04 0,34
Paper products -67,49 -0,14 3,61 -33,46 -0,55 0,49 -6,46 -0,11 0,08 -28,97 -0,48 0,42 -18,10 -0,32 0,21 -20,26 -0,32 0,32
Petroleum products 2,3 -0,03 -0,04 7,29 -0,06 -0,11 -2,97 -0,05 0 33,03 0,66 0,05 -9,33 0,01 0,10 4,14 0,02 -0,03
Chemical, rubber, plastics -65,68 -0,15 0,18 -203,83 -0,46 0,56 -42,32 0,10 0,20 -133,62 0,91 0,90 2,81 0,93 0,40 -103,37 -0,16 0,32
Mineral (non-metallic) -3,39 0,01 0,42 -16,11 -0,46 0,56 -0,72 0,06 0,24 2,97 0,68 1,51 -2,51 0,08 0,51 6,30 0,43 0,46
Iron, steel -24,03 -0,25 0,08 -48,94 -0,43 0,54 -9,63 -0,01 0,44 37,48 0,56 0,63 174,63 2,12 0,68 -71,83 -0,26 2,48
Metals (non-ferrous) -25,77 -0,36 0,06 -24,62 -0,48 -0,17 10,04 0,05 -0,19 -23,29 -0,18 0,32 -30,98 -0,41 0,11 -38,49 -0,47 0,21
Metal products -24,12 -0,17 0,99 -62,41 -0,73 2,31 -16,51 -0,13 0,66 34,9 3,09 1,10 -14,26 0,02 0,69 -7,40 0,16 0,49
Motor vehicles and parts -13,70 0,05 0,21 -175,25 -0,07 1,67 -68,99 0,26 1,10 -2,15 0,17 0,29 -29,19 -0,07 0,19 342,28 2,82 0,85
Transport equipament -14,22 -0,06 0,16 -19,65 -0,01 0,27 1,61 0,08 0,04 27,91 0,97 0,32 -19,15 -0,36 0,01 -20,62 -0,39 0,01
Electronic equipment -49,29 -0,33 0,45 -67,97 -0,70 0,53 -171,91 0,37 2,11 -54,04 0,14 0,67 -38,95 -0,44 0,29 -39,58 -0,49 0,28
Machinery and equipment -164,31 -0,31 0,55 -374,01 -0,49 1,37 -75,23 0,19 0,45 180,76 2,25 0,54 96,16 1,26 0,33 -56,64 0,02 0,27
Manufactures -5,94 -0,14 0,64 -11,64 -0,8 0,91 -4,36 -0,10 0,47 14,35 4,64 1,20 -6,69 0,28 1,00 -6,36 -0,24 0,62
Trade balance: Industry
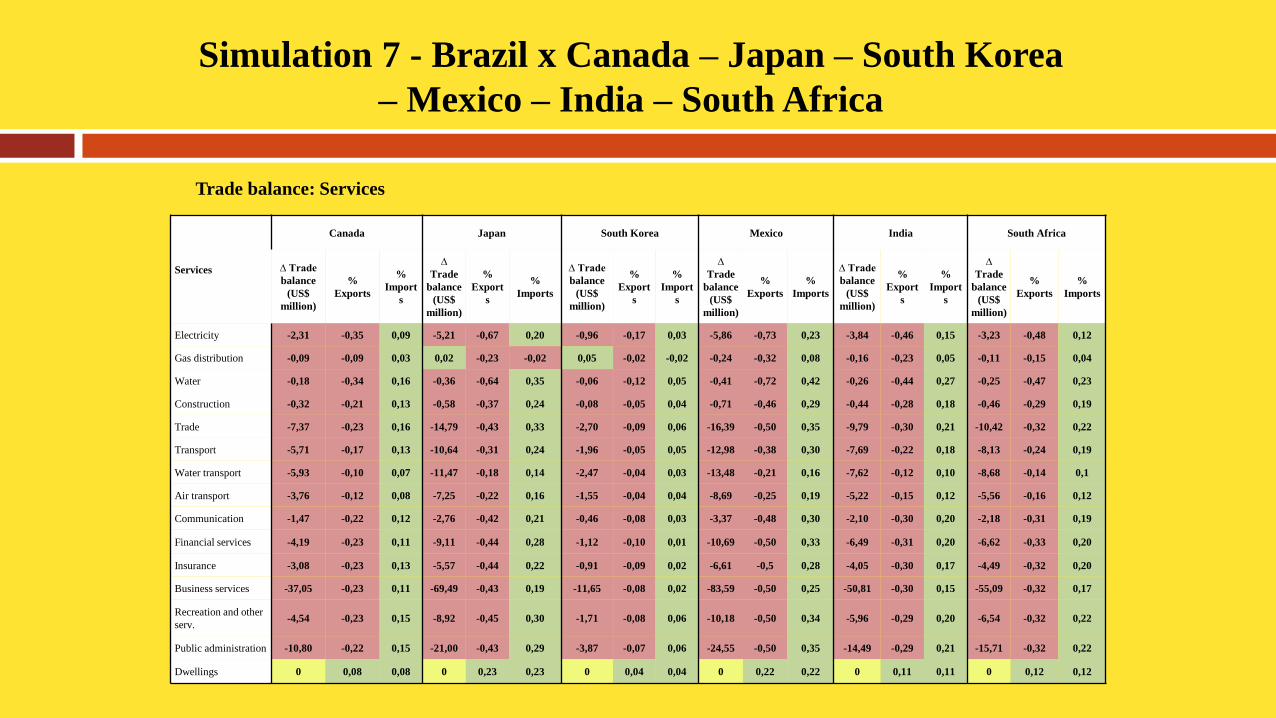
Simulation 7 - Brazil x Canada – Japan – South Korea
– Mexico – India – South Africa
Services
Canada Japan South Korea Mexico India South Africa
∆ Trade
balance
(US$
million)
%
Exports
%
Import
s
∆
Trade
balance
(US$
million)
%
Export
s
%
Imports
∆ Trade
balance
(US$
million)
%
Export
s
%
Import
s
∆
Trade
balance
(US$
million)
%
Exports
%
Imports
∆ Trade
balance
(US$
million)
%
Export
s
%
Import
s
∆
Trade
balance
(US$
million)
%
Exports
%
Imports
Electricity -2,31 -0,35 0,09 -5,21 -0,67 0,20 -0,96 -0,17 0,03 -5,86 -0,73 0,23 -3,84 -0,46 0,15 -3,23 -0,48 0,12
Gas distribution -0,09 -0,09 0,03 0,02 -0,23 -0,02 0,05 -0,02 -0,02 -0,24 -0,32 0,08 -0,16 -0,23 0,05 -0,11 -0,15 0,04
Water -0,18 -0,34 0,16 -0,36 -0,64 0,35 -0,06 -0,12 0,05 -0,41 -0,72 0,42 -0,26 -0,44 0,27 -0,25 -0,47 0,23
Construction -0,32 -0,21 0,13 -0,58 -0,37 0,24 -0,08 -0,05 0,04 -0,71 -0,46 0,29 -0,44 -0,28 0,18 -0,46 -0,29 0,19
Trade -7,37 -0,23 0,16 -14,79 -0,43 0,33 -2,70 -0,09 0,06 -16,39 -0,50 0,35 -9,79 -0,30 0,21 -10,42 -0,32 0,22
Transport -5,71 -0,17 0,13 -10,64 -0,31 0,24 -1,96 -0,05 0,05 -12,98 -0,38 0,30 -7,69 -0,22 0,18 -8,13 -0,24 0,19
Water transport -5,93 -0,10 0,07 -11,47 -0,18 0,14 -2,47 -0,04 0,03 -13,48 -0,21 0,16 -7,62 -0,12 0,10 -8,68 -0,14 0,1
Air transport -3,76 -0,12 0,08 -7,25 -0,22 0,16 -1,55 -0,04 0,04 -8,69 -0,25 0,19 -5,22 -0,15 0,12 -5,56 -0,16 0,12
Communication -1,47 -0,22 0,12 -2,76 -0,42 0,21 -0,46 -0,08 0,03 -3,37 -0,48 0,30 -2,10 -0,30 0,20 -2,18 -0,31 0,19
Financial services -4,19 -0,23 0,11 -9,11 -0,44 0,28 -1,12 -0,10 0,01 -10,69 -0,50 0,33 -6,49 -0,31 0,20 -6,62 -0,33 0,20
Insurance -3,08 -0,23 0,13 -5,57 -0,44 0,22 -0,91 -0,09 0,02 -6,61 -0,5 0,28 -4,05 -0,30 0,17 -4,49 -0,32 0,20
Business services -37,05 -0,23 0,11 -69,49 -0,43 0,19 -11,65 -0,08 0,02 -83,59 -0,50 0,25 -50,81 -0,30 0,15 -55,09 -0,32 0,17
Recreation and other
serv. -4,54 -0,23 0,15 -8,92 -0,45 0,30 -1,71 -0,08 0,06 -10,18 -0,50 0,34 -5,96 -0,29 0,20 -6,54 -0,32 0,22
Public administration -10,80 -0,22 0,15 -21,00 -0,43 0,29 -3,87 -0,07 0,06 -24,55 -0,50 0,35 -14,49 -0,29 0,21 -15,71 -0,32 0,22
Dwellings 0 0,08 0,08 0 0,23 0,23 0 0,04 0,04 0 0,22 0,22 0 0,11 0,11 0 0,12 0,12
Trade balance: Services