Embed Size (px)
Citation preview


ACKNOWLEDGEMENTS
The authors wish to thank the following organizations for their financial support which helps the Manufacturing and Society in the 21st Century and the MAPI Foundation to undertake this project: American Council for Capital Formation; Dover Corporation, Madison Industries, National Association of Manufacturers; Parker Hannifin Corporation; and Snap-on Incorporated.
Helpful editorial comments were received from Margo Thorning. Excellent editing and formatting was provided by Susan Sumler.
The authors alone are responsible for the contents of this publication.
Copyright © 2015 by The Aspen Institute The Aspen Institute One Dupont Circle, NW Suite 700 Washington, DC 20036 Published in the United States of America Publication Number: 15-012

Why Is Capital Investment Consistently Weak in the
21st Century U.S. Economy
By
Thomas J. Duesterberg
Executive Director Manufacturing and Society in the 21st Century
The Aspen Institute
Donald A. Norman
Director of Economic Studies MAPI Foundation

THE ASPEN INSTITUTE — MANUFACTURING AND SOCIETY IN THE 21ST CENTURY 1
Why Is Capital Investment Consistently Weak
in the 21st Century U.S. Economy?
By
Thomas J. Duesterberg, Ph.D.
Donald A. Norman, Ph.D.
EXECUTIVE SUMMARY U.S. capital investment spending has faltered since the dot-com speculative bubble which burst in early 2000. It has not kept pace with the economic growth, profits, cash flows or virtually any other metric one could use to benchmark investment spending. In 2014, real GDP was 8.7 percent above its level in the fourth quarter of 2007, the peak quarter prior to the Great Recession. Gross private domestic investment over the same period was just 3.9 percent higher. The trend in investment spending net of the depreciation which occurred is far worse. Net private investment totaled $860 billion in 2006; by 2013 it totaled just $524 billion.
The slowing pace of investment has contributed to slower productivity, economic growth and, ultimately, to a slower rate of improvement in living standards. Labor productivity increased at an average annual rate of 3.3 percent between 1947 and 1973. It declined after 1973 and then picked up in the 1990s, growing at an average annual rate of 3.2 percent between 1996 and 2004. But then, between 2006 and 2014 it grew at an annual rate of 1.5 percent. Since 2011, it has increased by just 0.7 percent per year.
There are a number of explanations as to why investment spending has lagged, including:
Policy uncertainty and weak business confidence;
Reduced animal spirits and entrepreneurialism;
Lack of investment opportunities (“Secular Stagnation”);
Corporate tax policy;
Regulation; and
Loss of market share to global competitors.
While there has been much concern expressed about the tepid rate of recovery from the Great Recession, a growing number of economists believe that recent trends reflect the new normal or what they call “secular stagnation.” That is, the potential growth rate of the U.S. economy going forward cannot be expected to match the economy’s performance between the end of World War II and 2000. The outlook for slower economic growth is partly a consequence of demographic and education trends which are largely beyond the influence of economic policy. Investment spending also is influenced by factors ranging from uncertainty, a reduction in animal spirits and entrepreneurialism, and by limited technological opportunities that are on the horizon. Factors like these are not easily dealt with by economic policy, but can more readily be affected by the overall economic and regulatory climate.
Other factors that influence investment spending, however, can be influenced by economic policy. Corporate tax reform would contribute to investment, especially if it includes a provision that allows for the expensing of investment. Expensing and lower corporate tax rates would make U.S. companies more competitive in global markets. Reduced uncertainty regarding the course of economic (including monetary) policies, increased spending for research and development and for an aging and deteriorating infrastructure, the negotiation of additional free trade agreements and stronger enforcement of existing ones, and regulatory reform that pays attention to the costs that an ever-increasing number of regulations impose on companies and which makes it easier for companies to start new businesses also would contribute to increased investment. In turn, this should spur greater productivity growth and, ultimately, a higher rate of economic growth and living standard than we will have if we remain on the current path. We have no magic bullet to suggest to rebalance the complicated equation, but hope that analysis like ours showing the long-term impact on basic investment will help resuscitate a reasonable democratic discussion of the trade-offs.

2 WHY IS CAPITAL INVESTMENT CONSISTENTLY WEAK IN THE 21ST CENTURY U.S. ECONOMY?
Introduction
At least since the crash of the dot-com bubble at the turn of the millennium, observers have puzzled
over the weak levels of capital investment in the United States.1 This weakness has been especially
pronounced in the last few years as the economy fitfully recovers from the deepest recession since the
1930s. Real capital investment has yet to recover previous levels even though the overall rebound is now
in its sixth year. Capital investment is generally considered to be one of the principal sources of growth in
productivity, innovation, and the overall standard of living. And, indeed, in the years since the onset of the
current recovery all these indices have slowed in tandem with capital investment.
The problem is now so persistent that leading economists are advancing an argument structurally
similar to that popular in the wake of the Great Depression; that is, for reasons which are hotly debated, we
have reached a stage of economic development characterized by secular stagnation, hence requiring
reduced levels of capital investment.2 In the late 1930s, the term of economic art advanced to explain the
slow recovery from the depression was economic maturity. Harvard economist Alvin Hansen and others
argued, somewhat like Cowen and Gordon more recently, that the bulk of the advances expected from
current and any projected technology had already been harvested and that population growth would slow
and reduce consumption growth, thereby reducing the rate at which capital investment could be expected to
grow going forward. Fortunately, the pessimists were proven wrong and post-war America—fueled in part
by technological advances born of the massive war effort, and new capital investment in aerospace,
information technology, and machinery—enjoyed three generations of vigorous economic growth,
innovation, and unprecedented personal prosperity.3
In this paper we explore the issue of weak capital investment, first providing evidence for the
problem and its impact and then reviewing some plausible explanations for the weakness. Based on the
evaluation of the causal factors, we offer some suggestions for public policy to address the weakness of
private investment. Given the centrality of the manufacturing sector to innovation, research and
development, productivity growth, wage growth, and overall economic growth, we pay particular attention
to this sector, although the issue of slow investment growth transcends manufacturing and reaches into all
sectors of the economy.4 While recovering the levels of dynamic growth achieved from the end of World
War II to about 2007 is an unknowable prospect because of the role of new innovation in growth theory for
the modern economy, we do argue that the historically low levels of capital investment can partially be
remedied with good policy to set us on a path to higher growth. Some argue too that we may have reached
a stage of economic development in which capital investment is no longer as important to innovation and
growth as it has been for the last 150 years. This, too, is probably not knowable at this time, but we believe
that capital investment, which includes investment in intellectual property, is still a vital source of
innovation and growth.
1 One of us wrote at length about this problem in 2008: See Donald A. Norman, “The Puzzle of Manufacturing Sector
Investment,” Business Economics, April 2008, pp. 23-33, http://nabe-web.com/publib/be/0802/norman.html. 2 See especially: Tyler Cowen, The Great Stagnation (New York: Dutton, 2011); and Robert J. Gordon, “Is U.S.
Economic Growth Over? Faltering Innovation Confronts the Six Headwinds,” National Bureau of Economic Research,
Working Paper No. 18315, August 2012. 3 For a good contemporaneous summary of this debate and a refutation of the economic maturity thesis, see George
Terborgh, The Bogey of Economic Maturity (Chicago: Machinery and Allied Products Institute, 1950). This group was
the predecessor of MAPI. In the first edition of his influential textbook on economics, Paul Samuelson reviews the
debate between Hansen and Terborgh. See Paul A. Samuelson, Economics: An Introductory Analysis, First Edition
(New York: McGraw Hill, 1948), pp. 417-423. 4 One of us has offered evidence for the importance of manufacturing to the future growth of the U.S. economy. See
Thomas J. Duesterberg, The Manufacturing Resurgence: What It Could Mean for the U.S. Economy. A Forecast for
2020 (Washington: The Aspen Institute and MAPI, 2013),
http://www.aspeninstitute.org/sites/default/files/content/docs/pubs/Manufacturing_Resurgence.pdf.
THE ASPEN INSTITUTE — MANUFACTURING AND SOCIETY IN THE 21ST CENTURY 3
Section I Evidence of Weak Investment
Although real GDP in 2014 was almost 9 percent above its level in the fourth quarter of 2007
(the peak of the previous business cycle), several major categories of gross investment have not
recovered to the same extent. Table 1 gives the real dollar value of GDP and major categories of
investment just prior to the start of the recession, at the trough of the recession and then for 2014.5 Most
investment measures fell precipitously between 2007 Q4 and 2009 Q2. With the recovery investment
has also revived. Nonetheless, when comparing investment levels prior to the start of the recession with
investment levels in 2014, it is apparent that most categories of investment have not grown as fast as
GDP.
Total fixed
investment includes
investment in residential
housing, which has yet to
fully recover from the
recession. Even when
housing investment is
excluded, it is clear that
fixed investment still has
not recovered to the extent
as overall GDP. In
contrast, investment in
equipment and intellectual
property has rebounded.
Government investment
actually rose during the recession as a result of the large stimulus bill (which, for instance, doubled the
National Science Foundation [NSF] budget for one year), but this category faltered significantly after
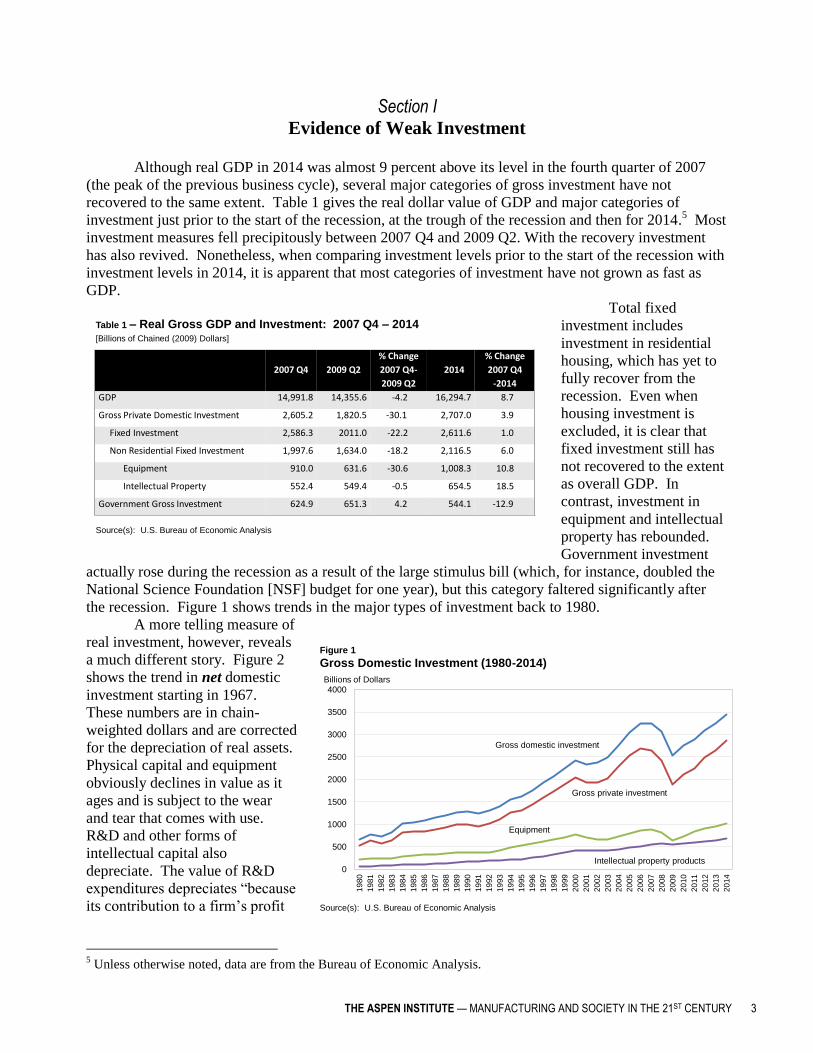
the recession. Figure 1 shows trends in the major types of investment back to 1980.
A more telling measure of
real investment, however, reveals
a much different story. Figure 2
shows the trend in net domestic
investment starting in 1967.
These numbers are in chain-
weighted dollars and are corrected
for the depreciation of real assets.
Physical capital and equipment
obviously declines in value as it
ages and is subject to the wear
and tear that comes with use.
R&D and other forms of
intellectual capital also
depreciate. The value of R&D
expenditures depreciates “because
its contribution to a firm’s profit
5 Unless otherwise noted, data are from the Bureau of Economic Analysis.
Figure 1
Gross Domestic Investment (1980-2014)
0
500
1000
1500
2000
2500
3000
3500
4000
19
80
19
81
19
82
19
83
19
84
19
85
19
86
19
87
19
88
19
89
19
90
19
91
19
92
19
93
19
94
19
95
19
96
19
97
19
98
19
99
20
00
20
01
20
02
20
03
20
04
20
05
20
06
20
07
20
08
20
09
20
10
20
11
20
12
20
13
20
14
Gross private investment
Gross domestic investment
Equipment
Intellectual property products
Source(s): U.S. Bureau of Economic Analysis
Billions of Dollars
2007 Q4 2009 Q2
% Change
2007 Q4-
2009 Q2
2014
% Change
2007 Q4
-2014
GDP 14,991.8 14,355.6 -4.2 16,294.7 8.7
Gross Private Domestic Investment 2,605.2 1,820.5 -30.1 2,707.0 3.9
Fixed Investment 2,586.3 2011.0 -22.2 2,611.6 1.0
Non Residential Fixed Investment 1,997.6 1,634.0 -18.2 2,116.5 6.0
Equipment 910.0 631.6 -30.6 1,008.3 10.8
Intellectual Property 552.4 549.4 -0.5 654.5 18.5
Government Gross Investment 624.9 651.3 4.2 544.1 -12.9
Table 1 – Real Gross GDP and Investment: 2007 Q4 – 2014[Billions of Chained (2009) Dollars]
Source(s): U.S. Bureau of Economic Analysis

4 WHY IS CAPITAL INVESTMENT CONSISTENTLY WEAK IN THE 21ST CENTURY U.S. ECONOMY?
declines over time.”6 In Figure 2
one can readily see the traditional
pattern of decline and recovery to
new highs in cycles since 1967,
but a significant change in the
pattern occurred during the Great
Recession. Full recovery of net
domestic investment appears to
be years in the future, including
investment in the vital categories
of equipment and intellectual
property. Net private fixed
investment, for example, was
$870 billion in 2006 and $524
billion in 2013. In 2009, for the
first time since the Great
Depression, we witnessed a net
destruction of capital stock in the
United States, at least for the
important category of equipment.
It is instructive to break
up this data into discrete periods
to show the magnitude of the
problems. Figure 3 illustrates
domestic capital investment for
periods that coincide with major
changes or productivity trends,
which we discuss in the Section
II. The extent of the slowdown
after the end of the dot-com
speculative bubble is clear, as is
the accelerated decline after the
Great Recession.
When looking more
closely at the sub-components of
this indicator, the reality is even
worse for government investment in the economy (Figure 4). Government expenditures support the
maintenance of, and additions to, our infrastructure that are required for a well-functioning competitive
global economy, as well as much of the basic
research that underpins the formation of our
intellectual property. As Figure 4 shows, after a
bump in 2009 and 2010 due to the stimulus bill, real
government investment has seen a steady downturn,
which is even more pronounced when depreciation is
accounted for. Federal spending on research and
6 Wendy C. Y. Li, “Depreciation of Business R&D Capital,” BEA/National Science Foundation R&D Satellite Account
Paper (Washington: Bureau of Economic Analysis, October 2012),
http://www.bea.gov/national/pdf/WendyLiDepreciationBusinessR%26DCapital20130314BEAwebversion.pdf.
Full recovery of net domestic
investment appears to be years in the
future, including investment in the
vital categories of equipment and
intellectual property.
-100
0
100
200
300
400
500
600
700
800
900
1000
1100
1200
19
67
19
69
19
71
19
73
19
75
19
77
19
79
19
81
19
83
19
85
19
87
19
89
19
91
19
93
19
95
19
97
19
99
20
01
20
03
20
05
20
07
20
09
20
11
20
13
Figure 2
Net Domestic Investment by Major Type, Chained Dollars
Net intellectual property Net equipment
Net
nonresidential
Net fixed investment
Net domestic investment
Source(s): U.S. Bureau of Economic Analysis
Billions of Dollars
Source(s): U.S. Bureau of Economic Analysis and MAPI
Figure x. Growth of Net Domestic Investment Over Selected Time Periods Figure 3
Growth of Domestic Investment Over Selected Time Periods
-1
0
1
2
3
4
5
6
7
8
1967 - 1973 1974 - 1993 1994 - 2000 2001 - 2013 2005 - 2013
Ave
rag
e A
nnua
l P
erc
ent

THE ASPEN INSTITUTE — MANUFACTURING AND SOCIETY IN THE 21ST CENTURY 5
development dropped in 2011
and has not recovered. The
NSF notes that this is “… a
noticeable departure from the
recent trend.”7
A closer look at net
investment in both equipment and
intellectual property, both of
which are centered in and
important to innovation in
manufacturing, have lagged since
the end of the dot-com boom in
2000. Figures 5 and 6 show a
leveling off of net investment in
both categories since 2000. Net
equipment investment between
2006 and 2013 declined from
$222 billion to $193 billion, and
intellectual property investment
was down from $74 billion to $71
billion. Recovery has been
modest following the heady
decline of equipment spending
after 2007. Intellectual property
expenditures have been steadier, a
sign of the importance placed on
such investment by firms and
research institutions, but net
investment is still below the 2000
peak.
The final category of
importance to the private
economy is investment in
nonresidential structures. This
includes mining, utility,
commercial and manufacturing
buildings, and infrastructure.
This indicator peaked in 2008 and has far to go before it gets back up to this high level. Figure 7 shows
that net investment in structures in 2013 was about half that in 2008.
Another measure of investment activity bears close scrutiny, in large part due to recent
contentious debates. Many have argued over the last 30 years that U.S. firms, particularly
manufacturing firms, are moving their investments abroad at an alarming rate and, hence, both
hollowing out domestic production capacity and shifting accompanying research and development out
of the country. Such analysis ignores the impact of inward foreign direct investment (FDI), that is,
investment by foreign firms and individuals in domestic U.S. assets. Data clearly show that the United
States is the leading destination in the world for FDI. In 1999, the United States was the destination for
7 See National Science Foundation, Science and Engineering Indicators 2014 (Arlington, VA: NSF, 2014), p. 4-2,
http://www.nsf.gov/statistics/seind14/index.cfm/overview.
0
100
200
300
400
500
600
700
1980
1981
1982
1983
1984
1985
1986
1987
1988
1989
1990
1991
1992
1993
1994
1995
1996
1997
1998
1999
2000
2001
2002
2003
2004
2005
2006
2007
2008
2009
2010
2011
2012
2013
Figure 4
Gross and Net Government Investment
Billions of Chained (2009) Dollars
Gross government investment
Less: consumption of fixed capital
Equals: net government investment
Source(s): U.S. Bureau of Economic Analysis
Figure 4
Gross and Net Domestic Investment in Equipment
-200
0
200
400
600
800
1000
1980
1981
1982
1983
1984
1985
1986
1987
1988
1989
1990
1991
1992
1993
1994
1995
1996
1997
1998
1999
2000
2001
2002
2003
2004
2005
2006
2007
2008
2009
2010
2011
2012
2013
Equipment
Less: Consumption of fixed capital
Equals: Net equipment
Billions of Chained (2009) Dollars
Source(s): U.S. Bureau of Economic Analysis
Figure 5
Gross and Net Domestic Investment in Equipment

6 WHY IS CAPITAL INVESTMENT CONSISTENTLY WEAK IN THE 21ST CENTURY U.S. ECONOMY?
39 percent of global FDI.8 For
manufacturing, the net investment
total by foreign firms in the United
States is considerably larger than
that of U.S. direct investment
abroad, as Figure 8 illustrates.
Nonetheless, as analyst Dan
Ikenson points out, inward bound
FDI has been declining on a real
and relative basis since the
bursting of the dot-com bubble.
The U.S. share of global FDI is
now around 17 percent, and it has
been 13 years since the peak of
$314 billion in FDI in the United
States was achieved. FDI in the
United States fell from $227
billion in 2011 to $147 billion in
2012.9 Although these net
numbers are reflected in the total
investment figures provided
earlier, it is worth noting that there
is still more inward than outward
bound FDI, and the slowdown in
domestic investment in the United
States starting around 2000
extends to foreign investors as
well. Even motor vehicle sector
investments show a balance in
recent years in favor of inward
bound flows. So the decline in
domestic investment is not due to
moving investment abroad.
Related to FDI is the
question of R&D investment by multinational companies, both domestic and foreign, in the United States
and abroad. Again the story is that, partly due to the importance of foreign multinational production in
the United States, there is no evidence that U.S. firms are in the vanguard of a net exodus of R&D to
foreign destinations. It is true that U.S.
companies are expanding their foreign R&D
spending more quickly (2.3 percent in recent
years) than in the United States, but the same
is true for foreign firms based in the States.
All told, in 2010 foreign multinationals
8 See the excellent overview by Daniel J. Ikenson, “Reversing Worrisome Trends: How To Attract and Retain
Investment in a Competitive Global Economy,” CATO Institute Policy Analysis, No. 735, August 22, 2013,
http://www.cato.org/publications/policy-analysis/reversing-worrisome-trends-how-attract-retain-investment-
competitive. 9 Ibid, pp. 2-3.
Despite record corporate profits in recent
years and the accumulation of around $2
trillion in cash reserves on the balance sheets
of major corporations, investment as a
percent of cash flow has been diminishing.
Figure 6
Gross and Net Domestic Investment in Intellectual Property Products
0
100
200
300
400
500
600
700
1980
1981
1982
1983
1984
1985
1986
1987
1988
1989
1990
1991
1992
1993
1994
1995
1996
1997
1998
1999
2000
2001
2002
2003
2004
2005
2006
2007
2008
2009
2010
2011
2012
2013
Billions of Chained (2009) Dollars
Less: Consumption of fixed capital
Intellectual property products
Equals: Net Intellectual Property Products
Source: U.S. Bureau of Economic Analysis
0
100
200
300
400
500
600
19
80
19
81
19
82
19
83
19
84
19
85
19
86
19
87
1988
19
89
19
90
19
91
19
92
19
93
19
94
19
95
19
96
19
97
19
98
19
99
20
00
2001
20
02
20
03
20
04
20
05
20
06
20
07
20
08
20
09
20
10
20
11
20
12
20
13
Figure 7
Net Domestic Investment in Nonresidential Structures
Billions of Chained (2009) Dollars
Gross Investment in Nonresidential Structures
Less: Consumption of Fixed Capital
Equals: Net Structures
Source(s): U.S. Bureau of Economic Analysis

THE ASPEN INSTITUTE — MANUFACTURING AND SOCIETY IN THE 21ST CENTURY 7
conducted over $41 billion of
R&D for the same purpose in
the United States. It is worth
noting that 70 percent of R&D
is accounted for by manufac-
turing firms, and foreign firms
devote more for this purpose in
the United States than the
reverse.10
The last indicator of the
secular slowdown in capital
investment we consider is a
financial one. Despite record
corporate profits in recent years
and the accumulation of around
$2 trillion in cash reserves on
the balance sheets of major
corporations, investment as a
percent of cash flow has been
diminishing. Figure 9 shows
that after a bump upwards in
2001, when the economy began
recovering from the dot-com
bubble, net investment as a
proportion of cash flow steadily
declined in absolute terms and
relative to its long-term
average. Anecdotal evidence
from executives at
manufacturing firms suggests
that the investment pattern of
the buoyant 1990s later came to
be seen as less efficient than
planned, and so executives
became more cautious after
2000. Nonetheless, the long
period in which investment in capital goods has increased at a relatively slow rate compared to what one
might expect given cash flows and corporate profits remains a puzzle.
Section II Lagging Investment and Productivity
Following the pioneering work of Robert Solow, the rate of economic growth is a function of the
growth of labor and capital inputs.11 In addition, the rate of economic growth and living standards are
10
NSF, Science and Engineering Indicators 2014, op. cit., pp. 4-25–4-29. 11
Robert M. Solow, “A Contribution to the Theory of Economic Growth,” Quarterly Journal of Economics, Vol. 70,
February 1956, pp. 65-94.
8
0
100,000
200,000
300,000
400,000
500,000
600,000
700,000
800,000
900,000
1,000,0001980
1983
1986
1989
1992
1995
1998
2001
2004
2007
2010
2013
Millions o
f D
ollars
Figure 8
Foreign Direct Investment in Manufacturing in the United States and Abroad(All Countries Total 1980-2013)
Manufacturing FDI AbroadMotor Vehicles and Equipment FDI
Abroad (dashed line)
Motor Vehicles and
Equipment FDI in U.S.
Manufacturing FDI in U.S.
Notes: Data for FDI abroad prior to 1982 is not available.
Data for FDI in the U.S. prior to 1997 is based on SIC; 1997 and beyond based on NAISC.
Source(s): U.S. Bureau of Economic Analysis
-10
0
10
20
30
40
50
60
70
80
90
19
77
19
78
19
79
19
80
19
81
19
82
19
83
19
84
19
85
19
86
19
87
19
88
19
89
19
90
19
91
19
92
19
93
19
94
19
95
19
96
19
97
19
98
19
99
20
00
20
01
20
02
20
03
20
04
20
05
20
06
20
07
20
08
20
09
20
10
20
11
20
12
20
13
Perc
en
t
Average, 1977 - 2013
Figure 9
Net Private Investment as a Percent of Net Cash Flow
Source(s): St. Louis Federal Reserve Board and MAPI

8 WHY IS CAPITAL INVESTMENT CONSISTENTLY WEAK IN THE 21ST CENTURY U.S. ECONOMY?
also raised by improvements in productivity. That is, after accounting for increased labor and capital
inputs there is additional or “residual” growth that generally is attributed to productivity gains driven by
technological change, efficiency improvements and innovation. This residual growth has been referred
to as “a measure of our economic ignorance” because it is difficult to precisely measure the contribution
of technological change and innovation to economic growth. Nonetheless, measures of the residual
contribution to economic growth from technological change and innovation are referred to as total factor
or multifactor productivity.
A significant issue for the United States (as well as for China, Japan, and Europe) is that
demographic trends point to a slowing of the growth of labor inputs over time. The U.S. labor supply
grew rapidly during the 20th century as population grew and also because the overall labor force
participation rate increased rapidly as women entered the workforce. But the labor force participation
rate for women peaked in 2000 at 60.3 percent and edged down to 56.6 percent in early 2015. The
overall labor force participation rate peaked at 67.3 percent in 2000 and currently stands at 62.1 percent.
The population is aging and those in the baby boomer generation are retiring. These retirees possess a
lot of what economists call human capital that makes them productive. A growing concern in the
manufacturing sector is that many companies are facing the prospect of losing skilled workers because
the median age level of employees is rising.12
In addition to the slowing growth of the labor force, education levels are leveling off after a long
period in which the number of individuals graduating from high school and college increased. The rise
in education levels contributed to the skill sets of workers and thus to increased productivity. With the
leveling of years of schooling, the skills sets of workers cannot grow as rapidly as they did throughout
most of the 20th century.13 This too contributes to slower productivity growth.
Adding to the reduced growth of the labor supply is the slowing growth of labor productivity
(output per hour). Changes in labor productivity are the result of shifts in the composition of the labor
supply, the intensity of
capital goods, and to
multifactor productivity
growth. Labor productivity
for the major sectors of the
U.S. economy grew at an
average rate of 3.3 percent
between 1948 and 1973
(Figure 10). Then, from
1974 through 1995,
productivity grew by just
1.5 percent per year.
A number of
explanations have been
advanced to explain why
there was a marked
slowdown in productivity
growth starting in 1973.
These included a decline in
labor quality, the two energy price shocks following the Arab Oil Embargo and the Iranian revolution,
and the reduction in the growth of measured capital per labor hour. Labor productivity growth
12
Harold L. Sirkin, “The Coming Shortage of Skilled Manufacturing Workers,” Bloomberg Business, January 14, 2013. 13
A good summary of trends is in Brink Lindsey, “Why Growth Is Getting Harder,” Cato Institute, Policy Analysis No.
737, October 2013, pp. 3-11.
0
1
2
3
4
5
1947 - 1973 1974 - 1995 1996 - 2004 2005 - 2014 2011 - 2014
Ave
rag
e A
nnua
l P
erc
ent
Source(s): U.S. Bureau of Labor Statistics and MAPI
Figure 9. Labor Productivity Growth Over Selected Time Periods
Figure 10
Labor Productivity Growth Over Selected Time Periods

THE ASPEN INSTITUTE — MANUFACTURING AND SOCIETY IN THE 21ST CENTURY 9
rebounded to an average of 3.2 percent between 1996 through 2004. The spread of technologies
associated with the Internet and computers is generally thought to explain this resurgence of
productivity growth. Productivity growth then slowed again after 2004. Between 2005 and 2014, labor
productivity grew at an average annual rate of 1.5 percent. Worse, since 2011, however, productivity
growth has averaged just 0.7 percent.
Labor productivity in the manufacturing sector, though generally greater than productivity for
the economy at large, has exhibited a similar pattern (Figure 11). After growing at an average rate of
2.6 percent between 1988 and 1994, productivity growth increased to an average of 4.7 percent between
1995 and 2005. Since 2011,
labor productivity growth
has averaged 1.5 percent.
An expanding
capital stock also
contributes to the overall
economic growth rate. For
one thing, providing
workers with more capital
contributes to labor
productivity. As elaborated
earlier, investment in capital
goods has been declining
and this is one of the
reasons the growth in labor
productivity has slowed.
The trend in the productivity
of capital goods has moved
upward since 1988 (Figure
12). In addition, the
contribution to growth in the
private nonfarm business
sector from increases in
capital intensity has slowed
in recent years. From 1995
to 2000 increased capital
intensity contributed 1.2
percentage points to the
growth of the private
business sector and from
2000 through 2007
increased capital intensity
contributed 1.0 percentage
point. In the period from
2007 to 2013, however, this
contribution fell to 0.7
percentage points.
Technological
change and innovation as
measured by multifactor productivity (Figure 13) is the final contributor to economic growth.
Multifactor productivity reflects the combined effects of technological change, efficiency gains, returns
Figure 12
Growth of Capital Productivity
-5
-4
-3
-2
-1
0
1
2
3
4
5
1988
1989
1990
1991
1992
1993
1994
1995
1996
1997
1998
1999
2000
2001
2002
2003
2004
2005
2006
2007
2008
2009
2010
2011
2012
2013
Pe
rce
nt
Cha
ng
e f
rom
Pre
vio
us Y
ea
r
Source(s): U.S. Bureau of Labor Statistics and MAPI
Figure 11
Manufacturing Labor Productivity Growth
(Output Per Hour)
-2
0
2
4
6
8
10
19
88
19
89
19
90
19
91
19
92
19
93
19
94
19
95
19
96
19
97
19
98
19
99
20
00
20
01
20
02
20
03
20
04
20
05
20
06
20
07
20
08
20
09
20
10
20
11
20
12
20
13
20
14
Pe
rce
nt
Cha
ng
e f
rom
Pre
vio
us Y
ea
r
All Major Sectors Manufacturing Linear (Manufacturing)
Source(s): U.S. Bureau of Labor Statistics and MAPI

10 WHY IS CAPITAL INVESTMENT CONSISTENTLY WEAK IN THE 21ST CENTURY U.S. ECONOMY?
to scale, and other factors
beyond increases in the
supply of labor and capital.
The contribution of
multifactor productivity has
increased over time but, as
was the case with capital
intensity, the contribution of
multifactor productivity to
economic growth has
declined in recent years.
Increases in the
labor supply, the quality of
the labor supply, capital
goods, technological change,
and improved efficiency are
all drivers of economic
growth. All of these factors
have weakened since around
2000. Some of these drivers
cannot be changed by
adopting new economic
policies. For example,
demographic factors are, as
Dale Jorgenson has said,
“baked in” and there is little
that can be done to change
them.14
The Great Recession
Lagging investment
and slower productivity
growth contributed to the
weak recovery from the
Great Recession. As shown
in Figure 14, economic
growth in the four to six
quarters following the end of
postwar recessions typically bounced back strongly; that is, until the last three recessions. There was a
positive correlation between the extent to which GDP fell and the strength of the recovery. The
recessions in 1990-1991 and in 2001 were relatively mild and thus the fact that growth in the recovery
phase was not strong was not surprising. In the Great Recession, however, the large peak to trough drop
in GDP (equal to 4.2 percent) was followed by a very weak recovery.
Our view is that the slowing growth of investment and the concomitant fall in productivity
contributed to the weak recovery. Investment spending is the one variable most susceptible to policy
influence and thus it is important to ask what is behind its weakening since the end of the dot-com
bubble.
14
Remarks to Cato Institute forum on “The Future of Economic Growth,” Washington, DC, December 4, 2014,
www.cato.org/events/future-us-economic-growth.
Figure 14
Recovery From Recessions
-2
0
2
4
6
8
10
1958
1960
- 1
961
19
69
- 1
97
0
19
73
- 1
97
5
19
81
- 1
98
2
19
90
-1
99
1
2001
20
08
-2
00
9
Ave
rag
e Q
ua
rte
rly G
DP
Gro
wth
Ra
te D
uri
ng
R
eco
ve
ry P
ha
se
Source(s): U.S. Bureau of Economic Analysis and MAPI
Figure 13
Multifactor Productivity Growth
-2
-1
0
1
2
3
41988
1989
1990
1991
1992
1993
1994
1995
1996
1997
1998
1999
2000
2001
2002
2003
2004
2005
2006
2007
2008
2009
2010
2011
2012
2013
Pe
rce
nt
Source(s): U.S. Bureau of Labor Statistics and MAPI

THE ASPEN INSTITUTE — MANUFACTURING AND SOCIETY IN THE 21ST CENTURY 11
Section III Why Is Investment Lagging?
Standard economic, econometric and financial models used to forecast investment spending
incorporate various drivers that are thought to determine investment spending. At the aggregate level,
these models typically include interest rates and the growth of GDP. At the firm level, other variables
help explain what drives investment decisions. A recent MAPI survey of senior financial executives
found that cash flow and expected profits are key drivers of investment decisions.15 But other factors
including the level of capacity utilization, expected market growth and interest rates also affect
investment decisions. A subsequent MAPI survey looked at the role of hurdle rates. Most companies
establish hurdle rates—benchmarks of the required return on an investment—that are used in making
investment decisions.16 The expected return on a proposed investment must equal or exceed the
company’s hurdle rate which is based on its weighted average cost of capital. Hurdle rates for
particularly risky investments may exceed the company’s weighted average cost of capital. Other
metrics may be used, including Economic Value Added or EVA, payback periods, net present value,
and the expected return on invested capital, to help guide decisions. In general, most of these purely
financial factors have been favorable in recent years.
Apart from these financial considerations, factors such as confidence, animal spirits, lack of
profitable investment opportunities, changing demographics, changes in fiscal and monetary policies,
the tension between short-term demands on the part of investors for quicker returns versus longer term
corporate strategic goals, as well as uncertainty associated with regulatory initiatives (environmental,
financial, antitrust), and tax policy, can also impact investment spending. Most of these factors have
always existed, but it appears that many have worsened since around 2000. For example, there has been
much uncertainty in the past two years as to when the Federal Reserve Board will change its monetary
policy and, if so, what it will do.
A fundamental question is whether one or more of the factors cited above have changed to such
an extent that they have caused investment spending to lag. What follows is a brief overview of some
factors thought to reduce investment spending.
Weak Business Confidence
If business decision makers have confidence that their markets will expand and if they are
confident that there will be no major surprises that could disrupt their plans, they will be more willing to
commit to investments in long-lived assets that will yield returns over the long run. The current
environment is one which challenges confidence. As we have shown, investment remains weak even
though firms have near-record cash reserves, interest rates remain low, and capital markets are generally
strong. Slowing economic growth in Europe and Asia, radical and rapid changes in financial markets,
the threats posed by ISIL and Russia, and volatility in energy markets are just a few of the events that
undermine confidence and may help offset the favorable conditions in capital markets and corporate
balance sheets.
Measuring uncertainty’s impact on confidence is difficult because there are many different types
of this phenomenon. There are uncertainties created by the economic outlook in the United States,
polarization of the political parties, macroeconomic policy, monetary policy, regulatory policies
(environmental and financial), the economic outlooks for our major trading partners, volatility of oil and
exchange rates, and corporate tax policy.
Scholars are developing tools to understand how the nuances of uncertainty affect decision
making for investment. What matters is level and trend in overall uncertainty. A recent paper by Baker,
15
MAPI Foundation, Business Outlook Survey, January 2015. 16
MAPI Foundation, Business Outlook Survey, April 2015.

12 WHY IS CAPITAL INVESTMENT CONSISTENTLY WEAK IN THE 21ST CENTURY U.S. ECONOMY?
Bloom, et. al. develops a measure of uncertainty associated with levels of government spending,
regulation, taxes, and political polarization.17 Their measure of uncertainty has trended upward since
1960. The trend in their index was relatively stable between 1973 and 2006. Since 2006, however, the
uncertainty index has climbed much more rapidly than in earlier periods, thus providing some evidence
that uncertainty could be having an impact on investment. The research of the Bloom/Baker Stanford
team has been extended in time (back to 1900) and place (with many other developed economies) and
tends to corroborate a consistent correlation between uncertainty and weak investment.
A recent paper by the Bank for International Settlements links the “collapse in investment in
2008 …” which “accounted for a large part of the contraction in aggregate demand …” in many
advanced economies directly to uncertainty.
Moreover, the authors find that: “The
test results imply that the economic
uncertainty has had a greater effect since
2007.”18
Another recent publication links
the uncertainty index developed by the
Stanford team directly to capital investment by corporations, with a strong negative correlation
between the two. This research further refines the findings to show that the negative impact is more
pronounced for “firms with a higher degree of investment irreversibility and for firms which are
dependent on government spending.”19
The term “irreversibility” generally applies to large capital
projects with lengthy lead times, such as building refineries, commercial aircraft, or new factories.
Uncertainty is clearly a composite of many factors, some of which are explored in more
detail below. It is worth noting that an accumulating number of studies show a break in overall
levels of uncertainty in the last 10-15 years that is related in ways to capital investment weaknesses.
Reduced Animal Spirits and
Entrepreneurialism
John Maynard Keynes discussed the role of animal spirits in driving investment in his book, The
General Theory. Keynes defined animal spirits as a “[s]pontaneous urge to action rather than inaction
and not as the outcome of a weighted average of quantitative benefits multiplied by quantitative
probabilities.”20 In his discussion on animal spirits, Keynes apparently sought to reassure those who
were concerned that new economic policies might depress investment, noting that “[i]f the fear of a
Labour Government or a New Deal depresses enterprise, this need not be the result of a reasonable
calculation or of a plot with political intent—it is the mere consequence of upsetting the delicate
balance of spontaneous optimism [emphasis added].” The main point here is that whether or not a
calculation is based on reason, the motivation to invest can be impacted by uncertainty. In 2006, then
Federal Reserve Governor Kevin Warsh echoed this line of argument, stating that businesses appeared
to be more risk-averse than warranted by economic fundamentals.
A variation of the role played by animal spirits is the role of entrepreneurialism. Citing the work
of the great economic historian David Landes and his co-authors, the Kauffman Foundation summarizes
the case: “Historically, entrepreneurship and innovation have been the principal source of economic
17
Scott Baker, Nicholas Bloom, Brandice Canes-Wrone, Steven J. Davis and Jonathan Rodden, “Why Has U.S. Policy
Uncertainty Risen Since 1960?” Draft paper for the American Economic Review Papers and Proceedings, January 5,
2015. 18
Ryan Banerjee, Jonathan Kearns and Marco Jacopo Lombardi, “Why Is Investment Weak?” Quarterly Review, Bank
for International Settlements, March 2015, pp. 67, 75. 19
Huseyin Gulen and Mihai Ion, “Policy Uncertainty and Corporate Investment,” Social Science Research Network,
February 20, 2015, http://papers.ssrn.com/sol3/papers.cfm?abstract_id=2188090. 20
John M. Keynes, The General Theory of Employment, Interest and Money (London: Macmillan, 1936), pp. 161-162.
[A]n accumulating number of studies show a
break in overall levels of certainty in the last
10-15 years that is related in ways to capital
investment weaknesses.

THE ASPEN INSTITUTE — MANUFACTURING AND SOCIETY IN THE 21ST CENTURY 13
growth, technological progress and rising standards of living.”21 The Kauffman Foundation is among
those consistently raising the clarion call for diminishing levels of entrepreneurship in the United States.
Their measure of new business start-ups shows that business creation peaked in 2006, declined by 31
percent by 2010, and, by 2012, was still 27 percent below the recent peak. New business creation
actually reached almost 800,000 in the late 1970s and 1980s, and was only around 400,000 in 2012.
Declines in prime age and in younger age cohorts exacerbate their concern.22
Some like Alex Tabarrok dispute this, arguing that the number of small business start-ups is not
an accurate measure of entrepreneurialism. CEOs and managers in large modern corporations are able
to act in an entrepreneurial fashion. He cites the turnaround of Ford Motor Company under its former
CEO Allan Roger Mulally as an example of entrepreneurialism in a large corporation.23
At a higher level of this
category, at least in terms of potential
for innovation, is venture capital
(VC) funding. The United States is a
global leader in this arena, but other
nations are narrowing the gap. Total
VC activity in the United States took
a dive in the Great Recession but has
revived during the recovery. Between 2002 and 2012, the total amount of VC invested in the United
States increased from $22 billion to $27 billion, but the average size of investment is flat and the value
relative to GDP declined from $2.08 to $1.73 per $1,000 of GDP in this period.24 Ernst & Young
publishes an “Entrepreneurship Barometer” for the G-20. In the 2013 edition, the United States ranks
high in terms of the culture of entrepreneurship and financing but low on the tax and regulation measure
and last among the G-20 on what they identify as “coordinated support” which encompasses the eco-
system allied with government and educational institution support for entrepreneurial ventures.25
Lack of Investment Opportunities
(Secular Stagnation)
As noted earlier, Robert Gordon and others believe that investment spending has slowed because
there is a lack of opportunities in which to invest. This argument has a lineage dating back to the 1930s
when Alvin Hansen and others thought that the United States and other industrialized countries were
doomed to a slower growth rate owing to the absence of new technologies that typically spur investment
and to demographic weakening. Gordon cites the railroad, electricity, automobiles, and modern
communications as examples of technologies that ushered in periods of large investment and faster
economic growth. In a similar vein, Tyler Cowen argues that we have taken advantage of the “low
hanging fruit” of new technology and going forward it will be increasingly difficult to find opportunities
that would cause investment to expand as fast as it did for most of the post-World War II era. Cowen
and Gordon both place emphasis on breakthrough investments that have major impact over time but are
hard to anticipate. Larry Summers and Paul Krugman have also embraced variations of this hypothesis.
There is one sense in which the secular stagnation model is hard to dispute. The simple story of
growth over time sees population growth and labor deepening combining with productivity growth due
to innovation, the latter part being emphasized by Cowen and Gordon. But renewed levels of growth, at
least in developed economies, clearly have little if any room for improvement due to labor deepening,
21
Kauffman Foundation, “State of Entrepreneurship Address 2014,” Kansas City, February 2014, p. 6. 22
Kauffman Foundation, “2015 State of Entrepreneurship Address,” Kansas City, February 2015, pp. 3-5. 23
Remarks to Cato Institute forum on “The Future of Economic Growth,” op. cit. 24
See NSF, Science and Engineering Indicators 2014, op. cit., Figures 8-57 and 8-59. 25
Ernst & Young, The EY G20 Entrepreneurship Barometer 2013, http://www.ey.com/GL/en/Services/Strategic-
Growth-Markets/EY-G20---Access-to-funding.
Lagging investment is an important reason as to why
the growth of labor productivity has slowed. It also
helps to explain why the contributions from capital
intensity and multifactor productivity have slowed in
recent years.

14 WHY IS CAPITAL INVESTMENT CONSISTENTLY WEAK IN THE 21ST CENTURY U.S. ECONOMY?
and may be deteriorating in this measure. Population growth is slowing or declining, the labor force
participation rate has declined, average hours worked is falling, and educational attainment indicators
are stable to declining.26 There is undoubtedly room for improvement in educational equality and labor
force participation, but the consistent, rapid gains of the 20th century are behind us.
The idea of secular stagnation cannot be dismissed out of hand and the lack of new breakthrough
technologies may in fact be one holding back investment spending, at least in the near term until new
ones are developed. Further, while secular stagnation may be one factor that accounts for slowing
investment, there are others as discussed throughout this section. While secular stagnation may not
easily be remedied by policy changes, some of these other factors can be.
There is another increasingly useful way to view innovation, especially in the economy of the
21st century. In an important work on the microeconomics of innovation, William Baumol emphasizes
that much of what is done in the modern setting can be characterized as the “routinization” of
innovation. While it is all well and good to rely on major breakthroughs that drive waves of economic
growth (is the “Internet of everything” the next in this series?27), most advances are incremental and
depend on long-term accumulation of new ideas and collaboration to translate them into marketable
products. As Baumol puts it, “… leading economic historians have concluded from their evidence that
much of the U.S. economy’s productivity growth is attributable not only to those dramatic
breakthroughs, but perhaps even more to the accumulation of preexisting products and processes.” 28 A
contemporary example perhaps of this phenomenon is the 21st century research agenda of Boeing:
The 99-year-old aerospace giant long has focused on developing new technologies that
it reserved for big projects every 15 years or so to craft the fastest—and farthest-flying
jetliners—such as its 787 Dreamliner.
Today, Boeing is centering innovation on incremental improvements that it can deliver
more quickly to airlines with greater reliability and at a lower price, said Ray Conner,
chief executive of Boeing’s commercial airplane unit … [in an interview with The Wall
Street Journal].29
While we cannot rule out major new productivity-enhancing innovations, the life of the modern firm is,
as Baumol argues, a continuous process of looking for improvements to gain an edge in a competitive
economy. That is perhaps why R&D budgets in U.S. corporations have not declined at the same rate as
expenditures on structures and production-related equipment.
Corporate Tax Policy
A growing body of empirical research helps demonstrate that the current corporate tax structure
clearly contributes to lagging investment. As shown in Table 2, the United States has a higher statutory
26
See above and Lindsey, op. cit., pp. 3-10. 27
Teena Hammond, “Cisco: The Internet of Everything is at a tipping point,” TechRepublic, February 18, 2015. Cisco
estimates that $19 trillion in new profits and cost savings could emerge globally in the next decade from this
phenomenon. 28
William J. Baumol, The Free-Market Innovation Machine: Analyzing the Growth Miracle of Capitalism (Princeton,
NJ: Princeton University Press, 2012), p. 34. 29
Jan Ostrower, “At Boeing, Innovation Means Small Steps, Not Giant Leaps,” The Wall Street Journal, April 2, 2015,
http://www.wsj.com/articles/at-boeing-innovation-means-small-steps-not-giant-leaps-1428016900.
A growing body of empirical research helps demonstrate that the current
corporate tax structure clearly contributes to lagging investment.

THE ASPEN INSTITUTE — MANUFACTURING AND SOCIETY IN THE 21ST CENTURY 15
corporate tax rate than any of our
major trading partners.30 A higher
tax rate raises the effective cost of
capital. Moreover, the U.S.
corporate tax rate has remained
unchanged for more than 20 years
while other countries have lowered
their rates. When one looks at
effective tax rates (i.e., the average
rate paid after various deductions
are taken), it remains the case that
the U.S. companies are at a
disadvantage. Effective corporate
tax rates in most countries also
have declined in recent years to a
much greater degree than in the
United States (Table 3). In the last
10 years, the average effective
marginal tax rate on corporate
investment fell by 3 percent in all
OECD countries and nearly 7
percent in the G-7. More than 63
countries dropped their tax rate on
corporate entities since 2005, while
the United States remained
stable.31 The 2015 Economic
Report of the President outlines the
impact of these differentials on
investment and growth and the
rationale for lowering corporate tax
rates.32 Add to that the burden of
local and state taxes and the
fluctuation of rules affecting
depreciation of capital assets, and
it becomes clear that U.S. companies face a disadvantage when competing in global markets. This is
one reason for the United States losing global market share in FDI, as we showed in Section I. Because
of the differential in tax rates and with all other factors being equal, it is simply more profitable, in most
cases, to produce outside the United States.
As MAPI Vice President and Chief Economist Daniel J. Meckstroth put it, “[t]he U.S. tax
system is out of step with the rest of the world.”33 It is the only country in the G-7 that taxes the active
foreign earnings of its companies worldwide. The differential tax rate faced by U.S. companies distorts
30
Daniel J. Meckstroth, The U.S. Needs a More Competitive Corporate Tax System, MAPI Foundation and NAM,
April 13, 2015. 31
See Jack Mintz and Duanjie Chen, “U.S. Corporate Taxation Prime for Reform,” Tax Foundation Special Report
No. 228, February 2015. 32
Council of Economic Advisors, Economic Report of the President (Washington, DC: Government Printing Office,
2015), Chapter 5. 33
Meckstroth, op. cit.
Year Percentage Points
2014 20062006 to 2014
Change2014 Difference
With the U.S
China 25.0 33.0 -8.0 -15.0
Canada 26.5 36.1 -9.6 -13.5
Mexico 30.0 29.0 1.0 -10.0
Japan 35.6 40.7 -5.1 -4.4
Germany 29.6 38.3 -8.7 -10.4
South Korea 24.2 27.5 -3.3 -15.8
United Kingdom 21.0 30.0 -9.0 -19.0
France 33.3 33.3 0.0 -6.7
Brazil 34.0 34.0 0.0 -6.0
United States 40.0 40.0 0.0 0.0
9-Country Trade-Weighted Average 27.9 33.6 -5.7 -12.1
OECD Trade-Weighted Average 27.9 32.3 -4.4 -12.1
Global Average 23.6 27.5 -3.9 -16.4
Table 2 – Statutory Corporate Tax Rates
Source(s): KPMG and MAPI
Year Percentage Points
2014 20052005 to 2014
Change2014 Difference
With the U.S
China 21.4 47.6 -26.2 -12.1
Canada 7.7 35.4 -27.7 -25.8
Mexico 18.9 18.9 0.0 -14.6
Japan 29.4 31.7 -2.3 -4.1
Germany 26.6 36.3 -9.7 -6.9
South Korea 32.4 35.3 -2.9 -1.1
United Kingdom 22.5 27.7 -5.2 -11.0
France 37.7 37.2 0.5 4.2
Brazil 34.5 34.5 0.0 1.0
United States 33.5 35.1 -1.6 0.0
9-Country Trade-Weighted Average 20.5 34.7 -14.2 -13.0
OECD Trade-Weighted Average 19.2 27.8 -8.6 -14.3
Table 3 – Marginal Effective Tax Rates in Manufacturing
Source(s): Mintz and Chen and MAPI

16 WHY IS CAPITAL INVESTMENT CONSISTENTLY WEAK IN THE 21ST CENTURY U.S. ECONOMY?
investment decisions and even with deferrals
meant to offset some of the tax burden created
by taxation of foreign earnings the tax
differences in many cases are so large that
foreign earnings will never be brought back to the United States.
Regulation
One negative factor frequently adduced by corporate executives as influencing investment
decisions is the burden of regulation. While one needs to emphasize that much of the existing corpus of
domestic regulation is essential to the smooth functioning of the economy and is a result of democratic
choices to achieve social and cultural welfare goals, there is increasing evidence that the weight of
regulation in the United States is growing at a swift pace and is likely affecting global competitiveness.
Because we now must include global investment flows to get a true picture of this variable, it is
increasingly important to address the relative burden of regulation as a factor in investment decisions.
So we will distinguish between the static state of the regulatory burden as it affects investment and the
change over time as it affects the attractiveness of U.S. investment and in comparison to the parts of the
world.
To focus on manufacturing alone, based on a study done for the National Association of
Manufacturers (NAM), the total burden of federal regulation is nearly $20,000 per employee for
manufacturing firms and over $2 trillion for the entire economy. Manufacturing executives report that
some two-thirds of the regulatory costs would
be spent on investment if the money were freed
up.34 The pace of growth for major regulations
affecting manufacturers has picked up
measurably in recent decades. According to a
National Economic Research Associates
(NERA) study, since 1998 “… the accumulated
inflation-adjusted cost of regulations affecting the manufacturing sector has grown by an inflation
annualized rate of 7.6 percent” whereas real GDP has grown by 2.2 percent and the physical volume of
manufacturing output by 0.4 percent annually in the same years.35
In more recent years, new or proposed regulations could have substantial impact on the
industrial sector. The proposed strengthening of the ozone emissions standard to 65 parts per billion
(ppb) would, again according to the NERA, add about $140 billion per year in compliance costs and
reduce manufacturing output by 0.3 percent per year.36 Moreover, 34 states would be non-compliant by
2020, calling into question the ability to build new plants, drill new oil and gas wells, or expand
industrial production in those states. These states include most of the industrial Midwest, major oil and
gas producing regions, the newly industrialized Southwest, New England, and California. According to
the Environmental Protection Agency (EPA) analysis, meeting the new requirement will necessitate
major contributions from “unknown technology.” In the absence of technological breakthroughs, it is
highly conceivable that existing plants will be required to close and new investment in oil, gas and
34
The Cost of Federal Regulation in the U.S. Economy, Manufacturing and Small Business (Washington: NAM, 2014),
Executive Summary, http://www.nam.org/Data-and-Reports/Cost-of-Federal-Regulations/Federal-Regulation-
Executive-Summary.pdf. 35
NERA, Macoreconomic Impacts of Federal Regulation of the Manufacturing Sector, report commissioned by MAPI
(Arlington, VA: MAPI, 2012), p. 34, https://www.mapi.net/system/files/NERA_MAPI_FinalReport_0.pdf. 36
See NERA, Economic Impacts of a 65 ppb National Ambient Air Quality Standard for Ozone, prepared for the
National Association of Manufacturers (Washington: NAM, 2015), pp. 5-11, 5-14,
http://www.nera.com/publications/archive/2015/economic-impacts-of-a-65-ppb-national-ambient-air-quality-
standa.html.
…there is increasing evidence that the
weight of regulation in the United States
is growing at a swift pace and is likely
affecting global competitiveness.
As… Meckstroth put it, “the U.S. tax system
is out of step with the rest of the world.”

THE ASPEN INSTITUTE — MANUFACTURING AND SOCIETY IN THE 21ST CENTURY 17
petrochemical sectors, and other energy-intensive industries will be limited, assuming that EPA chooses
to vigorously enforce the new standard.
Another new regulation also introduces major uncertainties and possible costs on the technology
industry. The Federal Communications Commission this winter adopted its “net neutrality” rule,
requiring Title II regulation of the internet infrastructure on the model originally conceived for the wired
telephone network as it existed in the 1930s. While details are yet to be fully understood, uncertainty
about enforcement alone may dampen new investment in infrastructure such as fiber optic cable. And it
is unknown if the economic model of Title II regulation will diminish the economic returns available
under the previous system of light regulation and, hence, discourage new investment. Experience with
generally similar regulation applied in recent decades in the European Union (EU) suggests that such
regulation will discourage investment. A study of the Annenberg School for Communication at the
University of Pennsylvania shows that investment in broadband in Europe 2007-2012 was less than half
that in the United States and that U.S. consumers enjoyed better access to broadband at lower prices
than European consumers.37 Another study comparing the EU approach to that of the United States
concludes:38
In sum, it is not clear that Europe’s approach to net neutrality—encouraging
unbundled networks—will do much to facilitate neutral networks. Moreover, the
cost of that neutrality appears to be significantly less investment in next-generation
networks.
A final example of regulation that impedes investment is the ban on crude oil exports.39 In a
study released in 2014, we argued that lifting this ban would spur sizable new investment in both oil and
petrochemical infrastructure, encouraging over $63 billion per year in new manufacturing investment,
and that such dynamism in this sector would lead to additional investment gains in related industries
such as machinery, construction and mining equipment, and pipeline infrastructure.40 The recent decline
in oil prices has already contributed to lower investment. According to Goldman Sachs estimates, the
drag from lower oil and gas exploration will cut growth in investments in half in 2015 relative to 2014.41
The other important way to analyze the impact of regulation is to compare the growth or
diminution of regulation and the general investment environment relative to other competing nations.42
Of course many factors affect decisions about where to site important capital investment (including
R&D). These include the tax environment, availability of a skilled workforce, the legal environment,
infrastructure, and many more. The regulatory environment is clearly an important factor in such
decisions. While it is frequently asserted that the U.S. economy is relatively less regulated than some
competitors, such as Germany, the United Kingdom, China, or Japan, most competitive analyses in
recent years show that whatever U.S. advantage may once have existed is slipping away due to a more
robust pace of U.S. regulatory growth and efforts by foreign competitors to narrow the gap. For
37
Christopher S. Yoo, “U.S. vs. European Broadband Deployment: What Do the Data Say?” University of
Pennsylvania Institute for Law and Economics, Research Paper No. 14-35, June 2014,
http://papers.ssrn.com/sol3/papers.cfm?abstract_id=2510854. 38
See Scott J. Wallsten and Stephanie Hausladen, “Net Neutrality, Unbundling, and their Effects on International
Investment in Next-Generation Networks,” Review of Network Economics, Vol. 8, Issue 1, March 2009, p. 107. 39
This ban was set in place by law in 1973, but in 2014 was partially lifted by executive decision. Some scholars argue
that the entire ban could be lifted by executive action. 40
See Thomas J. Duesterberg, Donald A. Norman, and Jeffrey F. Werling, Lifting the Crude Oil Export Ban: The
Impact on U.S. Manufacturing (Washington: The Aspen Institute, 2014),
http://www.aspeninstitute.org/sites/default/files/content/upload/FINAL_Lifting_Crude_Oil_Export_Ban_0.pdf. 41
Nick Timiros, “Oil Price Drop Hurts Spending on Business Investments,” The Wall Street Journal, March 22, 2015. 42
See Ikenson, “Reversing Worrisome Trends: How To Attract and Retain Investment in a Competitive Global
Economy,” op. cit.

18 WHY IS CAPITAL INVESTMENT CONSISTENTLY WEAK IN THE 21ST CENTURY U.S. ECONOMY?
example, the Organization for Economic Cooperation and Development (OECD) maintains a “FDI
regulatory restrictiveness index” for 58, mostly developed, countries. Using a broad spectrum of
measures, the index strives to capture whether countries are open or closed to foreign investments. In
1997 the United States was well under the overall average score, registering 0.089 versus 0.138 for all
OECD members, where 1 is totally closed and 0 is totally open to FDI. But by 2013 the United States
was above the average of OECD countries, with a stable rating of 0.089, while the OECD average had
fallen to 0.069. By 2013, countries as diverse as the United Kingdom, Poland, Japan, Sweden, Latvia,
Germany, and Costa Rica all had more friendly climates for inward FDI than the United States.43
The World Economic Forum (WEF) publishes a highly watched “Global Competitiveness
Report” each year. Using over 50 separate criteria, the Forum attempts to capture the world rankings of
each country’s relative competitiveness. While the United States typically ranks high on this scale, on
the sub-index of “burden of government regulation” the 2014-2015 tables found the United States 82nd
out of 144 nations. Overall, the United States ranked third in total competitiveness.44 Another global
ranking system finds the U.S. position related to “economic freedom” to be declining. The Fraser
Institute has published its rankings, based on 42 variables, since 1980 for most countries. In that year
the United States ranked third in the “Economic Freedom of the World” index but it had fallen to 14th
by the most recent year. Moreover, in regulatory related categories, the United States fared more
poorly: in terms of “regulation” it was 21st, in terms of “freedom to trade internationally” it was 40th,
and in terms of “size of government” it was 162nd.45 All of these rankings thus show a consistent pattern
of slowly eroding global advantage due to various categories of regulation. In 2012, Harvard Business
School’s (HBS) Michael Porter and Jan Rivlin published the results of a survey of over 1,900 HBS
graduates on how they made location decisions for new plant and equipment. In their summary they
state simply that: “Considerable evidence … suggests that the U.S. is not winning enough of the
location decisions that support healthy job growth and rising wages.” And in explanation, they argue in
part: “The U.S. government is failing to tackle weaknesses in the business environment that are making
the country a less attractive place to invest and nullifying some of America’s most important
competitive strengths.”46 Regulation is an important part of Porter’s story.
Global Trade and Investment
The United States emerged from the colossal destruction of World War II as the industrial super
power of the world. Challenged by few in the wake of the devastation of Germany, Japan, and much of
industrial Eurasia, the United States enjoyed an era of unprecedented growth, prosperity, and global
economic dominance. By the 1970s, U.S. dominance began to slowly erode as the European and East
Asian economies rose from the ashes, enjoyed the advantages of the latecomer, and began to compete
again in global markets, especially for industrial goods. By the early 1970s, President Nixon felt
compelled to act to stem the tide of losing global (and domestic) market share to new industrial powers.
He authorized the Secretary of the Treasury John Connally to end the link of the dollar to gold and
devalue the U.S. dollar. Together with a 10 percent import surcharge levied at the same time, the cause
of combatting foreign economic competition was joined. This battle has continued unabated since then
as new competitors, most recently the newly developed “BRIC” countries of Brazil, Russia, India, and
China have joined the fray, along with Mexico and many others. Many have argued since the 1970s,
43
Ibid, pp. 16-17. And for 2013 data see OECD, FDI Regulatory Restrictiveness Index, 2013 (Brussels, OECD, 2015),
http://www.oecd.org/investment/index. 44
World Economic Forum, Global Competitiveness Report, 2014-15 (Geneva: WEF, 2015),
http://www.weforum.org/reports/global-competitiveness-report-2014-2015. 45
Economic Freedom of the World: 2014 Annual Report (Vancouver, BC: Fraser Institute, 2014),
http://www.fraserinstitute.org/research-news/display.aspx?id=21855. 46
Michael E. Porter and Jan W. Rivlin, “Choosing the United States,” Harvard Business Review, March 2012,
http://www.harvardbusiness.org/choosing-united-states.

THE ASPEN INSTITUTE — MANUFACTURING AND SOCIETY IN THE 21ST CENTURY 19
that “fair” and oftentimes “unfair” foreign competition can explain the slower growth, loss of jobs, and
slower investment, at least relative to the 1950s and 1960s.
While the dominant position of the United States in the immediate post war period was bound to
wane as the world recovered, further erosion of the competitive position in the last few decades was a
less obvious outcome. Figure 15 shows the slow loss of global market share for manufactured goods
exports by the United States, whose share declined from 14 percent in 2000 to 9 percent in 2013.
During this period, total U.S. exports continued to grow, by 85 percent between 2005 and 2014, but they
failed to keep pace with those of the new export super powers in Asia and the developing world. Europe
lost global market share, but not at the same pace as the United States.
A slightly different
picture emerges from an
examination of trade flows
in terms of value added.
The Apple iPhone, to take a
famous example, is
assembled in China, but the
lion’s share of the value
added originates in the
design and engineering of
the phone, and in
communication chips made
or engineered in the United
States. Germany’s luxury
cars, to take another
example, are often
assembled in the United
States or China, while key
parts are made in Germany
or nearby Slovakia.
Traditional trade statistics
count the entire value of the
resulting product according
to its last place of
substantial transformation,
hence China for the iPhone,
etc. The OECD and the
World Trade Organization
(WTO) now provide
estimates of trade flows on
a “value added” basis,
which tell a slightly better
story for the United States.
Figure 16 shows the trade
balance for the United
States using this method,
and it reduces the trade
deficit in merchandise for
4
6
8
10
12
14
16
18
2000
2001
2002
2003
2004
2005
2006
2007
2008
2009
2010
2011
2012
2013
Pe
rce
nt
of
Wo
rld
Ma
nufa
ctu
red
Exp
ort
s
Other East Asian
United States
Japan
China
Source(s): World Bank and Eurostat and MAPI Foundation
* Extra=exports to non-members
Updated1/12/2015
Figure 15
The United States Is Losing Export Market Share
EU-extra*
-600
-500
-400
-300
-200
-100
0
100
200
Gross Trade Balance Value-Added Trade Balance
$billio
ns
Manufacturing Service Agriculture, fishing, mining
Source(s): OECD-WTO TiVA and MAPI
Figure 16
Manufacturing Accounts for a Smaller Share of the Trade
Deficit in Value-Added Terms (2009)

20 WHY IS CAPITAL INVESTMENT CONSISTENTLY WEAK IN THE 21ST CENTURY U.S. ECONOMY?
the United States, while reversing it for services trade.47 Another measure of the impact of global
competition is what share of domestic U.S. consumption for manufactured goods is captured by foreign
producers. As Figure 17 illustrates, import shares of total domestic demand grew from 31 percent in
1998 to a high of 39 percent before the Great Recession, but appear to have leveled out since then at 38-
39 percent. As noted
earlier, exports from the
United States (see Figure
17 for exports’ share of
output) have grown faster,
around 85 percent in gross
terms, since 2005, than
imports which grew only at
a 40-45 percent rate.
Nonetheless, since the
value of imports is so much
larger, the trade deficit has
been reduced only
marginally.
This clear loss of
global market share, most
notably in merchandise
trade, almost certainly has
a negative impact on
domestic capital
investment. While the total measure of investment foregone due to erosion of market share is nearly
impossible to calculate, we have shown elsewhere that the most likely source of future growth in
domestic output of goods is recapturing some of the lost global market share, including domestic market
share.48 More specifically, we have given some estimates of the effect on investment in the oil and gas
sector and affiliated industries from lifting the ban on oil exports and, hence, capturing broader global
market share in this sector.49 The data cited earlier shows some stabilization or slight improvement in
U.S. export performance and regaining some domestic market share, but thus far the progress is almost
certainly too modest to spur a measurable uptick in domestic investment.
In our discussion of regulation as it affects global investment decisions, we noted that the
advantage enjoyed by the United States in its overall investment climate may be eroding. Another
concern is specifically related to trade policy. In recent years, the trade balance with countries with
which the United States has some form of free trade agreement (FTA) has generally been more
favorable than with the rest of the world. For example, the United States in 2014 had a trade surplus in
manufactured goods of $55 billion with FTA partners, but a deficit of $579 billion with non-FTA
countries.50 This experience and economic theory generally suggest that further trade opening
agreements would be helpful for recapturing global market share and spurring domestic capital
investment. The United States, however, has fallen behind other, more aggressive trade-oriented nations
in implementing new trade opening agreements. Over 400 new regional FTAs have come into effect
47
See MAPI and NAM, The Facts About Modern Manufacturing (Facts About Manufacturing’s Impact on Foreign
Trade and Investment) (Arlington, VA: MAPI, 2014). The reversal in services trade is due to how trade facilitation
services (transportation, financing, distributors) for merchandise goods are accounted for. 48
Duesterberg, The Manufacturing Resurgence, op. cit. 49
Duesterberg, Norman, and Werling, Lifting the Crude Oil Export Ban, op. cit. 50
See Bureau of Economic Analysis, Free Trade Agreements, http://trade.gov/fta/.
0
5
10
15
20
25
30
35
40
45
1998
1999
2000
2001
2002
2003
2004
2005
2006
2007
2008
2009
2010
2011
2012
2013
Pe
rce
nt
0
5
10
15
20
25
30
35
40
45
1998
1999
2000
2001
2002
2003
2004
2005
2006
2007
2008
2009
2010
2011
2012
2013
Pe
rce
nt
Export Share of Non-Duplicative Output
Source(s): U.S. Bureau of Economic Analysis and MAPI Foundation
Updated: 12/5/2014
Import Share of Domestic Demand
Figure 17
The Trade Gap Widens for Manufacturers

THE ASPEN INSTITUTE — MANUFACTURING AND SOCIETY IN THE 21ST CENTURY 21
since 1995, and the United States is party to only two of these (as well as 10 bilateral agreements. In
contrast, Mexico has three major regional agreements, adding all of Europe and Latin America to its list.
The European Union has 38 separate FTAs and is negotiating 12 more.51 Relatively open access to as
much of the world as possible is becoming a more important element of the calculus that informs global
investment decisions. One prominent example is the decision of Audi to build its newest North
American plant in Mexico, after having procured land in Tennessee with this plant in mind. According
to the Wall Street Journal, Audi’s chief executive cited Mexico’s web of FTAs, which “… give
exporters from Mexico duty-free access to markets that contain 60 percent of the world’s economic
output …” as a prime reason for choosing Mexico over the United States.52 BMW, Nissan, and the U.S.
big three all produce cars in Mexico. The United States could help itself by completing the two huge
trade agreements, with Pacific and European nations, which have been under consideration for the last
few years.
Section IV Policy Recommendations
Secular Stagnation
Perhaps this is stating the obvious, but we do believe that the investment drought is a problem
and that it is not immune from actions that can help alleviate it. It is a problem because capital
investment has been and will continue to be a source of innovation, productivity growth, and, through
various transmission mechanisms, of increases in the standard of living. We have offered substantial
evidence of these links, and the growth performance of the U.S. economy, including growth in incomes,
bears out the notion that the capital investment slowdown coincides with weaker economic productivity
growth. The secular stagnation hypothesis has some attraction in this slow growth environment, but we
think it is too often overstated. While
demographic and labor deepening
dynamism clearly have weakened, there
is probably some secular element (i.e.,
impact of the Great Recession) affecting
the numbers. It ought to be possible to
improve labor quality through better
education and targeted immigration
measures. As for the lack of innovation,
we have argued that incremental
innovation is increasingly a defining feature of the modern capitalist economy, and that there is no way
to predict if another major breakthrough, comparable to those of electrical power or the internet, is on
the horizon. Risk takers and inventors certainly have not disappeared, and there are numerous
candidates now on the horizon for major new technologies: robotics, 3-D printing, the Internet of
things, and new energy generation and storage technologies are just a few.
51
See World Trade Organization, Participation in Regional Trade Agreements, https://www.wto.org/english/tratop
_e/region_e/rta_participation_map_e.htm. 52
See Dudley Althaus and William Boston, “Why Auto Makers Are Building New Factories in Mexico, Not the U.S.,”
The Wall Street Journal, March 18, 2015, p. A-1, http://www.wsj.com/articles/why-auto-makers-are-building-new-
factories-in-mexico-not-the-u-s-1426645802.
Risk takers and inventors certainly have not
disappeared, and there are numerous candidates
now on the horizon for major new technologies:
robotics, 3-D printing, the Internet of things, and
new energy generation and storage technologies
are just a few.

22 WHY IS CAPITAL INVESTMENT CONSISTENTLY WEAK IN THE 21ST CENTURY U.S. ECONOMY?
Trade Policy Related to the secular stagnation argument is one extensively employed by the predecessor to
this theory, that of economic maturity. This idea too rested on a foundation of technology saturation but
also on a dearth of demand. Labor market weakness, an aging and slow growing demographic dynamic,
and income stagnation and inequality are often linked to this phenomenon.53 The demand stagnation
notion is often inelegantly associated with the loss of market share for U.S. industry in a globalized
economy. But while
recognizing the reality of
some of these
developments, we do not
accept the notion that they
represent a permanent
condition. Slower consumer spending, for instance, is certainly due in large part to the need to
rebalance personal balance sheets. On the positive side, immigration has been a constant force for
renewal and demographic strength in the United States. The United States has lost global market share,
especially in goods, but that market is growing rapidly, as billions of people in Asia and elsewhere enter
the middle class and become viable consumers. U.S. export performance in the last decade has
improved and continual attention to factors which affect its competitiveness (see below) can extend this
improvement. Being more aggressive in opening new markets through trade agreements, especially the
TTIP and TPP initiatives, would go a long way to strengthen total demand. Consistent enforcement of
WTO and IMF restrictions on IPR infringement, dumping, currency manipulations, and other trade
distorting would also aid U.S. producers in access to growing global demand. Eliminating the ban on oil
exports would open up vast new markets and provide a direct stimulus to sizable domestic capital
investment.
Corporate Tax Reform
There are a number of other specific policy measures that would help spur a reversal of
investment, either directly or indirectly, through channels that strengthen overall competitiveness or
total demand. Changing our corporate tax structure is one step—perhaps the most important step—that
can be taken to increase investment spending. There are many competing proposals as to how the
corporate tax structure should be changed.54 One is the Fiscal Commission Plan (the Bowles-Simpson
Plan) that was introduced in 2010. This plan would lower the top statutory corporate income tax rate
from 35 percent to 28 percent. The plan would make up for lost tax revenue by broadening the tax base.
The net impact, however, would be to raise the effective cost of capital in the corporate sector by 5
percent, according to Ernst & Young.
A second proposal, known as the Growth and Investment Plan, was proposed in 2005 by the
President’s Advisory Panel on Tax Reform. This plan would lower the top corporate statutory tax rate
to 30 percent and would allow businesses to expense new business investment, remove interest from the
business tax base, and reduce investor-level taxes on dividends, capital gains and interest. Because
immediate deductibility of investment is allowed, the cost of capital for the corporate sector as a whole
would be lowered by 21 percent. A proposal like or similar to the Growth and Investment Plan clearly
would provide an incentive for increased investment. Other plans abound. President Obama, House
Ways and Means Chairman, Paul Ryan, Senators Rubio and Lee, and Senate Finance leaders Hatch and
Wyden all have plans.
53
See especially, Gordon, op. cit. 54
For a detailed analysis of these two alternatives, see Ernst & Young, Impact of Two Proposed Federal Tax Reform
Plans on Business Investment Incentives: Alternative Approaches to Business Tax Reform. A Special Report prepared
for the American Council for Capital Formation.
The United States, however, has fallen behind other, more
aggressive trade-oriented nations in implementing new
trade opening agreements.
THE ASPEN INSTITUTE — MANUFACTURING AND SOCIETY IN THE 21ST CENTURY 23
Enacting any type of tax reform is one
of the most difficult legislative challenges for
Congress. If this were not the case, the
corporate tax code would have been changed
long ago. There is broad agreement that the
high marginal corporate tax rates paid by U.S.
companies discourage investments; that the
taxation of income earned abroad at these high
tax rates works against the repatriation of
earnings; and that corporate tax reform should
be fiscally responsible. There is also the issue
of the double taxation of corporate earnings when they are paid out as dividends or when investors
realize capital gains, and the question of keeping full or accelerated depreciation of capital investment to
encourage investment decisions. The chief problem in gaining a consensus on tax reform is that
industries will be affected in different ways with some being winners and others losing. There is no
magic solution to this problem, but it is clear the current corporate tax code discourages investment by
U.S. companies and tax reform that reduced marginal tax rates, quickened depreciation schedules, and
encouraged companies to repatriate foreign earnings would provide incentives for increased investment.
One cannot forget subchapter S and other pass through firms, which represent hundreds of
thousands of businesses which often are innovators and job creators and account for almost 40 percent
of all U.S. business activity. Lowering the C-corporation tax rate would open an even wider gap
between the rates paid by the two major types of firms. For pass through firms to remain dynamic and
competitive, some neutrality with C-corporations (lowering the statutory rate in line with C-
corporations) and sensitivity to the impact of loophole closing measures should be considered.55
Simplification of the tax code, partly by trading off costs due to lower rates for eliminating some
preferences would help both small and large firms by freeing up resources for more productive use than
tax compliance.
Research and Development
We noted in the first section of this paper that federal, state, and local investment in research and
infrastructure has been weak to declining in recent decades. Federal R&D expenditures, especially for
basic research, are important to innovation, particularly in an era in which private sector firms have
difficulty in devoting cash to high risk basic research.56 A steady and robust federal budget for basic
research is something that not only adds to investment but plants seeds for breakthrough technology
over the long run. Physical infrastructure—roads, airports, ports, and water systems in the United
States—have been under-funded for many years. Despite continued calls for a renewed commitment to
infrastructure spending and a brief spurt of federal spending to combat the Great Recession, federal,
state, and local budgets are constantly squeezed by rising commitments for health, income support, and
pensions. Some rebalancing of priorities to free up funds to repair infrastructure, so important in
meeting simple needs such as clean water for semiconductor fabrication plants, electrical transmission
lines to power the internet, or pipelines to transport new found oil and gas resources, would be helpful to
spur investment and growth in our economy.
55
See “Should Main Street Business Elect C-Corp Status? No!” S Corporation Association of America, February 2015.
See URL for a discussion of some of the relevant issues: http://s-corp.org/2015/02/04/should-main-street-businesses-
elect-c-corp-status-no/. 56
For an analysis of the strong correlation between federal support for basic research and innovation, see Jeremy
Leonard and Cliff Waldman “An Empirical Model of the Sources of Innovation in the U.S. Manufacturing Sector: One
Must Look Beyond R&D To Understand Innovation,” NABE Business Economics, Vol. 42, October 2007, No. 4,
http://nabe-web.com/publib/be/0704/leonard.html.
There is no magic solution to this problem,
but it is clear the current corporate tax code
discourages investment by U.S. companies
and tax reform that reduced marginal tax
rates, quickened depreciation schedules, and
encouraged companies to repatriate foreign
earnings would provide incentives for
increased investment.

24 WHY IS CAPITAL INVESTMENT CONSISTENTLY WEAK IN THE 21ST CENTURY U.S. ECONOMY?
Uncertainty and Political
Polarization
The possible policy remedies to address the effects of uncertainty are less obvious and perhaps
less specific than for taxation or infrastructure. Bloom and his collaborators have constructed a complex
index, and some recent work does identify and address “policy related uncertainty.”57 They note the
consistent rise in overall size, complexity, and reach of government programs—mainly measured by
growth in taxes, spending, and regulation. We also described other efforts to explain the relative
decline in competitiveness due to growth of some of these factors. The Stanford team, additionally,
links uncertainty to “increased political polarization.” Specific measures such as constant changes in the
tax code, some provisions of which must be renewed every year, major disruptions in government
programs, and more extensive regulation are difficult to counter in an era of polarization. But it is
possible to conceive of more consistent and stable political conditions and some reduction of partisan
rancor as helpful in reducing uncertainty, especially if it can be shown to generate positive economic
benefit. The experience of the 1980s and 1990s is helpful to recall in this regard.
Other research suggests the theory that the impact of uncertainty on the economy is mediated by
the transmission mechanisms of financial markets.58 That is, uncertainty results in more restrictive
lending conditions, reduced propensity to commence or provide credit for “irreversible” capital
intensive projects, and in turn to less credit availability. The most powerful impact is on capital
investment, but purchases of both durables and non-durables are also affected. It is conceivable that
monetary policy could reduce the impact of heightened uncertainty by offsetting the worst of the
financial market effects. For instance, the stock market crash of 1987 did not result in a recession partly
due to a quick response from the Federal Reserve Board to provide liquidity. Most believe that the
impact of the Great Recession also was mitigated by monetary policy.
Regulation
The final arena in which policy could work to promote investment is in the broad and complex
area of regulation. Many factors, from environmental to health and worker safety and prudential
regulation of financial institutions fall under this rubric. We noted at the outset that each democratic
polity must try to balance decisions about regulation based on social analysis and on socio-cultural
choices. Some improved form of cost-benefit analysis is needed to assist in this process. Some
regulations have “unintended consequences” that might merit a second look when they appear. For
example, in our zeal to tamp down the excess speculation in financial markets following the Great
Recession, new restrictions on trading, new capital requirements, and enhanced regulatory oversight of
financial institutions may have led to reduced liquidity in those markets (hence less investment). In
recent comments, former Treasury Secretary Larry Summers said “… regulators should make a priority
of addressing the problems of bond market liquidity, brought on by their very efforts to make
institutions safer after the financial crisis.”59 We also noted earlier that regulatory costs faced by U.S.
companies are greater than those placed on many competitors in both the developed and developing
countries. The ease of doing business, the sheer number and complexity of regulations, and the
cumulative cost of same has slowly worsened the competitive position of the United States and deterred
investment decisions of both domestic and foreign firms in the U.S. economy. It is our view that cost-
benefit analyses provide cover for proposed regulations and often do not take such costs seriously.
57
Baker, et al., “Why Has U.S. Policy Uncertainty Risen Since 1960,” op. cit. 58
S. Gilchrist, J. Sim and E. Zakrajsek, “Uncertainty, Financial Frictions, and Investment Dynamics,” Finance and
Economics Discussion Series, Divisions of Research & Statistics and Monetary Affairs, Federal Reserve Board, Paper
No. 2014-69, 2014. 59
Patti Domm, “Summers agrees with Dimon: There’s a Liquidity Problem,” NBC.com, April 9, 2015.

THE ASPEN INSTITUTE — MANUFACTURING AND SOCIETY IN THE 21ST CENTURY 25
Consequently, the balance has become skewed in favor of increasing the regulatory burden. We have no
magic bullet to suggest to rebalance the complicated equation, but hope that analysis like ours showing
the long-term impact on basic investment will help resuscitate a reasonable democratic discussion of the
trade-offs.
Additionally, there are tools available to the Executive and Legislative branches of government
to review, change, and eliminate poorly conceived, anachronistic or overly burdensome regulations.
More reliance on the powers of the Office of Information and Regulatory Affairs at The White House or
broader use of Congressional Oversight through the Congressional Review Act ought to be starting
points for redressing the balance. Much of the thrust for increased regulation in recent years has come
from the federal government, in some cases adopting national regulations in areas long left to some
states. One example is the recent imposition on states of federal standards for hydraulic fracturing. The
new “one size fits all” standards override standards already in place in states with diverse geographies,
such as Colorado and Ohio. Standards at the state level were developed with input from industry, civil
society, and state environmental officials, all of whom had a better understanding of their states’
resource bases and conditions. Such experimentation at the state level has historically been part of the
process of finding good balance between competing interests, and we think it should be the default
option in most cases.
Concluding Remarks
A number of factors have contributed to the lag in investment spending that has become
increasingly apparent since the bursting of the dot-com bubble. The slowing of investment spending has
resulted in slower productivity growth and, in turn, a lower rate of economic growth. While there has
been much concern expressed about the tepid rate of recovery from the Great Recession, a growing
number of economists believe that recent trends reflect the new normal. That is, the potential growth
rate of the U.S. economy going forward cannot be expected to match the economy’s performance
between the end of World War II and 2000.
The outlook for slower economic growth is partly a consequence of demographic and education
trends which are largely beyond the influence of economic policy. Investment spending also is
influenced by factors ranging from uncertainty, a reduction in animal spirits and entrepreneurialism, and
by limited technological opportunities that are on the horizon. Factors like these are not easily dealt with
by economic policy.
Other factors that influence investment spending can, however, be affected by economic policy.
Corporate tax reform that makes U.S. companies more competitive in global markets, reducing
uncertainty regarding the course of economic (including monetary) policies, increasing spending for
research and development and for an aging and deteriorating infrastructure, negotiating additional free
trade agreements, and regulatory reform that pays attention to the costs that an ever-increasing number
of regulations impose on companies and which makes it easier for companies to start new businesses
would contribute to increased investment, greater productivity growth and, ultimately, a higher rate of
economic growth and living standards than we will have if we remain on the current path.

About the Authors
Thomas J. Duesterberg, Ph.D.
Tom is Executive Director of the Manufacturing and Society in the 21st Century
program at the Aspen Institute. He recently retired as President and CEO of the
Manufacturers Alliance/MAPI, an economic research and executive education
organization based in Arlington, Virginia, with more than 500 manufacturing
firms as members. Previous positions include: Director of the Washington Office
of The Hudson Institute, Assistant Secretary for International Economic Policy at
the U.S. Department of Commerce, chief of staff to two members of Congress,
and associate instructor at Stanford University. His commentary and analysis on
manufacturing, economic performance, globalization, and related policy issues
can be found in major news outlets.
He holds a B.A. degree from Princeton and M.A. and Ph.D. degrees from Indiana University.
Donald A. Norman, Ph.D.
Don is a director of economic studies and council director of the CFO and
Finance Councils at MAPI. Norman writes extensively on a broad range of
issues, including energy and its implications for the manufacturing sector,
conservation and energy efficiency, the determinants of investment, stock market
valuations, and benchmarking audit fees. He compiles the quarterly MAPI
Foundation Business Outlook, which provides an accurate near-term indicator of
manufacturing sector business prospects. Norman is frequently invited to make
presentations at industry events, conferences, and corporate meetings, such as
with Toyota Materials Handling, U.S.A.; Motion Industries; Morgan Advanced
Materials; the National Fluid Power Association; and the Aspen Institute’s
Manufacturing and Society in the 21st Century.
Norman’s experience includes economic research and teaching. Before joining MAPI, he was a research
manager at the American Petroleum Institute and a staff economist at the Federal Trade Commission. He
also taught at the University of California at Santa Barbara and the California State University, Long
Beach.
Norman holds a Ph.D. in economics from UCLA, an MBA from George Mason University, and an M.A.
and B.A. in economics from UCLA.