Embed Size (px)
Citation preview

LOGO
LOGOwww.themegallery.com
LOGO2
LOGO3
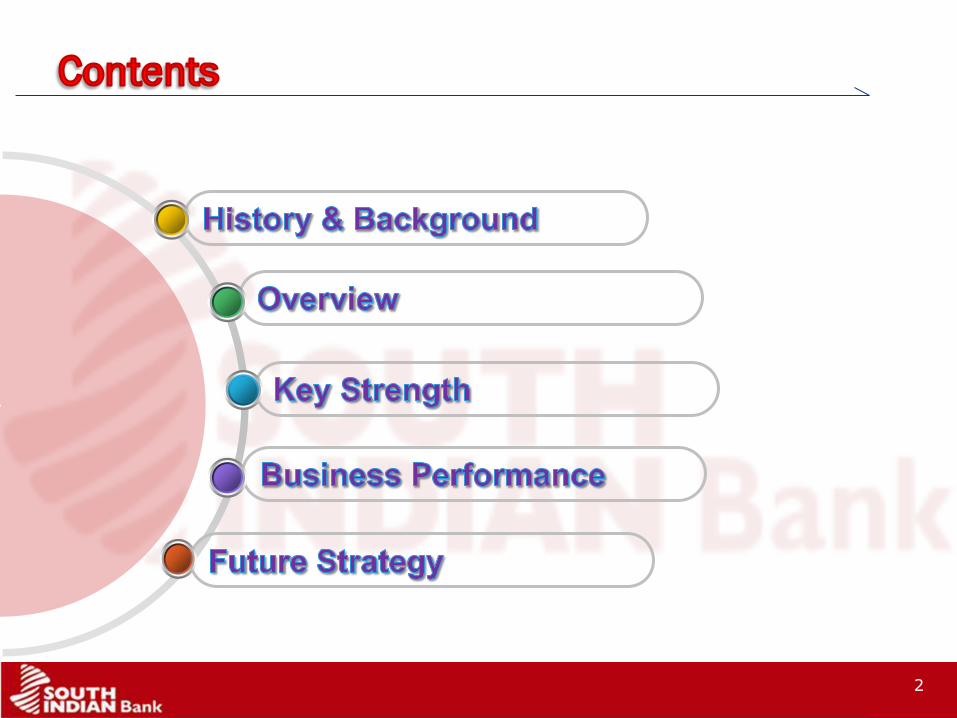
HISTORY & BACKGROUND
LOGO
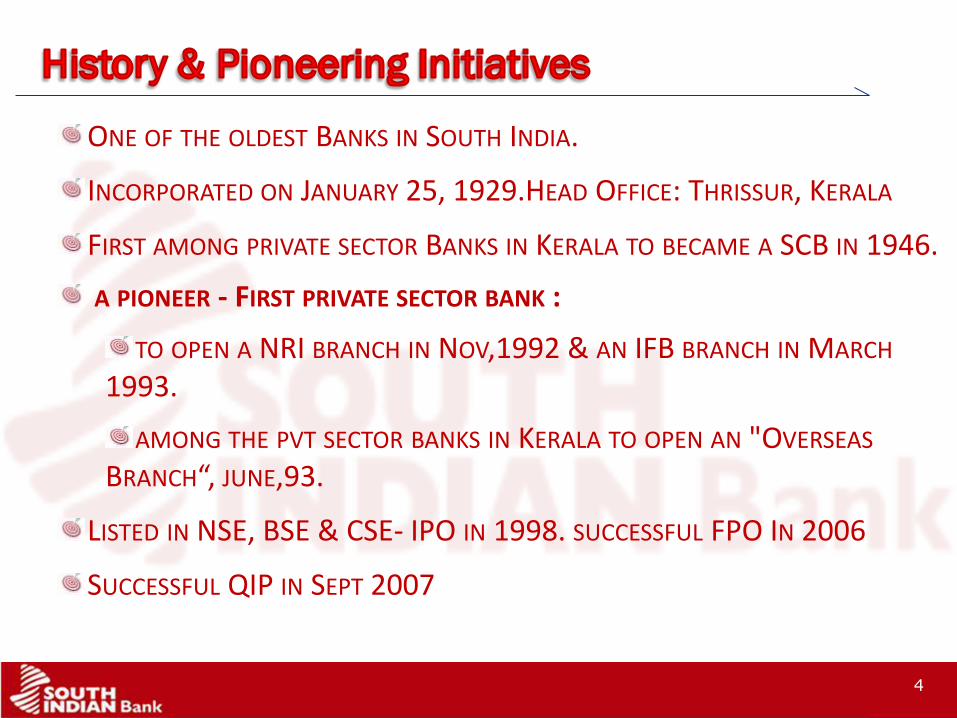
ONE OF THE OLDEST BANKS IN SOUTH INDIA.
INCORPORATED ON JANUARY 25, 1929.HEAD OFFICE: THRISSUR, KERALA
FIRST AMONG PRIVATE SECTOR BANKS IN KERALA TO BECAME A SCB IN 1946.
A PIONEER - FIRST PRIVATE SECTOR BANK :
TO OPEN A NRI BRANCH IN NOV,1992 & AN IFB BRANCH IN MARCH
1993.
AMONG THE PVT SECTOR BANKS IN KERALA TO OPEN AN "OVERSEAS
BRANCH“, JUNE,93.
LISTED IN NSE, BSE & CSE- IPO IN 1998. SUCCESSFUL FPO IN 2006
SUCCESSFUL QIP IN SEPT 2007
4
LOGO5
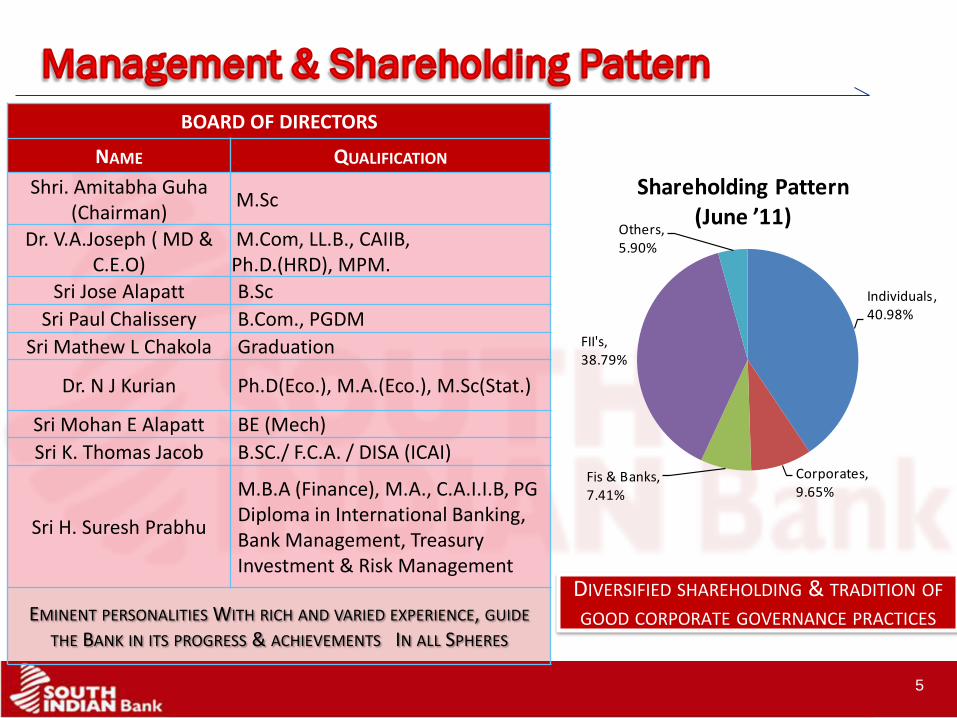
Individuals,40.98%
Corporates,9.65%
Fis & Banks,7.41%
FII's,38.79%
Others,5.90%
Shareholding Pattern (June ’11)
BOARD OF DIRECTORS
NAME QUALIFICATION
Shri. Amitabha Guha(Chairman)
M.Sc
Dr. V.A.Joseph ( MD & C.E.O)
M.Com, LL.B., CAIIB, Ph.D.(HRD), MPM.
Sri Jose Alapatt B.Sc
Sri Paul Chalissery B.Com., PGDM
Sri Mathew L Chakola Graduation
Dr. N J Kurian Ph.D(Eco.), M.A.(Eco.), M.Sc(Stat.)
Sri Mohan E Alapatt BE (Mech)
Sri K. Thomas Jacob B.SC./ F.C.A. / DISA (ICAI)
Sri H. Suresh Prabhu
M.B.A (Finance), M.A., C.A.I.I.B, PG Diploma in International Banking, Bank Management, Treasury Investment & Risk Management
EMINENT PERSONALITIES WITH RICH AND VARIED EXPERIENCE, GUIDE
THE BANK IN ITS PROGRESS & ACHIEVEMENTS IN ALL SPHERES
DIVERSIFIED SHAREHOLDING & TRADITION OF
GOOD CORPORATE GOVERNANCE PRACTICES
LOGO6
CORPORATE VISION
MISSION
TO EMERGE AS THE MOST PREFERRED BANK IN THE COUNTRY IN TERMS OF BRAND, VALUES,PRINCIPLES WITH CORE COMPETENCE IN FOSTERING CUSTOMER ASPIRATIONS, TO BUILD HIGH
QUALITY ASSETS LEVERAGING ON THE STRONG AND VIBRANT TECHNOLOGY PLATFORM IN PURSUIT
OF EXCELLENCE AND CUSTOMER DELIGHT AND TO BECOME A MAJOR CONTRIBUTOR TO THE
STABLE ECONOMIC GROWTH OF THE NATION.
TO PROVIDE A SECURE, AGILE, DYNAMIC AND CONDUCIVE BANKING ENVIRONMENT TO
CUSTOMERS WITH COMMITMENT TO VALUES AND UNSHAKEN CONFIDENCE, DEPLOYING THE BEST
TECHNOLOGY, STANDARDS, PROCESSES AND PROCEDURES WHERE CUSTOMER CONVENIENCE IS OF
SIGNIFICANT IMPORTANCE AND TO INCREASE THE STAKEHOLDERS’ VALUE.
LOGO7
LOGO8
LOGO
HIGHLIGHTS
No of years in banking business 82 years
No of branches 643
No of ATM’s 533
Business as on Quarter end June 2011-2012 ` 53773 Crore
Last 5 years business CAGR ~26%
Net Interest Margin (June 11) 2.8%
Capital Adequacy Ratio (Basel II -June ’11) 13.51%
Net Non-Performing Assets (June ’11) 0.29%
9
LOGO10
OVERVIEW
LOGO
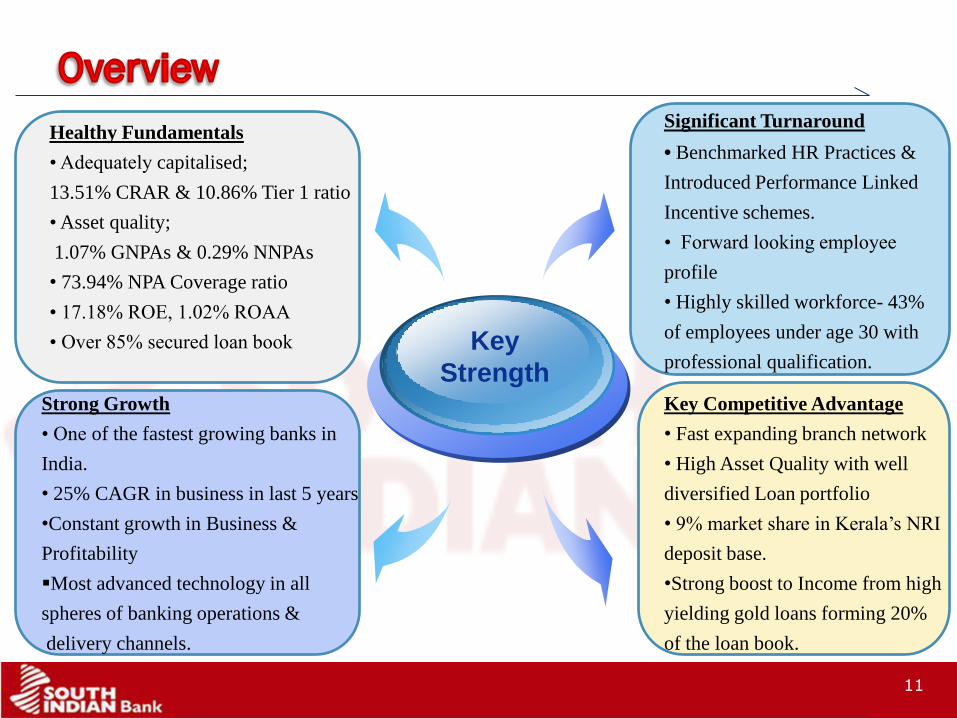
Healthy Fundamentals
• Adequately capitalised;
13.51% CRAR & 10.86% Tier 1 ratio
• Asset quality;
1.07% GNPAs & 0.29% NNPAs
• 73.94% NPA Coverage ratio
• 17.18% ROE, 1.02% ROAA
• Over 85% secured loan book Key
Strength
Significant Turnaround
• Benchmarked HR Practices &
Introduced Performance Linked
Incentive schemes.
• Forward looking employee
profile
• Highly skilled workforce- 43%
of employees under age 30 with
professional qualification.
Strong Growth
• One of the fastest growing banks in
India.
• 25% CAGR in business in last 5 years
•Constant growth in Business &
Profitability
Most advanced technology in all
spheres of banking operations &
delivery channels.
Key Competitive Advantage
• Fast expanding branch network
• High Asset Quality with well
diversified Loan portfolio
• 9% market share in Kerala’s NRI
deposit base.
•Strong boost to Income from high
yielding gold loans forming 20%
of the loan book.
11
LOGO
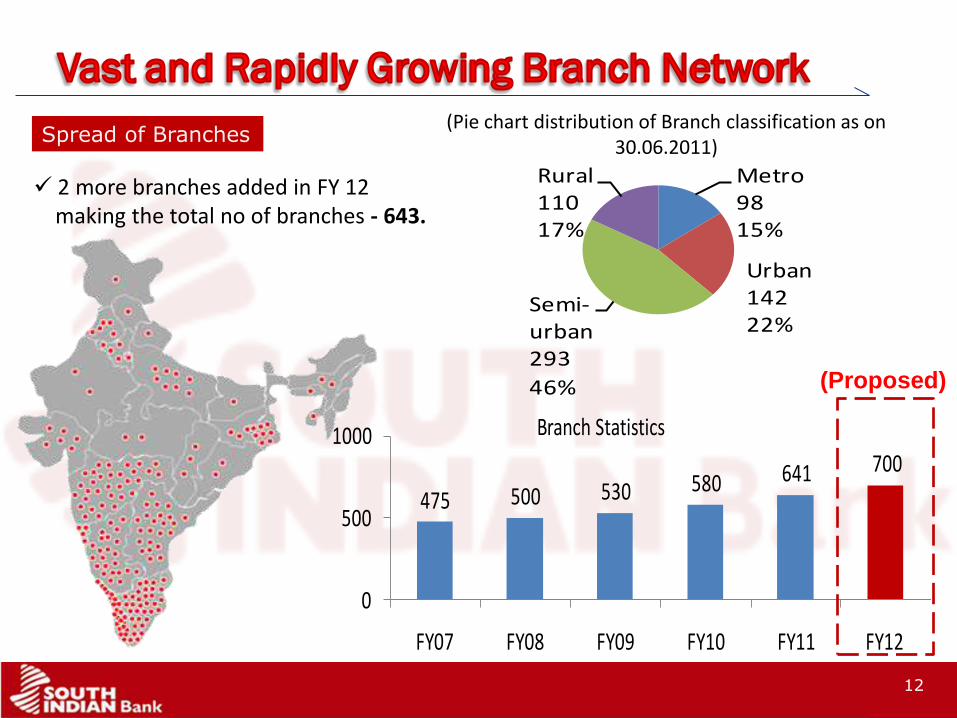
475 500 530 580 641 700
0
500
1000
FY07 FY08 FY09 FY10 FY11 FY12
Branch Statistics
Spread of Branches
Metro9815%
Urban14222%
Semi-urban293
46%
Rural11017%
12
(Pie chart distribution of Branch classification as on 30.06.2011)
2 more branches added in FY 12making the total no of branches - 643.
(Proposed)
LOGO13
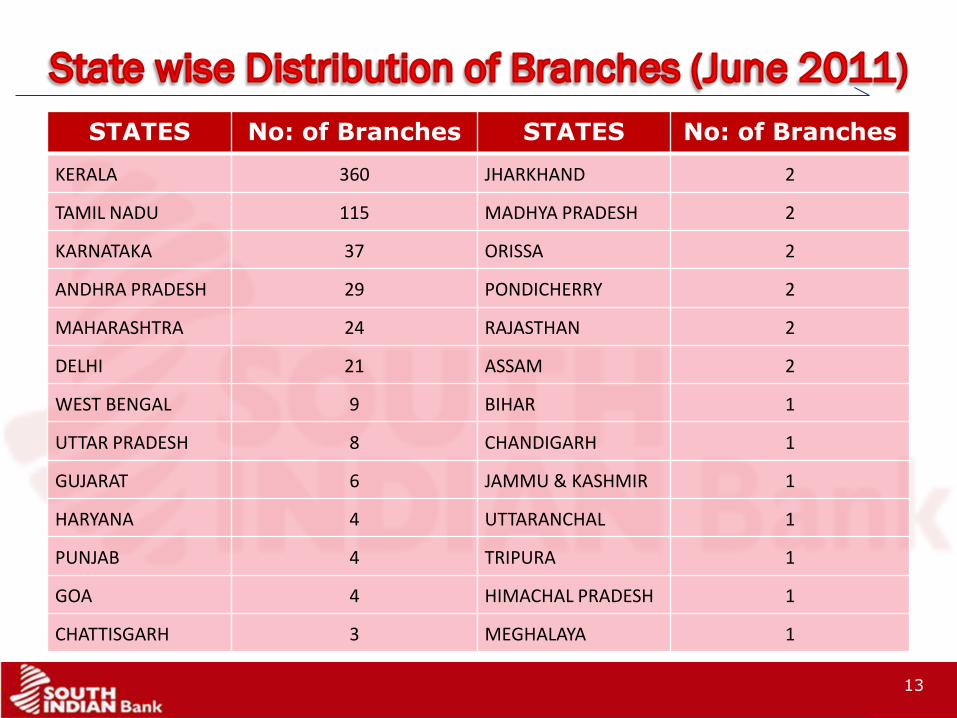
STATES No: of Branches STATES No: of Branches
KERALA 360 JHARKHAND 2
TAMIL NADU 115 MADHYA PRADESH 2
KARNATAKA 37 ORISSA 2
ANDHRA PRADESH 29 PONDICHERRY 2
MAHARASHTRA 24 RAJASTHAN 2
DELHI 21 ASSAM 2
WEST BENGAL 9 BIHAR 1
UTTAR PRADESH 8 CHANDIGARH 1
GUJARAT 6 JAMMU & KASHMIR 1
HARYANA 4 UTTARANCHAL 1
PUNJAB 4 TRIPURA 1
GOA 4 HIMACHAL PRADESH 1
CHATTISGARH 3 MEGHALAYA 1
LOGO14
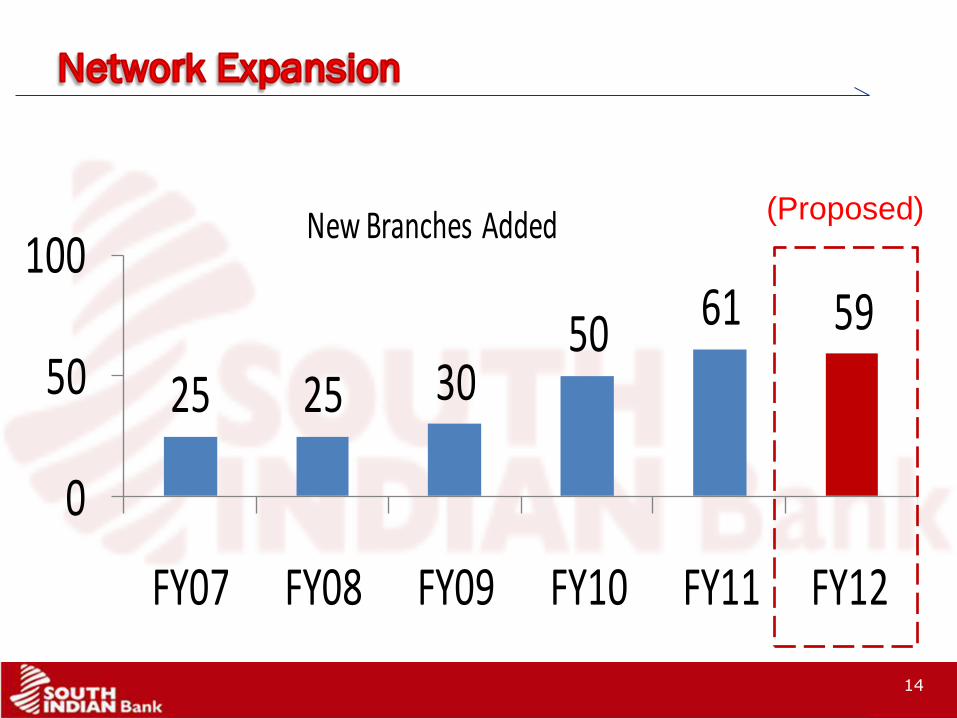
25 25 3050 61 59
0
50
100
FY07 FY08 FY09 FY10 FY11 FY12
New Branches Added (Proposed)
LOGO
Project SIBERTECH- 100% Core Banking Solution (CBS) using FINACLE from Infosys.
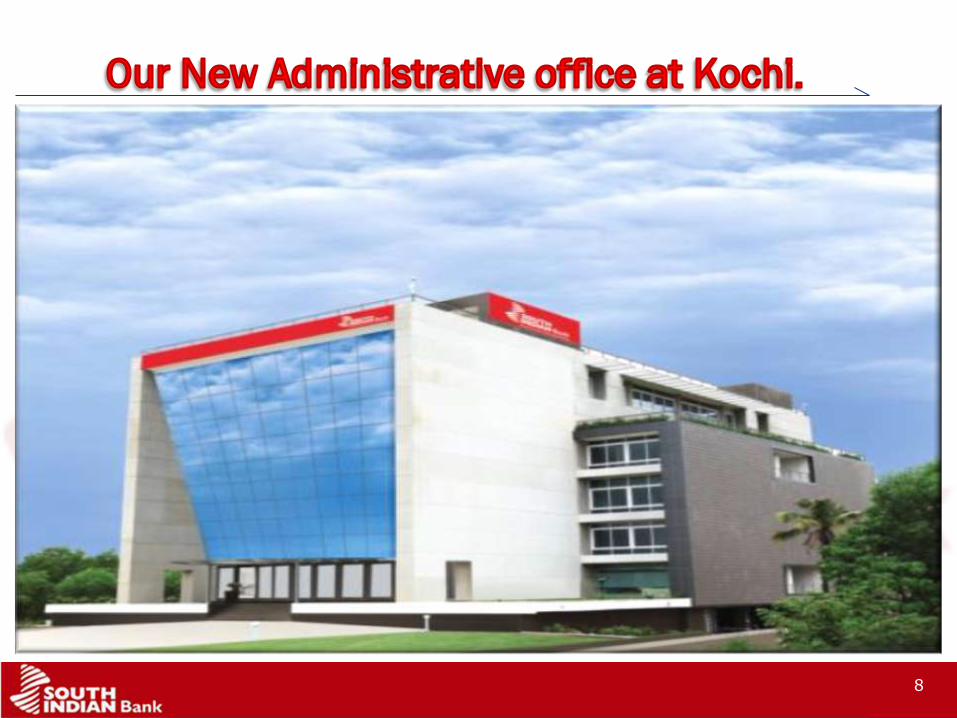
Centralized Data Centre with most advanced technological platform in a new state of the art “Green”
complied building at Kochi, Kerala.
Emphasis on IT security & Risk Management - Disaster-recovery site at Bangalore for CBS & Regular IS
Audits.
Member of INFINET & 533 On-line ATMs through NFS tie-up with other banks
A host of hi-tech products- International debit & credit cards, high speed & secure Internet & Mobile
Banking for retail & corporate clients.
Online Value added services - Stock trading, ticket booking, mobile recharges, shopping, Utility
payments, offerings.
SIB FINS Card -A smartcard based FI initiative in association with M/s Coromandel Infotech India Ltd.,
Chennai, as the technology service provider.
Successfully implemented RTGS & NEFT in all branches.
Successfully launched Smart card at Christ University, Bangalore which works as Access card, Identity
card, ATM card and card for payment of fees in Christ College for around 10000 students.
Best-in-class IT products & solutions in all banking operations like Treasury, Risk Management,
AML, Credit Processing, HR, Audit & KYC.
15
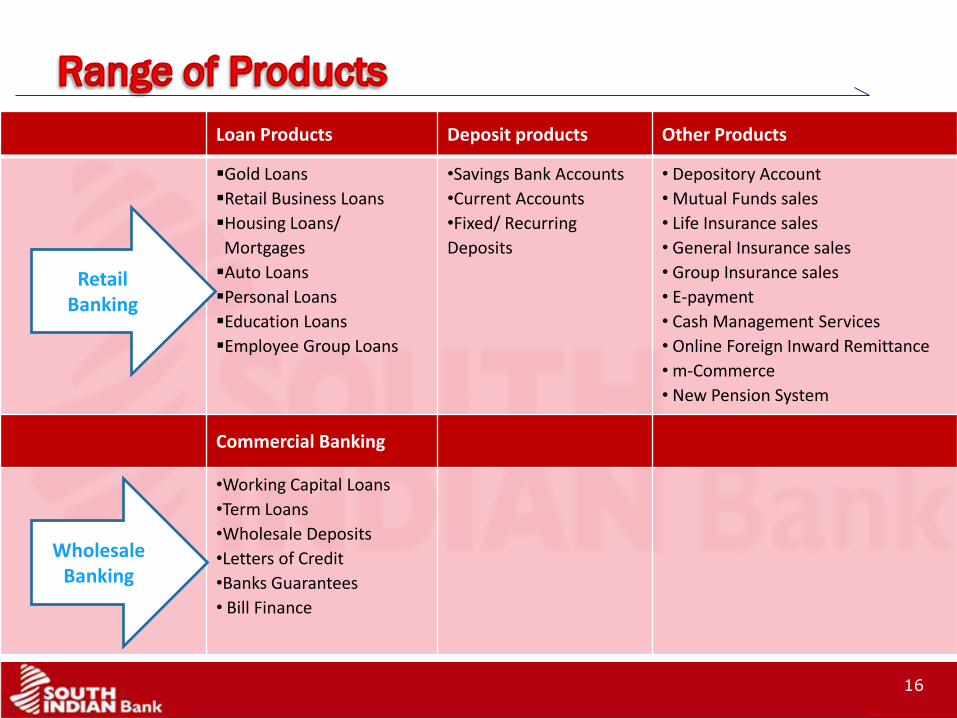
LOGO
Loan Products Deposit products Other Products
Gold Loans
Retail Business Loans
Housing Loans/
Mortgages
Auto Loans
Personal Loans
Education Loans
Employee Group Loans
•Savings Bank Accounts
•Current Accounts
•Fixed/ Recurring
Deposits
• Depository Account
• Mutual Funds sales
• Life Insurance sales
• General Insurance sales
• Group Insurance sales
• E-payment
• Cash Management Services
• Online Foreign Inward Remittance
• m-Commerce
• New Pension System
Commercial Banking
•Working Capital Loans
•Term Loans
•Wholesale Deposits
•Letters of Credit
•Banks Guarantees
• Bill Finance
Retail Banking
16
Wholesale Banking
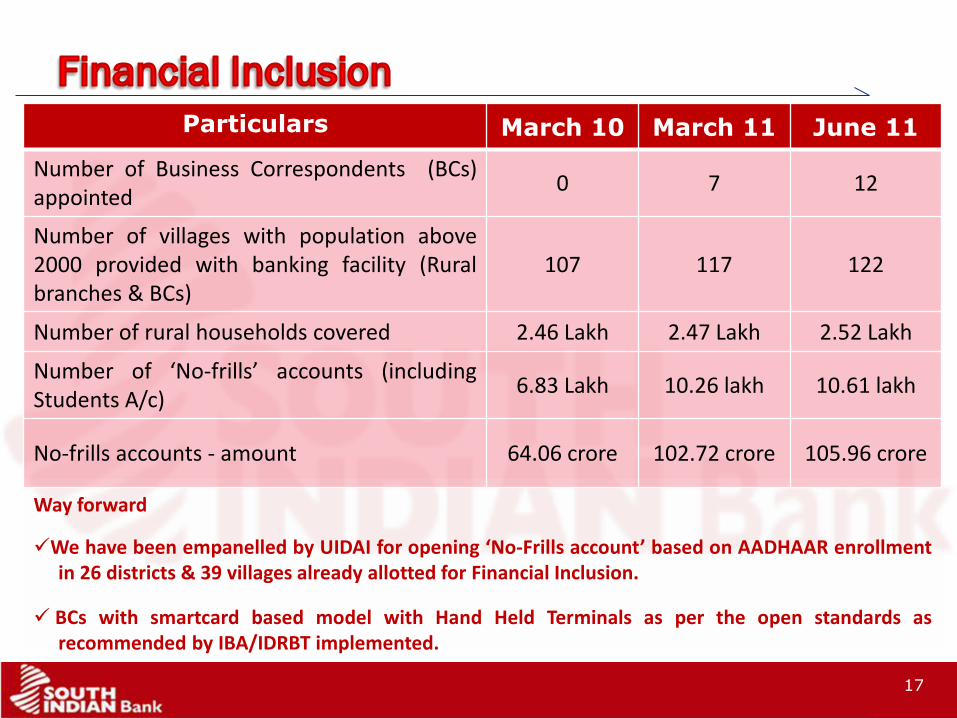
LOGO
Particulars March 10 March 11 June 11
Number of Business Correspondents (BCs)appointed
0 7 12
Number of villages with population above2000 provided with banking facility (Ruralbranches & BCs)
107 117 122
Number of rural households covered 2.46 Lakh 2.47 Lakh 2.52 Lakh
Number of ‘No-frills’ accounts (includingStudents A/c)
6.83 Lakh 10.26 lakh 10.61 lakh
No-frills accounts - amount 64.06 crore 102.72 crore 105.96 crore
Way forward
We have been empanelled by UIDAI for opening ‘No-Frills account’ based on AADHAAR enrollment. in 26 districts & 39 villages already allotted for Financial Inclusion.
BCs with smartcard based model with Hand Held Terminals as per the open standards as. recommended by IBA/IDRBT implemented.
17
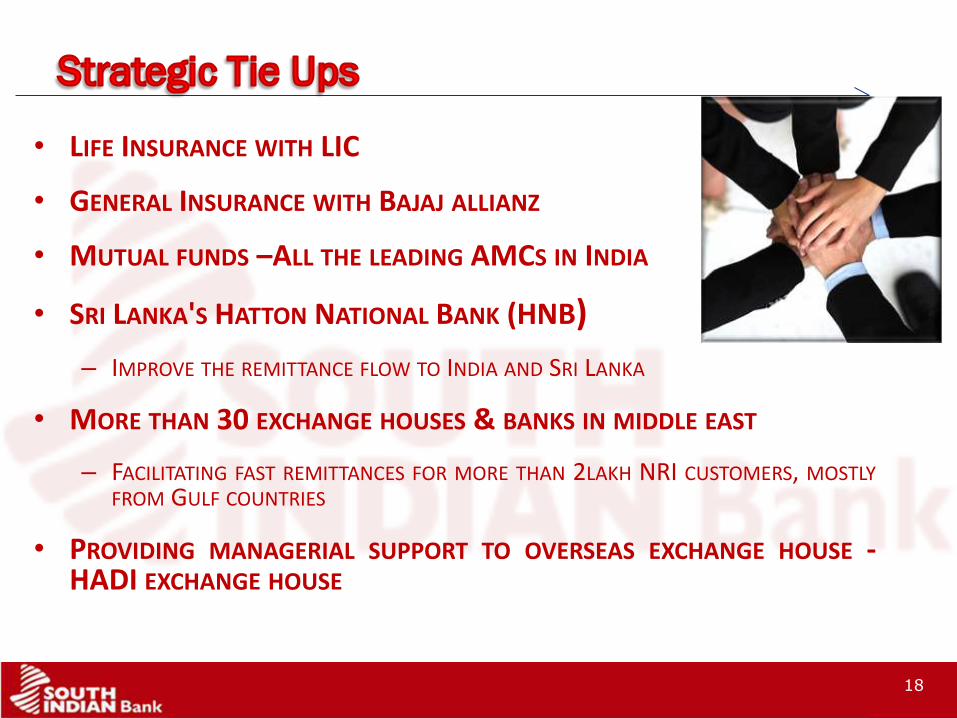
LOGO
• LIFE INSURANCE WITH LIC
• GENERAL INSURANCE WITH BAJAJ ALLIANZ
• MUTUAL FUNDS –ALL THE LEADING AMCS IN INDIA
• SRI LANKA'S HATTON NATIONAL BANK (HNB)
– IMPROVE THE REMITTANCE FLOW TO INDIA AND SRI LANKA
• MORE THAN 30 EXCHANGE HOUSES & BANKS IN MIDDLE EAST
– FACILITATING FAST REMITTANCES FOR MORE THAN 2LAKH NRI CUSTOMERS, MOSTLYFROM GULF COUNTRIES
• PROVIDING MANAGERIAL SUPPORT TO OVERSEAS EXCHANGE HOUSE -HADI EXCHANGE HOUSE
18
LOGO
NO. 1 in Asset Quality- Business Today Ranking of Banks.
Best Bank in Asset Quality Award - Dun & Bradstreet
Best NPA Manager- ASSOCHAM- ECO Pulse Survey.
Top Performer in Asset Quality- Analyst 2008 Survey.
Best Asian Banking Website - Asian Banking & Finance Magazine, Singapore.
Best Old Pvt Sector Bank - Financial Express India's Best Banks 2008-2009.
Best Pvt Sector bank in the Service quality segment
Outlook Money - CFore Survey.
Best Website Award from Kerala Management Association
India’s Best Bank 2010 Award – “Businessworld – Price Water House Coopers
. Best Banks Survey 2010”
19
LOGO20
BUSINESS PERFORMANCE
LOGO
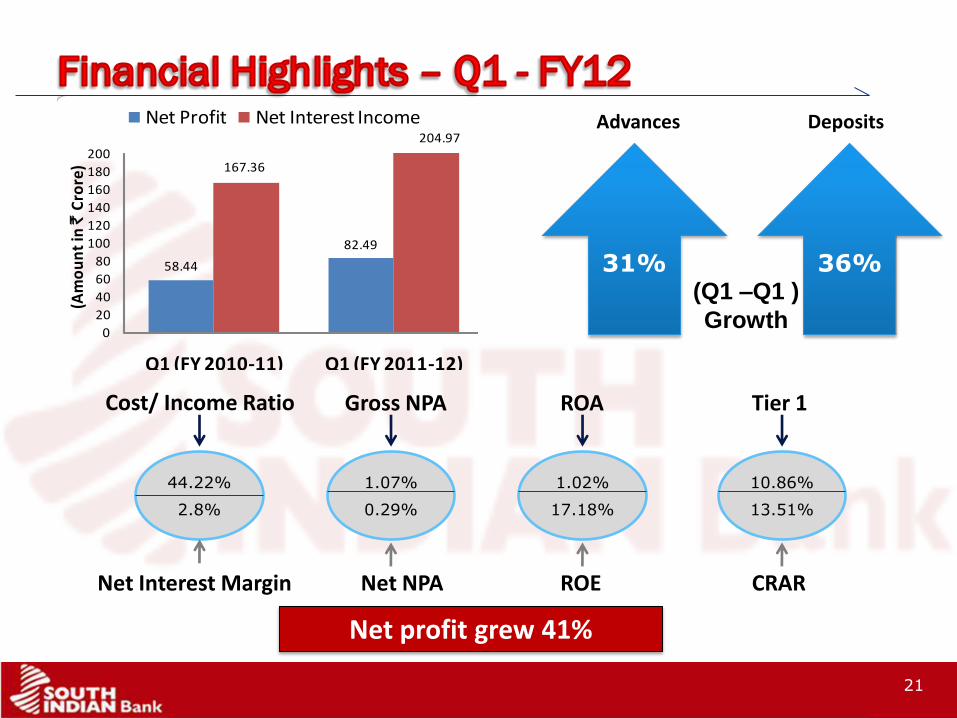
58.44
82.49
167.36
204.97
0
20
40
60
80
100
120
140
160
180
200
Q1 (FY 2010-11) Q1 (FY 2011-12)
Net Profit Net Interest Income
(Am
ou
nt
in `
Cro
re)
31%
Net profit grew 41%
Advances Deposits
21
36%
44.22%
2.8%
Cost/ Income Ratio Gross NPA ROA Tier 1
Net Interest Margin Net NPA ROE CRAR
1.07%
0.29%
1.02%
17.18%
10.86%
13.51%
(Q1 –Q1 )
Growth
LOGO
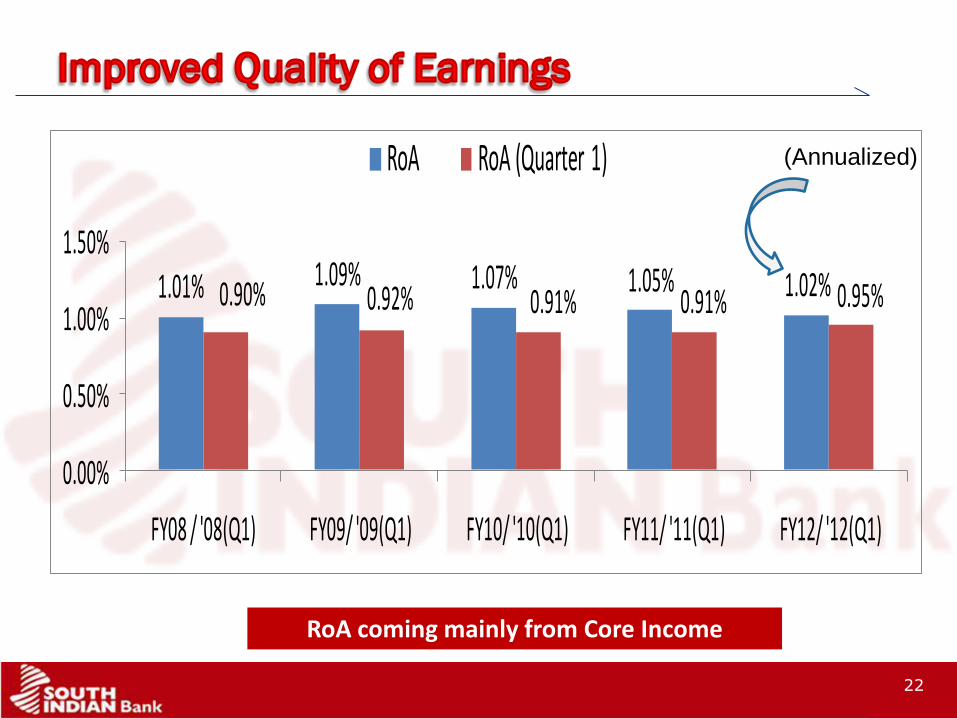
RoA coming mainly from Core Income
22
1.01% 1.09% 1.07% 1.05% 1.02%0.90% 0.92% 0.91% 0.91% 0.95%
0.00%
0.50%
1.00%
1.50%
FY08 / '08(Q1) FY09/ '09(Q1) FY10/ '10(Q1) FY11/ '11(Q1) FY12/ '12(Q1)
RoA RoA (Quarter 1) (Annualized)
LOGO
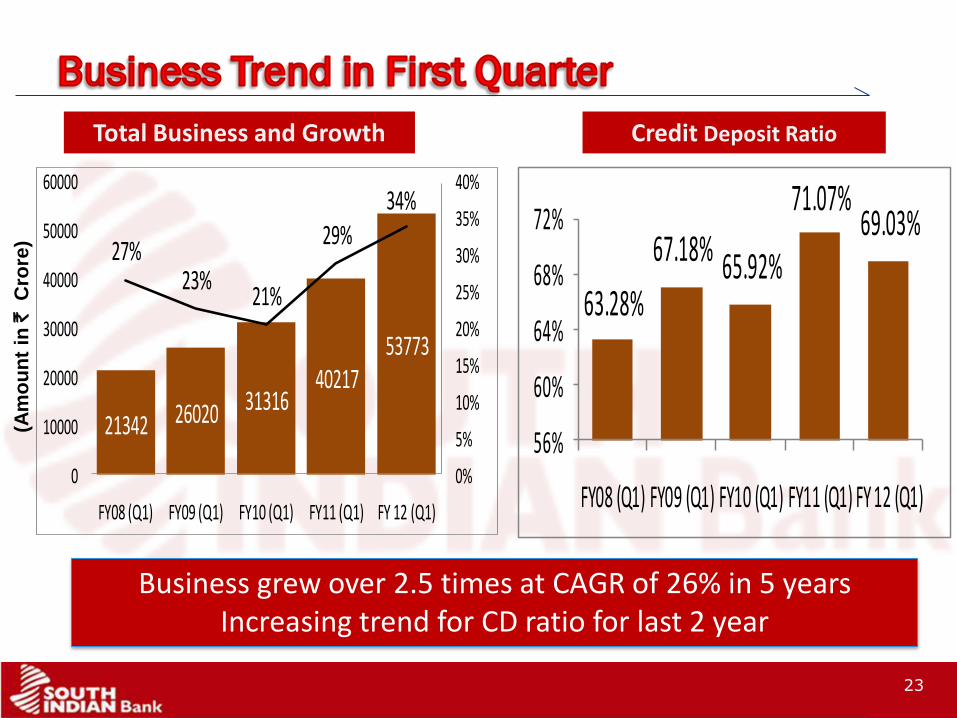
21342 26020 3131640217
53773
27%23%
21%
29%34%
0%
5%
10%
15%
20%
25%
30%
35%
40%
0
10000
20000
30000
40000
50000
60000
FY08 (Q1) FY09 (Q1) FY10 (Q1) FY11 (Q1) FY 12 (Q1)
63.28%
67.18% 65.92%
71.07%69.03%
56%
60%
64%
68%
72%
FY08 (Q1) FY09 (Q1) FY10 (Q1) FY11 (Q1) FY 12 (Q1)
Total Business and Growth
Business grew over 2.5 times at CAGR of 26% in 5 yearsIncreasing trend for CD ratio for last 2 year
23
Credit Deposit Ratio
(Am
ou
nt
in `
C
rore
)
LOGO
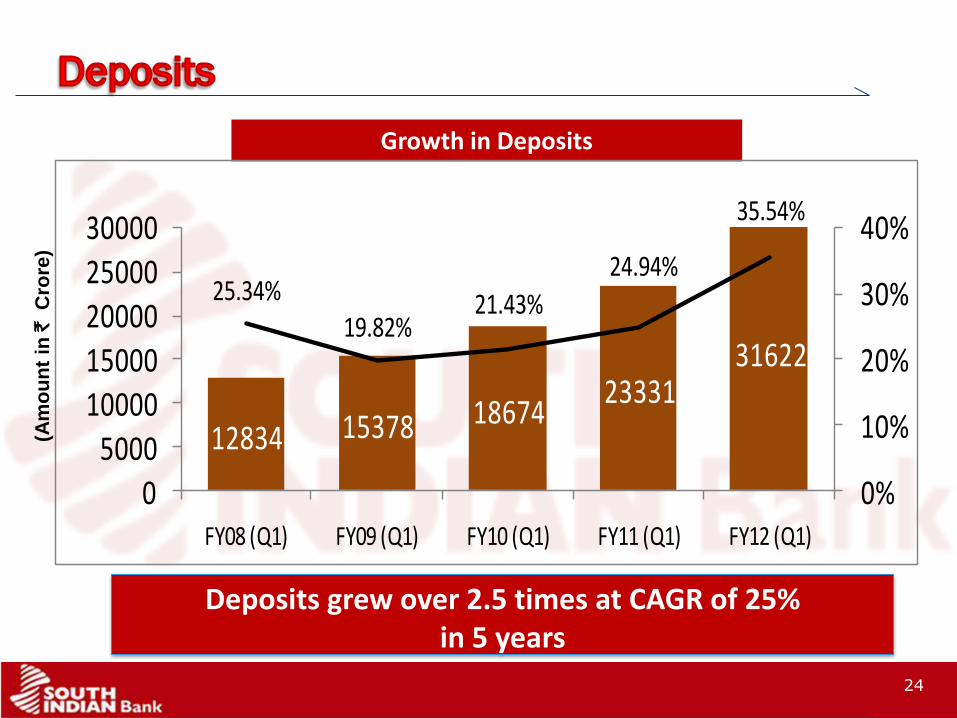
Growth in Deposits
12834 15378 1867423331
31622
25.34%19.82%
21.43%
24.94%
35.54%
0%
10%
20%
30%
40%
0
5000
10000
15000
20000
25000
30000
FY08 (Q1) FY09 (Q1) FY10 (Q1) FY11 (Q1) FY12 (Q1)
Deposits grew over 2.5 times at CAGR of 25%in 5 years
24
(Am
ou
nt
in `
C
rore
)
LOGO
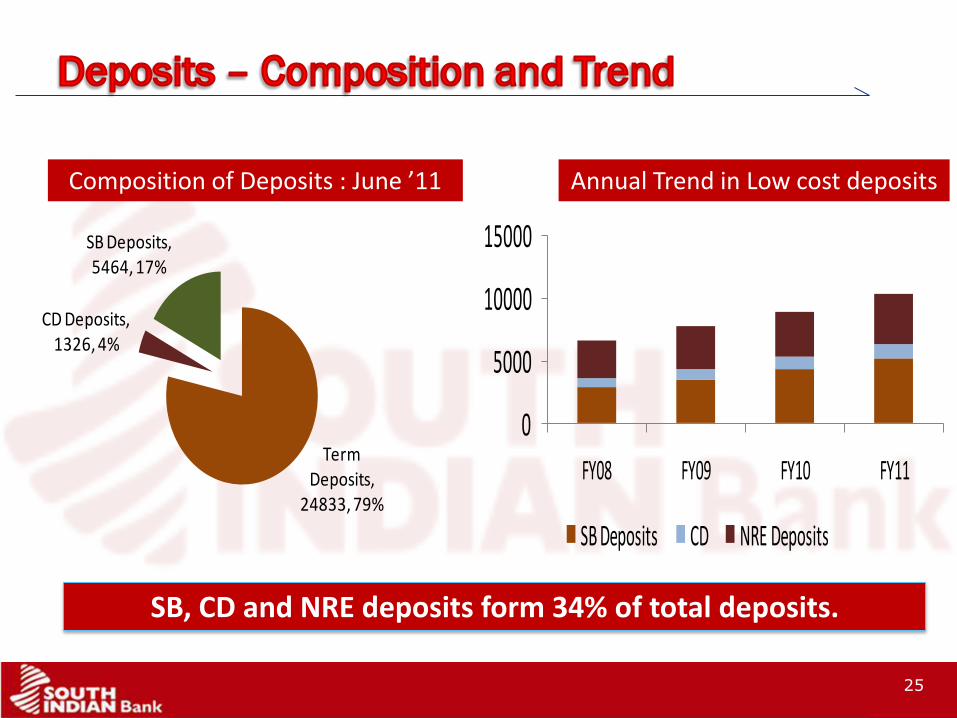
Term Deposits,
24833, 79%
CD Deposits, 1326, 4%
SB Deposits, 5464, 17%
0
5000
10000
15000
FY08 FY09 FY10 FY11
SB Deposits CD NRE Deposits
SB, CD and NRE deposits form 34% of total deposits.
25
Annual Trend in Low cost depositsComposition of Deposits : June ’11
LOGO
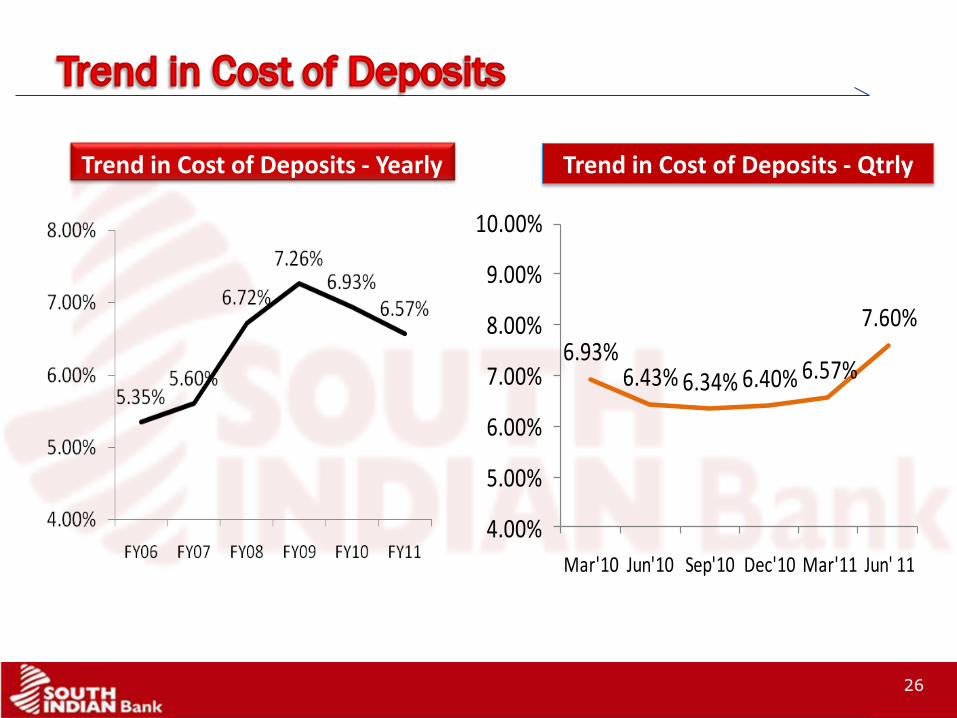
Trend in Cost of Deposits - Yearly
6.93%6.43% 6.34% 6.40% 6.57%
7.60%
4.00%
5.00%
6.00%
7.00%
8.00%
9.00%
10.00%
Mar'10 Jun'10 Sep'10 Dec'10 Mar'11 Jun' 11
Trend in Cost of Deposits - Qtrly
26
LOGO
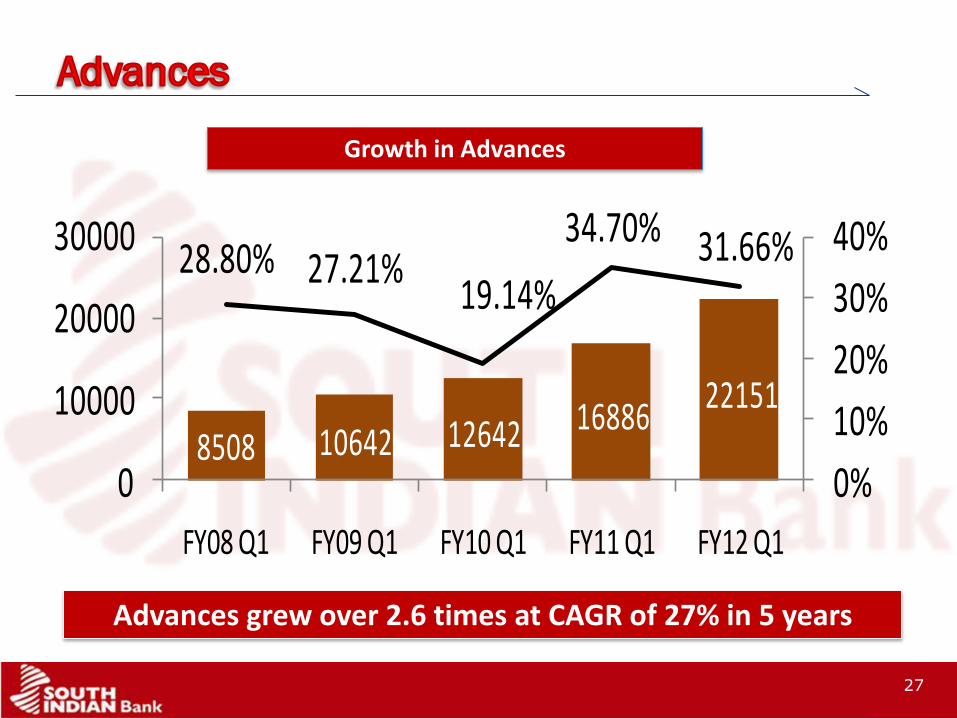
8508 10642 12642 1688622151
28.80% 27.21%19.14%
34.70% 31.66%
0%
10%
20%
30%
40%
0
10000
20000
30000
FY08 Q1 FY09 Q1 FY10 Q1 FY11 Q1 FY12 Q1
Growth in Advances
Advances grew over 2.6 times at CAGR of 27% in 5 years
27
LOGO
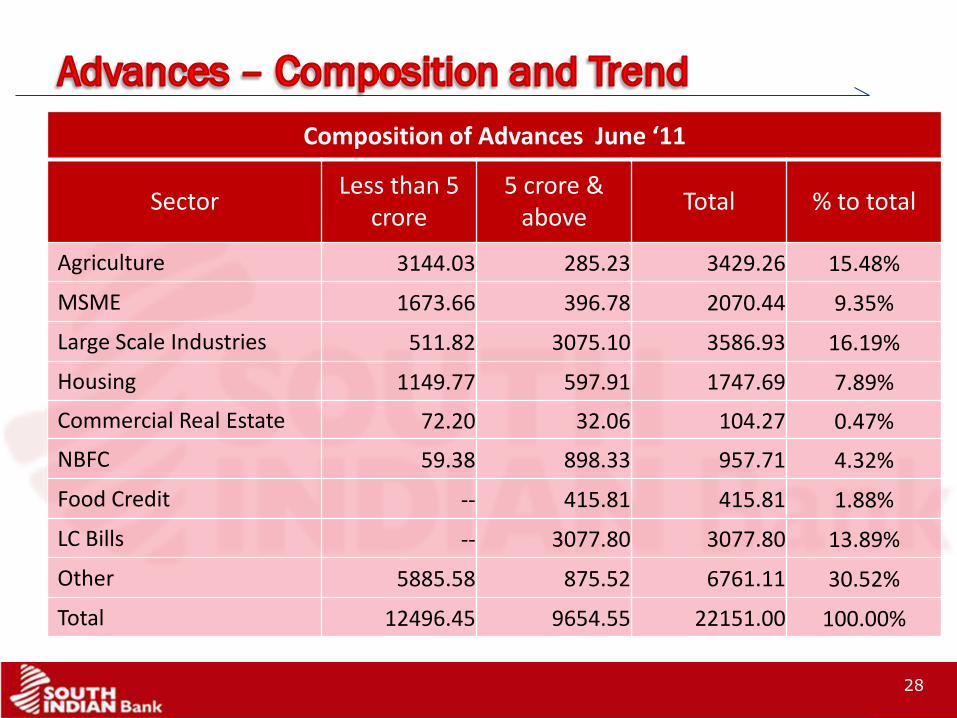
Composition of Advances June ‘11
SectorLess than 5
crore5 crore &
aboveTotal % to total
Agriculture 3144.03 285.23 3429.26 15.48%
MSME 1673.66 396.78 2070.44 9.35%
Large Scale Industries 511.82 3075.10 3586.93 16.19%
Housing 1149.77 597.91 1747.69 7.89%
Commercial Real Estate 72.20 32.06 104.27 0.47%
NBFC 59.38 898.33 957.71 4.32%
Food Credit -- 415.81 415.81 1.88%
LC Bills -- 3077.80 3077.80 13.89%
Other 5885.58 875.52 6761.11 30.52%
Total 12496.45 9654.55 22151.00 100.00%
28
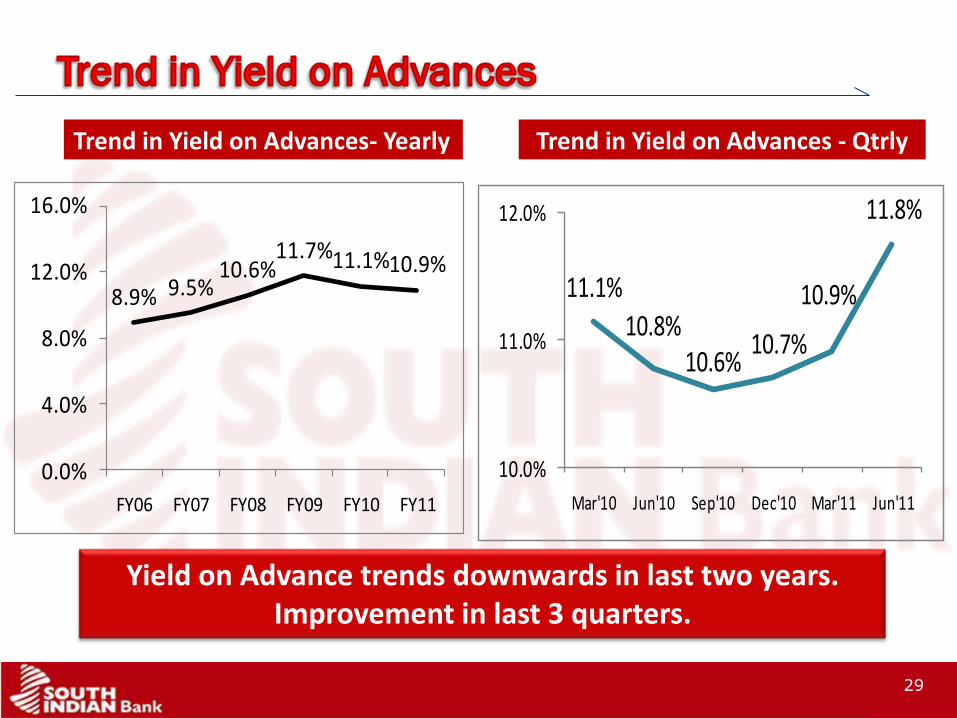
LOGO
8.9% 9.5%10.6%
11.7%11.1%10.9%
0.0%
4.0%
8.0%
12.0%
16.0%
FY06 FY07 FY08 FY09 FY10 FY11
11.1%
10.8%10.6%
10.7%
10.9%
11.8%
10.0%
11.0%
12.0%
Mar'10 Jun'10 Sep'10 Dec'10 Mar'11 Jun'11
Trend in Yield on Advances- Yearly Trend in Yield on Advances - Qtrly
Yield on Advance trends downwards in last two years.Improvement in last 3 quarters.
29
LOGO
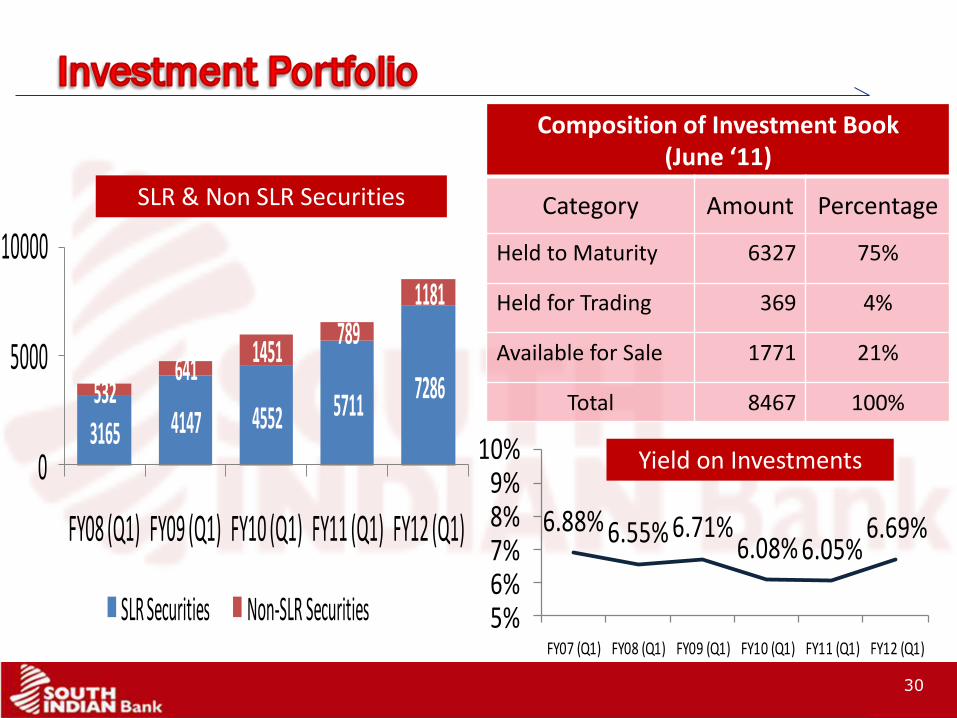
3165 4147 4552 57117286532
6411451
7891181
0
5000
10000
FY08 (Q1) FY09 (Q1) FY10 (Q1) FY11 (Q1) FY12 (Q1)
SLR Securities Non-SLR Securities
Composition of Investment Book (June ‘11)
Category Amount Percentage
Held to Maturity 6327 75%
Held for Trading 369 4%
Available for Sale 1771 21%
Total 8467 100%
6.88% 6.55% 6.71%6.08% 6.05%
6.69%
5%6%7%8%9%
10%
FY07 (Q1) FY08 (Q1) FY09 (Q1) FY10 (Q1) FY11 (Q1) FY12 (Q1)
30
Yield on Investments
SLR & Non SLR Securities
LOGO
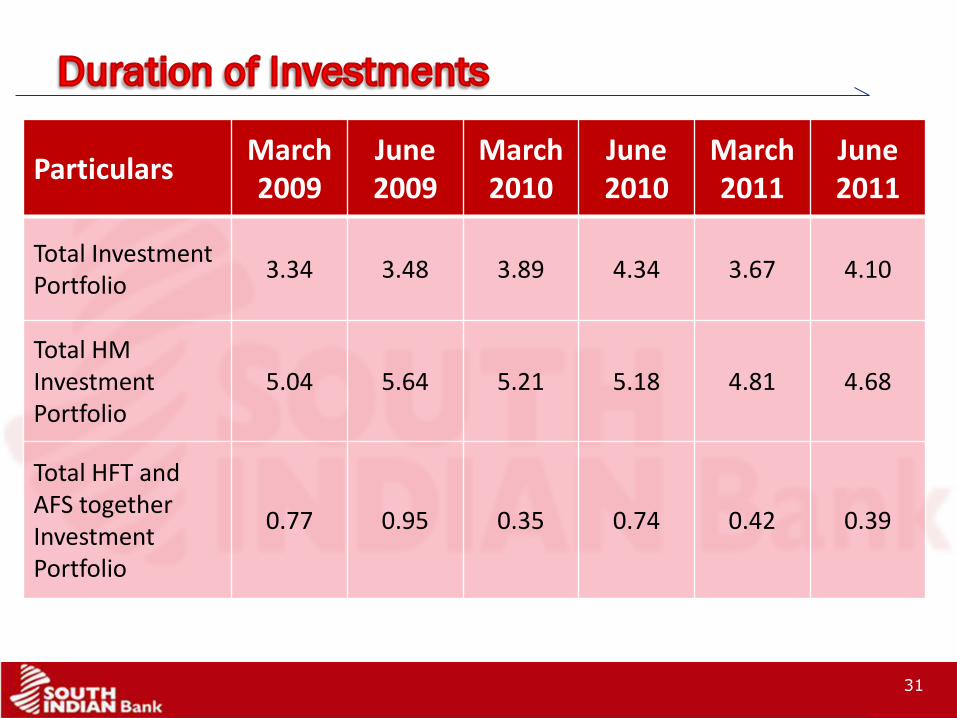
ParticularsMarch 2009
June2009
March 2010
June2010
March 2011
June 2011
Total Investment Portfolio
3.34 3.48 3.89 4.34 3.67 4.10
Total HM Investment Portfolio
5.04 5.64 5.21 5.18 4.81 4.68
Total HFT andAFS together Investment Portfolio
0.77 0.95 0.35 0.74 0.42 0.39
31
LOGO
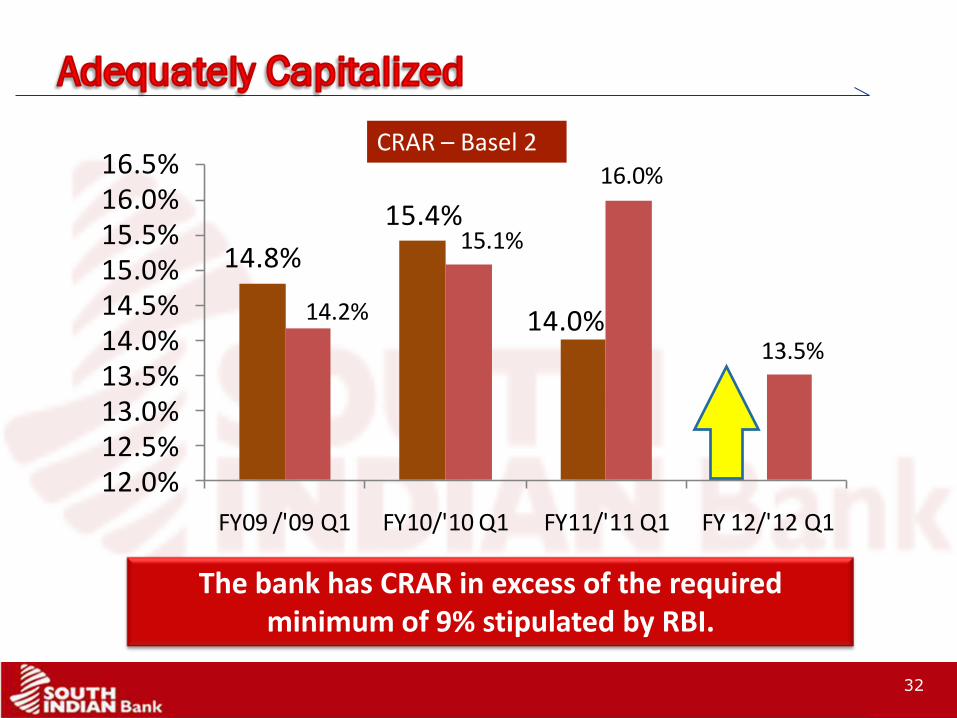
14.8%
15.4%
14.0%14.2%
15.1%
16.0%
13.5%
12.0%12.5%13.0%13.5%14.0%14.5%15.0%15.5%16.0%16.5%
FY09 /'09 Q1 FY10/'10 Q1 FY11/'11 Q1 FY 12/'12 Q1
The bank has CRAR in excess of the required minimum of 9% stipulated by RBI.
32
CRAR – Basel 2
LOGO
RWATier 1 Capital
Tier 2 Capital
Total Capital
Mar 09 9525 1259 147 1406
Mar 10 11377 1412 337 1749
Jun 10 11270 1476 326 1802
Sep 10 11861 1551 330 1881
Dec 10 13174 1622 340 1962
Mar 11 14647 1650 401 2051
Jun 11 15152 1645 401 2046
13.22% 13.71% 14.30% 13.93%12.42% 13.10% 13.08% 12.31% 11.27% 10.86%
1.54% 1.37%3.57% 3.43%
2.97% 2.89% 2.78%2.58%
2.74% 2.65%
0%
5%
10%
15%
20%
Mar'09 Jun'09 Sep'09 Dec'09 Mar'10 Jun'10 Sep'10 Dec'10 Mar'11 Jun'11
Tier 1 CRAR Tier 2 CRAR
Strong Core Capital. Dependence on Capital
Instruments low.
(Amount in ` crore)
33
LOGO
34%
26% 28%
12%
41%
0%
10%
20%
30%
40%
50%
0
200
400
600
800
1000
FY08 (Q1) FY09 (Q1) FY10 (Q1) FY11 (Q1) FY12 (Q1)
Int on Adv Int on Inv Oth Int Non-Int Income Trend
Total income
FY08 (Q1) 322.00
FY09 (Q1) 405.90
FY10 (Q1) 521.20
FY11(Q1) 581.80
FY 12 (Q1) 820.40
Gross Annual income grew over 2.5 times in 5 years at CAGR 26%
7.52% 8.73% 8.85% 9.53% 8.45% 9.47%
0%
5%
10%
15%
FY07
(Q1)
FY08
(Q1)
FY09
(Q1)
FY10
(Q1)
FY11
(Q1)
FY12
(Q1)
Yield on funds
(Amount in ` crore)
34
LOGO
ParticularsQuarter ended
30/06/2010 Quarter ended
30/06/2011
Commission, Exchange & Brokerage 8 9
Profit on sale of investment (NET) 9 15
Profit on sale of Land, Building & Other assets (net)
- ~ 1
Profit on Exchange Transactions (Net) 4 5
Miscellaneous Income
1. Processing Fees 2 3
2. Rent Received - -
3. Others (Folio charges, Locker Rent) 18 19
Total 41 52
(Amount in ` crore)
35
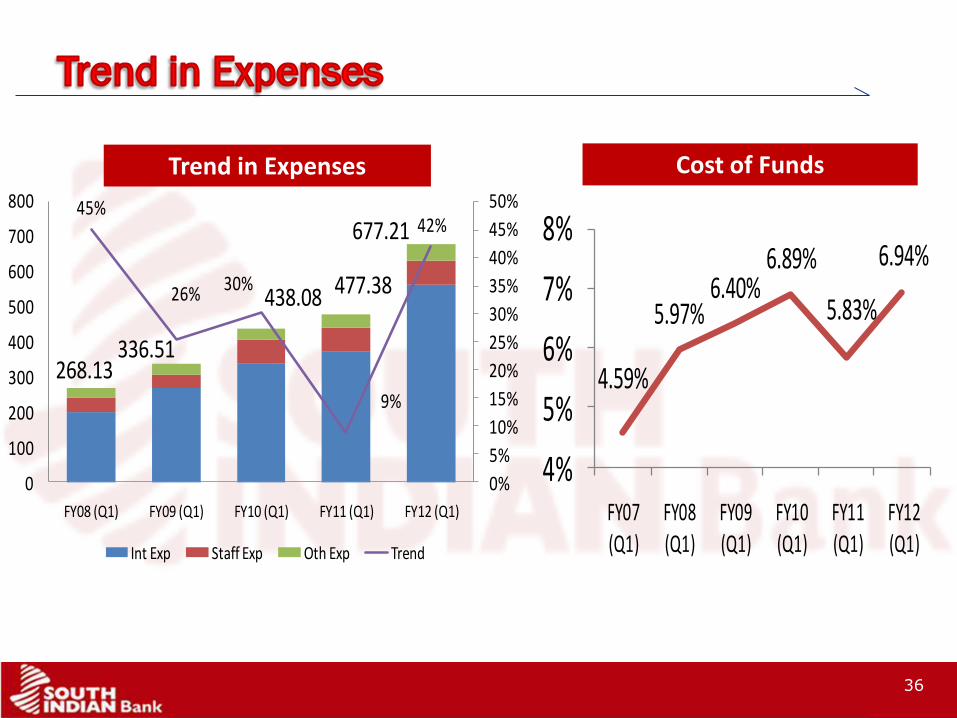
LOGO
45%
26% 30%
9%
42%
268.13336.51
438.08 477.38
677.21
0%
5%
10%
15%
20%
25%
30%
35%
40%
45%
50%
0
100
200
300
400
500
600
700
800
FY08 (Q1) FY09 (Q1) FY10 (Q1) FY11 (Q1) FY12 (Q1)
Int Exp Staff Exp Oth Exp Trend
4.59%
5.97%6.40%
6.89%
5.83%
6.94%
4%
5%
6%
7%
8%
FY07 (Q1)
FY08 (Q1)
FY09 (Q1)
FY10 (Q1)
FY11 (Q1)
FY12 (Q1)
Trend in Expenses
36
Cost of Funds
LOGO
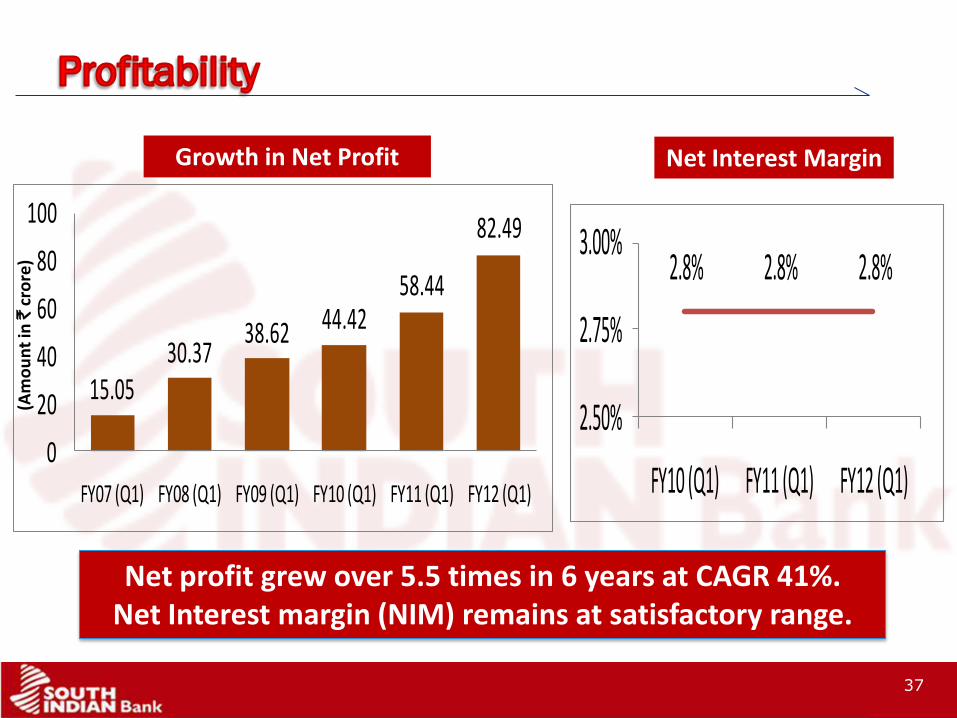
15.0530.37
38.62 44.4258.44
82.49
0
20
40
60
80
100
FY07 (Q1) FY08 (Q1) FY09 (Q1) FY10 (Q1) FY11 (Q1) FY12 (Q1)
2.8% 2.8% 2.8%
2.50%
2.75%
3.00%
FY10 (Q1) FY11 (Q1) FY12 (Q1)
Net profit grew over 5.5 times in 6 years at CAGR 41%.Net Interest margin (NIM) remains at satisfactory range.
Growth in Net Profit
(Am
ou
nt
in `
cro
re)
37
Net Interest Margin
LOGO38
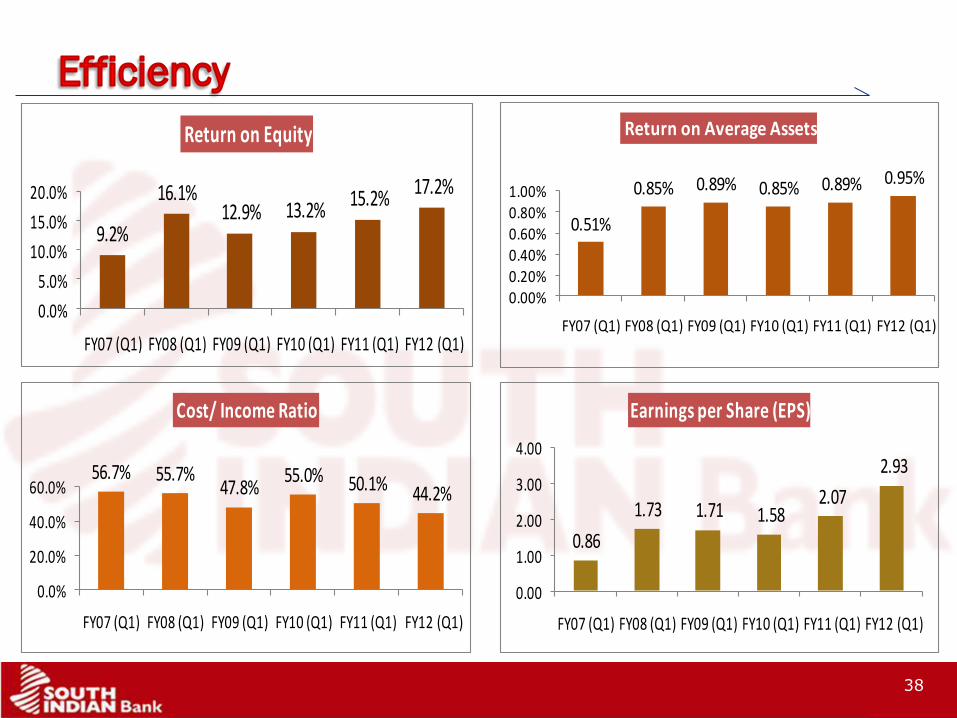
9.2%
16.1%12.9% 13.2%
15.2%17.2%
0.0%
5.0%
10.0%
15.0%
20.0%
FY07 (Q1) FY08 (Q1) FY09 (Q1) FY10 (Q1) FY11 (Q1) FY12 (Q1)
Return on Equity
0.51%
0.85% 0.89% 0.85% 0.89% 0.95%
0.00%0.20%0.40%0.60%0.80%1.00%
FY07 (Q1) FY08 (Q1) FY09 (Q1) FY10 (Q1) FY11 (Q1) FY12 (Q1)
Return on Average Assets
56.7% 55.7%47.8%
55.0% 50.1% 44.2%
0.0%
20.0%
40.0%
60.0%
FY07 (Q1) FY08 (Q1) FY09 (Q1) FY10 (Q1) FY11 (Q1) FY12 (Q1)
Cost/ Income Ratio
0.86
1.73 1.71 1.582.07
2.93
0.00
1.00
2.00
3.00
4.00
FY07 (Q1) FY08 (Q1) FY09 (Q1) FY10 (Q1) FY11 (Q1) FY12 (Q1)
Earnings per Share (EPS)
38
LOGO39
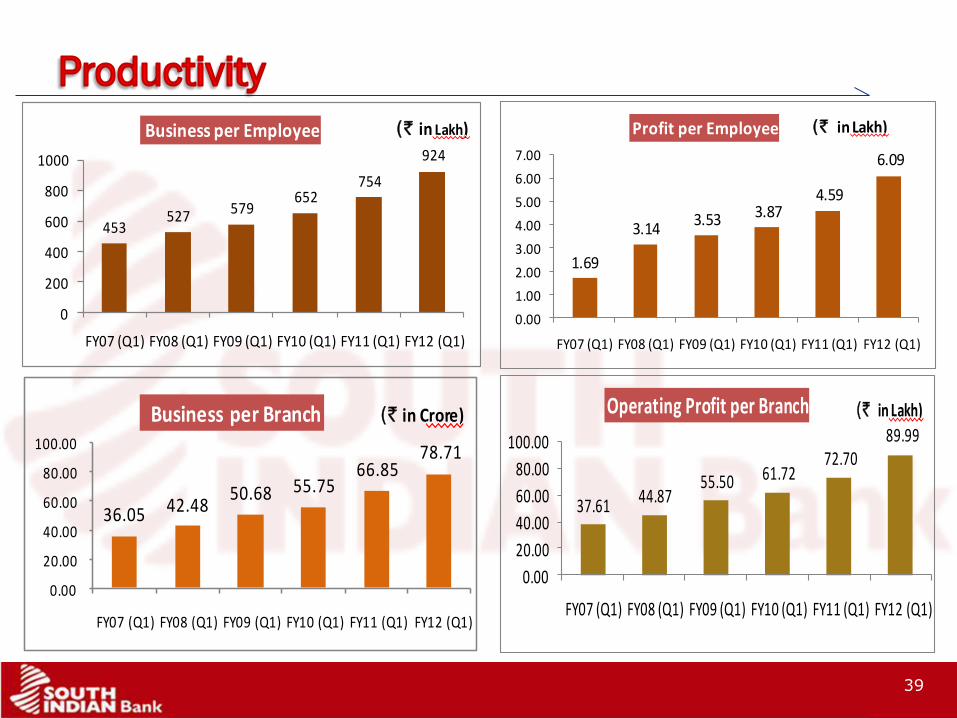
453527 579
652754
924
0
200
400
600
800
1000
FY07 (Q1) FY08 (Q1) FY09 (Q1) FY10 (Q1) FY11 (Q1) FY12 (Q1)
Business per Employee (` in Lakh)
36.05 42.4850.68 55.75
66.8578.71
0.00
20.00
40.00
60.00
80.00
100.00
FY07 (Q1) FY08 (Q1) FY09 (Q1) FY10 (Q1) FY11 (Q1) FY12 (Q1)
Business per Branch (` in Crore)
37.61 44.8755.50 61.72
72.7089.99
0.00
20.00
40.00
60.00
80.00
100.00
FY07 (Q1) FY08 (Q1) FY09 (Q1) FY10 (Q1) FY11 (Q1) FY12 (Q1)
Operating Profit per Branch (` in Lakh)
1.69
3.143.53 3.87
4.59
6.09
0.00
1.00
2.00
3.00
4.00
5.00
6.00
7.00
FY07 (Q1) FY08 (Q1) FY09 (Q1) FY10 (Q1) FY11 (Q1) FY12 (Q1)
Profit per Employee (` in Lakh)
39
LOGO40
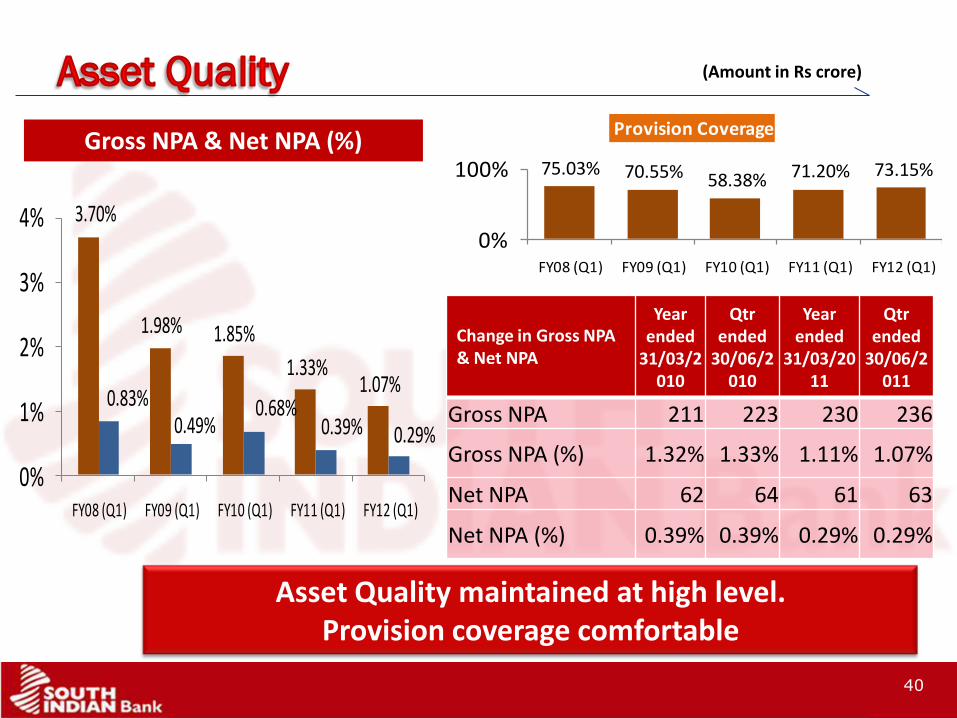
3.70%
1.98% 1.85%
1.33%1.07%
0.83%0.49%
0.68%0.39% 0.29%
0%
1%
2%
3%
4%
FY08 (Q1) FY09 (Q1) FY10 (Q1) FY11 (Q1) FY12 (Q1)
75.03% 70.55% 58.38% 71.20% 73.15%
0%
100%
FY08 (Q1) FY09 (Q1) FY10 (Q1) FY11 (Q1) FY12 (Q1)
Provision Coverage
Change in Gross NPA & Net NPA
Year ended
31/03/2010
Qtr ended
30/06/2010
Year ended
31/03/2011
Qtr ended
30/06/2011
Gross NPA 211 223 230 236
Gross NPA (%) 1.32% 1.33% 1.11% 1.07%
Net NPA 62 64 61 63
Net NPA (%) 0.39% 0.39% 0.29% 0.29%
Gross NPA & Net NPA (%)
Asset Quality maintained at high level. Provision coverage comfortable
(Amount in Rs crore)
40
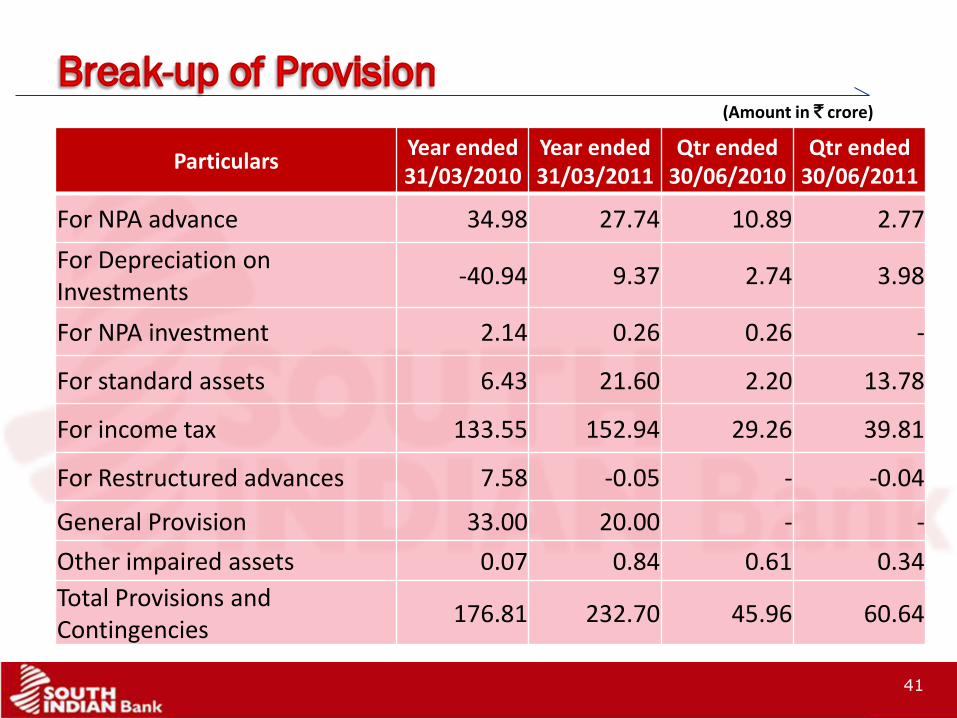
LOGO41
ParticularsYear ended 31/03/2010
Year ended 31/03/2011
Qtr ended 30/06/2010
Qtr ended 30/06/2011
For NPA advance 34.98 27.74 10.89 2.77
For Depreciation on Investments
-40.94 9.37 2.74 3.98
For NPA investment 2.14 0.26 0.26 -
For standard assets 6.43 21.60 2.20 13.78
For income tax 133.55 152.94 29.26 39.81
For Restructured advances 7.58 -0.05 - -0.04
General Provision 33.00 20.00 - -
Other impaired assets 0.07 0.84 0.61 0.34
Total Provisions and Contingencies
176.81 232.70 45.96 60.64
41
(Amount in ` crore)
LOGO42
(Amount in ` crore)
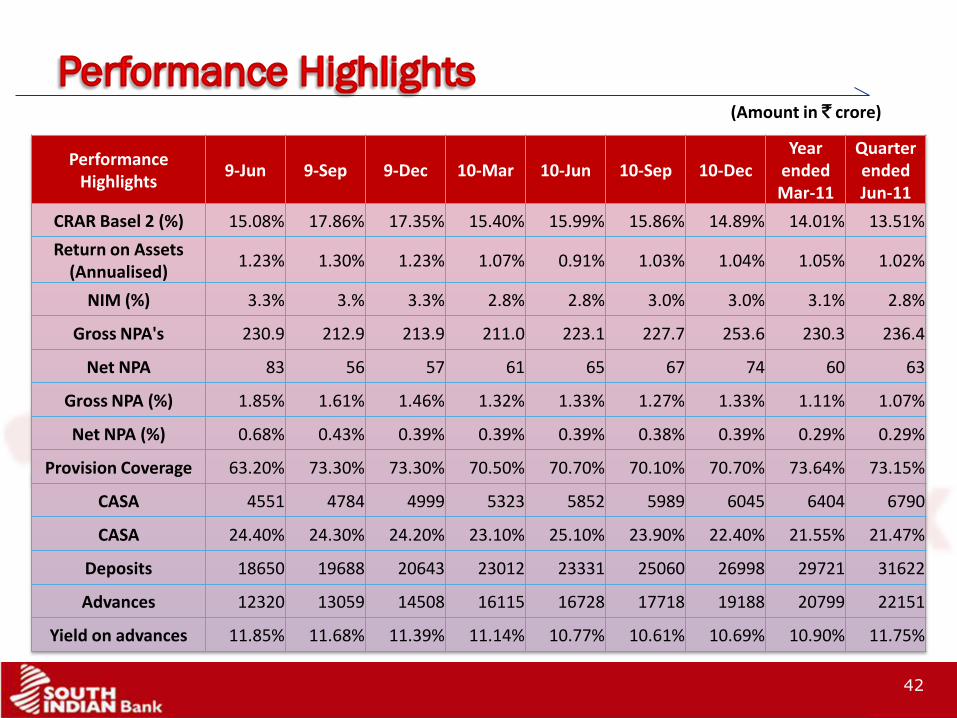
Performance Highlights
9-Jun 9-Sep 9-Dec 10-Mar 10-Jun 10-Sep 10-DecYear
ended Mar-11
Quarter ended Jun-11
CRAR Basel 2 (%) 15.08% 17.86% 17.35% 15.40% 15.99% 15.86% 14.89% 14.01% 13.51%
Return on Assets (Annualised)
1.23% 1.30% 1.23% 1.07% 0.91% 1.03% 1.04% 1.05% 1.02%
NIM (%) 3.3% 3.% 3.3% 2.8% 2.8% 3.0% 3.0% 3.1% 2.8%
Gross NPA's 230.9 212.9 213.9 211.0 223.1 227.7 253.6 230.3 236.4
Net NPA 83 56 57 61 65 67 74 60 63
Gross NPA (%) 1.85% 1.61% 1.46% 1.32% 1.33% 1.27% 1.33% 1.11% 1.07%
Net NPA (%) 0.68% 0.43% 0.39% 0.39% 0.39% 0.38% 0.39% 0.29% 0.29%
Provision Coverage 63.20% 73.30% 73.30% 70.50% 70.70% 70.10% 70.70% 73.64% 73.15%
CASA 4551 4784 4999 5323 5852 5989 6045 6404 6790
CASA 24.40% 24.30% 24.20% 23.10% 25.10% 23.90% 22.40% 21.55% 21.47%
Deposits 18650 19688 20643 23012 23331 25060 26998 29721 31622
Advances 12320 13059 14508 16115 16728 17718 19188 20799 22151
Yield on advances 11.85% 11.68% 11.39% 11.14% 10.77% 10.61% 10.69% 10.90% 11.75%
42
LOGO43
FUTURE STRATEGY
LOGO44
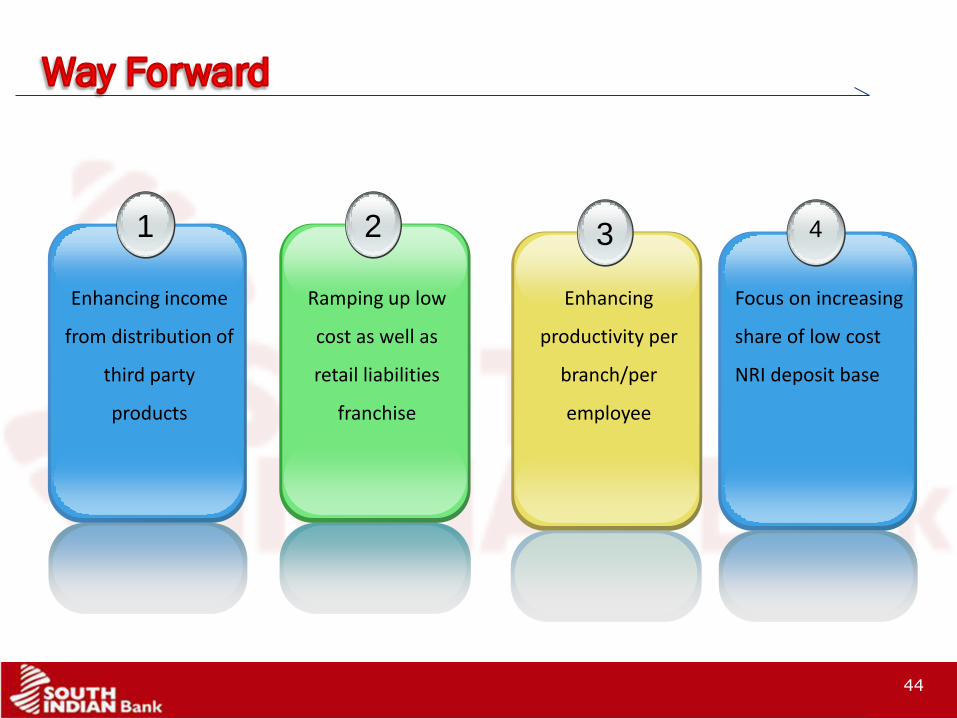
1
Enhancing income
from distribution of
third party
products
2
Ramping up low
cost as well as
retail liabilities
franchise
3
Enhancing
productivity per
branch/per
employee
4
Focus on increasing
share of low cost
NRI deposit base
44
LOGO
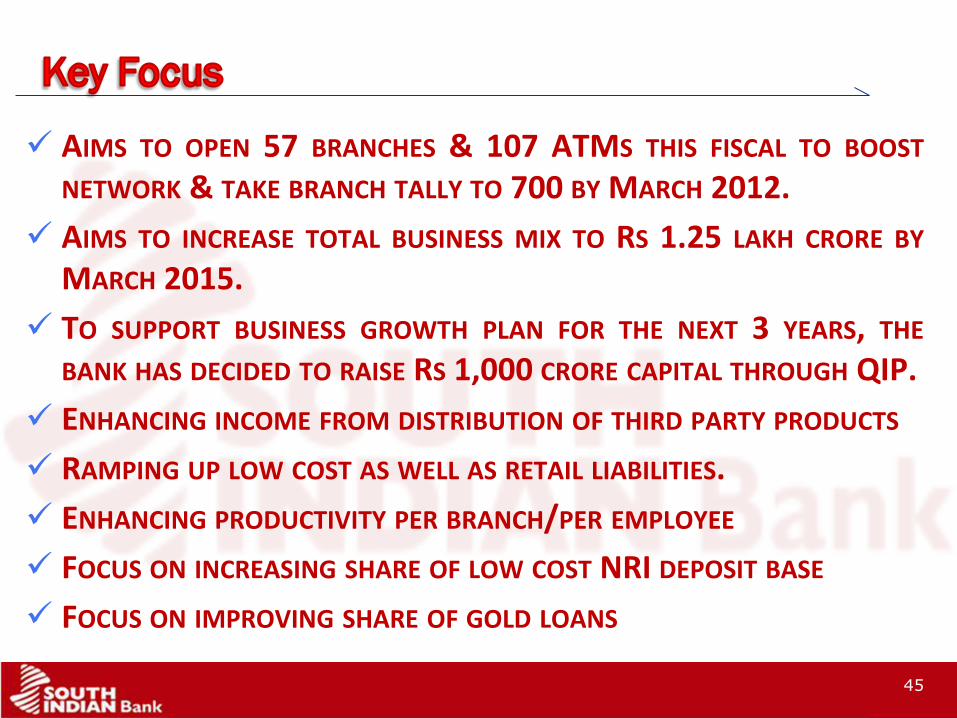
AIMS TO OPEN 57 BRANCHES & 107 ATMS THIS FISCAL TO BOOST
NETWORK & TAKE BRANCH TALLY TO 700 BY MARCH 2012.
AIMS TO INCREASE TOTAL BUSINESS MIX TO RS 1.25 LAKH CRORE BY
MARCH 2015.
TO SUPPORT BUSINESS GROWTH PLAN FOR THE NEXT 3 YEARS, THE
BANK HAS DECIDED TO RAISE RS 1,000 CRORE CAPITAL THROUGH QIP.
ENHANCING INCOME FROM DISTRIBUTION OF THIRD PARTY PRODUCTS
RAMPING UP LOW COST AS WELL AS RETAIL LIABILITIES.
ENHANCING PRODUCTIVITY PER BRANCH/PER EMPLOYEE
FOCUS ON INCREASING SHARE OF LOW COST NRI DEPOSIT BASE
FOCUS ON IMPROVING SHARE OF GOLD LOANS
45
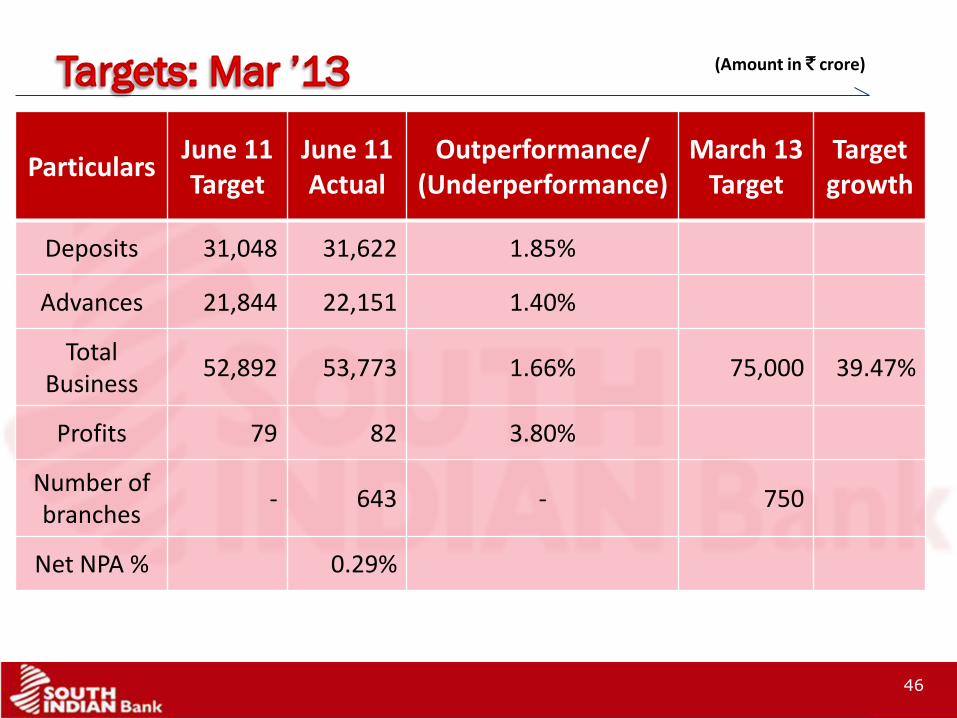
LOGO
ParticularsJune 11 Target
June 11 Actual
Outperformance/ (Underperformance)
March 13 Target
Target growth
Deposits 31,048 31,622 1.85%
Advances 21,844 22,151 1.40%
Total Business
52,892 53,773 1.66% 75,000 39.47%
Profits 79 82 3.80%
Number of branches
- 643 - 750
Net NPA % 0.29%
46
(Amount in ` crore)
46
LOGO
IMPORTANT NOTICE
47
No representation or warranty, express or implied is made as to, and no reliance should be placed on, the fairness,accuracy, completeness or correctness of such information or opinions contained herein. The information containedin this presentation is only current as of its date. Certain statements made in this presentation may not be based onhistorical information or facts and may be “forward looking statements”, including those relating to the Company’sgeneral business plans and strategy, its future financial condition and growth prospects, and future developments inits industry and its competitive and regulatory environment. Actual results may differ materially from these forward-looking statements due to a number of factors, including future changes or developments in the Company’s business,its competitive environment and political, economic, legal and social conditions in India. This communication is forgeneral information purpose only, without regard to specific objectives, financial situations and needs of anyparticular person. This presentation does not constitute an offer or invitation to purchase or subscribe for any sharesin the Company and neither any part of it shall form the basis of or be relied upon in connection with any contract orcommitment Important Notice whatsoever. The Company may alter, modify or otherwise change in any manner thecontent of this presentation, without obligation to notify any person of such revision or changes. This presentationcan not be copied and/or disseminated in any manner.
47
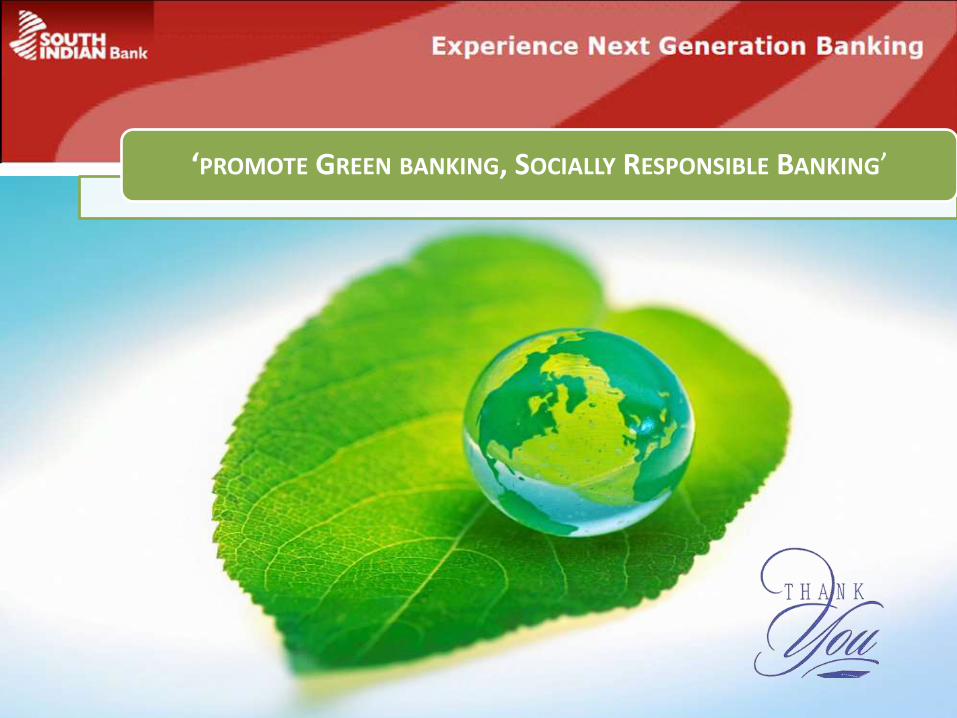
48
‘PROMOTE GREEN BANKING, SOCIALLY RESPONSIBLE BANKING’