Embed Size (px)
Citation preview

The Australian Centre for International Agricultural Research (ACIAR) was established in June 1982 by an Act of the Aust.ralian Parliamem. Its mandate is to help identify agricultural problems in developing countries and to commission collaborative research bet ween Australia and developing country researchers in fields where Australia has a special research competence.
Where trade names are used this constitutes neither endorsement of nor discrimination against any product by the Centre.
ACIAR PROCEEDINGS This series of publications includes the full proceedings of research workshops, seminars or symposia organised or supported by ACIAR. Numbers in this series are distributed internationally to selected individuals and scientific institutions. Previous numbers in the series are listed inside the back cover.
© Australian Centre for International Agricultural Research, G.P.O. Box 1571, Canberra, A.e:r: 2601. Blair, Graeme and Lefroy, Rod (ed.) 1990. Sulfur Fertilizer Policy for Lowland and Upland Rice Cropping Systems in Indonesia: proceedings of a seminar, Jakarta, Indonesia 18-20 July 1989. AClAR Proceedings No. 29, 142 pp.
ISBN 1 86320 009 6 Typeset and laid out by: Ocean Graphics, Gold Coast, Queensland. Primed by: Brown Prior Anderson Pty Ltd. Burwood, Vic 3125.

Sulfur Fertilizer Policy for Lowland and Upland Rice Cropping Systems
in Indonesia
Proceedings of a seminar held at Jakarta 18 - 20 July, 1989
Editors: Graeme Blair and Rod I-efroy
Host: Ministry of Agriculture, Government of Indonesia

Contents
Foreword 5
Editors' Preface 7
Recommendations 9
Executive Summary 11
World sulfur industry R.J. Morris and C.A. Balazs 15
The fertilizer industry in Indonesia Sri Ambar Suryosunarko 19
Fertilizer S consumption in Indonesia: where sulfur is used and why Chairil A. Rasahan and Faisal Kasryno 26
The impact of fertilizer subsidies and rice price policy on food crop production in Indonesia Mark W. Rosegrant and Faisal Kasryno 32
The fertilizer subsidy and fertilizer use in Indonesia Dennis T. O'Brien 42
ACIAR's suIfur in rice research program in S.E. Asia Graeme Blair 51
Sui fur research in upland crops in Southeast Asia R.D.B. Lefroy 56
N, P, K and S fertilization for food crops: present status and future challenges Ibrahim Manwan and Achmad M. Fagi 61
The status of N, P, K and S of lowland rice soils in Java J. Sri Adiningsih, Djoko Santoso and M. Sudjadi 68
N, S, P and K status of the soils in the islands outside Java Djoko Santoso, J. Sri Adiningsih and Heryadi 77
N, P, K and S status of food crops in islands outside Java M. Ismunadji 83
S research on rice in Indonesia M. Ismunadji 87
S research on upland crops in Indonesia A.K. Makarim 91
S responses in pastures and animals in South Sulawesi, Indonesia Graeme BlRir and A.R. Till 95
Su1fur studies at Hasanuddin University Solo S.R. Samosir 97
Incidental S inputs in rainfall and irrigation water R.D.B. Lefroy, Djoko Santoso and M. Ismunadji 101
3

Some aspects of the sulfur nutrition of crops Go Ban Hong 105
Agronomic effectiveness of alternative S fertilizers - IFDC's experience D.K. Friesen 107
Agronomic effectiveness of S sources for lowland rice c.P. Mamaril and P.B. Gonzales 115
Alternative sulfur sources: ACIAR research R.D.B. Lefroy 120
Cost effective alternative S supply for Indonesia D.I. Gregory 125
Extension problems associated with the use of S fertilizers A. Rusadhi and C. Syarief 138
4

Foreword Fertilizers have played an important role in increasing food production in both the developed and developing world. Initially the nutrients nitrogen, phosphorus and potassium were the major focus of attention but as crop production has intensified, an increasing amount of attention has been focused on other nutrients essential to plant growth.
ACIAR has supported a wide range of fertilizer-related projects within its plant nutrition program. These include studies on efficiency of utilisation of urea (8206, 8517 and 8940), Boron (8603), Zinc (8366) and Phosphorus and Sulfur (8328, 8804). Projects 8328 and 8804 provided the stimulus for this meeting which, through support from the Australian International Development Assistance Bureau (AIDAB), brought together key personnel from Indonesia with specialists from ACIAR, IRRI, IFDC, IFPRI and the Universities of New England and Wollongong in Australia.
We hope that the papers presented in this proceedings, and the recommendations from it, will assist in the decision-making processes regarding fertilizer production and distribution in Indonesia and guide future research activities.
5
G.H.L. Rothschild Director, ACIAR

Editors' Preface Indonesian and Australian scientists have conducted joint research activities concerned with fertilizer sui fur since 1975. AClAR involvement in this area began in 1985 as collaborative work between the University of New England (UNE) and the Bogor Research Institute for Food Crops (BORIF) as part of Project 8328, which also involved work in Thailand and Malaysia. Project 8328 was replaced by Project 8804 in 1988. Under this project, both the Centre for Soils Research (CSR) and BORIF have been involved in collaborative work with UNE.
Earlier work had shown large responses in rice yield to S applications, particularly in S. Sulawesi. Field trials in Java and Sumatra, as part of Projects 8328 and 8804, have generally shown either no or small responses in yield of upland and lowland crops to S applications. Careful analysis of the S cycle in Indonesian, Thai and Malaysian cropping systems has shown that in many cases the return of S in crop residues and the incidental inputs of S in Nand P fertilizers, in rainfall and in irrigation water, are sufficient for crop growth. This explains the reduced incidence of S deficiency.
These ACIAR funded studies have been complemented by agronomic and economic studies in Indonesia carried out by international centres such as IFDC, IRRI and IFPRI.
The purpose of this seminar was to bring together agricultural scientists, policy makers and key personnel in industry to develop a set of recommendations for the use of suI fur fertilizers in Indonesia. The objectives of this seminar were to: 1. Review the needs for sulfur fertilizers in Indonesia; 2. Examine ways in which sulfur could be most efficiently incorporated into fertilizer
programs within the existing fertilizer industry; 3. Prepare a report to the Government of Indonesia on appropriate strategies for
restoring nutrient balance to the fertilizers used in Indonesia. Through the Special Purposes Grant Program support was provided by AIDAB
for the seminar. The seminar was hosted by The Ministry of Agriculture, Indonesia (MOA). The
Steering Committee was chaired by Dr Soetatwo Hadiwigeno, Director General, AARD, and the Organising Committee was chaired by Dr Suryatna Effendi, Director, CSR.
The meeting was opened by the Junior Minister of Agriculture, Professor Dr Sjarifuddin Baharsjah and was attended by 45 participants. A total of 22 papers were presented and this was followed by workshop sessions to prepare the recommendations.
These proceedings include an executive summary, the papers presented and the recommendations made by the meeting. We believe that the meeting brought together a considerable amount of valuable information on which to make the recommendations and that this approach could be used by other countries faced with similar decisions regarding fertilizers and fertilizer policy.
Gmeme Blair Rod Lefroy
7

Recommendations Participants at the seminar broke into working groups based on Biology, Technology and Policy and later reformed so that three different groups, each with expertise from each former group, considered the subject. The reports from each group were discussed in a plenary session and the following recommendations were proposed: 1. Whilst much S research has been conducted, some areas of Indonesia have not
been adequately covered. An integrated S research program, which includes Crop and Soil Research Institutes, the Directorate General of Agriculture and the Fertilizer Industry needs to be undertaken. Such research should be implemented through a network approach established among institutions under the Ministry of Agriculture (MOA). This research team should commence by utilising existing information from crop production data, field trials, fertilizer use, rainfall and irrigation inputs, and other information, to better define the S status of the major Indonesian agricultural systems and to select appropriate research locations.
2. Fertilizer S programs should be adjusted to move from a corrective to a replacement application of S. This should be achieved by reducing the present recommendation for rice of l00kg/ha of ammonium sulfate (AS) to 50kg/ha AS which will provide 12kg S/ha. This is sufficient to replace the S removed from the rice system.
3. To reduce the present application of AS for sugarcane on Java to lOOkg/ha and to maintain N inputs by substituting 250kg/ha of urea for the 500-600kg AS removed from usage. In sugarcane areas outside Java, 200 kg AS/ha should be used and the present N application rate maintained with urea.
4. That the subsidy on AS be phased out. Since the cost of S fertilizer represents only 1 3070 of production costs in rice, it is unlikely to affect rice production. The rate of phase out should be adjusted to the reduction in TSP subsidy to avoid product cross substitution of AS and TSP.
5. That the AS freed up as a result of lower usage in Java be distributed to areas that at present receive little or no allocation. Priority should be given to areas of known deficiency and to crops with a high S requirement. If S demand exceeds the present AS production capacity, additional S fertilizers
should not be produced by the direct production of AS because of the poor economics of this process. Increased AS production associated with caprolactam might be economical.
A number of alternative scenarios were considered for delivering additional S requirements to the farmers. The most feasible were considered to be elemental S coated TSP or high analysis granular elemental S products.
Commercial technology exists to produce a coated TSP product (0:18:0:10) which would supply IOkg S/ha when applied at 100kg/ha. It would supply less than this when the P rate was reduced. In areas of low TSP usage AS or a high analysis granulated S product should be used as the S source.
Because of the low rate of S application (12 kg S/ha) a high analysis granulated S source would have to be mixed with TSP at the farm level for application. This would require a special extension effort to ensure adoption.
Other alternatives discussed but considered not to be feasible were: - Addition of elemental S to urea at Gresik. This would need planning to allow
incorporation of the S facilities in the planned new urea plant to be built at Gresik or for it to be retro-fitted. This plant is being constructed to supply urea to E. Java and production of urea/S for distribution to areas outside Java would reduce urea supply to the target area. The provision of urea/S production facilities at other existing urea plants would be uneconomical because of the need to install sulfur handling and melting facilities at each location.
9

Elemental S fortified TSP. It is technically feasible to incorporate up to 16070 molten S with phosphoric acid or during mixing; however, sublimation of S leads to problems during drying. For this reason this alternative does not seem feasible.
- Urea/AS briquettes. The possible disadvantage of this may be the production of sulfide and lower S recovery.
The choice of the alternative should be based on the possibility of manufacture, ease of distribution and extension, and cost factors of the alternatives.
10

Executive Summary This executive summary was prepared by Graeme Blair and Rod Lefroy with assistance from D.K. Friesen (lFDC), Dennis O'Brien (University of Wollongong), Mark Rosegrant (lFPRI) and Djoko Santoso (CSR).
S Status of Indonesian Agriculture
S deficiencies have been identified in many countries in the S.E. Asian region and this has prompted research into S fertilizer management and, in some areas, the inclusion of S containing fertilizers in recommendations. Whilst some S deficiencies are as a result of the inherently low S status of the soils, many appear to be as a result of increased offtake of S, because of increased cropping intensities and increased yields, and reduced inputs, due to the use of high analysis fertilizers containing little or no S.
Research in several S.E. Asian countries has shown that in both lowland and upland systems this balance between S inputs and S offtake or losses is critical (Lefroy a, and Makarim)*. In many cropping systems the inputs of S in rainfall and irrigation water play a significant role in maintaining this balance (Lefroy et al.).
Soil and plant analyses alone are not yet sufficiently accurate to delineate areas of sulfur deficiency; however they do provide a guide to S status. Plant analysis data from rice plants sampled throughout Java in 1972 estimated that 3.03 million ha of rice had a low to marginal S status (lsmunadji). The low S status of the soil of 2.88 million ha of Java, estimated in a more recent survey (Sri Adiningsih et al.), and the significant responses of some of these soils to S in glasshouse trials, would explain the earlier plant analysis data. The fact that many of these soils do not respond to S applications in the field as well as the fact that the incidence of S deficiency in rice in Java has declined, would appear to be due to the incidental inputs of S in rainfall and irrigation water and the application of S in ammonium sui fate as part of the recommended N fertilizer program.
A 5t/ha rice crop is estimated to remove 5kg S/ha in grain with a further IOkg S present in the straw. If 50070 of the S in straw is lost as a result of burning (Blair) or use for animal forage, then the S required to replace the offtake and loss amounts to IOkg S/ha/crop. Whilst there may be S losses as a result of leaching in sandy soil, these appear to be balanced by inputs in rainfall and irrigation.
The current recommendation that lOOkg/ha ammonium sulfate be applied to each rice crop supplies 24kg S/ha. Whilst this level of S fertilization has been important in overcoming the S deficiencies previously observed, current evidence suggests that the S application can now be reduced to a level which balances the estimated S offtake and losses. The application of 50kg ammonium sulfate/ha/crop would provide 12kg S/ha with the remaining 50kg ammonium sulfate being replaced by 23kg urea/ha, which as an N source is less expensive to produce and distribute.
Although less intensively studied, the sulfur status of plants and soils of islands outside Java have frequently been found to be low (Ismunadji, Santoso et al. and Samosir). Responses in crops and pastures to S applications have been observed, particularly in South Sulawesi (Blair and Till, Ismunadji, Mamaril and Gonzales), whilst areas which have significant S inputs have no response (Manwan and Fagi).
Across Indonesia as a whole, for 1984- 88 the majority of ammonium sulfate (63%) was used for food crops, predominantly rice, with a further 20% used for sugarcane and 17% for estate crops (Rasahan and Kasryno). When analysed across different
*These and the following references refer to papers in these Proceedings.
11

regions 80670 of S in fertilizer was applied in Java during 1983-86, largely as result of the intensive rice cultivation on this island. A reduction in the recommended rate of ammonium sulfate application to rice, from lOOkg/ha to 50kg/ha would free up an estimated 162 000 t ammonium sui fate which could then be used on the islands outside Java where deficiencies are observed and ammonium sui fate is currently not, or only sparingly available. This amount of ammonium sulfate when applied at 50kg/ha would fertilize approximately 3.2 million ha of land and replace approximately 74 000 tonnes of urea used in these areas, which could be used in Java.
On the basis of input/output calculations, ammonium sulfate applications to sugarcane also are excessive and could be partially replaced by urea, thus freeing up more ammonium sulfate for use on the islands outside Java. Indonesia's current production capacity for AS of 650 000 t (Gregory) could therefore be redistributed to provide S at an adequate rate to cover crop offtake and losses for all of Indonesia's arable land.
S in the Indonesian Fertilizer Industry
World S production increased from 34 to 49 million tonnes (+ 15 million t) between 1967 and 1977 and by 6 million t between 1977 and 1987 (Morris). At the same time that production has increased, the source and supply locations have changed. Brimstone has become a more important source and regions other than N. America have become more important suppliers. Indonesia imports all its elemental S requirements.
Ambar has presented data which indicates that, in 1988-89, a deficit in local production capacity exists in triple superphosphate (TSP) and ammonium sui fate (AS) (Table I).
Table 1. Capacity, production, demand and balance (thousand tonnes) of TSP, Urea and AS in 1988/89 (Ambar)
Urea TSP AS
Capacity 4940 1200 650 Production 4248 1166 586 Demand 3184 1345 598 Balance + 1064 -179 -12
The 650 000 t production capacity is centralised at Gresik, E. Java. The manufacturing complex consists of 3 units (AS!, ASH and ASIII). ASI and ASIII produce AS by a direct process using low sulfur fuel oil and imported S whilst ASH uses recycled phospho-gypsum which is a by-product of TSP production derived from imported S, carbon dioxide and ammonia. Gregory has presented estimates of the cost of production of AS from these plants (Table 2). The cost of production is higher than the import price, but foreign exchange and integration of AS and TSP production considerations need to be taken into account in deciding the true cost of production.
Table 2. Estimated production cost ($US) of AS from Gresik
Production Cost
Foreign currency Local currency
TOTAL
AS! and ASIIl
62.79 14.67
77.46
ASH
8.16 122.32
130.48
Import
85.00
85.00
Gresik is the only location in Indonesia where elemental S handling and melting facilities exist. This has important implications for future S supply to agriculture.
Rasahan and Kasryno presented data that shows that AS consumption has increased
12

from 417 000 to 592000 t in the 1984-85 to 1988-89 period and that 64OJo of this was used on food crops in 1988-89.
World Bank estimates produced by Gregory suggest AS demand in Indonesia will increase from 607 000 to I 010 000 tonnes between 1988 and 1995. This is based on current application rates.
Fertilizer S Comparisons
Sulfur can be applied in a variety of fertilizer materials. These include combination of traditional sulfate fertilizer (gypsum, K2S04) with high analysis materials (OAP) or the introduction of elemental S (SO) onto or into high analysis materials to yield So fortified products.
The results of agronomic comparisons of sulfate and elemental S fertilizers conducted on upland and lowland crops in W. Africa and S.E. Asia have generally demonstrated that elemental S (SO) products were as effective as sulfate sources (Lefroy a, Lefroy b, Friesen, Mamaril). Possible exceptions are S-bentonites and sulfur coated urea (SeU) (Lefroy b, Mamaril). Both of these materials have proved ineffective in pot trials and field experiments have shown that S-bentonite is not effective on rice in the Philippines and Indonesia. Trials have also shown that deep placement of SO greatly limits its availability to the immediate crop. This places some constraints on how it is combined with other nutrient sources for application to rice, (e.g. So in urea super granules would not be a viable means of delivering corrective S applications). Deep placement of sulfate sources (e.g. AS/urea/super granule) does not appear to decrease yields, although there may be significant losses of S due to leaching and/or reduction.
Leaching losses from S" sources are less than from sui fate sources and, consequently, these materials have shown superior residual value in both upland and lowland situations. Elemental S in granular products (e.g. sulfur fortified TSP and urea S) was found to be less available than fine S· powder dispersed throughout the soil in greenhouse trials. These differences were not significant under field conditions for products containing lower S· concentrations. High analysis So materials offer some advantages with respect to the flexibility in obtaining different nutrient proportions in blending. However, there may be some disadvantages in the use of such blended products in that beneficial effects such as the enhanced oxidation of So when intimately mixed with phosphate would not occur. Application of S in these high formulations may further reduce availability by effectively decreasing the degree of dispersion of S in the soil when applied at low rates.
Fertilizer Policy
Fertilizer pricing policy has been a major instrument in the Indonesian Government's very successful program to stimulate agricultural growth in general and rice production in particular (Rosegrant). Food crop production increased from an average annual production level of 42.1 million t during Repelita I to 62.9 million t in 1986. This represents a compound growth rate of almost 30/0 per year. Fertilizer use increased at an average annual growth rate of almost 15% over the same period. Ammonium sulfate consumption increased by more than four times the level of the early eighties, to 561 000 t in 1987-88.
Although fertilizer application rates are high in rice production, the cost of fertilizer is a relatively small component of the total farm levcl production costs. It represents between 10 to 20OJo of the total production cost of most food crops in Indonesia. The cost of ammonium sulfate is estimated to be between 1 and 3OJo of total production costs (O'Brien).
Agronomic research indicates that the current rates of S application to rice in much of Java are above those needed to maintain current growth rates in rice production. There is also evidence that the use of AS as an N source on sugar has led to rates of S application to that crop in excess of the recommended rates.
13
Consideration by the government of encouraging reduced AS application rates to rice and sugar on Java would seem appropriate at this time.
If AS use on Java was reduced, the AS fertilizer saved could be diverted to use on the rapidly developing outer islands where there are indications that increased rates of S application could result in increased crop production.
Reduction in the subsidy on AS and an extension program to encourage decreased AS use on Java would release fertilizer for use elsewhere and is unlikely to affect crop production or incomes in Java. This should be accompanied by a research and extension effort off Java to determine appropriate S fertilizer application rates for rice and other food crops. The anticipated increased use of AS on the outer island would ensure that Indonesia's current AS production capacity was fully utilised.
The reduction in the subsidy to AS will result in a budgetry cost saving to the GOI (Rosegrant). Further savings will accrue when the P.T. Gresik AS plant switches to the lower cost production method of using natural gas instead of fuel oil in the near future.
The increase in AS price would need to be accompanied by an appropriate increase in the price of TSP to discourage substitution of this fertilizer for AS. Agronomic research indicates that TSP is also used on Java, and some areas of the outer islands, at rates above required levels. Economic analysis shows that the price of urea in combination with the price of rice remains a significant factor affecting rice production. It is therefore essential that the levels of the AS and TSP prices be determined in an integrated manner that takes into consideration urea and rice prices.
14
World Sulfur Industry
R. J. Morris* and C. A. Balazs**
Abstract Sulfur (S) is used as a raw material in the manufacture of fertilizers, synthetic and natural
fibres, paper, rubber, metals, food, pharmaceuticals, and many other materials. Until recently, its uses were so broadly based that economists used S consumption to measure industrial activity. However, a combination of economic and environmental factors have changed S-use patterns. Fertilizer manufacture now accounts for about two-thirds of the world's S consumption, and agricultural rather than industrial activities are the main determinant of S use. Major changes also took place in S supply. S produced as a byproduct increased rapidly and now accounts for over half of S production. This paper discusses the changes in the supply and demand situation for S and provides future forecasts.
AT ambient temperatures, pure sulfur (S) is an odourless, tasteless, pale yellow solid required for the growth of plants and animals. It is also a dynamic global commodity widely used as a raw material in the manufacture of fertilizers, synthetic fibres, paper, rubber, metals, food, pharmaceuticals. and several other materials. Its use is so broad that for many years it was considered to be an indicator of a nation's industrial productivity. However, some significant changes have occurred during the past two decades and these will be reviewed in this paper.
Production Trends
Elemental S, commonly called brimstone, is mined from ore deposits in many countries. The USA, USSR, Poland, Mexico, and Iraq are the major world producers from ore deposits.
Brimstone is also produced as a byproduct from the processing of fossil fuels - mainly natural gas, petroleum and tar sands. Canada, USA, France, Japan, Saudi Arabia, USSR and other countries are important producers of byproduct S.
S compounds, particularly sulfide ores and sulfuric acid are also useful sources of S. Iron sulfides
* Director of Agricultural Programs ** Director of Market Studies, The Sulphur Institute,
Washington, D.e. 20006
15
(pyrites) are produced for their S values, but other materials such as sulfuric acid produced at nonferrous metal smelters and at a few coal-burning plants are often considered unwanted byproducts.
Total S production in all forms increased 67!1fo from 33.7 to 56.7 million tonnes between 1967 and 1987, with most of the growth, 17 million tonnes, taking place between 1967 and 1977. Between 1977 and 1987, production rose by only 6 million tonnes, an average annual growth of only 1.1070.
The share of production by source has also changed as shown in Thble 1. In 1967, brimstone production was 17.5 million tonnes, about half of world S supply, but has now increased its share of total production to over 65%, 37 million tonnes. Between 1967 and 1977 there was a large decline in S production from pyrites, and a slower but continuing decline is likely as environmental concerns increasingly affect disposal of cinders remaining after processing.
Production of S in other forms, primarily smelter acid, has remained relatively constant at about 17%, but may increase 1 to 2 % between now and 1995 as a result of additional smelter acid production, also resulting from environmental pressures.
The source of world brimstone production has changed significantly. For many years, brimstone production from the Frasch process dominated the market. However, during the past two decades, the

Frasch S share of production has declined from almost 60070 to less than 30%. Since mined Frasch S is a discretionary source, its production can be adapted to changing demand patterns. Until recently, recovered S from sour natural gas and petroleum production was dependent solely on the demand for energy and considered a byproduct; thus the motivation to produce S was entirely different from that of the Frasch producer. Recovered S has had a dramatic impact on our industry and will continue to play an ever-increasing role in the future.
Not only has the form of S produced changed, but there have been significant geographical shifts in production. North American production increased about 40%, from 13 to 18 million tonnes, between 1967 and 1987. Western European S production has remained steady at between 7 and 8 million tonnes during the entire 2O-year period. The region's position as a brimstone producer declined relative to some other regions. Germany, and to a lesser extent Belgium, Great Britain, Italy and the Netherlands have become increasingly important S producers, while France's production is declining due to exhaustion of the Lacq gas fields. Spanish pyrites production is also declining.
Production in Asia has tripled to 6.8 million tonnes in 1987, with most of this growth in China, where pyrites is the major S source; and in Japan, where recovered S production dominates.
Dramatic growth has occurred in Eastern Europe, where S production in Poland and USSR, the two major producers, increased 118%, from just under 8 million in 1967 to 17 million tonnes in 1987. The USSR will become a more important factor in the future.
Latin America, the Middle East, Africa and Oceania together produced about 3 million tonnes S in 1967, with over 1 million tonnes from Latin America. Middle Eastern production was insignificant in 1967, but by 1987 production, principally from Saudi Arabia, Iraq and Iran, totalled just over 3 million tonnes.
Consumption Trends
S consumption increased significantly during the past two decades by about 71<Vo. In 1967, the world consumed only 33.5 million tonnes, but consumption grew rapidly by 15 million tonnes during the 1967-77 decade to reach 48.5 million tonnes. However, like production, growth in demand was slower between 1977 and 1987, and totalled 57.2 million tonnes in 1987.
Geographical markets for S are also changing. Consumption in North America has remained relatively stable during the past 20 years and totalled 13 million tonnes in 1987. The US is the largest
16
consumer in this region, accounting for almost 9O<Vo of North American consumption. In terms of the world's total market share, however, the continent lost 10%.
Consumption in Eastern Europe has shown steady growth, eclipsing North American consumption by more than 2 million tonnes in 1987. It has more than doubled over the past two decades and now represents more than one-quarter of the world's total. Western Europe, on the other hand, the second-largest consumer in 1967, has lost 10070 of its market share during the same period. Consumption has remained at about 9 million tonnes throughout the period.
The highest percentage growth has occurred in Africa, Latin America and Asia. Between 1977 and 1987 alone, annual growth in these regions averaged 8.7%,7.0% and 3.9<Vo, respectively. Africa consumed less than a million tonnes in 1967 and now is approaching 5 million, a 400% increase. Similarly, Latin American consumption has grown from about 800 000 tonnes in 1967 to over 3 million in 1987. In Asia, S consumption totalled just under 4.5 million tonnes in 1967. By 1987, consumption in this region doubled to reach more than 9 million tonnes. These three regions have become important markets for S and this trend is likely to continue.
In addition to geographical shifts, market end-uses have also changed. Non-fertilizer use of S increased from 20 to 24 million tonnes between 1967 and 1987, but during the 20-year period its share of the market fell from 61 to 43%.
Use of S in the fertilizer sector more than doubled from 13 million tonnes in 1967 to 33 million tonnes in 1987. During the period, its share of the total S market increased from 39 to 58%. Although S use by the fertilizer industry increased 20 million tonnes, its use to manufacture Nand K fertilizers declined in market share and increased only modestly in tonnage. However, use of S to manufacture phosphate had the greatest impact on S consumption and this market was vital to the success the sulfur industry experienced during the past two decades, accounting for 84% of increased demand. Greater use of phosphate alone did not account for the increase in consumption. Some phosphate fertilizers, such as diammonium phosphate (DAP), require nearly 1 tonne of S to produce a tonne of P 205, while others, such as nitrophosphate, require no S. Between 1967 and 1987, the production of high-analysis phosphate fertilizer materials, such as DAP, increased from 11 <Vo of total S consumption to 39%. This rapid increase in the use of high S consuming technologies was the most important factor influencing increased global demand for S, accounting for 18 of the 24 million tonne increase.
S is also an essential plant nutrient in its own right, required for a balanced fertilizer program. Where

once it was added incidentally through application of single superphosphate and other fertilizers, as well as from the atmosphere, this is no longer the case, and deliberate applications are made on all continents. While S as a plant nutrient was not a factor in 1967, by 1987, deliberate use of S as a fertilizer totalled some 2 million tonnes to supply a growing demand and will continue to increase.
Trade Patterns
International S trade patterns have changed over the past two decades as welL Both pyrites and sulfuric acid trade are subject to constraints not affecting brimstone. Therefore, discussion will focus on brimstone, which presently is by far the most widelytraded S material. In 196740.6070 of brimstone was involved in international trade and this level has increased only slightly to 44.70/0 in 1987.
Canada was an important exporter of brimstone as early as 1967, and its importance has continued to grow. In 1967, Canadian exports totalled 1.7 million tonnes, 24% of the world total. In 1987, Canada exported more than 6.5 million tonnes, and its share of total exports had increased to 40%. The regional share of exports from Canada has also changed. Canadian exports to Western and Eastern Europe and North America now account for 21% of total exports, while in 1967 they comprised 54%. Africa, which imported only 4% of Canadian brimstone in 1967, now accounts for more than one-third.
France, which exported about 1 million tonnes in 1967, exported only half this amount in 1987. Likewise, Mexican exports have declined 0.5 million tonnes during the two decades.
Polish exports increased from 300 000 tonnes in 1967 to almost 4 million in 1987, about half of which is shipped to other countries in Eastern Europe.
The USA's leading position in the export market in 1967 declined over the past several decades but its present share at 1.2 million tonnes is still greater than France and Mexico.
The USSR is no longer a sulfur exporter, although it is likely to become an important one in the future. Saudi Arabia was not an exporter in 1967, but in 1987 exported about 700 000 tonnes.
The trading patterns shown here illustrate Canada's rapid growth and the decline of other S suppliers over the past two decades. Canada's market continued to grow while other major exporting countries have passed their peak. Only USSR is likely to challenge Canada's position in the next decade. However, these five exporting countries, which accounted for 96% of all exports in 1967, shipped only 82% in 1987.
The importance of many cxporting companies or
17
agencies has also been diminished. In 1967, six agencies accounted for nearly all S exports. By 1987, 16 organisations accounted for less than 90% of the totaL This was most evident in North America where many other organisations joined Cansulex and Shell Canada in S export.
Future Trends
Production
Our forecast shows that S production will increase from the present level of just under 57 million tonnes, to a little over 68 million by 1995. This represents an annual growth factor of 2.5% per year. Most of this growth will come from brimstone sources, accounting for 9.4 million tonnes of the 11 million tonne increase. In the brimstone sector, the dominance of recovered S will continue and the market share of Frasch S will decline from 28 to 24%. While we recognise that additional Frasch S may result from exploration in the Gulf of Mexico and in Egypt, we do not believe this will be a factor during the forecast period.
North American production is expected to increase by a modest 2.5 million tonnes reaching just under 20 million by 1995, with a substantial portion of this increase coming from Canada. However, we have not included additional tonnages from the future Caroline sour gas field production in the period preceding 1995.
Perhaps the most important question is USSR production which will depend on the development of sour gas facilities at Astrakhan. We take a co·nservative view of S production in the USSR and are forecasting Soviet brimstone production will increase by about 6 million tonnes by 1995. We expect their pyrites production to decline by 0.5 million tonnes or more, and smelter acid to increase only modestly.
Western Europe is expected to remain at about the 8 million tonne level. Production in Asia is expected to increase by about 2 million tonnes to a total of about 12 million by 1995.
Latin America may only increase by about 0.5 million tonnes during the forecast period. A factor in the Latin American picture, however, is Chilean smelter acid which could significantly increase in the future.
Table 1. Changes in type of sulfur produced 1967-1987.
Year Sulfur type as percentage of world total
1%7 1977 1987
Brimstone Pyrites Other
51.9 64.6 65.4
30.3 19.2 17.1
17.8 16.4 17.5

Consumption
The Sulphur Institute's Market Study Group is projecting S consumption from all sources will increase from 57.2 to 69.0 million tonnes by 1995. About 700/0 of future growth will be the result of growth in phosphates and plant nutrient sulfur (PNS). Growth in demand for sulfur for phosphate manufacture and PNS will total about 10 million tonnes. This growth will be greatest in Asia where fertilizer consumption will likely be the most rapid into early next decade.
Growth in traditional non-fertilizer markets, caprolactam, ore leaching, Ti02, pulp and paper and others, will remain relatively flat, with total nonfertilizer S consumption growing by only about 2 million tonnes between now and 1995.
When future consumption is evaluated by region, North America does not show much growth, increasing only about 9% during the period, substantially all of which is in the fertilizer sector. Consumption in this region is expected to total about 14.5 million tonnes by 1995.
18
Western European consumption will decline, probably by half a million tonnes. Declines are expected in both fertilizer and non-fertilizer markets.
Consumption in Eastern Europe and USSR will expand by over 3 million tonnes, according to our projections. Both the fertilizer and non-fertilizer sectors will grow, but the fertilizer sector will total 2 million tonnes, or two-thirds more.
Asia is a key region and by 1995 consumption of S will reach almost 12 million tonnes. Most of the growth will be in fertilizers where more than 2 million tonnes of additional consumption is forecast. African consumption will grow by almost 2 million tonnes as well, all of it in the fertilizer sector. Projections of consumption and production indicate a balanced marketplace through 1990. But between 1990 and 1995, a deficit situation will likely develop and the world will be short at least 1 million tonnes of S. The growing demand for fertilizer continues to drive the increasing demand for suI fur. The only factors likely to impact negatively on this will be a decrease in consumption of sulfuric acid-based phosphatic fertilizers.

The Fertilizer Industry in Indonesia
Sri Ambar Suryosunarko"
Abstract The aim of this paper is to give an overview of the development of the fertilizer industry in
Indonesia. It covers aspects such as raw material, capacity, ownership, organisation, marketing and distribution.
To fulfil the increasing demand for fertilizer the government of Indonesia has given encouragement to the development of the fertilizer industry in Indonesia. The fertilizer industry has two functions: a backward linkage to give added value to raw materials, and a forward linkage to support the agricultural sector by supplying fertilizers in order to achieve the goal of self-sufficiency in food. Fertilizer is a vital production input in achieving this goal through programs of intensification, extensification and diversification as well as rehabilitation.
In order to maintain the stability and continuity of fertilizer supply to farmers at a reasonable price, the fertilizer industry is supported by development programs which are continually updated in accordance with the development of fertilizermanufacturing technology.
Besides backward and forward linkages the fertilizer industry, as a basic industry, is responsible for enhancing industrial linkages and promoting regional economic growth.
Factors which are important in the establishment of a viable fertilizer industry are the availability of raw materials, skilled labour and markets. These three factors are available in Indonesia especially for the urea fertilizer industry. In addition to these three factors, safeguarding the environment and the participation of local engineering companies are important. The fertilizer industries which are developing in Indonesia include the manufacture of
* Directorate General for Basic Chemical Industry, Ministry of Industry, Indonesia
19
urea, triple superphosphate (TSP), ammonium sulfate (AS) and ground rock phosphate for direct application.
Raw Materials
Natural gas
The main raw material for urea fertilizer production is natural gas which is available in large quantities in Indonesia. The locations of these natural gas resources (1able 1) determine the location of the fertilizer plants.
Rock phosphate
Rock phosphate deposits found to date are small and scattered and with a low P content. Because of this all rock phosphate for the production of TSP is imported. This amounts to around 1 million tonnes and comes from Jordan, Morocco, and Tunis.
Exploration is still being undertaken to discover new rock phosphate deposits in Indonesia.
Phosphoric acid
Additional phosphoric acid to meet the needs of the fertilizer industry amount to about 400 000 tonnes/year which is imported from Jordan, Morocco, USA, Philippines, Tunis and Spain.
Sulfur
Economical deposits have not been found yet in Indonesia. About 250 000 t S/yr is imported from USA and Canada for use in producing ammonium sulCate.

Other raw materials
No potassium deposits have been found in Indonesia. Limestone and dolomite are mined throughout the country.
Development Of The Fertilizer Industry
Bearing in mind the increasing demand for fertilizer and the amount of natural gas available, the government of Indonesia has decided to develop the urea fertilizer industry. The first ammonia and urea plant, Pusri 1 commenced construction in 1961 at Palembang, South Sumatra, and started production in 1963. In the following Five-Year National Development Plan which began in 1969-70, the urea fertilizer industry developed very rapidly. Since soil characteristics in Indonesia vary greatly, the type of fertilizer which is most appropriate is single-nutrient types such as urea, TSP and ammonium sulfate. Development of the fertilizer industry is following this policy.
The profiles of the fertilizer plants are presented in Appendix 1.
Ownership and Organisation
Ownership
Most of the existing fertilizer producers are owned by the Government, namely: PT Pupuk Sriwijaya (Pusri), PT Pupuk Kujang, PT Pupuk Kalimantan Timur, PT Pupuk Iskandar Muda and PT Petrokimia Gresik, while PT Asean Aceh Fertilizer (AAF) is an Asean Industrial Project with a shareholder composition of Indonesia 600/0, Philippines 130/0, Thailand 13070, Malaysia 13%, and Singapore 1%.
Other small fertilizer producers such as PT Sumatra Phosphat, PT Polowijo Gosari, PT Rolimex and PT Gemari are privately owned companies.
Organisation
Both the government-owned and privately-owned fertilizer companies are under the administration of the Directorate General of Basic Chemical Industry, Ministry of Industry. To coordinate these companies an association was established called the Indonesian Association of Fertilizer Manufacturers which consists of: Chairman of the Presidium, ViceChairman, Secretary-General, Members of the Presidium, who are the President or Director of each fertilizer producer; and Members of the Board of the Association. These Board members chair the following Committees: Technical, Production Committee, Research and Development, Marketing and Distribution, Foreign Relations; and Industrial Climate.
20
Meetings between the Government and the Association or the Association and its members are held periodically. The Committee holds seminars, discussions, workshops, and other meetings among the members to exchange experiences and to solve technical problems.
National Capacity
The development of the national capacity of fertilizer and the supply/demand balance are shown in Table 2. From the end of the first five-year development plan (1973-74) until the end of the fourth five-year development plan (1988-89) the fertilizer industry developed rapidly. For urea, fertilizer supply is bigger than demand but for ammonium sulfate and phosphatic fertilizer supply is already lower than demand. Urea fertilizer is being exported at the rate of about 1 million t/year.
Imports of TSP and potassium chloride are organised by a Government-owned trading company.
Marketing and Distribution
Fertilizers used in Indonesia are mostly singlenutrient, i.e. urea, TSP, ammonium sulfate and potassium chloride, and are still subsidised by the government. Compound fertilizers such as DAP and NPK are used in small amounts and are not subsidised. Marketing of subsidised fertilizer is controlled by the government while marketing of unsubsidised fertilizers is not. A 'pipeline distribution system' is used to market subsidised fertilizers. Distribution starts at the manufacturer and ends with the consumer through a chain of distribution channels. The five targets of distribution are right quality, right place, right quantity, right time and right price.
To implement the marketing and distribution of subsidised fertilizer the Government has appointed PT Pupuk Sriwijaya (Pusri) as the sole distributor for the whole of Indonesia. The distribution channels are: Line I: Storage facility in the area of the local
fertilizer manufacturer or in the harbour area which is managed by the harbour authority for storing locally manufactured as well as imported fertilizer.
Line 11: Storage facility outside the harbour area or located in the Provincial Capital which is receiving and storing fertilizer from the Line I and/or from the bagging plants.
Line Ill: Storage facilities in the area of the Capital of Kabupaten (second level of the regional governmental administration) which is

Table 1. Location and resources (TSCF) of natural gas in Indonesia.
Location
Aceh North Sumatra South Sumatra East Kalimantan West Java East Java
Total Reserve
17.69 TSCF 1.27 TSCF 6.12 TSCF 20.8 TSCF 3.46 TSCF 2.56ITSCF
Utilised
14.21 TSCF 1.27 TSCF 2.5 TSCF 12.38 TSCF 2.33 TSCF
The distribution system of fertilizers varies depending on the location and agricultural sector:-
Food Crops in Java and South Sulawesi Fertilizer is manufactured by six companies, namely P:r. Pusri, P.T. Asean, Aceh Fertilizer, P.T. Pupuk Iskandar Muda, P.T. Pupuk Kalimantan Timor, P.T. Pupuk Kujang and P.T. Petrokimia Gresik. Bagged fertilizer is transported by rail or ship from all plants and in bulk from the first four listed above. The bagged fertilizer goes to both Lines II and III and the bulk
Table 2. Supply and demand balance of fertilizer in Pelita I, II, Ill, IV (million tonnes).
1969170 1973174
(a) Urea Capacity 0.100 0.145 Production 0.084 0.122 Demand 0.308 0.669 Balance (0.224)* (0.547) (b).TSP Capacity 0 0 Production 0 0 Demand 0.049 0.136 Balance (0.049) (0.136) (c).AS Capacity 0 0.150 Production 0 0.120 Demand 0.061 0.065 Balance (0.061) 0.055
* Numbers in parenthesis are negative values.
Table 3. Country of destination of exports of urea and ammonia in 1988, expressed as a percentage of total exports.
Country Urea Ammonia
China 36 0 Malaysia 16 1 Philippines 13 42 Vietnam 11 0 Thailand 11 2 Hongkong 6 0 Japan 4 0 Sri Lanka 1 0 Singapore 1 1 South Korea 1 21 Taiwan 0 18 India 0 11 Spain 0 3
managed by PT Pusri receiving and storing fertilizer from Line IL
Line IV: Storage facilities in the area of the Cooperatives which act as fertilizer distributor, receiving and storing fertilizer from Line Ill.
21
1978179 1983/84 1988/89
2.235 2.805 4.940 1.451 2.255 4.248 1.080 2.157 3.184 0.371 0.098 1.064
0 1.000 1.200 0 783 1.166
0.205 738 1.345 (0.205) 0.045 (0.0179)
0.150 0.200 0.650 0.129 0.208 0.586 0.155 0.358 0.598
(0.026) (0.150) (0.012)
material first to Line 11 and then to Line HI. All distribution up to Line III is by P.T. Pusri. From Line III the fertilizers go to a distribution cooperative and then either through a retailer cooperative or directly to the supply locations.
Food Crops in other areas The manufacturing and distribution system is the same as in Java and South Sulawesi as far as Line Ill. From Line III the fertilizer goes either to a distributor cooperative or the government-owned P.T. Pertani. The fertilizer then goes either to a retailer cooperative or directly to the supply location.
Plantation Crops The manufacturing and distribution system is the same as for food crops as far as Line Ill. From Line III all fertilizer is distributed to private and government plantations through PT. Pertani.
To carry out the fertilizer distribution program PT Pusri is supported by the following distribution facilities.
Bagging plant:
Location: Belawan, North Sumatra: Teluk Bayur, West Sumatra: Cilacap, Central Java: Tanjung Priok, Jakarta: Surabaya, East Java: Ujung Pandang, S. Sulawesi: Meneng, East Java:
Total
Capacity 270000 TPA 180000 TPA 360000 TPA 200 000 TPA 450000 TPA 270000 TPA
1000000 TPA
2730000 TPA
Seven bulk carriers of 7500 dead weight (dwt) each or a total capacity of about 52 500 dwt owned by PT Pusri and one bulk carrier of 10 000 (dwt) capacity owned by a private company and one ammonia carrier of 3750 (dwt).
Rail wagons, 595 of 30 t capacity each, (total 17 850 t), and 7 locomotives.
Eighty-two storage facilities with total capacity 400 000 t.
Productiou, Export and Import
The domestic market is the first priority for the Indonesian fertilizer industry. Excess capacity is available for export. In 1988 the Indonesian industry exported I 024 000 t of urea, 17 000 t of ammonia sulfate and 312 000 t of ammonia. The distribution of exports is shown in Table 3.
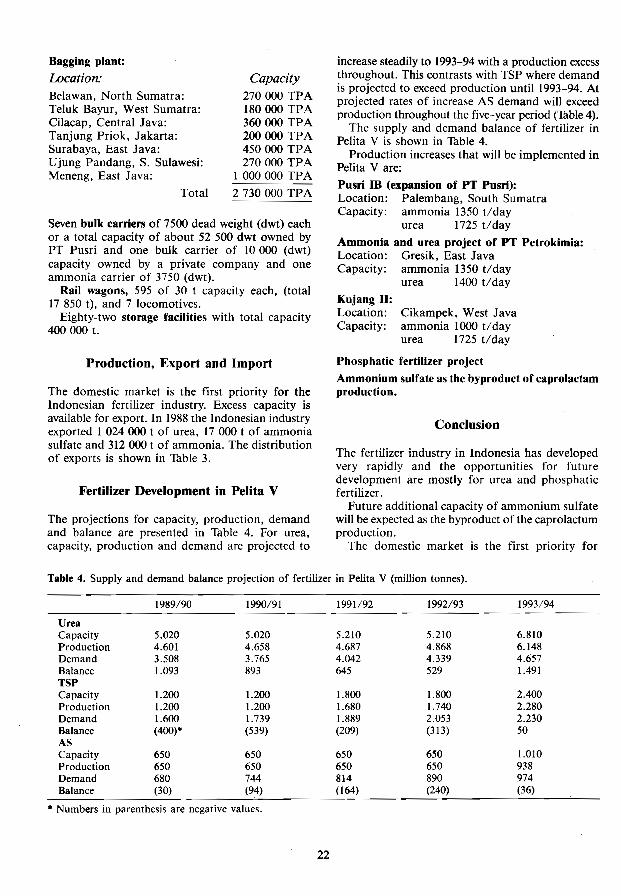
Fertilizer Development in Pelita V
The projections for capacity, production, demand and balance are presented in Table 4. For urea, capacity, production and demand are projected to
increase steadily to 1993-94 with a production excess throughout. This contrasts with TSP where demand is projected to exceed production until 1993-94. At projected rates of increase AS demand will exceed production throughout the five-year period (Table 4).
The supply and demand balance of fertilizer in Pelita V is shown in Table 4.
Production increases that will be implemented in Pelita V are:
Pusri IB (expansion of PT Pusri): Location: Palembang, South Sumatra Capacity: ammonia 1350 tlday
urea 1725 t/day
Ammonia and urea project of PT Petrokimia: Location: Gresik, East Java Capacity: ammonia 1350 tlday
Kujang 11: Location: Capacity:
urea 1400 tl day
Cikampek, West Java ammonia 1000 tlday urea 1725 tlday
Phosphatic fertilizer project
Ammonium sulfate as the byproduct of caprolactam production.
Conclusion
The fertilizer industry in Indonesia has developed very rapidly and the opportunities for future development are mostly for urea and phosphatic fertilizer.
Future additional capacity of ammonium sulfate will be expected as the byproduct of the caprolactum production.
The domestic market is the first priority for
Table 4. Supply and demand balance projection of fertilizer in Pelita V (million tonnes). ----------... ---
1989/90 1990/91 1991/92 1992193 1993/94
Urea Capacity 5.020 5.020 5.210 5.210 6.810 Production 4.601 4.658 4.687 4.868 6.148 Demand 3.508 3.765 4.042 4.339 4.657 Balance 1.093 893 645 529 1.491 TSP Capacity 1.200 1.200 1.800 1.800 2.400 Production 1.200 1.200 1.680 1.740 2.280 Demand 1.600 1.739 1.889 2.053 2.230 Balance (400)* (539) (209) (313) 50 AS Capacity 650 650 650 650 1.010 Production 650 650 650 650 938 Demand 680 744 814 890 974 Balance (30) (36)
• Numbers in parenthesis are negative values.
22
Indonesian fertilizer and excess is exported. The amount of urea exported in 1988 is shown in Table 2. Urea is exported by each urea manufacturer. TSP and KCL is imported by the government-owned trading company. Urea ammonia is also exported regularly.
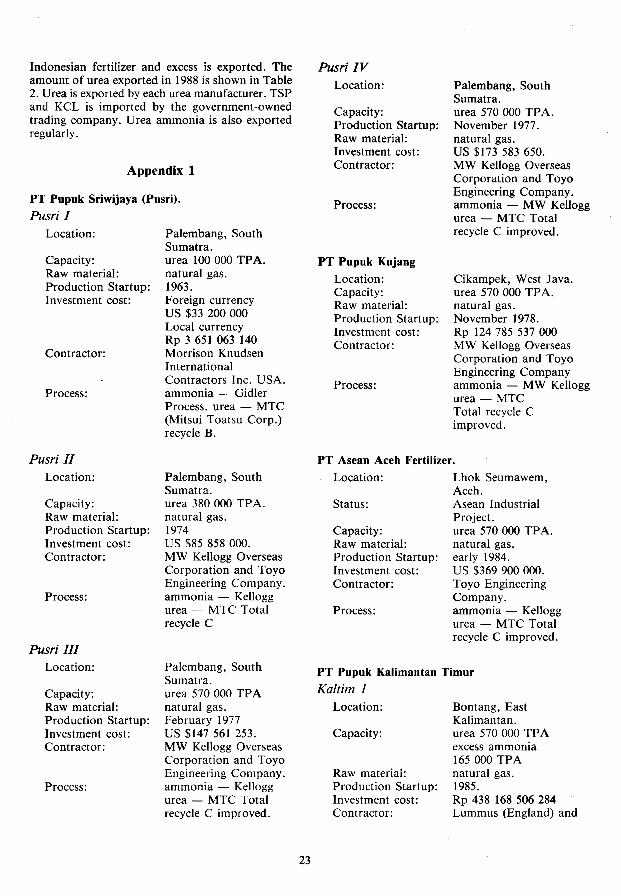
Appendix 1
PT Pupuk Sriwijaya (Pusri).
Pusri I Location:
Capacity: Raw material: Production Startup: Investment cost:
Contractor:
Process:
Pusri Il Location:
Capacity: Raw material: Production Startup: Investment cost: Contractor:
Process:
Pusri III Location:
Capacity: Raw material: Production Startup: Investment cost: Contractor:
Process:
Palembang, South Sumatra. urea 100 000 TPA. natural gas. 1963. Foreign currency US $33 200 000 Local currency Rp 3 651 063 140 Morrison Knudsen International Contractors Inc. USA. ammonia - Gidler Process. urea - MTC (Mitsui Toatsu Corp.) recycle B.
Paiembang, South Sumatra. urea 380 000 TP A. natural gas. 1974 US $85 858 000. MW Kellogg Overseas Corporation and Toyo Engineering Company. ammonia Kellogg urea - MTC Total recycle C
Palembang, South Sumatra. urea 570 000 TP A natural gas. February 1977 US $141 561 253. MW Kellogg Overseas Corporation and Toyo Engineering Company. ammonia - Kellogg urea - MTC Total recycle C improved.
23
Pusri IV Location:
Capacity: Production Startup: Raw material: Investment cost: Contractor:
Process:
PT Pupuk Kujang
Location: Capacity: Raw material: Production Startup: Investment cost: Contractor:
Process:
Palembang. South Sumatra. urea 510 000 TP A. November 1977. natural gas. US $173 583 650. MW Kellogg Overseas Corporation and Toyo Engineering Company. ammonia - MW Kellogg urea - MTC Total recycle C improved.
Cikampek, West Java. urea 570 000 TP A. natural gas. November 1918. Rp 124 785 537 000 MW Kellogg Overseas Corporation and Toyo Engineering Company ammonia - MW Kellogg urea MTC Total recycle C improved.
PT Asean Aceh Fertilizer. Location:
Status:
Capacity: Raw material: Production Startup: Investment cost: Contractor:
Process:
Lhok Seumawem, Aceh. Asean Industrial Project. urea 570 000 TP A. natural gas. early 1984. US $369 900 000. Toyo Engineering Company. ammonia - Kellogg urea MTC Total recycle C improved.
PT Pupuk Kalimantan Timur
Kaltim 1 Location:
Capacity:
Raw material: Production Startup: Investment cost: Contractor:
Bontang, East Kalimantan. urea 570 000 TP A excess ammonia 165000 TPA natural gas. 1985. Rp 438 168 506 284 Lummus (England) and

Process:
Kaltim 11 Location:
Capacity:
Raw material: Production Startup: Investment cost: Contractor:
Process:
Ka/tim III Location:
Capacity: Raw material: Production Startup: Investment cost:
Contractor:
Process:
Coppee Rust (Belgium) as subcontractor for ammonia. ammonia - Grand de Paroise urea Stamicarbon
Bontang, East Kalimantan. urea 570 000 TP A excess ammonia 165000 TPA natural gas. 1985. Rp 446 123 153000 MW Kellogg Overseas Corp. ammonia - Kellogg semi low energy urea Stamicarbon stripping
Bontang, East Kalimantan. urea 570 000 TP A natural gas. end of 1988. Yen 30734063000 and Rp. 90 742 624000 Consortium Chiyoda (Japan) and Rekayasa (Indonesia) ammonia Topsoe low energy urea - Stamicarbon low energy
PT Pupuk Iskandar Muda
Location: Capacity: Raw material: Production Startup: Investment cost: Contractor:
Process:
PT Petrokimia Gresik
Lhok Seumawe, Aceh. urea 570000 TPA. natural gas. 1985 Rp 283 291 971 000 Toyo Engineering Company and PT Rekayasa Industries. ammonia - Kellogg urea - MTC total recycle C improved.
Unit Ammonium Sulfate I. Location: Capacity:
Gresik, East Java. ammonium sulfate
24
Raw material:
Production Startup: Investment cost:
Contractor: Process:
Unit TSP I. Location: Capacity:
Raw material:
Production Startup: Investment cost:
Contractor:
Process:
Unit TSP If. Location: Capacity:
Raw material:
Production Startup: Investment cost: Contractor:
Process:
Unit Phosphoric Acid Location: Capacity:
150000 TPA. urea 45 000 TP A. or ammonium sulfate 200 000 TPA. sulfuric acid 15 000 TPA. ammonia 8 000 TP A LSFO (low suI fur fuel oil), sulfur. 1972. US$57.6 million and Rp 1 972 500 000 Considit, Italy. ammonium sulfate ammonia - Haldor Topsoe sulfuric acid - Contact process of Monsanto. urea - lnventa
Gresik, East Java. TSP 330 000 TP A, DAP 80000 TPA, NPK 50 000 TP A. or TSP 500 000 TP A. after improvement: TSP 600 000 TPA. Rock phosphate, phosphoric acid. 1979. FF 283 742 000 and Rp 10 168 210 000 Spie Batignolles, France. TVA
Gresik, East Java TSP 500000 TPA. after improvement: TSP 600 000 TPA. Rock phosphate phosphoric acid. 1983. Rp 42 359 000 000 Spie Batignolles, France. TVA
Gresik, East Java. phosphoric acid 317000 TPA (54070 ).

Raw material:
Production Startup: Investment cost: Contractor:
Process:
Cement retarder! 440 000 TPA gypsum aluminium fluoride 12600 TPA. Rock phosphate, sulfuric acid. 1985. Rp 193 381 082 000 Mitsubishi Corporation and Hitachi Zosen. Nissan C.
Unit Ammonium Sul/ate 11. Location: Capacity:
Raw material:
Production Startup: Investment cost:
Contractor:
Gresik, East Java. ammonium sulfate 250000 TPA. phosphogypsum, carbon dioxide, ammonia. 1985. included in phosphoric acid unit. included in phosphoric acid unit.
Unit Ammonium Sul/ate Ill. Location: Capacity:
Raw material: Production Startup: Contractor:
Gresik, East Java. ammonium sulfate 200000 TPA. ammonia, sulfuric acid. 1986. PT Petrokimia
25
PT Sumatra Phosphate Industries
Location: Medan, North Sumatra.
Capacity: ground phosphate rock 50000 TPA
Raw material: Rock phosphate.
PT PaJawijo Gosari
Location:
Capacity:
Raw material:
PT Kurnia Pelita
Location: Capacity:
Sedayu, Gresik, East Java. ground rock phosphate 30000 TPA dolomite fertilizer 30000 TPA after expansion 120 000 TPA local rock phosphate and local dolomite.
Surabaya and Medan. compound fertilizer 72 000 TP A each.
PT Rolimex Corporation Location:
Capacity:
Medan, North Sumatra. mixed fertilizer 16 000 TPA.
PT Gemah Ripah Lohjinawi (Gemari) Location: Capacity:
Cianjur, West Java. liquid mixed fertilizer

Fertilizer S Consumption in Indonesia: Wbere Sulfur is Used and Wby
Chairil A. Rasahan* and Faisal Kasryno**
Abstract Fertilizer use in Indonesia has increased dramatically over the last 20 years and resulted in
increased productivity and increased incomes in the agricultural sector. A result of this increased productivity has been the attainment of self-sufficiency in rice production.
The majority of S is applied as ammonium sui fate, the production of which has increased from 120 000t in 1974 to 656 000t in 1988. In the 1984-89 period, 631170 of the ammonium sulfate consumed in the agricultural sector was used for rice, 171170 for sugarcane and 20070 for estate crops. Approximately 801170 of ammonium sulfate consumed is used in Java with a further 111170 in Sumatra.
This paper discusses the production, consumption, distribution and price of S fertilizers with regard to the requirement for S and the costs of the government's fertilizer policy.
THE widespread adoption and utilisation of chemical fertilizers in Indonesia in the last 20 years has been the result of government agricultural policy which aimed to increase productivity and income from this sector. These results, together with the introduction of new biological technologies and various government market interventions have created the conducive economic environment required to promote agricultural growth and development. As a result, Indonesia has achieved an outstanding performance in agricultural development, and in particular has been able to achieve and maintain rice self-sufficiency in the last few years.
The success of Indonesia's fertilizer policy has also created problems for the government. The fertilizer industries are vested in the public sector and the government also maintains full control of fertilizer imports and exports, domestic storage, wholesaling operations, and input-output pricing policies, as well
• Centre for Agro Economic Research, Ministry of Agriculture, Jalan A. Yani No.70, Bogor, Indonesia.
·*Bureau of Planning, Ministry of Agriculture, Jalan Harsono RM No. 3, Pasar Minggu Jakarta Salatan 12520, Indonesia.
26
as subsidising and protecting the whole fertilizer system. State budget subsidies are granted in order to absorb any costs created in implementing systems of allocative controls on production, storage, trade, and domestic pricing of fertilizer. In the case that the domestic price of fertilizer is lower than world market prices, protection to domestic production will, in the long run, generate economic inefficiency. Excessive price subsidy is likely to lead to excessive usage which creates a false import or manufacturing demand. In the long run, society will suffer because of misallocation of resources caused by unnecessary market distortions.
It is within this context that this paper addresses some of the issues related to the implication of fertilizer policy on the level of fertilizer consumption. In particular, the questions that need to be answered are what is the consumption level of sui fur-containing fertilizers, where are they used and what creates the demand.
In the following section trends in production, trade, and utilisation of fertilizer in Indonesia are reported. This is followed by a discussion of sui fur consumption by the sub-sectors of agriculture and by geographic area. This leads to a discussion of potential factors and problems affecting the current and future level of sulfur consumption.

Historical Trends
In the past 15 years there has been rapid growth in domestic production capacity. Table 1 shows that in 1974 domestic urea production was only 207 OOOt, and that this had increased to exceed 4 million tonnes by 1988. During that same period, production of ammonium sulfate increased from 122 000 to 656 000t. Domestic production of triple superphosphate (1SP) began in 1979 and by 1988 had risen to more than 1.2 million tonnes. Furthermore, as indicated in Table 1, the highest growth in fertilizer production occurred between 1974 and 1984 (Pelita II and Pelita Ill). Rates of growth in domestic production have slowed since 1984, but remain high compared with the growth of world fertilizer production of 150/0 per year for nitrogen and 12% per year for phosphates.
Table 1. Fertilizer production in Indonesia, 1969 1988 (thousand tonnes).
Year Urea AS TSP
1969 84 1974 207 122 1979 1 826 148 117 1984 3044 356 1027 1988 4178 656 1249
Domestic fertilizer consumption has grown at an equally rapid pace. Urea use increased by 13.8%, ammonium sulfate (AS) by 15.0%, and 1SP by 25.3%/year between 1979 and 1983 (Table 2). The growth rate in domestic consumption of fertilizer, however, has started to slow down in Pelita IV (1984-88).
In 1981, annual fertilizer imports exceeded domestic production capacity by approximately US$llOm. Since 1985 Indonesia has become a major fertilizer exporter, although substantial amounts of raw materials are imported for domestic fertilizer production. Rapid production growth has outpaced domestic urea demand. Domestic production of phosphate fertilizers has matched growth in domestic demand. In 1987, Indonesia's net exports of fertilizer had a reported value of US$55m. However, it is important to note that between 1987 and 1988, the value of Indonesian foreign exchange that has to be spent in order to import fertilizer items has increased by almost 67%. Given the limitation of foreign exchange available to the country and the current state of the domestic fertilizer industry, such unexpected import trends should be taken seriously.
S Utilisation in Agricultural Production In order to give an overall view of S in the context of fertilizer consumption in Indonesia, two series of
Table 2. Consumption of fertilizer by types, 1969 1988. --------------------------------
Year Urea AS TSP KCI Total
('000 t)
1969 308 61 49 14 432 1970 342 76 65 14 484 1971 413 67 55 4 539 1972 485 157 39 55 736 1973 669 65 136 21 891 1974 604 139 193 16 ?52 1975 676 94 235 34 1039 1976 686 122 211 24 1043 1977 962 140 183 69 1 355 1978 1080 155 205 109 1 549 1979 1240 196 268 122 1 825 1980 1680 330 439 123 2572 1981 2021 282 644 148 3 \03 1982 2 181 335 752 125 3393 1983 2 157 358 738 171 3374 1985 2693 481 1 122 297 4593 1987 2911 569 1 262 409 5 151 1988 3259 647 1426 466 5798
Growth Rate (OJo/year)
1969-73 19.4 1.6 25.5 \0.1 18.1 1974-78 14.5 2.7 1.5 47.9 12.2 1979 - 83 13.8 15.0 25.3 8.4 15.4 1984- 88 3.1 14.8 8.5 16.9 6.4
27

historical consumption trends are provided, namely was followed by estate crops. In all sectors, except S utilisation across agricultural commodities (mostly sugarcane, urea consumption exceeded that of the foodcrops and treecrops) and S regional consumption other fertilizers. In the sugarcane sector ammonium (Tables 3 and 4). suI fate consumption exceeded that of all other
fertilizers. S Utilisation across agricultural commodities
Table 3 shows that foodcrops consumed the largest S Utilisation across the regions
proportion of fertilizer for all types of fertilizer. This The utilisation of S in the various regions is reported
Table 3. Fertilizer consumption for agricultural subsector 1984 - 88.
Year Foodcrops Estate Crops Sugarcane Others Total
'000 t 0'/0 '000 t 0/0 '000 t "10 '000 t 070 '000 t 0'/0
Urea 1984/85 2342 91 208 8 0 0 25 1 2575 100 1985/86 2334 89 270 10 1 0 6 0 2611 100 1986/87 2486 91 231 9 0 0 0 0 2717 100 1987/88 2485 91 256 9 I 0 3 0 2745 100 1988/89 2636 91 260 9 0 0 I 0 2897 100 Average 2456 91 245 9 0 0 9 0 2703 100
AS 1984/85 231 55 80 19 104 25 2 1 417 100 1985/86 299 64 90 19 77 17 0 0 466 100 1986/87 337 66 75 IS 100 20 0 0 512 100 1987/88 372 66 90 16 102 18 0 0 564 100 1988/89 379 64 106 18 106 18 1 0 592 100 Average 324 63 88 17 98 20 I 0 511 100
TSP 1984/85 886 89 99 10 4 0 5 I 994 100 1985/86 933 86 148 14 5 1 2 0 1088 100 1986/87 1 056 87 143 12 5 0 4 0 1 208 100 1987/88 1 039 86 147 12 21 2 2 0 1209 100 1988/89 1 III 87 153 12 10 1 3 0 1 277 100 Average 1005 87 138 12 9 1 3 0 1 155 100
KCf 1984/85 88 37 144 61 1 0 4 2 237 100 1985/86 103 35 191 64 2 1 1 0 297 100 1986/87 124 46 142 52 4 2 1 0 271 100 1987/88 184 45 211 52 13 3 I 0 409 100 1988/89 191 41 265 57 8 2 1 0 466 100 Average 138 41 191 57 6 2 2 1 336 100
Source: Ministry of Agriculture.
Table 4. Regional consumption (t) of AS and 070 of AS consumption (in parenthesis), 1983-86.
Year Java Sumatera Kalimantan Sulawesi N. Tenggara Total
1983 312 326 36466 0 10 418 0 358000 (87.00) (10.0) (0.0) (2.9) (0.0) (lOO)
1984 330 167 41 542 1 887 12238 160 417 000 (79.1) (9.9) (0.5) (2.9) (0.0) (100)
1985 363887 62996 6886 20355 672 466000 (78.1 ) (13.5) (1.5) (4.4) (0.1) (100)
1986 380347 62089 3216 24110 415 512000 (74.3) (12.1) (0.6) (4.7) (0.1) (lOO)
Source: Ministry of Agriculture.
28

in Table 4. It is not surprising to find that the largest S consumption is in Java, given the fact that the most intensive agricultural production occurs on that island. Ismunadji et al. (1983) reported that large areas of the country have been shown to be Sdeficient. Limited empirical evidence suggests that S deficiencies are found on the island of Java, Sumatera and Sulawesi.
Farmers in Sumatera are the second-greatest users of S fertilizers. In 1983 only 10070 of total domestic
Table S. Source and potential sources of fertiliser sulfur (Palmer et al. 1983, after B1air, 1979).
Source
Sulfate - containing Ammonium sulfate Superphosphate Calcium sulfate Potassium sulfate Ammonium sulfate nitrate Ammonium nitrate sulfate
Elemental sulfur - containing Elemental sulfur
Other inorganic forms Ammonium thiosulfate sol. Sulfur dioxide
Percentage S
24 5 12
18 16 22
15 5 11
100
26 50
ammonium suI fate consumption was allocated to Sumatera, but this share had increased to 13.5070 in 1985. Along with the growth of agricultural food production outside Java, the share of total fertilizer consumed in Java has been declining slowly since early 1980. The share of S consumption in Java has declined from 87% in 1983 to 74.3% in 1986 (Table 4).
Factors and Problems Affecting Sulfur Utilisation
Based on the performance of S fertilizer described in the previous section, at least two factors and two problems will determine the current and future prospects of S fertilizer consumption in Indonesia
S-containiog fertilizer
Undoubtedly, S as a nutrient will become increasingly important in the Asian as the trend towards high analysis continues and S deficiency is more clearly identified as an impediment to production (Lancaster and Boyd 1983). In the case of Indonesia, it is clear that urea, TSP, and AS are considered the primary sources of N, P, and S. There is a wide range of S-containing fertilizer materials which has been used or proposed for use under diverse conditions. An example of such materials is listed in Table 5 as
Table 6. Fertilizer recommendation for food and estate crops (kg/ha) and average consumption (in parenthesis), 1986.
Fertilizer (kg/ha)
Crops Urea AS TSP KCl Total
Paddy lowland 150- 300 0-100 50-150 0-75 (194) (32) (93) (57) (377)
Paddy upland 150-300 0-50 75 100 50 75 (194) (25) (105) (59) (383)
Paddy swamp 125-150 0 50 100 0 75 (136) (0) (82) (52) (271)
Corn 100-250 0-100 75 150 0-50 (208) (35) (124) (47) (413)
Soybean 50-100 0-50 63~200 25 50 (67) (13) (116) (41) (238)
Peanut 63 -100 0 88-200 0 50 (76) (0) (117) (36) (229)
Cassava 150-200 0-50 50-150 50 100 (187) (7) (80) (64) (337)
Greennut 38-75 0 63-125 0-50 (61) (0) (90) (28) (179)
Sorghum 200 0 75-100 50-100 (200) (0) (94) (63) (156)
Cotton 60-150 40 100-200 100 300-490
Sugarcane 0 400-700 100-600 200 400 700 1700
Source: Ministry of Agriculture.
29

quoted from Palmer et al. (1983). Of these, ammonium sulfate is the best-known sulfatecontaining fertilizer available in Indonesia. Given the fact that urea and TSP are the most widely-used fertilizers in Indonesia, potential ways of including S with these materials may offer alternative sources.
S-deficiencies
One of the most important factors affecting utilisation of S in the future is the availability of information about S deficiencies related to soils and crops. Identification of soils where S-deficiency occurs has gradually increased as many Indonesian soil scientists gain more experience in S research. This has been matched by an increasing awareness by agronomists which is reflected in making fertilizer recommendations for crops (see, for example, Table 6). The role of government implementing agencies in providing agricultural extension services is crucial in providing and delivering such information to farmers.
Characteristics of the domestic price of fertilizer
Since the beginning of Pelita I, the government has introduced input-output agricultural price policies, in particular in the rice sector, to achieve rice selfsufficiency. In the case of fertilizer prices, the policies have two common features. The price of fertilizer is guaranteed throughout the country, irrespective of the different level of infrastructure development in each region. The price of fertilizer is similar on a per kg basis for all types distributed by the government. Table 7 shows fertilizer prices set by the government from 1969 to 1988. Except in 1988, where for the first time the price for TSP (Rp l70/kg) was different from
the price of urea (Rp 165/kg), all types of fertilizer have had common prices. In the international free market, each type of fertilizer has a different set of prices according to its cost of production. For example, the average price of ammonium sui fate in 1988 was US$1l0/t, while the average price of urea was US$145/t in the same year. Under these circumstances,both fertilizers were underpriced. Consequently, farmers may be encouraged to buy more fertilizer than they would buy at world market
Table 7. Price of fertilizer (Rp/kg) and unmilled rice (Rp/kg), 1969-88.
Unmilled Price Year Fertiliser rice ratio
1969 26 21 1.24 1970 26 21 1.24 1971 26 21 1.24 1972 26 21 1.24 1973 40 30 1.33 1974 60 42 1.43 1975 80 59 1.36 1976 70 69 1.01 1977 70 71 0.99 1978 70 75 0.93 1979 70 88 0.80 1980 70 105 0.67 1981 70 120 0.58 1982 90 135 0.67 1983 90 145 0.62 1984 100 167 0.60 1985 100 175 0.57 1986 125 175 0.71 1987 135 190 0.71 1988 165 250 0.66
Source: Ministry of Agriculture.
Table 8. Estimation of financial subsidy for fertilizer by factory 1988 - 89.
1YPe of fertilizer
Urea
AS
TSP
KC!
Factory
Pusri Kujang Kaltim
A.A.F. P.I.M.
Total
Export
Petro
Petm
Import
Total
Non-Total subsidy
supply price (t) (Rp/kg)
1221 526 192 575 013 154
1036043 249 119790 234 599838 234
3552210
601292 211
585492 260
I 218 634 365
514325 277
5 870661
Average exchange rate in 1988 was Rp. 1750/US$1.00
30
Farm price Total Subsidy level Subsidy (Billion ($US
(Rp/kg) (Rp/kg) rupiah) million) .---.
165 27 33 101 18915 165 II 6498 -3713 165 84 86925 49671 165 69 8266 4723 165 69 41 238 23565
163032 93 161
245 -34 -20506 -ll 718
165 95 55601 31 772
170 195 237 571 135 755
165 I12 57690 32 966
493389 281 937

prices. Table 7 also shows that the real price of fertilizer (in terms of price ratio) has been declining over time, indicating that the economic incentive to the farmers to use fertilizer has been increasing.
Subsidy on the price of fertilizer
The problem becomes more complicated if the domestic cost of producing fertilizer is higher than the marginal cost of fertilizer in other fertilizerexporting countries. In order to maintain common fertilizer prices throughout the region, the cost of subsidy will increase significantly in both financial and economic terms. Table 8 estimates the financial subsidy that was paid by the government in 1988. The higher the cost of domestic production compared to other countries, the less benefit the farmers get from the fertilizer price subsidy. In cases where the cost of domestic production for S is higher than world market prices, and as long as the price paid by the farmers is higher than the economic border price, society suffers two losses, namely, the cost of protecting the fertilizer industry, and the cost of over pricing fertilizer to the farmers. At the same mandatory fertilizer prices, only farmers located in very remote areas actually benefit from the subsidy, while those farmers who live in areas with relatively better infrastructure are actually being taxed.
31
References
B1air, G.1. and Till, A.R. (ed.). 1983. SuI fur in South-East Asian and South Pacific Agriculture. Research for Development Seminar, Ciawi, Indonesia, May 23-27, 1983. Sponsored by the Australian Development Assistance Bureau (ADAB) and the Sulphur Institute. Armidale, Australia, University of New England.
Ismunadji, M., B1air, G.1., Momuat, E and Sudjadi, M. 1983. Sulfur in the agriculture of Indonesia. In: Sulfur in South-East Asian and South Pacific Agriculture, B1air G.1. and Till A.R. (ed.). Armidale, Indonesia-UNE, 165-179.
Lancaster, 1.M. and Boyd, R. 1983. Regional production capacity to produce sulfatic fertilizers and potential sources of supply of S. In: Sulfur in South-East Asian and South Pacific Agriculture, B1air G.1. and Till A.R. (ed.). Armidale, Indonesia-UNE, 315-325.
Palmer, B., McCaskill, M., Friesen, D. and Hammond, L. 1983. Sulfur containing fertilizers, past, present, and future. In: B1air G.1. and Till A.R. (ed.). Sulfur in SouthEast Asian and South Pacific Agriculture, Armidale, Indonesia-UNE, 301-314
Tabor, S.R. 1988. Option for improving the economic efficiency of fertilizer use. Agricultural Sector Loan Project. World Bank Working Paper. Washington D.C. U.S.A.
The Impact of Fertilizer Subsidies and Rice Price Policy On Food Crop Production in Indonesia
Mark W. Rosegrant* and Faisal Kasryno**
Abstract Fertilizer subsidies have been one of the main instruments used by the government to stimulate
agricultural growth in general and rice production in particular. The government subsidy to fertilizers allowed a steady decrease in real prices of fertilizer and an increase in the paddy-urea price ratio. This highly favourable paddy-urea price ratio, together with the spread of modern varieties and large investments in irrigation, stimulated high rates of growth of fertilizer use and crop production. The rapid increase in fertilizer use has also caused an increase in financial costs of the subsidy and a re-examination of the costs and benefits of the subsidy.
The analysis in this paper examines the impact of a phase-out of fertilizer subsidies on the area, yield, production, demand, trade balances, farm revenue, consumer food expenditures and import costs for major food crops in Indonesia under alternative rice price policies. The alternative rice price policies are a fixed domestic price policy and a flexible domestic price policy which permits the domestic price to change with the world price of rice. The analysis utilises a supply-demand model for Indonesian food crops which can assess the medium to long-term impacts of alternative government policies on food price, input price, and irrigation investment policies.
The results show that the fertilizer subsidy, together with the rice price, remains a powerful policy instrument in attempting to balance the growth in domestic demand and supply of rice. Farmers are highly responsive to changes in the fertilizer price. A full phase-out of the fertilizer subsidy has a large negative impact on fertilizer use and production, particularly of rice, and net imports and import costs increase significantly. Depending on rice price strategies, removal of subsidies causes either consumers or producers to suffer significant welfare losses. With a constant domestic rice price, consumer welfare is maintained, but farm revenues decline sharply. If a flexible price poli,,), is followed, large increases in consumer food expenditures are only partially offset by increases in producer revenues.
The significant costs of the phase-out of the fertilizer industry subsidy suggest caution in moving toward full elimination of the subsidy. Continued increases in the world price of rice and significant continued and new successes in other areas of technology policy such as credit, past management, and efficiency of application of fertilizers, would facilitate a phased elimination of the subsidy.
GOVERNMENT policy has been a key factor in the rapid growth of the Indonesian agricultural sector over the past decade. From 1978 to 1985 the agricultural sector grew at the annual rate of 4.3070 in real terms, while the food crop sector grew at a
.. International Food Policy Research Institute, 1776 Massachusetts Avenue, N.w. Washington, D.C. 20036 U.S.A
"Centre for Agro Economic Research JI. A. Yani 70, Sogor, Indonesia
32
rate of 5.4% over the same period. The largest contribution has been from growth in rice production, which grew at a rate of over 7% per year from 1978 to 1985. The growth in rice production has been in significant part due to government policies, including investment in irrigation and research, extension programs for new technologies and inputs, stabilisation of rice prices, and favourable input pricing policies.
One of the key policy instruments has been the large subsidy on fertilizer prices relative to the world

Table 1. Prices of paddy and fertilizer, (Rp/kg), Indonesia, 1974-86.
Current farm Real farm Current Years price of price of price of Real price Paddy/Fertilizer
dried paddy!a) dried paddy(b) fertilizer of fertilizer(b) price ratio (1977) (1977)
Rp/kg
1974 41.80 59.80 40.00 85.83 1.05 1975 58.50 70.23 60.00 96.03 0.98 1976 68.50 71.95 80.00 73.52 0.86 1977 71.00 71.00 70.00 70.00 1.01 1978 75.00 70.16 70.00 65.48 1.07 1979 85.00/95.00 74.96/83.77 70.00 61.73 1.21/1.36 1980 105.00 73.63 70.00 49.09 1.50 1981 120.00 74.03 70.00 43.18 I. 71 1982 135.00 76.06 70.00 50.70 1.93 1983 145.00 73.05 90.00 45.34 1.61 1984 165.00 75.34 90.00 45.50 1.83 1985 175.00 76.19 100.00 43.54 1.75 1986 175.00 70.15 125.00 50.16 1.40
Source: Central Bureau of Statistics (a) Government support price for paddy at KUD (cooperative) level (14070 moisture content). (b) Prices are deflated by the Indonesian non-food consumer price index.
price or economic border price of fertilizer. This subsidy has supported a highly favourable and generally increasing paddy price to fertilizer price ratio. The paddy-fertilizer price ratio nearly doubled between 1974-76 and 1982-84. Only since 1984 has there been a significant decline in this ratio as both paddy and fertilizer prices were adjusted due to the accumulation of large stocks of rice.
Although the fertilizer subsidy has been an important incentive for rice production growth, a number of factors have converged to stimulate a reassessment of fertilizer subsidy policy by the government of Indonesia. These factors include the success of the rice production program in eliminating imports, which appears to allow a cutback in incentives to rice production; the historically low real world price of rice and other food commodities; shortfalls in government revenues due to oil price declines; and the increasingly high fiscal cost of fertilizer subsidies. A particular focus of this reassessment is the evaluation of the costs and benefits of reducing or eliminating the subsidies to fertilizer.
In this paper, we examine the impact of the elimination of fertilizer subsidies on the area, yield, production, demand, trade balances, farm revenue, consumer food expenditures, and import costs for major food crops in Indonesia under different rice price policies. The analysis utilises an Indonesian food crop supply-demand model which permits assessment of medium-to long-term impacts of alternative government food and input price polices, trade policies, and irrigation investment policies.
33
The paper is organised as follows: fertilizer subsidy and rice price policy in Indonesia are briefly discussed; the structure and operation of the food crop supply-demand model are summarised; the impact of a five-year phase-out of the fertilizer subsidy under alternative rice price policies is examined using the model; and policy implications are summarised.
Table 2. Fertilizer consumption on food crops ('000t) in Indonesia, 1969-87.
Year
1969 1970 1971 1972 1973 1974 1975 1976 1977 1978 1979 1980 1981 1982 1983 1984 1985 1986 1987
Fertilizer consumption on food crops
433.6 439.4 507.4 558.3 832.1 875.4 920.6 914.1
1211.3 1 340.7 1 541.7 2284.6 2 811.9 3 316.5 3070.6 3508.9 3900.5 3 717.6 4050.3
Source: Central Bureau of Statistics.

Fertilizer Subsidy Policy
Fertilizer subsidies have been one of the main instruments used by the government to stimulate growth in agricultural production in general and rice production in particular. Table 1 shows the government farm support price for paddy and farm price of fertilizer, 1974-86. The government subsidy to fertilizers allowed a steady decrease in real prices of fertilizer from 1970 to 1984. With a nearly stable real floor price of paddy, the paddy-fertilizer price ratio increased from about 1.00 in the early to mid-1970s to nearly 2.00 in the early 1980s. This highly favourable paddy-fertilizer price ratio, together with the spread of modern varieties and large investments in irrigation, stimulated high rates of growth in fertilizer use on food crops, as shown in Table 2. Fertilizer use on food crops grew at a rate of 140/0 from 1969 to 1977 and 13% from 1977 to 1987.
Table 3 shows the pattern of subsidies to urea and triple superphosphate (TSP) fertilizer relative to economic border prices during the period 1970-86. There has been a modest decline in the rate of fertilizer subsidy in the past three years, partly because of the increase in the domestic price of fertilizers, but largely due to the declining border price of fertilizer. In 1986, the rates of subsidy on urea and TSP were at 33% and 55%, respectively, relative to border prices adjusted to the farm level.
In addition to setting farm level fertilizer prices, the government is heavily involved in the production, trade, and distribution of fertilizer. All domestic fertilizer is produced by government-owned fertilizer plants, and imports and exports of fertilizer are controlled by the government. Domestic distribution is monopolised by the government to the wholesale level. From the wholesale level to the farm level, generally competitive distribution of fertilizer is carried out by farmers' cooperative (KUD) and smallscale traders.
Some Indonesian fertilizer plants are highly competitive internationally and export urea profitably. Others, however, are relatively high-cost producers. The domestic fertilizer distribution system is also relatively inefficient, burdened by a number of costly regulations and cumbersome distribution channels. As a result, substantial subsidies are also paid for the production and distribution of fertilizer so that the farm price can be maintained.
Despite the decline in the rates of subsidy in recent years, the fiscal burden of the subsidy has become increasingly large with the rapid expansion of fertilizer use. Table 4 shows the estimated cost of the fertilizer subsidy, 1984-86, including the total cost of the subsidy, the portion of the subsidy accruing to farmers, and the residual, which represents the
34
subsidy to fertilizer production and distribution. In 1986, the subsidy to farmers was about Rp 369 billion, or nearly one-quarter of total government subsidies to agricultural production. An additional Rp 272 billion subsidy was paid to the domestic production and distribution of fertilizer.
Rice Price Policy
The Indonesian government has attempted to meet a number of sometimes conflicting objectives through implementation of its rice price policy. Among the major objectives have been maintenance of a relatively low and stable consumer price for rice; maintenance of incentives for rapid growth in domestic rice production; growth in farm income; and reduction in foreign exchange costs of rice imports.
The main instruments of government rice policy have been a ceiling price for consumers, a farm level floor price, and eontrol of international trade in rice. The Bureau of Logistics has utilised procurement of rice to defend the floor price, and has been very successful since the mid-1970s in maintaining the announced price. Only in 1985, following two large harvests in 1984 and 1985 and a large build-up in stocks, did the farm price drop below the announced floor price. As noted above, the floor price has been virtually constant in real terms sinee the mid-1970s.
The ceiling price has been maintained by injections of supplies into urban markets from domestic procurement, imports, and stocks. The ceiling price of rice has shown a slow decline in real terms since the 1970s, similar to that of the floor price. The ceiling price (and actual wholesale prices) has been much less variable than world market prices, indicating that the Bureau of Logistics has generally been successful in insulating domestic prices from short-term fluctuations in world prices, although at a high cost in purchasing, holding, and distributing riee.
The analysis in this paper focuses on the interaction of rice price and fertilizer subsidy policy in affecting crop production, demand, and trade balances. The analysis considers not only domestic prices but also the relationship between domestic and world prices of rice. Indonesian government price policy has generally isolated the domestic markets from shortrun world price fluctuations, while attempting to follow long-run trends in world prices. Government policies which affect these prices are complicated by Indonesia's major role in the world rice market. The size of Indonesia's imports (or exports) affects world rice prices. Policies that would lead to an increase in Indonesia's rice imports will also boost the world price of rice. The analysis below assesses the impact of fixed vs flexible domestic rice price policy in

Table 3. Average subsidies for fertilizer by type, Indonesia, 1970-86.
CIF Marketing cost Adjusted CIF Farmer prices Implicit tariff Exchange
Year Urea(a) TSP(b) Urea TSP Urea TSP Urea TSP Urea TSP rate
$US/t Rp/t 070 Rp/US$
1970 69.40 64.38 8733 6572 37823 33677 26600 26600 -28.7 -20.2 420 1971 68.39 65.89 8855 7 146 37541 34651 26600 26600 -28.1 -22.4 420 1972 80.44 87.46 9609 7593 43340 44273 26600 26600 -37.9 -39.5 420 1973 121.57 127.49 13 293 10510 64300 64 002 40000 40000 -37.3 -37.2 420 1974 328.61 303.52 16376 14071 154391 141 550 40000 40 000 -74.0 -71.7 420 1975 261.08 266.09 19010 15247 128663 127006 60000 60 000 -53.2 -52.7 420 1976 141.18 120.62 22260 18008 81556 68788 80000 80000 -0.9 17.1 420 1977 157.32 129.21 24308 19847 90380 74116 70000 70000 -21.9 -5.4 420 1978 172.36 125.20 25 889 21 188 133 615 99438 70000 70000 -47.3 -29.3 632 1979 215.04 194.27 34428 28331 168 829 149 750 70000 70000 -58.3 -53.0 630 1980 256.09 224.00 38783 38652 200 635 180 220 90000 90000 -54.9 -49.8 632 1981 255.88 201.72 43577 43430 211 177 175 553 90000 90000 -57.! -48.3 655 1982 223.91 177.31 31 605 47725 187 670 171 312 90 000 90000 -52.0 -55.7 697 1983 133.24 238.07 35511 53623 168 484 291 222 100 000 100 000 -40.6 -65.5 998 1984 142.16 200.60 33705 49744 186 527 265 389 100 000 lOO 000 -46.3 -62.2 1075 1985 116.86 140.25 43107 51465 174691 209 387 100 000 100 000 -42.8 -52.1 1126 1986 86.70 133.00 43083 58355 185 617 278 543 125 000 125 000 -32.7 -54.6 1644
(a)CIF urea derived from FOB Western Europe + freight rate + insurance cost for 1970-81. For 1982-86 FOB Indonesia was used for urea. (b)CIF TSP derived from FOB U.S.A. + freight rate + insurance cost. Source: Transport and distribution data from PUSRI.
response to changes in net imports and world prices induced by fertilizer price changes.
Supply-Demand Model of the Indonesian Food Crop Sector
In this section, the Indonesian food crop supply-demand model is briefly presented. A detailed description of the structure and operation of the model is given by Rosegrant et al. (1987).
Supply
Total production of five food crops, rice, corn, cassava, soybeans, and sugar, is determined by fertilizer demand functions, yield response functions, and area response functions estimated for Java and
Table 4. Fiscal cost of fertilizer subsidies in Indonesia, 1984-86 (billion Rp).
Subsidy to fertilizer
Total Subsidy to production and Year subsidy farmer distribution
1984 546.2 396.2 150.0 1985 536.3 349.6 186.7 1986 641.2 369.0 272.3
Source: Estimated from data from the Ministry of Finance and Ministry of Agriculture.
35
off-Java. Fertilizer demand for each crop is estimated as a function of expected crop price; fertilizer price; technology shift variables, such as percentage use of modern varieties, percentage of area irrigated, and percentage of area under intensification programs; and trend, which represents the effect of unmeasurable technological shift variables. Crop yields are estimated as a function of fertilizer use, technology shift variables, and lagged yield. Area harvested is estimated as a function of expected crop revenues, expected revenues of competing crops, and lagged area.
Demand
Per capita demand for six food crops (including wheat, which is not produced domestically) is estimated as a function of per capita consumption expenditures, the 'own price' of the crops and the prices of complementary and substitute food commodities. Demand functions are estimated for different income classes and regions. Demand functions for corn and soybean for feed, and a demand function for home consumption of corn production are also specified.
Government policy The impact of government pricing and investment policies are assessed by specifying the level of investment in irrigation, market intervention policies

in support of food crop prices, and government fertilizer subsidies. Under any sped fied set of policies, area, yield, production, consumption, supply-demand balances, farm revenue, food expenditures, and import expenditures can be projected to the year 2000.
The model can be simulated by fixing import levels and generating market-clearing domestic prices, or by fixing domestic prices and generating marketclearing import levels. In determining market-clearing prices or imports, Indonesia is treated in the model as a large country in the world rice trade. The world rice price is therefore a function of net Indonesian imports, with the world rice price increasing as imports increase, as noted above. It is assumed that, from the equilibrium world price prevailing at selfsufficiency, each incremental million tonnes of Indonesian imports raises world rice prices by $50/t (Timmer 1986). Fertilizer subsidy policy can therefore affect world prices through its impact on rice production and imports.
Data and estimation procedures Provincial area, yield, technology, and price data from the Central Bureau of Statistics for the years 1969-85 were aggregated on an eight-region basis, including East, Central, and West Java, North Sumatera, other Sumatera, South Sulawesi, other Sulawesi, and other Indonesia. Provincial fertilizer use for total food crops was taken from PUSRI. Allocation of total fertilizer use to individual crops was based on the annual Survey of Agriculture.
The time series data for the three regions on Java were then pooled, as were the data for the five regions off-Java. This procedure permitted estimation of separate supply response relationships on- and offJava, while providing for an adequate number of observations for estimation of the functions. Regional dummy variables were included in the area and yield functions, and the functions were estimated using ordinary least squares.
A number of studies of food demand parameters in Indonesia have been completed. This study therefore does not represent a fully-fledged attempt to econometrically estimate a complete set of demand parameters. Instead, the model relies largely on a synthesis of existing studies to develop a set of ownand cross-price and income elasticities for rice, corn, soybean, cassava, sugar and wheat.
The elasticities of demand for rice are based on econometric estimates using the 1981 SUSENAS (National Social Economy Survey) data. These estimates of rice demand parameters from crosssectional data represent long-run elasticities. The estimated elasticities for rice were thus adjusted downward to obtain short-run elasticities appropriate for use in the model.
36
For other crops, already completed demand studies were reviewed (see Teklu and Johnson 1986 and Dixon 1982 for useful reviews). The relationships between rice demand parameters and non-rice demand parameters from these studies were then used to make proportional adjustments from the rice demand parameters to develop estimates of the demand parameters for the other crops. Demand elasticities for all crops are disaggregated by region and by income class.
In the following sections of this paper, the base simulation assumptions and results are presented, and the impact of fertilizer subsidy policy under alternative price policy regimes is examined.
Base Assumptions for the Model
Base year values for area, yield, production and consumption are 1984-86 averages for rice, corn, cassava, and sugar, and the average of 1985-86 values for soybeans. Year 1984 was dropped from the base year average for soybeans because of the upward shift in soybean area since then due to the government soy bean program. The base run of the model assumes constant real 1986 crop prices, fertilizer prices, and wage rates. Growth rates in area under intensification and modern rice varieties are equal to 1982-85 rates of growth. Area harvested under irrigation for rice is assumed to increase by 8000 ha per year in each of the Java regions and from 6200 to 13 200 ha per year in the off-Java regions depending on the existing irrigation base and future potential. The total is 80 000 ha of new irrigated area harvested per year. This investment level is comparable to the program under the PELlTA IV Five-Year Plan, 1984-88.
Population growth rates in the base year by region and rural-urban breakdown are based on 1971-80 growth rates computed from the censuses of those years, adjusted downward to account for reported slowing of population growth rates since 1980. The population growth rate in each class is assumed to decline by 0.0004070 per year. This distribution of class-specific population growth rates and rate of decline generates a total population growth of 2.04% in 1986, declining to 1.85% in 2000.
The base run assumes an even distribution of per capita income and expenditures growth across regions and expenditure class (per capita expenditures are assumed to grow at the same rate as per capita income). The rate of growth in per capita income is assumed to be zero for 1986 and 1987, reflecting economic difficulties, and 2.0% per year thereafter. The aggregate per capita income growth rate is higher than the individual class-specific growth rates, because the population growth rate is higher in urban areas, with proportionately more medium-to high-

income persons, than in rural areas. For the period I985~2000. these assumptions yield an aggregate per capita income growth rate of 2.1 070.
Impact of Fertilizer and Rice Price Policy: Results from Simulations
Four combinations of fertilizer and rice price policy are analysed here using the Indonesian food crop supply-demand model. The first scenario assumes that constant fertilizer prices are maintained (Le., there is no reduction of the fertilizer subsidy) and that domestic rice prices are also held fixed at constant base year levels. The second scenario assumes a phase-out of the fertilizer subsidy while maintaining fixed domestic rice prices. The subsidy phase-out is simulated by an increase in the weighted price of urea and TSP from Rp l25/kg to Rp 21O/kg between 1986 and 1991. This scenario implies that the government will import enough rice to meet demand at a constant domestic wholesale rice price, despite reductions in production due to the phaseout of the fertilizer subsidy. With this policy, the government bears the burden of the increasing world price of rice due to increased Indonesian imports of rice. Self-sufficiency equilibrium world rice price is set at 1995 projected levels.
In the third scenario, the price of fertilizer is held constant, but the government maintains a policy of flexible domestic rice prices. In this scenario it is assumed that the government sets the domestic wholesale rice price equal to the world rice price, and allows it to float with the world price as the world price increases in response to increased Indonesian imports. The farm price of paddy is assumed to respond to increased wholesale prices, with the government adjusting the floor price of paddy and a constant percentage marketing margin being maintained between farm and wholesale prices. The final scenario assumes phase-out of the fertilizer subsidy combined with flexible domestic rice prices.
Projected results from the four scenarios for 1995 and 2000 are presented in lable 5 (with fixed domestic rice prices) and Table 6 (with flexible domestic rice prices). The results highlighted include rice prices; area, yield, production, and imports of rice and the aggregate of other crops (corn, cassava, soybeans, sugar, and wheat); utilisation of fertilizer for rice and all crops; cost of food imports; net farm revenue; and consumer food expenditures.
The results in Thble 5 indicate that the complete phase-out of the fertilizer subsidy, combined with maintenance of constant domestic rice prices, has a substantial negative impact on rice production, with a smaller effect on production of other food crops,
Table 5. Summary of key results from scenarios with alternative fertilizer pricing policies and fixed domestic rice price, Indonesia, projections for 1995 and 2000.
Constant fertilizer Phase-out of fertilizer price with fixed subsidy with fixed
domestic rice price domestic rice price
Year 1995 2000 1995 2000
Rice Domestic wholesale price (Rp/kg) 348 348 348 348 Paddy area ('000 ha) 10229 10 545 9925 10 185 Paddy yield (t/ha) 4.66 4.99 4.30 4.60 Paddy production ('OOO t) 47657 52583 42675 46 898 Imports ('000 t) 91 377 3 136 3854
Other crops Area (index') 100.0 103.8 100.4 104.2 Yield (index') 100.0 111.5 97.2 107.1 Production (index') 100.0 115.6 98.4 111.5 Imports ('000 t) 2693 2528 3208 3490
Fertilizer use Subtotal for rice ('000 t) 3775 4007 2670 2831 Per hectare use for rice (kg/ha) 369 380 269 278 Total use, food crops ('000 t) 4404 4664 3 128 3343
Cost of food imports (billion Rp) 1 157 1 521 3 126 4 107 Net farm revenue (billion Rp) 9874 11 150 8755 9829 Consumer food expenditures
(billion Rp) 14 146 15835 14 137 15821 ~~~ .....
a Index = 100.0 for 1995 values for scenario with constant fertilizer price with fixed rice price.
37

Table 5. Summary of key results from scenarios with alternative fertilizer pricing policies and fixed domestic rice price, Indonesia, projections for 1995 and 2000.
Constant fertilizer Phase-out of fertilizer price with fixed subsidy with fixed
domestic rice price domestic rice price
Year 1995 2000 1995 2000
Rice Domestic wholesale price (Rp/kg) 351 354 405 408 Paddy area ('000 ha) 10247 10 578 10 393 10777 Paddy yield (t/ha) 4.66 4.99 4.32 4.64 Paddy production ('000 t) 47713 52806 44890 49979 Imports ('000 t) -4 109 579 727
Other crops Area (indexa) 99.9 103.4 96.9 9S.6 Yield (index') 100.8 111.6 98.5 10S.7 Production (index') 100.6 115.3 95.4 107.2 Imports ('000 t) 2733 2640 4805 5492
Fertilizer use Subtotal for rice ('000 t) 3771 4041 2868 3 125 Per hectare use for rice (kg/ha) 368 382 276 290 Total use, food crops ('000 t) 4345 4699 3299 3602
Cost of food imports (billion Rp) 1 129 1 436 1 579 1 993 Net farm revenue (billion Rp) 9946 11 331 10 311 11 510 Consumer food expenditures
(billion Rp) 14203 15978 15326 17052
a Index = 100.0 for 1995 values for scenario with constant fertilizer price with fixed rice price.
compared with the constant fertilizer price scenario. The phase-out of the fertilizer subsidy (which represents a 68010 increase in the price of fertilizer) is projected to induce a 3% decline in rice area by 1995 and nearly an 8% decline in yield, giving about a 10.5010 decline in total production, or about 5 million t of paddy. Production declines by about 5.7 million t (11 %) in 2000. As a result of this decline in production, projected imports of rice increase to 3.1 million t in 1995 and 3.85 million t in 2000.
Removal of the fertilizer subsidy causes a decline in production of other crops in total of about 1.6% in 1995 and 3.5% in 2000. The bulk of the loss in production on other crops is in corn. For the other crops, production is less responsive to fertilizer, and demand for fertilizer is less responsive to changes in the price of fertilizer, so the impact on crop production is less than for rice and corn. Imports of non-rice crops increases by nearly 1 million t in 2000 compared to the constant fertilizer price scenario.
Full removal of the fertilizer subsidy has a large impact on the use of fertilizer, particularly on rice. As shown in Table 5, projected per hectare use of fertilizer on rice in 2000 declines by about 27%, and total use on rice by 29%. latal fertilizer use for all food crops declines by 28%.
Table 5 also shows that removal of the fertilizer subsidy while maintaining constant domestic rice
38
prices has a dramatic impact on net farm revenue and the net cost of import of the six commodities. Net farm revenue declines by over Rp 1000 billion, or about 11% in 1995, relative to the base run. This reduction in revenue is due to the direct increase in fertilizer price; reductions in crop yields; a decline in total cropped area of these five commodities; and a relative shift out of a higher net revenue-producing crop (rice) into other crops. Given the importance of the food crop sector in the economy, the decline in farm income resulting from the phase-out of fertilizer subsidy could have a significant negative impact on the economy as a whole. Food consumption expenditures are virtually the same since commodity prices are maintained. There are slight changes in expenditures because of changes in home consumption of corn.
The net import bill for food crops nearly triples in 1995 compared to the base projections. In order to maintain constant domestic rice prices, large rice imports are required (3.1 million t in 1995). These large imports induce an increase in the world price of rice from the self-sufficiency equilibrium level of US$212/t to US$369/t, making the large import quantity even more expensive. Protecting consumers against the rise in the world price of rice due to removal of the fertilizer subsidy is very costly in terms of foreign exchange and farm revenue.

Fertilizer imports saved, or exports generated, from the reduction in domestic fertilizer use due to elimination of the fertilizer subsidy could provide a partial offset to the increased cost of rice imports. The reduction in total fertilizer use described above would imply a drop in domestic urea consumption of about 1.1 million t, given the current composition of fertilizer use. At the 1986 FOB price of $US87/t, however, only two fertilizer plants in Indonesia could compete in world urea markets. With exports of 1.5 million t currently, an additional 1 million t would be beyond the capacity of the efficient plants. Subsidies would be required to export the production from less efficient plants. Nevertheless, subsidised exports of urea could generate US$96 million or Rp 157 million in export earnings. An additional Rp 65 billion could be saved from elimination of imports of TSP and other fertilizers. Even this optimistic scenario could generate only Rp 220 billion of mostly subsidised exports. This amount does not significantly offset increased food import costs.
Table 6 summarises the results for the fertilizer price scenarios combined with flexible domestic rice prices, so that the government does not protect consumers relative to the world price. Instead, the domestic wholesale price of rice is allowed to move with the world price, and the farm price moves with the wholesale price in order to maintain a constant marketing margin.
A policy of maintaining flexible rice prices has a number of effects. As the fertilizer price increases, domestic rice production falls, which leads to increased imports of rice. Increased imports push up world prices, and domestic wholesale and farm prices rise with the world price. This rise in domestic prices reduces demand and stimulates production, dampening the growth in imports and prices. With some year-to-year variability due to lags in production and price adjustments, and to
technological change over time, a new equilibrium level of world prices and domestic prices, supply and demand, and import demand is reached at the unsubsidised fertilizer price.
Adoption of a flexible rice price policy has very little impact when fertilizer prices are maintained at constant levels, because there are only small rice imports under these scenarios, so the rice price does not change much. Thus the results for the constant fertilizer price scenarios in Tables 5 and 6 are almost the same.
However, a flexible rice price policy significantly affects the impact of the phase-out of the fertilizer subsidy. In this scenario (Table 6) the removal of the fertilizer subsidy boosts wholesale rice prices in 1995 to Rp 405/kg and in 2000 to Rp 408/kg, about 170/0 above the base year price of Rp 348/kg. The world price is projected to increase to $248/t in 2000, also
39
17% above the long-run self-sufficiency equilibrium price of $212/1. Equivalent percentage increases are passed on to farm level prices.
Thble 6 shows the production effects of the fertilizer subsidy elimination coupled with increased rice prices. Rice yields still drop by about 7.3 % in 1995 relative to the base case, because fertilizer use declines due to the large increase in fertilizer price, which is only partially offset by a higher rice price. However, the increased rice price improves the net revenue from rice sufficiently to induce an increase in area harvested despite higher fertilizer prices. Rice area harvested increases by about 1.5% in 1995 relative to the base simulation. The total loss in production due to the fertilizer subsidy phase-out is therefore just under 6% when domestic rice prices are permitted to rise with the world prices. This compares with the 11 070 reduction in rice production from subsidy elimination when rice prices are held constant.
Other crop production, however, declines even more than under the constant rice price assumption because a significant amount of other crop area on Java shifts to rice as the rice price increases. Other crop area declines by 3% in 1995 and 5% in 2000 relative to the constant fertilizer price scenarios, and production drops by over 7% in 2000.
The flexible rice price policy somewhat lessens the decline in use of fertilizer from the phase-out of the fertilizer subsidy. However, aggregate fertilizer use still declines by about 23Ofo for both rice and total food crops with a removal of the fertilizer subsidy.
Use of a flexible rice price policy sharply reduces the impact of fertilizer subsidy removal on rice imports. Instead of the 3.1-3.85 million t import requirement reported in Table 5, the removal of fertilizer subsidies would result in 579 000 t of imports in 1995 and 727 000 tin 2000. Thc reduction in rice imports, compared to the fertilizer subsidy phase-out with constant domestic prices, is due to increased production and reduced demand due to higher prices. Total food demand for rice declines by nearly 1.2 million t in 1995 due to the direct impact of increased rice prices, and the induced decline in real income. This represents a decline in per capita consumption of rice from 143.3 to 137.4 kg in 1995, a 4% decline.
The improvement in the import position compared with the fertilizer phase-out with constant domestic rice price case is partially offset by increased import requirements (or reduced exports) of the other crops. For example, combined net imports of these crops increase from 3.5 million t in 2000 for the fertilizer subsidy phase-out with constant rice prices (Table 5) to 5.5 million t with flexible rice prices (Table 6). Increased imports of these crops are due to a drop in production due to area and yield reductions, and

the increase in consumption as consumers substitute other commodities for rice.
Nevertheless, the net effect of a flexible domestic rice price on the import bill is highly favourable compared with the removal of the subsidy while maintaining constant rice prices. The net import bill in 2000 for the six crops is reduced by nearly half from Rp 3100 billion to about Rp 1600 billion, compared with the case of fertilizer subsidy phaseout with constant domestic rice price. The relatively lower world price of rice and reduced rice imports more than compensate for increased imports of the other crops. Use of flexible domestic rice prices thus considerably dampens the increase in import requirements induced by the elimination of the fertilizer subsidy.
Although the increase in cost of imports due to elimination of fertilizer subsidies is reduced by permitting flexible domestic rice prices, the import bill is still significantly larger compared with the base scenario with retention of the fertilizer subsidy. In 1995, the import bill is Rp 422 billion (36070) higher than with retention of the fertilizer subsidy. Reduced import costs for TSP of about Rp 48 billion could partially offset these costs, and increased exports of urea could generate about Rp lIO billion, but probably only with government subsidies.
The other major impact of flexible domestic prices is a shift of the burden of removal of the fertilizer subsidy from farmers (or farmers as producers) to consumers. Net farm revenue with flexible rice prices and subsidy removal is actually higher than in the base case with constant fertilizer and rice prices. Net farm revenue in ]995 is Rp 437 billion (4070) greater than in the base simulation. The increase in farm price of rice more than compensates for increased fertilizer prices.
However, consumption expenditures for food increase sharply, by about Rp 1200 billion or 8070 in 1995. Because of the importance of rice in the diet, the increase in domestic prices significantly boosts consumer food expenditures.
Conclusions and Policy Implications
Analysis of the impact of fertilizer subsidies in Indonesia is complicated by the important role of Indonesia in the world rice market. Because Indonesia is a major actor in this market, the world rice price cannot be taken as a constant in evaluating the impact of a phase-out of the fertilizer subsidy. The change of world prices in response to fertilizer price increases, and how government price policy adjusts to the world price, together determine domestic production and demand response, and apportion the costs of fertilizer price increases among producers, consumers, and the government.
40
The results presented show that it is inadvisable for the government to eliminate the fertilizer subsidy in combination with a policy of maintaining constant domestic rice prices. The annual costs of the fertilizer subsidy to farmers for the crops analysed here, estimated from the base run, would be Rp 374 billion in 1995. If the subsidy to other crops and the fertilizer production and distribution subsidies went up by a like percentage, the total fertilizer subsidy would be about Rp 780 billion in 1995. The removal of this subsidy would, however, cost Rp 1120 billion in farm revenue in 1995.
In addition, the government would need to import 3.1 million t of rice in 1995 to maintain constant domestic rice prices. This level of imports is projected to force up the long-run world price from US$212/t to US$369/t, so the government would be required to pay a subsidy of $157 It on each tonne of rice imported. This subsidy to consumers would cost the government US$492 million, or Rp 809 billion, larger than the savings from phasing out the fertilizer subsidy.
Protecting domestic consumers against increases in the world price of rice following elimination of the fertilizer subsidy would thus be prohibitively expensive. Alternatively, the government can permit flexible domestic rice prices. This policy slows the increase in world prices resulting from subsidy reduction by dampening domestic demand (and therefore import demand) and stimulating domestic production to partially offset the effects of the subsidy elimination.
Although a flexible price policy lessens the production loss and dampens the rice import, and net import cost increases, these remain significant. Flexible domestic prices protect the income of farmers following removal of subsidies, but shift the burden to consumers. The costs could be distributed more evenly between producers and consumers if the government allowed only partial adjustment of domestic prices to increase in world prices. However, this would require government-subsidised rice imports, the cost of which could more than offset the savings from elimination of the fertilizer subsidy.
The large negative impacts of the fertilizer subsidy phase-out on production, prices, trade balances, and either farmer or consumer welfare, depending on rice price policy, suggest that reduction of the fertilizer subsidy should be a gradual process. The cost of adjustment to a gradual phase-out of the fertilizer subsidy would be significantly eased if world rice prices continue to increase from the historic lows of the mid-1980s, and if increased progress can be made in other areas of production policy and technological development, including improvement in the quality of irrigation; expansion of the KUPEDES (village co-operative unit) credit program which extends

institutional credit to farmers at un subsidised rates; dissemination of improved technology for corn, soybean, and cassava; improved pest management practices; higher efficiency in application of fertilizer; and improved fertilizer production and distribution systems. Immediate efforts sl:Iould be made to improve the efficiency of domestic production and distribution of fertilizer. Improvements in these areas could save about 40OJo of total subsidy costs.
Significant continued and new successes in these areas of technology policy could increase rates of productivity gain rapidly enough so that removal of the fertilizer subsidy would save budgetary resources while maintaining balanced growth in demand and supply. As progress is made in technology policy, the government should continue pragmatic monitoring and assessment of the impact of the fertilizer price on production, consumption, and consumer and producer welfare, and adjust the fertilizer price based on this assessment.
41
References
Dixon, lA. 1982. Food consumption parameters and related demand parameters in Indonesia: A review of available evidence. International Food Policy Research Institute, Washington, D.C.
Rosegrant, M.W. Kasryno, F., Gonzales, L.A., Rosahan, e. and Saefudin, Y. 1987. Price and investment policies in the Indonesian food crop sector. Report submitted to the Asian Development Bank. International Food Policy Research Institute, Washington D.e. and Centre for AgroEconomic Research, Indonesia.
Teklu, T. and Johnson, S. 1986. Preliminary analysis of demand parameters for Indonesia. Iowa State University, Ames (mimeo).
Timmer, C.P. 1986. Food price policy in Indonesia. Cambridge, Massachusetts, Harvard Institute of International Development (mimeo).

The Fertilizer Subsidy and Fertilizer Use in Indonesia
Dennis T. O'Brien*
Abstract Subsidising the price of fertilizer has been an integral part of the Indonesian Government's
policy to encourage increased crop production. The primary objective of pricing policies is to increase crop production by encouraging increased use of inputs such as fertilizer. Increased fertilizer consumption is not the objective, but is a means to the objective.
The price of urea remained steady at Rp. 70/kg through the late 1970s and early 1980s. Although the urea price has almost doubled since 1982, the paddy-urea price ratio has fallen only slightly on its 1972 level due to the increases in the paddy floor price. The rising per unit cost of the fertilizer subsidy, along with increases in fertilizer use, resulted in an almost three-fold increase between 1980-81 and 1986-87 in the budget cost of the subsidy scheme. Total expenditure on fertilizer subsidy reached Rp. 699.6 billion in 1986-87.
Studies indicate that fertilizer consumption and food production would be maintained if the subsidy was reduced and at the same time rice prices increased. If the subsidy phase-out occurred at constant rice price, rice production could decline to 100/0.
SUBSIDISING the price of fertilizer has been an integral part of the Indonesian Government's policy to encourage increased crop production. Fertilizer and crop pricing policies, along with Governmentsponsored rural credit schemes, extension programs and introduction of improved crop varieties, as well as infrastructure development. have all contributed to the very significant increases in food crop production that have occurred in Indonesia since the mid-1970s (Thble 1). These efforts have made the nation self-sufficient in rice and major food crops, and have also had significant effects on rural income levels.
Food crop production has expanded due to increases in both the areas planted and in crop yields. Infrastructure investment into expansion and improvement of the nation's irrigation systems as well as into the opening-up of new areas to food crop production in the outer islands has contributed much to the expansion in area planted to food crops (Thble 2). Input (fertilizers and other agrochemicals) and
* Department of Economics, The University of Wollongong, P 0 Box 1144, Wollongong NSW 2500 AUSTRALIA
42
crop pricing policies, as well as the introduction of improved crop varieties have also had significant impacts on areas planted to food crops, but have been particularly important in their effects on crop yields (Table 3).
It is the impact of pricing policies. and in particular fertilizer pricing policies, that are the focus of this paper. Crop yield depends, among other things, on the rate of fertilizer application. The rate of fertilizer application is affected by the responsiveness of the crop to applied fertilizer, the levels of other management factors (land preparation, irrigation, weed and pest management, etc.). as well as the price of fertilizer relative to the price of the crop (Fig. 1).
The primary objective of pricing policies is to increase crop production by encouraging increased use of inputs such as fertilizer. Increased fertilizer consumption is not the objective of pricing policies, although increased consumption does have important effects on the fertilizer and resource sectors. Increased fertilizer consumption is a means to achieving the primary objective of increased crop production, and to obtaining the benefits associated with that. The impacts of pricing policies on food crop production were outlined in another paper (Rosegrant, these Proceedings). In this paper, the effects of fertilizer
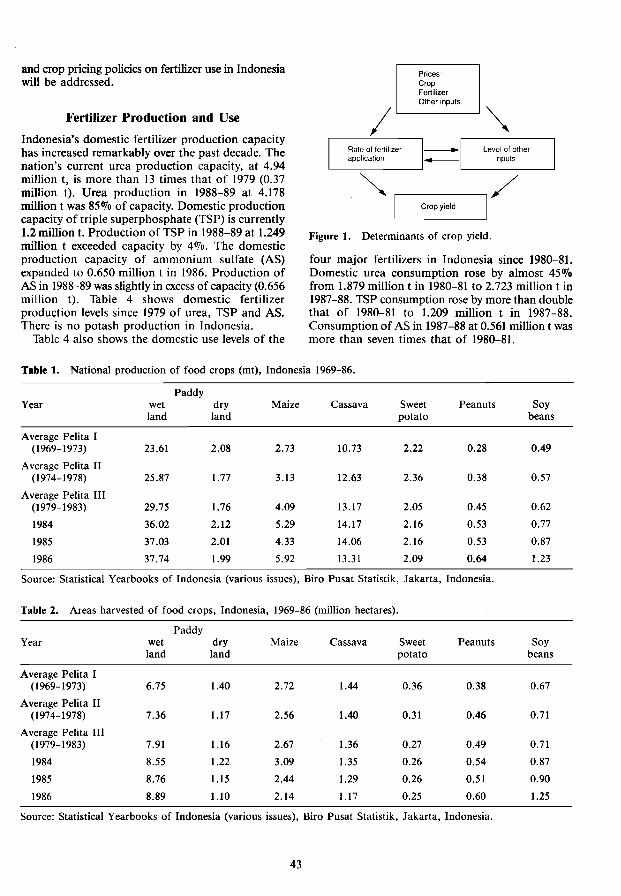
and crop pricing policies on fertilizer use in Indonesia will be addressed.
Fertilizer Production and Use
Indonesia's domestic fertilizer production capacity has increased remarkably over the past decade. The nation's current urea production capacity, at 4.94 million t, is more than 13 times that of 1979 (0.37 million t). Urea production in 1988-89 at 4.178 million t was 85010 of capacity. Domestic production capacity of triple superphosphate (TSP) is currently 1.2 million 1. Production of TSP in 1988-89 at 1.249 million t exceeded capacity by 4%. The domestic production capacity of ammonium sulfate (AS) expanded to 0.650 million t in 1986. Production of AS in 1988-89 was slightly in excess of capacity (0.656 million t). Table 4 shows domestic fertilizer production levels since 1979 of urea, TSP and AS. There is no potash production in Indonesia.
Table 4 also shows the domestic use levels of the
Prices: Crop Fertilizer Other inputs
~ / Rate of fertilizer - Level of other application - inputs
~ 1/ I
Crop yield
Figure 1. Determinants of crop yield.
four major fertilizers in Indonesia since 1980-81. Domestic urea consumption rose by almost 45% from 1.879 million t in 1980-81 to 2.723 million t in 1987-88. TSP consumption rose by more than double that of 1980-81 to 1.209 million t in 1987-88. Consumption of AS in 1987-88 at 0.561 million t was more than seven times that of 1980-81.
Table 1. National production of food crops (mt), Indonesia 1969-86.
Paddy Year wet dry Maize Cassava Sweet Peanuts Soy
land land potato beans
Average Pelita I (1969-1973) 23.61 2.08 2.73 10.73 2.22 0.28 0.49
Average Pelita 11 (1974-1978) 25.87 1.77 3.13 12.63 2.36 0.38 0.57
Average Pelita III (1979-1983) 29.75 1.76 4.09 13.17 2.05 0.45 0.62
1984 36.02 2.12 5.29 14.17 2.16 0.53 0.77
1985 37.03 2.01 4.33 14.06 2.16 0.53 0.87
1986 37.74 1.99 5.92 13.31 2.09 0.64 1.23
Source: Statistical Yearbooks of Indonesia (various issues), Biro Pusat Statistik, Jakarta, Indonesia.
Table 2. Areas harvested of food crops, Indonesia, 1969-86 (million hectares).
Paddy Year wet dry Maize Cassava Sweet Peanuts Soy
land land potato beans
Average Pelita I (1969-1973) 6.75 1.40 2.72 1.44 0.36 0.38 0.67
Average Pelita 11 (1974-1978) 7.36 1.17 2.56 1.40 0.31 0.46 0.71
Average Pelita III (1979-1983) 7.91 1.16 2.67 1.36 0.27 0.49 0.71
1984 8.55 1.22 3.09 1.35 0.26 0.54 0.87
1985 8.76 1.15 2.44 1.29 0.26 0.51 0.90
1986 8.89 1.10 2.14 1.17 0.25 0.60 1.25
Source: Statistical Yearbooks of Indonesia (various issues), Biro Pusat Statistik, Jakarta, Indonesia.
43

Table 3. Yields of food crops, Indonesia 1969-86 ('000 kg/ha).
Paddy Year wet dry Maize Cassava Sweet Peanuts Soy
land land potato beans
Average Pelita I (1969-1973) 3.50 1.50 1.00 7.5 6.2 0.74 0.73
Average Pelita II (1974-1978) 3.52 1.51 1.22 9.0 7.5 0.81 0.79
Average Pelita III (1979-1983) 3.76 1.52 1.53 9.7 7.6 0.93 0.87
1984 4.21 1.74 1.71 10.5 8.2 1.00 0.90
1985 4.23 1.75 1.77 10.9 8.4 1.04 0.97
1986 4.25 1.81 1.88 11.4 8.3 1.07 0.98
Source: Statistical Yearbooks of Indonesia (various issues), Biro Pusat Statistik, Jakarta, Indonesia.
Table 4. Fertilizer production and domestic use (,OOOt) Indonesia, 1979/80-1988/89.
Urea TSP AS
Domestic Domestic Domestic Year production Use production Use production Use
1979-80 I 828 114 152 1980-81 2001 1 878.9 465 561.4 180 78.1 1981-82 2011 2 153.5 559 734.1 195 157.4 1982-83 I 961 2073.4 577 724.6 210 363.2 1983-84 2241 2380.4 783 855.2 2.8 365.7 1984-85 3044 2 574.1 I 027 990.5 356 418.0 1985-86 3690 2610.4 1 051 1 087.5 482 466.1 1986-87 3957 2723.8 1 169 1 209.0 575 512.2 1987-88 4154 2723.4 I 177 1 208.6 604 561.0 1988-89 4 178 2947.0 1249 I 277.0 656 592.0
Source: Directorate of Agro Industries, Ministry of Industries.
Rates of Fertilizer Application
Rates of fertilizer application to the major food crops grown in Indonesia are shown in Table 5. Over the period shown (1979 to 1986) rates of fertilizer application to rice increased by 790/0 to 287 kg/ha in 1986. The rate of urea application increased by just over 50% to 204 kg/ha. The rate of application of TSP/DAP to rice more than trebled between 1979 (25kg/ha) and 1986 (77 kg/ha). The rate of application of other fertilizers (KCI and AS) to rice, although doubling over the period still remained low (5 kg/ha in 1986).
The increases in rates of fertilizer application to other food crops, since 1979, were even more significant than that for fertilizer applied to rice. The rate of fertilizer application to maize more than doubled between 1979 and 1986. The rates of fertilizer applied to sweet potatoes and groundnuts almost trebled over the eight-year period shown in Table 5. Fertilizer application rates to soybeans and cassava
44
increased by more than four-fold the levels of 1979, to 69 and 36 kg/ha respectively in 1986.
Although the rates of fertilizer application to food crops in Indonesia have increased, the cost of fertilizer as a proportion of the total cost of food crop production has declined (Table 6). This is due primarily to the very significant increases in the cost of hired labour. The cost per hectare of inorganic fertilizers applied to rice during the 1987 dry season in East Java was less than 10% of the total cost of rice production. Fertilizer costs were 16% of the cost of corn production and 19% of the cost of soybean production. Fertilizer was 9% of cassava production costs and less than 4% of the total costs of peanut and mungbean production.
Fertilizer Pricing Policy
The Government of Indonesia has for a long time had a policy of maintaining an artificially favourable fertilizer-rice price ratio. Table 7 shows the urea price

Table 5. Fertilizer use by crops (kg/ha).
1979 1980 1981 1982 1983 1984 1985 1986
Rice(a) Total 159.79 203.24 231.13 242.01 273.13 345.67 262.38 286.67 Urea 132.78 154.55 170.06 175.10 195.43 244.91 184.74 204.43
TSP/DAP 25.24 47.88 58.64 63.52 73.54 98.93 73.15 77.39 Others 1.77 0.81 2.43 3.39 4.16 1.83 4.49 4.85
Maize Total 43.67 76.65 115.94 111.47 111.31 82.49 123.07 96.71 Urea 38.93 68.80 100.41 95.62 97.75 71.03 95.77 69.95
TSP/DAP 2.20 7.59 15.19 14.45 12.97 10.61 24.29 24.03 Others 2.54 0.26 0.34 1.40 0.59 0.85 3.01 2.73
Soybeans Total 15.93 38.44 58.32 81.49 69.38 72.71 77.67 69.44 Urea 10.09 20.82 34.82 52.45 38.51 43.45 43.01 40.67
TSP/DAP 5.18 16.62 21.01 26.89 28.81 27.82 32.29 26.05 Others 0.66 1.00 2.49 2.15 2.06 2.44 2.37 2.72
Cassava Total 7.91 18.69 27.11 27.65 39.25 12.51 30.65 36.31 Urea 7.01 15.54 22.70 22.02 34.04 9.83 15.03 27.87
TSP/DAP 0.74 2.92 4.00 5.32 5.1I 2.48 14.44 7.23 Others 0.16 0.23 0.41 0.31 0.10 0.20 1.18 1.21
Sweet potatoes Total 9.57 48.72 50.78 62.66 98.22 54.62 27.83 27.36 Urea 8.95 41.69 41.68 49.87 55.15 32.95 20.77 20.28
TSP/DAP 0.46 7.02 8.86 11.78 26.10 14.95 6.16 6.18 Others 0.16 0.01 0.24 1.01 16.97 6.72 0.90 0.90
Groundnuts Total 27.01 52.56 76.91 91.27 75.65 62.11 84.45 76.64 Urea 21.93 28.86 39.77 50.50 41.77 36.27 42.01 37.34
TSP/DAP 4.87 23.28 35.46 38.58 33.17 22.91 40.88 37.05 Others 0.21 0.42 1.68 2.19 0.71 2.93 1.56 3.25
(a) Wet-land rice. Source: CBS, Cost structure of farm paddy and palawija (various years).
and floor price of rice since 1977. A policy of a low and constant urea price, 70 Rp/kg between 1977 and 1982, and a rising floor price of rice resulted in a favourable and improving fertilizer-rice price ratio over that period. This policy did much to encourage the continued adoption of improved rice varieties and higher rates of fertilizer application during this period; this in turn had profound effects on rice production and rural incomes, especially on Java, and took the nation towards self-sufficiency in rice. The price of urea has increased several times since it was increased from 70 to 90 Rp/kg in 1983, but the urea-rice price ratio has continued to remain favourable.
The rising cost of domestic fertilizer production and the changing world prices of fertilizers have meant that both the financial and economic per unit costs of the fertilizer subsidy have increased. The financial fertilizer subsidy cost is the government fiscal cost of the fertilizer subsidy program. The economic cost of the fertilizer subsidy is the opportunity cost of the resources aIlocated to fertilizer production, and the opportunity cost of domestic use of subsidised fertilizers.
Estimates of the per unit economic costs of the
4S
fertilizer subsidy program for urea and TSP are shown in Table 8 as implicit tariffs. They are the differences between the subsidised retail prices and the estimated retail prices of fertilizer based on prevailing world prices (adjusted CIF). The estimated economic cost of the subsidy on urea in recent years has been around 40-500/0 of the adjusted CIF. The estimated per unit economic cost of the subsidy on TSP has been around 60% of the adjusted CIF. The costs to the nation in foregone fertilizer export earnings, or incurred fertilizer import costs, are substantial.
Thble 9 shows the estimated per unit financial costs of the fertilizer subsidies for urea, TSP, AS and imported KCI in 1986-87. In 1986-87 the subsidy on urea, produced at PT Kaltim and PT Iskanda Muda was around 90 Rp/kg. The percentage subsidy on urea produced at these plants was around 40%. The percentage subsidy on urea supplied by PT Pusri, at 13% for bagged and 5% for bulk urea, was substantially less. Urea produced by PT Kujang was unsubsidised. The per unit subsidy on TSP produced by PT Petrokimia Gresik in 1986-87 was almost 60% of the estimated unsubsidised retail cost, while that on AS produced by the same company was 50%. The

Table 6. Production costs of major food crops 1987 dry season, East Java. --_ ...
Crop Paddy
Production costs (wetJand) Corn Soybean Cassava Peanut Mungbean
Land rental (Rp) 217 000 105630 219888 ll5 385 191 960 94 325 (070) 35.93 23.11 38.34 36.43 37.72 25.92
Labor-Family<a) (Rp) 16660 54021.75 17 936.58 5 384.61 4 657.00 43 135.78 (070) 2.76 I) .82 3.13 1.70 0.91 11.85
Labor-Family hired (Rp) 276860 197546 162376.29 107 846.15 165 360 172 889 (070) 45.85 43.23 28.31 34.05 32.49 47.51
Seed (Rp) 15375 24627 36861 16923 ll5 783 24032 (070) 2.55 5.39 6.43 5.34 22.75 6.60
Fertilizer - ureal AS (Kg) 355 431.4 32.63 158.46 84.91 57.94 (Rp) 41 515 53925 4064 19807 10468 7242.5 (070) 6.87 11.80 0.71 6.25 2.06 1.99
TSP (Kg) 100 102 76.86 60.31 58.06 48.06 (Rp) 9675 12.550 94261 7538.46 6985 6 007.50 (070 ) 1.60 2.75 16.43 2.38 1.37 1.65
ASIKC! (Kg) 50 40.39 14.79 (Rp) 6050 4970 II 758 (070) LOO 1.09 2.05
- Total (Kg) 505 573.79 124.28 218.77 142.97 106.0 inorganic (Rp) 57240 71 445 110083 27345.46 17 453 13250
(070 ) 9.47 15.64 19.19 8.63 3.43 3.64 organic (Kg) 587.45
(Rp) 15,384 4,005 (070) 4.68 1.10
Other agrochemicals (Rp) 20740 19285 8690.12 8624 (070) 3.43 3.36 1.71 2.37
Other costs(b) (Rp) 3729 7 109.63 28500 5067 3625 Total costs (Rp) 603 875 456999 573 539.50 316767.84 508970 363 886 Gross value (Rp) 896627 896627 923806 850769.23 916631 714573 Net return (Rp/ha) 439854 439854 350265 544001 395460 363938
(a) Imputed values are used for family labour. (b) Other costs are taxes, water charges, draft animal hire and tractor rental. Source: Ministry of Agriculture, Cost oj Production Survey, 1987. Primary Survey Tabulation.
Table 7. Prices of urea and paddy, Indonesia 1977-87.
Year Paddy floor Urea Paddy/Urea price price price
Rp/kg Rplkg
1977 71 70 1.01 1978 75 70 1.07 1979(a) 85 70 1.21 198(}(a) 95 70 1.36 1981 120 70 1.71 1982 135 70 1.93 1983 145 90 1.61 1984 164 90 1.83 1985 175 lOO 1.75 1986 190 125 1.52 1987 215 135 1.59
........ --~
(a) Changed during the year. Source: Central Bureau of Statistics, Statistical Yearbook (various issues).
46
per unit subsidy on imported KCI in 1986-87 ranged between 35 and 48070, depending upon the destination of the imported fertilizer.
The rising per unit financial cost of the fertilizer subSIdy, along with me Increases in fertilizer use, resulted in an almost threefold increase between 1980-81 and 1986-87 in the government's total budget cost of the fertilizer subsidy scheme (Table 10). In 1986-87, the fertilizer subsidy scheme cost the Indonesian Government Rp 600 billion. This was more than half the agriculture and irrigation sector budget in 1986-87, and about eight times the Ministry of Agriculture expenditure on research and extension in that year (Tabor, 1988).
Impacts of Reduction in the Fertilizer Subsidy
The fertilizer subsidy in Indonesia is recognised as having been successful. It is this success, as well as its high fiscal and economic costs, that is now put forward as a major reason for proposing complete,

Table 8. Estimated per unit economic costs of urea and TSP Indonesia 1979-88.
Subsidised Adjusted CIF retail price Implicit tariff
Year Urea(a) TSP(b) Urea TSP Urea TSP Rp/kg Rp/kg
1979 169 150 70 70 -58.3 -53.0 1980 201 180 90 90 -54.9 -49.8 1981 211 176 90 90 -57.1 -48.3 1982 188 171 90 90 -52.0 55.7 1983 168 291 100 100 -40.6 -65.5 1984 187 265 lOO 100 -46.3 62.2 1985 175 209 100 lOO -32.7 52.1 1986 186 279 125 125 -32.7 54.6 1987 222 331 135 135 -38.7 59.2 1988 300 361 135 135 -55.0 -62.5
(a) CIF Urea determined from FOB Western Europe + freight + insurance cost for 1970. For 1982 to 1986 FOB Indonesia was used for urea. (b) CIF TSP determined from FOB USA + freight and insurance cost. Source: Transport and distribution data from PUSRI, reported in World Bank, Fertilizer Industry Sector Report, 1988. Modified from Tabor, S.W. 1988.
Table 9. Estimated per unit financial subsidies for urea, TSP and ammonium sulphate and KCI (used in domestic production, 1986-87).
Ex factory Distribution Actual cost Retail Subsidy (5) Percentage price (1) cost (2) price (3) = price (4) = (3) (4) subsidy
Items (I) + (2) (6) (5)1(3) Rp/t Rp/t Rp/t Rp/t Rp!t
1. Urea (PT Pusri)
Packed 81 305.41 63 073.47 144378.88 125000 19378.80 13.42 Bulk 68819.28 63 073.48 131 892.76 125000 6892.76 5.23
2. Urea (Kujang)
92 696. I3 31 266.09 123962.40 125000 no subsidy
3. Urea (Kaltim)
Packed 145 841.94 74019.98 219861.92 125000 94861.92 43.15 Bulk 138481.94 74019.98 213 481.92 125000 87481.92 41.17
4. Urea (Iskandar Muda)
Packed 152341.35 65986.57 218327.92 125000 93327.92 42.75 Bulk 143 728.35 65986.57 209714.92 125000 84714.92 40.40
5. TSP (Petrokimia Gresik)
249958.15 51 284.28 301,242.43 125000 176242.43 58.51
6. AS (Petrokimia Gresik)
205 831.91 41669.72 247501.63 125000 122501.63 59.50
7. KCI (Imported)
Region A 157575.00 35 118.32 192693.32 125000 67693.32 35.13 Region B 157575.00 36666.66 194241.66 125000 69241.66 35.65 Region C 157 575.00 58 822.54 213 397.54 125000 88397.54 41.42 Region D 157 575.00 84563.16 242 138.16 125 000 117 138.16 48.38
Source: Directorate of Food Crop Economics, Ministry of Agriculture 1986, as quoted by Tabor, S.R. 1988 Options for improving economic efficiency of fertilizer use. Notes: Region A: All provinces in Java and Bali. Region B: North Sumatera, West Sumatera, Lampung and Lombok Island. Region C: West Nusa Tenggar (except Lombok Island), South Sumatera, Aceh, South Sulawesi and North Sulawesi. Region D: Jambi, Bengkulu, Riau, Central Suiawesi, SE Sulawesi, Kalimantan, Maluku, East Nusa Tengara and irian Jaya.
47

Table 10. Total government budget cost of fertilizer subsidy 1980/81 - 1986/87 (billion Rp).
Fiscal Domestic Imported years producer fertilizer
1980-81 170.7 48.1 1981-82 198.0 49.3 1982-83 183.9 97.4 1983-84 264.8 16.8 1984-85 460.9 34.7 1985-86(0) 441.7 23.0 1986-87(a) 599.6 31.3
(a) Budget figure. Source: Recent Economic Developments (1986) International Monetary Fund.
or at least partial, removal of the program. In the current period of tightening fiscal constraint, the fertilizer subsidy scheme is an obvious budget item to be considered for reduction or complete removal. This is particularly the case, given the high absolute cost of the scheme as well as its high cost relative to other government budget items. It is now argued, given that the policy objectives have been achieved, that the high cost of maintaining the subsidy is no longer warranted.
The fertilizer subsidy has been successful and significant in its effect on: fertilizer sectors development; income transfer to the rural sector; and increased crop production.
Each of these accomplishments has been achieved indirectly through the effect of price on fertilizer use. What then would be the impacts of changes in fertilizer price on fertilizer use and consequently on the fertilizer sector, rural income levels and crop production?
Several studies have attempted to determine the effects of pricing policies on Indonesian food crop production. Studies by the World Bank (1982), Rosegrant et aL (1987), and Altemeier et al. (1988) have, through the development of detailed empirical models, simulated the effects of changes in fertilizer and food crop prices on fertilizer use, food crop production, balance of payments (net value of imports and exports of fertilizer and food crops), farmer and consumer welfare, and government budget costs. The results of these studies have been varied.
The analysis by the World Bank (1982) concluded that gradual reduction in the budget subsidy on fertilizers, provided that fertilizer price increases were matched by appropriate rice price increases, would not affect fertilizer use significantly and that selfsufficiency in rice would be maintained. Farm incomes could be maintained, however consumers would face higher rice prices. Substantial savings in the government's budget cost would result.
48
Adjustments in the fertilizer and rice prices were predicted by the World Bank to result in reductions in the already low rates of fertilizer application to secondary food crops, and consequently in reductions to output of these crops. However, the higher rice price may induce an increased demand by consumers for secondary food crops. The predicted net effect by the Bank is that prices may increase slightly and production of secondary food crops would remain about the same or slightly higher.
Rosegrant et aL (1987) conclude, as did the World Bank study, that phasing-out of the fertilizer subsidy must be considered in conjunction with adjustments in the rice price, as the strategy on rice price will affect the welfares of consumers and producers. They also caution against reductions in the fertilizer subsidy, unless improvements in the efficiency of fertilizer production and distribution, dissemination of crop production technology, upgrading of the irrigation system, and development of institutional arrangements (rural credit, crop marketing, etc.) can keep pace with the phase out of the subsidy.
Rosegrant et al. simulate the phase-out of the fertilizer subsidy against three rice price strategies. These are constant domestic wholesale and farm rice prices; and two scenarios where the domestic wholesale rice price is set equal to and allowed to float with the world rice price. The differences between the last two rice price scenarios is in the assumed world rice price. Rosegrant et aL (1987) conclude that, with a constant domestic wholesale rice price, complete phase-out of the fertilizer subsidy would have substantial negative impacts on rice production (10070 decline by 1995) and result in an increase in rice imports to 3.1 million t by 1995. Under this rice price scenario, they estimate that fertilizer use on rice would decline by 1.29 million t by the time that the subsidy is completely phased out.
The effect on corn production of phasing out the subsidy is also estimated to be significant (6.1070 decline in production by 1995). Fertilizer use on corn is estimated to fall by by 0.133 million 1.
The effect on production of other food crops and on fertilizer use on these crops was determined to be minor.
The estimated effects of the fertilizer subsidy phase-out with flexible domestic rice prices was that rice and corn production would decline by about 6 and 10% respectively by 1995. This is because of the impact of higher fertilizer prices on the wholesale rice price and the more favourable fertilizer-rice price ratio under this scenario. The reduction in fertilizer use is less under this rice price.
Altemeier et al. (1988) used a general equilibrium model to test the effects of changes in the fertilizer price under two rice price scenarios. They consider

Table 11. Simulation of 1988 rice and fertilizer pricing options.
Change in real farm rice price (0/0) 0 + 5 +10
Change in fertilizer price (nominal) (%) 0 +23 +40 +23 +40
Rice production(a) million metric tons 25.96 26.24 26.10 26.86 26.72 % change on base year(b) 1.08 0.54 3.47 2.92
Fertilizer use million metric tons 3.6 3.3 3.1 3.4 3.1 % change on base year(b) -8.33 -13.89 -5.56 -13.89
(aJ Milled rice equivalents. (b) Recalculated (not as quoted by Tabor and Altemeier). Source: Ministry of Agriculture, Sector Model Simulation; Tabor and Altemeier 1988.
the effects of a 23070 increase in the 1987 fertilizer price (as announced on 16 October, 1988) and a 40% increase in fertilizer prices, when 5 and 10070 increases in rice price are assumed. The results of their analysis are summarised in Table 11. Their analysis indicates that the effect of substantial increases in fertilizer price on rice production can be counteracted by moderate increases in the .price of rice. They also predict that, through fertilizer and rice price increases of the order shown in Table 11, significant reductions in fertilizer consumption on rice can be achieved and that substantial Government budgetary savings can be achieved. Assuming a 10% increase in the real rice price (as forecast by BULOG) in 1988, Altemeier et al. (1988) estimate that a 40% increase in fertilizer price would result in budgetary savings of approximately Rp 220 billion.
Conclusions
The three studies reviewed in this paper have used national or provincial level data to determine the impacts of fertilizer and crop pricing policies on fertilizer use, food crop production, consumer and producer welfare, import-export balance, and government budget costs. In each case the need for increased 'efficiency' in fertilizer production and distribution and in food crop production was highlighted as a prerequisite for phasing-out of the fertilizer subsidy.
Achieving improved 'efficiency' in the fertilizer and food crop sectors presents some challenging research areas that require immediate attention. The impacts of increasing domestic fertilizer production capacity and modification of existing fertilizer plants, as well as consideration of fertilizer import and export alternatives, need to be evaluated under alternative fertilizer price schemes. Methods of improving the marketing and distribution of fertilizer also need to be analysed for their effects on the fertilizer sector, as well as for their impacts on the retail price of
49
fertilizer and consequent effects on the crop sector. Within the food crop sector, there is a need for
scientific research into food crop production technology. This should include research into development of improved crop varieties as well as research into alternative methods of crop production. Research into fertilizer management practices, such as rates, methods and timing of fertilizer application, needs to be continued and used to develop meaningful recommendations for farmers. The values of these technologies need to be considered for input and product prices that might prevail under possible future economic environments.
Microeconomic analyses are also needed to determine the farm level impacts of fertilizer and crop pricing policies on fertilizer use, crop production and rural income and employment levels. Farm level prices, and income and employment opportunities, have changed significantly over the past decade and the pace of change in economic conditions in rural areas is likely to accelerate. Agriculture is now more commercialised. Marketable surpluses have increased and the expenditure patterns for crop production have changed. Fertilizer expenditure has declined relative to that on hired labour. There is a need to evaluate the farm level significance of fertilizer and crop pricing policy as well as other programs that could be implemented to ensure continued growth of food crop production as well as improvements in the income of rural people. Such analyses would complement the national level studies that have already been done.
References
Altemeier, K., Tabor, S. and Adinugroho, B. 1988. Supply parameters for the economic analysis of food supply. Ekonomi dan Keuangan. (In Indonesian).

Rosegrant, M.W., Kasryno, F., Gonzales, L.A., Rasahan. C. and Saefudin, Y. 1987. Price investment policies in the Indonesian food crop sector. International Food Policy Research Institute, Center for Agro-Economic Research, Indonesia.
Jabor, S. 1988. Options for improving the economic
50
efficiency of fertilizer use. Consultancy Report, Agricultural Sector Loan Project, World Bank AS5AG, Washington, D.C. U.S.A.
World Bank 1982. Indonesia: policy options and stategies for major food crops. World Bank. Washington, D.C. U.S.A.

ACIAR's Sulfur In Rice Research Program In S.E. Asia
Graeme Blair*
Abstract ACIAR's S research program in South East Asia has demonstrated that field experiments of
S response need to continue for a number of years at the same sites to enable measurement of residual effects of previous applications of fertilizer to be measured and the impact of environmental inputs on S dynamics to be assessed. It shows that crop residue management and incidental S inputs can be major determinants of long-term S fertilizer requirements. The burning of straw or straw removal from rice paddies increases the demand of the cropping system and will lead to increases in sulfur requirements in the long term. Earlier field studies show that elemental S is as effective as sulfate S as a source for flooded rice. Glasshouse studies using 355 have shown that fertilizer 5 recovery is generally lower from surface-applied elemental S than from sulfate and that deep placement of elemental S results in a low recovery from the source. The glasshouse studies also show that elemental S, urea-S melt and S-coated TSP are effective means of supplying S to rice when they are mixed with the soil and that 5CU and S-hentonite do not release sufficient S.
ACIAR's involvement in rice research in S.E. Asia grew out of the earlier studies conducted by IRRI, MORIF and the University of New England (UNE) in South Sulawesi. These results are reported elsewhere in these proceedings.
ACIAR's Phosphorus and Sulfur in Tropical Cropping Systems project commenced in 1985. This project has four major components. 1. S response and interactions with P in upland and
lowland areas in Indonesia, Malaysia and Thailand.
2. S source experiments conducted under field conditions in South East Asia and in greenhouse conditions in Australia.
3. Glasshouse studies at UNE by scientists from South East Asia. a) Source and placement of S (Solo Samosir,
Waree Chaitep and Made Dana). b) S cycling from rice straw and ash (Waree
Chaitep). 4. Laboratory studies of S dynamics (Solo Samosir,
Arsiana Triana).
• University of New England, Armidaie, NSW Australia
51
5. S accessions in rainfall. Results of the field S source experiments are
presented by Lefroy in these Proceedings.
Sulfur Response and Interactions with P in South East Asia
Field experiments consisting of a 5P x 5S factorial design have been conducted at a number of sites in Indonesia, Malaysia and Thailand. Sulfur responses were recorded at one site in Indonesia and one in Thailand. Lack of response at other sites can be attributed to one or more of the following; a) an inherently high S level in the soil; b) sufficient incidental inputs from irrigation water
and rainfall to provide crop S needs (Lefroy, these Proceedings); or
c) the site chosen was one which received S fertilizers in the previous year.
Indonesia
A 5P x 5S factorial experiment was conducted by lsmunadji and Makarim, Bogor Institute for Food Crops (BORIF), at Singamerta, West Java, Indonesia in 1987 and 1988. A significant response to S was recorded in the 1987 dry season crop (Thble 1). A non-

Table 1. Direct and residual effects of S fertilizers on grain yield of lowland rice at Singamerta, West Java (Ismunadji and Makarim, unpublished data).
~-------------------
S treatment Grain yield (kg/ha at 14070 moisture)
Dry Season Rainy Season (kg/ha) 1987 1987/88*
0 5784 3272 8 5809 3504
16 6240 3534 32 5628 3579 64 6388 3725
LSD (0.05) 485 455
"No S applied to this crop
Table 2. Physical and chemical characteristics of the lowland rice site at Ubon Ratchathani, Thailand.
Site Soil series Soil taxonomy
pH (CaCI2,I:I0 OM 070 Clay 070 SO /--S ppm(a) Total S ppm(b) Adsorbed S (ppm)(cl Extractable P (ppm)(d) Thtal P (ppm)(b) Adsorbed P (ppm)(e)
Ubon Ratchathani Roi Et Aeric Paleaquult
3.9 0.7 7 3.4
24 14.0
1.7 144 33.0
(aJ Calcium phosphate extractable (O.OlM, pH4.8) (b) Nitric perchloric acid digest (c) Sulfate S removed from solution by soil at 5ug S/ml
in the equilibrated solution (d) Sodium bicarbonate extractable (O.05M, pH 8.5, 16
hrs) (Colwell, 1963). (e) P removed from solution by soil at 0.2ug P/ml in
the equilibrated solution.
2200 (a)
S
2000 • P
• 'i 1800
l :!I
"
1 .~ 1600 .~
(!)
1400
1200
Fertilizer application (kglha)
Dtble 3. S balance sheets for rice grown at Ubon in 1986.
Fertilizer application So Ss S32 (kgS/ha)
Yield (kg/ha) Brown rice 1133 lllO 1066 Stubble 2152 2302 2464 Straw + H + UFG 1453 1454 1797
S input (kg/ha) Fertilizer 0 8 32 Rain 3.6 3.6 3.6
S uptake (kg/ha) Brown rice 1.3 1.3 1.3 Stubble 1.7 2.0 2.8 Straw + H + UFG 1.1 I.l 2.0
S Balance (kg/ha) Stubble returned 1.2 9.2 32.3 Stubble removed -0.5 7.2 29.5
significant response to S was recorded in 1987-88 rainy season. These results indicate that approximately 16 kg S/ha is required for maximum crop yield at this site.
Thailand
Data from Ubon, Thailand, indicate the need to conduct S experiments over a sufficiently long timescale. This site is representative of the sandy soils of the Roi Et series found on some 2.5 x 1()6 ha of land in Northeast Thailand. The characteristics of the site are presented in Table 2.
This soil has a high hydraulic conductivity (5.35 x 10⁻⁴ cm/sec). The parent materials are mainly sandstone and shale and the texture is sandy clay loam to silty clay loam. A no-fertilizer control
5000 (b)
S 4500
'i 4000 • 0, 6 :!I .~ 3500
1 " :l u <w '" 3000 a:
2500
2000 0 8 16 24 32 40 48 56 64
Fertilizer application (kg/ha)
Figure 1. Effect of phosphate and sulfate applications on (a) grain and (b) residue yields of rice at Ubon in 1987.
52

treatment was added to the 5P x 5S factorial design used at this site. The grain yield of the control (no fertilizer) plot was only L08 tlha compared with the mean yield of 3.25 t/ha for the whole experiment which received a basal application of N, K and trace elements. A major component of this response is believed to be due to N addition.
No response to P or S was recorded in the first two years of the experiment (1985 and 1986). In the 1987 cropping year there was a significant response in grain yield to both P and S and in residue yield to S (Fig. 1).
Analysis of soil samples taken prior to planting in 1986 showed an almost constant level of 13 ppm of calcium phosphatic extractable S in the whole soil profile for all treatments (Fig. 2).
These data suggest S is moving both laterally and downward in this light textured profile.
A calculation of S balance in this rice-cropping system in 1986 (Table 3) suggests the reason for the gradual onset of S deficiency. These results show that when stubble is removed there is a net loss of 0.5 kg S/ha/yr from the cropping system. This loss becomes a net gain of 1.2 kg S/ha/yr if the stubble is returned and no S applied in the fertilizer. This almostequilibrium situation is brought about by a net input of 3.6 kg S/ha/yr in rainfall at this location. However,
o 5
60
80
100
Extractable S (~g/g)
10 15 20
Figure 2. Effect of sulfate application on the calcium phosphate extractable sulfate levels in the profile at Ubon sampled prior to planting of rice in 1986.
53
80 Lowland/Lowland
Surlace Deep Surface Deep
Elemental Gypsum
80 Upland/Upland
_ 60
"l ~
~
I 1£ 40 (/)
~ .f'
I '" u.. 20
0 L ~ Sunaee Deep Surface Deep
Elemental Gypsum
80 Lowland/Upland
Surface Deep Surface Deep
Elemental Gypsum
Figure 3. Effect of placement and source on recovery of fertilizer S in successive rice crops (hatched = crop 1, open = crop 2) grown under different water management treatments.

120
;0
~ 100
~ .0, SO "§
E ,g 60
~
" > 0
" !" 40 en ~
if 20
0
120
~ 100
10 <ij c: SO .0, "§ E ,g 60
~
" 8 40 !" 'f) eft 20
Upland
Low S High S LowS High S
S A S A S A S A
No gypsum 6kgS/ha
Lowland
Low S High S Low S
S A S A S A
E]Soil
S==straw
I2ZI Roo1
A~ash
D Straw • Grain
High S
S A
_LOSS
Figure 4. Residue S recovery from rice straw (S) or ash (A) added to lowland or upland rice. Low S = residue from S deficient crop. High S = residue from S adequate crop.
these figures almost certainly overestimate S balance, as they take no account of S lost in leaching.
It is suggested that the situation of this site is similar to that in South Sulawesi, Indonesia, where rice is often grown on soils of moderate to high hydraulic conductivity.
Glasshouse Studies Of Sulfur Nutrition Of Rice
Source and placement
Glasshouse experiments, which have been carried out at UNE, using different S sources with upland and lowland rice are reported in these proceedings by Lefroy. They have generally shown only minor differences in the effectiveness of different sulfate and elemental S sources when used in a surface application. There was a marked reduction in the
54
·0
'" Q> en
'" 20 c: 0 :s 0 '" "g c:
,g :J en
·0
'" {jj ~ c:
~ 0 '" ·0
'" c:
.2 "5 en
3.5
3.0
2.5
2.0
1.5
1.0
0.5
a) Prairie soil
I LSD (p~0.05) pH 7.00
pH 6.45
~PH5.90 pH 5.35
pH 4.S0
0.0 +-----,------,-----,-----,----, ·150 -50 50 150
Redox potential (mV)
25 b) Krasnozem soil
20 I LSD (p=0.05)
15
10
250 350
pH 7.00
Ol-------£l pH 6.45
pH 5.90
pH 5.35
pH 4.S0
0+-----,-----,-----,-----,----, -150 -50 50 150 250 350
Redox potential (mV)
Figure 5. The effect of redox and pH levels of sulfate in the soil solution in two Australian soils.
effectiveness of both groups of fertilizers when deepplaced in flooded soils, with the reduction often being greater with the elemental sources (Fig. 3).
S cycling from crop residues
Glasshouse experiments conducted by Chaitep studied the S dynamics from S reincorporated into a rice cropping system either as straw or ash obtained from the straw (Fig. 4). The results show that loss of S on burning is approximately 600/0 from a low S straw and 40% from straw containing high S. The amount of S recovered by the crop from an equivalent weight of ash is higher than from straw, especially under upland conditions. However, this higher recovery is insufficient to offset the loss that occurs on burning (Fig. 4). These results show that in a rice

cropping system where the residues are burnt, S is lost from the immediate cropping area. The fate of this S is dependent on air movements and rainfall but, if wind speeds are low and there is frequent rainout as in many areas of Indonesia, then much of the S lost on burning may be recycled to the agricultural area. Information on S accessions in rainfall in Indonesia are presented in these Proceedings by Lefroy.
Laboratory studies of sulfur dynamics in flooded soil
Experiments conducted by Samosir in 1988 have improved our understanding of S dynamics in flooded soiL These studies have shown that S
55
concentration in the soil solution increased as pH increased due to desorption of S from the positive1ycharged sites in the soil (Fig.5). There was little change in soil S levels as redox fell, except under high pH conditions. As an acid soil, such as the Prairie and Krasnozem soils studied, undergoes flooding, the redox falls and pH rises and the soil S concentration increases (Fig. 5).
References
Colwell, J.D. 1963. The estimation of phosphorus fertilizer requirements of wheat in southern New South Wales by soil analysis. Australian Journal of Experimental Agriculture and Animal Husbandry 3, 190-197.

Sulfur Research In Upland Crops in Southeast Asia
R. D. B. Lefroy*
Abstract Changes in cropping systems and fertilizer management practices have led to an increase in
the occurrence of S deficiency in Southeast Asian agriculture. This has occurred as a result of changes in the balance between S input and S offtake or losses.
Since 1985, the Australian Centre for International Agricultural Research has been funding a project which has conducted experiments on the responses to S and the interactions between Sand P in upland cropping systems in Thailand, Indonesia and Malaysia. Growth responses and S uptake into grain and residues have been measured along with inputs of S in fertilizer and rain and the S content throughout the soil profile. The growth responses can largely be explained by the S status of the soils, the balance between S input and S offtake and an extrapolation of data on the movement of S within the profile to allow for S loss by leaching.
It is suggested that the use of such a balance sheet approach, along with data on the soils S status, S sorption capacity and physical characteristics, allows different cropping systems to be evaluated for their S-fertilizer requirements.
THE increased use of fertilizers, increased cropping intensities, improvements in management practices and the use of improved varieties have resulted in increased crop production in much of S.E. Asia, with concomitant increases in the demands on soil fertility and subsequent requirements for new fertilizer programs. The expansion of agriculture onto more marginal soils has also increased the need for appropriate fertilizer programs.
The use of high analysis Nand P fertilizers, containing little or no S, has meant that the addition of S has often declined at the same time as the S offtake in crops has increased. The result is an increase in the incidence, and the projected incidence, of S deficiency. These changes in production systems and fertilizer practices are likely to continue, as is the expansion of agriculture into more marginal areas.
Appreciation of the chemical and physical characteristics of the major soil types, the nutrient demands and removals for the various cropping systems and how these balance with nutrient inputs, enables prediction of the areas and cropping systems
.. Department of Agronomy and Soil Science, University of New England, Armidale, NSW 2351 Australia
56
in which S deficiency is likely. A clear understanding of the cycling of S will also assist in the development of stategies for alleviating S deficiency in those areas where it occurs.
Since 1985 a series of experiments investigating the Sand P nutrition of upland crops has been carried out, in Thailand, Indonesia and Malaysia, as part of a project on P and S cycling in tropical cropping systems funded by the Australian Centre for International Agricultural Research (ACIAR). The studies have been predominantly on corn, with some work on mungbeans, cowpeas, upland rice and peanuts. Experiments in lowland cropping systems have also been included and are reported elsewhere in these Proceedings (Blair).
In addition, laboratory and greenhouse studies on Sand P have been carried out at the University of New England, also as part of the ACIAR project.
Experimental Results
At three sites in Thailand, two sites in Indonesia and one site in Malaysia, experiments were set up to study the effects of P and S on upland crops in experiments using a factorial design with 5 levels of P, applied as monocalcium phosphate, and 5 levels of S, applied

800l a) 800 b)
• • 1986 I • 1986 I 700 700 b. P4S4
• • 600 600
<i • <i
I 500 e:::
~ 1987 0> 500 1987 A
I 6
A -0 "0 400 ID 400 ID
""-----.~--- ":;:. ":;:. c: c: "iij
"iij 300 Cl 300 Cl A
::1 ! I I I I I I
::1 I I I I I I I I
0 8 16 24 32 40 48 56 64 0 8 16 24 32 40 48 56 64
P application (kg/ha) S application (kg/ha)
Figure 1. Effect of a) phosphate and b) sulfate on grain yield of corn at Ubon, Thailand in 1986 and 1987.
Table I. Gross S balance sheets for 1986 and 1987 at Ubon, Thailand.
1986 1987 S levels 2 3 4 5 2 3 4 5
(kg/ha)
Yields Corn 246 738 631 674 Cowpea 136 179 201 100
S Input Fertilizer 0 8 16 32 Rain 3.4 3.4 3.4 3.4 Total 3.4 11.4 19.4 35.4
S Uptake Corn
product 0.26 0.65 0.80 0.85 residue 1.11 1.43 1.84 1.85
Cowpea product 0.27 0.35 0.41 0.23 residue 0.19 0.28 0.30 0.31
Balance Residue returned 2.87 10.40 18.19 34.32 removed 1.57 8.69 16.05 32.16
as gypsum. The soils at each site were thoroughly characterised at the start of the experiments and the yield of products and residues, their S contents and the levels of Sand P in the soil profile were measured for each crop. The sites in Thailand and Indonesia were cropped for several years during the experiment.
To maintain close control for extended periods of time, all these sites were on experimental stations. This had the drawback that the soils had been well fertilized and consequently there were often no
672 218 287 387 422 654 132 80 102 74 95 103
64 0 0 0 0 0 3.4 3.4 3.4 3.4 3.4 3.4
67.4 3.4 3.4 3.4 3.4 3.4
0.84 0.28 0.38 0.50 0.58 0.92 2.42 0.72 0.82 0.96 1.03 0.98
0.33 0.17 0.22 0.16 0.23 0.27 0.37 0.24 0.31 0.37 0.44 0.55
66.23 2.95 2.80 2.74 2.59 2.21 63.44 1.99 1.67 1.41 1.12 0.68
57
responses to either or both nutrients, at least initially, or for certain crops in the rotations. However, achieving yield responses was not the only aim of these experiments.
At Muneng, in East Java, corn was grown as a mono crop during the wet season and was intercropped with Dolichos lab lab in the dry season. The experiment was carried out for three wet and two dry seasons. There was no significant response to either P or S for the three wet season corn crops or

the two dry season cornl Dolichos crops (see Makarim, these Proceedings).
At Pekalongan, in Central Lampung, a wet season corn crop was followed by a dry season cowpea crop, a wet season upland rice crop, a dry season corn crop, a dry season cowpea crop and a wet season upland rice crop. There was no response to P or S in either of the two upland rice or the two cowpea crops. The major responses in both corn crops was to P, although there were some indications of a response to S in some treatments.
Of the three sites in Thailand, all of which were planted with corn and followed by either mungbean or cowpea, one showed no response to either P or S over the three years, one developed a response to P with time, and one showed a response to both P and S from the first crop.
Although one aim of these experiments was to try to identify soil types which are likely to respond to 5 fertilizer applications, the major aim was to investigate the cycling of Sand P in the soil-plant system on a wide range of soil types. Two of the sites from Thailand will be used to demonstrate some of the important features of the 5 cycle.
The soil at Ubon Ratchatani in northeast Thailand, which is classified as an Oxic Paleustult, is a nutritionally poor, light textured soil. The crop failed in the first year due to inappropriate fertilizer placement, poor germination and poor rains. The first successful corn crop showed a large and significant response to an 5 application of 8 kg 5/ha and an equally large response to a P application of 16 kg P/ha (Fig. 1). In the following year no fertilizer was applied to any of the treatments except the combination of 32 kg Sand 32 kg P/ha (P 454)' The response to the residual 5 fertilizer was much lower than the initial applications, except where the initial application was at a rate of 64 kg 5/ha; this suggests that only with this application was there sufficient 5 remaining in the soil for it to be non-limiting. The response to the residual P fertilizer was limited by the level of S remaining in the soil. The treatment which had the re-application had the same yield as the previous application.
The lack of sufficient S remaining in the soil after previous applications of 32 kg S/ha or less suggests that the previous application has been either taken up by the plant, converted to an unavailable form or leached from the profile.
Table 2. Percentage of calcium phosphate extractable sui fate in the top 40 cm at Phra Phuttabat. ------ ...... - .~
Year
1986 1987
o
44 32
S level (kg/ha) 16
50 35
64
53 37
58
Table 3. S balance sheet for the three years 1985-87 at Phra Phuttabat.
Treatment S level P level
2 2
3 3
4 4
5 5
---------------Input Fertilizer (kg S/ha)
1985 1986 1987
Rain (kg/ha/yr)
Total (kg S/ha)
Uptake (kg S/ha)
Product Residue
Balance (kg S/ha)
Residue returned removed
0 8 16 32 64 0 8 16 32 64 0 8 16 32 64
4 4 4 4 4
12 28 44 108 140
21.0 17.1 23.1 26.6 25.3 19.0 18.2 23.9 19.6 20.5
-9.0 10.9 20.9 81.4 114.7 -28.0 7.3 3.0 61.8 94.2
By mea.~uring the inputs of S in fertilizer and rainfall and 5 uptake by the crops, both into grain and residue, it is possible to calculate the gross balance between these processes. The 5 balances for 1986 and 1987 are shown in Table 1. With the very low yields at this site the uptake of 5 by the crops was low and even when no fertilizer was applied there was a positive 5 balance, irrespective of whether the residues were returned or not. The balance is positive since the input of 5 in rain is greater than the uptake by the crops. Even if the 5 in rainfall is ignored the balance is still positive for treatments which responded to S applications and thus does not explain the responses in either year unless there is significant loss of 5 from, or immobilisation in, the soi\.
Prior to planting of the first successful corn crop in 1986, measurement of the calcium phosphate extractable S levels down the soil profile showed treatment differences in the levels of 5 when averaged across the phosphate treatments (Fig. 2). Not only was the level of extractable S in the profile higher where 64 kg 5/ha was applied in the previous year, but there was also evidence of significant movement of S down the profile.
Soil samples taken prior to planting in 1987 gave further evidence of S movement with no significant treatment differences at or near the surface, but large treatment differences at depth in the profile. The results even suggest that there was significant loss of 5 from the measured profile.

a) Extractable S ("gig) b) Extractable S (l1g/9)
0 5 10 15 20 0 5 20 0 I I
~1 I I
20
1 E
'" 40 .2 40
iE l!1 e ~ 0.
.£
~ 60 .c
60 :a 0 '" 0
80 80
!
100 100-'
Figure 2. Effect of sulfate application on the extractable sulfate levels in the soil profile at Ubon sampled prior to the planting of corn in a) 1986 and b) 1987.
Extractable S (119/g) Extractable S (l1g1g)
0 to 20 30 40 0 10 0 0
20 20
E E .2 .2
~ 40 l!1 40 e i "-
c .t:
60 a 60 :a '" ~ 0
80 80
100 100
Figure 3. Effect of sui fate application on the level of extractable sulfate in the soil profile at Phra Phuttabat sampled prior to planting of corn in a) 1986 and b) 1987.
Therefore, in this light textured soil, which is more than 80(1,10 sand, less than 10(1,10 clay and has an hydraulic conductivity of 1.85 x 1O~3 cm/sec, the low inherent S level in the soil and the Iow residual value of applied S fertilizer is a result of very low S sorption capacity and rapid percolation of water with its subsequent leaching of sulfate through the profile.
The site at Phra Phuttabat, in central Thailand, is on a more fertile soil which is classified as an Ustoxic Paleustult. This soil contains approximately 40010 sand and 30010 clay and as such has a higher sorption capacity and a lower hydraulic conductivity of 2.95 x 1O~4 cm/sec. The maximum yields at this
59
site were around 4 tlha compared to less than 1 t/ha at Ubon. Over the three years of the experiment a significant response to P developed, but there was no significant response to S.
Despite the higher sorption capacity, lower hydraulic conductivity and lack of reponse to S fertilizer, there was still evidence of movement of sulfate in the profile or immobilisation into other forms (Fig. 3). Expressing the amount of extractable sulfate in the top 40 cm as a percentage of the sulfate in the whole profile shows this apparent S movement down the profile (Thble 2). If the S was not leached through the profile but was immobilised into a nonextractable form, which subsequently is turned over

into a plant-available form, then these changes in extractable S do not represent a net loss from the system. However, it is unlikely that this would explain all the changes in the extractable sui fate levels.
Calculation of a S balance sheet for this site across the three years shows much greater uptake of S by the plant due to the higher yields (Table 3). As a result, the gross S balance is negative if no fertilizer is applied and is even negative if 8 or 16 kg S/ha is applied and the plant residues are not returned. The negative values with applications of 8 and 16 kg S/ha when the residues are not returned emphasise the importance of residue management in the S cycle.
With a negative balance between S inputs and S offtake and apparent movement of S in the soil, why was there no response to S fertilizer? It is possible that there are other inputs, such as lateral flow of S-containing water, but these are unlikely to be very large. The most likely explanation is that the difference between net input of S and net offtake is being made up from the soil's S reserves. Clearly soils differ in their capacity to maintain this 'mining' of soil nutrients, with the differences being due to their organic matter content, their sorption capacity and the levels of S-containing minerals.
60
Conclusion
The amount of plant-available S is of major importance in determining the likelihood of S being a yield-limiting factor. However, other factors in the cycling of S must be considered when determining which soils and cropping systems are likely to be Sdeficient and how these deficiencies are to be overcome. In an extensive cropping system, Sdeficiency is only likely to occur on very light textured soils with very low sorption capacity and low organic matter, such as the soil at Ubon, Thailand. As the intensity of cropping increases, with its concomitant increase in S offtake, so more fertile soils are likely to become S-limiting, especially if their increased yields are as a result of high applications of S-free N and P fertilizers. The use of a simple balance sheet approach of all S inputs and off-take, along with information on a soil's extractable S levels, S sorption capacity and physical characteristics, allows for current and projected cropping systems to be assessed for their likely requirement for S fertilization. Using this approach it should be relatively easy to assess the current status of the S cycle in a large range of Indonesia's cropping systems and soil types and to evaluate the effects of projected changes in fertilizer programs, cropping intensity, crop management and residue management systems.
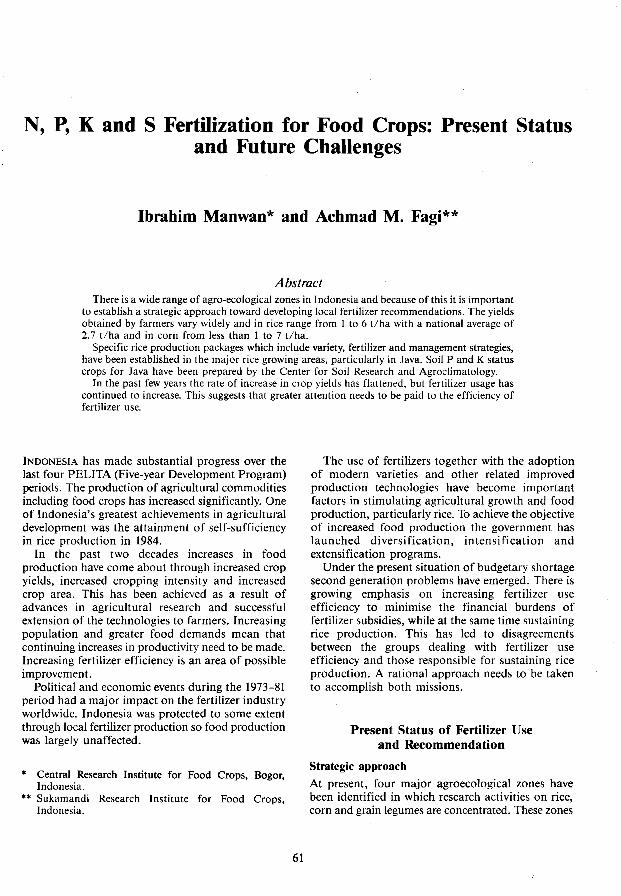
N, P, K and S Fertilization for Food Crops: Present Status and Future Cballenges
Ibrahim Manwan* and Achmad M. Fagi**
Abstract There is a wide range of agro-ecological zones in Indonesia and because of this it is important
to establish a strategic approach toward developing local fertilizer recommendations. The yields obtained by farmers vary widely and in rice range from 1 to 6 t/ha with a national average of 2.7 tlha and in corn from less than 1 to 7 t/ha.
Specific rice production packages which include variety, fertilizer and management strategies, have been established in the major rice growing areas, particularly in Java. Soil P and K status crops for Java have been prepared by the Center for Soil Research and Agroclimatology.
In the past few years the rate of increase in crop yields has flattened, but fertilizer usage has continued to increase. This suggests that greater attention needs to be paid to the efficiency of fertilizer usc.
INDONESIA has made substantial progress over the last four PELITA (Five-year Development Program) periods. The production of agricultural commodities including food crops has increased significantly. One of Indonesia's greatest achievements in agricultural development was the attainment of self-sufficiency in rice production in ]984.
In the past two decades increases in food production have come about through increased crop yields, increased cropping intensity and increased crop area. This has been achieved as a result of advances in agricultural research and successful extension of the technologies to farmers. Increasing population and greater food demands mean that continuing increases in productivity need to be made. Increasing fertilizer efficiency is an area of possible improvement.
Political and economic events during the 1973-81 period had a major impact on the fertilizer industry worldwide. Indonesia was protected to some extent through local fertilizer production so food production was largely unaffected.
• Central Research Institute for Food Crops, Bogor, Indonesia.
*" Sukamandi Research Institute for Food Crops, Indonesia.
61
The use of fertilizers together with the adoption of modern varieties and other related improved production technologies have become important factors in stimulating agricultural growth and food production, particularly rice. To achieve the objective of increased food production the government has launched diversification, intensification and extensification programs.
Under the present situation of budgetary shortage second generation problems have emerged. There is growing emphasis on increasing fertilizer use efficiency to minimise the financial burdens of fertilizer subsidies, while at the same time sustaining rice production. This has led to disagreements between the groups dealing with fertilizer use efficiency and those responsible for sustaining rice production. A rational approach needs to be taken to accomplish both missions.
Present Status of Fertilizer Use and Recommendation
Strategic approach
At present, four major agroecological zones have been identified in which research activities on rice, corn and grain legumes are concentrated. These zones

are irrigated wetland, rainfed wetland, dryland and swamp. Further sub-division of the four major agroecological zones can be made according to the soil type, irrigation facilities, agroclimate, topography, and socioeconomic conditions.
Because of the wide range of agroecological zones which exists in Indonesia there are wide variations in crop production opportunities. Production opportunities in each zone can be maximised through selection of appropriate crops and varieties, management systems and fertilizer practices.
Diversity both within and between agroecological zones means that it is impossible to carry out fertilizer trials in all locations and careful attention must be paid to site characterisation so that the results can be extrapolated to other areas.
The yields obtained by individual farmers in each agroecological zone vary considerably. Yields of rice vary from 1 to 6 t/ha with a national average of 2.7 tlha. Corn yields vary from less than 1.0 to 7.0 tlha with a national average of l. 7. Soy bean yields vary from less than 0.5 to 3 tlha with a national average of 2.0 tlha, and mungbean yields range from 0.5 to 2.5 t/ha with a national average of 0.7. This indicates that, to some extent, technologies that can produce high yields of rice, corn, soybean, peanut, mungbean, and other food crops are already available to farmers. These technologies, including proper fertilizer recommendations, need to be identified and tested in various agroecological zones for wider adaptation.
The role of fertilizers
The introduction of 'miracle rice', IR5 and IR8 in 1963 changed the concept of farm management from low input traditional rice farming to high input modern rice farming. Modern rice technology in Indonesia has been developed through a series of experiments conducted at the research institutes of the Agency for Agricultural Research and Development (AARD). The results of these experiments have been further evaluated in various locations representing more specific rice agroecosystems. Present fertilizer recommendations which have been widely adopted by farmers have beem formulated from these studies.
Research and farmer experience have identified the key role that fertilizers play in crop production in Indonesia. Since the introduction of the first fertilizer subsidy package in PELITA I in 1979, there has been a trend to increasing fertilizer rates per hectare. Originally only N and P fertilizers (urea and TSP) were used in these packages but they have now been broadened to include K, S and Zn.
Whilst fertilizer application contributed substantially to increased crop production and quality, it has also created problems. Continued high application of P and K fertilizers in Java has led to
62
a buildup of these nutrients in some areas. This has been confirmed by analysis of soil samples by the Centre for Soil Research and Agroclimatology. This Centre has compiled N and P maps of Java based on these analyses.
During the last few years the rate of growth in food production has nearly ceased whilst inputs, particularly fertilizer, have continued to increase. Costs of inputs are increasing and the efficiency of utilisation of these inputs has tended to decline. Imbalances in nutrients, resulting from continuous heavy fertilization are thought to be one of the major causes of stagnant growth in rice production. Speculation exists about the widespread occurrence of S, K and Zn deficiency and Fe toxicity in irrigated rice fields in Java. Arguments about the cause of an outbreak of 'bacterial red stripe' on IR64 and IR36 in the 1988 dry season continue. Low application rates of K combined with poor drainage seem to aggravate the seriousness of this disease.
A new rice intensification program, SUPRA INSUS, was initiated in late 1986 to further stimulate rice production. This package contains the following ten components:
use of certified seed of high yielding varieties (HYV); thorough land preparation; good on-farm water management plant populations of more than 200 000 hills per hectare; balanced fertilizers; applications of liquid fertilizer (foliar spray) or growth regulators; varietal rotation; integrated pest management; cropping systems practice; and improved postharvest technology.
The development of fertilizer recommendations for maize, tuber crops, and food grain legumes follows that used in rice. Both research and verification tests of fertilizer packages for those crops lag behind rice. Research results from Java indicate that:
maize and tuber crops generally respond to N while responses to P and K vary with soil type; drainage affects the availability of N, P and K to maize and legume crops planted after irrigated rice; S deficiencies in maize or grain legumes are rare when planted after lowland rice.
Development of fertilizer recommendations
In order to optimise the use of fertilizers it is important to develop proper fertilizer recommendations based on the results of well planned and well organised research and

Table 1. Grain yield of IR 64 receiving high and low inputs at various locations in Java, 1987-88 wet season.
Treatmenta Grain yield at Grain yield at Yield high input low input (LI)b difference
(HI) Lll LI2 HI-LIt HI-LIz Tanjung Taman-Indramayu
Standard package 7.90 8.23 9.35 -0.33 1.45· Standard package + AS 8.34 0.11 -1.01* Standard package + Zn 8.51 0.23 -0.84 Standard package + AS + Zn 8.99 0.76 -0.36
Gempol-Karawang
Standard package 7.66 7.18 7.47 0.48 0.19 Standard package + AS 7.17 -0.01 -0.30 Standard package + Zn 7.54 0.36 0.07 Standard package + As + Zn 7.54 0.36 0.07
Banyubiru-Ambarawa
Standard package 6.42 5.97 6.40 0.45 -0.02 Standard package + AS 7.00 1.03* 0.60 Standard package + Zn 6.75 0.78 0.35 Standard package + AS + Zn 5.88 -0.09 -0.52
Ballyudollo-Boyolali
Standard package 4.59 4.29 4.28 0.30 0.31 Standard package + AS 4.66 0.37 0.38 Standard package + Zn 4.42 0.13 0.14 Standard package + AS + Zn 4.50 0.21 0.22
a Standard package = thorough tillage; NPK application; apply foliar spray Cytozime. b Ll l : conventional tillage; NP application (no K); no Cytozime;
Ll2: thorough tiJlage; N application (no P and K); no Cytozime. • difference significant at the 5OJo level.
muItilocation tests conducted in different agroecological zones. An evaluation of SUPRA INSUS technology was conducted in major rice agroecosystems in Java because the results of rapid rural appraisal (RRA) in SUPRA INSUS areas indicated that farmers were reluctant to use all of the recommended components (KEPAS 1988). The results of these evaluations (Thble 1) failed to show any yield advantage from the addition of AS or Zn in any location, except in Banyubiru, Ambarawa, Central Java. At this location the application of ammonium sulfate, in addition to urea, increased grain yield of IR64 by 1.03 tlha over that receiving urea only at the same N level.
By contrast at Tanjung Taman, Indramayu, West Java the use of thorough tillage and N alone (LI2, Table 1) resulted in a rice yield of 9.3 tlha compared with the 7.90 tlha in the SUPRA INSUS package treatment. Other studies have confirmed the importance of thorough tillage and integrated pest management (IPM) as major determinants of rice yields (Table 2). These tests clearly showed that the SUPRA INSUS fertilizer package could not be
63
generalised. It needs to be adjusted according to the particular characteristics of the site and farmer skill.
Soils of Indonesia are generally deficient in Nand there is no evidence of N accumulation in soils as a result of N fertilizer applications. The P status of soils in Indonesia varies markedly both as a result of inherent fertility and fertilizer application. Research at Sukamundi, Java has shown that soil P and K levels increased as a result of P and K application to 16 successive rice crops (Table 3). This study is supported by soil survey results from CSR (1988) which indicate that TSP applications could be reduced in some 3 million ha of irrigated rice fields in Java.
The above results suggest that present fertilizer recommendations need to be altered to take account of nutrient accumulation from past fertilizer application if fertilizer efficiency is to be enhanced. If rice fields are nearing their potential then more economical fertilization programs need to be developed to maintain farmer profitability otherwise production may switch away from rice and endanger rice self-sufficiency. The incorporation of rice

production into a broader farming system which may include rice, fish, duck and upland crops would help to stabilise production and incomes.
The results of the CSR studies have not been universally accepted and it is suggested that a coordinated program of research, multi-Iocational and demonstration activities are needed to verify the soil analysis results.
Studies of K in rice soils have been less intensive. Previously it was believed that the rivers of Java contain sufficient K from weathering for rice growth. The soil map prepared by CSR (1988) generally confirms the adequate K status of most of thc soils of Java. Results from the long-term trial at Sukamundi (Table 3) show no K accumulation as a result of fertilizer K application. In cropping systems where straw is returned, K status may be maintained at a higher level.
Responses in rice to S application have been reported from South Sulawesi. Results from a longterm trial conducted at the Maros Research Station measured a response to S in the 19th consecutive crop grown in the 1986 dry season but no response in the following wet season crop. This seasonal difference in S response may be due to S in ground water which rises to the surface during the wet season.
Future Directions in Fertilizer Management and Use
Food crops diversification and fertilizer management
The government of Indonesia realises that continued dependence on rice production for food and income is difficult to sustain in the long term, and has paid increasing attention to alternative crops.
The major questions which need to be addressed with respect to food crop diversification are: (a) how to increase non-rice food crops (palawija)
production without sacrificing rice production, and
(b) the selection of appropriate policies in the palawija intensification program.
To stimulate rice production the Government introduced a mass guidance scheme (BIMAS). This included a subsidy on fertilizers which stimulated consumption. Because of the resultant build up in fertility and the present national economic downturn, these subsidies are being reduced. Partial phase-out of the fertilizer subsidy has increased fertilizer prices and the floor price of rice. These have moved together to prevent a sharp decline in farm revenue.
A recent study indicates that full removal of the fertilizer subsidy would cause a significant drop in rice and maize production, but would have little effect on soybean and cassava production (Kasryno and Rosegrant 1988). Other reports suggest that a full phase-out of the fertilizer subsidy would be appropriate only if continuing progress could be made in the areas of technological development including higher efficiency in fertilizer use, improved fertilizer distribution and production systems (IFPRI,1987).
Rationalisation of fertilizer use
Fertilizer consumption has grown at a rate of more than 16OJo/yr in the last 15 years. However, a large percentage (72 %) of the fertilizer was used for wetland rice and only 13% for palawija crops (Kasryno, 1986). Fertilizer consumption grew at an accelerated rate after 1979 (Fig. I), but consumption
Table 2. Contributions of recommended method of insecticide application, plant spacing, tillage practices individually and interaction among them to grain yields of IR64 (t/ha), 1987/88 Wet Season.
Component of package l Tanjung Tanam Banyubiru Talun Sukorejo (Supra Insus) (Indramayu) (Ambarawa) (Blitar) (MaJang)
Individual Component
Method of insecticide appl. (lPM) -0.20 -0.20 -0.07 -0.11
Plant spacing (30x 15 cm) -0.31 0.02 -0.02 -0.25
Thorough tillage 0.34 0.02 0.01 0.15
Interaction between two components
IPM x Thorough tillage 0.84* 0.73* 0.55* -0.10
Plant spacing x Thorough tillage 0.62* 0.32 0.40 0.09
IPM x Plant spacing 0.26 -0.08 -0.26 -0.32
1 IPM: integrated pest management (insecticides were applied when there was a sign of insect infestation). * Significant at the 5010 level.
64
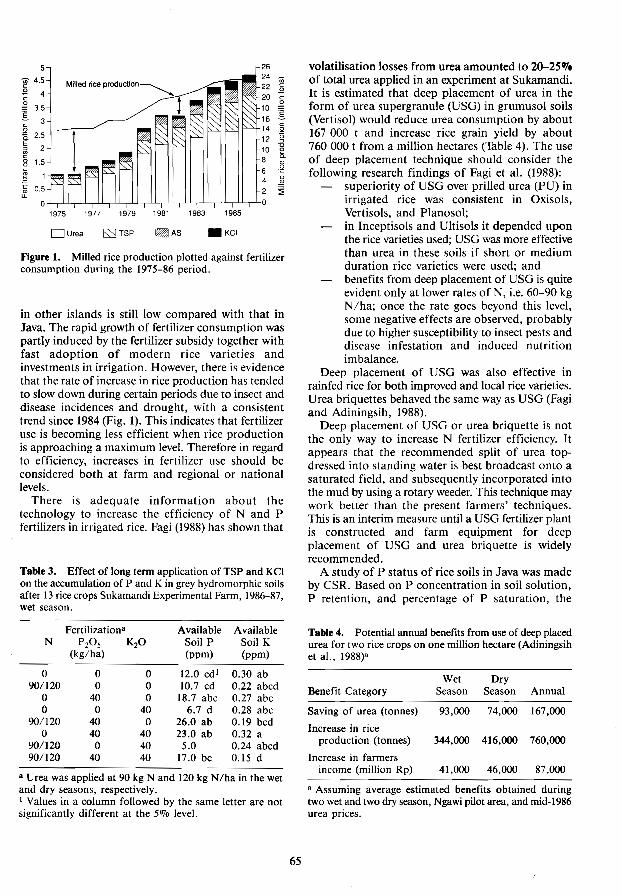
26 ~24 .,
22 c B
20 c
10 Q
16 §. 14 c
0
12 U " 10 ~
8 0-., 6 ,g 4 " .!!! 2 :lE
DU,ea ESTSP ~AS _KCI
Figure 1. Milled rice production plotted against fertilizer consumption during the 1975-86 period.
in other islands is still low compared with that in Java. The rapid growth of fertilizer consumption was partly induced by the fertilizer subsidy together with fast adoption of modern rice varieties and investments in irrigation. However, there is evidence that the rate of increase in rice production has tended to slow down during certain periods due to insect and disease incidences and drought, with a consistent trend since 1984 (Fig. l). This indicates that fertilizer use is becoming less efficient when rice production is approaching a maximum level. Therefore in regard to efficiency, increases in fertilizer use should be considered both at farm and regional or national levels.
There is adequate information about the technology to increase the efficiency of Nand P fertilizers in irrigated rice. Fagi (1988) has shown that
Table 3. Effect of long term application of TSP and K Cl on the accumulation of P and K in grey hydromorphic soils after 13 rice crops Sukamandi Experimental Farm, 1986-87, wet season.
N
----o
90/120 o o
901120 o
901120 90/120
FertiIizationR
PZ0 5 KzO (kg/ha)
o 0 o 0
40 0 o 40
40 0 40 40 o 40
40 40
Available Available Soil P Soil K (ppm) (ppm)
12.0 cd! 10.7 cd
18.7 abc 6.7 d
26.0 ab 23.0 ab
5.0 17.0 be
0.30 ab 0.22 abed 0.27 abc 0.28 abe 0.19 bcd 0.32 a 0.24 abcd 0.15 d
a Urea was applied at 90 kg Nand 120 kg N/ha in the wet and dry seasons, respectively. I Values in a column followed by the same letter are not significantly different at the 5070 level.
65
volatilisation losses from urea amounted to 20-25070 of total urea applied in an experiment at Sukamandi. It is estimated that deep placement of urea in the form of urea supergranule (USG) in grumusol soils (Vertisoi) would reduce urea consumption by about 167 000 t and increase rice grain yield by about 760 000 t from a million hectares (Table 4). The use of deep placement technique should consider the following research findings of Fagi et aI. (1988):
superiority of USG over prilled urea (PU) in irrigated rice was consistent in Oxisols, Vertisols, and Planosol; in Inceptisols and UItisols it depended upon the rice varieties used; USG was mOre effective than urea in these soils if short or medium duration rice varieties were used; and benefits from deep placement of USG is quite evident only at lower rates of N, i.e. 60-90 kg N/ha; once the rate goes beyond this level, some negative effects are observed, probably due to higher susceptibility to insect pests and disease infestation and induced nutrition imbalance.
Deep placement of USG was also effective in rainfed rice for both improved and local rice varieties. Urea briquettes behaved the same way as USG (Fagi and Adiningsih, 1988).
Deep placement of USG or urea briquette is not the only way to increase N fertilizer efficiency. It appears that the recommended split of urea topdressed into standing water is best broadcast onto a saturated field, and subsequently incorporated into the mud by using a rotary weeder. This technique may work better than the present farmers' techniques. This is an interim measure until a USG fertilizer plant is constructed and farm equipment for deep placement of usa and urea briquette is widely recommended.
A study of P status of rice soils in Java was made by CSR. Based on P concentration in soil solution, P retention, and percentage of P saturation, the
Table 4. Potential annual benefits from use of deep placed urea for two rice crops on one million hectare (Adiningsih et aI., 1988)a
Wet Dry Benefit Category Season Season Annual
Saving of urea (tonnes) 93,000 74,000 167,000
Increase in rice production (tonnes) 344,000 416,000 760,000
Increase in farmers income (million Rp) 41,000 46,000 87,000
a Assuming average estimated benefits obtained during two wet and two dry season, Ngawi pilot area, and mid-1986 urea prices.

availability of P was classified into high, moderate, and low values, and suggested that TSP applications could be reduced to 50, 25 and OOJo of the present recommended respectively. By following this recommendation, it can be projected that TSP consumption in Java can be reduced by 197 883 t per year in a million hectares of lowland rice (Adiningsih et al. 1988a).
Adiningsih et al. (1988 a,b) have shown that incorporation of rice straw in K-deficient soil (Oxisols) at 5 t/ha was as effective as KCl application at 200 kg/ha. A long term trial conducted at Sukamandi Experimental Station indicated that K should be applied every alternate year or four alternate seasons to sustain grain yield of IR36 rice.
It is important to emphasise that improvement of N, PorK fertilizer use efficiency cannot be made separately, because they are interrelated with each other and with other factors. Furthermore, in double crop systems where one of the crops is rice and the other is palawija, the fertilizer management of the rice crop will be different from the fertilizer management of rice crops grown in succession in a year. The management of the palawija crop will have an effect on the rice crop and vice versa. Therefore, soil fertility and fertilizer management should be viewed from a cropping systems perspective (C.P. Mamaril, personal communication).
Narrowing rice yield gaps within rice-growing districts
High variability and wide rice yield gaps among the rice growing areas within the rice growing districts are still observed although the locations have the same ecosystems (soil, climate, irrigation, etc.). In West Java, for example, the rice yields in the rice growing districts tended to positively correlate with the production cost up to 5.0 ha yield level, with a few exceptions.
The average of rice yield in Lebak, Serang, and in parts of Thngerang is still low compared with those in other districts, particularly with rice growing districts within the command of Jatiluhur irrigation system such as Subang, Bekasi, Karawang, and Indramayu districts. According to information that has yet to be confirmed, P and K fertilizers are inadequately used in Lebak, Serang and Tangerang. On the other hand, P and K fertilizers have been intensively used in rice growing areas within the command of Jatiluhur irrigation system.
At present the use of high-yielding rice varieties covers nearly 85070 of the total rice area. The yield gaps in these areas still can be minimised, therefore rice production still can be increased with proper nutrient and crop management. Likewise, additional increased rice production still can be generated from the areas where local rice varieties and traditional
66
farming practices are used. Generally, these areas are in rain fed and upland ecosystems.
Thus efficient use of fertilizers in well established and in intensified rice growing areas there are two main objectives: to reduce production costs, without necessarily causing yield decline, hence increase farm income; and to reallocate the increased amounts of fertilizer projected for use in these areas to other, less intensive, rice growing areas, such as rainfed and upland rice, or for palawija intensification programs.
Location specific fertilizer package
The soils of Indonesia are resources of primary importance for the expansion of food crop production. Use and management must consider other factors like climate, water availability, and socio-economic conditions. Each interacts with the other, hence the combination must be considered in generating the fertilizer package.
AARD through the CSR in collaboration with FAO has established land suitability ratings for various crops, induding rice, maize, tuber crops, and food grain legumes (FAO 1979). A land that is marginally suitable for rice may be highly suitable for maize, cassava or soybean, and vice versa. These can be used in generating the appropriate fertilizer package for each food crop.
Increasing population pressure will lead the farmers to cultivate less productive agricultural lands. In the case of rice, increasing areas of moderately to marginally suitable rice lands are projected to be incorporated into intensification programs, such as SUPRA INSUS. Increasing the productivity level of marginal lands to a high productivity level as in the highly suitable lands requires a high level of fertilization and other inputs which results in low economic efficiency.
Thus, self-sufficiency in rice or palawija crops should be looked at at the national level. This means that not all the districts have to manage to be sufficient in rice or palawija. A district, where the majority of its land is highly suitable for any palawija crop, should intensify that crop. The requirements for rice may be supplied from other districts where the majority of the land is highly suitable for rice. Selection of a certain commodity and/or farming systems should be based on the comparative advantage of each commodity or farming model.
It is, therefore, very important to develop specific location fertilizer packages for rice and palawija crops. This study identifies a need for complete characterisations of lands and will use land suitability ratings available at CSR AARD. Zoning of agricultural land through agro-ecosystem inventory is a basic tool in future agricultural development programs.

References Adiningsih, S., Rochayati, S., Setyorini, D. and Sudjadi.
M. 1988a. Efficient use of fertilizer in irrigated rice land. Paper presented at Symposium Ill: Research on Food Crops. CRIFC AARD, Puncak/Bogor, 21-23 March 1988. (In Indonesian).
Adiningsih, S., Moersidi. S., Sudjadi, M. and Fagi, M. 1988b. Evaluation on phosphate requirement for intensified rice cultivation in Java. Paper presented at the National Workshop on Efficient Use of Fertilizer. CSR/IFDC/APPI, Cipayung/Bogor, 21 November 1988. (In Indonesian).
Baharsyah, S., Kasryno, F. and Darmawan, D.H. 1988. Rice position in Indonesian economy. In: Rice. CRIFC AARD. 1-35. (In Indonesian).
BIair, G.J., Mamaril, c.P. and Momuat. E. 1988. Sulfur nutrition of wetland rice. IRRI Research Paper Series, No 21.
Centre for Soil Research (CSR). 1988. Evaluation of the demand for phosphate in intensified wetland rice in Java. 1987-88 crop season. Interim Report: Research on Phosphate Requirement. Bogor. 6 August 1988. (In Indonesian).
Fagi, A.M. 1988. State of knowledge on fertilization technique in irrigated wetland rice. Proceedings National Workshop on Fertilizer Efficiency. CSR AARD, 37-59. (In Indonesian).
Fagi, A.M., Adiningsih, S. 1988. Increasing efficiency of nitrogen efficiency in irrigated and rainfed wetland rices.
67
Paper presented at the National Workshop on Efficient Use of Fertilizer. CSR/IFDC/APPI, Cipayung/Bogor, 21-22 November 1988. (In Indonesian).
Fagi, A.M., Taslim, H. and Sudjadi, M. 1987. Country Report Proceedings, Efficiency of Nitrogen Fertilizer for Rice. IRRI, Los Banos, Philippines, 235-252.
Fagi, A.M., Tejasarwana, R. and TasIim, H. 1988. Report multilocation trials on nitrogen use efficiency in irrigated wetland rice, 1984-85 crop seasons. Proceedings, Workshop on Fertilizer Use Efficiency. CSR AARD, 47-74.
FAO. 1979. A land capability appraisal. UNDP: AGLlINSI 721011.
International Food Policy Research Institute (IFPRI). 1987. IFPRI Report 1987,29 and 32.
Kasryno, F. 1986. Supply of rice and demand for fertilizer for rice farming in Indonesia. Jurnal Agro Ekonomi (JAE). 5, 2.
Kasryno, F. and Rosegrant, M.W. 1988. Fertilizer demand and price policy. Proceedings National Workshop on Fertilizer Efficiency. CSR AARD, 221-243.
KEPAS (Kelompok Penelitian Agroekosistem). 1988. Supra Insus program in lalur Pantura, West Java. Problems, constraints and suggestion for improvement. AARD Ford Foundation, Jakarta, 57 pp. (In Indonesian).
Stangel, P.]. and Harris, G.T. 1987. Trends in production, trade, and use of fertilizers: a global perspective. Proceedings, Efficiency of Nitrogen Fertilizers for Rice. IRRI, Los Banos, Philippines. 1-26.

The Status of N, P, K and S of Lowland Rice Soils in Java
J. Sri Adiningsih*, Djoko Santoso* and M. Sudjadi*
Abstract The consumption of fertilizers for lowland rice has increased significantly and coincides with
the increase of rice production in Indonesia. A significant amount of the fertilizer used was on lowland rice in Java.
Since funds for a fertilizer subsidy are limited, the use of fertilizers should be re-evaluated with consideration of the nutrient status of the soils and fertilizer efficiency. Based on the available data from soil analyses and fertilizer trials, an evaluation of the nutrients status of N, P, K and S of lowland soils in Java has been conducted.
The results indicated that the N status was very low and N fertilization is needed at varying rates. The P and K status had been compiled in a \:250000 scale map. About 85070 of the total area had high P status due to continuous applications of P. On these soils P fertilizers could be applied once in 2 to 3 cropping seasons.
The distribution of K status across 3.65 million ha lowland soils in Java is as follow: 23.8070 is considered to be high; 36.4"70 medium and 39.8 low. Rice soils with low K status were found mostly in west Java.
The sulfur status based on Ca(H2P04h 500 ppm P extractable S indicate that about 52.8070 of the total area has low S status and was mostly found in Central and East java. However, most of the field trials did not show any response to S fertilization. Thus S status of the soils could not be used as a single parameter to predict the response of rice to S fertilization.
THE agricultural sector plays an important role in supporting the development of the industrial sector during the fifth Five Year Plan (PELlTA).
The intensification program, initiated in the 1960s, which was aimed at increasing agricultural production particularly rice, is being escalated and improved through the INSUS (Special Intensification), OPSUS (Special Operation) and SUPRA INSUS programs. Accordingly, larger amounts and more varied types of fertilizers are presently consumed.
In the last 20 years urea and TSP have been used on food crops in ever increasing amounts (Table I), while potassium chloride and ammonium sulfate which have been used only since 1978, are now also increasingly consumed. The largest amount of fertilizer is consumed by lowland rice in Java with a total harvested area of 5.1 million ha, or 55070 of
* Central Research Institute for Soil Science and Agriclimate, Bogor, Indonesia
68
the total harvested area of Indonesia. This is due to the fact that larger amounts and more types of fertilizer are used per ha in Java. In several areas farmers have been applying rates exceeding the recommended rates, particularly urea and TSP.
Fertilizer consumption will continue to increase, thus requiring more fertilizer subsidy, while on the other hand the government's funds are limited. There is, therefore, an urgent need for increasing fertilizer use efficiency.
This paper presents the findings of studies on the N, P, K and S status of the lowland soils of Java, which are based on soil testing data and fertilizer trials on farmers' fields. This study is expected to be useful as a guide to planning further field trials, fertilizer recommendation and distribution.
Nitrogen
Of all nutrients, plants have the greatest need for nitrogen. The efficiency of N fertilizers in lowland rice ranges between 30 and 50%, depending on rice

Table L Total fertilizer consumption ('000 t) for food crops from 1969 to 1988.
Years
1969 1970 1971 1972 1973 1974 1975 1976 1977 1978 1979 1980 1981 1982 1983 1984 1985 1986 1987 1988
Urea
308 172 406 480 668 604 670 666 919 975
1.147 1.679 1.992 2.153 2.117 2.342 2.334 2.486 2.485 2.636
TSP
49 11 55 41
134 193 233 207 218 266 275 439 637 752 739 886 933
1.056 1.039 Ull
KCl
9 20 69 70 88
103 124 184 191
AS
23 54 99
294 259 231 299 337 372 379
Sources: Mass Guidance Control Agency, 1987 and Thchnical Sub team 'SPSP', 1989.
variety, method and time of application. Studies on the efficiency of nitrogen for lowland rice have included comparisons of different N sources, such as sulfur coated urea, ammonium sulfate, urea, urea formaldehyde, and urease inhibitors. Available N in
Table 2. Organic-N content (010) of some lowland rice soils in Java.
No. Soil Group
1. Aluvial 2. Glei Hydromorphic 3. Regosols 4. Andosols 5. Grumusols 6. Mediterranean 7. Red Yellow Podzolic S. Latosol
West Central Java Java
0.11 0.13 0.15 0.13 0.17 0.10 0.20 0.21 0.14 0.21 0.12 0.13 0.15 0.20 0.18
East Java
0.13 0.14 0.12
0.11 0.11
0.16
the soil is very dependent on soil organic matter content, and no rapid and suitable method of N soiltesting has yet been found to predict N requirement. Analytical data from approximately 600 soil samples taken from lowlands soils in Java indicated that the organic-N content of the lowland soils in Java is very low (0.10-0.210/0) (Table 2). In general, recommendation for N fertilization is based on plant requirement and its efficiency.
Results of fertilizer trials on lowland rice at several locations in Java have indicated that N fertilizers are urgently needed (Table 3). At present, the recommended rates range between 200-300 kg urea/ha and its efficiency is, generally, very low ( < 400/0). Due to improper application, N losses through volatilisation, denitrification and leaching are high.
Table 3. Response of lowland rice to N, P, K and S application.
Location
West Java Cicurug Cicurug Cicurug Cianjur Cianjur Karawang
Central Java Klalen Klaten
East Java Cangakan Cangakan Cangakan Cangakan Madiun Madiun
Season
86 86/87
87 88
88/89 88/89
87/88 88
86/87 87
87/88 88 88
88/89
Control
30.4 37.8 34.4 42.1 41.0 26.3
40.0 49.3
41.6 29.2 38.7 26.5 32.7 34.8
N
46.5 51.0 44.5 51.5 45.3 54.7
50.4 66.7
57.1 44.2 55.4 41.2 39.6 50.3
69
NP
59.7 55.8 55.4 53.4 41.3 55.2
50.9 75.8
55.6 47.4 58.0 43.3 34.8 55.6
Treatment
NPK
kg/ha
41.9 54.4 45.6 50.2 52.7 57.1
58.8 72.5
62.0 54.4 65.8 37.3 39.8 57.1
NPKS
49.0 53.1 47.0 49.5 45.7 49.9
52.2 70.5
65.1 60.3 69.3 43.2 37.2 58.8
LSD 0.05
1.0 0.6 8.7 7.1 ns 8.1
6.1 6.9
4.4 6.[ 6.2 5.6 ns
6.5
CV (%)
18.6 8.5
17.0 8.2
20.3 8.9
6.8 5.9
6.8 11.0 9.2
20.5 15.0 7.3
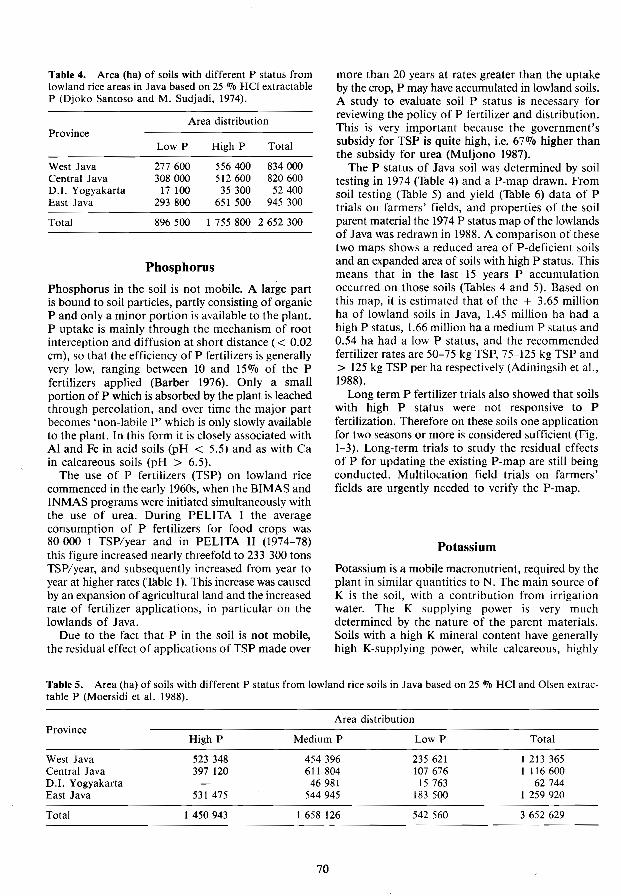
Table 4. Area (ha) of soils with different P status from lowland rice areas in Java based on 25 Illo HCI extractable P (Djoko Santoso and M. Sudjadi, 1974).
Area distribution Province
Low P High P Total
West Java 277600 556400 834000 Central Java 308000 512600 820600 0.1. Yogyakarta 17 100 35300 52400 East Java 293800 651 500 945300
Total 896500 I 755800 2652300
Phosphorus
Phosphorus in the soil is not mobile. A large part is bound to soil particles, partly consisting of organic P and only a minor portion is available to the plant. P uptake is mainly through the mechanism of root interception and diffusion at short distance ( < 0.02 cm), so that the efficiency of P fertilizers is generally very low, ranging between 10 and 150/0 of the P fertilizers applied (Barber 1976). Only a small portion of P which is absorbed by the plant is leached through percolation, and over time the major part becomes 'non-labile P' which is only slowly available to the plant. In this form it is closely associated with Al and Fe in acid soils (pH < 5.5) and as with Ca in calcareous soils (pH > 6.5).
The use of P fertilizers (TSP) on lowland rice commenced in the early 19605, when the BIMAS and INMAS programs were initiated simultaneously with the use of urea. During PELITA I the average consumption of P fertilizers for food crops was 80000 t TSP/year and in PELITA II (1974-78) this figure increased nearly threefold to 233 300 tons TSP/year, and subsequently increased from year to year at higher rates (Table I). This increase was caused by an expansion of agricultural land and the increased rate of fertilizer applications, in particular on the lowlands of Java.
Due to the fact that P in the soil is not mobile, the residual effect of applications of TSP made over
more than 20 years at rates greater than the uptake by the crop, P may have accumulated in lowland soils. A study to evaluate soil P status is necessary for reviewing the policy of P fertilizer and distribution. This is very important because the government's subsidy for TSP is quite high, i.e. 670/0 higher than the subsidy for urea (Muljono 1987).
The P status of Java soil was determined by soil testing in 1974 (Table 4) and a P-map drawn. From soil testing (Table 5) and yield (Table 6) data of P trials on farmers' fields, and properties of the soil parent material the 1974 P status map of the lowlands of Java was redrawn in 1988. A comparison of these two maps shows a reduced area of P-deficient soils and an expanded area of soils with high P status. This means that in the last 15 years P accumulation occurred on those soils (Tables 4 and 5). Based on this map, it is estimated that of the + 3.65 million ha of lowland soils in Java, 1.45 million ha had a high P status, 1.66 million ha a medium P status and 0.54 ha had a low P status, and the recommended fertilizer rates are 50-75 kg TSP, 75-125 kg TSP and > 125 kg TSP per ha respectively (Adiningsih et al., 1988).
Long term P fertilizer trials also showed that soils with high P status were not responsive to P fertilization. Therefore on these soils one application for two seasons or more is considered sufficient (Fig. 1-3). Long-term trials to study the residual effects of P for updating the existing P-map are still being conducted. Multilocation field trials on farmers' fields are urgently needed to verify the P-map.
Potassium
Potassium is a mobile macronutrient, required by the plant in similar quantities to N. The main source of K is the soil, with a contribution from irrigation water. The K supplying power is very much determined by the nature of the parent materials. Soils with a high K mineral content have generally high K-supplying power, while calcareous, highly
Table 5. Area (ha) of soils with different P status from lowland rice soils in Java based on 25 Illo HCl and Olsen extractable P (Moersidi et al. 1988).
Area distribution Province
High P Medium P Low P Total
West Java 523348 454396 235621 1 213 365 Central Java 397 120 611 804 107676 1 116600 0.1. Yogyakarta 46981 15763 62744 East Java 531 475 544945 183 500 1259920
Total 1450943 I 658 126 542560 3652629
70

Sepatan-Tangerang Kemiri-Karawang 80-
'" .-;::::==--
.r:; 60 S: 3! "g; >- 40 e "iii a
20
Subang 80-
i S: 60 -0 (j) "S:-e e? 40 (:!
20
------80~ranjur~~
60 -r===-----------~--.-----.-
"j 20
f j I j I 0 25 50 75 100
P rates (kg TSP/ha)
WS 1987188 {1st crop} --- WS 1988/89 (3rd crop)
---- DS 1988 (2nd crop)
Figore 1. Response of lowland rice to P application in 3 successive crops (WS 1987/88; OS 1988 and WS 1988/89) in West Java.
<0 ,f" g :!2 .!!' :>. c: .~
C.9
Kediri 80~
60
40
20 ,(
I 0
I I I 25 50 75
I 100
Mojokerto lOO..,
60
40
m-~ :l2
'" "S:-e '~ ('J
so
60
40
Purwokerto
I 25
I 50
j f 75 lOO
80 Kebumen
60
40
20
o I I
25 50 I I
75 lOO
80 Pekalongan Klaten 80
60 ------------------------- so
40 40
20 20
P rates (kg TSP/ha)
-- WS 1987/88 (1st crop) --- WS 1988/89 (3rd crop) ---- DS 1888 (2nd crop)
Figore 2. Response of lowland rice to P application for successive crops (WS 1987/88; OS 1988 and WS 1988/89) in Central Java.
Malang 80
60
40
20
o I
25 I
50 I
75 I
100
P rales (kg TSP/ha)
--- WS 1987/88 (1 sI crop) ----- OS 1988 (2nd crop) --- WS 1988/89 (3rd crop)
Figure 3. Response of lowland rice to P application in 3 successive crops (WS 1987/88; OS 1988 and WS 1988/89) in East Java.
weathered and coarse textured soils are, in general, K-deficient.
Generally, the plant's requirement for K depends on the availability of other nutrients, particularly N and P. Symptoms of K deficiency on lowland rice in Java were first reported in the 1970s when high
71
yielding varieties were introduced. Field trials which included K fertilizer requirement for rice have been conducted since 1976.
Soil samples were collected from the lowland areas in Java in 1977 to evaluate K status. A single value soil K-map with a scale 1:1 000 000 was prepared

Table 6. Regression equation of yield response (y) of lowland rice to P application (x kg/ha) and its residue for 2-3 successive crops (1987/88-1988/89).
Location Season Regression equation R
West Java
Sepatan Tangerang 1 Y = 64.87 + 0.0877 X 0.0006 X2 0.17 us
2 Y = 65.96 + 0.1245 X 0.0015 X2 0.84** 3 Y = 69.70 + 0.0144 X 0.24 us
Kemiri Karawang 1 Y '" 60.97 + 0.0037 X 0.02 us
2 Y 50.60 + 0.1275 X - 0.0016 X2 0.63* 3 Y 73.60 + 0.0060 X 0.02 us
Subang 1 Y = 68.95 + 0.0227 X 0.41 ns
2 Y = 52.37 + 0.0550 X 0.68* 3 Y = 65.34 0.0296 X 0.92*·
Cianjur 1 Y = 66.52 + 0.0529 X 0.38 us
2 Y 58.64 + 0.0560 X 0.46 os
3 Y 53.68 + 0.0300 X 0.42 ns
Central Java
Purwokerto I Y = 50.05 + 0.0437 X 0.44 us
2 Y = 53.49 + 0.0029 X 0.02 ns
Kebumen 1 Y = 41.73 + 0.7037 X 0.0049 X2 0.81** 2 Y = 41.74 + 0.1600 X 0.0005 X2 0.95**
Pekalongan I Y 56.10 + 0.0175 X 0.09 ns
2 Y 59.78 + 0.0782 X - 0.0004 X2 0.38 ns
Klaten 1 Y = 39.84 + 0.3951 X - 0.0022 X2 0.81 ** 2 Y = 60.30 + 0.1512 X 0.0009 X2 0.43 ns
East Java
Kediri I Y 58.23 0.0300 X 0.28 ns
2 Y 56.08 - 0.0898 X 0.61' 3 Y 55.00 + 0.0772 X 0.54 us
Mojokerto 1 Y = 54.11 + 0.0677 X 0.54 us
2 Y = 72.94 + 0.0120 X 0.16 ns
3 Y = 81.23 + 0.1633 X 0.0014 X2 0.47 us
Malang 1 Y = 47.76 + 0.0101 X 0.004u,
2 Y = 54.62 + 0.0484 X 0.50· 3 Y 58.67 + 0.0867 X - 0.0011 X2 0.60*
ns : Non Significant ** : Significant at 1 "10 * : Significant at 5 "10.
(Parwoto 1978) and the estimated areas in the various K classes are presented in Table 7. In 1989 this map was revised at a larger scale (1:250 000), using supplemental data from 600 soil samples, field trials conducted on farmers' fields and properties of parent material. This new map showed that of the 3.65 million ha lowland soils in Java, 1.45 million ha had a low K status, 1.33 million ha a medium K status, and 0.87 million ha had a high K status (Table 8). The map showed that in West Java, with acidic parent materials and relatively high rainfall, the majority of soils had a low K status. The K status of the soils increased towards the east. This trend is also observed in the 1977 K status map.
The map shows that the area with low K status is much smaller than that quoted by Partohardjono et al. (1977) who estimated that 2.2 million ha of the lowlands in Java were K deficient. The lower estimate is most likely due to the fact that in the 10 years between the study farmers had been applying KCl to the soil and in several areas straw incorporation, which returns K to the soil, is also practiced.
72
This K-map can be used as a basis to conduct field trials, but is not yet a suitable basis to make K fertilizer recommendations, since the supply of K to plants is affected by many factors such as soil, plant and soil management, incorporation of straw, and irrigation water.

Table 7. Area ('000 ha) of soils with different K status Symptoms of S deficiency might be observed on soils with parent material low in S, calcareous soils, soils with poor drainage, and coarse textured soils. Applications of high rates of Nand P, and the use of high analysis fertilizers and pesticides containing little or no S promote S deficiency.
from lowland rice areas in Java based on 25 070 HCI ex-tractable K (Parwoto, 1978).
West Central Classes Java Java
Very low 192 14 (0 - 10 mg/kg)
Low 313 177 (10 - 20 mg/kg)
Medium 176 327 (20 40 mg/kg)
High 124 165 (40-60 mg/kg)
Very high 51 212 (> 60 mg/kg)
Total 856 895
Sulfur
East Java
8
213
335
252
93
901
Total
214
703
838
541
356
2652
Symptoms of S deficiency were first reported in Indonesia by Leyder and Aldjabri (1971) in a pot experiment using Grumusol soil from Ngale. Later, Adiningsih et al. (1973) and Widjaya Adhi (1975) also reported S deficiency in pot experiments using other soils from Java and South Sulawesi. Soils which are responsive to S generally belong to the great group of Grumusols, Regosols, and Alluvials. Momuat et al. (1977) reported that S deficiency was observed in glasshouse and farmers' fields experiments at several locations in South Sulawesi. He indicated ammonium sulfate, K2S04 , gypsum or elemental S could be used as S sources.
Sulfur is an essential plant nutrient and is required by plants in similar amounts to P. Sources of S in the soil are S-containing minerals, organic matter, irrigation water or rain water, and also S-containing fertilizers and pesticides.
Based on pot experiments using several lowland soils and on analysis of rice plant samples from lowland soils in Java, Ismunadji (1977) has prepared a map of the locations of S-deficient lowland soils in Java. Based on plant critical S data Ismunadji (1977) estimated that 1.16 million ha is S deficient and 1.77 ha is considered to be marginal, or a total of 2.93 million ha are responsive to S. The map is
Table 8. Area ('000 ha) of soils with different K status from lowland rice areas in Java based on 25 % HCI extractable K (Didi Ardi et al. 1989).
Low Medium High Total Province < 20 mg 20~40 mg > 40 mg
West Java 664 403 146 1.213 (54.7070) (33.2%) (12.1%)
Central Java 397 353 367 1.117 (35.5%) (31.6%) (32.9%)
Yogyakarta 1 62 63 (0.6070) (98.4%)
East Java 391 511 358 1.260 (31.1%) (40.6%) (28.4%)
Total 1.453 1.329 870 3.653 (39.8070) (36.4%) (23.8070) (100%)
Table 9. Area (ha) of soils with different S status from lowland rice areas in Java based on Ca HP04 extractable S. (Djoko Purnomo et aI., 1989).
Area distribution Province
Low Medium High Total < 10 ppm S 10- 30 ppm S > 30 ppm S
West Java 135000 922030 133 310 1 260340 Central Java 767500 201 250 28120 996870 East Java 703 120 146 250 849370
Total I 605620 I 269530 161 430 3 106580
73

at present used as a basis for the recommendation of ammonium sulfate applications (50-100 kg/ha).
Correlation studies by Sulauman et aL (1984) indicated that among four extractants for S, Ca(H2P04h 500 ppm P gave the highest correlation with dry matter yield. As in the previous pot experiments, the majority of soils responding to S belonged to the great group Grumusols, Regosols and AlIuvials.
Using data of Ca(H2P04)2 500 ppm P extractable S from 345 lowland soil samples, Djoko Purnomo et at. (1989) attempted to prepare a map of the S status of lowland soils in Java at a scale of 1:750000. This method needs to be calibrated in the field. By using three levels of soil S, Le. low « 10 ppm S), medium (10-30 ppm S) and high (> 30 ppm S), it is estimated that of the 3.04 million ha of lowlands in Java, 1.61 million ha (52.80/0) had a low S Status, 1.27 million ha (41.8%) had a medium S status and 0.16 million ha (5.4%) had a high S status (Table 9).
Field trials comparing responses to S sources at
five locations in Java (Thble 10) which were assumed to be S deficient did not show any response to S fertilization (Table 11). Differences between S sources (AS, urea S, S Bentonite, gypsum and elemental S) tested were non-significant. Results of these trials are confirmed by the results of multilocation experiments recently conducted on farmers' fields on lowland soils in Java, where responses to S were slight and in general non existent, and at some locations production was even reduced where S was applied (Table 12).
The experience in Java confirms the opinion of Blair et aL (1977) that the soil's S status predicted from a sulfate-S extractant cannot be used as a parameter for predicting the plants' response to Sfertilization. Available S status is dependent on several factors, particularly the soil redox potential, organic matter content, soil microbiological activity, quality of irrigation water and rainwater. We conclude that fertilizer recommendations for S should be reviewed because they are highly location-specific.
Table 10. Some soil chemical properties of soils at the site of Sulfur trials in Java.
Location
West Java Central Java East Java Soil Properties Cianjur-Cilamaya Klaten Cangakan-Madiun
pH (HP) 5.5 5.0 6.0 8.1 7.8
Clay (OJo) 60 34 14 78 62
Organic matter C (070) 2.9 1.9 0.8 1.2 1.4 N (070) 0.3 0.2 0.1 0.1 0.1 P Olsen (ppm) 90 40 35 60 104 Available S (ppm) 15.0 10.8 12.0 2.6 L3
Exchangeable K 0.1 0.4 0.2 0.4 0.4 (meq/lOOg soil) CEC 49.0 35.9 17.0 76.3 41.0
Table 11. Response of lowland rice to N, P, K and S application on five locations in Java.
Treatment Location
N P20S K20 Sa Cangakan Madiun Klaten Cianjur Karawang (OL) (Or,) (Re.) (OL) (Al.)
Kg ha-1 t/ha· 1
3.2 3.3 4.0 4.2 2.6 90 4.7 4.0 5.0 5.1 5.5 90 60 4.8 3.5 5.1 5.3 5.5 90 60 50 5.7 4.0 5.9 5.0 5.7 90 60 50 4.8 5.8 3.7 5.2 5.0 5.0 90 60 50 9.6 5.4 3.6 5.6 5.2 5.9
a Applied as AS b Or = Orumosol. Re = Regosol, All = AlluviaL
74

Table 12. Response of lowland rice to K (KCl) and S (AS) at 21 locations throughout Java in the 1988 89 wet season.
Treatment ----
NP NPK NPKS LSD CV Location 0.05 (0/0 )
tlha·1
West Java 1. Sepatan-Tangerang 6.9 2. Benda-Tangerang 6.8 3. Pontang-Serang 7.4 4. Kemiri-Krawang 7.6 5. Cilamaya-Krawang 5.7 6. Sirnagalih-Cianjur 5.8 7. Pusakanagara 6.8 8. Plumb on 5.0 9. Indramayu 6.2
Central Java 10. Slawi-Tegal 4.5 11. Banyudono 7.4 12. Ketitang 6.9 13. Pekalongan 5.8
East Java 14. Madiun 6.2 15. Baron-Nganjuk 6.7 16. Gubah-Kediri 6.2 17. Mojokerto 8.2 18. Kepanjen 5.6 19. Probolinggo 5.0 20. Bojonegoro 7.2 21. Jember 5.3
a ns = not significant.
Conclusions
Based on result of the evaluation of the data presented, the following conclusions can be made: I. The N status of the lowland soils is generally low.
The rate of N fertilizer applied should be adjusted to the plant's requirement and its efficiency.
2. As a consequence of continuous P fertilization during the last 15 years, the P status of the major part of lowlands in Java is relatively high. Results of experiments during three consecutive seasons did not show any significant response to P fertilizer. The P fertilizer recommendation should therefore be reviewed.
3 . Based on soil test data, it is estimated that out of the 3.65 million ha approximately 39.80/0 of the lowlands in Java have a low K status, 36.40-/0 a medium K status, and 23.8% a high K status. The most extensive lowland area with a low K status is located in West Java. Data should be used with caution in making fertilizer recommendations because of K supplies from other sources such as irrigation water and crop residues.
4. The S status of the soil cannot be used as a parameter to predict plant requirements for S.
6.5 7.0 7.4 6.9 5.1 5.5 6.9 6.1 7.0
4.5 7.0 6.7 5.7
5.3 7.4 5.6 8.6 6.0 5.0 7.0 5.5
75
6.7 nsa 5.1 6.6 ns 5.1 7.3 ns 4.3 7.0 0.6 4.6 5.6 ns 8.0 5.7 ns 8.5 6.9 0.2 1.6 6.4 ns 3.7 6.4 0.3 2.6
4.6 ns 20.1 7.1 ns 5.4 6.9 ns 3.4 5.1 ns 6.5
5.9 1.1 12.5 7.0 0.7 5.6 5.6 ns 9.9 8.7 0.5 3.4 5.8 ns 6.1 5.3 ns 5.6 6.9 ns 8.0 5.4 0.4 5.3
Data from field trials does not support the soiltest data compiled. Response to S is very locationspecific, and is determined by factors such as soil redox potential, organic matter content and soil microbiological activity, quality of irrigation water and rain water. Proper soil and organic matter (crop residues,
legumes, etc.) management is the key to increasing the nutrient status and fertilizers-use efficiency to improve soil productivity.
References
Adiningsih, S. J., Tini Prihatini, 1973. Nutrient evaluation and problem identification on several lowland soils in Java (Internal report, unpublished). (In Indonesian).
Adiningsih, S. J., Tini Prihatini and Mursidi, S. 1975. Nutrient evaluation on South Sulawesi soils. Publication No. 16/1975. The Soil Research Institute. (In Indonesian).
Barber, S. A. 1976. Efficient Fertilizer Use. Agron. Res for Food, ASA.Spec. Pub!. Bull. 26.
Blair, G. J. Mamaril C. P. and Momuat E. 0., 1978. The Sulfur Nutrition of Rice. Contr. Centr. Res. Inst. Agric. Bogor No. 42, 13 p.

Didi Ardi S., Supardi A.K., Aldjabri, M. Supartini, J. Adiningsih, S. and Sudjadi M. 1989. The status of Potassium in lowland soils in Java and Madura. The Centre of Soil Research (in press - in Indonesian).
Djoko Purnomo, Djoko Santoso and Heryadi 1989. The status of Sulfur in lowland soils in Java. The Centre of Soil Research (in press - in Indonesian).
Ismunadji, M., 1977. The role and distribution of sulfur deficiency on lowland rice in Java. The role of research outcome on rice and second crop in agricultural development. Proceedings, Symposium I. The Centre of Agricultural Research and development, Bogor, Book 11: 285-294. (In Indonesian).
Leyder, R. A. and Aldjabri, M. 1972. Sulfur deficiency under conditions of wet rice cultivation with specific reference to a vertisols near Ngawi, East Java. News!. Soil Study Group Bogor 112, 21-29
Mass Guidance Control Agency (B.P. Bimas). 1987. The continuity of food sufficiency toward and beyond 2000. The Secretariat of Mass Guidance Control Agency (B.P. Bimas), Jakarta. (In Indonesian).
Momuat E. 0., Mamaril, C. P. Umar, A. P. and Momuat, J. S. 1977. Sulfur deficiency and its solution in Sulawesi. The role of research outcome on rice and secondary crops in agricultural development. Proceedings, Symposium I. The Centre of Agricultural Research and development, Bogor. Book II: 295-307. (In Indonesian).
Moersidi S., Santoso, D., Supartini, M., Aldjabri, M.,
76
Adiningsih, S. and Sudjadi M. 1988. Map of phosphate requirements of lowland soil in Java and Madura. The Centre of Soil Research (in press - in Indonesian).
Muljono, D. H. 1987. The distribution of phosphate fertilizer in Indonesia. Proceedings, National Conference on phosphate fertilizer application. The Centre of Agricultural Research, Bogor. (In Indonesian)
Partohardjono S., Ismunadji, M. and Soepardi, G. 1977. The determination of lowland rice areas in Java which require potassium. The role of research on rice and secondary crops in agricultural development. Proceedings, Symposium I. The Centre of Agricultural Research and Development, Bogor. Book 11: 309-316. (In Indonesian).
Parwoto, 1978. The correction of the status map of Potassium on lowland soils in Java and Madura. Thesis. Faculty of Agriculture, University of Brawidjaya, Malang. (In Indonesian).
Santoso, D. and SUdjadi, M. 1974. Phosphorus deficient paddy soils in Java and Madura. Soil Fertility Report No. 36A. Centre for Soil Research, Bogor. 25 pp. (In Indonesian).
Sulauman, M. Supartini, S. and Sudjadi, M. 1984. Relationship between available sulphur content in soils and lowland rice response. Pembr. Pen. Tanah dan Pupuk. 3, 20-26. (In Indonesian).
Widjaja Adhi, LP.G., 1973. Research in soil fertility in the framework of soil test study for rice. News!. Soil Sci Soc. Indonesia 3, 17-27.

N, S, P and K Status of Soils in the Islands Outside Java
Djoko Santoso~ J. Sri Adiningsih* and Heryadi*
Abstract The islands outside Java are dominated by Red Yellow Podzolic and Organic Soils. The nutrient
status of these soils are less intensively studied than soils in Java, but the soils have a great potential for agricultural expansion. The N, S, P and K status of these soils is discussed with emphasis on the acid mineral soils.
It is concluded that the Red Yellow Podzolic Soils are low in inherent fertility, but these soils can be quite productive so long as adequate nutrients are added and other measures are adopted.
Further studies on Sand P isotherms, leading to the construction of Sand P requirement maps are needed to support agricultural planning and development.
Although ,oil P testing in lowland rice soils in Java is well developed there is a need to extend this research to upland areas on the islands outside Java. Soil tests for S and K need to be developed and calibrated.
THE soils of the islands outside Java are often described as a great reserve for agricultural expansion. The greatest potential for this expansion are the four major islands, Sumatera, Kalimantan, Sulawesi and lrian Jaya (Driessen and Soepraptohardjo 1974). It is estimated that on these islands 79.2 million ha of land with slopes less than 150/0 are considered to be suitable for agricultural expansion (Djaenudin and Sudjadi 1987). These areas consist mainly of two Great Soil Groups, the Red Yellow Podzolics (Ultisol and Oxisol) and the Organic Soils (Histosol) (Driessen and Soepraptohardjo 1974). Red Yellow Podzolic soils cover the greatest area on the islands outside Java (Table 1).
The inherent fertility status of the Red Yellow Podzolic soils depends primarily on the content of organic matter. Under rainforest vegetation the soils have a high organic matter content, but once the forest is cleared and the land is cultivated, soil organic matter decreases rapidly, especially if the top soil layer is eroded. Thus, in general the cultivated Red Yellow Podzolic soils have a low-nutrient content especially for N, S, P and K.
Since not all Red Yellow Podzolic soils are equally suitable for agricultural expansion, it is recommended
• Central Research Institute for Soil Science and Agriclimate, Bogor, Indonesia
77
that soil surveys be conducted prior to any agricultural development (Driessen and Soepraptohardjo 1974).
The Organic soils vary from extremely poor to very rich, depending on the kind and composition of the organic materials. Under appropriate management techniques these soils can be productive and produce crops (Driessen and Soepraptohardjo 1974).
The objective of this paper is to report on the N, S, P and K status of the soils in the islands outside Java with special emphasis on the acid mineral soils.
Nitrogen As a common characteristic the arable soils in the islands outside Java are low in organic matter. This was shown in a recent survey conducted in 16 provinces to support the soybean intensification program (Table 2).
Organic matter content is a very important factor determining inherent fertility status of soils. The amount of N released as the organic matter mineralises will largely determine crop yield. However, to obtain high yields with high-yielding varieties, the N requirement of the crop should be met by fertilizers or manures added to the soils. Recent studies indicate that given proper soil and organic matter management acid upland soils in

Table 1. Distribution and area of four major soils in Indonesia* (,000 ha).
Java Suma- Kali-tera mantan
Soil
Red Yellow Podzolic 325 15.950 14.525 (Ultisol)
Organosol 25 6.781 6.469 (Hitosol)
Alluvial 2.550 6.238 5.644 (Entisol)
Latosol 2.831 6.788 4.469 (InceptisoI/Oxisol)
Other Soils 7.488 11.606 22.893
Total 13.219 47.363 54.000
* Source: Muljadi and Soepraptohardjo, 1975.
Sula- Irian-wesi jaya
1.494 12.001
10.875
1.363 2.575
2.856 356
13.382 16.393
19.095 42.200
Other Islands
3.231
800
1.082
9.956
15.069
Total
47.526
24.150
19.170
18.382
81.715
190.946
Table 2. Total carbon and nitrogen content and C/N ratio of acid mineral soils in Indonesia (TPAK, 1986).
Number Total C Total N Province of C:N
samples Av.* SD* Av. SD
0/0
Aceh 98 1.63 1.20 0.16 0.14 10.2 North Sumatera 64 1.56 1.14 0.14 0.07 11.1 West Sum at era 24 4.05 1.14 0.28 0,43 14.5 Riau 124 2.12 1.09 0.19 0.09 11.2 Jambi 84 1.77 0.72 0.15 0.07 11.8 Bengkulu 12 2.64 1.38 0.25 0.13 10.6 South Sumatera 74 1.58 0.73 0.12 0.06 13.2 Lampung 119 1.48 0,47 0.10 0.03 14.8 West Java 148 1.34 0.73 0.13 0.07 10.3 West Kalimantan 21 2.29 0.63 0.15 0.03 15.3 Central Kalimantan 39 2.05 0,42 0.13 0.03 15.8 East Kalimantan 31 1.49 0.65 0.16 O.ll 9.3 South Kalimantan 41 1.44 0,41 0.12 0.03 12.0 Central Sulawesi 21 2.42 2.39 0.20 0.23 12.1 South Sulawesi 29 2.09 1.38 0.26 0.37 8.0 South-east Sulawesi 103 1.16 0,46 0.12 0.05 9.7
* In this and Tables 4 and 5, Av. and SD are the mean value and standard deviation of the respective soil characteristic.
Indonesia can be continuously productive without significant loss of organic matter. Adiningsih et al. (1988) reported that application of green manure as mulch obtained from tree legumes planted in alleys intercropped with food crops increased organic matter content, improved physical properties and increased productivity of the soil.
Sulfur Information on the S status of the soils in the outer islands of Indonesia is limited. Ismunadji et al. (1983) summarised S studies which had been conducted in Indonesia. Except for a study of tea in Sumatra, other studies conducted in Java and South Sulawesi have
78
been mainly concerned with crop response to S fertilization rather than S status of the soils per se (Ismunadji et al. 1983). Momuat et al. (1977) reported various soil types in South Sulawesi in which responses to S fertilization were observed, but S status of the soils was not given.
S in soils is present both in organic and inorganic forms. However, it is known that most of the S in soils occurs as organic S and becomes available on its mineralisation to sui fate. The low organic matter content of the cultivated soils in the islands outside Java mentioned earlier suggests that they are likely to have low levels of organic S. Mineralisation of this organic S is unlikely to provide adequate levels of plant-available S to high-yielding crops. This problem

250
200
150
~ '" i "0 100 ~ 0
'" Cl
50
0-
-50 0
I f I I
/
/ I
I I
//
/ /
/ /
Merauke, sub soil
/ Merauke, top soil /
/
B. Putus, sub soil
.,...-----~~
___ - B. Putus, topsoil
/~
;// ___ -------=Lampung, subsoil
-------- topsoil
10 20 30 40 50
S in soil solution (ppm)
Figure 1. S isotherm from three top and three sub soils from Indonesia.
may be aggravated by rapid mineralisation of organic matter followed by leaching losses of the resultant sulfate-S in humid tropical areas, where high temperature and high rainfall quantities and intensities are experienced. Leaching losses of sulfateS can be high, particularly in coarse textured soils, alkaline soils, or other soils with low capacity to adsorb S.
Analysis of 21 samples of Red Yellow Podzolic soils taken from different sites outside Java showed that the soils had very low levels of S as water - or phosphate-extractable sui fate in their top as well as sub-soil layer (Table 3, D. Santoso, unpublished data).
Although the Red Yellow Podzolic soils of Indonesia are superficially similar in their characteristics, including their generally low inherent S status, careful study revealed that they differ widely in their capacity to adsorb S. Figure 1 shows that the capacity of the soils to adsorb S varied from low to high, but in general the topsoils had lower capacity than the subsoils.
In contrast with the Red Yellow Podzolic soils, which in general may have low S content, there are acid sulphate soils which contain acid sui fate compounds (pyrite and jarosite) in quantities harmful to plant growth. In southern Kalimantan and on the eastern coast of Sumatra alone it has been estimated that up to 2 million ha of Acid Sulfate or potentially Acid Sulfate soils are present, and presumably some
79
occur along the coasts of Irian Jaya (Driessen and Soepraptohardjo 1974). These soils are difficult to reclaim but they could be used as an alternative SsOurce for other agricultural areas as is the practice in India (Biswas et al. 1986).
Phosphorus Next to nitrogen, phosphorus is the plant nutrient most frequently limiting crop yields in acid mineral soils in the islands outside Java. Analysis of Bray 1 extractable P in soil samples taken from 16 provinces showed very low levels in most provinces, except in West Kalimantan, East Kalimantan, Central Sulawesi and South Sulawesi (Table 4). In these four provinces the mean values of extractable P were high, but the standard deviations were also high, indicating that the P levels varied considerably, and there were samples with zero or approaching-zero values (TPAK, 1986).
The P status of 21 soils from outside Java with generally low S status was variable (Table 3). Bray 1 P levels ranged from 1.8 to 56.4 ppm P and showed little or no relationship with S levels. This may be due to differing organic matter levels and differing fertilizer histories.
Unlike Java the P status of soils on the other areas of Indonesia have not yet been extensively mapped. Unfortunately a P soil test for Red Yellow Podzolic soils has not been well developed. Similarly, the P sorption characteristics of these soils, which directly relate P status and P requirements of the soil, need further studies.
The significance of P sorption by acid soils has been the subject of many studies. The P sorption capacity of soils is a useful criterion for soil fertility assessment. The quantity of P required to attain a standard concentration of 0.2 ppm P in the solution equilibrated with the soil, using the phosphate sorption technique described by Fox and Kamprath (1970), is called the standard P requirement.
It is generally accepted that acid mineral soils of the humid tropics have high phosphate sorption
~_10oo l ~ I -'?> ' ~ al € g Cl
001
P in soil solution (ppm)
Figure 2. P isotherm for three top and three sub soils from Indonesia.
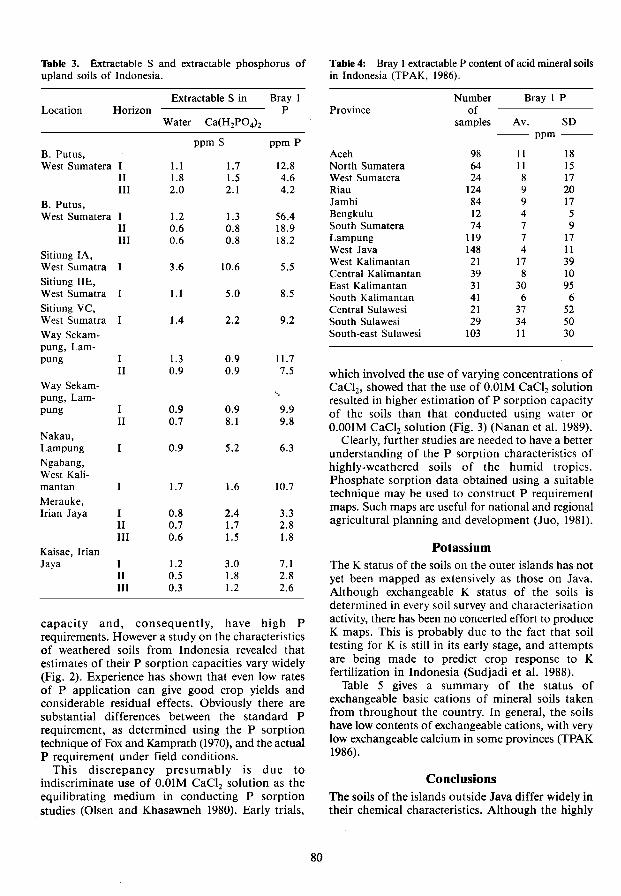
Table 3. Extractable S and extractable phosphorus of upland soils of Indonesia.
Location
B. Putus, West Sumatera
B. Putus, West Sumatera
Sitiung lA, West Sumatra
Sitiung lIE, West Sumatra Sitiung VC, West Sumatra Way Sekam-pung, Lam-pung
Way Sekampung, Lam-
Horizon
I 11 III
I 11 III
I 11
pung I
Nakau, Lampung
Ngabang, West Kalimantan
Merauke,
11
Irian Jaya I
Kaisae, lrian
11 III
Jaya I 11 III
Extractable S in Bray 1 ------------- P Water Ca(H2P04h
ppm S ppm P
I.I 1.7 12.8 1.8 1.5 4.6 2.0 2.1 4.2
1.2 1.3 56.4 0.6 0.8 18.9 0.6 0.8 18.2
3.6 10.6 5.5
1.1 5.0 8.5
1.4 2.2 9.2
1.3 0.9 11.7 0.9 0.9 7.5
c.
0.9 0.9 9.9 0.7 8.1 9.8
0.9 5.2 6.3
1.7 1.6 10.7
0.8 2.4 3.3 0.7 1.7 2.8 0.6 1.5 1.8
1.2 3.0 7.1 0.5 1.8 2.8 0.3 1.2 2.6
capacity and, consequently, have high P requirements. However a study on the characteristics of weathered soils from Indonesia revealed that estimates of their P sorption capacities vary widely (Fig. 2). Experience has shown that even low rates of P application can give good crop yields and considerable residual effects. Obviously there are substantial differences between the standard P requirement, as determined using the P sorption technique of Fox and Kamprath (1970), and the actual P requirement under field conditions.
This discrepancy presumably is due to indiscriminate use of O.OlM CaCl2 solution as the equilibrating medium in conducting P sorption studies (Olsen and Khasawneh 1980). Early trials,
80
Table 4: Bray 1 extractable P content of acid mineral soils in Indonesia (TPAK, 1986).
Province
Aceh North Sumatera West Sumatera Riau Jambi Bengkulu South Sumatera Lampung West Java West Kalimantan Central Kalimantan East Kalimantan South Kalimantan Central Sulawesi South Sulawesi South-east Sulawesi
Number of
samples
98 64 24
124 84 12 74
119 148 21 39 31 41 21 29
103
Bray 1 P
Av. SD --- ppm ---
11 18 11 15 8 17 9 20 9 17 4 5 7 9 7 17 4 11
17 39 8 10
30 95 6 6
37 52 34 50 11 30
which involved the use of varying concentrations of CaCl2, showed that the use of O.OlM CaCl2 solution resulted in higher estimation of P sorption capacity of the soils than that conducted using water or O.OOlM CaCl2 solution (Fig. 3) (Nanan et al. 1989).
Clearly, further studies are needed to have a better understanding of the P sorption characteristics of highly-weathered soils of the humid tropics. Phosphate sorption data obtained using a suitable technique may be used to construct P requirement maps. Such maps are useful for national and regional agricultural planning and development (Juo, 1981).
Potassium The K status of the soils on the outer islands has not yet been mapped as extensively as those on Java. Although exchangeable K status of the soils is determined in every soil survey and characterisation activity, there has been no concerted effort to produce K maps. This is probably due to the fact that soil testing for K is still in its early stage, and attempts are being made to predict crop response to K fertilization in Indonesia (Sudjadi et al. 1988).
Table 5 gives a summary of the status of exchangeable basic cations of mineral soils taken from throughout the country. In general, the soils have low contents of exchangeable cations, with very low exchangeable calcium in some provinces (TPAK 1986).
Conclusions The soils of the islands outside Java differ widely in their chemical characteristics. Although the highly

Table 5. Exchangeable basic cations of acid mineral soil in Indonesia (TPAK, 1986).
Province
Aceh North Sumatera West Sumatera Riau Jambi Bengkulu South Sumatera Lampung West Java West Kalimantan Central Kalimantan East Kalimantan South Kalimantan Central Sulawesi South Sulawesi South-East Sulawesi
Number of
sample
98 64 24
124 84 12 74
119 148
21 39 31 41 21 29
103
Ca
Av. SD
4.32 4.98 1.87 1.26 1.87 1.26 2.96 3.35 1.17 2.05 1.08 0.54 1.41 3.74 1.03 0.07 6.90 5.76 0.71 0.33 0.82 0.41 2.53 4.06 1.46 0.70 2.67 2.34 4.66 6.39 3.45 4.02
weathered acidic Red Yellow Podzolic soils cover a vast area, a substantial area is covered by Organic soils, Alluvial and Latosols.
The nutrient status of the soils of the islands outside Java has not yet been studied as intensively as those of Java; however, the soils have great potential for agricultural expansion. The Red Yellow Podzolic soils are low in inherent fertility but their great potential for crop production can be tapped so long as adequate nutrients are replenished and other measures are adopted.
Soil-testing techniques for S, P and K should be developed. Further studies on Sand P isotherms, leading to the construction of Sand P maps, are needed to support agricultural planning and development.
References Adiningsih, S.J., Sudjadi, M. and Sri Rochayati. 1988.
Organic recycling in Indonesia. Agro-Chemicals News in Brief. ESCAP/FAO/UNIDO. 33-38.
Biswas, B.c., Satish Maheshwari and Yadav, D.S. 1986. Use of indigenous sources of sulphur in Indian agriculture. In: Sulphur in Indian Agriculture. The Sulphur Institute, Washington, D.C.
Djaenudin, D. and Sudjadi, M. 1987. Reserve of land resources for agriculture in the four major islands for the year 2000. Journal Litbang Pertanian. VI (3), 55-61 (in Indonesian).
Driessen, P.M. and Soepraptohardjo, M. 1974. Soils for agricultural expansion in Indonesia. Bulletin 1. ATA 106. Center for Soil Research, Bogor, Indonesia.
81
Mg K Na
Av. SD Av. SD Av. SD
meq/lOOg soil
1.94 1.98 0.22 0.18 0.16 0.20 0.58 0.42 0.36 0.74 0.18 0.25 0.82 1.24 0.13 0.10 0.20 0.12 0.87 0.77 0.15 0.08 0.14 0.10 0.55 0.68 0.13 0.15 0.19 0.22 0.55 0.32 0.13 0.07 0.13 0.14 0.36 0.44 0.14 0.\3 0.12 0.06 0.35 0.16 0.10 0.06 0.12 0.07 3.46 3.27 0.30 0.39 0.17 0.12 0.37 0.20 0.10 0.05 0.10 0.07 0.26 0.20 0.11 0.09 0.12 0.06 0.94 1.17 0.25 0.13 0.11 0.04 0.40 0.26 0.10 0.07 0.07 0.06 1.22 1.37 0.24 0.18 0.12 0.06 1.66 2.76 0.16 0.10 0.16 0.19 1.08 1.35 0.19 0.13 0.27 0.46
Fox, R.L. and Kamprath, E.J. 1970. Phosphate sorption isotherms for evaluating P requirements of soils. Proceedings, Soil Science Society of America 34, 902-907.
Ismunadji, M., Blair, G.l., Momuat, E. and Sudjadi, M. 1983. Sui fur in the agriculture of Indonesia. In: Blair, G.l. and Till, A.R. (ed.), S in S.E. Asian and S. Pacific Agriculture. 165-179.
Juo, A.S.R. 1981. Chemical characteristics. In: Greenland, D.J. (ed.) Characterization of Soils in Relation to Their Classification and Management for Crop Production : Examples from Some Areas of the Humid Tropics 51-79.
300
250
200
"£ ~ "- 150 3 "0 W e 0
'" 100 "-
50
0 0.01 0.1
P in soil solution (ppm)
Figure 3. Phosphate sorption isotherm of Podzolic soil from Kentrong, West Java, in different CaClz concentrations.

Momuat, E. 0., Mamaril, C. P., Umar A. P. and Momuat, Ch. J. S. 1977. Sulphur deficiency and correction in lowland rice in South Sulawesi. In: Proceedings, Symposium on the Role of Research in Lowland Rice and Upland Crops in Agriculture Development. Maros, 26-29 September 1977. Central Research Institute for Food Crops, BOgOT, Indonesia 295-307. (in Indonesian).
Muljadi, D. and Soepraptohardjo, M. 1975. Problems on acreage and distribution data of marginal soils. Proceedings Symposium Prevention and Restoration of Marginal soils for Regional Development Centre for Soil Research. Jakarta, 27-29 October 1975 (in Indonesian).
Nanan, S.M., Djoko Santoso and Widjaja-Adhi, [ P.G. 1989. Phosphate sorption of Indonesian soils using different concentrations of CaCl2 solution as the equilibrating medium. Proceedings Technical Meeting, Bogor, Indonesia. Centre for Soil Research (in Press).
82
Olsen, S.R. and Khasawneh, F.E. 1980. Use and limitations of physical-chemical criteria for assessing the status of phosphorus in soils. In: Khasawneh, F.E., Sample, E.C. and Kamprath, E.J. (ed.). The Role of Phosphorus in Agriculture. ASA, CSSA, SSSA. Madison, Wise., U.S.A. 361-410.
Sudjadi, M., Sri Adiningsih, J. and Gill, D. W. 1988. Potassium availability in soils of Indonesia. In: Potassium in the Agricultural System of the Humid Tropic. Proceedings 19th Colloquium of the International Potash Institute. 185-196.
TPAK (Team Penelaah Analisa Kimia). 1986. The second report on chemical analysis of soil samples from survey for food crops development and mapping of liming rate. Center for Soil Research and Rice and Upland Crops Development Project, Director General of Food Crops. 29 pp. (in Indonesian).

N, P, K and S Status of Food Crops in Islands Outside Java
M. Ismunadji*
Abstract Agricultural expansion has to take place on islands outside Java, since there is no more land
available for agricultural expansion in already densely populated Java. The limitation to this is that most soils are marginal or problem soils. Low N, P-deficiency, low bases, Al toxicity, low pH, poor physical characteristics and swampy areas are major constraints to crop production in many locations in these islands.
N-deficiency occurs on almost all soil in Indonesia and whilst insufficient N is applied in many areas of the outer island overuse of N could be becoming a problem in Java.
P-deficiency is widespread particularly on the Red Yellow Podzolic soils which cover extensive areas of the outer islands. As with N, overuse of P may be occurring in Java whilst underuse is a major limitation in many outer islands.
K and Zn have been shown to be important in alleviating Fe toxicity in rice grown on marginal soils of the outer islands.
The lack of systematic studies of S make it difficult to estimate the magnitude of this nutrient deficiency.
THE government policy to increase food crop production is through intensification, extensification, diversification and rehabilitation. The Indonesian intensification program to date is considered to have been successful, particularly on Java. However, problems are arising in some areas of Java due to fertilizer imbalance. This subject is discussed elsewhere in these proceedings. Agricultural expansion has to take place on islands outside Java, since there is no more land available for agricultural expansion in already densely populated Java. It is known that Java is more fertile compared to the other islands, where most of the soils are Red Yellow Podzolics, Histosols, and Alluvials. There are also swampy and tidal areas which have particular development problems.
As a result crops grown in these areas are subjected to various stresses, such as nutrient deficiencies and toxicities, flooding, drought and serious pest and disease incidence due to nutritional imbalance. Most soils are deficient in N. Phosphate deficiency, Al toxicity, low pH, low bases and poor physical
* Bogor Research Institute for Food Crops, Bogor, Indonesia
83
characteristics are major constraints to crop production in acid mineral soils. Salinity is another constraint on coastal plains and S-deficiency is a problem on some soils.
In this paper information is presented on the nutrient status of food crops, especially rice, based on research, observation, and other available information.
Nitrogen
Nitrogen is the most important of the four major nutrients (N, P, K and S) for crop production. Nitrogen derives from organic matter and most mineral soils throughout Indonesia are deficient in N. Because of this N is always applied to food crops to obtain high yields. The importance of N in crop production is reflected in consumption figures which show its high use relative to other nutrients (see Ismunadji, these Proceedings).
Since research on N-fertilizer efficiency was initiated by Ismunadji et al. (1973), numerous Nfertilizer efficiency experiments in lowland rice have been conducted during the last 15 years. Ismunadji et al. (1973) showed that with the present practice of
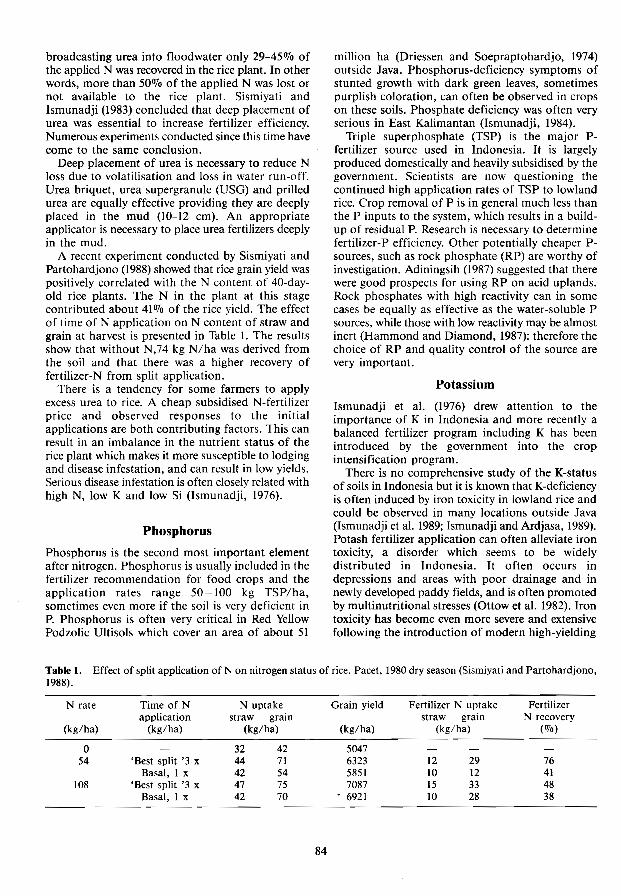
broadcasting urea into floodwater only 29-45070 of the applied N was recovered in the rice plant. In other words, more than 50% of the applied N was lost or not available to the rice plant. Sismiyati and Ismunadji (1983) concluded that deep placement of urea was essential to increase fertilizer efficiency. Numerous experiments conducted since this time have come to the same conclusion.
Deep placement of urea is necessary to reduce N loss due to volatilisation and loss in water run-off. Urea briquet, urea supergranule (USG) and prilled urea are equally effective providing they are deeply placed in the mud (10-12 cm). An appropriate applicator is necessary to place urea fertilizers deeply in the mud.
A recent experiment conducted by Sismiyati and Partohardjono (1988) showed that rice grain yield was positively correlated with the N content of 40-dayold rice plants. The N in the plant at this stage contributed about 41% of the rice yield. The effect of time of N application on N content of straw and grain at harvest is presented in Table L The results show that without N,74 kg N/ha was derived from the soil and that there was a higher recovery of fertilizer-N from split application.
There is a tendency for some farmers to apply excess urea to rice. A cheap subsidised N-fertilizer price and observed responses to the initial applications are both contributing factors. This can result in an imbalance in the nutrient status of the rice plant which makes it more susceptible to lodging and disease infestation, and can result in low yields. Serious disease infestation is often closely related with high N, low K and low Si (lsmunadji, 1976).
Phosphorus
Phosphorus is the second most important element after nitrogen. Phosphorus is usually included in the fertilizer recommendation for food crops and the application rates range 50 -100 kg TSP/ha, sometimes even more if the soil is very deficient in P. Phosphorus is often very critical in Red Yellow Podzolic UItisols which cover an area of about 51
million ha (Driessen and Soepraptohardjo, 1974) outside Java. Phosphorus-deficiency symptoms of stunted growth with dark green leaves, sometimes purplish coloration, can often be observed in crops on these soils. Phosphate deficiency was often very serious in East Kalimantan (Ismunadji, 1984).
Triple superphosphate (TSP) is the major Pfertilizer source used in Indonesia. It is largely produced domestically and heavily subsidised by the government. Scientists are now questioning the continued high application rates of TSP to lowland rice. Crop removal of P is in general much less than the P inputs to the system, which results in a buildup of residual P. Research is necessary to determine fertilizer-P efficiency. Other potentially cheaper Psources, such as rock phosphate (RP) are worthy of investigation. Adiningsih (1987) suggested that there were good prospects for using RP on acid uplands. Rock phosphates with high reactivity can in some cases be equally as effective as the water-soluble P sources, while those with low reactivity may be almost inert (Hammond and Diamond, 1987): therefore the choice of RP and quality control of the source are very important.
Potassium
Ismunadji et at. (1976) drew attention to the importance of K in Indonesia and more recently a balanced fertilizer program including K has been introduced by the government into the crop intensification program.
There is no comprehensive study of the K-status of soils in Indonesia but it is known that K-deficieoey is often induced by iron toxicity in lowland rice and could be observed in many locations outside Java (lsmunadji et al. 1989; Ismunadji and Ardjasa, 1989). Potash fertilizer application can often alleviate iron toxicity, a disorder which seems to be widely distributed in Indonesia. It often occurs in depressions and areas with poor drainage and in newly developed paddy fields, and is often promoted by multinutritional stresses (Ottowet al. 1982). Iron toxicity has become even more severe and extensive following the introduction of modern high-yielding
Table 1. Effect of split application of N on nitrogen status of rice. Pacet, 1980 dry season (Sismiyati and Partohardjono, 1988).
N rate Time of N N uptake Grain yield Fertilizer N uptake Fertilizer application straw grain straw grain N recovery
(kg/ha) (kg/ha) (kg/ha) (kg/ha) (kg/ha) (070)
0 32 42 5047 54 'Best split '3 x 44 71 6323 12 29 76
Basal, I x 42 54 5851 10 12 41 108 'Best split '3 x 47 75 7087 15 33 48
Basal, 1 x 42 70 6921 10 28 38
84
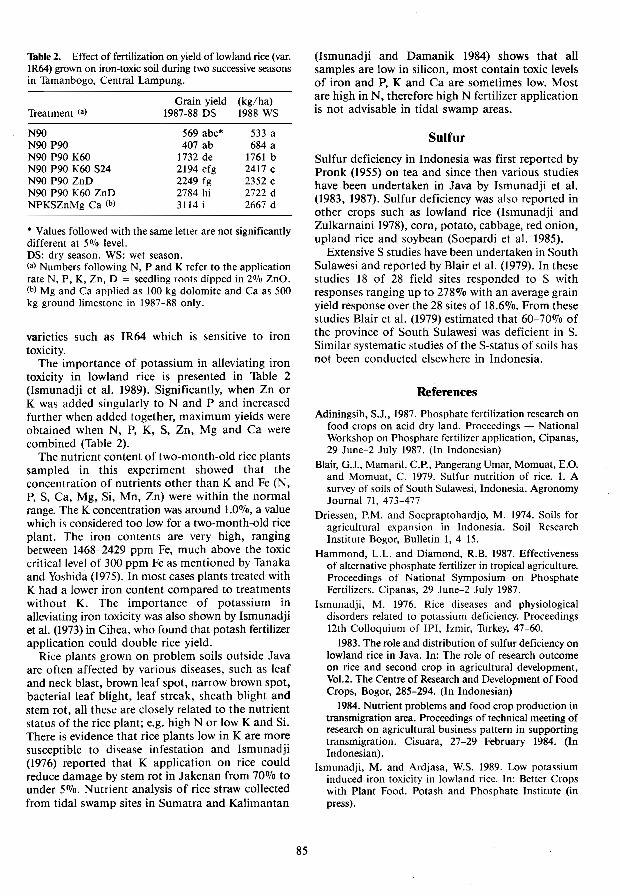
Table 2. Effect of fertilization on yield of lowland rice (var. IR64) grown on iron-toxic soil during two successive seasons in Tamanbogo, Central Lampung.
Grain yield (kg/ha) Treatment (a) 1987-88 DS 1988 WS
N90 569 abc* 533 a N90 P90 407 ab 684 a N90 P90 K60 1732 de 1761 b N90 P90 K60 S24 2194 efg 2417 c N90 P90 ZnD 2249 fg 2352 c N90 P90 K60 ZnD 2784 hi 2722d NPKSZnMg Ca (b) 3114i 2667 d
* Values followed with the same letter are not significantly different at 51110 level. DS: dry season. WS: wet season. (a) Numbers following N, P and K refer to the application rate N, P, K, Zn, D seedling roots dipped in 2UJo ZnO. (b) Mg and Ca applied as 100 kg dolomite and Ca as 500 kg ground limestone in 1987-88 only.
varieties such as IR64 which is sensitive to iron toxicity.
The importance of potassium in alleviating iron toxicity in lowland rice is presented in Table 2 (Ismunadji et al. 1989). Significantly, when Zn or K was added singularly to Nand P and increased further when added together, maximum yields were obtained when N, P, K, S, Zn, Mg and Ca were combined (Table 2).
The nutrient content of two-month-old rice plants sampled in this experiment showed that the concentration of nutrients other than K and Fe (N, P, S, Ca, Mg, Si, Mn, Zn) were within the normal range. The K concentration was around 1.0070, a value which is considered too low for a two-month-old rice plant. The iron contents are very high, ranging between 1468-2429 ppm Fe, much above the toxic critical level of 300 ppm Fe as mentioned by Tanaka and Yoshida (1975). In most cases plants treated with K had a lower iron content compared to treatments without K. The importance of potassium in alleviating iron toxicity was also shown by Ismunadji et al. (1973) in Cihea, who found that potash fertilizer application could double rice yield.
Rice plants grown on problem soils outside Java are often affected by various diseases, such as leaf and neck blast, brown leaf spot, narrow brown spot, bacterial leaf blight, leaf streak, sheath blight and stem rot, all these are closely related to the nutrient status of the rice plant; e.g. high N or low K and Si. There is evidence that rice plants low in K are more susceptible to disease infestation and Ismunadji (1976) reported that K application on rice could reduce damage by stem rot in Jakenan from 70070 to under 56/0. Nutrient analysis of rice straw collected from tidal swamp sites in Sumatra and Kalimantan
85
(Ismunadji and Damanik 1984) shows that all samples are low in silicon, most contain toxic levels of iron and P, K and Ca are sometimes low. Most are high in N, therefore high N fertilizer application is not advisable in tidal swamp areas.
Sulfur
SuI fur deficiency in Indonesia was first reported by Pronk (1955) on tea and since then various studies have been undertaken in Java by lsmunadji et al. (1983, 1987). SuIfur deficiency was also reported in other crops such as lowland rice (Ismunadji and Zulkarnaini 1978), corn, potato, cabbage, red onion, upland rice and soybean (Soepardi et al. 1985).
Extensive S studies have been undertaken in South Sulawesi and reported by Blair et al. (1979). In these studies 18 of 28 field sites responded to S with responses ranging up to 278070 with an average grain yield response over the 28 sites of 18.6070. From these studies Blair et al. (1979) estimated that 60-70070 of the province of South Sulawesi was deficient in S. Similar systematic studies of the S-status of soils has not been conducted elsewhere in Indonesia.
References
Adiningsih, S.J., 1987. Phosphate fertilization research on food crops on acid dry land. Proceedings - National Workshop on Phosphate fertilizer application, Cipanas, 29 June-2 July 1987. (In Indonesian)
Blair, G.J., Mamaril, C.P., Pangerang Umar, Momuat, E.O. and Momuat, C. 1979. Sulfur nutrition of rice. 1. A survey of soils of South Sulawesi, Indonesia. Agronomy Journal 71, 473-477
Driessen, P.M. and Soepraptohardjo, M. 1974. Soils for agricultural expansion in Indonesia. Soil Research Institute Bogor, Bulletin 1, 4-15.
Hammond, L.L. and Diamond, R.B. 1987. Effectiveness of alternative phosphate fertilizer in tropical agriculture. Proceedings of National Symposium on Phosphate Fertilizers. Cipanas, 29 June-2 July 1987.
Ismunadji, M. 1976. Rice diseases and physiological disorders related to potassium deficiency. Proceedings 12th Colloquium of IP!, Izmir, Turkey, 47-60.
1983. The role and distribution of sulfur deficiency on lowland rice in Java. In: The role of research outcome on rice and second crop in agricultural development, Vol.2. The Centre of Research and Development of Food Crops, Bogor, 285-294. (In Indonesian)
1984. Nutrient problems and food crop production in transmigration area. Proceedings of technical meeting of research on agricultural business pattern in supporting transmigration. Cisuara, 27-29 February 1984. (In Indonesian).
Ismunadji, M. and Ardjasa, W.S. 1989. Low potassium induced iron toxicity in lowland rice. In: Better Crops with Plant Food. Potash and Phosphate Institute (in press).

Ismunadji, M., Ardjasa, W.S. and Von Uexkull, H.R. 1989 Increasing productivity of lowland rice grown on iron toxic soils. International symposium on rice production on acid soils of the tropics, Kandhi, Sri Lanka, 26-30 June 1989.
Ismunadji, M., Blair, G.J., Momuat, E. and Sudjadi, M. 1983. Sulfur in the agriculture of Indonesia. In: Blair, G.J. Land Till, A.R. (ed.), Sulfur in S.E. Asian and South Pacific agriculture, Armidale University of New England, 165-179.
Ismunadji, M. and Damanik, M. 1984. The nutrient status of tidal swamp rice in Kalimantan and Sumatra, Indonesia. In: Workshop on research priorities in tidal swamp rice, International Rice Research Institute, 161-165.
Ismunadji, M., Makarim, A.K. and Rushadi, A. 1987. Status report on the role of sulphur as a plant nutrient in Indonesia. Proceedings symposium on fertilizer sulphur requirements and sources in developing countries of Asia and the Pacific, Bangkok, 26-30 January 1987, 31-37.
Ismunadji, M., Makarim, A.K. and Purwoatmodjo, P. 1986. The effect of sulfur and phosphorus on nutrient status and growth of lowland rice on 'Secang' Latolsol soil. Bogor Food Crop Research Institute. Seminar 17-18 December 1986. (In Indonesian).
Ismunadji, M., Soepardi G, Satari, A.M. and Muljadi, D. 1976 Potassium and food crops: problems and prospects. Agricultural Research Centre Institute, Special Edition 2, 162. (In Indonesian).
Ismunadji, M. and Zulkarnaini, L 1978. Sulphur deficiency
86
of lowland rice in Indonesia. Sulphur in Agriculture 2, 17-19.
Ismunadji, M., Zulkamaini, I., Prawirosamudro, A. and Yazawa, F. 1973. Productivity of some major Java soils with special reference to yield and nitrogen nutrition of lowland rice. Contr. Central Research Institite of Agriculture, Bogor 5, 1-12.
Ottow, J.C.G., Benckiser, G. and Watanabe, L 1982. Iron toxicity as a multinutritional stress. International symposium on distribution, characteristics and utilization of problem soils. Tropical Agriculture Research Series 15, 167-179.
Pronk, F. 1955. Nitrogen fertilizer experiments on tea in Sumatra. Arch. Theecult. 19, 115-150.
Sisrruyati, R. and Ismunadji, M. 1983. The effort to increase Nitrogen fertilization efficiency on lowland rice. In: The role of research outcome on rice and second crop in agricultural development. Proceedings of symposium, Maros, 26-29 September 1977. 2, 317-324. (In Indonesian).
Sismiyati, R. and Partohardjono, S. 1988. The status of Nitrogen nutrient on lowland rice in relation to the fertilizer efficiency. Symposium of food crop research, CHoto, 21-23 March 1988. (In Indonesian).
Soepardi, S., lsmunadji, M. and Partohardjono, S. 1985. Towards balanced fertilization in order to increase the quantity and quality of agriculture production. Directorate General of Food Crop Agriculture, Jakarta. (In Indonesian).
Tanaka, A. and Yoshida, S. 1975 Nutritional disorders of the rice plant in Asia. IRRI, Technical Bulletin 10.

S Research on Rice in Indonesia
M. Ismunadji*
Abstract Deficiency is a problem of increasing importance in rice production in Indonesia. Intensification
of agriculture, the change from AS (24070 S) to S-free urea and from SSP (12670 S) to TSP (1-2670 S), the use of HYV's, less use of organic fertilizers and removal of crop residues promote sulfur deficiency in lowland rice. Sulfur application can affect yield, yield components and grain quality. Surveys have a shown that 31070 of rice plant samples collected from Java were deficient, 45070 marginal and only 25070 sufficient in S. More than 50% of irrigation water samples collected contained less than 3 ppm S. From these surveys it is estimated that S deficiency could occur on an area of about 574 000 ha which could be harvested once a year and 568 000 ha twice a year. The magnitudes for the marginal sulfur status are 828 000 ha and 940 000 ha respectively.
Ammonium sui fate is the main S-containing fertilizer used by farmers, produced domestically and cheap because of government subsidy. Research indicates that potassium suI fate, gypsum, ammonium sulfate and elemental S are equally effective as S sources for rice.
RICE is the staple food of most Indonesians and rice cropping the major consumer of fertilizers. Indonesia is now entering the fifth phase of the Five-year Development Plan and agriculture remains the highest priority. Population pressure has forced the government to introduce an intensification program and agricultural expansion to produce more food to meet the population's requirements.
During the 1969-1989 period, the contribution of agricultural intensification to national development was clearly demonstrated by the success in rice production. Since 1984 Indonesia has transformed itself from the world's largest rice importer to being virtually self-sufficient in rice production. Between 1969 and 1987 rice production increased from lOA to 27.5 million tonnes. The increase has been achieved partly by agricultural expansion, but to a larger extent by intensification, with the use of high yielding varieties (HYVs), better cultural practices, water management and crop protection, and increased use of fertilizers.
Occurrence of S Deficiency
Responses to sulfur are widespread in the tropics and recorded in many countries (Blair et al. 1979). Sulfur
• Bogor Research Institute for Food Crops, p.o. Box 368, Bogor, Indonesia.
87
deficiency in rice was first recognised in Java (Yoshida and Chaudry 1972; Leijder and Aldjabri 1972; Ismunadji et al. 1975).
The past use of ammonium sulfate (24010 S) as a nitrogen source has masked S needs in lowland rice. The occurrence of S deficiency in rice has increased because of intensification of agriculture, the change from ammonium sui fate (24% S) to S-free urea as the N-source and from SSP (12% S) to TSP (1-2070 S), use of modern HYVs, less use of organic manures, multiple cropping and removal of crop residues for eattle feed or raw materials for industry. Because of this, S is becoming increasingly important for food cropping.
The modification of rice intensification into the SUPRA INSUS program with ample supply of inputs promotes the use of S-fertilizers to meet the high yield-target. The present fertilizer recommendation for SUPRA INSUS is 200 kg urea, 100 kg TSP, 75-100 kg KCl and 100 kg AS per hectare for the high yield target of 9 tlha rough rice.
Kamprath et al. (1956) demonstrated that P application reduced sulfate adsorption and because of this could induce S deficiency through leaching losses. Soils in the humid tropics are subjected to high moisture percolation and leaching due to heavy rain and Pearson et al. (1962) have indicated that 90% of water soluble bases were leached as sui fate.
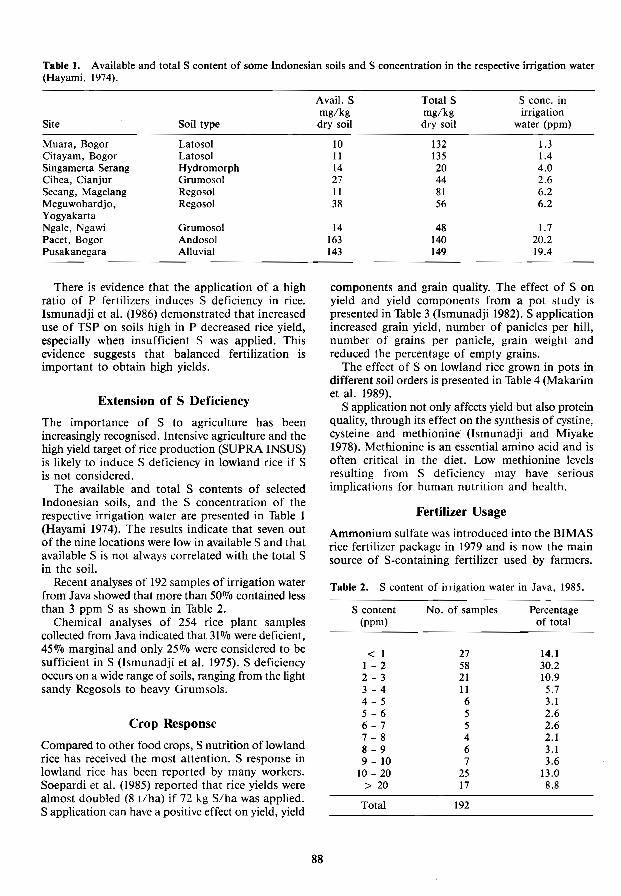
Table 1. Available and total S content of some Indonesian soils and S concentration in the respective irrigation water (Hayarni, 1974).
Site Soil type
Muara, Bogor Latosol Citayam, Bogor Latosol Singamerta Serang Hydromorph Cihea, Cianjur Grumosol Secang, Magelang Regosol Meguwohardjo, Regosol Yogyakarta Ngale. Ngawi Grumosol Pacet, Bogor Andosol Pusakanegara Alluvial
There is evidence that the application of a high ratio of P fertilizers induces S deficiency in rice. Ismunadji et al. (1986) demonstrated that increased use of TSP on soils high in P decreased rice yield, especially when insufficient S was applied. This evidence suggests that balanced fertilization is important to obtain high yields.
Extension of S Deficiency
The importance of S to agriculture has been increasingly recognised. Intensive agriculture and the high yield target of rice production (SUPRA INSUS) is likely to induce S deficiency in lowland rice if S is not considered.
The available and total S contents of selected Indonesian soils, and the S concentration of the respective irrigation water are presented in Table 1 (Hayami 1974). The results indicate that seven out of the nine locations were low in available S and that available S is not always correlated with the total S in the soil.
Recent analyses of 192 samples of irrigation water from Java showed that more than 506,1Q contained less than 3 ppm S as shown in Table 2.
Chemical analyses of 254 rice plant samples collected from Java indicated that 316,10 were deficient, 45% marginal and only 25% were considered to be sufficient in S (Ismunadji et al. 1975). S deficiency occurs on a wide range of soils, ranging from the light sandy Regosols to heavy Grumsols.
Crop Response
Compared to other food crops, S nutrition of lowland rice has received the most attention. S response in lowland rice has been reported by many workers. Soepardi et a!. (1985) reported that rice yields were almost doubled (8 t/ha) if 72 kg S/ha was applied. S application can have a positive effect on yield, yield
Avail. S Total S S conc. in mg/kg mg/kg irrigation dry soil dry soil water (ppm)
88
10 132 1.3 11 135 1,4 14 20 4.0 27 44 2.6 11 81 6.2 38 56 6.2
14 48 1.7 163 140 20.2 143 149 19.4
components and grain quality. The effect of S on yield and yield components from a pot study is presented in Table 3 (Ismunadji 1982). S application increased grain yield, number of panicles per hill, number of grains per panicle, grain weight and reduced the percentage of empty grains.
The effect of S on lowland rice grown in pots in different soil orders is presented in Table 4 (Makarim et al. 1989).
S application not only affects yield but also protein quality, through its effect on the synthesis of cystine, cysteine and methionine (lsmunadji and Miyake 1978). Methionine is an essential amino acid and is often critical in the diet. Low methionine levels resulting from S deficiency may have serious implications for human nutrition and health.
Fertilizer Usage
Ammonium sulfate was introduced into the BIMAS rice fertilizer package in 1979 and is now the main source of S-containing fertilizer used by farmers.
Table 2. S content of irrigation water in Java, 1985.
S content No. of samples Percentage (pp m) of total
< I 27 14.1 1 - 2 58 30.2 2 - 3 21 10.9 3 4 11 5.7 4 5 6 3.1 5-6 5 2.6 6 - 7 5 2.6 7 - 8 4 2.1 8 - 9 6 3.1 9 - 10 7 3.6
10 20 25 13.0 > 20 17 8.8
Total 192
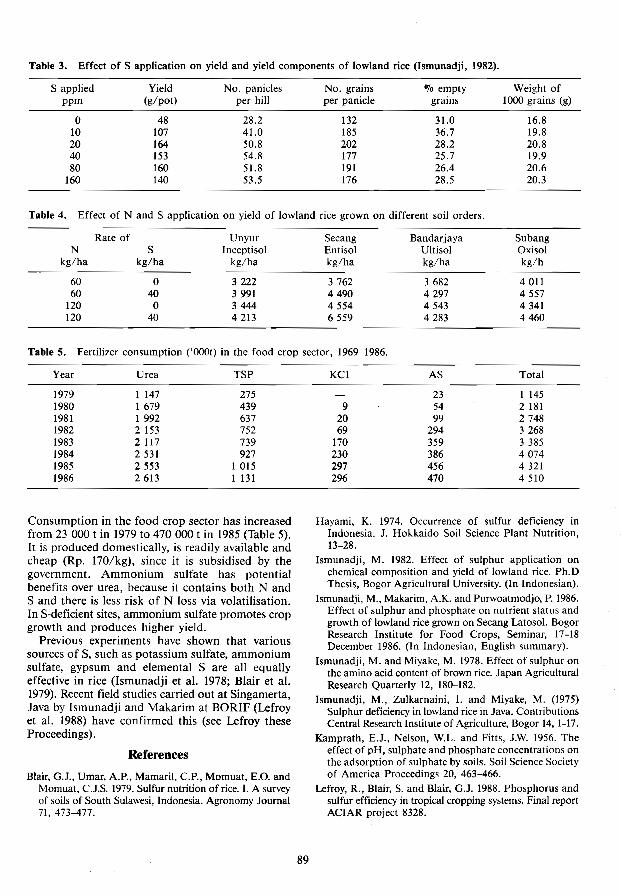
Table 3. Effect of S application on yield and yield components of lowland rice (Ismunadji, 1982).
S applied Yield No. panicles No. grains lIJo empty Weight of ppm (g/pot) per hill per panicle grains 1000 grains (g)
0 48 28.2 132 31.0 16.8 10 107 41.0 185 36.7 19.8 20 164 50.8 202 28.2 20.8 40 153 54.8 177 25.7 19.9 80 160 51.8 191 26.4 20.6
160 140 53.5 176 28.5 20.3
Table 4. Effect of Nand S application on yield of lowland rice grown on different soil orders. ----..... --~
Rate of Unyur Secang Bandarjaya Subang N S Inceptisol Entisol Ultisol Oxisol
kg/ha kg/ha kg/ha kg/ha kg/ha kg/h
60 0 3222 3762 3682 4011 60 40 3991 4490 4297 4557
120 0 3444 4554 4543 4341 120 40 4213 6559 4283 4460
Table 5. Fertilizer consumption ('OOOt) in the food crop sector, 1969-1986.
Year Urea TSP
1979 I 147 275 1980 I 679 439 1981 I 992 637 1982 2 153 752 1983 2 117 739 1984 2531 927 1985 2553 1 015 1986 2613 1 131
----....
Consumption in the food crop sector has increased from 23 000 t in 1979 to 470 000 t in 1985 (Table 5). It is produced domestically, is readily available and cheap (Rp. l70/kg), since it is subsidised by the government. Ammonium sulfate has potential benefits over urea, because it contains both Nand S and there is less risk of N loss via volatilisation. In S-deficient sites, ammonium sulfate promotes crop growth and produces higher yield.
Previous experiments have shown that various sources of S, such as potassium sulfate, ammonium suI fate, gypsum and elemental S are all equally effective in rice (Ismunadji et al. 1978; Blair et al. 1979). Recent field studies carried out at Singamerta, Java by Ismunadji and Makarim at BORIF (Lefroy et al. 1988) have confirmed this (see Lefroy these Proceedings).
References
B1air, G.l., Umar, A.P., Mamaril, C.P., Momuat, E.O. and Momuat, C.lS. 1979. Sulfur nutrition of rice. l. A survey of soils of South Sulawesi, Indonesia. Agronomy Journal 71, 473-477.
89
KCl AS Total
23 1 145 9 54 2 181
20 99 2748 69 294 3268
170 359 3385 230 386 4074 297 456 4321 296 470 4510
Hayami, K. 1974. Occurrence of sulfur deficiency in Indonesia. J. Hokkaido Soil Science Plant Nutrition, 13-28.
Ismunadji, M. 1982. Effect of sulphur application on chemical composition and yield of lowland rice. Ph.D Thesis, Bogor Agricultural University. (In Indonesian).
Ismunadji, M., Makarim, A.K. and Purwoatmodjo, P. 1986. Effect of sulphur and phosphate on nutrient status and growth of lowland rice grown on Secang Latosol. Bogor Research Institute for Food Crops, Seminar, 17-18 December 1986. (In Indonesian, English summary).
Ismunadji, M. and Miyake, M. 1978. Effect of sulphur on the amino acid content of brown rice. Japan Agricultural Research Quarterly 12, 180-182.
Ismunadji, M., Zulkarnaini, I. and Miyake, M. (1975) Sulphur deficiency in lowland rice in Java. Contributions Central Research Institute of Agriculture, Bogor 14, 1-17.
Kamprath, E.J., Nelson, W.L. and Fitts, J.w. 1956. The effect of pH, sulphate and phosphate concentrations on the adsorption of sulphate by soils. Soil Science Society of America Proceedings 20, 463-466.
Lefroy, R., Blair, S. and Blair, G.J. 1988. Phosphorus and sulfur efficiency in tropical cropping systems. Final report ACIAR project 8328.

Leijder, R.A. and Aldjabri, M. 1972. Sulphur deficiency under conditions of wet rice cultivation, with specific reference to a Vertisol near Ngawi, East Java. Newsletter Soil Study Group Bogor 112, 21-29.
Makarim, A.K., Ismunadji, M. and Von Vexkull, H.R. 1989. Nutritional constraints on rice production on acid soils in Indonesia. International Symposium on rice production on acid soils of the tropics, Kandy, Sri Lanka, 26-30 June 1989.
Mamaril, c.P., Vmar, A.P., Manwan, 1. and Momuat, C.J.S. 1976. Sulfur response of lowland rice in South
90
Sulawesi, Indonesia. Contribution Central Research Institute of Agriculture, Bogor 22, 1-12.
Pearson, R.W., Abruna, F. and Vincente-Chandler, J. 1962. Effect of lime and nitogen applications on downward movement of calcium and magnesium in two humid tropical soils from Puerto Rico. Soil Science 93, 77-82.
Soepardi, G., Ismunadji, M. and Partohardjono, S. 1985. Toward balanced fertilization to-increase quality and yield of crops. Directorate General of Food Crops, Jakarta. (In Indonesian).

S Research on Upland Crops in Indonesia
A. K. Makarim*
Abstract As a consequence of limited research on upland crops in Indonesia information about the
sulfate status of these soils is limited. Soil S levels vary from very low to very high but appear generally to be adequate for upland crops under present management regimes. Measurements of the S-content of different crops and plant parts within crops suggest there is a variation in S requirements.
As a general rule the higher the grain yield, irrespective of crop, the greater the rate of soil-S depletion and consequently the greater the need for sulfur addition. A three-year experiment demonstrated a significant response of upland crops (rice, cowpea, corn, Dolichos lab lab and soybean) to S application in both field and pot experiments with the exception of corn at Mnneng and soybean at Ngale.
Large variations in soil condition, climate and crop management suggest that there are probably areas of undetected S-deficiency in Indonesia. More research on S is needed. To be successful this research needs to be systematic and comprehensive.
THERE are few studies on the S requirements of upland crops in Indonesia compared to the number in flooded rice. Under upland conditions, organic S mineralises to sulfate which is available to crops and is susceptible to leaching.
In acid upland soils, S is retained on the surface of iron and aluminum compounds and held there against leaching. In many tropical soils, S adsorption increases with depth because of higher Fe and Al contents (Kamprath et al. 1957). Liming can decrease sui fate retention in tropical soils due to the loss of surface positive charge. In the absence of leaching, liming can increase the S availability (EIkins and Ensminger 1971). Application of P can also increase water-soluble sulfate and the effects are more pronounced in higher S sorption capacity soils (Santoso 1987).
S Levels in Upland Soil
A recent study conducted in Indonesia indicates that out of 88 soil samples taken from Lampung province, 30070 were low in ammonium acetate extractabIe-S
* Bogor Research Institute for Food Crops Jalan Cimmungu, Bogor, West Java, Indonesia
91
( < 30 mg S/kg) and 50070 less than 50 mg S/kg. The extractable-S level of the soils varied between 2.8 and 22.8 mg S/kg (Ismunadji and Partohardjono 1986).
Yazawa (1985) collected 55 soil samples from upland soils of Java and Sumatra. The S status of the soils is presented in Table 1. In West Java 6 out of 17 samples are low in S, whereas in Central Java 11 out of 13 and in East Java 11 out of 15 are low in S. These data suggest that soils from Java are more likely to be S-deficient for upland crops than those from West Java. Soils in Java generally have lighter texture and higher pH than those in W. Java.
S status of soils in tidal swamp areas that have beert cleared in Karang Agung, South Sumatra were found to vary from 1.41 to 813.2 mg S/kg. The mean value of extractable-S for 11 samples of peat soils was found to be 235.7 mg S/kg, compared to 226.6 mg S/kg in 47 mineral soils.
More research on soil-S status in Indonesia is needed and studies relating soil-S levels to S uptake are practically non-existent. The S status of soils in the drier areas of eastern Indonesia need to be studied. Areas of S deficiency need to be delineated in a systematic manner which considers soil, crop and climatic factors.
The development and standardisation of a suitable extractant for S for routine analysis is required for

Table 1. Number of soil samples in each soil-S category from seven provinces in Java and Sumatra.
<30 30-50 >50 Total Province (m S/kg)
West Java 6 3 8 17 Central Java 11 I 1 13 East Java 11 1 3 15 Lampung 4 0 0 4 South Sumatra I 0 1 2 Jambi 0 0 2 2 West Sumatra I I 2
Total 34 5 16 55
evaluation of soil-S status. Easy, rapid, and accurate methods of determination of S should be investigated, so that mOre samples could be studied. Soil test/crop response correlation studies and field verification trials need to be conducted to verify the critical limits of sulfur in soils for upland crops.
Plant-S uvels of Upland Crops
Yazawa (1985) found that of 81 soybean leaf samples collected from Java and Sumatra, 17.30/0 were deficient «0.1 %8) and 50.6% had less than 0.15%8. These data suggest that S-deficiency is a potential constraint in soybean production and will
Table 2. Number of soybean leaf samples in each plantS category from seven provinces in Java and Sumatra.
Province <0.1070 S >0.1070 S Total
West Java 2 19 21 Central Java 8 11 19 East Java 2 16 18 Lampung 2 4 6 South Sumatra 0 2 2 Jambi 0 4 4 West Sumatra 0 11 11
Total 14 67 81
be aggravated by intensified agriculture. The S-plant status in each province is presented in Thble 2.
In West Java 2 out of 21 soybean leaf samples (or 90/0) contained less than 1% S, whereas in Central and East Java the low S level in soybean leaf were found in 42070 and 11% of samples. respectively. This indicates that S-deficiency could be expected to occur more frequently in Central and East Java than those in West Java. In Sumatra only 2 out of 23 soybean leaf samples collected contained less than 0.1 % S. These plant S data generally support the soil S data presented in Table 1.
Upland rice samples collected from several locations in Lampung province in the 1985-86 rainy season contained from 0.087 to 0.150% S and from 0.040 to 0.064% S for straw and grain, respectively. Although the S concentrations of upland rice plant tissues were low, no S-deficiency symptoms appeared in the fields.
Research in the BORIF/ACIAR Project has found that S concentration in plant tissues can vary markedly between crops, seasons and sites (Tables 3, 4 and 5).
In the rainy season (RS) crop at Muneng the S concentration was higher in the leaf than the stem at silking and higher in the stover than grain at maturity (Table 3). The S concentrations in leaf and stem were similar in the dry season (DS) crop at silking at Muneng, but higher in stem than leaf at Pekalongan. The grain S concentration was more constant across treatments than other tissues (Table 3).
The S concentrations of upland rice samples from a field experiment at Pekaiongan in the 1987-88 rainy season where no S response was recorded were 0.058% in brown rice and 0.103% in straw.
In cow pea and Dolichos lab lab, the S concentration of the stover was found to be higher than the seed and seed-S was more sensitive than stover-S to S application.
Critical limits of S concentration of plant tissues
Table 3. 8ulfur concentration in corn plant tissues grown in different locations and seasons.
At silking At harvest LocationlCrops
Leaf Stem Stover Cob Grain
Muneng Corn RS 87/88 -8 0.171 0.149 0.101 0.034 0.092
+S 0.205 0.148 0.111 0.034 0.090 Corn OS 88 -S 0.093 0.085 0.054 0.028 0.081
+S 0.097 0.084 0.058 0.029 0.081
Pekalongan Corn OS 87 -S 0.132 0.154 0.096 0.037 0.089
+S 0.134 0.161 0.093 0.037 0.095
92

in upland crops are still incomplete and plant analysis for S needs to be standardised.
Measurement of the S content of plant products and residues can give estimates of the longer-term consequences of differing fertilization practices. An example of S taken up by corn plants at Muneng in the 1987-88 rainy season is presented in Table 5. Total S uptake of corn plants at harvest ranged from 7.82 to 10.32 kg S/ha. The amount of S in the grain was higher than that in the stover (leaf + stem + cob), at an average grain yield of 3962 kg/ha. The addition of S did not significantly increase S uptake. The S balance was negative when stover was removed or returned in the absence of fertilizer S.
The relationship between grain yield and S uptake is presented in Fig. 1. Approximately 6 kg S/ha are present in the tops in a crop of 3 tlha. The amount of fertilizer S required to produce this yield will depend on the efficiency of uptake and the contribution from sources such as rain or irrigation water and plant residues, and losses via leaching and soil erosion.
Research on the S requirement of upland crops needs to be strengthened and the monitoring of S additions and removal should be expanded to enable prediction of long-term S requirements.
Plant Response to S Application
Reports on plant response to S application are incomplete. Variable responses have been recorded in experiments conducted in different areas in Indonesia.
Two field experiments have been conducted at Muneng, East Java and Pekalongan, Lampung, for several seasons to test the effects of P and S application on several upland crops. The results are presented in Tables 6 and 7. Corn yields in the first
12 S uptake. -2.14 + 2.71 yield (tlha) (kg S!ha)
11 r 0.6776"
10 -
9
8
7
6 Cl
o
2_6 2_8
[J
o 0
DD o
o
o o
o
00
'b ,,0
o :J C 0
o
3.2 3.4 3.6
(Thousands) corn yield (kg/ha)
o
o o
o
o o
4 4_2 4.4 4_6
Figure 1. Sulfur uptake as a function of corn yield at Mumeng, East Java. RS 1987-1988.
93
and third seasons increased with S application when no P was applied. The most significant increase in yield occurred in the last season. The response to S, however, became inconsistent when P was applied. This may be the result of the P application increasing soil-S availability through desorption.
The response of several crops to P and S was studied in a rotation at Pekalongan, Lampung. Generally, there was no significant difference between yields from different treatments in different crops or seasons.
No response to S was recorded in soy bean grown under glasshouse conditions on six soils taken from
Table 4. Effects of S application on S concentration (070) in plant tissues of cowpea and Dolichos lab lab.
Location Treatment Seed Stover
Pekalongan Cowpea -S 0.103 0.159
+S 0.113 0.162
Muneng Dolichos -S 0.086 0.136
+S 0.121 0.128
Table 5. S inputs, outputs and balance (kg/ha) in a corn crop grown at Muneng, E. Java in the 1987-88 rainy season and fertilized with 32 kg P Iha and varying rates of S,
kg/ha Inputs Fertilizer S 0 16 32
Outputs Grain 3.75 3.99 3.96 Stover + cob 4.03 6.33 4.50
Balance Stover removed 7.78 + 12.01 +28.04 Stover returned -3.75 + 5.68 23.54
Table 6. Corn yields as affected by P and S application in different seasons at Muneng, East Java.
P S RS85/86 RS86/87 RS87/88
(kg/ha) 0 0 3242 3767 2968
8 3578 3655 3581 32 3896 4085 4033
16 0 3406 3500 3638 8 3087 3560 3788
32 4008 3732 3666
64 0 3148 3827 3495 8 4076 3586 3995
32 3440 3492 4072 (SO- 867 772 674
a Least significant difference P = 0.05.

Table 7. The effects of P and S fertilizers and their residues on crop yields under rotation at Pekalongan, Lampung.
P S Corn Cowpea Upland Corn Cowpea Upland RS85/86 DS86 rice DS87 DS87 rice
RS86/87 RS87/88
(kg/ha) (tlha)
0 0 3.92 0.36 2.19 8 3.86 0.22 2.12
32 4.61 0.20 2.32
16 0 4.74 0040 2.63 8 4.10 0.21 2.54
32 4.82 0.30 2.30
64 0 4042 0.14 2.66 8 3.96 0.40 2.11
32 4.91 0045 2.15 LSoa 0.76 0.33 0.65
a Least significant difference P = 0.05.
Lampung (Gunung Sugih, Jabung, Sidomulyo, Sukadana, Abung Selatan, and Pekalongan). Another study of S responses in upland rice grown on 11 soils from West Java under glasshouse conditions showed no response to S in any soil.
Response of soybean to S application was reported from a Vertisol at Ngaie, East Java (Yazawa, 1985). Willis variety produced 20.0 g grain/pot and 98 pods per plant if S was applied. Without S application, the grain yield and pod number produced were reduced to 11.9 g/pot and 65 pods per plant, respectively.
The large variation of response of crops to S application in Indonesia could be due to the large variation in soil conditions including soil-S status and inputs of S from other sources, crop requirement and their sensitivity to S stress, climate, and management. Evaluation of S inputs and outputs in cropping systems is needed if better recommendations of sulfur fertilization are to be made.
Conclusion
1. A limited number of S trials on upland crops in Indonesia indicate S deficiency may occur only in several locations in Central and East Java.
94
0.53 0.29 1.69 0.65 0.72 2.12 0.68 0041 1.66
1.33 0049 1.96 1.07 0.36 1.73 1.22 0.34 2.16
0.96 0.57 2.09 0.89 0.26 2.32 1.71 0.65 2.02 0.59 0.30 0048
2. There is insufficient research data available to delineate S-deficient areas of upland crops.
3. The requirement for S and the utilisation of soil and fertilizer-S varies among upland crops.
4. In view of increased cropping intensity and application of S-free fertilizers, S deficiency is likely to become a limiting factor.
References
Elkins, D.M. and Ensminger, L.E. 1971. Effects of soil pH on the availability of adsorbed sui fate. Soil Science Society of America Proceedings 35, 931-934.
Ismunadji, M. and Partohardjono, S. 1986. Nutrient status of the soils of Lampung, Indonesia. Technical meeting of the Technology Development Group, Cipayung. September 9-10, 1986. (In Indonesian).
Kamprath, E. J., Nelson, W. L. and Fitts, 1. W. 1957. Sulphur removed from soils by field crops. Agronomy Journal 49, 289-293.
Santoso, D. 1987. Towards increasing phosphorus and sulphur fertilization efficiency for upland cropping systems on tropical acid soils. Progress report. External review of ACIAR Project in Bogor, Indonesia. July 29-31, 1987.
Yazawa, F. 1985. Physiological disorders of soybean. Expert report. The strengthening of Legumes in Relation to Cropping System Research Project (ATA 218). 71 pp.
S Responses in Pastures and Animals in South Sulawesi, Indonesia
Graeme Blair* and A.R. TiII**
Abstract Small plot studies have shown marked responses of Centro to S fertilizer applied either as
elemental S or suI fate. The increased legume production resulted in a decrease in alang-alang. Grazing studies have demonstrated S responses in terms of liveweight gain of cattle in South
Sulawesi. When S was applied to native pasture, there was an increase of between 33 and 46070 in liveweight gain in the cattle. When S was applied to an alang-alang dominant pasture which had been oversown with legumes, there was a marked increase in animal production. Where 30 kg S/ha/yr was applied over a 3 year period, there was a 100070 increase in liveweight gain per ha per year at a stocking rate of I animal unit (AU)/ha and an increase of 15070 at a stocking rate of 2 AU/ha. The lower response at higher stocking rate is a reflection of the lower quantity of the feed on offer for the animals as a result of increased stocking rate.
These data, together with the earlier findings, suggest that some 69-70070 of the agricultural area of the province of South Sulawesi is responsive to S. Further experiments need to be conducted to ascertain S rates required for maximum production and the residual value of S additions.
A series of S. experiments on pastures was conducted on the Maiwa and Siwa Ranches of B.T. Bina Mulya Ternak in South Sulawesi, Indonesia from 1976 to 1981. The results from the original small plot trials have been presented by Blair et al. (1978) and are summarised in Table 1. This series of experiments has shown a highly significant Centro (Centrosema pubescens) yield response to applied S in the first year after sowing and fertilizer application. In this experiment, S was applied either as elemental S at 50 kg S/ha plus TSP or in molybdenised single superphosphate (13 kg S/ha). No significant response to P alone (TSP) was recorded. It is not possible to ascribe the differing initial fertilizer response found between TSP + S and Mo single superphosphate to S rate, S form, or Mo.
An important feature of the result reported here is that the stimulation of legume growth brought about by the application of S-containing fertilizers leads to a decline in the production of alang-alang (lmperata cylindrica).
The results of this experiment show a significant negative relationship between Centro yield and lmperata production one year after fertilizer
• Program Co-ordinator, ACIAR, University of New England Armidale, NSW 2351 Australia.
** CSIRO Division of Animal Production, Armida\e, N.S.W. 2351 Australia
95
application. These results show that, in addition to increasing the quantity of herbage available to animals, the addition of S-containing fertilizers brought about a control of lmperata at this site, which is representative of a large area of South Sulawesi. Control by competition is a much more attractive alternative than costly spraying or repeated cultivations.
In a follow-up experiment it was found that the response to S was the same whether applied as elemental or sui fate S (applied in superphosphate) (Table 2). This suggests that the greater response to Mo super (sui fate S) than to elemental S found in the earlier experiment (Table 1) was most probably due to the presence of Mo rather than to the different S source. The low pH of the soil suggests that Mo availability may be a problem on this site.
Similar soils to that at the experimental site are estimated to cover approximately 15070 of the area of the province of South Sulawesi and hence S deficiency is likely to be widespread.
Grazing experiments The small plot experiments reported by Blair et al. (1978) were followed by a series of grazing experiments conducted by Ibrahim (1983) at Siwa, South Sulawesi. In these experiments, elemental S was broadcast on to the existing alang-alang dominant

Table 1. Centro yield following topdressing with various fertilizers at Maiwa, South Sulawesi (Blair et aI. 1978).
Fertilizer Centro yield
kg/ha
0 8217 a* TSP 9023 a TSP + elemental S 22526 b Mo single super 23214 b
.. Numbers followed by the same letter are not significantly different.
Table 2. Centro yield (kg/ha) at Maiwa, South Sulawesi, following topdressing with various fertilizer materials (Blair et al. 1978).
Harvest date Fertilizer 1112176 17/4177 Total
0 2853 a" 1196 a 4086 a Superphosphate 6787 b 3704 b 10491 b Elemental S 7235 b 2758 ab 9993 b TSP 3050 a 2004 a 5054 a
.. Numbers within harvests followed by the same letter are not significantly different according to the Studentised range test.
pastures. The results from Siwa, South Sulawesi reported in Table 3, were repeated at Maiwa in the central part of South Sulawesi.
96
Table 3. Liveweight gain (kg/ha/yr) of cattle grazing oversown pasture in South Sulawesi fertilized with varying S rates applied as elemental S (Ibrahim 1983).
Stocking rate AV/ha
1 2
S applied (kg/ha/yr) o 15 30
35.8 a(") 91.2 bc
55.8 abc 103.6 cde
71.5 c 105.1 de
(*) Numbers followed by the same letter are not significantly different according to the Studentised range test.
These results support those of the earlier plot studies and show that the application of S has a beneficial effect on animal production in addition to assisting in the suppression of Imperata (alangaJang) invasion.
References Blair, G.]., Pualillin, P. and Samosir, S. 1978. Effect of
fertilizers on the yield and botanical composition of pastures in South Sulawesi, Indonesia. Agronomy Journal 70, 559-562.
Ibrahim, 1983. The effects of grazing management and sui fur fertilizer on pasture and animal productivity in the wet tropics. University of New England, Armidale, M.Rur.Sci. Thesis.

Sulfur Studies at Hasanuddin University
Solo S. R. Samosir*
Abstract Research carried out at Hasanuddin University in South Sulawesi has identified S deficiencies
in pastures, tree legumes, sugarcane, corn and rice. These deficiencies appear to be as a result of inherently low S status soils, losses of S to the atmosphere as a result of burning of grass, and low S retention capacity of many of the soils.
Measurement of the S sorption capacities of 11 tops oils from South Sulawesi showed that the amount of added S that was sorbed at a solution concentration of 5ppm ranged from 0 to 120 Ilg S/g of soil. On the low S sorbing soils it is suggested that split application of sulfate or the use of slow release elemental S may be appropriate.
The presence of oxidised and reduced layers in the soil and the presence of surface water have a marked bearing on the availability of S to rice plants in flooded systems. Differences in rice growth and S uptake, as a result of different fertilizer sources and placements, were seen within 1 to 2 weeks of fertilizer application.
While growth and S uptake from surface-applied elemental S were initially less than with surfaceapplied potassium sui fate there was no difference at a later stage. Surface-applied elemental S was also shown to be not significantly different in growth and S uptake from ammonium sulfate or gypsum in an earlier experiment.
The deep placement of sulfate fertilizer reduced growth and S uptake but not as severely as the deep placement of elemental S. The amount of fertilizer S taken up by rice plants ranged from about 500/0 with surface applications to 31070 with deep-placed sulfate and 5% with deepplaced elemental S.
Clearly the source and placement of S fertilizers is an important consideration in developing appropriate fertilizer management strategies.
SOUTH Sulawesi is an area where crop and animal production has increased substantially in the last 10 years. It is a net exporter of rice and animal products to densely populated Java and is likely to become more important in this regard in the future.
This paper reports on studies undertaken by staff and students from Hasanuddin University (UNHAS) and on my own studies at the University of New England (UNE) related to S in rice.
S Deficiency in South Sulawesi
S deficiencies have been recorded in studies undertaken by students at UNHAS. S responses have been recorded in pasture (Blair et a1. 1978), in the
• Department of Soil Science, Hasanuddin University, Ujung Pandang, S. Sulawesi, Indonesia
97
tree legume Leucaena leucocephaia grown on Iimed acid soils, in sugarcane grown on a vertisol soil (Ismunadji et al. 1983), and by corn (lbrahim 1978).
The impoverishment of S in soils used for the pasture and Leucaena could be the result of poor inherent S status, soil erosion and repeated burning of grass that results in the loss of S to the atmosphere. Besides the effect of burning of grass, the low available S in the sugarcane soil could be attributed to its near-neutral pH, and hence low S retention capacity, and its montmorillonitic clay content.
The deficiency shown by the soil used for the corn experiment may be due to the leaching of sulfate desorbed from the soil as a result of the long history of application of phosphatic fertilizers.
A pot trial with flooded rice conducted at UNHAS showed that 19 of 56 soils taken from different parts of South Sulawesi in 1982-1983 showed response to S.

320
240 10
'~ 11
0>
iii 0> Eo "0
~ U> 160
'" ~ '" '0 5 cc
" 0 3 E « 80
o
-80 +---r--,----r---.-----r---.------, o 5 10 15 20 25 30
Sullate in solution (ppmS)
Figure 1. Sulfate sorption isotherms for 6 soils from South Sulawesi. (Numbers refer to soil numbers in Table I).
Sorption capacity in soils of S. Sulawesi
Sulfate sorption isotherms of 11 topsails from South Sulawesi showed a wide range in S sorption capacity. Data from 6 contrasting soils is presented in Fig. 1. Table I shows that in these 11 soils from zero to 120 p.g S/g soil of the added S was sorbed at a solution concentration of 5 ppm S, which is the 'external requirement' required by many field plants (Fox 1980).
Sulfate ions can be easily leached from the low Ssorbing soils. Hence, a low sorbing soil may easily become deficient in S, and split application of sui fate or the use of slow release elemental S may be the most appropriate S management on these soils. Highly sorbing soils reduce S loss through leaching, however, a high amount of S added is required to obtain the 'external requirement' of plants.
S Source and placement in flooded rice
It is well known that deep application of nitrogenous fertilizers increases N efficiency (De Datta 1986). The factors controlling the efficiency of suI fur fertilization in wetland rice appear to contrast with those for
98
40
30
i :a '0
i 20
§ Z
10
! 0
0 2 4
DE
ss . Surface applied suffate
SE • Surface applied elemental S
DS Deep aplied sulfale
DE - Deep applied elemental S
8 10
Weeks after transplanting
J<'igure 2. The effect of S source and placement on tiller numbers.
nitrogen. A preliminary experiment, undertaken by Samosir and reported by Blair (1987), showed that incorporation of fine powdered elemental S into flooded soil was not as effective as surface application in increasing dry matter yield and S uptake in the 5 rice varieties tested.
However, the same elemental S source was as effective as ammonium sulfate, potassium sui fate and gypsum when applied to the surface soil (Samosir and Blair 1983). The existence of oxidised and reduced layers in the soil and the presence of surface water appear to play an important role in S transformation and fertilizer performance in relation to the growth of rice plants. Rice plants are able to pass oxygen, via their root systems, to the root medium (Van Raalte 1941), thus enabling the roots to oxidise and take S. Sulfide has been found to be as effective as sulfate as S-source to rice plants grown in culture solution (Han 1973).
Reduced S will be oxidised to suI fate in the surface oxidised layer or in the rice rhizosphere. Sulfate S is mobile and is therefore more accessible to plant roots. In reduced environments sulfate is reduced to sulfide and precipitated as iron and other metal sulfides, thus transforming part of S in the soil to an immobile and unavailable form.
An experiment was undertaken by Samosir at UNE to study the effect of placement of elemental Sand potassium sulfate on the growth of two varieties of flooded rice.
The varieties C4-63 and Pulu Bolong were selected for study because they varied in their O2 diffusion from the root surface. I t was hypothesised that S

Table l. The amount of added S sorbed by 11 soils from South Sulawesi at a solution concentration of 5 ppm S (in O.OIM CaCI2 background solution).
Soil No. Soil description Sulfate sorbed at 5ppm in solution
(/lg S/ g soil)
I Regosol, Kassik x' 2 Podsolic, top soil, bottom of hill, Wajo x 3 Alluvial, Segeri, Pangkep 3 4 Alluvial, Empagae, Sidrap 4 5 Mediterranean, Biru, Bone 9 6 Podsolic, top soil, top of hill, Wajo 18 7 Lateritic soil, Arasol, Bone 24 8 Alluvial, Tonra, Bone 20 9 Grumusol, Bengo, Bone 10
10 Grumusol, Caberge, Soppeng 63 11 Latosol, Bikeru, Sinjai 120
• x very low, beyond the isotherm curve.
uptake would be higher in C4-63 because of its higher O2 release which would allow more sulfate to remain in the rhizosphere. This was not the case and S uptake was not significantly different between the varieties.
Fertilizer placements
The 35S-labelled fertilizers, K2S04 and elemental S (size 425 to 142 p,m), were either broadcast onto the soil surface in the presence of surface water soon after transplanting or mixed with the bottom layer soil (depth 7-21 cm) 30 days before transplanting (total soil depth was 21 cm).
The plants were harvested and the soils from the pots sampled at 42 days after transplanting (42 dat) and at maturity. C4-63 matured by 114 dat and Pulu Bolong was 60 days later (174 dat).
Data on the number of tillers (Fig. 2), dry matter yield (Table 2) and S uptake (Table 3) all show better growth of plants under surface compared to deep placement. Surface elemental S placement resulted in slower earlier growth but showed no difference with surface sulfate at the later stage of growth. The difference due to placement and fertilizer source on
Table 2. Yield of flooded rice grown with elemental sulfur or potassium sulfate placed on the surface or deep in the soil profile.
Fertilizers 42 dat Maturity Tops Filled grain Straw
Surface elemental 7.5 b' 41.2 a 82.9 b Surface sui fate 13.5 a 38.5 a 101.7 a Deep elemental 4.0 d 25.1 b 50.4 c Deep sui fate 6.2 c 42.8 a 92.9 ab
* Within column numbers followed by the same letter are not significantly different.
plant growth (number of tillers) could be observed as early as one or two weeks after fertilizer application.
Deep sulfate (DS) resulted in the same level of dry matter yield at maturity compared to surface sulfate (SS) and surface elemental (SE) treatments, but the earlier growth in this treatment was slow. In all cases the deep elemental (DE) treatment resulted in the slowest growth and the lowest S uptake.
At 42 days after transplanting (dat) the highest recovery of fertilizer S in the plant tops was in the SS treatment (15.60/0) and lowest in DE (0.03%) (Table 3). Fertilizer accumulation in the plant tops between 42 dat and maturity was highest in SE and the order of uptake was SE > SS > OS > DE. This high uptake in SE shows that oxidation was initially delayed but became rapid with time. Fertilizer S recovery in the plant tops at maturity was not significantly different between SS and SE but was reduced in SS and only reached 5% DE (Table 3).
The results of this experiment support other studies at UNE and those of Friesen and Chien who found that surface application of S fertilizer resulted in better growth of flooded rice compared to deep placement or incorporation with soil. The higher dry matter yield and S uptake in the surface treatment could be attributed to the better S supply because of the oxidation of S to su)fate in the surface oxidised soil and water and the intensive oxidation of the soil medium in the rhizosphere in the top soil layer. Deep
Table 3. S uptake (mg/pot) and 070 of fertilizer S in tops of flooded rice grown with elemental sulfur or potassium sulfate placed on the surface or deep in the soil profile.
Fertilizers 42 dat Maturity Fertilizer S Total Fert. S Total Fert. S uptake
/lg/pot (0J0 of I'g/pot (0J0 of 42 dat applied) applied) maturity
Surface elemental 10.6 b* 4.7 b 92.0 a 52.9 a 48.2 a Surface sulfate 22.9 a 15.6 a 91.1 a 49.6 a 34.0 b Deep elemental 5.0 c 0.003 d 33.7 c 5.0 c 4.98 c Deep suI fate 9.5 b 2.7 c 76.8 b 31.5 b 28.8 b
• Within column numbers followed by the same letter are not significantly different.
99

placement resulted in slow early growth because the roots developed in the S-deficient top soil layer. Uptake of S at the later stage of growth remained low because less root developed at the bottom layer while a part of the sulfate may have been transformed to sulfide or organic forms.
Sulfate S that remains in the surface water is more prone to loss in surface runoff. There is a need to study the adsorption of sui fate by the surface soil since a higher percentage of roots developed in the top layer soil in this experiment. This suggests that surface application of phosphate fertilizer may also produce better rice growth compared to deep placement or incorporation. Hence the sorption capacity of the top soil layer could have an important bearing on S dynamics.
S application should provide sufficient S for early growth but does not result in levels of sulfate in the surface water that may be prone to a loss in runoff.
References
Blair, 0.1. 1987. Nitrogen-sulfur interactions in rice. In: Efficiency of nitrogen for rice. International Rice Research Institute, Los Banos, Philippines, 195-203.
Blair, G.J., Pualillin, P. and Samosir, S. 1978. Effect of fertilizers on the yield and botanical composition of pastures in South Sulawesi, Indonesia. Agronomy Journal 70, 559-562.
100
De Datta, S.K. 1986. Improving nitrogen fertilizer efficiency in lowland rice in tropical Asia. In: S.K. De Datta and W.H. Patrick Jr. (cd.). Nitrogen Economy of Flooded Soils. Martinus Nijhoff Publishers, Doordrecht, p.171.
Fox, R.t. 1980. Response of sulphur by crops growing in highly weathered soils. Sulphur in Agriculture 4, 16-32.
Friesen, D.K. and Chien, S.H. 1986. Sulphur fertilizers and their application: general review and S source evaluation at IFDC. In: S. Porteh and Sk. Gh. Hussain (ed.), International Symposium on Agricultural Soils. The Bangladesh Agricultural Research Council and The Sulphur Institute. 407-434.
Han, 1973. Sulfur availability to rice plants on its transformations in rice soil and rhizosphere. M.Se. thesis, University of Philippines.
Ibrahim, B. 1978. Effect of P, K, Sand Mg on the growth of corn grown at Bontobili experiment station, South Sulawesi. Unpubl. thesis. Faculty of Agriculture, Hasanuddin University, Ujung Pandang, South Sulawesi. (In Indonesian).
Ismunadji, M., Blair, G.J., Momuat, E. and Sudjadi, M. 1983. Sui fur in the agriculture of Indonesia. In: G.J. Blair and A.R. Till (ed.), S in S.E. Asian and S. Pacific Agriculture. Armidale, University of New England, 165-179.
Samosir, S. and Blair, O.J. 1983. Sulfur nutrition of rice. Ill. A comparison of fertilizer sources for flooded rice. Agronomy Journal 75, 263-306.
Van Raalte, M.H. (1941). On the oxygen supply of rice roots. Ann. Jard. Bot. Builenzorg 50, 90-113.

Incidental S Inputs in Rainfall and Irrigation Water
R. D. B. Lefroy~ Djoko Santoso** and M. Ismunadji***
Abstract From an analysis of S input/output balance sheets it is apparent that S inputs in rainfall and
irrigation water may be of significance to the S nutrition of crops. A network for assessing the inputs of S from rainfall in parts of southeast Asia is described
and results for Malaysia, and preliminary results for Indonesia, given. Results for a two-month period in Indonesia suggest that the amount of S received in rainfall ranges from less than 0.5 to more than 2.5 kg S/ha/2 months, with the high inputs predominantly in lava and the lower inputs predominantly in the outer islands. It appears that the major sources of S in rainfall are from marine sources and the burning of organic matter and fossil fuel.
The concentration of S in irrigation water, which presumably bears a close relationship to the S in rainfall, was shown to vary from less than 1 ppm to more than 200 ppm, but with the majority of samples being less than 3 ppm S. A relationship between the concentration of S in irrigation water and the available S in the soil is shown.
CROPS obtain their S predominantly in the form of sulfate taken up by the roots from the soil solution, which can come from various sources. It can be desorbed from exchange sites, mineralised from organic matter, come from sulfate fertilizers, be oxidised from elemental S fertilizers or metal sulfides or come in as sulfate in solution in groundwater, irrigation water or rainwater.
S in Rainfall
In the S balance sheets shown in earlier papers (these Proceedings) the contribution of S in rainfall has been seen to be significant in comparison to the offtake of S by the crop. Realising the potential importance of the accession of S in rainfall to the balance between S inputs and offtake, a simple system for measuring the S in rainfall was developed to enable the long term collection of data across a large number of sites.
The measurement apparatus uses ion-exchange
* Department of Agronomy and Soil Science University of New England, Armidale,N.S.W. 2351, Australia
** Centre for Soils Research, 11 Ir. H. Juanda 98, Bogor, West Java, Indonesia
*** Bogor Research Institute for Food crops, JI. Cimanggu, Bogor, West Java, Indonesia
101
resins to adsorb the S passing through the collector. Periodically the S adsorbed onto the resins is desorbed and measured. This apparatus has allowed the assessment of the temporal and geographical distribution of S in rainfall. Initially this system was set up at 30 sites in Peninsular Malaysia and 29 sites in Thailand. Later it was expanded to 5 sites in East Malaysia and more recently to 20 sites in Indonesia. A small number of sites has also been established in eastern Australia.
The amount of S in rainfall is dependent on a large number of factors. It must be related to rainfall, as the carrier of S present in the atmosphere, but more importantly it is related to the sources of atmospheric S. S in the atmosphere comes from a range of natural and anthropogenic sources. The natural sources include emission of sulfides from yolcanoes, the emission of S-containing gases from vegetation, but, most importantly the release of S from the oceans. While there are several forms and methods of S inputs from the oceans, the most important as far as agriculture is concerned is the sui fate carried in seaspray. As sea-spray formation is affected by wave formation, the speed and direction of the wind and coastal geography, so these same factors will affect the amount of S in the atmosphere and ultimately in the rain.
The other major source of atmospheric S is the

burning of organic matter and fossil fuel, which is almost entirely controlled by man's activity.
Proximity to tbe coast
The effect of distance from the coast can be seen from data collected over a 12-month period along a transect from the Australian east coast city of Coffs Harbour to the town of Bourke, about 700 km inland (Fig. I). The first three sites, all within 40 km of the coast, have very similar rainfall of over 2000 mm and yet the accession of S drops from over 22 kg SI ha at the coast to less than 7 kg S/ha within 13 km of the coast.
Weather conditions The effect of the prevailing weather conditions can be seen from the S accession maps for Peninsular Malaysia (Fig.2). Figure 2b is for the period when the most active storms of the N.E. monsoon affect the east coast. The effect is an increase in S accession along the east coast and for much of the rest of the country, excluding the Cameron Highlands. Figure 2a is for the S-W monsoon period, which produces much less violent storms, due largely to the protection afforded by Sumatra. Figure 2c is later in the N-E monsoon season when, although the accession on the east coast is much lower than in the previous period, it is still evident that the monsoon is having an effect.
An experiment to investigate the S reponse of lowland rice on the east coast of Malaysia was set up in October 1988. One month after transplanting there was clear evidence of a response to S. At maturity, however, there was no evidence of the response. The rainfall accession data allowed us to estimate that between 5 and ID kg S/ha had been deposited in the rain during the life of this crop and this appears to have been sufficient to overcome the low S status of the light textured soil in which the experiment was carried out.
25
20 co ~ 15· !l ~ 10 :; (/)
5
0 0
~ ,\ \ \ \ \ \ \ \ \
L
Rainfall ..
SuJfur •
-- ~I
200 400 600
Distance from coast (km)
800
3000
2oo0E' S
~ . ., 1000 er
Figure 1. The accession of S (kg/ha) (solid line) and the rainfall (broken line) on a transect from eoffs Harbour to Bourke, NSW.
102
Fossil fuel burning
The effect of the urbanised and industrialised inputs from Kuala Lumpur/Petaling laya and 10hore BarulSingapore can be clearly seen in Figure 2, particularly Figure 2c. The effect of other agroindustrial inputs, such as from the burning of srich oil palm residues cannot be specifically identified, due to its diverse distribution, but it is thought that this may be an important source of atmospheric S.
Indonesian data A set of rainfall collectors was established at meteorological stations and experimental sites in December 1988. Results from the first 2-month collection period are shown in Table 1. The accession of S ranged from less than 0.1 kg S/ha to over 2.5 kg SI ha with a rainfall range of 300-1300 mm. From these two data sets it is possible to calculate that there was a very large range in the concentration of S in the rain, from 0.005-0.37 ppm.
In interpreting this data it must be remembered that much of Indonesia, being around latitude 0°, does not have the violent seas that are experienced on the east coast of Malaysia. As such, the heavy rain
<1kg Slhalcolleclion period
1-2kg Slhalcolleclion period
2-4kg Slhalcollection period
4 D 4-10kg Siha;caliection period
5 • > 1 Okg Slhalcollection period
b)
Figure 2. Spatial analysis of S inputs in Malaysia for the periods (a) 101711986-10/9/1986; (b) 10/9/1986-10/1111986; and (c) 1112/1986-311111987.

Table 1. Accession of S in rainfall in Indonesia over a two-month period, from December 1988 to February 1989.
Site
Sampali Sincinin Kubang Ujo Tanjung Karang Ciledug Cilacap Klaten Ngawi Banyuwangi Denpasar Karangasem Bima Kupang Genyem Manado Palu Ujung Pandang Tarakan Palangkaraya Pontianak
Province
Sumatera Utara Sumatera Barat Jambi Lampung Jakarta Selatan Jawa Tengah Jawa Tengah Jawa Timur Jawa Timur Bali Bali Nusa Tenggara Barat Nusa Tengarra Timur Irian Jaya Sulawesi Utara Sulawesi Tengah Sulawesi Selatan Kalimantan Timur Kalimantan Tengah Kalimantan Barat
in Ujung Pandang is not associated with high accessions of S due to the calmer seas; this is likely to be true for much of the country.
In the more populated areas, such as in Java, it is likely that the higher S accessions are as a result of the greater anthropogenic inputs from the burning of organic matter and fossil fuel and from industry. Inputs from volcanoes will also have a significant effect in specific areas of the country. As more periods are sampled and more sites are established, so the major geographical, seasonal and year-by-year variations in S accession in rainfall across the Indonesian archipelago will become evident.
150 • • • , g
100 0
5i 0> • g 0 Ul
s: • (f)
ro 50 • ;§
o 5 10 15 20 25
S concentration in irrigation wale, (ppm)
Figure 3. Relationship between total S in soil and S concentration of irrigation water.
103
Rainfall S (mm) (kg/ha)
302 0.42 683 1.51 519 1.58 728 0.92 588 1.67 700 2.62 714 2.25 684 1.45 608 1.68 801 1.56 779 1.34 n.a. 0.21 518 0.92 784 0.52 982 1.26 348 0.26
1333 0.10 528 0.55 803 0.04 500 0.44
From this preliminary data it appears that some areas of Indonesia receive substantial amounts of S in rainfall, which must contribute significantly to the S nutrition of crops, while other areas receive only very minor amounts.
Irrigation water
Unlike the situation with the experiment in east coast Malaysia, where the amount of S in rain during the rice crop was sufficient to provide enough S for the crop, one lowland rice site in Thailand showed no response to S or P for three years and yet had a
18
16
14 Oi 0 <:> 12 ;;; Cl
10 g '0 <Jl 8
(f)
QJ
:is 6
re
1 4
• , 0
0
• • i i 5 10
i 15
•
rl!=0.940 Y=-0.701 + 0.785X
i 20
i 25
S concentration in irrigation water (ppm)
Figure 4. Relationship between available S in soil and the concentration of S in irrigation water.

negative S balance in each year. While this may have been because the crops were growing on the soil S reserves, it may also be that not all inputs were being taken into account. It is possible that there was enough S in the irrigation water to sustain the crop's growth.
There is little data on the extent to which irrigation water can provide a crop's S requirements (Yoshida and Chaudry 1979). Estimates for the concentration of S in irrigation water required for adequate growth range from 1.7 ppm (Ishizuka and Tanaka 1959 cited in Freney et al. 1982) to 6.4 (Wang 1979). Despite this lack of precise information, it is clear that the S in irrigation water must be of importance, either directly to the plant or as an input to the soil reserves.
Work in Indonesia has investigated the relationship between the concentration of S in irrigation water and the levels of total and available S in soils collected at the same sites (lsmunadji and Zulkarnaini 1978). There was no relationship between the total S levels and the irrigation water concentration (Fig. 3). However, although a limited data set of only 9 there appears to be a relationship between the level of available S and the irrigation water concentration (Fig. 4).
The S concentration of irrigation water varies widely. In a survey of 192 sites in Java the concentrations measured ranged from less than 0.5 ppm to more than 200 ppm. However, over 55070 were found to be less than 3 ppm and less than 10% were found to be greater than 20 ppm (see Ismunadji, these Proceedings) .
Conclusion
While further work could be carried out to assess the relative contribution of S in rain and in irrigation water under a range of water management regimes
104
and for a range of soil types, a reasonable estimate of the potential S accession from these sources can probably be made from current knowledge. The rainfall distribution, the water catchment structure, the water management regime,the prevailing weather conditions and proximity to the sea and other sources of S, can all be used to estimate S accessions. Further collection of rainfall accession data and irrigation water concentrations will only improve these estimates.
The use of estimates of the accession of S in rain and irrigation water, along with knowledge of the fertilizer and residue S inputs, the crop offtake and the soil chemical and physical characteristics should allow those areas and cropping systems which are likely to require S fertilizers to be identified and appropriate fertilizer programs designed. It is apparent from preliminary data on the accession of S in rainfall for Indonesia that this is a significant source of S in parts of the country, such as Java, but is of little consequence in other parts of the country, such as Sulawesi.
References
Freney. J.R. Jacq, V.A. and Baldensterger, El. 1982. The significance of the biological sui fur cycle in rice production. In: Dommergues, Y.R. and Diem, H.G. (ed.) Microbiology of tropical soils and plant productivity. Developments in Plant and Soil Science V. The Hague, Martinus Nijhoff. 271-317.
Ismunadji, M. and Zulkarnaini, I. 1978. Sulfur deficiency of lowland rice in Indonesia. Sulphur in Agriculture 2, 17-19.
Wang, CH. 1979. Sulphur fertilization of rice - diagnostic techniques. Sulphur in Agriculture 3, 12-15.
Yoshida, S. and Chaudry, M. R. 1979. S nutrition of rice. Soil Science Plant Nutrition 25, 121-134.

Some Aspects of the Sulfur Nutrition of Crops
Go Ban Hong*
Abstract Sui fur is an important component of biological, economic and industrial activities on earth.
~ulfur supply to crops is larg~ly determined by biological cycling processes and from atmospheric mputs. Supply of plant-avaIlable suI fate may become limited in aerated upland soils because of leaching, while in flooded soils, reduction to potentially toxic sulfide can bring about deficiency or even sulfide toxicity.
Indonesia has numerous small volcanic sulfur deposits which have not been commercially exploited.
S in the Environment SULFUR (atomic number 16, atomic weight 32) together with oxygen, selenium, tellurium and polonium belongs to the Group VIA elements of the periodic table consisting almost completely of nonmetals which can form compounds with metals (especially heavy metals) in which the oxidation number is -2. Oxidation states of +2, +4 and +6 can occur when a Group A element is combined with the electronegative elements oxygen and the halogens.
S, together with its compounds, is found in meteorites and is widely distributed in nature in the ocean, the earth's crust, the atmosphere and in plant and animal life. S in the earth's crust amounts to 300 ppm, while that of carbon is 220 ppm (Krauskopf, 1979).
S is often found in combination with metals as sui fides: pyrite (FeS2), marcasite (FeS2)' pyrrhotite (FenSn + I), chalcopyrite (CuFeS2)' galena (PbS), sphalerite (ZnS); and as sulfates: anhydrite (CaS04),
gypsum (CaS04.2H20), barite (BaS04). Organic substances, e.g. hair, wool, albumin, glucocide oils and proteins, also contain sui fur.
S in Industry The largest consumer of mined S is the sulfuric acid industry. Eighty-eight percent of S in the chemical industry is consumed as sulfuric acid, being mostly
* Sintuwu Maroso University, Poso, Central Sulawesi
105
an intermediate product. The fertilizer manufacturing industry is the largest consumer of sulfuric acid, converting it into superphosphates, ammonium phosphates, ammonium sulfate and mixed and compound fertilizers. S is also used as a soil amendment (gypsum), and is an important ingredient in the synthesis and formulation of insecticides, acaricides, fumigants and fungicides.
S Deposits and Sonrces in Indonesia The volcanic arc through the Sunda islands of Indonesia is rich in S deposits which are exploited on a negligible scale, as is the crater of Mount Welirang, East Java. Because of the small and scattered nature of the deposits, Indonesia imports most S needed for the fertilizer manufacturing industry, the Soroako nickel processing complex and other industrial uses.
The ocean is a great reservoir of sedimentary S compounds. Tidal flow in the dry season transports suI fates inland through the estuarine and river beds. The heavy salty water remains in the bottom zone with the soluble sui fates becoming biologically and chemically fixed in the mud as sulfides. Industrial and biological activity releases large amounts of S compounds as gases into the atmosphere. These gases are a familiar feature in the volcanic areas of Sumatra, Java, Bali, North Sulawesi, Lesser Sunda Islands and the Moluccas. In some areas, rainwater percolating from craters is high in sulfuric acid and harmful for irrigation use (e.g. Banyu Putih from the Ijen plateau and crater, East Java). Another harmful

effect of S is the drainage of tidal swamps for rice cultivation and human settlement. Uncontrolled drainage leads to aeration and oxidation of jaracite to H2S04•
S in Indonesian Agriculture Continuous submergence of paddy soils throughout the year can lead to nutrient and physiological problems for plants growing in these soils. In the coastal plains and the irrigated river valleys of Sulawesi rising groundwater induces physiological disorders in coconut, cocoa, clove and other trees. Yellowing of leaves, premature fruit drop and accelerated leaf senescence are typical symptoms.
Indonesia has relied heavily on ammonium sulfate as an S source (Go, 1961a,b, 1966, 1967, 1978) for agriculture. Ammonium sulfate is an acid-producing fertilizer and continuous use of high rates of application can result in a decline in soil pH. This may induce deficiencies or toxicities of other plant
106
nutrients. Because of this and the high cost of manufacture, consideration should be given to phasing-out subsidies on this product and to replacing it eventually with less acid-producing sulfatic fertilizers.
References Go Ban Hong 1961a. Ammonium sulfate. The Bulletin of
National Congress of Soil Science I. (In Indonesian). 1961b. Fertilization with a new fertilizer. Department
of Agriculture Seminar, Jakarta. (In Indonesian). 1966. The fertilizer industry of Indonesia. The Centre
of Agricultural Research Institute, Bogor. (In Indonesian).
1967. Fertilizer industry. A discussion. The Centre of Agricultural Research Institute, Bogor. (In Indonesian).
1978. Healthy and unhealthy soiL Food and Nutrition Workshop. Indonesian Science Institute. (In Indonesian). Krauskopf, K.B. 1979. Introduction to geochemistry. 2nd
Edn. XIII+. McGraw-Hill Kogakusha, Tokyo, 617.

Agronomic Effectiveness of Alternative S Fertilizers - IFDC's Experience
D. K. Friesen*
Abstract The increasing prevalence of sui fur (S) deficiencies in crop production in Southeast Asia can
be attributed in part to the widespread use of high-analysis, sulfur-free fertilizers such as urea and triple superphosphate (TSP). Methods of correcting these deficiencies include chemical or physical combinations of traditional sulfate fertilizers with high-analysis products or the introduction of elemental S (SO) into high-analysis materials to yield SO-fortified products.
The International Fertilizer Development Center (IFDC) has been involved in collaborative research to evaluate alternative SO-fortified products. Greenhouse experiments found that fine S·, whether surface-applied or incorporated into upland or flooded soil, was as effective as sulfate. Cogranulation of SO with urea or TSP reduced the efficiency of S·, and deep placement rendered it completely ineffective to the immediate crop. The efficiency increased with greater dispersion of S· particles in the soil. It was also found, however, that S" oxidation was enhanced when phosphate and S" fertilizers were intimately mixed. Thus the effect of poor S· dispersion was counteracted somewhat in cogranulated S"-TSP products.
Field evaluation of SO-fortified TSP under upland conditions showed it to be as effective as single superphosphate (SSP) and to have superior residual value. Tracer studies with 35S indicated that this increased efficiency was due to reduced leaching losses. In field comparisons with flooded rice, 35S tracers indicated comparable efficiencies of granular elemental S sources (SO-fortified TSP and urea-SO) and sulfate sources under broadcast and incorporated conditions.
The relatively low optimal fertilizer S requirements ( < 10 kg S/ha) observed in field experiments indicate that the cost of maintaining soil S fertility would constitute a rather small fraction ( < 10070) of a farmer's total fertilizer costs. Thus, differences in S-source efficiency, unless they are substantial, are relatively unimportant in the selection of appropriate S-fertilizer sources.
8ULFUR (8) deficiencies in upland crops and flooded rice are becoming increasingly prevalent in Southeast Asia as soil S reserves are depleted through increased cropping intensity associated with high-yielding varieties and the adoption of multiple cropping practices. The widespread use of high-analysis. S-free fertilizers such as urea and triple superphosphate (TSP) means that very little of the 8 removed from soils in crop products or lost through leaching or the burning of crop residues is replenished by fertilizer applications. Because most of the fertilizer production capacity in the region is dedicated to the manufacture of these high-analysis materials, means
,. International Fertilizer Development Center, Muscle Shoals, Alabama 35662, U.S.A.
107
must be developed to supply crop requirements for plant nutrient 8 in inexpensive forms that are compatible with existing fertilizer production and distribution facilities.
This paper compares the forms and properties of 8-fertilizer sources and summarises results found by the International Fertilizer Development Center (IFDC) in collaborative research to evaluate alternative 8 fertilizers for upland crops and flooded rice.
Forms and Properties of S Fertilizer Sonrces For developing countries, suitable S-fertilizer sources can be grouped into two broad categories: those containing S in the sulfate form and those containing S in the elemental form. These forms have opposing advantages and disadvantages which affect their

60 a
Incorpora1ed
50 Deeo-point ptaced Rate 20 mg S!kg
i 40
:2 Q)
>- 30 c iii 0, 1] tI' 20
10
d
Check Urea-S prilled Urea-S powdered Gypsum powdered
Figure 1. Rice grain yield obtained with urea-So melt and gypsum as influenced by placement method of S fertilizers in continuously flooded soil. Means with the same letters above columns are not significantly different at 5070 level using Duncan's multiple-range test (Chien et al. 1987).
suitability for different crops and cropping systems and the way in which they are managed. Sulfate forms are generally soluble compounds which are readily available to crops but are also highly susceptible to leaching in permeable soils receiving a high incidence of rainfall. Elemental S (SO) is insoluble and consequently is less susceptible to leaehing losses. It is also less readily available to crops because it must first be oxidised to sulfate, a process that is biologically mediated and thus dependent on appropriate temperature and the presence of adequate moisture, SO-oxidising organisms, and, most important, oxygen. Although soil temperatures in the tropics are generally optimal for SO oxidation, soil moisture conditions vary widely from the optimum of 75-1000/0 of field capacity. Thus, suboptimal moisture levels under semi-arid or even humid conditions with soils of low moisture-retention capacity or dry periods may reduce the rate of So oxidation under upland conditions. On the other extreme, the saturated soil conditions found in flooded rice culture may limit the activity of SO-oxidizing micro-organisms by curtailing their oxygen supply under reduced soil conditions.
With the possible exception of gypsum (CaS04 2H20), it is probably not possible or at least not economically feasible to reduce leaching losses of sulfates by product manipulation. Even gypsum, the least soluble of the common sulfate fertilizer sources, will, on the basis of solubility principles, dissolve in less than 3 mm of rainfall when applied at a rate of 10 kg S/ha. Leaching losses from gypsum can be reduced by increasing the particle size (which reduces
108
'5 ~ s-~ a " (f)
iD ~ 1'" If
80
60
40
20
-- SSP (2,0-3.4mm) .,,--_ •••••• S'·TSP (2,O-3.4mm) ------- S"·TSP (LO-2_0mm) -.- S'-TSP (05-1,Omm) - - S'-TSP(0_15-0,2Smm)
S rate (mg/kg)
I 150
Figure 2. Effect of granule size on S recovery from SO-fortified triple superphosphate (SO-TSP) containing J6OJo elemental S «0.25 mm) (Friesen, unpublished data).
the rate of dissolution) and/or by dehydrating the material to the less soluble anhydrite form (Korentajer et aL 1984). The alternatives for ensuring an adequate S supply for crops grown under high leaching conditions are the application of S at a sufficiently high sulfate rate to allow for losses or the practice of splitting the application.
Although sui fate-containing materials such as single superphosphate (SSP) and especially ammonium sulfate dominate the S fertilizer-market, interest in elemental S products remains high, principally because of the savings in transportation and handling costs that would accrue with this highanalysis material. Such considerations become especially important when fertilizers must be imported and/or transported long distances over land to their markets as, for example, in West Africa. The difficulty with elemental S-based sources is the need to provide the So in a physical form that can be oxidised at a rate sufficient to satisfy crop requirements, Le. in addition to being dependent on the environmental factors described above (temperature, moisture, redox, etc.), the rate of So oxidation is also directly related to its specific surface area. Thus So must be applied in finely divided form
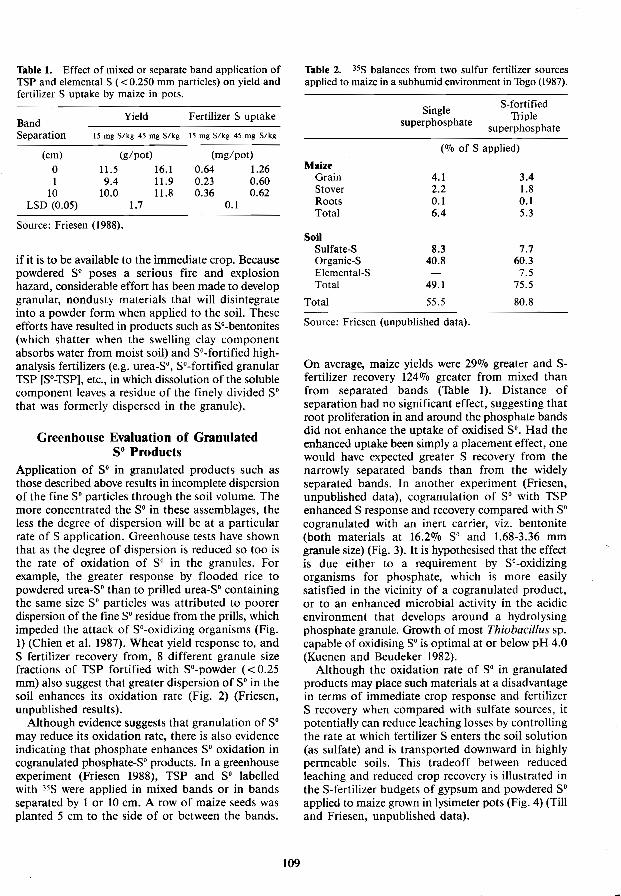
Table 1. Effect of mixed or separate band application of TSP and elemental S «0.250 mm particles) on yield and fertilizer S uptake by maize in pots.
Band Yield Fertilizer S uptake
Separation 15 mg SI kg 45 mg S/kg 15 mg S/kg 45 mg S/kg
(cm) (g/pot) (mg/pot)
0 11.5 16.1 0.64 1.26 1 9.4 11.9 0.23 0.60
10 10.0 11.8 0.36 0.62 LSD (0.05) 1.7 0.1
Source: Friesen (1988).
if it is to be available to the immediate crop. Because powdered S· poses a serious fire and explosion hazard, considerable effort has been made to develop granular, nondusty materials that will disintegrate into a powder form when applied to the soil. These efforts have resulted in products such as SO-bentonites (which shatter when the swelling clay component absorbs water from moist soil) and SO-fortified highanalysis fertilizers (e.g. urea-So, SO-fortified granular TSP [SO-TSPj, etc., in which dissolution of the soluble component leaves a residue of the finely divided S· that was formerly dispersed in the granule).
Greenhouse Evaluation of Granulated So Products
Application of S· in granulated products such as those described above results in incomplete dispersion of the fine So particles through the soil volume. The more concentrated the So in these assemblages, the less the degree of dispersion will be at a particular rate of S application. Greenhouse tests have shown that as the degree of dispersion is reduced so too is the rate of oxidation of S· in the granules. For example, the greater response by flooded rice to powdered urea-So than to prilled urea-So containing the same size SO particles was attributed to poorer dispersion of the fine S· residue from the prills, which impeded the attack of SO-oxidizing organisms (Fig. 1) (Chien et al. 1987). Wheat yield response to, and S fertilizer recovery from, 8 different granule size fractions of TSP fortified with SO-powder «0.25 mm) also suggest that greater dispersion of So in the soil enhances its oxidation rate (Fig. 2) (Friesen, unpublished results).
Although evidence suggests that granulation of So may reduce its oxidation rate, there is also evidence indicating that phosphate enhances SO oxidation in cogranulated phosphate-SO products. In a greenhouse experiment (Friesen 1988), TSP and SO labelled with 35S were applied in mixed bands or in bands separated by 1 or 10 cm. A row of maize seeds was planted 5 cm to the side of or between the bands.
109
Table 2. 35S balances from two sui fur fertilizer sources applied to maize in a subhumid environment in Togo (1987).
Maize Grain Stover Roots Total
Soil Sulfate-S Organic-S Elemental-S Total
Total
Single superphosphate
S-fortified Triple
superphosphate
(0/0 of S applied)
4.1 3.4 2.2 1.8 0.1 0.1 6.4 5.3
8.3 7.7 40.8 60.3
7.5 49.1 75.5
55.5 80.8
Source: Friesen (unpublished data).
On average, maize yields were 29070 greater and Sfertilizer recovery 124% greater from mixed than from separated bands (Table 1). Distance of separation had no significant effect, suggesting that root proliferation in and around the phosphate bands did not enhance the uptake of oxidised So. Had the enhanced uptake been simply a placement effect, one would have expected greater S recovery from the narrowly separated bands than from the widely separated bands. In another experiment (Friesen, unpublished data), cogranulation of SO with TSP enhanced S response and recovery compared with SO cogranulated with an inert carrier, viz. bentonite (both materials at 16.2% So and 1.68-3.36 mm granule size) (Fig. 3). It is hypothesised that the effect is due either to a requirement by So-oxidizing organisms for phosphate, which is more easily satisfied in the vicinity of a cogranulated product, or to an enhanced microbial activity in the acidic environment that develops around a hydrolysing phosphate granule. Growth of most Thiobacillus sp. capable of oxidising SO is optimal at or below pH 4.0 (Kuenen and Beudeker 1982).
Although the oxidation rate of SO in granulated products may place such materials at a disadvantage in terms of immediate crop response and fertilizer S recovery when compared with sui fate sources, it potentially can reduce leaching losses by controlling the rate at which fertilizer S enters the soil solution (as sulfate) and is transported downward in highly permeable soils. This tradeoff between reduced leaching and reduced crop recovery is illustrated in the S-fertilizer budgets of gypsum and powdered SO applied to maize grown in lysimeter pots (Fig. 4) (Till and Friesen, unpublished data).

~ ~ ~ ,., c a; ('j
80 A.
60
40
I /
/ /
/ 20 I
/
/ /
I
/ /
r I
/"
/' /'
/'
/' /'
/'
-- S"-TSP (1.7-3.6mm) Se-bentonite (1.7-3.6mm)
O~-----.~------,--···~-~,-·····-~~·-.------,
o 20
150 B.
/ /
/ /
/ /
/
40
/' /'
/' /'
/ /
40
S rate (mg/kg)
/" /'
/" /'
,/
80 100
Figure 3. Effect of co-granulation of S· with TSP on (a) grain yield response and (b) fertilizer S recovery by upland rice. Both materials 16070 S·, 1.7-3.6 mm granule size (Friesen, unpublished data).
110
Gypsum
0....,.---,
_ 15 E ~ .c 15. 30 ~
45
o
Elemental S «O.25mm)
Org-S
20 20
Residual fertilizer S (% applied)
Figure 4. Plant recovery and distribution of fertilizer S in soil from two sources at harvest (Till and Friesen, unpublished data).
Sulfur Source Comparisons for Upland Crops Alternative S-fertilizer sources have been evaluated on upland crops in several collaborative experiments in West Africa since 1985. These experiments involved comparisons of either powdered or granular sulfate and So sources at several rates of applied Sand included evaluation of both immediate response and residual value. Comparisons were made at sites of varying agroclimatic conditions (semi-arid and sub humid agroecological zones; 400--1600 mm annual precipitation) on soils highly susceptible to leaching (sands to sandy loams with low organic matter content).
In contrast to the poorer responses to SO-TSP observed in the greenhouse, the effectiveness of SO-TSP applied to sorghum or maize at three sites did not differ significantly from that of SSP (Friesen 1989). At one site, SO-TSP was, in fact, marginally superior to SSP (Fig. Sa). Sulfur fertilizer balances constructed at this site and others using 35S-labeled sources showed lower recovery of S by the crop from the So source (S"-TSP) but substantially greater residual S remaining in the soil profile from this source (Table 2). Approximately 45010 of the fertilizer S from the sulfate source (SSP) was lost by leaching, whereas less than 20% of the So could not be accounted for. The distribution of residual fertilizer S in the soil profile (Fig. 6) shows that much of the SO-TSP remained in the surface layer and was thus accessible to the subsequent crop. The value of this residual S is readily seen in the maize response to these residual treatments the following year, and is further illustrated in the comparative response of

3000
2000
1000
o
(a) 1987
.o.--"'Annual SO·TSP
.-__ Annual SSP l:r-----.:l Residual So. TSP o~Residual SSP
10 20 I
40 I o
(b) 1988
I 20
t
I 40
I 60
Total fertilizer S applied in two years (kg/ha)
Figure 5. Maize grain yield responses to annually applied and residual SO-fortified triple superphosphate (S"-TSP) and single superphosphate (SSP) applied in 1987 and reapplied in 1988 (one-half original rate) at Amoutchou, Togo (Friesen, 1989).
maize to reapplications of S·-TSP and SSP (Fig. 5b). Thus, the overall efficiency of S sources must be measured in terms of not only the immediate crop responses they provide but also their residual effectiveness to subsequent crops.
Sulfur Source Comparisons for Flooded Rice The application of S· sources to flooded rice imposes a set of conditions on the rate of S· oxidation that is entirely different from those that are found under upland crops. These conditions depend on how the S source is managed. Because one alternative means of supplying S to rice is in combination with macronutrient carriers such as N or P, management of the S source would inevitably be constrained to that deemed best for the carrier. For N the most efficient method of application is generally acknowledged to be deep-point placement as supergranules; a less efficient method is incorporation into the reduced soil zone. The least desirable management practice involves broadcast application without incorporation, a practice that can lead to high losses of N by ammonia volatilisation. Unfortunately, greenhouse tests have demonstrated that the rate of oxidation, and hence effectiveness of elemental S· fertilizer applied to flooded rice,
111
follows the reverse order with respect to methods of application. Thus, deep-placed application of S in a urea-So product, while maximising N-use efficiency, renders the S component useless for the immediate crop (Fig. 1) (Chi en et al. 1987). Although this S would ultimately become available to subsequent crops as the soils become aerobic between successive crops and are mixed during land preparation operations (Chien et al. 1988), the farmer must inevitably be forced to accept a yield loss when deepplacing such a source for the first time. However, used as an S-fertility maintenance source in which one relies on the residual S value of the previous deepplaced application, the technology of such a material may be viable.
The effectiveness of deep-placed versus incorporated urea-So and urea-ammonium sulfate for irrigated lowland rice and subsequent rice and legume crops is currently being tested by IFDC in long-term field tests in the Philippines in collaboration with the International Rice Research Institute (lRRI). Data from the first crop of flooded rice (not shown) appear to confirm greenhouse results with respect to the effect of application method on availability of S from urea-So.
Collaborative experiments to evaluate alternative S sources for rainfed rice were conducted in northeast

Fertilizer S (% applied)
Figure 6. Soil profile distribution at harvest of fertilizer S from (a) single superphosphate and (b) SO-fortified triple superphosphate applied to maize at Amoutchou, Togo (1987) (Friesen, unpublished data).
Thailand. Although no significant responses to S applications were observed in these experiments, Sfertilizer balances constructed using 35S-labelled sources provide information on the relative use efficiencies of elemental and sui fate S sources. In an experiment in 1986 on a loamy Aeric Paleaquult (Snitwongse et aI., unpublished data), 30 kg S/ha from SSP or SO-TSP was incorporated into soil with 4 cm of standing floodwater at transplanting. Crop recovery of applied S was approximately 11 and 5OJo, respectively, from the two sources, suggesting a less than optimal rate of S· oxidation for the SO-TSP source. Nevertheless, about 57-610/0 of the applied S was recovered from the soil from both sources, and about 30-35% could not be accounted for. The distribution of residual S through the soil profile (not shown) provides evidence of leaching from both sources although the possibility of run-off losses cannot be discounted in that two heavy rainfall events occurred 2-4 days after fertilizer application and inundated the plots.
In a second rain fed rice trial planted on a loamy sand (Aquic Dystropepts) at the same site in northeast Thailand (Satrusajang et aI., unpublished data), ureaSO and urea-ammonium sui fate at 10 kg S/ha were compared in two application methods: (1) broadcast onto dry soil prior to flooding and transplanting or (2) broadcast and incorporated into flooded soil prior to transplanting. Recovery of fertilizer S in the rice grain and straw tended to be greater from the So source than from the sulfate source and greater from broadcast treatments than from incorporated treatments (Table 3). On average, all the applied So was recovered in the crop and soil, whereas approximately 20% of the applied S from ureaammonium sulfate could not be accounted for and
112
Fertilizer S (% recov6\'Y)
o 20 40 60-
5 I
-
30 (a) Urea oS. Urea-AS
Figure 7. Soil profile distribution of fertilizer S at harvest from (a) urea-So and (b) urea-ammonium sulfate applied to rainfed rice in northeast Thailand (1987) (Satrusajang et ai., unpublished data).
was presumed leached from the profile. The profile distribution of residual fertilizer 8 at harvest (Fig. 7) indicates that considerable downward movement occurred from the ammonium sui fate treatments. Most of the residual 8°, on the other hand, remained near the soil surface. Although a followup dry-season soybean crop ultimately failed as a result of insect pressure, the percent S derived from fertilizer measured at flowering suggests greater residual value from the elemental S treatments (Table 4).
Conclusions The experiments in West Africa demonstrated that granular SO-fortified products such as SO-TSP are agronomically viable materials for upland crops. It is likely that similar relative effectiveness can be expected on the northeast plateau of Thailand and elsewhere in Southeast Asia where soil and climatic conditions are similar to those in West Africa. Available data from IFDC collaborative trials in Southeast Asia indicate that high-analysis fertilizers such as urea and TSP fortified with finely divided S" are also viable 8 sources under flooded soil conditions when applied in a manner conducive to So oxidation. They may also provide a residual value that is superior to that of sui fate sources.
Results from our experiments and those of other researchers in West Africa suggest that the S requirements of crops in this region generally can be satisfied with applications of as little as 10 kg S/ha. Results reported from Southeast Asia indicate similar S fertilizer requirements. Because poor physical distribution of S in the soil will likely decrease its

Thble 3. Effect of Sulfur Source and Application Method on 35S Recovery in a Rainfed Rice System (Northeast Thailand, 1987). --~ .....
Urea-Ammonium Urea-So Sulfate
Incor- Incor-Surface porated Surface porated
(010 S applied)
Rice Grain 7.4 6.7 5.1 S.7 Straw 14.2 13.1 12.4 10.4 Roots 2.4 1.8 1.9 1.8 Total 24.0 21.6 19.4 17.9
SoU A vailable-S 16.3 14.8 14.4 10.3 Unavailable-S 68.2 55.0 55.7 41.5
Total 84.5 69.8 70.1 51.8
TOTAL 108.5 91.4 89.5 69.7
Source: Satrusajang et al. (unpublished data).
agronomic effectiveness, the application of a straight granulated elemental S source at such low rates may be impractical, at least for corrective applications. Yet S applied with N or P in traditional S-containing compounds such as ammonium sui fate and SSP is wasteful in terms of the excessive S rates that these sources compel when the carrier (N or P) is applied at its optimal level, the higher initial costs per unit of carrier N or P, and the higher transportation and handling costs. The high rates of leaching that were observed from sulfate sources further indicate that efficient recovery, and concomitantly high residual value, from excessive periodic (biennial or triennial) S applications of these sources cannot be expected. These considerations suggest, therefore, that fertilizer S be delivered to the farmer in products with a carrier having N:S or P:S ratios more appropriate to crop requirements. Products such as urea-ammonium sulfates, double superphosphates, ammonium nitratesulfates, and ammonium phosphate-sulfates are already available in some marketplaces. Component materials (urea and ammonium sui fate, single and triple superphosphate, etc.) could also be bulkblended to achieve products comparable to these commercial products. The introduction of appropriate amounts of gypsum back into TSP during granulation would have the additional advantage of reducing the need to dispose of waste byproduct. Sulfuric acid-based partially acidulated phosphate rocks (PAPRs) also possess a more appropriate P:S ratio than does fully acidulated SSP. Another alternative, which offers the attraction of a high-analysis product, is to fortify common materials such as urea, TSP, and diammonium
113
Table 4. Effect of residual S fertilizers applied to a preceding rice crop on S derived from fertilizer (Sdff) in soybeans at flowering.
Urea S' Urea-ammonium
sulfate
Application method
Surface broadcast
19.4
11.4
Broadcast and incorporated
(010 Sdff) 15.5
9.4
Source: Satrusajang et at. (unpublished data).
phosphate (DAP) with S·, although the hazards of handling So and the production facilities required to introduce it into these materials in a fine particle size must be considered.
Given the relatively low S rates generally required to provide adequate levels of S for crops, it is instructive to compare the costs of S-fertility maintenance with that of other fertilizer inputs (Friesen 1989). For example, by using farm-level prices of urea and ammonium sulfate in Indonesia as of December 1988 (each, US$96.80/ton) and ascribing the difference in price per unit of N in each to the S content of the ammonium sulfate, it can be shown that the cost per hectare of Sand N fertilizer applied as a mixture of ammonium sulfate and urea would be approximately US$2.19 for S (applied at to kg S/ha) and approximately $18.94 for N (applied at 90 kg N/ha). Thus, if other nutrient inputs (P and K) are also considered, the cost of fertilizer S would represent less than 10010 of the farmer's total fertilizer costs. Under world market conditions (more closely approached in Thailand, for example) the relative cost of S is even less. These estimates suggest that differences in efficiency of alternative S fertilizer sources, unless they are very substantial, will have a rather small impact on crop production costs and should not greatly influence government policy choices in the selection of appropriate sources of fertilizer S for Indonesian agriculture. Ultimately, therefore, the choice of a source (or sources) will depend on economic considerations of both production and distribution in the context of existing production facilities in Indonesia.
References Chien, S.H., Friesen, D.K. and Hamilton, B.w. 1988. Effect
of application method on availability of elemental sulfur in cropping sequences. Soil Science Society America Journal 52, 165-169.
Chien, S.H., Hellums, D.T. and Henao, J. 1987. Greenhouse evaluation of elemental sulfur and gypsum for flooded rice. Soil Science Society America Journal 51, 120-123.

Friesen, D.K. 1988. Sulfur fertilizer research at IFDC. Sulfur in Agriculture 12, 14-18.
Friesen, D.K. 1989. Fate and efficiency of sulfur fertilizers applied to food crops in West Africa. Paper presented at the Symposium of the West African Fertilizer Management and Evaluation Network (WAFMEN), Ouagadougou, Burkina Faso, February 7-11, 1989.
114
Korentajer, L., Byrnes, RH. and Hellums, D.T. 1984. Leaching losses and plant recovery from various sulfur fertilizers. Soil Science Society America Journal 48, 671-676.
Kuenen, J.O. and Beudeker, R.E 1982. Microbiology of thiobacilli and other sui fur-oxidizing autotrophs, mixotrophs and heterotrophs. Transactions Royal Society London, B 298, 473-497.

Agronomic Effectiveness of S Sources for Lowland Rice
C P. Mamaril* and P. B. Gonzales**
Abstract Field trials in the Philippines and collaborative trials in South Sulawesi and Java, Indonesia,
evaluated the effectiveness of five sulfur (S) sources applied at 20 and 40 kg S/ha rates on Sdeficient soils for IR64 and IR30 lowland rices.
At Maros site, average yield increase of ammonium sulfate, urea S, elemental S, and gypsum application was 2.7 tlha more than that of a control, whereas S bentonite increased yield by 0.2 tlha. At Batangas site, five S sources increased yield by 0.8-2.9 t/ha.
In 1986 wet season (WS) and 1987 dry season (DS), urea S had higher relative agronomic effectiveness (RAE) for grain yield to that of ammonium sulfate (1040/0 and 123%) or gypsum (1170/0 and 152070) than the other S sources.
1fials in Batangas, Philippines, during 1987 and 1988 DS determined the response of IR64 and IR66, both early-maturing varieties, and IR28222-9-2-2-2-2, a medium-maturing line, to three different timings of S application, using elemental S, urea S, and gypsum.
In 1987 DS, IR64 yielded significantly more than did the control when S was broadcast and incorporated into the soil at transplanting than when S was topdressed 15 or 30 days after transplanting (dat). IR28222-9-2-2-2-2 yielded higher when S was applied at transplanting or topdressed at 15 dat than at 30 dat. Elemental and urea S gave similar yields.
In 1988 DS, IR66 yielded significantly more than did the control when ES was topdressed at 15 dat and gypsum, either at 15 or 30 dat. Yields of IR28222-9-2-2-2-2 were similar for three different timings of application or with either S source.
IN the past, S as a plant nutrient did not receive much attention. It was often applied to the soil through low-analysis fertilizers and S-containing pesticides, and obtained from rainfall and atmosphere.
Recently, however, S deficiency in crops has become widespread. Intensive cropping systems using high-yielding varieties have accelerated S removal from the soil. Increased use of high-analysis S-free fertilizers, decreased use of S-containing pesticides, and better control of emission by industrial and domestic fuel burning (hence low S02 release) have aggravated the S-deficiency problem in lowland rice (Mamaril and Gonzales 1987). Adequate supplies of all plant nutrients including 8 must be available to the crop for maximum yields.
* Agronomist and INSURF Coordinator and Research Aide
** Agronomy Department, International Rice Research Institute, Los Banos, Laguna, Philippines
115
Despite the ammonium sulfate (24070 S) and single superphosphate (11 070 8) being the main fertilizer 8 sources in the tropics, the proportion of S-containing fertilizers in the world has decreased (Blair 1979). Although the higher crop yields are removing almost 6 million tonnes of S worldwide, fertilizers now consumed are predominantly high-analysis 8-free N, P, and K fertilizers.
The Philippine Fertilizer and Pesticide Authority has reported the increasing amount of both high analysis and low-S containing fertilizers. Ammonium sulfate consumption was only about one-third that of urea. Phosphorus consumed comes mainly from high analysis (14-14-14) fertilizers. The decline in the use of S-containing fertilizers will likely increase further the 8 deficiency in wetIand rice soils.
A survey of the 8 status of 153 sites in the Philippines revealed that surface soils of 40 sites contained less than 10 ppm 804- 2 -S the critical level for lowland rice. However, more sites contained low S04-2-S even at lower soil depths. This suggests that if farmers cease to apply S-containing fertilizers,

more soils may become S-deficient because even the subsoil layer may not be able to supply the S required by rice (Mamaril and Gonzales 1987).
Flooded rice response to S application was observed in the field in Bangladesh, Burma, India, Indonesia, Taiwan, and Brazil (Freney et aL 1982) whereas yield increased by as much as 3300/0 in Brazjl and 278% in Indonesia. Yield increased with up to 60 kg S/ha application in Indonesia (Blair et al. 1979a). However, 20 kg S/ha application appeared generally adequate except in extremely S-deficient and light-textured soils.
Significant lowland rice responses to S have been observed in several Philippine trials. Lockard et aL (1972) reported that two out of three soils responded to applied S under greenhouse conditions. Han (1973) found that S content of rice grown in upland conditions was significantly higher than that of plants grown in submerged conditions.
The economic importance of S has increased as S deficiencies become more widespread. S is now applied as a major nutrient in significant segments of tropical and subtropical agriculture.
The objectives of the study were: (1) to compare the effectiveness of five S sources and two rates under flooded lowland rice conditions; and (2) to determine the proper S application timing using early and a medium-maturing lowland rice varieties.
Materials and Methods
Grain yield response of lowland rices to different S fertilizer sources
Field trials were conducted in Pangasinan and Batangas, Philippines during the 1986 WS to evaluate the agronomic effectiveness of five S-fertilizer sources, namely, ammonium sulfate (AS) 24% S, elemental S (ES) 97070 S, S bentonite (SB) 90% S, gypsum 180/0 S, and urea S (US) 20% S in increasing grain yield of IR64 and IR30 lowland rices.
In Pangasinan, each of the S sources was broadcast and incorporated into the soil at 20 and 40 kg/ha just before transplanting. Uniform amounts of NPK fertilizers were applied in all treatments. Treatments were arranged in a randomised complete block design with four replications. Yield responses were measured and plant samples were collected from each plot, ground and anaiyzed for total S. In Batangas, aside from the rice response to different S sources, the residual effects of these sources were evaluated in two subsequent rice crops.
A collaborative trial using the same treatments as those at Philippine sites was conducted in Maros, South Sulawesi, Indonesia during 1986 WS. Yield data and plant samples obtained from these sites were analysed at IRRI headquarters in the Philippines.
116
In 1987/88 WS, the same trial was conducted on the same site and in Klaten, Central Java and in Madiun and Cangakan, East Java, Indonesia. The residual effects of S sources were also evaluated in the subsequent rice crop.
Table 1 shows the soil chemical properties and texture of the experimental sites.
Lowland rice response to different timing of S application
In 1987 DS, a field trial conducted in Batangas, Philippines evaluated the yield response of earlymaturing variety (100-115 days) IR64, and mediummaturing line (111-125) IR28222-9-2-2-2-2 to different timing of S application.
Elemental and urea S at 40 kg S/ha rate were: (I) broadcast and incorporated into the soil at transplanting, (2) topdressed at 15 dat , and (3) topdressed at 30 dat. All plots received equal amounts of 90 kg N/ha, 17 kg P/ha and 33 kg K/ha. Grain yield response was measured and plants sampled for S analysis.
In 1988 DS, a second trial was conducted at the same site using the 1987 DS S-application treatments. Early-maturing IR66 was used as the test variety and sui fate-containing gypsum as the S source.
A collaborative trial using the same treatments as those at Philippine site was conducted in Maros, South Sulawesi, Indonesia during the 1987/88 WS.
Results and Discussion
Grain yield response of lowland rices to different S fertilizer sources
Applying 20 and 40 kg S/ha gave similar yields irrespective of S source and site.
In Indonesia, all S sources, except SB, increased grain yield by 2.7 tlha compared with the control (Fig. la). IR30 grains had low S uptake in SB and NPK treatments. The result suggests that the elemental form of S was equally effective as the S04 -LS form and shows that oxidation of powdered ES can take place under flooded soil conditions (Blair et aL 1979b ; Samosir and Blair 1983).
SB was less effective than the other sources. The slow disintegration rate of SB granules obviously restricted the exposure of elemental S to microbial transformations. Chien et al. (1987) observed that when urea-S melt prills were broadcast into the flooded soil surface, S particles imbedded in the granules were left in spots on the soil surface. Apparently, S oxidation rate was restricted because of decreased contact with the soil environment.
At three sites in Central and East Java, Indonesia,

B.
"' Pangasinan
~ Philippines
m 2
~ .S;
:2
~
° 3 C.
Batangas Philippines
2
NPK S bentonite Urea S Elemental Gypsum Ammonium S sultate
Figure 1. Grain yield increase of IR 64 over the control with the application of NPK and NPK + S fertilizers in three field trials. 1986 WS.
2°1
15~ Y =·O.53213+0.52847(X) (=·0.9716
0
0° 0
00
6' 0
0° 0
cO 0
0
Total S uptake (kglha)
Figure 2. Relationship of total dry matter yield to total S uptake by IR 64 in soils applied with 5 sources and 2 rates of S. Batangas, Philippines, 1986.
117
4
3
.DScontrol 3,Otlha
fZ:l ws control ~ 3.4 tJha
Figure 3. Average yield increases of IR 64 over the control due to the residual effects of applied S for 2 subsequent cropping seasons. Batangas, Philippines, 1987.
the effect of applied S was not observed on the first and second crop.
At the Maros site, plots applied with S fertilizers increased yield by 12.6070 more than the control during 1987-88 WS.
In Pangasinan, Philippines, however, NPK and SB gave similar yields to that of the other S sources (Fig. Ib) probably because of high S content in irrigation water (1.8 ppm) from a deep well near the experimental site. Yield trend was reflected in the S uptake by grains. Apparently, S in irrigation water supplied the crop S requirement hence, S fertilizer application did not further increase grain yield. Wang et al. (1976) in Brazil observed rice response to S supplied by river water, probably used to irrigate the trial, containing only 0.2 ppm of S. Yoshida and Chaudhry (1979) calculated that irrigation water containing 2.7 ppm S can supply the S needs of rice, assuming a 50010 S recovery by plant.
In Batangas, S application significantly increased grain yield by 0.8-2.9 tlha, irrespective of S source (Fig. lc). SB gave the lowest yield among the S sources. These results are similar to those observed in Indonesia. Total S uptake by plants was correlated with total dry matter yield (Fig. 2). However, total S uptake and dry matter yield did not differ between 20 and 40 kg S/ha application.
Application of 20 kg S/ha was adequate to support a normal rice crop at the three field sites. Applying 40 kg S/ha did not further increase grain yield. In the second crop, yield increases due to S sources were significantly higher than those due to NPK because of residual S (Fig. 3). Moreover, yield increases due to SB were higher than those obtained from the yield of the first crop. This result indicates that the residual S had completely oxidized to S04 LS, thus providing additional available S to plants in the SB treatment. Yield declined due to AS, US, and gypsum application.
In the third crop, yield increases due to S sources
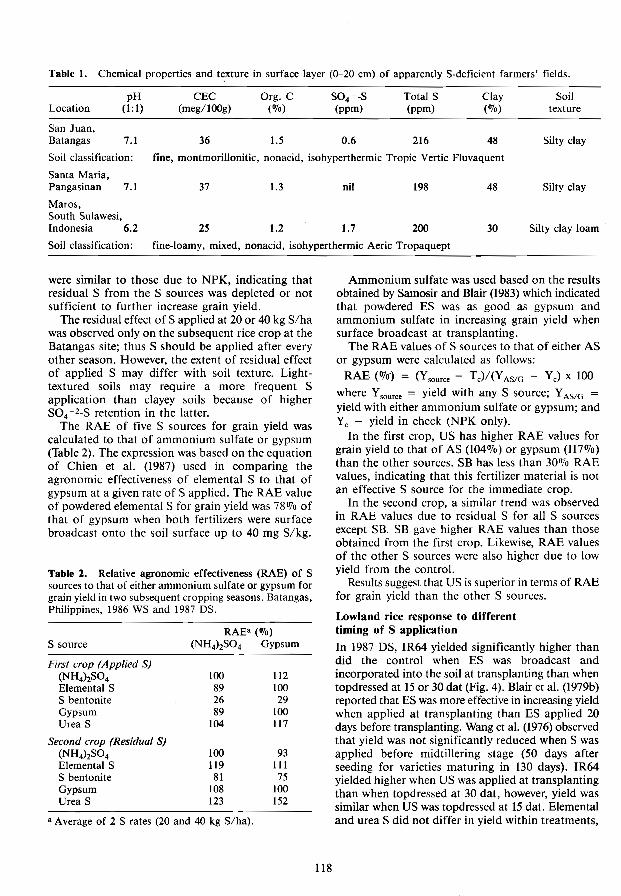
Table 1. Chemical properties and t~xture in surface layer (0-20 cm) of apparently S-deficient farmers' fields.
pH CEC Org. C S04--S Total S Clay Soil Location (l: I) (meg/loog) (010) (ppm) (ppm) (010) texture
San Juan, Batangas 7.1 36 1.5 0.6 216 48 Silty clay
Soil classification: fine, montmorillonitic, nonacid, isohyperthermic Tropic Vertic Fluvaquent
Santa Maria, Pangasinan 7.1 37 1.3 nil 198 48 Silly clay
Maros, South Sulawesi, Indonesia 6.2 25 1.2 1.7 200 30 Silty clay loam
Soil classification: fine-loamy, mixed, nonacid, isohyperthermic Aeric Tropaquept
were similar to those due to NPK, indicating that residual S from the S sources was depleted or not sufficient to further increase grain yield.
The residual effect of S applied at 20 or 40 kg S/ha was observed only on the subsequent rice crop at the Batangas site; thus S should be applied after every other season. However, the extent of residual effect of applied S may differ with soil texture. Lighttextured soils may require a more frequent S application than clayey soils because of higher S04-2.S retention in the latter.
The RAE of five S sources for grain yield was calculated to that of ammonium sui fate or gypsum (Table 2). The expression was based On the equation of Chien et al. (1987) used in comparing the agronomic effectiveness of elemental S to that of gypsum at a given rate of S applied. The RAE value of powdered elemental S for grain yield was 78070 of that of gypsum when both fertilizers were surface broadcast onto the soil surface up to 40 mg S/kg.
Table 2. Relative agronomic effectiveness (RAE) of S sources to that of either ammonium sulfate or gypsum for grain yield in two subsequent cropping seasons. Batangas, Philippines, 1986 WS and 1987 DS.
S source
First crop (Applied S) (NH4hS04 Elemental S S bentonite Gypsum Urea S
Second crop (Residual S) (NH4hS04 Elemental S S bentonite Gypsum Urea S
RAEa (070) (NH4}zS04 Gypsum
100 89 26 89
104
100 119 81
108 123
112 100 29
100 117
93 111 75
100 152
• Average of 2 S rates (20 and 40 kg S/ha).
118
Ammonium sui fate was used based on the results obtained by Samosir and Blair (1983) which indicated that powdered ES was as good as gypsum and ammonium suI fate in increasing grain yield when surface broadcast at transplanting.
The RAE values of S sources to that of either AS or gypsum were calculated as follows:
RAE (%) = (Ysouree - Tc)/(Y AS/G Ye) X 100 where Ysource = yield with any S source; Y AS/G
yield with either ammonium sulfate or gypsum; and Ye - yield in check (NPK only).
In the first crop, US has higher RAE values for grain yield to that of AS (104%) or gypsum (117%) than the other sources. SB has less than 30% RAE values, indicating that this fertilizer material is not an effective S source for the immediate crop.
In the second crop, a similar trend was observed in RAE values due to residual S for all S sources except SB. SB gave higher RAE values than those obtained from the first crop. Likewise, RAE values of the other S sources were also higher due to low yield from the control.
Results suggest that US is superior in terms of RAE for grain yield than the other S sources.
Lowland rice response to different timing of S application
In 1987 DS, IR64 yielded significantly higher than did the control when ES was broadcast and incorporated into the soil at transplanting than when topdressed at 15 or 30 dat (Fig. 4). Blair et al. (1979b) reported that ES was more effective in increasing yield when applied at transplanting than ES applied 20 days before transplanting. Wang et al. (1976) observed that yield was not significantly reduced when S was applied before midtillering stage (50 days after seeding for varieties maturing in 130 days). IR64 yielded higher when US was applied at transplanting than when topdressed at 30 dat, however, yield was similar when US was topdressed at 15 dat. Elemental and urea S did not differ in yield within treatments,

e E 8
6
4
2
1987
IR64 Control yield=2.7Vha
~ 0 ~~~~~~~~-
1988
IR66 Control yield=3.6Vha
2
o~~~--~~~ .. ~-Tl T2 T3
IR28222-9-2-2-2 Control yeild=4.2Vha
IR28222-9-2-2-2-2 Control yield=4.8Vha
Tt T2 T3
• Elemental S ~Gypsum • UreaS
Figure 4. Average yield increases over control of lowland rices due to different times of S application: T, -broadcast and incorporated into the soil at transplanting; Tz - topdressed at 15 days after transplanting (dat); and T3 - topdressed at 30 dat. Batangas, Philippines, 1987 and 1988 DS.
with the latter also containing the elemental form of S.
IR28222-9-2-2-2-2 yielded 2 t/ha more than did the control when both US and ES were broadcast and incorporated at transplanting or topdressed at 15 dat (Fig. 4)_
In 1988 DS, IR66 yielded higher than did the control when ES was topdressed at 15 dat and gypsum, either at 15 or 30 daL
IR28222-9-2-2-2-2 yielded 2 t/ha for three different times of S application and with either ES or gypsum.
Results indicate that IR64 and IR66 rices increased yield by 4 t/ha more than the control when both ES and US were either broadcast and incorporated at transplanting or topdressed at 15 dat and gypsum, when topdressed as late as 30 dat for IR66. This fertilizer source contains readily available S for the crop. Blair et al. (1979b) calculated that a rice field covered with 5 cm of water can dissolve 1 205 kg gypsum/ha. The rate used in our study was well below the calculated rate of gypsum. Chien et al. (1987) reported that the agronomic effectiveness of gypsum was not influenced by the placement method (broadcast, incorporation or deep placement) for flooded rice since S04-ions are relatively mobile in flooded soil.
119
IR28222-9-2-2-2-2 will have optimum yield increase when US is topdressed at 15 daL However, when ES or gypsum is topdressed at as late as 30 dat at Batangas site, IR28222-9-2-2-2-2 will increase yield by 2 t/ha.
Results of the same trial at Maros, South Sulawesi, Indonesia indicate that yield response by IR42 and IR64 lowland rices can be obtained for all different timings of S application during 1987-88 WS.
References
Blair, G.J. 1979. Sulfur in the tropics. Technichal Bulletin No. 12, International Fertilizer Development Center, Muscle Shoals, USA. 69 pp.
Blair, G.J., Mamaril, c.P., Umar, A., Momuat, E.O., and Momuat, C. 1979a. Sulfur nutrition of rice. I. A survey of soils of South Sulawesi, Indonesia. Agronomy Journal 71, 417-477.
Blair, G.l., Momuat, E.O., and Mamaril, c.P. 1979b. Sulfur nutrition of rice. H. Effect of source and rate of S on growth and yield under flooded condition. Agronomy Journal 71, 477-480.
Chien, S.H., Hellums, D.T., and Henao, J. 1987. Greenhouse evaluation of elemental sui fur and gypsum for flooded rice. Soil Science Society of America Journal 51, 120-123.
Freney, l.R., Jacq, u.A., and Boldensperger, J.F. 1982. The significance of the biological sulfur cycle in rice production. In: Microbiology of Tropical Soils and Plant Productivity, Y.R. Dommerguis and H.G. Diem (ed.) Martinus Nijhoff. 271 pp.
Han, Kang Wan. 1973. Sulfur availability to rice plants and its transformations in rice soils and rhizosphere. M.S. Thesis. University of the Philippines at Los Banos, Laguna, Philippines.
Lockard, R.G., Ballaux, J.c., and Liongson, E.A. 1972. Response of rice plants grown in three potted Luzon soils to additions of boron, sulphur, and zinc. Agronomy Journal 64, 444-447.
Mamaril, C.P. and Gonzales, P.B. 1987. Sulfur status and requirements of the Philippines. In: Proceedings of the Symposium on Fertilizer Sulfur Requirements and Sources in Developing Countries of Asia and the Pacific, 26-30 January 1988. Jointly sponsored by FADINAP, FAO, TSI, and ACIAR, Bangkok, Thailand, 67-75.
Samosir, S., and B1air, G.1. 1983. Sulfur nutrition of rice: Ill. A comparison of fertilizer sources for flooded rice. Agronomy Journal 75, 203-206.
Wang, C.H., Liem, T.H., and Mikkelsen, D.S. 1976. Sulfur deficiency - a limiting factor in rice production in the lower Amazon Basin. I. Development of sulfur deficiency as a limiting factor for rice production. IRI Research Institute Bulletin No. 47, 46 pp.
Yoshida, S., and Chaudhry, M.R. 1979. Sulfur nutrition of rice. Soil Science Plant Nutrition 25(1), 121-134.

Alternative Sulfur Sources: ACIAR Research
R. D. B. l£froy*
Abstract A range of alternative sources and methods of application is available for applying S to those
soils and cropping systems which are likely to require S. S can either be applied in predominantly S fertilizers, in combination with N, or in combination with P.
The results of glasshouse and field experiments which show that sulfate and elemental S sources are of similar effectiveness are presented.
The manufacturing processes, costs of production, agronomic effectiveness and the requirements in terms of timing and placement of S, P and N, for a range of fertilizer products are discussed. The evidence available suggests that P:S rather than N:S combinations are likely to be most appropriate in rice cropping systems in Indonesia.
As a result of the changes that have occurred in the manufacturing and marketing of fertilizers and the changes in costs of production and commodity prices in the agricultural sector, there have been significant changes in the amounts and types of fertilizers used in much of Southeast Asia. The awareness that these changes in fertilizer practices, particularly the replacement of ammonium sulfate with urea, may adversely affect crop production in certain areas as a result of reduced S applications, has led to the assessment of alternative methods for maintaining S-fertilizer applications.
The main areas of concern are in regions which are inherently low in S and currently require S applications for the maintenance of crop growth within the present cropping system, and in areas in which increased demands on soil fertility, as a result of increased fertilizer applications or changes in cropping intensity will require additional S. As far as most countries in Southeast Asia are concerned, these areas are unlikely to dominate the nations' agricultural production areas, but may be of great regional importance.
There are several strategies for maintaining or increasing the application of S in areas which require this nutrient. Fertilizers which are predominantly applied as sources of other nutrients, but which
• Department of Agronomy and Soil Science, University of New England, ArmidaJe, NSW. 2351, Australia.
120
contain S, can be used instead of their high-analysis substitutes; thus, ammonium sulfate instead of urea, or single superphosphate instead of tri pIe superphosphate. Alternatively, specific S fertilizers can be used, such as gypsum or elemental S; the elemental S being applied as either powdered elemental or, more conveniently and safely, in prilled or flaked forms made with bentonite or other binders. As a further alternative, S can be incorporated into or coated onto N or P fertilizers during or after manufacture.
Experimental Results
Glasshouse experiments have been carried out with upland and lowland rice at the University of New England (UNE). using different S sources. These have been complemented by field studies.
Glasshouse studies
Several experiments have been conducted by scientists studying at UNE. A study conducted by Samosir examined the effect of surface and deep placement of elemental S and potassium sulfate on rice yield and S dynamics. These experiments utilised 35S_
labelled fertilizer to enable calculation of the direct recovery from the applied fertilizer.
These experiments showed no significant difference in grain yield between surface-applied elemental S or sulfate, or deep-placed sulfate. Total S uptake was

Lowland/Lowland Lowland/Upland 80
l "- 60 a; > 8 ~ (j) 40 a; J;! E 20 <I) le
0 Surface Deep Surface Deep Surface Deep Surface Deep Surface Deep Surface Deep
Elemenlal Gypsum Elemenlal Gypsum Elemental Gypsum
Figure 1. Recovery of fertilizer S in rice (hatched area represents crop 1 and open area crop 2 grown on residual S).
maximised when either elemental S or sulfate was placed on the soil surface (approximately 60070), lowest when elemental S was placed deep in the profile (6070), and intermediate from potassium sulfate deep in the profile (37.8070) (see Samosir, these Proceedings).
These studies were extended to two crops in an experiment by Chaitep. In this experiment fertilizer S recovery was approximately 550/0 from gypsum treatments, 30% from surface elemental treatment, and 160/0 for deep-placed elemental S in crop 1 (Fig. 1). After the second crop, overall fertilizer S recoveries increased to approximately 66% in the gypsum treatments, 43% in the surface placed elemental S treatment and 30070 in the deep placed elemental S treatment.
The overall recoveries of fertilizer S are generally simi lar between the three cropping systems (lowland/lowland, upland/upland, lowland/upland). In the upland followed by upland rice cropping system, recovery was higher from the gypsum treatments with maximum recovery in the deepplaced gypsum treatment. This was presumably due to better contact between roots and fertilizer in crop 1. The recoveries from the elemental S surface (16%) and deep treatments (21 %) in crop 2 highlight the importance of considering the economic value of the residual effect of elemental S. When the lowland rice cropping system was altered to an upland system in crop 2, recoveries were similar to those of the upland/upland system.
The effectiveness of different S sources for flooded rice has been studied at UNE by Made Dana. Grain yields and total S uptake were similar when S was applied as gypsum, elemental S, urea-S or S-coated TSP, and were lower with SCU and S bentonite (Table 1). The uptake of S from the fertilizer was higher with applications of elemental S mixed with the soil, ureaS melt or S-coated TSP than with gypsum, while the fertilizer S uptake from seu and S bentonite was lower than from gypsum.
121
Field trials
The first field trials of alternative S sources in the ACIAR program were set up in 1987. Five S sources were used: gypsum, elemental S (40-100 mesh), urea-S melt (Cominco), S-bentonite prill (Degrasul) and ammonium sulfate, at two rates of application, 8 and 32 kg S/ha, and with a no-S control. The S fertilizers were applied with basal fertilizers, including urea to balance N, prior to planting.
The first site was set up at Ubon in northeast Thailand. This was on the same light-textured, lowsorbing soil that was reported earlier as having a large response to both Sand P applications. Corn was planted immediately after the fertilizer was applied and was followed by a cowpea croP. which had no extra fertilizer.
The application of 32 kg S/ha as gypsum, elemental S or urea-S melt all significantly increased thc corn grain yield over both the 8 kg S/ha applications and the control, which did not differ from each other (Fig.2). The application of 8 or 32 kg S/ha as S bentonite or ammonium suI fate did not produce grain yields which differed significantly from the 0 kg S/ha control. Similar responses were seen in total biomass, except that the application of 8 kg S/ha of gypsum and elemental S produced significantly higher yields than the control (Fig. 3a). The S content of the biomass showed a similar response to fertilizer applications, with significant responses to 32 kg S/ha as gypsum, elemental Sand urea-S and to 8 kg S/ha of gypsum and elemental S, all the other treatments being not significantly different from the control (Fig. 3b).
There were only minor treatment differences in the yield and S uptake of cowpea to the fertilizer remaining after the corn crop. The S content of the cowpeas was significantly higher with the 32 kg S/ha of S-bentonite, suggesting that there was continued release of S from this product.
These data suggest that, for this soil, gypsum,

1000
<i1 800 E 0>
~ 600
" -.; >. co 400 ~
C!J 200
o a 32 8 32 8 32 8 32 8 32
Control Gypsum Elem S Urea S S Bent Amm Suf Source and rate of sulfur (kg Siha)
Figure 2. Effect of sulfur source and rate on corn grain yield at Ubon, Thailand.
elemental Sand urea-S melt are all effective S sources. S bentonite may be appropriate in long-term fertilizer programs, but the lack of response in the first crop and high price would not favour its use. Ammonium sulfate would not be recommended for use on this soil; the lack of response at this site and apparent depression of yield with 32 kg S/ha cannot be explained.
The other trial in this series was with lowland rice and was planted at Singamerta in West Java, with the same treatments as the corn/cowpea experiment. There was a significant response in grain yield to the applications of 8 and 32 kg S/ha of gypsum, ammonium sulfate or elemental S with no significant difference between these sources (Table 2). The application of urea-S melt and S-bentonite, at either rate, produced grain yields which did not differ significantly from the control.
The yield of rice at this site is high, at around 6 tlha, and the response to S relatively small. This is one of those sites where the evaluation of S sources, and in fact the recommendation of a fertilizer program including S, would only be feasible under intensive management conditions when high yields would result in a large S offtake. This is in contrast with the much less fertile upland site at Ubon, which responded to S fertilizers when corn yields are only of the order of I tlha. Clearly, if water and fertility
Table 1. Yield and S uptake relative to gypsum applied at 10 kg S/ba to flooded rice.
Fertilizer Grain Yield S uptake Fertilizer (Relative to gypsum = 100) S uptake(a)
EO mixed 84 97 0.45 Urea Smelt 93 104 0.45 seu 67 72 0.65 S-coated TSP 88 90 0.44 S-bentonite 63 69 0.79
(a) Higher values indicate less uptake from fertilizer; gypsum 0.51.
122
~ g '0 ]j
'" "' gj E ,2 ,0
]i t2
a)
Conlrol Gypsum Elem S Urea S S Bent Amm Sui
Source and rale of su!fur (kg S/ha)
b) 0 Slover
• Grain + Cob
o 8 32 B 32 832 8 32 8 32
I
Control Gypsum Elem S Urea S S Bent Amm Sui
Source and rale of sulfur (kg Siha)
Figure 3. Effect of S source and rate on biomass a) yield and b) S content.
management at such a site were improved, much larger responses to S fertilizers could be expected.
A second series of field trials to evaluate the effectiveness of alternative S sources was set up in 1988 in Thailand, Malaysia and Indonesia. Each experiment includes the evaluation of the Sresponsiveness of the site, with a control and four rates of gypsum (4, 8, 16 and 32 kg S/ha), and the evaluation of six alternative sources, all applied at the rate of 8 kg S/ha. The two extra sources used in this experiment are S-coated urea (TVA) and S-coated TSP (HI-FERT). Since the effective evaluation of fertilizers often requires long-term studies, to evaluate
Table 2. Effect of S source and rate on rice grain yield at Singamerta, West Java.
Rice grain yield (kg/ha)
S sources Rate of application (kg S/ha) o 8 32
------------------------Control Gypsum Ammonium Sui fate Elemental S Urea-S melt S Bentonite
5672
LSD(o.oS) 515 -- - ---------
6240 6765 6501 5950 5 835
6388 6523 6 189 5988 5621

Table 3. Comparison of the advantages and disadvantages of various S-containing fertilizers.
Sources
A.
Ammonium sulfate (21 :0:0:24)
Urea-SO melt (36:0:0:20)
SO-fortified AS (40:0:0:45)
SO-coated urea (41 :0:0: 10)
S'-coated MAP
B. Elemental S (SO) (0:0:0:100)
SO-Bentonite (0:0:0:90)
SO-AS granules
C. Granulated TSP-S·
SSP (0:9:0: 12)
SO-fortified SSP (0:6:0:6)
Double superphosphate (0: 16:0:6)
RP_SO
ESPARP
Advantages Disadvantages
Nitrogen: SuI fur
Existing production capacity and marketing structure High analysis
- Production technology relatively simple
- Can be produced with little modification to existing plants Can vary N:S ratio High analysis
Production technology relatively simple
- Can be produced with little modification to existing plants
- Can vary N:S ratio High analysis
Technology exists
N efficiency reduced when applied at transplanting All sulfate
- Maximum N efficiency is obtained with either deep placement or delayed topdressing, both of which reduce S efficiency
Maximum N efficiency is obtained with either deep placement or delayed topdressing, both of which reduce S efficiency
Hard S coating limits S release N application at sowing/transplanting
Technology exists - N application at sowing/transplanting
Predominantly S - High analysis - Needs to be finely ground to be
effective - Fine material explosive and an irritant
- High analysis S release slow unless on soil surface Existing technology
- Can be blended with N or P fertilizers to various N:S or N:P ratios
- Contains both sulfate and SO - Not yet evaluated Would need to be mixed with P fertilizer to enable small quantity to be spread
Phosphorus : S
- Can manipulate P:S ratio - Minimal capital investment - P and S applied at
sowing/ transplanting
Simple manufacturing process
Simple manufacturing process
- Simple manufacturing - Good P:S ratio
- Minimises processing Can vary P:S ratio
- Can vary release rate
- Can vary P and S release rate (sulfate + SO) Simple manufacture
123
- Manufacturing problems in run of pile processing (explosion)
P:S ratio unsatisfactory Sui fate leaching
P:S ratio unsatisfactory - Need to manipulate P:S ratio by
mixing with TSP
- S all as sulfate
Technology not available May be unsatisfactory on very P and S deficient areas Need ground SO Marketing and distribution
- Requires a new plant - Low analysis if Ca ignored - Need ground S'
Marketing and distribution

Table 3 continued
SO coated TSP Minimal capital investment - Simple manufacturing
- Need ground S'
- Can manipulate P:S ratio S could be added in Provinces
- P and S applied at sowing/transplanting
the residual value of an application and because of high levels of nutrients from previous fertilizer applications, an extra 32 kg S/ha as gypsum treatment was included so it could be re-applied while the other 11 treatments were grown only on the residual of the previous application.
Of the five sites planted to this design in Thailand, two were with peanuts, one with cowpeas, one with soybeans and one with lowland rice. All sites are on fairly infertile soils, which are genemlly farmed fairly extensively with low yields and which were all thought likely to respond to S at least if a higher-yielding management regime was used. During the 1988 wet season, however, the yields at all these sites were low, largely as a result of the time of planting, the rainfall distribution, and in some instances, to serious pest infestation. Only one of the five sites responded to S applications, and it showed no difference between the different S sources. At all the other sites there was also no difference between S sources.
Two lowland rice sites were established on the north-east coast of Peninsular Malaysia. While both sites showed early responses to S application and differences between the S sources, these had disappeared at maturity. It is thought that the reason these responses disappeared is that sufficient S was received in the rainfall (see Lefroy, Santoso and Ismunadji, these Proceedings).
Four sites were established in Indonesia to study these different sources. The sites are at Ngawi, in West Java, Klaten and Jakenan, in Central Java, and in Kubang Ujo, Jambi. Tho consecutive lowland rice crops have been planted at Ngawi, Klaten and Jakenan, and upland rice followed by soybean have been planted at Jambi. Results from these sites are not yet available.
Advantages and Disadvantages of Alternative S Sources
The basic ehoice in alternative S fertilizers is between those based on either sui fate or elemental S. While sulfate-S has an advantage in being immediately available to the crop, little can be done to prevent leaching losses from this source. On the other hand, the release rate of S from So can be manipulated by changing particle size. It would be possible to provide
124
S in the elemental form that could both be released throughout the life of the crop and over several crops. This might be required in areas of high P status where infrequent P fertilizer applications might be made.
A summary of the advantages and disadvantages of a range of alternative S sources is presented in Thble 3.
Conclusion
There are a number of different methods for maintaining S applications to soil types and cropping systems which require fertilizer S.
Glasshouse trials in Australia have found no significant differences between the effectiveness of sulfate and elemental S sources when used appropriately. In finding that the effectiveness of both sulfate and elemental S fertilizers are greatly reduced by deep placement in flooded systems, they suggest that the combination of S with a urea source, which is most effective in N nutrition when deepplaced, would not be the best method of maintaining S fertilization. In contrast, the requirement for P and S at early growth stages, unlike N, and the ideal placement of phosphate in flooded systems being at or near the surface would suggest that if S is to be applied in a combination fertilizer it may be best applied with P.
The first field studies carried out as part of the ACIAR collaborative research program between Australia, Indonesia, Thailand and Malaysia, showed that, in both upland and lowland conditions, gypsum and elemental S were equally effective in providing S to crops; ammonium sulfate was effective in lowland conditions but not upland, and urea-S melt effective only in the upland eonditions. Subsequent trials have produced no further evidence of significant differences between sources.
While agronomic differences between various S sources may be shown by more long-term studies in appropriate soil types and cropping systems, the field data to date and knowledge of the manufacturing and agronomic characteristics of the potential S fertilizers suggest that the choice of an appropriate source of S can be made with the relative P, Nand S requirements of the cropping system being taken into account and based on economics, availability and farmer acceptability.
Cost Effective Alternative S Supply for Indonesia
D. I. Gregory*
Abstract The extent and severity of S deficiency in Indonesia is poorly defined and there is a need to
better define quantitatively yield effects on rice to increased S use. Domestic production and subsidisation of ammonium sulfate fertilizer has rapidly increased
the use of fertilizer S but Indonesia does not have a clear comparative advantage vis-a-vis imports in ammonium sulfate production. Increased S fertilizer supplies above existing ammonium sulfate capacity will probably be required in the future. A domestic production policy for elemental S fertilizers can be economic.
Recent developments in new product formulation and production techniques utilising elemental S are described and indicative costs of production and distribution are provided. Marketing considerations will be important in the introduction of new products and some of these are referred to briefly.
THE achievement of government sponsored programs in intensifying agricultural production in Indonesia over the past 25 years should not be underestimated. Formerly the world's largest rice importer, Indonesia achieved a position of rice selfsufficiency in 1985. An integral part of these development programs has been an impressive development of the national fertilizer industry. This has not only established domestic self-sufficiency but also a significant export capacity in urea fertilizer at or below export parity prices based on indigenous natural gas. A policy of pursuing import substitution for triple superphosphate (TSP) and ammonium sulfate (AS) fertilizers, for which Indonesia has no clear comparative advantage, has offset to some extent however, the substantial benefits of a successful urea industry.
Predominant and economically sound reliance on the high-analysis fertilizers urea and TSP, allied to crop intensification and the use of high-yielding varieties, led to increasing evidence of localised S deficiencies and yield responses to S fertilizer applications for rice. S responses were also recognised in other crops. In 1979 a policy of subsidising the farmer price of AS, in addition to urea and TSP, gave recognition to this situation and farmers were
* Marketing Specialist, International Fertilizer Development Center, PO Box 2040, Muscle Shoals, Alabama. USA.
125
encouraged to use AS in addition to urea as a means of supplying S in known S-deficient areas.
The consumption of AS doubled between 1978 and 1980 to 329 OOOt and continued to increase in subsequent years at almost 70/0 p.a. average growth rate. In spite of the encouragement to farmers to use AS and the increased supply of domestically produced AS, considerable concern has been expressed as to whether this current policy is (a) providing sufficient fertilizer plant nutrient S (PNS) for optimum rice production, and (b) that AS is indeed the most suitable product for supplying PNS.
This paper reviews the impact of current policies on the supply of PNS and examines alternative andlor additional delivery system options for the Indonesian fertilizer sector from both a financial and economic viewpoint. Particular emphasis is placed on those options which could be integrated into the existing manufacturing, distribution, and marketing systems in the most cost-effective manner.
Development of Fertilizer PNS Use Apart from minor quantities of NPK fertilizers and sui fate of potash used on some industrial crops, fertilizer use in Indonesia is restricted to urea, AS, TSP, and muriate of potash (MOP). Total annual consumption of these products since 1975 is shown in Thble 1. The S contribution from the AS (24% S)

has increased from 22 468t in 1975 to an estimated 133 400t in 1987 and the N:sulfur ratio (NSR) has been narrowed from approximately 15:1 to 11:1 over this period due to the increasing proportion of AS in the product mix. Traces of S present in TSP are ignored in these calculations.
Estimates of food and industrial crop fertilizer usage made by IFDC (1981) and Ministry of Agriculture (1989) indicated that AS usage on food crops increased from approximately 25070 of total AS usage in 1978-79 to 50070 in 1979-80 and 66070 in 1986-87. Using these estimates as benchmarks it is estimated that fertilizer PNS use on food crops has increased from 5 600 tin 1975 to 88 100 tin 1987, while industrial crop usage has increased from around 35 000 t to 45 000 1. The NSR in fertilizer additions to food crops decreased from over 40:1 in the late 1970s to an estimated 14:1 in 1987. These estimates indicate that the current fertilizer recommendations and policies have considerably improved the supply of fertilizer PNS over the past to years.
Adequacy of Existing Fertilizer PNS Use Blair and Lefroy (1987) pointed out the difficulties of undertaking accurate regional and national S balance studies, including a lack of detailed data on fertilizer PNS applications by crop, incomplete data on S accretions from rainfall, particulate matter and irrigation water, and insufficient information on residue management systems. In spite of these difficulties S balance calculations can provide an approximate indication of the PNS balances.
A very simple S balance for Indonesia is summarised in Table 2 covering the period 1980-87. These estimates are based on S removed in crop products and present in crop residues less fertilizerS added. The estimated balances for food and industrial crops differ from those made by Blair and
Lefroy (1987). They estimated that in 1983 there was a negative annual S balance in food crops of 89 936 t and a positive balance of 37 493 t for industrial crops compared to these current estimates for 1983 of minus 66 600 t and plus 39 900 t respectively. The previous estimates were based on an IFDC (1981) estimate that 25070 of the AS used in Indonesia in 1978-79 was applied to food crops. The application of subsidy to AS and the incorporation of AS into official recommendations from 1979 significantly altered the proportions of AS used on food and industrial crops so that by 1984 the food crop proportion was estimated by Ministry of Agriculture (1989) to have been 54070. In the estimates reported here AS use on food crops is assumed to have increased from 25 to 50070 between 1978 and 1980, and then increased to 66070 by 1987. On this basis the 1987 annual S balances were minus 33 400 t and plus 11 500 t for food and industrial crops respectively.
The approach to S balance used by Morris (1987) was to apply a 33070 efficiency factor to fertilizer application and to assume total recycling of crop residues, manures and animal wastes. Using these assumptions the 1987 annual S balance was minus 43 200 t for food crops and minus 9 600 t for industrial crops. Whichever approach is used in calculating the annual S balance, it is apparent that the increased use of AS has considerably reduced but not eliminated the S deficit, with fertilizer PNS supplying 133 000 tin 1987 out of a requirement of between 155 000 and 244 000 t. The need for more accurate quantification of AS use by crop and crop removal of S is paramount in determining the S balance by crop and region.
The S balance estimates above are gross estimates for the whole country but the recommendations for AS use have been directed towards those areas where S deficiency has been assumed to be most severe.
Table 1. Summary of fertilizer consumption - Indonesia, 1975-87.
Year Urea TSP AS MOP N pps K20 S
1975 676 235 94 34 331 108 20 23 1976 686 211 122 24 341 97 14 29 1977 962 183 140 69 476 84 41 34 1978 1080 205 155 109 529 94 65 37 1979 1 239 268 196 122 611 123 73 47 1980 1 776 494 330 123 886 227 74 79 1981 2139 724 282 46 1043 333 28 68 1982 2039 713 331 88 1007 328 53 79 1983 2381 834 354 179 1 169 384 107 85 1984 2609 959 408 252 1 286 438 151 98 1985 2607 1048 475 290 1299 482 174 114 1986 2751 I 181 476 237 I 365 543 142 114 1987 2865 I 222 556 406 1435 562 244 133
Source: Indonesian Fertilizer Producers' Association (1986) and P. T. Pusri (1988).
126

Table 2. Simple sulfur balance for major food and industrial crops in Indonesia, 1980-87.
1980 1981 1982
Food crops Rice 53.7 63.7 65.3 Maize 11.6 13.1 9.4 Sorghum 0.02 0.01 0.01 Sesame 0.04 0.04 0.04 Soybean 3.4 4.6 4.0 Peanut 4.9 4.9 4.8 Cassava 6.2 6.0 5.9 Sweet potato 7.9 7.9 6.4 Veg. melons 5.6 5.8 7.1
Total 97.3 105.2 101.6
S added in 39.6 34.5 41.3 fertilizer
Annual S balance 57.7 -70.7 -60.3
Industrial Sugar 11.5 11.5 15.0 Rubber 0.0 0.0 0.0 Coconut 5.3 5.3 5.1 Oilpalm 5.6 6.2 6.8
Total 22.4 23.0 26.9
S added in 39.6 33.2 38.2 fertilizer
Annual S + 17.2 + 10.2 +11.3 balance
All crops Annual S
balance 40.5 -60.5 -49.0 --_ ...
Ismunadji et al. (1987) reported that S-deficiency for rice in Java extends to 574000 ha which could be harvested once a year and 560 000 ha which eould be harvested twice a year plus marginal S-deficient areas of 828 000 ha and 940 000 ha respectively. In the province of South Sulawesi it was claimed that 60-70070 of the crop area is deficient in S and in Lampung province between 30 and 50% may be deficient. If one assumes a requirement of 20 kg S/ha per crop for deficient areas and 10 kg/ha for marginal areas then the annual S requirements are approximately 62 000 t for Java, 2 200 t for Lampung, and 7 500 t for South Sulawesi for rice crops alone. By comparison the estimated S use on all food crops in 1987 for these three areas was Java, 97 500 t; Lampung, 1 330 t; and South Sulawesi, 3 300 1. It appears therefore that there is a considerable variation between regions in the adequacy of fertilizer S applications.
Future AS Demand Projections With a policy of maintaining rice self-sufficiency, increasing production of other food crops, and
127
Year 1983 1984 1985 1986 1987
- ('000 t) -
68.7 74.2 75.9 77.3 75.2 14.7 15.3 12.5 17.1 13.9 0.01 0.01 0.01 0.01 0.01 0.04 0.04 0.04 0.04 0.04 3.7 4.7 5.0 6.5 5.2 4.0 4.7 4.7 5.7 4.8 5.5 6.4 6.4 6.1 6.2 8.4 6.2 8.2 7.9 8.4 7.3 8.1 7.5 7.7 7.7
111.6 121.1 119.9 128.4 121.5
45.0 52.8 62.7 73.1 88.1
66.6 -68.3 -57.2 55.3 33.4
14.5 13.8 16.3 18.6 15.3 0.0 0.0 0.0 0.0 0.0 4.8 5.0 5.4 5.4 5.4 7.5 8.3 9.0 10.4 13.1
26.8 27.1 30.7 34.4 33.8
39.9 45.0 51.3 41.1 45.4
+13.2 + 17.9 +20.6 +6.8 + 11.5
-53.4 -50.4 -36.6 -48.5 -21.9
increased emphasis on export-orientated industrial crops (Indonesian Fertilizer Producers Association, 1986), crop intensification and the need for effective fertilizer use, including the need for S, will continue. The growth of fertilizer consumption is expected to slow, most noticeably in Java, where application rates already exceed recommended levels for Nand P and increased emphasis can be expected in the other major islands.
Forecasts of future fertilizer demand in Indonesia were made in the National Fertilizer Study II Report and subsequently amended in the National Fertilizer Marketing and Distribution Study, 1986-1995 (Pusri 1986). These forecasts reduced the compound growth in N-use from 12.6% achieved between 1964 and 1985 to 7.5% through to 1990 and 5.6!tlo for the period 1990-95. Total AS consumption was forecast to reach lm t by 1995, with a total S content of 262 800 t (Table 3). During the period 1985-87 N-consumption stagnated and the forecasts proved to be optimistic. A revised forecast by the World Bank (1988) reduced the forecast growth in consumption, as illustrated in Thble 4, which reduced the S consumption projection

Table 3. Forecast fertilizer demand ('OOO t) in Indonesia, made in 1986.
Year 1988 1989 1990 1991 1992 1993 1994 1995
('000 t)-
Urea 3644 3879 4116 4355 4593 4836 5084 5328 TSP 1 461 1572 1682 I 790 1899 2068 2116 2224 AS 584 639 699 765 837 916 1002 1095 MOP 360 393 430 470 513 561 613 670 N 1 799 I 918 2040 2164 2288 2417 2549 2681 P20 S 672 723 774 823 873 951 973 1 023 K20 216 236 258 282 308 337 368 402 S 140 153 168 184 201 220 240 263
Source: P.T. Pusri (1986).
Table 4. Revised forecast fertilizer demand ('OOO t) in Indonesia.
Year 1988 1989 1990 1991 1992 1993 1994 1995
- ('000 t)-
Urea 3008 3 159 3317 3416 3519 36246 3733 3845 TSP 1320 1 425 1 539 I 632 1730 I 833 1943 2060 AS 607 656 708 751 796 882 944 1010 MOP 443 482 526 563 602 644 689 737 N 1 511 1592 1677 1 733 1792 1 852 I 915 I 981 P20 S 607 656 708 751 796 843 894 948 K20 266 289 316 338 361 386 413 442 S 145 158 173 185 198 212 226 242
Source: Derived from World Bank (1988).
Table 5. Domestic fertilizer supply, demand, balance forecast Indonesia, 1988-95.
Year 1988 1989 1990 1991 1992 1993 1994 1995
- ('000 t)-Urea
Demand 3008 3 159 3317 3416 3519 3624 3733 3845 Supply
Existing 4271 4328 4328 4328 4328 4328 4328 4328 Pusri Ib 80 427 484 540 540 540 540 Gresik 161 230 270 270 270
Balance 1 263 1249 1438 1 558 1 579 1 514 1405 1 293
TSP Demand 1320 1425 1 539 1632 1 730 1833 1943 2060 Supply
Existing 1200 1200 1200 1200 1200 1200 1200 1200 TSP III 350 500 500 500 500 500
Balance 120 225 11 68 30 133 -243 -360
AS Demand 606 661 720 770 824 882 944 1010 Supply
Existing 650 650 650 650 650 650 650 650 East Kalimatan 50 200 200 200 200 200 200
Balance 44 39 130 80 26 -32 -94 -160
Source: Table 4 and Indonesian Fertilizer Producers' Association (1986).
128

for 1995 to 225 000 t. This forecast is believed to be more realistic, given the current circumstances of increasing farmer prices for fertilizer and the existing high levels of use in Java. The lower urea consumption projected improves the overall NSR to 8:1 by 1995.
Future AS Supply Projections AS production in Indonesia is currently concentrated at the Petrokimia Gresik complex with two direct ammonia neutralisation plants, each of 200 000 tonnes per annum (tpa) capacity, and a 250 000 tpa capacity Merseberg process plant using residual phosphogypsum. Further AS capacity of 200 000 tpa is planned as byproduct from a proposed caprolactam plant at East Kalimantan. The AS demand domestic supply balance is therefore expected to be tight over the next few years and be in deficit by 1993 or 1994, as shown in Table 5.
Table 6 summarises estimates of simple S balances for 1995. The estimates assume a 50070 increase in all crop production between 1987 and 1995, which is similar to the growth achieved in the past lO years of 4.2% per p.a. Three balance estimates are shown based on (1) total crop product and residue content of S less fertilizer-S applied; (2) total crop product S less one third of fertilizer-S applied; and (3) total crop product and residue S less one-third of fertilizerS applied. Two levels of fertilizer-S applications are shown; one based on AS demand projections and one based on domestic AS supply projections. The total S balance calculations range from + 9000 t S to -166000 tS.
Assuming that additional fertilizer -S requirements in Indonesia by 1995 may be at the high end of these estimates, say 150000 tpa, then the current policy of using AS to supply PNS requirements appears to be inadequate in supplying the current and future needs of Indonesian agriculture. The current and planned future supply of AS will therefore have to be supplemented with additional sources of PNS.
The need to identify fertilizer-S requirements more accurately is a prerequisite to any further capital investment or procurement plans for fertilizer-S.
The Financial and Economic Cost of Fertilizer S.
The use of AS fertilizer as a source of PNS is embodied into the recommended fertilizer package for rice at responsive sites. The current recommendation is that one-third of the total N applied should come from AS, with a maximum of 100 kg/ha, applied as a basal dressing. This provides a maximum fertilizer-S application of 24 kg/ha.
129
AS is not only supplying 8 but is also substituting the N in the displaced urea. The cost of S can be calculated by equating the value of N in AS with the equivalent value of urea N displaced, assuming similar efficiencies, and subtracting this from the total cost of AS. From information made available to IFDC on production and distribution costs for 1986-87, it is estimated that the current average costs of urea and AS at the line IV (retail) level in the distribution system, excluding subsidies, are US$113.5 and US$147.4 t, respectively. This equates to 25 cents/kg N in urea and 40 cents/kg 8 in AS. These estimates are based on May 1989 raw material costs and an exchange rate of Rp 1742:US$1.
The average bulk AS cost ex-factory, including depreciation, amortisation, and interest, is estimated at US$l11.4/t compared with $85/t economic value for imported AS. The domestic resource cost (DRC) ratio is 1.6. On a sunk cost basis the DRC ratio is estimated at 1.2. The domestic production of AS is therefore uneconomic even at today's prices for imported AS.
Until 1988 the farmer prices for urea, AS, TSP, and MOP were equal, at US$75.76/t. The total government economic subsidy for AS in 1986-87 was calculated by the World Bank (1988) to be U8$91.87 t and the annual subsidy U8$44.2 million.
Table 6. Forecast, 1995 suI fur balance in Indonesia assuming a 50OJo increase in crop production.
Food crops S in products S in residues
Total
Fertilizer S added
Annual S balance
Industrial Crops S in products S in residues
Total
Fertilizer S added
Annual S balance
Total S Balance (I) Total S Balance (2) Total S Balance (3)
Fertilizer Demand
Fertilizer Supply
- ('000 t)
108 108 74 74
182 182
157 133
-25 49
37 37 14 14 51 51
85 71
+34 +20
+9 29 -65 -78 153 -166
(1) S in crop product and residue less fertilizer - S. (2) S in crop product less one third of fertilizer - S. (3) S in crop product and residue less one-third fertilizer
S. Assumes 85010 total fertilizer demand or supply used on food crops.

The domestic production policy for AS as a source of PNS has not proved to be economic compared with the alternative of importing AS. The policy of supplying S has, however, had a considerable economic benefit. The 1986-87 cost of an estimated 472 600 t AS used on food crops is estimated at US$79 million. The cost of an equivalent quantity of N as urea would have been US$25.6 million (ignoring the opportunity cost of export income foregone) and the total cost of S applied was US$53.4 million (79 - 25.6). With the import cost of rice at US$228/t, the S addition of 105 000 t would have had to increase rice production by only 234 000 t to reach a break-even situation. This is less than 10/0 of total production.
Farm-gate Costs and Values With equal fertilizer product retail pricing the farmer cost of fertilizer-S is distorted. Using the same method for valuing the S content of AS as used previously at the factory level, the value of AS S in 1987 was 17.2 cents/kg kilogram compared to a N value of 16.5 cents/kg. The retail prices for urea and AS in December 1988 had increased to US$96.83/t and the Sand N values were 21.9 and 21.1 cents/kg respectively.
With approximately equal farm prices for Nand S the economics of S application are significantly better than for N when S responses occur. Rice grain yield responses per hectare to S, in S-deficient crops in Indonesia, have been reported by Blair et al. (1979) to be as high as 115 kg per kilogram of applied S. Average responses of perhaps 80 kg grain/kg S may be expected at application rates of between 10 and 20 kg/ha in S-deficient areas. In contrast average grain yield response to N is usually in the order of 10 kg per/kg applied N per hectare.
Alternative Sulfur Sources A very wide range of alternative sources of fertilizer-S is available. These have been described at length by Kanwar and Mudahar (1986), Beaton (1987), Tandon (1987), Friesen and Chien (1986) and Diamond et aL (1983), among others. Primarily the range of products is divided into two classes; products containing sulfate S and products containing elemental S. Agronomic efficiency of product use under given field conditions is a significant factor to be considered in the choice between elemental and sulfate S forms but a wide range of other criteria also needs to be considered. In discussing the criteria for evaluating fertilizer S sources, Kanwar and Mudahar (1986) list eight criteria which are summarised below;
• technical feasibility of production, distribution, and use;
130
• agronomic effectiveness under field conditions;
• producer, distributor, and user preferences; • economic effectiveness under free market
conditions; • economic effectiveness under prevailing and
alternate government policies; • foreign exchange use, earnings, and savings; • economic and financial aspects of research,
production, distribution, and use; and • existing and suggested government policies
dealing with all aspects of fertilizer-S. In Indonesia substantial commitments have already
been made to domestic production of urea, AS, and TSP. Under these circumstances the first priority should be to explore the avenues for improving the economic efficiency of current AS production as a fertilizer-S source. A longer-term need for additional quantities of fertilizer-S and the form in which it should be supplied also needs to be evaluated. The fertiIizer-S supply alternatives can be considered in three categories; elemental S fertilizers; N-S fertilizers; and phosphate-S fertilizers. The manufacturing aspects of these alternatives and the efficiency of AS production are discussed below.
Ammonium Sulfate Production Efficiency The P.T. Petrokimia Gresik fertilizer complex is a highly integrated fertilizer and chemical production facility in which the AS and TSP plants and the associated intermediate processing units cannot be considered as separate entities. The sulfuric acid plants are used to co-generate a major proportion of the total site power requirements and byproduct phosphogypsum, from the phosphoric acid production, is utilised to produce both AS and cement retarder in addition to byproduct chalk. The Merseberg process for the production of AS based on phosphogypsum requires carbon dioxide. This is obtained from a captive fuel oil-based ammonia plant. This high cost ammonia plant is operated at the minimum level needed to supply all the required carbon dioxide and approximately 700/0 of the Merseberg AS ammonia requirements. The rest of the ammonia for this plant and the two direct AS plants is sourced from Kaltim at about one-third the cost of the fuel oil-based ammonia.
Assuming continued production of AS on a sunk cost basis, estimates of the current Gresik bulk AS cash production and domestic resource costs, based on May 1989 world prices for raw materials, intermediates, and finished products are summarised in Table 7. These estimates indicate that the direct process AS is economic and has a DRC ratio of 0.7. The phosphogypsum-based AS process is not economic and the DRC ratio is 1.5. The significant

Table 7. Estimated AS production costs at Gresik, May 1989, US $ per tonne; exchange rate Rp 1742.
Bulk import costs: NH3 Sulfur AS
f.o.b. 115 115 65 Freight 10 15 15 Handling 5 5 5
Delivered cost 130 135 85
Direct process Merseberg process Average
Capacity (t) 400 000 250000 650000 Ammonia 0.261 @ $130
Sulfur 0.2531 @ $135 Gypsum Electricity Chemicals Salaries, wages Maintenance Other costs
Total Chalk credit
Total net cost
Foreign exchange Local currency Domestic resource Cost ratio
Source: Estimates derived from World Bank (1988).
improvements in the economic production costs compared to previous estimates made by the World Bank (1988) are due to the improved world prices for fertilizer materials and changes in exchange rates. The average cash production cost of AS for all three plants is estimated at US$95.lIt compared to the current economic value of US$85/t and the DRC ratio is 1.2. If the ammonia source at Gresik was a world-scale plant based on natural gas it is estimated that the current average cash production cost of AS would be US$80it and the DRC ratio would be approximately 0.9. The long-term rationalisation of AS production at Gresik probably rests on this approach with a world-scale ammonia plant and a down-sized urea plant to allow availability of sufficient carbon dioxide for the Merseberg AS process.
Elemental Sulfur Fertilizers There are two elemental S products which may be considered by the Indonesian fertilizer industry; elemental Sand S bentonite. Both products are used elsewhere to a limited extent for specialised purposes and provide the benefits of high concentration and flexibility of use in relation to other fertilizer nutrient requirements.
Direct use of elemental S theoretically offers a very cost effective source of S because of the nutrient
33.80 0.194t @ $325 63.05 0.071t @ $130 9.23
34.16 1.76t @ $10 17.60
3.00 0.25 1.25 1.50 3.50
18.00 3.20 6.20 6.20 7.00
77.46 130.48 0.714t -7.14
77.46 123.34 95.10
62.79 14.67
8.16 115.18
41.78 53.32
0.7 1.5 1.2
131
concentration. Agronomic efficiency of elemental S over time is directly related to particle size and the volume:surface area ratio. For effective utilisation in the season of use, elemental S particles usually need to be no more than 150 microns (lOO mesh) in diameter, as reported by Friesen and Chien (1986). Other size recommendations have varied from 25070 or more being less than 250 microns (Beaton et a1. 1985), 50% less than 149 microns with 100% less than 1000 microns (Tisdale et al. 1985), to 100070 being less than 72 microns (Fisher and Black 1983).
Grinding of S to this size poses considerable hazards. Confined atmospheric S concentrations above 35 mg/m3 create explosive conditions and the risks of combustion are ever-present. Also finely divided S is very unpleasant to handle. For these reasons most manufacturing processes for incorporating elemental S into fertilizer materials have relied on using Smelt.
One method used is to incorporate S in bentonite. Bentonite increases in volume in the presence of water and it is this characteristic which is utilised to cause the fragmentation and disintegration of the large S bentonite particle. S bentonite typically contains 90% Sand 10% bentonite and is usually formed by cooling a molten mixture of the two materials in a similar way to the production of formed S. As with formed S the product can be produced as granules, flakes,

prills, or pellets. Two forms of bentonite can be used; sodium bentonite, which expands in volume 7-11 times its original size, and calcium bentonite, which only swells 1-2 times its size in contact with water. S bentonite may be formulated with either or both types of bentonite to provide varying degrees of S fragmentation.
There are several producers of S bentonite in the USA and Canada where production began in the early 19708 and the process of manufacture is reasonably straightforward although it does require maintenance of tight process parameters to ensure consistently good quality. Plant capacities range from 20 000-60 000 tpa and the major use for the products is as constituents of dry bulk blends. In mid-1988 bagged product prices for S bentonite delivered to blending sites in the USA ranged from US$21O-2251t.
The early use of S bentonite products in North America involved recommended strategies of application and incorporation into the soil as early as possible before planting or seeding (Beaton et al. 1985; Beaton and Soper 1986). Beaton (1987) reported that it appears preferable to leave such fertilizers exposed on the soil surface for lengthy periods before incorporation. Lack of complete dispersion of fine S particles through the soil, as reported by Friesen and Chien (1986), retards S oxidation rates. It was reported by Beaton (1987) that one form of S bentonite typically dispersed S particles that were 50-750/0 less than 425 microns in diameter and 15-25% less than 75 microns.
In the opinion of Lee (pers. comm.), variability in bentonite specification and in S bentonite processing controls appear to affect the S particle size in the finished product. It may be that some of the variability in the effectiveness of S bentonite products as a source of S is due to these factors.
A recent development in Canada is a process in which finely ground S - 98% less than 75 microns (200 mesh) is agglomerated to spherical granules with a crushing strength of 2.7 kg and a 0.7% attrition rating. The finished product contains 95% S and readily disperses in water. Commercial production is due to commence in late 1989.
Nitrogen Sulfur Fertilizers Two products which have been or are in commercial production in this group could be considered in Indonesia as both products involve the incorporation of S into urea, the primary source of fertilizer N used on rice. These products are urea-sulfur and urea-AS. A third product, S-fortified AS, is also of interest.
Urea-sulfur is a granulated urea-suI fur melt analysing 36-0-0-20. It is a homogeneous product in which finely divided S of less than 100 microns is dispersed throughout each granule. The product was produced in Canada until recently and performed
132
well as an S source. Production ceased when the manufacturer commissioned a new urea plant and the product role in the market was replaced by the introduction of granular AS. The cost of production of urea-S is not known to the author but S-melting plant and additional urea-sui fur mixing equipment add to capital costs in addition to the cost of Sand a slight increase in processing costs.
Reported agronomic efficiency of urea-sulfur under tropical conditions has been varied. Gonzales et al. (1986) reported that in greenhouse trials at IRRI urea-sulfur outperformed elemental S, AS, calcium sui fate, and S bentonite as a source of S for both initial and second crop rice in Philippine wetland soils, whereas Chien et al. (1987), also in greenhouse experiments, found that the granular product was less effective than gypsum as an S source irrespective of whether it was broadcast, incorporated or deepplaced. However, field experiments in Thailand and the Philippines suggest that broadcast or incorporated urea-sulfur was as effective as urea-AS (Friesen pers. comm.).
Urea-AS product is a fluid bed granulated product that contains approximately 80% urea and 20% AS. The analysis of the product is 40-0-0-5. This is a high quality, free-flowing granular fertilizer with granules in the 2- to 3-mm diameter size range. No production cost information has been obtained for this product. Fluid bed granular urea-AS could be expected to incur a minor capital and processing cost increase over a straight urea plant but current experience is that fluid bed granulation provides cost savings from lower recycle rates and lower melt concentration requirements compared to other granular urea processes.
With the exception of one small-scale urea pan granulation unit, all of Indonesia's urea production is based on prilled urea, and there is only one operating fluid bed urea granulator in the region. Urea-AS as an S source could be considered for a future ammonia urea complex.
Another recent development in Canada is the production of drum granulated S-fortified AS, analysing at 7-0-0-68. This contains approximately one-third AS and two-thirds elemental S. The S, with a particle size of 98% less than 75 microns (200 mesh), is added to an AS slurry in a drum granulation process. No information on production cost is available but it is expected to compete favourably with sulfur bentonite and granulated AS in Canada (Lee pers. comm.).
Phosphate Sulfur Fertilizers All phosphate fertilizer in Indonesia is supplied as TSP produced at the PT Petrokimia Gresik complex from two TSP plants each with a rated capacity of 500 000 tpa but both currently operated at 600 000

Thble 7. Estimated AS production costs at Gresik, May 1989, US $ per tonne; exchange rate Rp 1742.
Bulk import costs: NH3
f.o.b. 115 Freight 10 Handling 5
Delivered cost 130
Production costs: Direct process
Capacity (t) 400 000 Ammonia 0.26t @ $130 33.80
Sulfur 0.253t @ $135 Gypsum Electricity 3.00 Chemicals 0.25 Salaries, wages 1.25 Maintenance 1.50 Other costs 3.50
Total 77.46 Chalk credit
Total net cost 77.46
Foreign exchange 62.79 Local currency 14.67 Domestic resource Cost ratio 0.7
Source: Estimates derived from World Bank (1988).
tpa. TSP I is designed to be able to produce DAP or NPK fertilizer though at a lower rate than for TSP. Approximately half the phosphoric acid requirement is imported and the remainder is produced on site from imported rock and S. In 1987 the economic cost of TSP production was estimated by the World Bank to be marginal but with the subsequent recovery in world prices this situation has improved. As byproduct phosphogypsum is fully utilised the most logical development for supplying S is to fortify the current TSP with elemental S to produce one or more products with a suitable P:S ratio. Current fertilizer recommendations include only one P rate for rice, and a range of S rates between 10 and 25 kg/ha. Products with P:S ratios of 2.5:1 and 1:1 are required. Such products require inclusions of elemental S at 8070 and 17% respectively.
Three methods of S-fortifying TSP are available; inclusion of molten elemental S in the mixer during the run-of-pile processing of TSP, adding ground S to phosphoric aeid, and the coating of granulated TSP with finely ground elemental S. The run-of-pile production process for TSP at the Gresik site followed by later granulation poses a problem of S sublimation and dust aecumulation in venting systems and associated explosion hazards during the granulation/drying/sizing process.
133
SuI fur AS
115 65 15 15 5 5
135 85
Merseberg process Total production
250000 650000 0.194t @ $325 63.05 0.071t @ $130 9.23
34.16 1.76t @ $10 17.60
18.00 3.20 6.20 6.20 7.00
130.48 0.714t 7.14 @$1O t
123.34 95.10
8.16 41.78 115.18 53.32
1.5 1.2
Although some trial batches of S-fortified TSP have been produced in Australia commercial production has been restricted to S-fortified single and double superphosphates, containing either 11, 18, or 36% S. This processing route bypasses the dangers inherent in the dryer. At low levels (6-8070) of S incorporation in TSP the risk of S sublimation is greatly reduced but there is some evidence referred to by Higgins (1987) that the presence of suI fate and/or temperatures below 120°C, and slow solidifieation are necessary to obtain the intimate incorporation of finely divided S particles that is obtained with single and double superphosphates.
The development of a process in New Zealand to pilot-plant scale by Charleston (1985, 1986) eliminated these problems through the use of high, controlled shear conditions to mix molten S in water, sulphuric and phosphoric acid. Higgins (1987) in describing the relatively simple proeess states that the size distribution of the S particles in the resultant slurry can be altered by changing the impeller speed and the point of introduction of the S into the vortex. It is not known whether this process has been proved up to commercial scale, but the advantages of introducing S into phosphoric acid prior to reaction with rock phosphate appear to provide a very suitable means of S-fortifying TSP.

Table 8. Cost estimates ($US) for alternative sulfur supply.
Raw materials and finished product costs
Urea TSP ASI
Cash costs 45 165 95 Capital charge 20 16 16
Total 65 181 111
Distribution 49 42 36 (incl. bags)
Retail cost 114 223 147
Delivered cost of suI fur (cents/kg) 40
Alternate products
Sulfur bentonite
Analysis N 0 P20 S 0 S 90
Raw materials 144 Processing 15 Capital recovery 6
Total cost 165
Distribution 45
Retail cost 210
Delivered cost sulfur (cents/kg) 23
ASI current AS production at Gresik. AS2 rationalised AS production at Gresik. AS3 new AS production. AS4 imported AS.
IFDC on a pilot-plant scale, has successfully added a ground S slurry to phosphoric acid prior to mixing with phosphate rock. S particle size has to match the finer particle size of the rock to ensure thorough distribution in the TSP.
A very recent development in Australia has been the commercialisation of a patented process for Scoating granulated TSP with micronised S. Adhesion of the 8 is achieved by the creation of a thin tacky film on the surface of the TSP granules by misting minute quantities of water onto a tumbling bed of TSP granules. Once the tacky surface is established the sui fur-based dry coating material is added. It is thought that some form of lignosulfonate compound may also be used to assist adhesion but this has not
134
Bent-AS2 AS3 AS4 onite S
90 95 65 192 115 16 20 20 30 20
106 115 85 222 135
36 36 30
142 ]5] 115
37 41 26
Urea-S Urea-AS SF-AS SF 8 SF 1 TSP TSP
0'/0
36 40 7 00 0 0 0 42 38
20 5 68 8 17
(US $/t)
45 39 124 177 173 20 19 21 4 5 38 41 19 2 2
103 99 164 183 180
45 45 45 42 42
148 144 209 225 222
29 88 28 27 23
been confirmed. The product apparently ha~ no significant problems with S sublimation and the physical form of the product has been independently described as excellent.
Currently the product is being produced with 100/0 S which provides a 2:1 P:8 ratio (4.6:1 Pz05:S ratio) but the producers claim that both larger and smaller ratios can be achieved. The processing costs are unknown but the product is being sold at the same price as TSP in Australia. With the current TSP cash production cost in Indonesia estimated at U8$165/t, as shown in Table 8, and the border price of 8 at US$135/t, a preliminary estimate of the material and processing cash costs indicates a bulk ex-factory cost of approximately US$182/t for 8070 8 product.
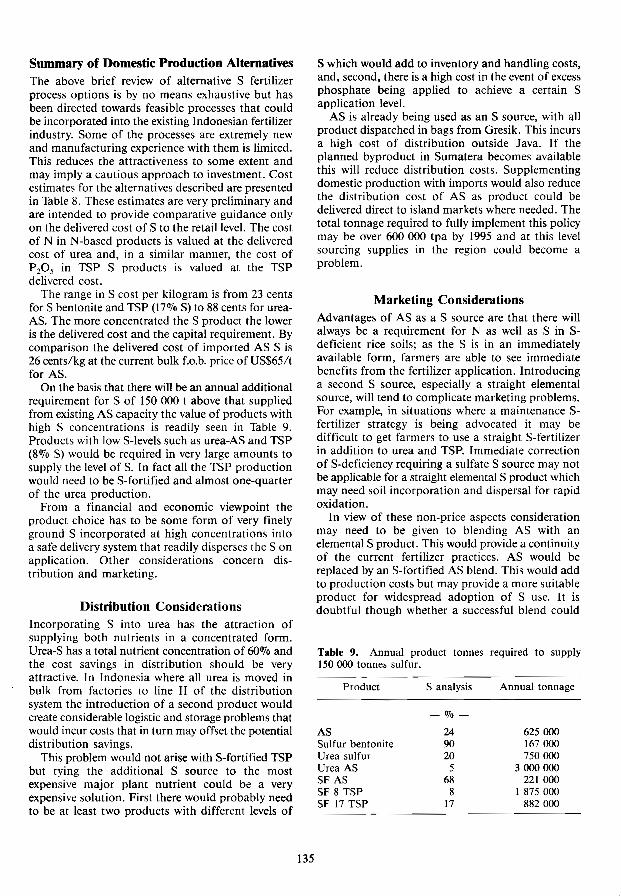
Summary of Domestic Production Alternatives The above brief review of alternative S fertilizer process options is by no means exhaustive but has been directed towards feasible processes that could be incorporated into the existing Indonesian fertilizer industry. Some of the processes are extremely new and manufacturing experience with them is limited. This reduces the attractiveness to some extent and may imply a cautious approach to investment. Cost estimates for the alternatives described are presented in Table 8. These estimates are very preliminary and are intended to provide comparative guidance only on the delivered cost of S to the retail level. The cost of N in N-based products is valued at the delivered cost of urea and, in a similar manner, the cost of P20 S in TSP S products is valued at the TSP delivered cost.
The range in S cost per kilogram is from 23 cents for S bentonite and TSP (171Jfo S) to 88 cents for ureaAS. The more concentrated the S product the lower is the delivered cost and the capital requirement. By comparison the delivered cost of imported AS S is 26 cents/kg at the current bulk f.o.b. price of US$65/t for AS.
On the basis that there will be an annual additional requirement for S of 150 000 t above that supplied from existing AS capacity the value of products with high S concentrations is readily seen in Table 9. Products with low S-levels such as urea-AS and TSP (81Jfo S) would be required in very large amounts to supply the level of S. In fact all the TSP production would need to be S-fortified and almost one-quarter of the urea production.
From a financial and economic viewpoint the product choice has to be some form of very finely ground S incorporated at high concentrations into a safe delivery system that readily disperses the S on application. Other considerations concern distribution and marketing.
Distribution Considerations Incorporating S into urea has the attraction of supplying both nutrients in a concentrated form. Urea-S has a total nutrient concentration of 6OIJfo and the cost savings in distribution should be very attractive. In Indonesia where all urea is moved in bulk from factories to line 11 of the distribution system the introduction of a second product would create considerable logistic and storage problems that would incur costs that in turn may offset the potential distribution savings.
This problem would not arise with S-fortified TSP but tying the additional S source to the most expensive major plant nutrient could be a very expensive solution. First there would probably need to be at least two products with different levels of
135
S which would add to inventory and handling costs, and, second, there is a high cost in the event of excess phosphate being applied to achieve a certain S application level.
AS is already being used as an S source, with all product dispatched in bags from Gresik. This incurs a high cost of distribution outside Java. If the planned byproduct in Sumatera becomes available this will reduce distribution costs. Supplementing domestic production with imports would also reduce the distribution cost of AS as product could be delivered direct to island markets where needed. The total tonnage required to fully implement this policy may be over 600 000 tpa by 1995 and at this level sourcing supplies in the region could become a problem.
Marketing Considerations Advantages of AS as a S source are that there will always be a requirement for N as well as S in Sdeficient rice soils; as the S is in an immediately available form, farmers are able to see immediate benefits from the fertilizer application. Introducing a second S source, especially a straight elemental source, will tend to complicate marketing problems. For example, in situations where a maintenance Sfertilizer strategy is being advocated it may be difficult to get farmers to use a straight S-fertilizer in addition to urea and TSP. Immediate correction of S-deficiency requiring a sulfate S source may not be applicable for a straight elemental S product which may need soil incorporation and dispersal for rapid oxidation.
In view of these non-price aspects consideration may need to be given to blending AS with an elemental S product. This would provide a continuity of the current fertilizer practices. AS would be replaced by an S-fortified AS blend. This would add to production costs but may provide a more suitable product for widespread adoption of S use. It is doubtful though whether a successful blend could
Table 9. Annual product tonnes required to supply 150000 tonnes sui fur.
Product S analysis Annual tonnage
- 0/0
AS 24 625000 Sulfur bentonite 90 167000 Urea sui fur 20 750000 Urea AS 5 3000000 SF AS 68 221 000 SF 8 TSP 8 1 875 000 SF 17 TSP 17 882000
be achieved with Indonesian AS due to the physical condition of the product.
Another aspect that needs to be considered is the impact of subsidy reduction and eventual removal. AS and TSP account for 60070 of the fertilizer subsidies in Indonesia and the continued policy of subsidy removal is going to increase the cost of these products to farmers. AS would increase in price by about 50% with full subsidy removal. The use of AS in severely S-deficient areas should not be affected but in marginally deficient areas the price increases may reduce demand and maintenance strategies will be affected.
Conclusion Considerable progress has been made in Indonesia towards correcting S-deficiency in food crop production in the past decade through the use of AS. Although national economic benefits have certainly been obtained the extent is unknown. The policy of import substitution for AS has not been economic but the current production capacity can be made economic on a sunk cost basis.
Additional domestic production of S fertilizers can be economic for concentrated dispersible agglomerations of finely ground S or S-fortification of TSP. The marketing flexibility of straight S products is seen as the major advantage for these products over additions to existing fertilizers.
Agronomic considerations of S form may need to be further defined but more importantly the extent and severity of S-deficiency by crop and region and the level of yield responses that may be anticipated are essential information that agronomists must provide to establish the need for correction and/or maintenance fertilizer strategies. Production and marketing strategies for additional S that is estimated to be required will be dependent on such considerations.
References Beaton, J. D. 1987. Desirable characteristics of S containing
fertilizers suitable for Asia and the Pacific region. Proceedings symposium on fertilizer sulfur requirements and sources in developing countries of Asia and the Pacific. Bangkok, 26-30 January, 1987. FADINAP, FAO, The Sulfur Institute and ACIAR.
Beaton, 1. D., Fox, R. L., and Jones, M. B. 1985. Production, marketing, and use of S products. In: Engelstad. O. P. ed. Fertilizer technology and use (3rd ed.) Madison, Wisconsin, Soil Society of America, 411-453.
Beaton, J. D. and Soper, R. J. 1986. Plant response to sulfur in Western Canada. In: Tabatabi, M. A. ed. Sulfur in agriculture. Madison, Wisconsin American Society of Agronomy, Agronomy Monograph No. 27, 375-403.
136
Blair, G. J. and Lefroy, R.D.B. 1987. Sulfur cycling in tropical soils and the agronomic impact of increasing use of S free fertilizers, increased crop production, and burning of crop residues. Proceedings symposium on fertilizer sulfur requirements and sources in developing countries of Asia and the Pacific. Bangkok, 26-30 January 1987. FADINAP, FAO, The Sulfur Institute and ACIAR.
Blair, G.J., Momuat, E.O., and Mamaril, C.P. 1979. Sulfur nutrition of rice 11: Effect of source and rate of S on growth and yield under flooded conditions. Agrononomy Journal, 71, 477-480.
Charleston, A.G. 1985. New Zealand Fertilizer Manufacturers Research Association, Research reports. June, 259-265.
1986. New Zealand Fertilizer Manufacturers Research Association, Research reports, June.
Chien, S.H., He!lums, D.T. and Henao, J. 1987. Greenhouse evaluation of elemental sulfur and gypsum for flooded rice. Soil Science Society of America Journal, 51, 120-123.
Diamond, R.B., Martinez, A., and Parish, D.H. 1983. Potential fertilizers for correcting S deficiencies. International Rice Research conference, Los Banos, Laguna, Philippines, IRRI.
Fisher, F. L. and Black, G. 1983. Sulfur-bentonite granules and their use. Abstract no. 24. Division of fertilizers and soil chemistry. 168th American Chemical Society National Meeting, Washington, D.e., August 28-September 2 1983.
Freisen, D. K. and Chien, S. H. 1986. Sulfur fertilizers and their application: general review and S source evaluation at IFDC. International Sulfur Symposium, Dhaka, Bangladesh, April 20-22 1986.
Gonzales,.P. B., Reyes, I. C., Villapando, R. R., Rosales. R. T. and Mamaril, C. P. 1986. Sulfur studies on some Philippine wetland rice soils. 2nd Annual Meeting of the Federation of Crop Science Society of the Philippines. Benguet State University, Mt Province, Philippines. April 30-May 2 1986.
Higgins, D. J. 1987. Some recent developments in S fertilizer technology. Proceedings Symposium on fertilizer sulfur requirements and sources in developing countries of Asia and the Pacific. Bangkok, 26-30 January. Organised by FADINAP, FAO, The Sulfur Institute and ACIAR.
IFDC. 1981. Kujang II. A prefeasability study. Alabama, USA. International Fertilizer Development Center.
Indonesian Fertilizer Producers Association. 1986. Indonesia: An Overview of the Fertilizer Sector. IFPA, Jakarta.
lsmunadji, M., Makarim, A. K. and Rushadi, A. 1987. Status report on the role of sulfur as a plant nutrient in Indonesia. Proceedings symposium on fertilizer sui fur requirements and sources in developing countries of Asia and the Pacific. Bangkok, 26-30 January 1987. FADlNAP, FAO, The Sulfur Institute and ACIAR.
Kanwar, 1. S. and Mudahar, M. S. 1986. In: Fertilizer Sulfur and Food Production. Dordrecht, Martinus NijhofflDr W. Junk Publications, 156-157.
Ministry of Agriculture. 1989. Indonesian Ministry of Agriculture, as reported by C.A. Rasaban and F. Kasryno,

Fertilizer Sulfur Consumption in Indonesia, Where Sulfur is Used and Why. Proceedings Seminar on SuI fur Fertilizer Policy for Lowland and Upland Rice Cropping Systems in Indonesia, July. MOA, ACIAR, AlDAB, Jakarta.
Morris, R. J. 1987. The importance and need for Sulfur in crop production in Asia and the Pacific Region. Proceedings symposium on fertilizer sulfur requirements and sources in developing countries of Asia and the Pacific. Bangkok, 26-30 January 1987. FADINAP, FAO, The Sulphur Institute and ACIAR.
Pusri, P. T., 1988 Personal communication, Jakarta, Indonesia.
137
Tandon, H.L.S. 1987. SuI fur containing fertilizers. Proceedings symposium on fertilizer S requirements and sources in developing countries of Asia and the Pacific. Bangkok, 26-30 January. Organised by FADINAP, FAO, The S Institute and ACIAR.
TisdaIe, S.L., Nelson, W. L. and Beaton, J. D. 1985. Soil Fertility and Fertilizers. (4th ed.). Macmillan. New York, NY.
World Bank. 1988. Indonesia, Fertilizer sector report. Asia region technical department. The World Bank, Washington, D.C., USA.
Extension Problems Associated with the Use of S Fertilizers
A. Rusadhi* and C Syarief**
Abstract Since 1984, Indonesia has reached a level of self-sufficiency in rice production, with annual
production of more than 25 million tonnes equivalent of unhusked rice. The extensive use of balanced fertilization has accounted for much of this success.
However, the rates of yield increment on rice have been gradually declining since 1984, signalling a levelling-off in productivity in many intensive rice-growing areas. Several causes have been identified, one of which is the deficiency of S. Trials conducted at many locations have shown responses in rice yield.
Although all sources of S have been found to give equivalent increases in rice yield, farmers choose ammonium sulfate (AS) fertilizer as it is more available in the market.
Considerable extension needs to be undertaken 10 encourage farmers to adopt S fertilizer technologies as an addition to their present practices in fertilization.
IN order to increase the food crops production to the level of self-sufficiency, the Indonesian Government has been conducting four major programs, namely Intensification, Extensification, Diversifieation and Rehabilitation. These programs are also applied to other commodities such as estate crops, horticultural crops, fish and tree crops.
Since the first year of the present Five-year Development Program (Indonesian abbreviation PELITA IV), Indonesia has been self-sufficient in rice. The main contributor to this success has been the intensification program. This success has to be maintained and extended to other food crops such as secondary field crops and horticultural crops.
In some agricultural areas, primarily in ricegrowing areas, deficiencies of some macronutrients such as potassium (K) and sulfur (S), as well as deficiencies in some micro nutrients such as zinc (Zn) and copper (Cu) have been identified. The appearance of these deficiencies is related to the intensification of agriculture since the start of PELITA I. The agricultural practices concerned are: the use of high-yielding varieties which are highly responsive to fertilization, the use of straight
* Directorate General of Food Crops Agriculture. **Directorate of Food Crops Projection Development,
Pasarminggu -1 akarta.
138
fertilizers with high nutrient contents, high cropping intensities, low returns of straw to the field and the use of pesticides containing low S or no S at all. New technologies which can maintain the rice production at the level of self-sufficiency are needed. The farmers then have to be educated to allow them to adopt these technologies, either personally or in groups.
Progress in Rice Production and Fertilizer Use
Rice production
Since the release in 1977 of the improved recommendations for the use of urea, TSP, KCl and AS fenilizers, and the use of the recommendations in the intensification programs, the average yield of rice (un husked) increased each year. From 1977 to 1984 the yield increased by 0.87 tlha (36.40/0) for BlMAS type of intensification and 0.86 t/ha (39.8%) for IMNAS type of intensification (Table 1).
Since 1984, the beginning of PELITA IV, Indonesia has reached self-sufficiency in rice, with an annual production of about 25.933 million t equivalent unhusked rice. However, the rates of increment of production have been declining, i.e. 80/0 in 1984, 2.3% in 1985, 0.9% in 1986 and 0.5% in 1987. A similar decline has been evident in yield per ha, as shown in Table 2. This is thought to be due to the use of high-yielding varieties which are highly
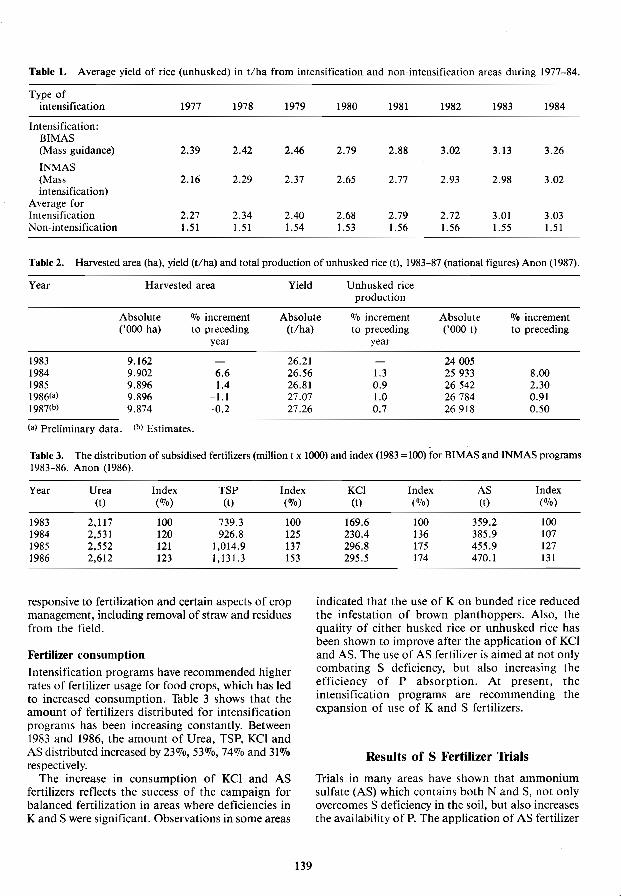
Table 1. Average yield of rice (unhusked) in t/ha from intensification and non-intensification areas during 1977-84.
Type of intensification 1977 1978 1979 1980 1981 1982 1983 1984
Intensification: BIMAS (Mass guidance) 2.39 2.42 2.46 2.79 2.88 3.02 3.13 3.26
INMAS (Mass 2.16 2.29 2.37 2.65 2.77 2.93 2.98 3.02 intensification)
Average for Intensification 2.27 2.34 2.40 2.68 2.79 2.72 3.01 3.03 Non-intensification 1.51 1.51 1.54 1.53 1.56 1.56 1.55 1.51
Table 2. Harvested area (ha), yield (t/ha) and total production of unhusked rice (t), 1983-87 (national figures) Anon (1987).
Year Harvested area Yield Unhusked rice production
Absolute 070 increment Absolute f\10 increment Absolute 1\10 increment
1983 1984 1985 1986(a) 1987{b)
('000 ha)
9.162 9.902 9.896 9.896 9.874
to preceding year
6.6 1.4
-1.1 -0.2
(a) Preliminary data. (h) Estimates.
(t/ha)
26.21 26.56 26.81 27.07 27.26
to preceding ('000 t) to preceding year
24005 1.3 25933 8.00 0.9 26542 2.30 1.0 26784 0.91 0.7 26918 0.50
Table 3. The distribution of subsidised fertilizers (million t x 1000) and index (1983 = 100) for BlMAS and INMAS programs \983-86. Anon (1986).
Year Urea Index TSP Index (t) (1\10) (t) (f\10)
1983 2,117 100 739.3 100 1984 2,531 120 926.8 125 1985 2,552 121 1,014.9 137 1986 2,612 123 1,131.3 153
responsive to fertilization and certain aspects of crop management, including removal of straw and residues from the field.
Fertilizer consumption
Intensification programs have recommended higher rates of fertilizer usage for food crops, which has led to increased consumption. Table 3 shows that the amount of fertilizers distributed for intensification programs has been increasing constantly. Between 1983 and 1986, the amount of Urea, TSP, KCl and AS distributed increased by 23070, 53070, 74070 and 31070 respectively.
The increase in consumption of KCl and AS fertilizers reflects the success of the campaign for balanced fertilization in areas where deficiencies in K and S were significant. Observations in some areas
139
KCI Index AS Index (t) (1\10) (t) (070)
169.6 100 359.2 100 230.4 136 385.9 107 296.8 175 455.9 127 295.5 174 470.1 131
indicated that the use of K on bunded rice reduced the infestation of brown planthoppers. Also, the quality of either husked rice or unhusked rice has been shown to improve after the application of KCl and AS. The use of AS fertilizer is aimed at not only combating S deficiency, but also increasing the efficiency of P absorption. At present, the intensification programs are recommending the expansion of use of K and S fertilizers,
Results of S Fertilizer Trials
Trials in many areas have shown that ammonium sulfate (AS) which contains both Nand S, not only overcomes S deficiency in the soil, but also increases the availability of P. The application of AS fertilizer

Table 4. The yield average (t/ha) of rice, corn and soybean from AS and TSP fertilizers trials held at some locations from 1983-84 to 1986-87. Anon (1987).
No. Crops Total of trial
locations
I. Bunded rice 138
2. Semi-bunded and upland rice 60
3. Corn 78
4. Soybean 36
a. I. Bunded rice at N -K (112.5 -60) kg/ha; 2. Semi-bunded rice at N -K (112.5 -30) kg/ha;
and upland rice at N -K ( 90 -30) kg/ha; 3. Corn at N -K ( 90 -30) kg/ha; 4. Soybean at N -K ( 22.5 -30) kg/ha;
is expected to improve the soil chemical environments for the rooting systems of the plants.
The average yields of the fertilizer trials using N, P, K and S are shown in Table 4.
Table 4 shows that the addition of Sand P elements increased the yield average of rice, corn and soybean. For bunded rice, the addition of 50.9 kg S/ha (equivalent to 200 kg AS/ha) and 63.5 kg pps/ha (equivalent to 150 kg TSP/ha) increased the yield by 0.75 tlha or by 13.3070 over the control. For semibunded rice and dryland rice, the application of 45.9 kg S/ha and 80.1 kg pps/ha increased the yield by 0.70 tlha or by 26.1% compared to the control yield. Similarly, the application of 37.7 kg S/ha and 66.2 kg pps/ha to corn increased the yield by 0.87 t/ha or 23.3% as compared to the control. For soybean, there was an increase of 0.28 t/ha or 25.4% over the control when 17.3 kg S/ha and 45.0 kg P20s/ha were used in addition to Nand K fertilizers.
The results of these fertilizer trials, and the observations from demonstration in development programs, have led to the following recommendations for use of S fertilizer in the form of ammonium sulfate:
The use of AS is recommended in the intensification areas which are deficient in S. For bunded rice, the recommended application is one-third of the recommended N with maximum application of 100 kg AS/ha. For areas which are deficient in S and respond to AS applications of up to 200 kg/ha, the recommended dose is not more than 150 kg AS/ha. For the very intensive areas (Special Intensification areas) which have already reached the productivity of more than 9.0 t/ha (husked rice, harvest dry weight) and have been treated
Fertilizer Yieldb Yield ratea (t/ha) increase
(kg/ha)
P20 S S max. control t/ha (070)
63.5 50.9 6.40 5.65 0.75 13.3
80.1 45.9 3.38 2.68 0.70 26.1
66.2 37.3 4.61 3.74 0.87 23.3
45.0 17.3 1.38 l.lO 0.28 25.4
140
b. I. (unhusked grains) 2. (unhusked grains)
(unhusked grains) 3. (grains) 4. (grains)
with TSP fertilizer in each growing season, the recommended use of AS is in the range of 100-150 kg/ha. To further encourage farmers to use a more balanced fertilization program, the use of AS is recommended in areas which are: deficient in S; practicing continuous rice planting throughout the year; lightlporous in soil textures; low in soil organic matter; and high in soil P status.
In addition to AS fertilizer trials, trials were held in the provinces of East Java and Lampung using gypsum as an alternative source of S. The results for bunded rice are shown in Table 5.
From Table 5 it can be seen that gypsum can be an alternative to AS as a source of S. Increased application of gypsum steadily increased grain yields. The highest grain yield (6.5 tlha) was achieved at the application of 30 kg S/ha from gypsum. When AS was used, the grain yield increased by 0.46 tlha or 7.4% over the control.
The Use of S Nutrient in the Context of Balanced Fertilization
The occurrence of S deficiencies on some major ricegrowing areas has led to efforts to increase the food crop productivity per unit of land through the use of balanced fertilization (N, P, K and S) practices. Technologies of balanced fertilization are expected to again raise production levels, which have given indications of levelling-off, and to improve the quality of rice grains and other food crops. Efforts to extend these technologies to the farmers include: campaigns on balanced fertilization, demonstration areas (demareas) on the practices of balanced fertilization,

Table 5. The response of bunded rice to S applications applied as either gypsum or ammonium sulfate.
Treatment Straw Husked-rice Yield increment code field-weight grain weight (kg/ha) (OTo)
(t/ha) (t/ha)
Recommended N,P,K (A) 9.61 5.62
A + 10kg S Gyspum 10.12 5.98 0.36 6.4
A + 20kg S Gypsum 11.45 6.27 0.65 11.6
A + 30kg S Gypsum 13.67 6.52 0.90 16.0
A + 20kg S A/S' 10.33 6.03 0.41 7.3
a Level of urea reduced to balance N.
Table 6. Detail of packages of technology used in Special Actions.
Name of package
A
Al
A2
B
C
D
Method used
'Panca Usaha' applied partially to marginal land
Non intensification areas raised to
General Intensification areas
General Intensification areas raised to Special Intensification areas
As above
Established Special Intensification Areas were made to be more intensive
As above
Soil tillage
full tillage
Component of technology Seed quality Fertilization
Pale-red labelled secds
Local, high . quality seeds
Certified seeds
As above
As above
Complete fertilizers
(NPKS)
As above
Complete fertilizers where:
-50 kg KCI/ha -1/3 N from AS maximum lOOkg/ha
As above
Complete nutrient (NPKS), where: -75 kg KCI/ha was
given -113 N from AS maximum JOOkg/ha
-Stimulants and specially blended liquid fertilizer
Notes: 'Panca Usaha' literally means 'Five efforts', Le. Five Recommended Cultural practices to be applied for increasing the food crops production: (a) proper land preparation and planting method; (b) proper water management; (c) use of high yielding varieties; (d) practices of balanced fertilization; (e) proper plant protection.
141

Table 7. The average yields of bunded rice from SUPRA INSUS programs in 5 provinces.
Target
No. Province Regency et/ha) (Ola)
1. West Sumatera Pariaman 6.6 100
2. West Java Subang 6.6 100
3. Central Java Pekalongan 6.6 100
4. East Java Jombang 6.6 100
5. South Sulawesi Sidrap 6.6 100
including the use of several plant growth regulators (stimulants) on rice crops, Special Actions to increase the rice crop production. and SUPRA INSUS (Supra Special Intensification).
The Campaign
In 1985 an extensive campaign on the practices of balanced fertilization, particularly on paddy fields deficient in S, was started. The campaign aimed at accelerating and extending the use of balanced fertilization practices by farmers, especially in the addition of KCl and AS fertilizers to the Nand P fertilizers applied. Activities included: i) improving the fertilizer recommendation specific
to each location, and more systematic and practicable recommendation books available to the extension officers in the field:
ii) holding fertilizer training sessions for the farmers in which the trainees learned the techniques of balanced fertilization and how to calculate
fertilizer requirements at the farmers' group level.
Demonstration area
In the 1985-86 cropping season there were 29 units of dem-area distributed through 20 regencies in Java. In 1986 and 1986-87 cropping seasons, the demonstration areas were extended to a total of 540 units, covering 117 regencies in 12 provinces. In several areas in Java, demonstrations on the practices of balanced fertilization were combined with the use of stimulants and specially blended liquid fertilizers.
Special actions
In 1987, Special Actions were aimed at securing the self-sufficiency of rice production in Indonesia. Recommended packages of production technology were made more detailed for each component and more specific to each farmers' group. The recommendations were classified into four types,
Grain yield
1987 1988 p1988-87
(t/ha) (070) (t/ha) (070) (t/ha) (070)
5.6 85 6.1 92 0.4 7
4.9 74 5.3 81 0.5 8
6.4 98 6.8 102 0.4 6
6.5 98 7.0 106 0.5 8
4.5 68 4.8 72 0.3 7
142
namely, Packages of Thchno!ogy A, B, C and D. Details of the packages are given in Table 6.
Supra lusus This was an integrated effort to increase food crops production involving many government institutions. It was a socioeconomic exercise in which co-operation between the farmers' groups in each extension area was improved. The result of this action was an increase in rice production (Table 7), as well as the farmers' revenue in several regencies in Indonesia. Table 7 shows that better management led to higher average yields in 1988 compared to those in 1987 in all locations.
Problems Associated with the Use of S Fertilizers
Sulfur deficiency has been identified worldwide including Indonesia. This problem was first reported in paddy fields in 1972, when the addition of S resulted in a significant increase in yield.
Several sources of S fertilizers such as elemental S powder, S coated urea (SCU), gypsum and ammonium sulfate (AS) have been tested. All these sources of S can be equally effective. Farmers will choose the fertilizer which is most easily found in the market and is easiest to handle. For these reasons, AS is more popular and has been used in intensification programs.
References
Anonymous. 1986. Guidance on intensification practices on BIMAS system. Directorate General of Food Crops, Jakarta.
1987. National Distribution System for Fertilizer. PT. Pupuk Sriwijaya.

ACIAR PROCEEDINGS SER TES RECENT TITLES
No. 16 Australian acacias in developing countries: proceedings of an international workshop held at the Forestry Training Centre, Gympie, Queensland, Australia, 4-7 August, 1986. John W. Turnbull (ed.), 196 p., 1987.
No. 17 Ticks and tick-borne diseases: proceedings of an international workshop on ecology of ticks and epidemiology of tick-borne diseases, held at Nyanga, Zimbabwe, 17-21 February, 1986. R.W. Sutherst (ed.), 159 p., 1987.
No. 18. Food legume improvement for Asia farming systems: proceedings of a workshop held at Khon Kaen, Thailand, 1-5 September, 1986. E.S. Wall is and D.E. Byth (ed.), 341 p.,1987.
No. 19. Technology change in postharvest handling and transportation of grains in the humid tropics: proceedings of an international workshop held at Bangkok, Thailand, 10-12 September, 1986. B.R. Champ, E. Highley and LV. Remenyi (ed.), 208 p., 1987.
No. 20. Management of wild and cultured sea bass/barramundi (Lates ca/carijer): proceedings of an international workshop held at Darwin, Northern Territory, Australia, 24-30 September, 1986 .. I.W. Copland and D.L. Grey (ed.), 210 p. 1987.
No. 21. Banana and plantain breeding strategies: proceedings of an international workshop held at Cairns. Australia, 13-17 October, 1986. O.J. Persley and E.A. De Langhe (ed.), 187 p.,1986.
No. 22. Bulk handling and storage of grain in the humid tropics: proceedings of an international workshop, Kuala Lumpur, Malaysia, 6-9 October, 1987. B.R. Champ and E. Highley (ed.), 296 p., 1988.
No. 23. Transport of fresh fruit and vegetables: proceedings of a workshop held at CSIRO Food Research Laboratory, North Ryde, Sydney, Australia, 5-6 February, 1987. P. Ferrar (ed.), 75 p., 1988.
No. 24. Smallholder agricultural development in Tonga: proceedings of a workshop held at the Institute for Rural Development, University of the South Pacific, Nuku'alofa, Tonga, 12-13 May, 1988. K.M. Menz (ed.), 50 p., 1988.
No. 25. Fumigation and controlled atmosphere storage of grain: proceedings of an international conference held at Singapore. 14-18 February, 1989. Bruce Champ and E. HigbJey {ed.) (In press).
No. 26. Economics of fishery management in the Pacific islands region: proceedings of an international conference held at Hobart. Tasmania, Australia, 20-22 March, 1989. H. Campbe\J, K. Menz and G. Waugh (cd.), 169 p., 1989.
No. 27. Draught animals in rural development: proceedings of an international research symposium, Cipanas, Indonesia, 3-7 July, 1989. D. Hoffmann, J. Navi and R.J. Petheram (cd.), 347 p. 1989.
No. 28. Tropical tree seed research: proceedings of an international workshop held at the Forestry Training Centre, Gympie, Queensland, Australia, 21-24 August. 1989. J.W. Turnbull (ed.), 156p., 1990.