Embed Size (px)
Citation preview

Achievement Gap Initiative At Harvard University
Getting It Done:Raising Achievement and Closing Gaps
in Whole School Systems: Recent Advances in Research and Practice

Deborah Jewell-Sherman, Ed.D.Superintendent
Yvonne W. Brandon, Ed.D.Deputy Superintendent
Victoria S. OakleyDirector of Instruction
Michael KightPrincipal, Albert Hill M.S.Richmond Public Schools
Richmond, VirginiaJune 17, 2008
PRESENTORS

Survival of Public Schooling
“If public schools survive, leaders will look very different from the way they presently look, both in who leads and what these leaders do.”
School Reform from the Inside OutDr. Richard Elmore

Richmond City Schools
24,247 Students88.3% Black7.1% White3.7% Hispanic1.0% Asian/Indian
20% Exceptional Education74% Economically Disadvantaged

Richmond City Schools
29 Elementary Schools9 Middle Schools8 High Schools5 Alternative/Exceptional Schools

Richmond Public Schools
Average School SizesElementary 430 studentsMiddle 648 studentsHigh 789 students
RICHMOND PUBLIC SCHOOLS
VisionA premier learning community that is the first choice for ALL in Richmond and recognized nationally for student excellence.
Mission
Educate ALL students to become highly successful, contributing citizens in a global society.

Virginia AccountabilitySchools receive two ratings based on the performance of students on
Virginia’s Standards of Learning Assessments (SOL).
Accreditation – the overall achievement in English, mathematics, science, and history. 70% benchmark for all students.
Adequate Yearly Progress (AYP) – goals established by the No Child Left Behind Act of 2001 (NCLB). Based on the overallachievement and achievement by student subgroups in reading and mathematics. Currently 77% for reading and 75% for mathematics increasing to 100% by 2013-2014.

Framework for ActionFocus the district on its primary goal –
Student Learning
Acknowledge the “Brutal Facts”

Accept the Brutal Facts!
RPS viewed as 2nd lowest performing school district in VirginiaNeed to meet VA Accreditation StandardsNeed to meet Federal Mandates – NCLB

Accept the Brutal Facts!
Incremental District GainsChoice for Parents ~ “Boutique” SchoolsMany content with examples of Individual Achievement & ExcellenceIntuitive Decision MakingDecentralized school systemLack of Accountability

Framework for ActionFocus the district on its primary goal –
Student Learning
Acknowledge the “Brutal Facts”Create a Sense of Urgency

Create a Sense of Urgency
The journey begins – 2002!
Status quo no longer acceptableCall to Excellence: Move from slow, incremental gains to demonstrated competence.

Framework for ActionFocus the district on its primary goal –
Student Learning
Acknowledge the “Brutal Facts”Create a Sense of UrgencyDesign and implement systemic improvement strategies

Design and Implement Systemic Improvement Strategies
No one person turns around a school district.
The leadership for the strategic improvement strategies we used in
RPS was cultivated from every sector of the district.

Charting The Course
A comprehensive accountability process On-going monitoring of schools’
progress toward achieving specified objectivesFormative & Summative AssessmentsData driven instructional decision-making “Real-time” feedback and prescriptive remedial strategies

Charting the Course DocumentPurpose of the Document
Provides data for analyzing school & student performance over time
3-year trendsDisaggregated data from prior school year
“Drives” the instructional plan for the yearIdentification of strengths & weaknessesInstructional conversations with staffTargeted staff development
Provides current data for monitoring progress

Charting the Course Document
Snapshot Data3-Year Trends & Last Year’s SOL Data
Test ResultsDiscipline ReferralsPercent of Attendance
Review of Disaggregated DataAYPSOL Subgroup Results“34” Reports Discipline Infractions

Ongoing Data CollectionBi-Weekly Data
Elementary (K-5)English/Reading, Mathematics, Science, Social Science
Middle (6-8)English, Mathematics, Algebra I, Geometry, Science, Earth Science, History/Social Science
High (9-12)English, Algebra I & II, Geometry, Earth Science, Biology, Chemistry, World History, World Geography, VA & US History, 11 History
Charting the Course Document

Albert H. Hill Middle School
486 Students85% Black13% White1% Hispanic1% Asian/Indian
28% Exceptional Education70% Economically Disadvantaged
(2006-2007 Statistics)

Albert H. Hill Middle SchoolMade AYP/Fully Accredited
3 Year English Performance
0
10
20
30
40
50
60
70
80
90
100
All Black White Disabilities Disadvantaged
Subgroup
Perc
ent P
assi
ng
200520062007

The Deming/Shewhart Improvement Cycle
DO
STUDY
PLAN
Act

Types of Data We CollectTypes of Data We Collect
AssessmentData
ProgramData
DemographicData

What is a Spreadsheet?
A spreadsheet is the computer equivalent of a paper ledger sheet. It consists of a grid made from columns and rows. It is an environment that can make number manipulation easy and somewhat painless.
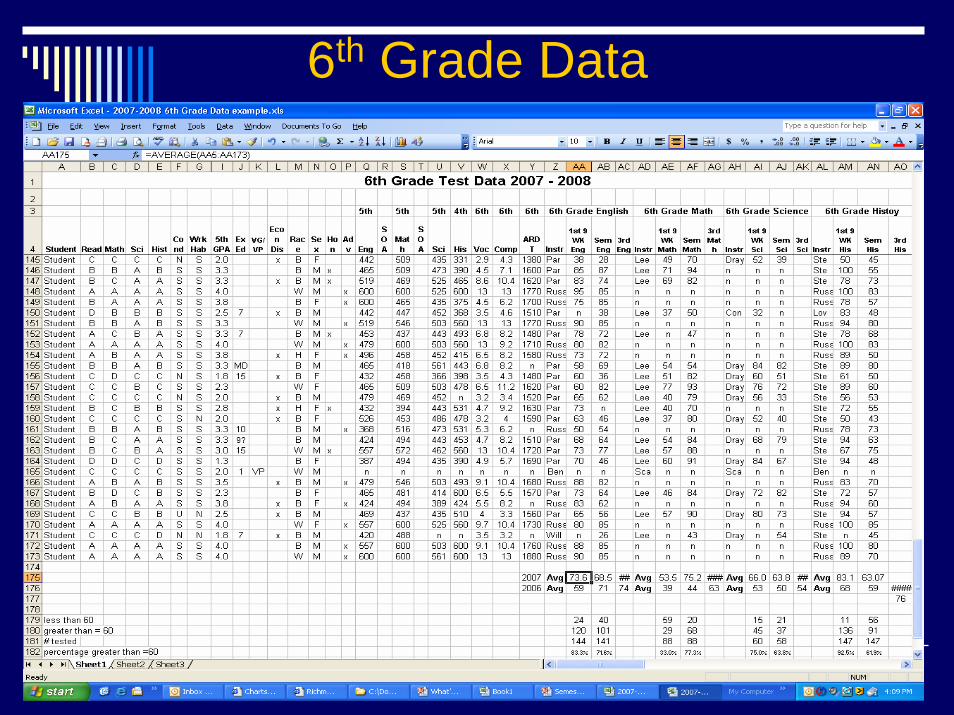
6th Grade Data

Graphs

Framework for ActionFocus the district on its primary goal –
Student Learning
Acknowledge the “Brutal Facts”Create a Sense of UrgencyDesign and implement systemic improvement strategies Provide Capacity Building Professional Development

NEW TEACHER & STAFF ORIENTATION


Building & Sustaining CapacityInstructional Staff
Developing capacity building, differentiated professional development for instructional staff
Initial FocusData AnalysisUse of student data for instructional decisionsStrategies for accelerating achievement and providing “real time” interventions

Capacity Building Professional Development
Theory of Action:Managed Instruction
A well-articulated, research-based curriculum aligned PreK-12
Curriculum Compass Curriculum Treasure Chest
Utilization of district-wide instructional model

Framework for ActionFocus the district on its primary goal –
Student Learning
Acknowledge the “Brutal Facts”Create a Sense of UrgencyDesign and implement systemic improvement strategies Provide Capacity Building Professional DevelopmentRestructure and Align Organization
Restructure and Align Organization
Move from decentralized to centralized instruction and accountabilityImplementation with fidelity throughout the school district

Framework for ActionFocus the district on its primary goal –
Student Learning
Implement Systemic Accountability

The Balanced Scorecard
EMPLOYEES AND ORG CAPACITYGoals Objectives
STUDENTS, CUSTOMERS AND STAKEHOLDERSGoals Objectives
FINANCIAL PERSPECTIVEGoals Objectives
INTERNAL BUSINESS PROCESSESGoals Objectives
VISION &MISSION
Implement Systemic Accountability

RPS REFORMSDISTRICT IMPROVEMENT SYSTEM
Balanced Scorecard
Aligns vision, mission and goals with strategic objectivesUses “Project Charter” to focus work of district on prioritiesProvides feedback on internal instructional and business processesMonitors progress and reports external outcomes

Making the ConnectionDistrict to School
Balance Scorecard
Charting the Course
School Improvement Plan

Framework for ActionFocus the district on its primary goal –
Student Learning
Implement Systemic AccountabilityForge Strategic Partnerships


Framework for ActionFocus the district on its primary goal –
Student Learning
Implement Systemic AccountabilityForge Strategic PartnershipsDocument the Journey


RPS2002 ~ 2007
RESULTS

Academic Achievement Significant Improvement!
05101520253035404550
2001 2002 2003 2004 2005 2006 2007
SOL NCLB
86% met State Accreditation; 100% HS and 93% ES80% of schools made AYP
RESULTS

Percent of Schools Meeting Federal & State Benchmarks
0102030405060708090
2003 2004 2005 2006 2007
SOLNCLB
RESULTS

Success Indicators – Moving
Class of 2006 Class of 2007
NCLB 48.9% 54.3% (+5.4%)
HSComp. 55.5% 67.2% (+11.7%)

Building & Sustaining CapacityInstructional Staff
Building “learning communities” in each school
Complementary FocusCore of expert“ lead teachers” in each schoolExpanded “induction” process for incoming teachers
RESULTS

Building & Sustaining CapacityInstructional Staff
Shared mission, vision, and valuesCollaborative workCollective inquiryAction orientation and experimentationCommitment to continuous improvement/mastery learningOutcome oriented
RESULTS

Building & Sustaining CapacityAdministrative & Support StaffTargeted professional development for non-instructional administrative and support staff
FocusClarity about #1 district goal – student achievementImprove effectiveness and efficiencyRealign resources to support instructional initiatives
RESULTS

Building & Sustaining CapacitySchool Board
RPS School Board
Professional Development at UVA Support of CGSC Audit Findings and RecommendationsFocus on Memorandum of Understanding with VADOE
RESULTS

Developing High Quality Workforce
Getting The Right People On The Bus
Recruitment, training, and retention of highly qualified teachers and staff through the combined efforts of RPS and the business community.
RESULTS

Community Collaboration
Establishment of partnerships with businesses, communities of faith, universities and other entities in all schools to enhance student achievement and post-secondary preparedness
RESULTS

RPS REFORMSFiscal Reform
An increasing percentage of the total budget allocated for teaching and learning on a yearly basisConsolidation of 6 schools
RESULTS

Touchstones on the Journey!
Blue Ribbon SchoolsDistinguished Title I SchoolsMilliken Award WinnerAll High Schools Fully AccreditedUS News & World Report – High SchoolsNational & State Recognitions for Excellence in Student Achievement

0.00
10.00
20.00
30.00
40.00
50.00
60.00
70.00
80.00
90.00
100.00
2005 2006 2007
EnglishMathScienceHist.5th
Fairfield Elementary School
LEGACY

ChallengesCost for Educating RPS Students
FY06* $12,219 per pupil cost76.0% Instruction11.4% Operations & Maintenance3.9% Transportation3.7% Food Services2.6% Administration2.4% Attendance & Health
*VDOE

Challenges in Urban School DistrictsStudent Membership
Long range projections -declining enrollmentDisproportionate growth/declineHigh Discipline & Drop Out RatesGraduation RateMore than 70% RPS schools – 50 % students below the poverty line in 2007Insufficient Parental Involvement
22,00022,20022,40022,60022,80023,00023,20023,40023,60023,80024,000
2004 2005 2006 2007
RPS

Challenges in Urban School Districts
Change in Local Governance
School Board Continuity
Funding 3 years of multi-million cutsFlat funding of local shareState Tax Revenue Forecast

Beyond CompetenceContinuation of Journey
“It’s about how you take a good organization and turn it into one that produces sustained great results.”
Jim Collins, Good to Great

Ongoing RPS Reform Agenda
School Board ~ Focus on “Whole Child”
Broaden concept of Academic AchievementIncorporate “Wellness” into daily learningFoster ethical behaviorRethinking Curriculum, Choice, Design

Generalizations
“It is hard to believe what you have never experienced!”“People must see, hear and experience high performing urban schools.”“People will have to want the change enough to work hard for it.”

Generalizations
Teams must understand the critical variables that influence change.Equity vs. Excellence – Cannot be a “zero sum” game. “. . . never lose faith in the end of the story.”
Admiral James Stockdale


![Achievement Gap[1]](https://img.dokumen.tips/doc/110x75/55842058d8b42aa81e8b4931/achievement-gap1-5584b8761200b.jpg)