Embed Size (px)
Citation preview

Achievement emotions and academic performance: longitudinal models of reciprocal effects Article
Accepted Version
Pekrun, R., Lichtenfeld, S., Marsh, H., W., Murayama, K. and Goetz, T. (2017) Achievement emotions and academic performance: longitudinal models of reciprocal effects. Child Development, 88 (5). pp. 1653-1670. ISSN 0009-3920 doi: https://doi.org/10.1111/cdev.12704 Available at https://centaur.reading.ac.uk/65981/
It is advisable to refer to the publisher’s version if you intend to cite from the work. See Guidance on citing .
To link to this article DOI: http://dx.doi.org/10.1111/cdev.12704
Publisher: Wiley-Blackwell
All outputs in CentAUR are protected by Intellectual Property Rights law, including copyright law. Copyright and IPR is retained by the creators or other copyright holders. Terms and conditions for use of this material are defined in the End User Agreement .
www.reading.ac.uk/centaur
CentAUR

Central Archive at the University of Reading Reading’s research outputs online

Running head: EMOTION AND ACHIEVEMENT 1
Achievement Emotions and Academic Performance:
Longitudinal Models of Reciprocal Effects
Reinhard Pekrun
University of Munich and Australian Catholic University
Stephanie Lichtenfeld
University of Munich
Herbert W. Marsh
Australian Catholic University and University of Oxford
Kou Murayama
University of Reading
Thomas Goetz
University of Konstanz and Thurgau University of Teacher Education
Child Development, in press

Running head: EMOTION AND ACHIEVEMENT 2
Author Note
Reinhard Pekrun, Department of Psychology, University of Munich, Munich, Germany, and
Institute for Positive Psychology and Education, Australian Catholic University, Sydney,
Australia; Stephanie Lichtenfeld, Department of Psychology, University of Munich, Munich,
Germany; Herbert W. Marsh, Institute for Positive Psychology and Education, Australian
Catholic University, Sydney, Australia, and Department of Education, University of Oxford,
Oxford, UK; Kou Murayama, Department of Psychology, University of Reading, Reading, UK;
Thomas Goetz, Department of Empirical Educational Research, University of Konstanz,
Konstanz, Germany, and Thurgau University of Teacher Education, Thurgau, Switzerland.
This research was supported by a LMU Research Chair grant awarded to R. Pekrun by
the University of Munich and four grants from the German Research Foundation (DFG) to R.
Pekrun (PE 320/11-1, PE 320/11-2, PE 320/11-3, PE 320/11-4). Parts of this paper were
presented at the annual meeting of the American Educational Research Association,
Philadelphia, PA, April 2014, and at the International Congress of Applied Psychology, France,
Paris, July 2014.
Correspondence concerning this article should be addressed to Reinhard Pekrun,
Department of Psychology, University of Munich, Leopoldstrasse 13, 80802 Munich, Germany.
E-mail: [email protected]

Running head: EMOTION AND ACHIEVEMENT 3
Abstract
A reciprocal effects model linking emotion and achievement over time is proposed. The model
was tested using five annual waves of the PALMA longitudinal study, which investigated
adolescents’ development in mathematics (grades 5-9; N=3,425 German students; mean starting
age=11.7 years; representative sample). Structural equation modeling showed that positive
emotions (enjoyment, pride) positively predicted subsequent achievement (math end-of-the-year
grades and test scores), and that achievement positively predicted these emotions, controlling for
students’ gender, intelligence, and family socio-economic status. Negative emotions (anger,
anxiety, shame, boredom, hopelessness) negatively predicted achievement, and achievement
negatively predicted these emotions. The findings were robust across waves, achievement
indicators, and school tracks, highlighting the importance of emotions for students’ achievement
and of achievement for the development of emotions.
Keywords: achievement emotion, anxiety, academic achievement, mathematics
achievement, control-value theory

Running head: EMOTION AND ACHIEVEMENT 4
Research has shown that children’s and adolescents’ emotions are linked to their academic
achievement. Typically, positive emotions such as enjoyment of learning show positive links
with achievement, and negative emotions such as test anxiety show negative links (for
overviews, see Goetz & Hall, 2013; Pekrun & Linnenbrink-Garcia, 2014; Zeidner, 1998).
However, most of the available studies were correlational and do now allow any inferences about
the causal ordering of emotion and achievement over time. As such, it remains unclear how the
observed links should be interpreted. It is open to question if students’ emotions impact their
learning, if success and failure at learning influence the development of their emotions, if other
variables cause the association, or if several of these possibilities are at work. Given the need to
acquire knowledge about the antecedents of both students’ achievement and their emotions, this
is an issue of considerable theoretical and practical importance. To address this issue, the present
investigation went beyond merely observing correlations at a single point in time and attempted
to disentangle the causal ordering of these constructs across multiple waves of data collection
and a developmental time span of several school years.
The investigation is based on a reciprocal effects model of emotion and achievement which
posits that the two variables reciprocally influence each other over time. This stands in contrast
to traditional unidirectional perspectives, which suggest that the link between emotion and
achievement is simply due to effects of emotions on students’ learning and performance. For
example, correlations between test anxiety and students’ achievement were interpreted as
indicating that anxiety impacts achievement, and test anxiety theories put forward various
suggestions about mediating mechanisms (e.g., cognitive interference, motivation; Zeidner,
1998, 2014). In a similar vein, in studies on affect and performance more generally, researchers
have been interested in the impact of moods and emotions on cognitive performance and created
Running head: EMOTION AND ACHIEVEMENT 5
various theories targeting this influence (Clore & Huntsinger, 2009).
Certainly an analysis of the effects of emotions is important as it can document the
functional relevance of emotions. However, what about the reverse causal direction, that is, the
impact of achievement on the development of emotions? In other words, what about emotions as
outcomes rather than causes of achievement? Herein we argue that this alternative causal
direction is no less important. Beyond their functions, emotions are developmental outcomes that
are in and of themselves important, because they are core components of identity, well-being,
and health. By implication, researchers and practitioners alike should attend to the antecedents of
students’ emotions, and academic achievement is certainly one promising candidate---academic
successes and failures possibly shape the development of emotions. As such, we concur with
traditional perspectives in assuming that emotions impact achievement, but we also extend this
notion and expect that achievement reciprocally influences emotion.
Empirical evidence on the causal ordering of students’ emotions and their achievement is
largely lacking, with a few exceptions pertaining to achievement-related anxiety. Specifically,
longitudinal investigations suggested that K-12 students’ test anxiety and academic achievement
reciprocally influence each other (Meece, Wigfield, & Eccles, 1990; Pekrun, 1992).
Furthermore, in a study of mathematics anxiety by Ma and Xu (2004), adolescents’ achievement
in mathematics had negative effects on their subsequent math anxiety, and anxiety had negative
effects on subsequent achievement for two of the five time intervals included. The failure to find
effects of anxiety on achievement for the other time intervals was likely due to the high stability
of the achievement variable across waves (autogressive ßs > .95). For children’s and adolescents’
achievement emotions other than anxiety, evidence on reciprocal links with academic
achievement is lacking.

Running head: EMOTION AND ACHIEVEMENT 6
In the following sections, we use Pekrun’s (2006; Pekrun & Perry, 2014) control-value
theory of achievement emotions to derive a theoretical framework for the reciprocal causation of
emotion and achievement. This model expands upon previous models on the linkages of anxiety
and boredom with achievement (Meece, Wigfield, & Eccles, 1990; Pekrun, 1992; Pekrun, Hall,
Goetz, & Perry, 2014; Zeidner, 1998) by addressing not only negative emotions but positive
emotions as well. We tested this model using a longitudinal dataset that examined adolescents’
emotions and achievement in mathematics over a period of five school years.
A Reciprocal Effects Model of Emotion and Achievement
The control-value theory (Pekrun, 2006; Pekrun & Perry, 2014) integrates propositions
from expectancy-value, attributional, and control approaches to achievement emotions (Folkman
& Lazarus, 1985; Pekrun, 1992; Turner & Schallert, 2001; Weiner, 1985). Achievement
emotions are defined as emotions related to achievement activities and their success and failure
outcomes. The theory posits that these emotions are aroused by cognitive appraisals of control
over, and the subjective value of, achievement activities and their outcomes. Control appraisals
consist of perceptions of one’s competence to successfully perform actions (i.e., academic self-
concepts and self-efficacy expectations) and to attain outcomes (outcome expectations). Value
appraisals pertain to the perceived importance of these activities and outcomes. Furthermore, the
theory posits that these emotions, in turn, influence achievement behavior and performance.
Since performance outcomes shape subsequent perceptions of control over performance, one
important implication is that emotions, their appraisal antecedents, and their performance
outcomes are linked by reciprocal causation. In terms of reciprocal causation, the theory is
consistent with reciprocal effects models for variables such as students’ self-concepts (Marsh &
Craven, 2006; Marsh, Trautwein, Lüdtke, Köller, & Baumert, 2005), achievement goals

Running head: EMOTION AND ACHIEVEMENT 7
(Linnenbrink & Pintrich, 2002), and anxiety (Pekrun, 1992).
Effects of Emotion on Achievement
In the control-value theory, two dimensions describing human affect are used to distinguish
types of emotions, namely valence (positive vs. negative or pleasant vs. unpleasant) and
activation (activating vs. deactivating). Using these dimensions renders four broad groups of
emotions: positive activating (e.g., enjoyment, hope, pride), positive deactivating (e.g.,
relaxation, relief), negative activating (e.g., anger, anxiety, shame), and negative deactivating
(e.g., boredom, hopelessness). The theory proposes that these emotions influence students’
cognitive resources, motivation to learn, and use of learning strategies, thus impacting their
achievement (for an in-depth discussion, see Pekrun & Linnenbrink-Garcia, 2012).
Positive activating emotions (e.g., enjoyment of learning) are thought to preserve cognitive
resources and focus attention on the learning task, support interest and intrinsic motivation, and
facilitate deep learning. Accordingly, these emotions are expected to positively influence
students’ academic achievement under most task conditions. The opposite pattern of effects is
proposed for negative deactivating emotions (boredom, hopelessness). These emotions are
thought to reduce cognitive resources and task-related attention, to undermine both intrinsic and
extrinsic motivation, and to promote shallow information processing. Accordingly, negative
deactivating emotions are expected to negatively influence students’ achievement.
Achievement effects are posited to be more variable for the remaining two categories of
emotion. Deactivating positive emotions (relaxation, relief) are thought to reduce attention and
effort in the moment, but they can strengthen long-term motivation to reengage with learning.
Activating negative emotions (anger, anxiety, shame) are thought to reduce cognitive resources
by inducing irrelevant thinking, such as worries about failure in test anxiety, and to undermine

Running head: EMOTION AND ACHIEVEMENT 8
intrinsic motivation. On the other hand, these emotions can trigger extrinsic motivation to invest
effort to avoid failure. Furthermore, they can facilitate the use of more rigid learning strategies,
such as rote memorization. However, notwithstanding individual differences regarding effects,
we expect that the average overall influence of positive deactivating emotions on achievement is
positive, and that the average overall influence of negative activating emotions is negative. For
negative activating emotions such as anxiety, this hypothesis is consistent with the available
evidence, which indicates that the correlations between these emotions and academic
achievement are typically negative (Hembree, 1988; Zeidner, 1998, 2014).
Reverse Effects of Achievement on the Development of Emotion
Achievement reciprocally influences the appraisals that are considered to be proximal
antecedents of emotion. As implied by the control-value theory as well as other models of
achievement emotion (e.g., Folkman & Lazarus, 1985), positive emotions are thought to be
promoted when perceived competence and control over achievement activities are high. For
example, students should enjoy learning when they judge themselves competent to master the
learning task, provided they are interested in the material. Negative emotions should result when
perceived competence and control are low. For example, anxiety about an upcoming important
exam should be high if students judge themselves incompetent to pass it. One possible exception
is boredom, which could be promoted by high perceived competence if coupled with low task
demands (i.e., under-challenge); however, in an academic context, boredom also has been found
to be linked to students’ lack of perceived competence and control (e.g., Pekrun et al., 2010).
Perceived competence and control are thought to influence both students’ momentary emotions
within a specific situation and their habitual, re-occurring emotions, which are based on re-
occurring appraisals and related control-value beliefs (for summaries of empirical evidence, see

Running head: EMOTION AND ACHIEVEMENT 9
Daniels & Stupnisky, 2012; Pekrun & Perry, 2014).
Perceived competence and control depend on students’ individual achievement history,
with success strengthening control and failure undermining it. Hence, achievement is expected to
have positive effects on perceived control. Since achievement has positive effects on control, and
control has positive effects on positive emotions, it follows that students’ achievement should
have positive effects on the development of positive emotions. Similarly, since achievement has
positive effects on control, and control has negative effects on negative emotions, it follows that
achievement should have negative effects on the development of negative emotions.
Feedback Loops of Emotion and Achievement over Time
Because emotions are posited to influence achievement and achievement, in turn, to
influence emotion, the two constructs are thought to be linked by reciprocal causation over time.
Both effects are expected to be positive for positive emotions, amounting to positive feedback
loops, and both effects are expected to be negative for negative emotions, which also amounts to
positive feedback loops. We acknowledge that there may be negative feedback loops for negative
activating emotions in some students and under some conditions (e.g., failure on an exam
instigating a student’s anxiety, and anxiety eliciting effort to avoid failing the next exam; Pekrun,
1992). However, the existing evidence summarized above implies that negative activating
emotions typically are aroused by failure and contribute to subsequent failure, suggesting that
feedback loops should be positive for these emotions as well in the average student.
Overview of the Present Research
We tested the proposed reciprocal effects model using a longitudinal investigation of
adolescents’ development in mathematics (Project for the Analysis of Learning and Achievement
in Mathematics, PALMA; see Frenzel, Goetz, Lüdtke, Pekrun, & Sutton, 2009; Frenzel, Pekrun,

Running head: EMOTION AND ACHIEVEMENT 10
Dicke, & Goetz, 2012; Marsh et al., in press; Murayama, Pekrun, Lichtenfeld, & vom Hofe,
2013; Murayama, Pekrun, Suzuki, Marsh, & Lichtenfeld, in press; Pekrun et al., 2007). To test
models of reciprocal causal linkages, designs are needed that assess both variables at multiple
points in time (Little, Preacher, Selig, & Card, 2007; McArdle, 2009; Rosel & Plewis, 2008).
Although such designs cannot fully rule out alternative causal explanations, they are better suited
to test causal propositions than cross-sectional designs or longitudinal designs that do not control
for prior levels of outcome variables. The PALMA study involved annual assessments of both
emotions and achievement, thus making it possible to conduct cross-lagged analyses examining
reciprocal causation. This study design made it possible to conduct multiple tests for the effects
of emotion on subsequent achievement, and of achievement on subsequent emotion, while
controlling for prior emotion and achievement levels.
For the present analysis, we used the grade 5 to 9 data from the PALMA study. As such,
the analysis involved five assessments for emotions and five assessments of achievement. These
assessments span the time from the beginning of secondary school (grade 5) to the end of
compulsory schooling in Germany (grade 9). At the start of secondary school, students are
selected into one of three tracks, including lower-track schools (Hauptschule), medium-track
schools (Realschule), and higher-track schools (Gymnasium), based on their elementary school
achievement. There is no additional school transition until the end of secondary school and
students usually remain in the same school.
As such, whereas math teachers and the specific classroom context can change, the broad
academic context for students’ affective development remains relatively stable across this time
period. Specifically, contextual factors defining the emotional salience of achievement, such as
the visibility and frequency of feedback on achievement, remain stable during this period. The

Running head: EMOTION AND ACHIEVEMENT 11
stability of context does not preclude changes in individual levels of emotion (e.g., due to
repeated success or failure and the influence of teachers and peers). However, given the stability
of context, we expected relations between students’ trait-like emotions considered in this study
and their achievement to be stable as well, with effects of these emotions on achievement, and
effects of achievement on emotions, showing equivalence (i.e., developmental equilibrium)
across each of the one-year intervals included.
Seven distinct mathematics emotions were measured, including math-related enjoyment,
pride, anger, anxiety, shame, boredom, and hopelessness. These emotions were selected based on
their frequency and theoretical relevance (Pekrun et al., 2007). They were measured as trait-like
variables, that is, students’ habitual, re-occurring emotions in mathematics. Habitual emotions
can influence learning and achievement over a longer time span, in contrast to momentary
emotional episodes. In addition, we considered summary constructs of positive and negative
affect derived from integrating scores for positive and negative emotions, respectively. As
compared with multiple discrete emotions, these constructs render a more parsimonious
description of students’ affective development (Linnenbrink, 2007).
Achievement was assessed by students’ end-of-the-year grades in mathematics, which are
derived from multiple evaluations across the school year and represent students’ cumulative
performance. As such, these grades are suited to examining the impact of emotions on the long-
term development of achievement. In addition, test scores from the PALMA mathematical
achievement test (see Pekrun et al., 2007) were included to examine the generalizability of the
findings across different achievement outcomes. These scores reflect generic mathematical
competencies whereas grades represent students’ curriculum-related achievement in the
classroom, which should be more closely related to their emotions. Accordingly, we expected

Running head: EMOTION AND ACHIEVEMENT 12
effects to be stronger for grades than for the test scores.
Structural equation modeling was used to test the reciprocal effects model. To ensure that
any observed relations were not mere artifacts of other plausible variables, we controlled for
students’ gender, intelligence, and family socio-economic status (SES) in the analysis. In
addition, we examined the equivalence of relations across school tracks. We expected the effects
linking emotion and achievement to be consistent over time and school tracks but modest in size
due to controlling for autoregressive effects, intelligence, and demographic variables.
Method
Participants and Design
The sample consisted of German adolescents who participated in the PALMA longitudinal
study (Pekrun et al., 2007). The study included annual assessments from grades 5 to 9 (2002-
2006). Sampling and the assessments were conducted by the Data Processing and Research
Center (DPC) of the International Association for the Evaluation of Educational Achievement
(IEA). Samples were drawn from schools within the state of Bavaria and were representative of
the student population of this state in terms of student characteristics such as gender, urban
versus rural location, and family background (SES; for details, see Pekrun et al., 2007). At each
grade level, the students answered the questionnaire towards the end of the school year. All
instruments were administered in the students’ classrooms by trained external test administrators.
At the first assessment (grade 5), the sample included 2,070 students from 42 schools
(49.6% female, mean age = 11.7 years). The sample comprised students from all three school
types within the Bavarian public secondary school system as described earlier, including lower-
track schools (Hauptschule, 37.2% ), intermediate-track schools (Realschule, 27.1%), and
higher-track schools (Gymnasium, 35.7%). These three school types differ in average student

Running head: EMOTION AND ACHIEVEMENT 13
achievement due to the selection of students by entry-level achievement (see Murayama et al.,
2013). The distribution of students across tracks represents the distribution in the population. In
each subsequent year, the study not only tracked the students who had participated in the
previous assessment(s), but also incorporated those students who had not yet participated in the
study but had become members of PALMA classrooms at the time of the assessment (for details
on sampling procedures, see Pekrun et al., 2007). This strategy resulted in the following sample
sizes for the subsequent years: 2,059 students in grade 6 (50.0% female, mean age = 12.7 years);
2,397 students at grade 7 (50.1% female, mean age = 13.7 years); 2,410 students at grade 8
(50.5% female, mean age = 14.8 years); 2,528 students at grade 9 (51.1% female, mean age =
15.6 years). Across all five assessments (i.e., grades 5 to 9), a total of 3,425 students (49.7%
female) took part in the study. 38.7% of the total sample participated in all five assessments, and
9.0%, 18,9%, 15.1%, and 18.3% completed four, three, two, or one assessment(s), respectively.
Measures
Emotions. Students’ emotions in mathematics were measured using the Achievement
Emotions Questionnaire-Mathematics (AEQ-M; Pekrun, Goetz, Frenzel, Barchfeld, & Perry,
2011). The instructions for the instrument ask respondents to describe how they typically feel
when attending class, doing homework, and taking tests and exams in mathematics; in this way,
the AEQ-M assesses students’ habitual, trait-like math-related emotions. The instrument
comprises seven scales measuring mathematics enjoyment (9 items, e.g., “I enjoy my math
class”), pride (8 items; e.g., “After a math test, I am proud of myself”), anger (8 items; e.g., “I
am annoyed during my math class”), anxiety (15 items; e.g., “I worry if the material is much too
difficult for me”), shame (8 items; e.g., “I am ashamed that I cannot answer my math teacher’s
questions well”), hopelessness (6 items; e.g., “During the math test, I feel hopeless”), and

Running head: EMOTION AND ACHIEVEMENT 14
boredom (6 items; e.g., “My math homework bores me to death”). Participants responded on a 1
(strongly disagree) to 5 (strongly agree) scale, and the scores were summed to form the emotion
indexes (Alpha range .86 to .92 across all scales and measurement occasions; see Table 1). The
scores were also used to derive indexes for positive and negative affect factors combining
positive and negative emotions, respectively (see Data Analysis section).
Achievement. Students’ achievement was assessed by their end-of-the-year grades in
mathematics as retrieved from school documents and by standardized test scores.
End-of-the-year grades. These grades are summative scores based on multiple exams
within each school year; they represent students’ achievement in the math curriculum for the
respective year. Grades range from 1 (excellent) to 6 (poor). Grade scores were reversed prior to
the analysis to ease interpretation.
Test scores. The test scores were derived from the PALMA Mathematics Achievement
Test (Pekrun et al., 2007) which measures students’ competencies in arithmetics, algebra, and
geometry. The test includes different test forms for different grade levels and includes anchor
items to allow for the linkage of test forms across assessments. The obtained scores were scaled
using one-parameter logistic item-response theory (Rasch scaling; see Murayama et al., 2013).
Background variables. Demographic variables (gender and SES) and intelligence were
included as covariates in the analysis. Gender was coded 1 = female, 2 = male.
Intelligence. Intelligence was measured at Time 1 (grade 5) using the 25-item nonverbal
reasoning subtest of the German adaptation of Thorndike’s Cognitive Abilities Test (Kognitiver
Fähigkeitstest [KFT 4–12 + R]; Heller & Perleth, 2000).

Running head: EMOTION AND ACHIEVEMENT 15
Socio-economic status. SES was assessed by parent report using the EGP classification
(Erikson, Goldthorpe, & Portocarero, 1979), which consists of six ordered categories of parental
occupational status. Higher values represent higher SES.
Strategy of Data Analysis
Structural equation modeling (SEM; Mplus, Version 7; Muthén & Muthén, 2012) was
used to evaluate the reciprocal effects model. We estimated two sets of models. The first set used
grades, and the second set used test scores as the achievement measure. In both sets, eight
different models were estimated, including seven separate models for the discrete emotions and
one integrative model combining all emotions into two second-order positive and negative affect
factors. There was substantial multicollinearity between the emotion variables in the dataset
(Table 1). As such, the present analysis combines two strategies to deal with multicollinearity,
namely, using single variables (separate discrete emotion models) and combining them by
constructing summary variables (integrative affect models). The separate discrete emotion
models also served to examine if the links between emotion and achievement were sufficiently
similar to combine emotions into the summary positive and negative affect constructs.
All of the models represent a cross-lagged format, with emotion at each assessment
influencing subsequent achievement one year later, and achievement at each assessment
influencing subsequent emotion one year later (Figure 1). As such, the discrete emotion models
include four paths from emotion to achievement and four paths from achievement to emotion. In
the affect models, there were eight paths from positive and negative affect to achievement, eight
paths from achievement to positive and negative affect, as well as four paths from positive to
negative affect and four paths from negative to positive affect (Figure 1). The emotion variables
were modeled as latent constructs. The achievement measure and the three background measures

Running head: EMOTION AND ACHIEVEMENT 16
(gender, intelligence, and SES) were evaluated as manifest variables. The background variables
were included as covariates; for each of these variables, directional paths to all of the emotion
variables and to all of the achievement variables were included.
We estimated two versions for all of the 16 models. In the first version, autoregressive
coefficients, cross-paths, and factor residual variances were freely estimated. In the second
version, all three parameters were constrained to be invariant across time intervals
(developmental equilibrium; e.g., the effects of Time n emotion on Time n+1 achievement were
constrained to be the same from each wave to the next).
Measurement models for latent variables. The emotion scale items were used as
indicators for each of the latent emotion variables. Following recommendations by Pekrun et al.
(2011), a correlated uniqueness approach was used by including correlations between residuals
for items representing the same setting (attending class, doing homework, and taking tests and
exams in mathematics). In addition, correlations between residuals for identical emotion items
across measurement occasions were included to control for systematic measurement error.
The latent affect factors were constructed in a two-step procedure. We first conducted
separate confirmatory factor analyses for each of the seven emotions across the five assessments
and derived emotion factor scores from these analyses (it was not possible to conduct a
confirmatory factor analysis with all emotion items across all assessments, i.e., 60 x 5 = 300
items, due to computational limitations). We then used these factor scores to construct one
integrative affect measurement model. For this model, factor scores for the positive emotions
served as indicators for positive affect, and factor scores for the negative emotions served as
indicators for negative affect. As such, the two affect constructs represent second-order factors.

Running head: EMOTION AND ACHIEVEMENT 17
Measurement equivalence across waves and school tracks. Prior to the main SEM
analyses, we sought to establish measurement equivalence of the latent emotion and affect
constructs over time and schools tracks. For each of the emotion and affect variables, we
sequentially evaluated models of configural, metric, scalar, and residual invariance (Meredith,
1993). Configural invariance is defined by equal patterns of factor loadings. Metric invariance
additionally requires equal factor loadings, scalar invariance requires equal factor loading and
intercepts, and residual invariance requires equal factor loadings, intercepts, and residual
variances. To establish equivalence of constructs for analyzing correlations and path coefficients,
metric invariance is the minimum needed (Chen, 2007; Steenkamp & Baumgartner, 1998). To
compare model fit, we followed recommendations by Chen (2007). Provided adequate sample
size, for testing metric invariance, a change of > -.010 in CFI, supplemented by a change of >
.015 in RMSEA or a change of > .030 in SRMR would indicate noninvariance; for testing scalar
or residual invariance, a change of > -.010 in CFI, supplemented by a change of > .015 in
RMSEA or a change of > .010 in SRMR would indicate noninvariance. As recommended, we
did not use the difference test because it is overly sensitive to sample size (Marsh, Balla, &
McDonald, 1988).
Hierarchical data structure, estimator used, and missing values. As students were
nested in schools, we corrected for the clustering of the data using the <type=complex> option
implemented in Mplus (Muthén & Muthén, 2012). As noted, schools in the German public
secondary school system differ in average student achievement due to the between-schools
tracking based on achievement, indicating that nestedness within schools needs to be considered.
The <type=complex> option corrects standard errors for nestedness while preserving use of the
covariance matrix from the full sample to calculate parameters.

Running head: EMOTION AND ACHIEVEMENT 18
To estimate the model parameters, the robust maximum likelihood estimator (MLR) was
employed which is robust to nonnormality of the observed variables. To make full use of the data
from students with missing data, we applied the full information likelihood method (FIML;
Enders, 2010). FIML has been found to result in trustworthy, unbiased estimates for missing
values even in the case of large numbers of missing values (Enders, 2010) and to be an adequate
method to manage missing data in longitudinal studies (Jeličič, Phelps, & Lerner, 2009). To
examine the robustness of the analysis, we replicated the cross-lagged analyses for emotion and
achievement with the subsample of students who participated in the study from the beginning (N
= 2,070). As compared to the models using the full sample, there were no substantial differences
in model fit ( CFI < .007, RMSEA < .006, and SRMR < .007 for all of the models), and the
substantive results were essentially the same (see Supplemental Material, Tables S6 and S7).
Goodness-of-fit indexes to evaluate model fit. We applied both absolute and
incremental fit indices to evaluate the fit of the models, including the comparative fit index
(CFI), the Tucker-Lewis index (TLI), the root-mean-square-error of approximation (RMSEA),
and the standardized-root-mean residual (SRMR). Traditionally, values of CFI and TLI higher
than .90 and close to .95, values of RMSEA lower than .06, and values of SRMR lower than .08
were interpreted as indicating good fit (Browne & Cudeck, 1993; Hu & Bentler, 1999). We
report these fit indexes to make the present analysis comparable with previous research.
However, it should be noted that the recommended cutoff values are often not met with datasets
derived from more complex studies, suggesting that they should be used with caution (Heene,
Hilbert, Draxler, Ziegler, & Bühner, 2011; Marsh, Hau, & Wen, 2004).
Results
Preliminary Analysis

Running head: EMOTION AND ACHIEVEMENT 19
Alpha coefficients for the emotion scales and manifest correlations for the emotions and
achievement are outlined in Table 1 (for information about distributions, see Table S1).
Correlations between the emotion measures indicated that enjoyment and pride were positively
related, as were anger, anxiety, shame, hopelessness, and boredom. The correlations between
positive and negative emotions were negative. Overall, this pattern of relations is consistent with
previous evidence on the structures of students’ academic emotions (e.g., Pekrun et al., 2011).
Enjoyment and pride correlated positively with mathematics achievement in each year, whereas
anger, anxiety, shame, hopelessness, and boredom correlated negatively with achievement.
Confirmatory Factor Analysis (CFA) for the Emotion Constructs
To further examine the relations between emotions, item-based CFA models including
the seven emotions were estimated. This was done separately for the five measurement
occasions. The models showed a good fit to the data (Supplemental Material, Table S2),
supporting the measurement quality of the emotion variables. The latent correlations between the
emotion variables showed the same pattern as the manifest correlations (Table 1). These
correlations are corrected for measurement error and indicate that the latent emotion variables
are closely related but nevertheless distinct (for similar findings with university students, see
Pekrun et al., 2011). This is also true for emotions that might be presumed to constitute opposite
ends of a bipolar continuum, such as enjoyment and boredom, which showed moderately
negative relationships. The strongest correlations were found for neighboring, like-valenced
emotions such as enjoyment and pride, and anxiety, shame, and hopelessness. In interpreting
these correlations, it is important to note that the present study used the AEQ-M to assess
students’ trait-like emotions. As noted by Pekrun et al. (2011), like-valenced trait emotions are
known to be strongly correlated, in contrast to state emotions which show more divergence.

Running head: EMOTION AND ACHIEVEMENT 20
For positive and negative affect based on the emotion factor scores, we conducted an
integrative CFA including both constructs across all five measurement occasions. The fit for this
CFA model was good (Supplemental Material, Table S3, configural invariance model). Latent
correlations between the positive and negative affect factors were r = -.19, -.23, -.25, -.23, and -
.21 (all ps < .01) for Times 1, 2, 3, 4, and 5, respectively, showing that the two affect constructs
were sufficiently distinct.
Measurement Invariance of the Emotion Constructs over Time and School Tracks
Measurement invariance across waves was tested separately for the seven emotions and
for positive and negative affect. The configural invariance models showed a good fit to the data,
with CFI > .93, RMSEA < .03, and SRMR < .05 for all seven discrete emotion constructs
(Supplemental Material, Table S3). As compared with these models, the loss of fit for the metric
invariance models was CFI < -.004, RMSEA < .001, and SRMR < .006 for all models,
indicating clear support for metric invariance for all of the emotions. The loss of fit for the scalar
invariance models was CFI < -.007,RMSEA < .004, and SRMR < .007 for all of the
emotions, documenting that scalar invariance was supported as well. The loss of fit for the
residual invariance models was CFI < -.010 for all emotions except shame, CFI = -.010, as
well as RMSEA < .003 and SRMR < .008 for all emotions, indicating support for residual
invariance. For positive and negative affect, the loss of fit was CFI < .008, RMSEA < .004,
and SRMR < .005 for the metric, intercept, and residual invariance models, demonstrating
support for invariance for these second-order constructs as well. In sum, the findings show that
the latent emotion and affect variables showed strong measurement equivalence over time, thus
meeting the requirements to be included in longitudinal analysis. Furthermore, in supplemental
analyses using multi-group analysis, the emotion constructs also showed strong measurement

Running head: EMOTION AND ACHIEVEMENT 21
equivalence across the three school tracks (see Supporting Information, Table S8).
Reciprocal Effects Models of Emotions and Achievement
The fit indexes provided support for the cross-lagged structural equation models for all
seven emotions as well as positive and negative affect and across both measures of achievement.
For all of the models freely estimating autoregressive effects, cross-lagged effects, and factor
residual invariances, CFI was > .92, TLI > .90, RSMEA < .06, and SRMR < .08 (Table 2 and
Supplemental Material, Table S4). When constraining autoregressive effects, cross-lagged
effects, and factor residual variances to be equal across time intervals, the loss of fit was CFI <
.003, RMSEA < .001, and SRMR < .003 for all of the models. These findings support the
invariance of these parameters, suggesting developmental equilibrium in autoregressive stability
and in the links of emotion and achievement across time. Accordingly, we adopted the
constrained models for further interpretation, which have the additional advantage of providing
more robust and precise parameter estimates (note that these constraints equalize unstandardized
coefficients; to ease interpretation, we report standardized coefficients which can still differ due
to the standardization procedure).
Emotions and grades. Factor loadings, path coefficients, and residual variances for the
reciprocal effects models including grades are displayed in Table 3. In the enjoyment and pride
models, both the emotion variables and students’ achievement showed considerable stability over
time, as indicated by the autoregressive effects for these variables. Furthermore, there were
significant relations between the positive emotions and achievement at grade 5 in these models,
latent rs = .26 and .26, ps < .001, for enjoyment and pride, respectively. Over and above these
pre-existing relations, and despite autoregressive stability, results showed enjoyment and pride to
positively predict each subsequent achievement outcome (ß range .11 to .13, ps < .001) while

Running head: EMOTION AND ACHIEVEMENT 22
controlling for gender, intelligence, and SES. In addition, positive paths emerged from each
achievement outcome to the subsequent enjoyment and pride variables (all βs = .11, ps < .001).
In the negative emotion models, there were substantial initial links between anger, anxiety,
shame, boredom, and hopelessness at grade 5, latent rs = -.31, -.39, -.32, -.16, and -.37,
respectively, ps < .001. Despite these links and the considerable stability of the emotion and
achievement variables over time, anger, anxiety, shame, boredom, and hopelessness negatively
predicted each subsequent achievement outcome (ß range -.08 to -.14, all ps < .001) while
controlling for gender, intelligence, and SES. The effects were especially pronounced for anxiety
and hopelessness (all ßs > -.11). In addition, negative paths from each achievement outcome to
subsequent anger, anxiety, shame, boredom, and hopelessness were observed (ß range -.06 to
-.14; all ps < .001).
These effects were similar across the two positive emotions, and similar across the five
negative emotions, thus justifying their combination into positive and negative affect constructs.
In the reciprocal effects model for positive and negative affect, the initial links with achievement
were rs = .26 and -.33 for positive and negative affect, respectively, ps < .001. Despite these
links and strong autoregressive coefficients for both positive and negative affect as well as
achievement, positive affect positively predicted achievement, and negative affect negatively
predicted achievement. Because both types of affect were included in the analysis, these findings
indicate that positive and negative affect had independent predictive effects on achievement.
Achievement, in turn, had positive predictive effects on positive affect and negative predictive
effects on negative affect. Regarding cross-paths between positive and negative affect, we had
not expected any effects of this type and none of the paths were significant.
Emotions and test scores. The findings for emotions and test scores replicated the results
Running head: EMOTION AND ACHIEVEMENT 23
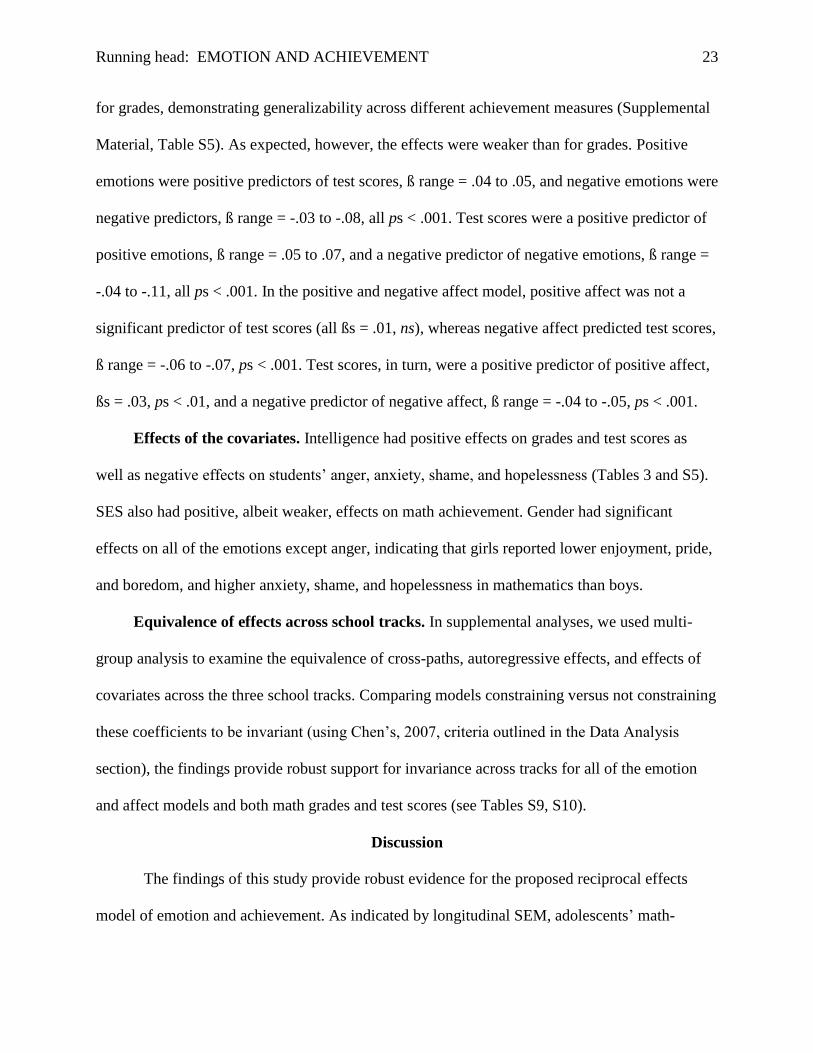
for grades, demonstrating generalizability across different achievement measures (Supplemental
Material, Table S5). As expected, however, the effects were weaker than for grades. Positive
emotions were positive predictors of test scores, ß range = .04 to .05, and negative emotions were
negative predictors, ß range = -.03 to -.08, all ps < .001. Test scores were a positive predictor of
positive emotions, ß range = .05 to .07, and a negative predictor of negative emotions, ß range =
-.04 to -.11, all ps < .001. In the positive and negative affect model, positive affect was not a
significant predictor of test scores (all ßs = .01, ns), whereas negative affect predicted test scores,
ß range = -.06 to -.07, ps < .001. Test scores, in turn, were a positive predictor of positive affect,
ßs = .03, ps < .01, and a negative predictor of negative affect, ß range = -.04 to -.05, ps < .001.
Effects of the covariates. Intelligence had positive effects on grades and test scores as
well as negative effects on students’ anger, anxiety, shame, and hopelessness (Tables 3 and S5).
SES also had positive, albeit weaker, effects on math achievement. Gender had significant
effects on all of the emotions except anger, indicating that girls reported lower enjoyment, pride,
and boredom, and higher anxiety, shame, and hopelessness in mathematics than boys.
Equivalence of effects across school tracks. In supplemental analyses, we used multi-
group analysis to examine the equivalence of cross-paths, autoregressive effects, and effects of
covariates across the three school tracks. Comparing models constraining versus not constraining
these coefficients to be invariant (using Chen’s, 2007, criteria outlined in the Data Analysis
section), the findings provide robust support for invariance across tracks for all of the emotion
and affect models and both math grades and test scores (see Tables S9, S10).
Discussion
The findings of this study provide robust evidence for the proposed reciprocal effects
model of emotion and achievement. As indicated by longitudinal SEM, adolescents’ math-

Running head: EMOTION AND ACHIEVEMENT 24
related positive emotions (enjoyment and pride) positively predicted their subsequent end-of-the-
year math grades, and grades, in turn, positively predicted the development of positive emotions.
Math-related negative emotions (anger, anxiety, shame, hopelessness, and boredom) were
negative predictors of subsequent math grades, and grades, in turn, were a negative predictor for
the development of negative emotions. Similar predictive effects were obtained for the
integrative constructs of positive and negative affect, respectively, and for test scores as a
measure of achievement. The findings were consistent across models for the seven discrete
emotions, the combined positive and negative affect model, four time intervals, two different
measures of achievement (grades, test scores), and the three school tracks while controlling for
students’ gender, intelligence, and SES. All of the effects were significant with the single
exception of the effects of positive affect on test scores.
Because prior links between emotion and achievement as well as intelligence and
demographic background variables were controlled, the path coefficients are likely to represent
effects of emotion on achievement, and vice versa, rather than simply the influence of prior
emotion, prior achievement, gender, intelligence, or socio-economic status. As expected, the size
of these coefficients was modest. However, it is important to note that the coefficients represent
incremental predictive effects due to prior emotion and achievement being controlled. Thus, the
coefficients represent effects of each variable on change in the other from one assessment to the
next, rather than effects on the absolute levels of these variables. Furthermore, both emotion and
achievement showed considerable stability over time, leaving little variance to be explained and
making it difficult to detect the effects of additional variables. From this perspective, the
consistency of effects lends credibility to the notion that emotion and achievement are indeed
linked by reciprocal causation over time.

Running head: EMOTION AND ACHIEVEMENT 25
Reciprocal Effects Linking Emotion and Achievement
The findings are congruent with previous evidence showing that emotions and academic
achievement are correlated (Goetz & Hall, 2013; Pekrun & Linnenbrink-Garcia, 2014; Zeidner,
1998). However, they go beyond correlational evidence by disentangling the directional effects
underlying the emotion-achievement link. Specifically, the findings suggest that emotions indeed
have an influence on adolescents’ achievement, over and above the effects of general cognitive
ability and prior accomplishments. These effects are in line with Pekrun’s (2006) control-value
theory which posits that emotions influence learning and achievement outcomes.
Of specific importance is the finding that adolescents’ positive emotions in mathematics
had positive predictive effects on their math grades over time. Previous research has produced
mixed findings on the relation between students’ positive affect and their learning, with most
studies reporting positive relations (see Linnenbrink, 2007) but some others null findings (e.g.,
Pekrun, Elliot, & Maier, 2009). The present analysis suggests that positive emotions can have
positive effects, in line with theory and the views of educational practitioners. However, the
effects were weaker for positive emotion than for the negative emotion constructs, and did not
reach significance for the predictive effect of positive affect on test scores. Future research
should examine possible reasons why negative emotion is a stronger predictor of students’
academic achievement than positive emotion. This difference may relate to general asymmetries
in the impact of negative versus positive states and events on human memory and action (see
e.g., Baumeister, Bratslavsky, Finkenauer, & Vohs, 2001).
The results also contribute to our understanding of the developmental origins of students’
emotions. The findings suggest that achievement impacts the development of emotions. It
appears that doing well in school can strengthen students’ positive emotions and reduce their

Running head: EMOTION AND ACHIEVEMENT 26
negative emotions over time, whereas doing poorly in school undermines positive emotions and
exacerbates negative emotions. These effects are likely mediated by students’ perceptions of
competence and control over achievement, with high control promoting enjoyment and pride and
low control leading to negative emotions (e.g., Pekrun et al., 2010).
Taken together, these effects amount to positive developmental feedback loops linking
emotions and achievement. As noted, a few longitudinal studies have found that students’ test
anxiety and their achievement were linked by positive feedback loops (Meece, Wigfield, &
Eccles, 1990; Pekrun, 1992). The present research adds to this literature by showing that
emotions other than anxiety share similar links with achievement. As such, it would appear that
unidirectional models are unable to adequately capture the complex reality of students’ emotions.
Rather, systems-oriented perspectives are needed that take more complex patterns of causal links
into account, including feedback loops between emotions, their antecedents, and their effects.
Discrete Emotions versus General Affect
It is noteworthy that the cross-paths were similar across different discrete emotions. For
effects of achievement on emotion, this is to be expected, as success and failure are thought to
impact the development of different positive and negative emotions in similar ways. As outlined
in our reciprocal effects model, success is expected to generally increase perceived control, thus
enhancing positive emotions, and failure is expected to decrease control, leading to negative
emotions. However, regarding effects of emotion on achievement, emotion theories such as the
control-value theory (Pekrun, 2006) imply that the effects of some emotions (e.g., deactivating
negative emotions such as boredom) may be more consistent than the effects of other emotions
(e.g., activating negative emotions such as anxiety). Instead, the findings clearly indicate that the
predictive effects of emotions on students’ long-term achievement were also similar across

Running head: EMOTION AND ACHIEVEMENT 27
different emotions. Accordingly, whereas constructs of discrete emotions are needed to explain
the impact of emotions on functional mechanisms and different types of cognitive performance,
parsimonious summary constructs of positive and negative affect may be sufficient to explain
their relations with overall academic achievement. This possibility is underscored by the robust
findings for positive and negative affect documented in the present analysis.
Effects of Gender, Intelligence, and SES
The findings on gender differences are consistent with previous evidence showing that
girls report less enjoyment and more anxiety and shame in mathematics even if they perform as
well as boys. Lower competence beliefs and perceived values in mathematics may be possible
explanations (Goetz, Bieg, Lüdtke, Pekrun, & Hall, 2013). However, girls reported less boredom
than boys, in line with previous evidence (Pekrun et al., 2010). As such, the findings suggest that
girls exhibit a more maladaptive profile of math emotions, except for boredom.
As expected, intelligence had substantial predictive effects on the achievement variables.
Furthermore, intelligence had negative effects on math-related anger, anxiety, shame, and
hopelessness. Given that students’ mathematics achievement was included in the analysis, this
finding suggests that higher general cognitive ability can help to reduce negative mathematics
emotions, above and beyond any effects of students’ academic success in mathematics. Finally,
SES also had positive, albeit weaker, effects on math achievement, suggesting that the family
exerts an influence on students’ achievement, over and above any effects of cognitive ability.
Limitations, Suggestions for Future Research, and Implications for Practice
The present study represents a significant advancement over previous research, because it
documents reciprocal effects of emotion and achievement over time while controlling for general
cognitive ability and critical demographic background variables. Nevertheless, several

Running head: EMOTION AND ACHIEVEMENT 28
limitations should be considered when interpreting the study findings and can be used to suggest
directions for future research.
Methodological considerations. As compared with experimental studies, the power of
non-experimental field studies to derive causal conclusions is limited. As such, although the
present analysis used multi-wave longitudinal structural equation modeling and controlled for
related variables and autoregressive effects, the possibility still exists that our findings are
attributable to other variables that were not included in the study. On the other hand, field studies
may be more ecologically valid than experimental emotion studies, which are limited in terms of
situational representativeness and ethical concerns about experimentally manipulating emotions.
Furthermore, statistical power is higher in field studies such as the present one due to large
sample size. To balance the benefits and drawbacks of different methodologies and make
headway in this avenue of research, future studies should further pursue the approach taken
herein while complementing this approach with experimental studies.
Achievement was assessed by students’ end-of-year grades and test scores. By using
grades, we sought to employ an ecologically valid measure of student achievement (for a similar
procedure, see Pekrun et al., 2014). As is typical for grades, more detailed information about
reliability was not available; as such, it was not possible to disattenuate the link between
emotions and grades for potential unreliability of this achievement measure. However, in
German secondary schools, end-of-the-year grades are summative scores based on multiple
exams within each school year, which may boost their reliability in comparison to grades on
single exams. In the present study, this is supported by the stability of grades across years (all ßs
> .50), which could be considered as a lower bound to reliability. Furthermore, from the
perspective of grades as sources of students’ emotional development, they could be seen as

Running head: EMOTION AND ACHIEVEMENT 29
having almost perfect reliability---grades, rather than objective achievement, provide the
feedback that shapes students’ perceptions of success and failure and any development based on
these perceptions. In addition, an advantage of grades is that they represent achievement in terms
of the math curriculum taught in students’ classes. They represent the specific contents learned
by students and may be superior to alternative measures in terms of curricular validity. Finally,
the findings based on grades proved to be generalizable, as the results were essentially the same
for test scores.
Substantive issues. The present research examined achievement emotions as experienced
by adolescents in the domain of mathematics. It is open to question whether the present findings
would generalize to other age groups, such as elementary school children or post-secondary
students. Furthermore, it is possible that there is individual variation in the link between
emotions and achievement. To examine such variation, within-person analyses of the relations
between emotion and achievement over time are needed (e.g., by using experience sampling
methodology; Goetz, Sticca, Pekrun, Murayama, & Elliot, 2016). Because the present research
involved samples of German adolescents, it also remains an open question as to whether the
findings would generalize to students in other cultures. Additionally, future research should
explore if these findings generalize to emotions in achievement domains other than mathematics,
The study considered a broad range of important mathematics emotions but did not
include an exhaustive list of emotions. It is open to question whether the observed reciprocal
effects would also occur for emotions not assessed herein. Specifically, the study did not include
students’ deactivating positive emotions, such as relief and relaxation. Future studies could
explore how these emotions are linked to students’ academic achievement. Furthermore, the
present study examined students’ trait-like emotions which are known to be highly correlated

Running head: EMOTION AND ACHIEVEMENT 30
(Pekrun et al., 2011), which makes it difficult to determine unique variance in achievement
attributable to different emotions. Future research should examine the unique impact of multiple
state emotions, which are less correlated (Goetz et al., 2016), on students’ learning.
Finally, the study addressed the overall developmental relations between emotion and
achievement but did not examine the mechanisms that mediate the observed links. In the
proposed model of reciprocal effects, it is posited that effects of emotion on achievement are due
to the influence of emotions on cognitive resources, motivation, and strategy use. The effects of
achievement outcomes on the development of emotion are thought to be mediated by perceptions
of competence and control over performance, and could additionally be mediated by value
appraisals. More research on the link between emotion and achievement as mediated by these
cognitive and motivational mechanisms is needed to better understand students’ emotions and
their relations with important school outcomes.
Implications for educational practice. Two important messages follow from the present
research. First, the results suggest that emotions have effects on adolescent students’ academic
achievement, and that these effects are not merely an epiphenomenon of prior performance---
more likely, they represent a true causal influence of students’ emotion experiences. By
implication, the findings suggest that educators, administrators, and parents alike should consider
intensifying efforts that strengthen adolescents’ positive emotions and minimize their negative
emotions. Second, the results imply that achievement outcomes reciprocally influence students’
emotions, suggesting that successful performance attainment and positive achievement feedback
can facilitate the development of positive emotions, and failure experiences can contribute to the
development of negative emotions. Accordingly, providing students with opportunities to
experience success (e.g., using intrapersonal standards to evaluate achievement; emphasizing

Running head: EMOTION AND ACHIEVEMENT 31
mastery over competition goals) may help to promote positive emotions and prevent negative
emotions (also see Pekrun, Cusack, Murayama, Elliot, & Thomas, 2014). By documenting the
influence of achievement outcomes on students’ emotions, the present findings elucidate one
important factor that can be targeted by educators to reduce students’ negative affect and
facilitate the development of emotional well-being.

Running head: EMOTION AND ACHIEVEMENT 32
References
Baumeister, R. F., Bratslavsky, E., Finkenauer, C., & Vohs, K. D. (2001). Bad is stronger than
good. Review of General Psychology, 5, 323-370. Doi: 10.1037//1089-2680.5.4.323
Browne, M. W., & Cudeck, R. (1993). Alternative ways of assessing model fit. In K. A. Bollen
& J. S. Long (Eds.), Testing structural equation models (pp. 136-161). Thousand Oaks,
CA: Sage.
Chen, F. F. (2007). Sensitivity of goodness of fit indexes to lack of measurement invariance.
Structural Equation Modeling: A Multidisciplinary Journal, 14, 464–504. doi:
10.1080/10705510701301834
Clore, G. L., & Huntsinger, J. R. (2009). How the object of affect guides its impact. Emotion
Review, 1, 39-54. doi: 10.1177/1754073908097185
Daniels, L. M., & Stupnisky, R. H. (2012). Not that different in theory: Discussing the control-
value theory of emotions in online learning environments. Internet and Higher Education,
15, 222-226. doi:10.1016/j.iheduc.2012.04.002
Enders, C. K. (2010). Applied missing data analysis. New York: Guilford.
Erikson, R., Goldthorpe, J. H., & Portocarero, L. (1979). Intergenerational class mobility in three
Western European Societies: England, France, and Sweden. British Journal of Sociology,
30, 341-415.
Folkman, S., & Lazarus, R. S. (1985). If it changes it must be a process: Study of emotion and
coping during three stages of a college examination. Journal of Personality and Social
Psychology, 48, 150-170.
Frenzel, A. C., Goetz, T., Lüdtke, O., Pekrun, R., & Sutton, R. (2009). Emotional transmission in
the classroom: Exploring the relationship between teacher and student enjoyment. Journal

Running head: EMOTION AND ACHIEVEMENT 33
of Educational Psychology, 101, 705-716. doi: 10.1037/a0014695
Frenzel, A. C., Pekrun, R., Dicke, A. L., & Goetz, T. (2012). Beyond quantitative decline:
Conceptual shifts in adolescents’ development of interest in mathematics. Developmental
Psychology, 48, 1069-1082. doi: 10.1037/a0026895
Goetz, T., Bieg, M., Lüdtke, O., Pekrun, R., & Hall, N. C. (2013). Do girls really experience
more anxiety in mathematics? Psychological Science, 24, 2079-2087. doi:
10.1177/0956797613486989
Goetz, T., & Hall, N. C. (2013). Emotion and achievement in the classroom. In J. Hattie and E.
M. Anderman (Eds.), International guide to student achievement (pp. 192-195). New
York: Routledge.
Goetz, T., Sticca, F., Pekrun, R., Murayama, K., & Elliot, A. J. (2016). Intraindividual relations
between achievement goals and discrete achievement emotions: An experience sampling
approach. Learning and Instruction. 41, 115-125. doi: 10.1177/095679761348698
Heene, M., Hilbert, S., Draxler, C., Ziegler, M., & Bühner, M. (2011). Masking misfit in
confirmatory factor analysis by increasing unique variances: A cautionary note on the
usefulness of cutoff values of fit indices. Psychological Methods, 16, 319-336. doi:
10.1037/a0024917
Heller, K., & Perleth, C. (2000). Kognitiver Fähigkeitstest für 4. bis 12. Klassen, Revision (KFT
4–12 + R) [Cognitive Abilities Test for Grades 4 to 12, revision (KFT 4–12 + R)].
Göttingen, Germany: Hogrefe.
Hembree, R. (1988). Correlates, causes, effects, and treatment of test anxiety. Review of
Educational Research, 58, 47-77. doi: 10.3102/00346543058001047

Running head: EMOTION AND ACHIEVEMENT 34
Hu, L. -T., & Bentler, P. M. (1999). Cutoff criteria for fit indexes in covariance structure
modeling: Sensitivity to underparameterized model misspecification. Psychological
Methods, 3, 424-453. doi: 10.1037/1082-989X.3.4.424
Jeličič, H., Phelps, E., & Lerner, R. M. (2009). Use of missing data methods in longitudinal
studies: The persistence of bad practices in developmental psychology. Developmental
Psychology, 45, 1195-1199.
Little, T. D., Preacher, K. J., Selig, J. P., & Card, N. A. (2007). New developments in latent
variable panel analyses of longitudinal data. International Journal of Behavioral
Development, 31, 357-365. doi: 10.1177/016502540707757
Linnenbrink, E. A. (2007). The role of affect in student learning: A multi-dimensional approach
to considering the interaction of affect, motivation, and engagement. In P. A. Schutz & R.
Pekrun (Eds.), Emotion in education (pp. 107-124).
Linnenbrink, E. A., & Pintrich, P. R. (2002). Achievement goal theory and affect: An
asymmetrical bidirectional model. Educational Psychologist, 37, 69-78. doi:
10.1207/S15326985EP3702_2
Ma, X., & Xu, J. 2004. The causal ordering of mathematics anxiety and mathematics
achievement: a longitudinal panel analysis. Journal of Adolescence, 27, 165–179. doi:
10.1016/j.adolescence.2003.11.003
Marsh, H. W., Balla, J. R., & McDonald, R. P. (1988). Goodness-of-fit indexes in confirmatory
factor analysis: The effect of sample size. Psychological Bulletin, 103, 391– 410.
doi:10.1037/0033-2909.103.3.391
Marsh, H. W., Hau, K.-T., & Wen, Z. (2004). In search of golden rules: Comment on hypothesis-
testing approaches to setting cutoff values for fix indexes and dangers in overgeneralizing

Running head: EMOTION AND ACHIEVEMENT 35
Hu and Bentler’s (1999) findings. Structural Equation Modeling, 11, 320-341. doi:
10.1207/s15328007sem1103
Marsh, H. W., & Craven, R. G. (2006). Reciprocal effects of self-concept and performance from
a multidimensional perspective. Perspectives on Psychological Science, 1, 133-163. doi:
10.1111/j.1745-6916.2006.00010.x
Marsh, H. W., Pekrun, R., Lichtenfeld, S., Guo, J., Arens, A. K., & Murayama, K. (in press).
Breaking the double-edged sword of effort: Developmental equilibrium and longitudinal
relations among effort, achievement, and academic self-concept. Developmental
Psychology.
Marsh, H. W., Trautwein, U., Lüdtke, O., Köller, O., & Baumert, J. (2005). Academic self-
concept, interest, grades, and standardized test scores: Reciprocal effects models of causal
ordering. Child Development, 76, 397-416. doi: 10.1111/j.1467-8624.2005.00853.x
McArdle, J. J. (2009). Latent variable modeling of differences and changes with longitudinal
data. Annual Review of Psychology, 60, 577-605. doi:
10.1146/annurev.psych.60.110707.153612
Meece, J. L., Wigfield, A., & Eccles, J. S. (1990). Predictors of math anxiety and its influence on
young adolescents course enrollment intentions and performance in mathematics. Journal
of Educational Psychology, 82, 60-70. doi: 10.1037/0022-0663.82.1.60
Meredith, W. (1993). Measurement invariance, factor analysis and factorial invariance.
Psychometrika, 58, 525-543
Murayama, K., Pekrun, R., Lichtenfeld, S., & vom Hofe, R. (2013). Predicting long-term growth
in students’ mathematics achievement: The unique contributions of motivation and
cognitive strategies. Child Development, 84, 1475-1490. doi: 10.1111/cdev.12036

Running head: EMOTION AND ACHIEVEMENT 36
Murayama, K., Pekrun, R., Suzuki, M., Marsh, H. W., & Lichtenfeld, S. (in press). Don't aim too
high for your kids: Parental over-aspiration undermines students' learning in mathematics.
Journal of Personality and Social Psychology.
Muthén, L. K., & Muthén, B. O. (2012). Mplus user’s guide. Los Angeles, CA: Author.
Pekrun, R. (1992). The expectancy-value theory of anxiety: Overview and implications. In D.G.
Forgays, T. Sosnowski, & K. Wrzesniewski (Eds.), Anxiety: Recent developments in self-
appraisal, psychophysiological and health research (pp. 23-41). Washington, DC:
Hemisphere.
Pekrun, R. (2006). The control-value theory of achievement emotions: Assumptions, corollaries,
and implications for educational research and practice. Educational Psychology Review,
18, 315-341. doi: 10.1007/s10648-006-9029-9
Pekrun, R., Cusack, A., Murayama, K., Elliot, A. J., & Thomas, K. (2014). The power of
anticipated feedback: Effects on students’ achievement goals and achievement emotions.
Learning and Instruction, 29, 115-124. doi: 10.1016/j.learninstruc.2013.09.002
Pekrun, R., Elliot, A. J., & Maier, M. A. (2009). Achievement goals and achievement emotions:
Testing a model of their joint relations with academic performance. Journal of Educational
Psychology, 101, 115-135. doi: 10.1037/a0013383
Pekrun, R., Goetz, T., Daniels, L. M., Stupnisky, R. H., & Perry, R. P. (2010). Boredom in
achievement settings: Control-value antecedents and performance outcomes of a neglected
emotion. Journal of Educational Psychology, 102, 531-549. doi: 10.1037/a0019243
Pekrun, R., Goetz, T., Frenzel, A. C., Barchfeld, P., & Perry, R. P. (2011). Measuring emotions
in students’ learning and performance: The Achievement Emotions Questionnaire (AEQ).
Contemporary Educational Psychology, 36, 36-48. doi: 10.1016/j.cedpsych.2010.10.002

Running head: EMOTION AND ACHIEVEMENT 37
Pekrun, R., Hall, N. C., Goetz, T., & Perry, R. P. (2014). Boredom and academic achievement:
Testing a model of reciprocal causation. Journal of Educational Psychology, 106, 696-710.
Pekrun, R., vom Hofe, R., Blum, W., Frenzel, A. C., Goetz, T. & Wartha, S. (2007).
Development of mathematical competencies in adolescence: The PALMA longitudinal
study. In M. Prenzel (Ed.), Studies on the educational quality of schools (pp. 17-37).
Münster, Germany: Waxmann.
Pekrun, R., & Linnenbink-Garcia, L. (2012). Academic emotions and student engagement. In S.
L. Christenson, A. L. Reschly, & C. Wylie (Eds.), Handbook of research on student
engagement (pp. 259-282). New York: Springer.
Pekrun, R., & Linnenbrink-Garcia, L. (Eds.). (2014). International handbook of emotions in
education. New York: Taylor & Francis.
Pekrun, R., & Perry, R. P. (2014). Control-value theory of achievement emotions. In R. Pekrun
& L. Linnenbrink-Garcia (Eds.), Handbook of emotions in education (pp. 120-141). New
York: Taylor & Francis.
Rosel, J., & Plewis, I., (2008). Longitudinal data analysis with structural equations.
Methodology, 4, 37-50. doi: 10.1027/1614-2241.4.1.37
Steenkamp, J.-B. E. M., & Baumgartner, H. (1998). Assessing measurement invariance in cross-
national consumer research. Journal of Consumer Research, 25, 78–90.
doi:10.1086/209528
Turner, J. E., Schallert, D. L. (2001). Expectancy-value relationships of shame reactions and
shame resiliency. Journal of Educational Psychology, 93, 320-329. doi: 10.1037//0022-
0663.93.2.320
Weiner, B. (1985). An attributional theory of achievement motivation and emotion.

Running head: EMOTION AND ACHIEVEMENT 38
Psychological Review, 92, 548-573. doi: 10.1037/0033-295X.92.4.548
Zeidner, M. (1998). Test anxiety. The state of the art. New York: Plenum.
Zeidner, M. (2014). Anxiety in education. In R. Pekrun & L. Linnenbrink-Garcia (Eds.),
Handbook of emotions in education (pp. 265-288). New York: Taylor & Francis.

Running head: EMOTION AND ACHIEVEMENT 39
Table 1
Alpha Coefficients and Pearson Product-Moment Correlations for Emotions and Achievement
Enjoyment Pride Anger Anxiety Shame Boredom Hopelessness
Enjoyment (.87) a .83 -.63 -.53 -.36 -.60 -.48 (.87) .84 -.65 -.51 -.33 -.63 -.51
(.88) .86 -.65 -.48 -.30 -.62 -.49
(.85) .86 -.61 -.46 -.30 -.57 -.49
(.89) .88 -.56 -.42 -.23 -.50 -.46
Pride .73 (.87) -.42 -.37 -.25 -.39 -.38 .74 (.88) -.51 -.42 -.27 -.50 -.44
.75 (.88) -.50 -.40 -.26 -.47 -.43
.76 (.89) -.48 -.37 -.25 -.47 -.43
.78 (.89) -.46 -.35 -.18 -.43 -.39
Anger -.55 -.35 (.87) .88 .76 .84 .93 -.55 -.40 (.88) .86 .73 .82 .82
-.56 -.39 (.87) .86 .69 .79 .83
-.53 -.39 (.87) .86 .68 .72 .85
-.49 -.37 (.88) .87 .68 .75 .84
Anxiety -.41 -.29 .74 (.90) .92 .67 .90 -.39 -.31 .74 (.90) .92 .60 .91
-.35 -.29 .74 (.91) .87 .53 .92
-.33 -.26 .73 (.91) .88 .51 .92
-.32 -.26 .73 (.92) .87 .55 .91
Shame -.27 -.19 .65 .78 (.86) .55 .82 -.23 -.18 .62 .77 (.88) .48 .79
-.20 -.16 .58 .74 (.87) .37 .78
-.19 -.16 .57 .75 (.87) .36 .78
-.14 -.09 .58 .74 (.89) .42 .78
Boredom -.51 -.27 .70 .44 .37 (.86) .63 -.53 -.35 .70 .39 .31 (.89) .60
-.52 -.33 .66 .33 .25 (.90) .54
-.48 -.32 .61 .29 .23 (.90) .56
-.41 -.29 .64 .32 .28 (.90) .57
Hopelessness -.41 -.34 .72 .83 .74 .43 (.86) -.43 -.38 .74 .86 .73 .42 (.88)
-.42 -.37 .74 .86 .71 .37 (.88)
-.43 -.37 .75 .86 .70 .37 (.87)
-.43 -.37 .76 .86 .68 .38 (.83)
Achievement .20 .18 -.30 -.37 -.33 -.13 -.38
(end-of-year .25 .22 -.30 -.38 -.34 -.11 -.40
grades) .34 .29 -.34 -.37 -.29 -.17 -.42
.41 .36 -.36 -.37 -.29 -.16 -.41
.45 .38 -.42 -.40 -.29 -.24 -.46
Note. a 1st, 2nd, 3rd, 4th, 5th coefficient in each column: Grade 5, 6, 7, 8, and 9, respectively. Coefficients
below main diagonal are manifest correlations. Coefficients above main diagonal are latent correlations
based on confirmatory factor analyses for each wave. Coefficients in parentheses are Cronbach’s Alphas.
p < .01 for all coefficients.

Running head: EMOTION AND ACHIEVEMENT 40
Table 2
Reciprocal Effects Models for Emotion and Grades: Fit Indexes
2 df CFI TLI RMSEA SRMR
Model
Cross-paths, autoregressive effects, and residual variances
freely estimated
Enjoyment 4125.280** 1147 .940 .928 .027 .052
Pride 2729.201** 722 .940 .928 .028 .048
Anger 3238.875** 918 .941 .927 .027 .049
Anxiety 9091.434** 2992 .920 .909 .024 .050
Shame 2168.850** 907 .965 .957 .020 .044
Boredom 1384.409** 532 .974 .966 .021 .038
Hopelessness 2018.158** 562 .959 .949 .027 .055
Positive and negative
affect
6837.618**
685 .947 .930 .051 .075
Cross-paths, autoregressive effects, and residual variances
invariant across waves
Enjoyment 4210.435** 1165 .938 .927 .027 .053
Pride 2794.131** 740 .942 .930 .028 .049
Anger 3285.829** 936 .940 .928 .027 .050
Anxiety 9148.887** 3010 .920 .909 .024 .050
Shame 2244.200** 925 .964 .956 .020 .045
Boredom 1500.094** 550 .971 .963 .022 .041
Hopelessness 2058.064** 580 .959 .950 .027 .055
Positive and negative
affect
6976.520** 721 .946 .933 .050 .078
** p < .01.

Running head: EMOTION AND ACHIEVEMENT 41
Table 3
Reciprocal Effects Models for Emotion and Grades: Standardized Factor Loadings, Path Coefficients, and Residual Variances
Enjoyment model Pride model Anger model Anxiety model Shame model
Enjoyment Grades Pride Grades Anger Grades Anxiety Grades Shame Grades
Factor loadings .37-.81a .55-.77 a .58-.77 a .44-.77 a .48-.78 a
Autoregressive effects
T1 T2 .67*** .57*** .62*** .57*** .58*** .57*** .60*** .56*** .62*** .58***
T2 T3 .66*** .59*** .64*** .59*** .61*** .59*** .64*** .58*** .61*** .60***
T3 T4 .66*** .61*** .65*** .61*** .62*** .60*** .66*** .60*** .60*** .62***
T4 T5 .65*** .59*** .65*** .59*** .62*** .58*** .68*** .58*** .60*** .60***
Cross-lagged effects
Grades
Enjoyment
Enjoyment
Grades
Grades
Pride
Pride
Grades
Anger
Grades
Grades
Anger
Grades
Anxiety
Anxiety
Grades
Grades
Shame
Shame
Grades
T1 T2 .11*** .13*** .11*** .11*** -.12*** -.10*** -.08*** -.11*** -.06*** -.09***
T2 T3 .11*** .13*** .11*** .12*** -.13*** -.10*** -.08*** -.13*** -.06*** -.09***
T3 T4 .11*** .13*** .11*** .12*** -.14*** -.10*** -.07*** -.14*** -.06*** -.09***
T4 T5 .11*** .12*** .11*** .12*** -.13*** -.10*** -.07*** -.14*** -.06*** -.08***
Effects of Covariates at T1
Gender .14*** .02 .17*** .02 -.03 .02 -.16*** .02 -.09** .02
Intelligence -.02 .40*** -.00 .40*** -.12*** .40*** -.18*** .40*** -.17*** .40***
SES -.05** .09*** .05* .09*** .03 .09*** -.04 .09*** -.03 -.09***
Residual Variances
T1 .98 .82 .97 .82 .98 .82 .94 .82 .96 .82
T2 .50 .57 .57 .58 .62 .57 .59 .57 .55 .58
T3 .51 .56 .54 .56 .59 .56 .53 .56 .58 .56
T4 .52 .58 .53 .58 .57 .57 .50 .58 .60 .58
T5 .52 .56 .52 .56 .57 .55 .50 .56 .61 .56

Running head: EMOTION AND ACHIEVEMENT 42
Table 3 (continued)
Boredom model Hopelessness model Positive and negative affect model
Boredom Grades Hopelessn. Grades Pos. affect b Neg. affect b Grades
Factor loadings .56-.77 a .63-.85 a .77-.96 a .41-.93 a
Autoregressive effects
T1 T2 .63*** .59*** .53*** .56*** .80*** .74*** .54***
T2 T3 .65*** .61*** .57*** .59*** .81*** .76*** .56***
T3 T4 .66*** .63*** .58*** .60*** .82*** .78*** .57***
T4 T5 .66*** .61*** .59*** .58*** .82*** .79*** .56***
Cross-lagged effects
Grades
Boredom
Boredom
Grades
Grades
Hopelessn.
Hopelessn.
Grades
Grades
Pos. affect
Grades
Neg. affect
Pos. affect
Grades
Neg. affect
Grades
T1 T2 -.06*** -.08*** -.11*** -.11*** .05*** -.04*** .10*** -.08***
T2 T3 -.06*** -.08*** -.12*** -.12*** .05*** -.04*** .10*** -.08***
T3 T4 -.06*** -.09*** -.12*** -.13*** .05*** -.04*** .10*** -.09***
T4 T5 -.06*** -.09*** -.11*** -.13*** .05*** -.04*** .10*** -.09***
Effects of Covariates at T1
Gender .09** .02 -.16*** .02 .15*** -.13*** .02
Intelligence .00 .40*** -.13*** .40*** -.02 -.15*** .40***
SES -.03 .09*** -.04 .09*** -.05** -.03 .09***
Residual Variances
T1 .99 .82 .95 .82 .97 .96 .82
T2 .59 .58 .66 .58 .34 .41 .58
T3 .56 .56 .61 .58 .33 .36 .57
T4 .54 .57 .60 .56 .32 .35 .59
T5 .53 .55 .59 .56 .32 .33 .57
Note. a Range of factor loadings. p < .001 for all loadings. b Cross-paths between positive and negative affect were not significant (all ps > .05).
* p < .05. ** p < .01. *** p < .001.

Running head: EMOTION AND ACHIEVEMENT 43
Figure 1. Basic structure of cross-lagged reciprocal effects models. Upper part: emotion and
achievement. Lower part: positive affect, negative affect, and achievement. The models include
cross-lagged effects, autoregressive effects, and directional paths from the covariates to emotion
or affect and achievement at all waves. Correlations between the covariates and between
residuals are not displayed.

Running head: EMOTION AND ACHIEVEMENT – SUPPORTING INFORMATION 44
Supporting Information
Table S1
Descriptive Statistics for Emotions and Achievement: Means, Standard Deviations, Skewness,
and Kurtosis
Time 1 Time 2 Time 3 Time 4 Time 5
M /
SD
Skew/
Kurt.
M /
SD
Skew/
Kurt.
M /
SD
Skew/
Kurt.
M /
SD
Skew/
Kurt.
M /
SD
Skew/
Kurt.
Enjoyment 29.90
7.63
0.09
0.55
26.83
7.65
0.17
0.37
24.56
7.40
0.30
0.19
23.99
7.11
0.24
0.20
23.71
6.99
0.27
0.00
Pride 22.55
6.54
0.05
0.54
20.86
6.56
0.05
0.49
19.17
6.37
0.24
0.32
18.78
6.32
0.25
0.16
18.53
6.13
0.23
0.22
Anger 16.03
7.35
1.03
0.42
17.73
7.78
0.75
0.17
19.57
7.78
0.52
0.42
19.33
7.69
0.56
0.31
19.40
7.54
0.55
0.30
Anxiety 34.00
12.31
0.64
0.15
34.76
12.66
0.61
0.18
35.31
12.90
0.59
0.19
33.85
12.49
0.66
0.01
33.95
12.40
0.67
0.04
Shame 14.99
6.85
1.17
0.91
15.30
7.14
1.12
0.72
15.03
6.82
1.10
0.63
14.48
6.74
1.22
1.14
14.36
6.59
1.25
1.18
Hopelessn. 12.15
5.84
1.15
0.65
12.86
6.20
0.77
0.22
13.53
6.30
0.42
0.69
13.41
6.36
0.43
0.52
13.44
6.22
0.51
0.36
Boredom 11.73
5.77
1.00
0.26
13.66
6.37
0.91
0.11
15.39
6.47
0.78
0.16
15.55
6.24
0.78
0.23
15.54
6.07
0.76
0.17
Grades 3.09
0.91
0.18
-0.24
3.16
0.96
-0.16
0.03
3.36
0.94
-0.09
-0.20
3.29
0.95
-0.16
-0.32
3.23
0.99
-0.23
.42
Test scores a
0.08
0.65
a 0.25
0.30
a -0.06
0.22
a 0.04
-0.29
a -0.39
0.79
Note. Times 1-5 = Grades 5-9. Emotion scores are sum scores of manifest items.
a Test scores were Rasch-scaled with M = 1,000, SD = 100 at all waves.

Running head: EMOTION AND ACHIEVEMENT – SUPPORTING INFORMATION 45
Table S2
Confirmatory Factor Analyses for the Discrete Emotion Constructs
Model 2 df CFI TLI RMSEA SRMR
Time 1 3131.430** 1081 .957 .932 .030 .043
Time 2 3443.127** 1081 .955 .929 .033 .048
Time 3 3997.959** 1081 .953 .925 .034 .050
Time 4 4381.458** 1081 .946 .915 .036 .053
Time 5 4413.424** 1081 .95 .92 .035 .052
Note. Separate confirmatory factor analyses for the five waves including enjoyment, pride,
anger, anxiety, shame, boredom, and hopelessness.
** p < .01.

Running head: EMOTION AND ACHIEVEMENT – SUPPORTING INFORMATION 46
Table S3
Measurement Equivalence of Emotion Constructs Across Waves
Configural Invariance Metric Invariance Scalar Invariance Residual Invariance
Model CFI TLI RMSEA SRMR CFI TLI RMSEA SRMR CFI TLI RMSEA SRMR CFI TLI RMSEA SRMR
Enjoyment .968 .961 .022 .036 .964 .957 .023 .042 .957 .950 .025 .049 .950 .945 .026 .057
Pride .979 .973 .020 .025 .978 .973 .020 .028 .974 .969 .021 .030 .967 .963 .023 .036
Anger .967 .958 .023 .032 .966 .959 .022 .034 .960 .953 .024 .035 .956 .951 .024 .037
Anxiety .936 .927 .023 .043 .935 .927 .023 .045 .930 .923 .024 .045 .923 .917 .024 .048
Shame .987 .983 .014 .026 .986 .982 .014 .027 .980 .976 .016 .028 .970 .966 .019 .034
Boredom .991 .987 .015 .021 .989 .986 .016 .026 .983 .978 .020 .031 .979 .975 .021 .033
Hopelessness .988 .984 .018 .020 .986 .982 .018 .023 .983 .981 .019 .024 .979 .977 .021 .028
Positive and
negative affect
.957 .940 .054 .077 .949 .931 .058 .082 .949 .935 .057 .082 .942 .929 .059 .083

Running head: EMOTION AND ACHIEVEMENT – SUPPORTING INFORMATION 47
Table S4
Reciprocal Effects Models for Emotion and Test Scores: Fit Indexes
2 df CFI TLI RMSEA SRMR
Model
Cross-paths, autoregressive effects, and residual variances
freely estimated
Enjoyment 3998.214** 1147 .950 .940 .027 .050
Pride 2590.262** 722 .958 .947 .027 .045
Anger 3268.875** 918 .950 .939 .027 .048
Anxiety 9206.366** 2992 .925 .915 .024 .053
Shame 2314.749** 907 .968 .960 .021 .043
Boredom 1596.453** 532 .974 .966 .024 .038
Hopelessness 1842.295** 562 .971 .964 .025 .049
Positive and negative
affect
6479.718**
685 .954 .940 .050 .073
Cross-paths, autoregressive effects, and residual variances
invariant across waves
Enjoyment 4136.124** 1165 .948 .938 .027 .052
Pride 2711.883** 740 .955 .946 .027 .046
Anger 3370.445** 936 .948 .938 .027 .048
Anxiety 9311.381** 3010 .924 .915 .024 .053
Shame 2428.962** 925 .966 .958 .021 .045
Boredom 1761.501** 550 .971 .963 .025 .041
Hopelessness 1939.106** 580 .970 .963 .026 .049
Positive and negative
affect
6659.495** 721 .953 .942 .049 .075
** p < .01.

Running head: EMOTION AND ACHIEVEMENT – SUPPORTING INFORMATION 48
Table S5
Reciprocal Effects Models for Emotion and Test Scores: Standardized Factor Loadings, Path Coefficients, and Residual Variances
Enjoyment model Pride model Anger model Anxiety model Shame model
Enjoyment Test Pride Test Anger Test Anxiety Test Shame Test
Factor loadings .33-.82 a .56-.77 a .59-.77 a .43-.77 a .47-.78 a
Autoregressive effects
T1 T2 .68*** .70*** .63*** .70*** .58*** .68*** .59*** .69*** .62*** .69***
T2 T3 .68*** .70*** .66*** .71*** .61*** .69*** .65*** .69*** .61*** .70***
T3 T4 .68*** .69*** .67*** .69*** .63*** .67*** .67*** .68*** .60*** .68***
T4 T5 .68*** .70*** .67*** .70*** .63*** .68*** .68*** .69*** .60*** .69***
Cross-lagged effects
Test
Enjoyment
Enjoyment
Test
Test
Pride
Pride
Test
Test
Anger
Anger
Test
Test
Anxiety
Anxiety
Test
Test
Shame
Shame
Test
T1 T2 .07*** .04*** .06*** .04*** -.11*** -.07*** -.09*** -.06*** -.08*** -.06***
T2 T3 .07*** .04*** .06*** .04*** -.10*** -.07*** -.09*** -.06*** -.08*** -.06***
T3 T4 .07*** .04*** .05*** .04*** -.10*** -.08*** -.08*** -.07*** -.08*** -.06***
T4 T5 .07*** .04*** .05*** .04*** -.10*** -.08*** -.08*** -.07*** -.09*** -.06***
Effects of Covariates at T1
Gender .14*** .13*** .17*** .13*** -.03 .13*** -.16*** .13*** -.09** .13***
Intelligence -.02 .56*** -.00 .56*** -.12*** .56*** -.17*** .56*** -.17*** .56***
SES -.06** .12*** -.05* .12*** -.03 .12*** -.03 .12*** -.03 .12***
Residual Variances
T1 .98 .62 .97 .62 .98 .62 .94 .62 .96 .62
T2 .51 .30 .58 .30 .63 .30 .61 .30 .56 .30
T3 .52 .31 .54 .31 .59 .31 .54 .31 .59 .31
T4 .52 .30 .54 .30 .58 .30 .50 .30 .59 .30
T5 .53 .30 .53 .30 .57 .30 .50 .30 .61 .30

Running head: EMOTION AND ACHIEVEMENT – SUPPORTING INFORMATION 49
Table S5 (continued)
Boredom model Hopelessness model Positive and negative affect model
Boredom Test Hopelessn. Test Pos. Affect b Neg. Affect b Test
Factor loadings .57-.77 a .59-.85 a .77-.97 a .42-.93 a
Autoregressive effects
T1 T2 .64*** .70*** .54*** .69*** .81*** .75*** .68***
T2 T3 .66*** .70*** .58*** .69*** .82*** .77*** .69***
T3 T4 .67*** .69*** .60*** .68*** .82*** .79*** .67***
T4 T5 .67*** .70*** .61*** .69*** .82*** .80*** .68***
Cross-lagged effects
Test
Boredom
Boredom
Test
Test
Hopelessn.
Hopelessn.
Test
Test Pos.
Affect
Test
Neg. Affect
Pos. Affect
Test
Neg. Affect
Test
T1 T2 -.04* -.05*** -.11*** -.06*** .03** -.05*** .01 -.06***
T2 T3 -.04* -.05*** -.11*** -.07*** .03** -.04*** .01 -.06***
T3 T4 -.04* -.06*** -.10*** -.07*** .03** -.04*** .01 -.06***
T4 T5 -.04* -.06*** -.11*** -.07*** .03** -.04*** .01 -.07***
Effects of Covariates at T1
Gender .09** .13*** -.16*** .13*** .15*** -.13*** .13***
Intelligence -.01 .56*** -.13*** .56*** -.01 -.15*** .56***
SES -.02 .12*** -.04 .12*** -.05** -.03 .12***
Residual Variances
T1 .99 .62 .96 .62 .98 .96 .62
T2 .59 .30 .66 .30 .34 .40 .30
T3 .57 .31 .61 .31 .33 .36 .31
T4 .54 .30 .59 .30 .32 .34 .30
T5 .53 .30 .59 .30 .32 .33 .30
Note. a Range of factor loadings. p < .001 for all loadings. b Cross-paths between positive and negative affect were not significant (all ps > .05).
* p < .05. ** p < .01. *** p < .001.

Running head: EMOTION AND ACHIEVEMENT – SUPPORTING INFORMATION 50
Table S6
Fit Indexes of Reciprocal Effects Models for Emotion and Grades:
Subsample of Students who Entered the Study at Grade 5 (N = 2,070)
Model 2 df CFI TLI RMSEA SRMR
Enjoyment 3479.354** 1165 .937 .926 .031 .060
Pride 2319.701** 740 .941 .928 .032 .054
Anger 2384.452** 936 .939 .926 .034 .053
Anxiety 7538.112** 3010 .919 .909 .027 .054
Shame 1922.145** 925 .962 .954 .023 .049
Boredom 1265.447** 550 .970 .962 .025 .043
Hopelessness 1691.283** 580 .957 .948 .030 .061
Positive and negative
affect
5086.566**
721 .939 .923 .054 .080
Note. Cross-paths, autoregressive effects, and residual variances invariant across waves.
** p < .01.

Running head: EMOTION AND ACHIEVEMENT – SUPPORTING INFORMATION 51
Table S7
Reciprocal Effects Models for Emotion and Grades: Subsample of Students who Entered the Study at Grade 5 (N = 2070)
Enjoyment model Pride model Anger model Anxiety model Shame model
Enjoyment Test Pride Test Anger Test Anxiety Test Shame Test
Factor loadings .35-.83 a .55-.77 a .59-.77 a .43-.77 a .47-.78 a
Autoregressive effects
T1 T2 .67*** .59*** .62*** .59*** .58*** .58*** .59*** .58*** .62*** .59***
T2 T3 .67*** .61*** .65*** .61*** .62*** .60*** .65*** .60*** .61*** .62***
T3 T4 .67*** .63*** .66*** .63*** .63*** .62*** .67*** .62*** .60*** .64***
T4 T5 .67*** .62*** .66*** .61*** .63*** .61*** .69*** .61*** .60*** .62***
Cross-lagged effects
Grades
Enjoyment
Enjoyment
Grades
Grades
Pride
Pride
Grades
Grades
Anger
Anger
Grades
Grades
Anxiety
Anxiety
Grades
Grades
Shame
Shame
Grades
T1 T2 .08*** .09*** .09*** .09*** -.07*** -.09*** -.07*** -.08*** -.06*** -.08***
T2 T3 .09*** .09*** .09*** .10*** -.07*** -.10*** -.07*** -.10*** -.07*** -.07***
T3 T4 .09*** .09*** .09*** .10*** -.07*** -.10*** -.07*** -.10*** -.07*** -.07***
T4 T5 .09*** .09*** .09*** .10*** -.07*** -.11*** -.07*** -.11*** -.07*** -.07***
Effects of Covariates at T1
Gender .14*** .01 .17*** .01 -.01 .04 -.15*** .02 -.07* .01
Intelligence -.03 .38*** -.02 .38*** -.11** .39*** -.16*** .38*** -.16*** .38***
SES -.06** .08*** -.05* .08*** -.03 .08** -.03 .08*** -.03 .08**
Residual Variances
T1 .98 .84 .97 .84 .99 .83 .95 .84 .97 .84
T2 .51 .58 .57 .58 .64 .59 .61 .58 .58 .58
T3 .51 .56 .54 .56 .60 .56 .54 .56 .59 .56
T4 .52 .57 .53 .57 .58 .58 .51 .57 .59 .57
T5 .52 .57 .52 .56 .57 .57 .50 .56 .60 .56

Running head: EMOTION AND ACHIEVEMENT – SUPPORTING INFORMATION 52
Table S7 (continued)
Boredom model Hopelessness model Positive and negative affect model
Boredom Test Hopelessn. Test Pos. Affect b Neg. Affect b Test
Factor loadings .56-.76 a .59-.85 a .76-.98 a .42-.93 a
Autoregressive effects
T1 T2 .62*** .61*** .54*** .58*** .81*** .75*** .56***
T2 T3 .64*** .62*** .58*** .60*** .80*** .75*** .58***
T3 T4 .65*** .64*** .59*** .62*** .80*** .75*** .60***
T4 T5 .65*** .63*** .60*** .61*** .79*** .76*** .59***
Cross-lagged effects
Grades
Boredom
Boredom
Grades
Grades
Hopelessn.
Hopelessn.
Grades
Grades
Pos. affect
Grades
Neg. affect
Pos. affect
Grades
Neg. affect
Grades
T1 T2 -.05* -.06*** -.10*** -.09*** .04*** -.03*** .07*** -.08***
T2 T3 -.06* -.06*** -.11*** -.10*** .04*** -.04*** .06*** -.08***
T3 T4 -.06* -.07*** -.11*** -.10*** .04*** -.04*** .06*** -.08***
T4 T5 -.05* -.07*** -.11*** -.10*** .04*** -.05*** .06*** -.08***
Effects of Covariates at T1
Gender .09** .02 -.15*** .02 .17*** -.12*** .02
Intelligence .01 .38*** -.12*** .38*** -.03 -.14*** .38***
SES -.02 .08*** -.03 .08*** -.06** -.04 .08***
Residual Variances
T1 .99 .84 .96 .84 .97 .96 .84
T2 .61 .59 .66 .58 .33 .39 .58
T3 .57 .56 .62 .56 .34 .39 .56
T4 .55 .57 .60 .57 .36 .39 .58
T5 .54 .56 .60 .56 .36 .39 .57
Note. a Range of factor loadings. p < .001 for all loadings. b Cross-paths between positive and negative affect were not significant (all ps > .05).
* p < .05. ** p < .01. *** p < .001.

Running head: EMOTION AND ACHIEVEMENT – SUPPORTING INFORMATION 53
Table S8
Measurement Equivalence of Emotion Constructs Across School Tracks
Configural Invariance Metric Invariance Scalar Invariance Residual Invariance
Model CFI TLI RMSEA SRMR CFI TLI RMSEA SRMR CFI TLI RMSEA SRMR CFI TLI RMSEA SRMR
Enjoyment .960 .951 .026 .044 .958 .949 .027 .051 .953 .946 .027 .053 .939 932 .031 .065
Pride .972 .963 .024 .035 .970 .963 .024 .042 .968 .962 .024 .043 .956 950 .028 .052
Anger .961 .950 .026 .041 .960 .951 .026 .046 .952 .943 .028 .047 .943 935 .030 .053
Anxiety .921 .909 .027 .050 .919 .908 .028 .055 .910 .900 .029 .056 .905 895 .029 .057
Shame .980 .974 .018 .037 .978 .973 .018 .054 .974 .968 .022 .055 .954 947 .026 .066
Boredom .987 .982 .019 .031 .986 .982 020 .038 .983 .979 .021 .039 .973 967 .026 .048
Hopelessness .982 .977 .023 .032 .982 978 .022 .037 .979 .976 .023 .038 .964 960 .030 .047
Positive and
negative affect
.955 .937 .059 .075 .954 .939 .058 .078 .953 .940 .057 .078 .953 943 .056 .079

Running head: EMOTION AND ACHIEVEMENT – SUPPORTING INFORMATION 54
Table S9
Multi-Group Reciprocal Effects Models for Emotion and Grades:
Fit Indexes for Invariance across School Tracks
2 df CFI TLI RMSEA SRMR
Model
Cross-paths, autoregressive effects, and effects of covariates
allowed to vary across tracks
Enjoyment 7556.258** 3575 .928 .916 .031 .063
Pride 4969.021** 2280 .932 .919 .032 .059
Anger 6020.910** 2878 .929 .917 .031 .060
Anxiety 17819.289** 9170 .901 .890 .029 .059
Shame 4791.526** 2845 .952 .944 .024 .057
Boredom 2995.170** 1700 .966 .957 .026 .054
Hopelessness 3833.084** 1790 .950 .941 .032 .063
Positive and negative
affect
9845.060** 2243 .941 .929 .055 .080
Cross-paths, autoregressive effects, and effects of covariates
invariant across tracks
Enjoyment 7798.508** 3663 .925 .915 .031 .065
Pride 5231.097** 2368 .927 .917 .033 .064
Anger 6179.622** 2966 .928 .918 .031 .062
Anxiety 18095.470** 9258 .899 .889 .029 .061
Shame 4981.714** 2933 .950 .942 .025 .060
Boredom 3217.265 ** 1788 .962 .955 .026 .059
Hopelessness 4130.255** 1878 .945 .939 .032 .073
Positive and negative
affect
10209.853** 2381 .940 .932 .054 .084
Note. The analysis is based on the final reciprocal effects models for emotion and grades
(see main text, results section).
** p < .01.

Running head: EMOTION AND ACHIEVEMENT – SUPPORTING INFORMATION 55
Table S10
Multi-Group Reciprocal Effects Models for Emotion and Test Scores:
Fit Indexes for Invariance across School Tracks
2 df CFI TLI RMSEA SRMR
Model
Cross-paths, autoregressive effects, and effects of covariates
allowed to vary across tracks
Enjoyment 7451.591** 3575 .932 .922 .031 .068
Pride 4880.764** 2280 .938 .926 .032 .068
Anger 5950.733** 2878 .934 .923 .031 .066
Anxiety 17700.078** 9167 .905 .894 .029 .061
Shame 4769.388** 2845 .955 .947 .024 .064
Boredom 3249.428** 1700 .961 .952 .028 .067
Hopelessness 3497.301** 1790 .960 .953 .020 .071
Positive and negative
affect
9372.345** 2243 .945 .934 .053 .086
Cross-paths, autoregressive effects, and effects of covariates
invariant across tracks
Enjoyment 7803.200** 3663 .928 .918 .031 .076
Pride 5238.465** 2368 .931 .922 .033 .081
Anger 6233.918** 2966 .930 .920. .031 .075
Anxiety 18058.194** 9255 .901 .89 .029 .067
Shame 5068.827** 2933 .950 .953 .025 .075
Boredom 3617.542** 1788 .954 .946 .030 .082
Hopelessness 3858.138** 1878 .954 .948 .030 .089
Positive and negative
affect
9856.236** 2381 .943 .935 .052 .099
Note. The analysis is based on the final reciprocal effects models for emotion and test scores
(see main text, results section).
** p < .01.

Running head: EMOTION AND ACHIEVEMENT – SUPPORTING INFORMATION 56
Table S11
Sample Mplus Input Syntax to Demonstrate Use of <TYPE = COMPLEX > Option:
Confirmatory Factor Analysis for Enjoyment
TITLE: ENJOYMENT CFA
!Specification of data file to be used for the analysis
DATA: FILE IS "PALMA Crosslagged_08.08.13.dat";
!List of all variables contained in the dataset
VARIABLE: NAMES ARE
vpnr school fges_1 fges_2 fges_3 fges_4 fges_5 fges_6
gma_jz4 gma_jz5 gma_jz6 gma_jz7 gma_jz8 gma_jz9 gma_zz10
jo_1 pr_1 ax_1 ag_1 hl_1 bo_1 sh_1 flow_1 jo_2 pr_2 ax_2
ag_2 hl_2 bo_2 sh_2 flow_2 jo_3 pr_3 ax_3 ag_3 hl_3 bo_3
sh_3 flow_3 jo_4 pr_4 ax_4 ag_4 hl_4 bo_4 sh_4 flow_4
jo_5 pr_5 ax_5 ag_5 hl_5 bo_5 sh_5 flow_5 jo_6 pr_6 ax_6
ag_6 hl_6 bo_6 sh_6 flow_6 clnr_6 clnr_1 clnr_2
agemon ageyear sex
sctyp_1 sctyp_2 sctyp_3 sctyp_4 sctyp_5 ag1_1 ag3_1
ag2_1 ag4_1 ag7_1 ag8_1 ag5_1 ag6_1 ax1_1 ax2_1
ax4_1 ax3_1 ax12_1 ax13_1 ax14_1 ax15_1 ax5_1
ax6_1 ax7_1 ax8_1 ax9_1 ax10_1 ax11_1 bo1_1 bo2_1
bo3_1 bo4_1 bo5_1 bo6_1 hl1_1 hl2_1 hl3_1 hl4_1
hl5_1 hl6_1 jo1_1 jo2_1 jo3_1 joengp_1 jogerp_1
jo7_1 jo8_1 jo9_1 jo4_1 jo5_1 jo6_1 pr1_1 pr2_1
pr6_1 pr7_1 pr8_1 pr3_1 pr4_1 pr5_1 sh1_1 sh2_1
sh7_1 sh8_1 sh3_1 sh4_1 sh5_1 sh6_1 kftviq_1
kftniq_1 kft_iq_1 jo1_2 ax1_2 ax3_2 ax4_2 jo2_2
bo2_2 ax2_2 ag1_2 sh2_2 bo1_2 jo3_2 ag2_2 bo3_2
ag3_2 sh1_2 ag4_2 pr1_2 pr2_2 ax5_2 jo6_2 hl1_2
ax7_2 hl3_2 ax10_2 hl4_2 ax9_2 jo4_2 ax6_2 ag5_2
hl2_2 sh4_2 ax11_2 hl5_2 ag6_2 sh5_2 jo5_2 ax8_2
hl6_2 sh6_2 pr3_2 pr4_2 sh3_2 pr5_2 bo4_2 ax14_2
jo7_2 ax15_2 ag7_2 bo6_2 ax12_2 sh8_2 jo8_2 ax13_2
bo5_2 pr8_2 ag8_2 jo9_2 pr6_2 sh7_2 pr7_2 kftviq_2
kftniq_2 kftiq_2 clnr_3 kftniq_3 kftviq_3 jo1_3 ax1_3
ax3_3 ax4_3 jo2_3 bo2_3 ax2_3 ag1_3 sh2_3 bo1_3
jo3_3 ag2_3 bo3_3 ag3_3 sh1_3 ag4_3 pr1_3
pr2_3 ax5_3 jo6_3 hl1_3 ax7_3 hl3_3 ax10_3
hl4_3 ax9_3 jo4_3 ax6_3 ag5_3 hl2_3 sh4_3
ax11_3 hl5_3 ag6_3 sh5_3 jo5_3 ax8_3 hl6_3
sh6_3 pr3_3 pr4_3 sh3_3 pr5_3 bo4_3 ax14_3
jo7_3 gma_zz7 ax15_3 ag7_3 bo6_3 ax12_3
sh8_3 jo8_3 ax13_3 bo5_3 pr8_3 ag8_3 jo9_3
pr6_3 sh7_3 pr7_3 kftiq_3 joc_1 jot_1 jol_1 prc_1
prt_1 prl_1 axc_1 axt_1 axl_1 agc_1 agt_1 agl_1
boc_1 bol_1 shc_1 sht_1 shl_1 joc_2 jot_2 jol_2
prc_2 prt_2 prl_2 axc_2 axt_2 axl_2 agc_2 agt_2
agl_2 boc_2 bol_2 shc_2 sht_2 shl_2 joc_3 jot_3
jol_3 prc_3 prt_3 prl_3 axc_3 axt_3 axl_3 agc_3

Running head: EMOTION AND ACHIEVEMENT – SUPPORTING INFORMATION 57
agt_3 agl_3 boc_3 bol_3 shc_3 sht_3 shl_3 clnr_4
jo1_4 ax1_4 ax3_4 ax4_4 jo2_4 bo2_4 ax2_4 ag1_4
sh2_4 bo1_4 jo3_4 ag2_4 bo3_4 ag3_4 sh1_4 ag4_4
mbunt1_4 mbueb2_4 mbueb1_4 mbunt2_4 pr1_4
pr2_4 ax5_4 jo6_4 hl1_4 ax7_4 hl3_4 ax10_4 hl4_4
ax9_4 jo4_4 ax6_4 ag5_4 hl2_4 sh4_4 ax11_4 hl5_4
ag6_4 sh5_4 jo5_4 ax8_4 hl6_4 sh6_4 pr3_4 pr4_4
sh3_4 pr5_4 bo4_4 ax14_4 jo7_4 ax15_4 ag7_4
bo6_4 ax12_4 sh8_4 jo8_4 ax13_4 bo5_4 pr8_4
ag8_4 jo9_4 pr6_4 sh7_4 pr7_4 joc_4 jot_4 jol_4
prc_4 prt_4 prl_4 axc_4 axt_4 axl_4 agc_4 agt_4
agl_4 boc_4 bol_4 shc_4 sht_4 shl_4 kftniq_4 kftviq_4
kftiq_4 laeng12345 clnr_5 kftniq_5 kftviq_5 kftiq_5
jo1_5 ax1_5 ax3_5 ax4_5 jo2_5 bo2_5 ax2_5 ag1_5
sh2_5 bo1_5 jo3_5 ag2_5 bo3_5 ag3_5 sh1_5 ag4_5
mbunt1_5 mbueb2_5 mbueb1_5 mbunt2_5 pr1_5
pr2_5 ax5_5 jo6_5 hl1_5 ax7_5 hl3_5 ax10_5 hl4_5
ax9_5 jo4_5 ax6_5 ag5_5 hl2_5 sh4_5 ax11_5 hl5_5
ag6_5 sh5_5 jo5_5 ax8_5 hl6_5 sh6_5 pr3_5 pr4_5
sh3_5 pr5_5 bo4_5 ax14_5 jo7_5 ax15_5 ag7_5
bo6_5 ax12_5 sh8_5 jo8_5 ax13_5 bo5_5 pr8_5
ag8_5 jo9_5 pr6_5 sh7_5 pr7_5 joc_5 jot_5 jol_5
prc_5 prt_5 prl_5 axc_5 axt_5 axl_5 agc_5 agt_5
agl_5 boc_5 bol_5 mbueb_5 mbunt_5 shc_5 sht_5
shl_5 sctyp_6 jo1_6 ax1_6 ax3_6 ax4_6 jo2_6
bo2_6 ax2_6 ag1_6 sh2_6 bo1_6 jo3_6 ag2_6
bo3_6 ag3_6 sh1_6 ag4_6 mbunt1_6 mbueb2_6
mbueb1_6 mbunt2_6 pr1_6 pr2_6 ax5_6 jo6_6
hl1_6 ax7_6 hl3_6 ax10_6 hl4_6 ax9_6 jo4_6 ax6_6
ag5_6 hl2_6 sh4_6 ax11_6 hl5_6 ag6_6 sh5_6 jo5_6
ax8_6 hl6_6 sh6_6 pr3_6 pr4_6 sh3_6 pr5_6 bo4_6
ax14_6 jo7_6 ax15_6 ag7_6 bo6_6 ax12_6 sh8_6
jo8_6 ax13_6 bo5_6 pr8_6 ag8_6 jo9_6 pr6_6 sh7_6
pr7_6 joc_6 jot_6 jol_6 prc_6 prt_6 prl_6 axc_6 axt_6
axl_6 agc_6 agt_6 agl_6 boc_6 bol_6 mbueb_6
mbunt_6 shc_6 sht_6 shl_6 kftniq_6 kftviq_6 kftiq_6
egp6f_ges egp6m_ges egp6_ges egp11f_ges egp11m_ges;
!Definition of cluster variable to account for nestedness of students within schools
CLUSTER = SCHOOL;
!Variables used in the CFA: Jo1_1=Joy Item 1 at Wave 1 to Jo1_5=Joy Item 5 at Wave 5_
USEVARIABLES ARE
jo1_1 jo2_1 jo3_1 jo4_1 jo5_1 jo6_1 jo7_1 jo8_1 jo9_1
jo1_2 jo2_2 jo3_2 jo4_2 jo5_2 jo6_2 jo7_2 jo8_2 jo9_2
jo1_3 jo2_3 jo3_3 jo4_3 jo5_3 jo6_3 jo7_3 jo8_3 jo9_3
jo1_4 jo2_4 jo3_4 jo4_4 jo5_4 jo6_4 jo7_4 jo8_4 jo9_4
jo1_5 jo2_5 jo3_5 jo4_5 jo5_5 jo6_5 jo7_5 jo8_5 jo9_5;
!Definition of missing values for all variables in the dataset
MISSING ARE ALL (-99);
!Command to consider nestedness by using the Mplus complex design
ANALYSIS: TYPE = COMPLEX;
MODEL:

Running head: EMOTION AND ACHIEVEMENT – SUPPORTING INFORMATION 58
!Measurement model defining latent variables enjoy_1 (enjoyment Wave 1) to enjoy_5 (enjoyment
Wave 5) by items as manifest indicators
enjoy_1 by jo1_1 jo2_1 jo3_1 jo4_1 jo5_1 jo6_1 jo7_1 jo8_1 jo9_1;
enjoy_2 by jo1_2 jo2_2 jo3_2 jo4_2 jo5_2 jo6_2 jo7_2 jo8_2 jo9_2;
enjoy_3 by jo1_3 jo2_3 jo3_3 jo4_3 jo5_3 jo6_3 jo7_3 jo8_3 jo9_3;
enjoy_4 by jo1_4 jo2_4 jo3_4 jo4_4 jo5_4 jo6_4 jo7_4 jo8_4 jo9_4;
enjoy_5 by jo1_5 jo2_5 jo3_5 jo4_5 jo5_5 jo6_5 jo7_5 jo8_5 jo9_5;
!Correlated uniquenesses within waves for items measuring class-related enjoyment
jo1_1-jo3_1 with jo1_1-jo3_1;
jo1_2-jo3_2 with jo1_2-jo3_2;
jo1_3-jo3_3 with jo1_3-jo3_3;
jo1_4-jo3_4 with jo1_4-jo3_4;
jo1_5-jo3_5 with jo1_5-jo3_5;
!Correlated uniquenesses within waves for items measuring test-related enjoyment
jo4_1-jo6_1 with jo4_1-jo6_1;
jo4_2-jo6_2 with jo4_2-jo6_2;
jo4_3-jo6_3 with jo4_3-jo6_3;
jo4_4-jo6_4 with jo4_4-jo6_4;
jo4_5-jo6_5 with jo4_5-jo6_5;
!Correlated uniquenesses within waves for items measuring learning-related enjoyment
jo7_1-jo9_1 with jo7_1-jo9_1;
jo7_2-jo9_2 with jo7_2-jo9_2;
jo7_3-jo9_3 with jo7_3-jo9_3;
jo7_4-jo9_4 with jo7_4-jo9_4;
jo7_5-jo9_5 with jo7_5-jo9_5;
!Correlated uniquenesses of identical items across waves
jo1_1-jo9_1 pwith jo1_2-jo9_2;
jo1_1-jo9_1 pwith jo1_3-jo9_3;
jo1_1-jo9_1 pwith jo1_4-jo9_4;
jo1_1-jo9_1 pwith jo1_5-jo9_5;
jo1_2-jo9_2 pwith jo1_3-jo9_3;
jo1_2-jo9_2 pwith jo1_4-jo9_4;
jo1_2-jo9_2 pwith jo1_5-jo9_5;
jo1_3-jo9_3 pwith jo1_4-jo9_4;
jo1_3-jo9_3 pwith jo1_5-jo9_5;
jo1_4-jo9_4 pwith jo1_5-jo9_5;
!Request to provide standardized STDYX solution in addition to default unstandardized solution
OUTPUT: STDYX;

Running head: EMOTION AND ACHIEVEMENT – SUPPORTING INFORMATION 59