Embed Size (px)
Citation preview

ACHARYA NARENDRA DEV COLLEGE
(University Of Delhi)
ELITE PROJECT● Neha(Maths(Hons.)Ist. year)
Mentor● Dr.Sarita Agarwal

A Study of the Fluctuations in A Study of the Fluctuations in the Stock Marketthe Stock Market

AcknowledgementNeha Chandra (B.Sc. Maths (Hons) ) and their mentor Dr.Sarita Agarwal are thankful to their
Principal Dr.Savithri Singh and the Mathematics Department.

ABSTRACTIn this project,we study the fluctuations in the stock market.We have observed the ups and downs in share market and its effect on the economy of a country.We found that the fluctuations are too caused by changes in GDP and currencyDollar parity.

Good economic outlooks mean
● People feel confident and spend more money, boosting company profits and positive economic outlook. The reverse is also true.
● The stock market is a realible form of investment. Investing in the stock market has an overriding goal to make money. Change within the stock market can have wide reaching effects.
INTRODUCTION

● When analyst use the term ”stock market fluctuations”, this means changes in price.
● The stock market is a real market where buyers and sellers meet to trade shares for money and the rules of supply and demand drive prices up and down,is called fluctuations. The actions of every individual investor cause the stock market to fluctuate.
Contents
➢Stock Market➢Factors affecting the stock ma➢Reasons for fluctuations in the stock market➢Stock Market Index (SMI)➢ Formula for calculating SMI➢Gross Domestic Product (GDP)

➢ Formula for calculating GDP➢ Rupee/Dollar➢ Methodology➢ Data
a.Indian Market b. USA Market
c. Singapore Market
d. Japan Market

➢ Correlation➢ Multiple Correlation➢ Regression Models
a.Indian Regression Model b. USA Regression Model c. Singapore Regression Model
d. Japan Regression Model➢ Conclusion➢ Biblography
➢ US Market➢ Singapore Market➢ Japan Market➢ Regression Models
a.Indian Regression Model
➢ Analysis➢ Conclusion➢ Bibliography

STOCK MARKETA Stock market of India was set up in 1875. At that time there were 22 bookies who met and established the BOMBAY STOCK EXCHANGE.
A stock market is a public market for the trading of company stocks and derivatives at an agreed price. The stock market is a realible form of investment.The stocks are traded at a place called exchange.

Objective
● To identify and analyse the impact of sentiments of investors on the share market prices and returns.
● To show the growth of a company (i.e. Profits and loss of company in the particular year).

In order to identify and understand the fluctuations in the stock market, one has to get a complete idea about the operations in the market.Every decision of the investor has an impact, which leads to profit or loss to him.

FACTORS AFFECTING THE STOCK MARKET
DEMAND and SUPPLY One of the major factor affecting stock price is demand and supply. The trend of the stock market trading directly affects the price. When people are buying the particular stocks,the price of that stock increases and vice versa.
INTEREST RATES- Regional and country economic factors, such as

Tax and interest rate policy, contribute to the directional change in the market.
INFLATION- Changes in inflation trends influence the long term stock market trends and volatility.
VOLATILITY- The stock market is volatile place to invest money. There is a strong relationship between volatility and market performance. When volatility increases stock market falls and vice versa.

● INVESTOR BEHAVIOUR- The higher level of volatility that comes has a direct impact on portfolios. As an investors portfolio of stock declines they should rebalance the weighting between stocks and bonds by buying more stocks at a lower price.
● FOREIGN MARKETS If the foreign market is facing the recession period,then the exporters can not sell goods overseas as they used to.

This causes drop in revenue and that can show up a fluctuation in the market.
● ECONOMIC GROWTH- High economic growth/ better prospectus for growth will help firms be more profitable because there will be more demands for goods and services.This will help in boosting up company's dividends and share prices.

● BANDWAGON EFFECT- At times the stock market seems to over react to certain events. Ex. In 1987, relatively little bad news caused the stock market to fall by 25%, but soon it regained the loss. Whenever prices fall people may feel insecure and want to get out of the market.

REASONS FOR THE FLUCTUATION IN STOCK MARKET
The following reasons are responsibe for the fluctuations in the stock market:
Imbalance between demand and supply conditions
Insidertrading reports
Market timing
New releases about the firms earnings and other important financial details

STOCK MARKET INDEXA stock market index or stock index is a method of measuring the value of a section of the stock market.This is computed from the prices of selected stocks. It is a tool used by investors and financial managers to describe the market and to compare the returns on the specific investments.
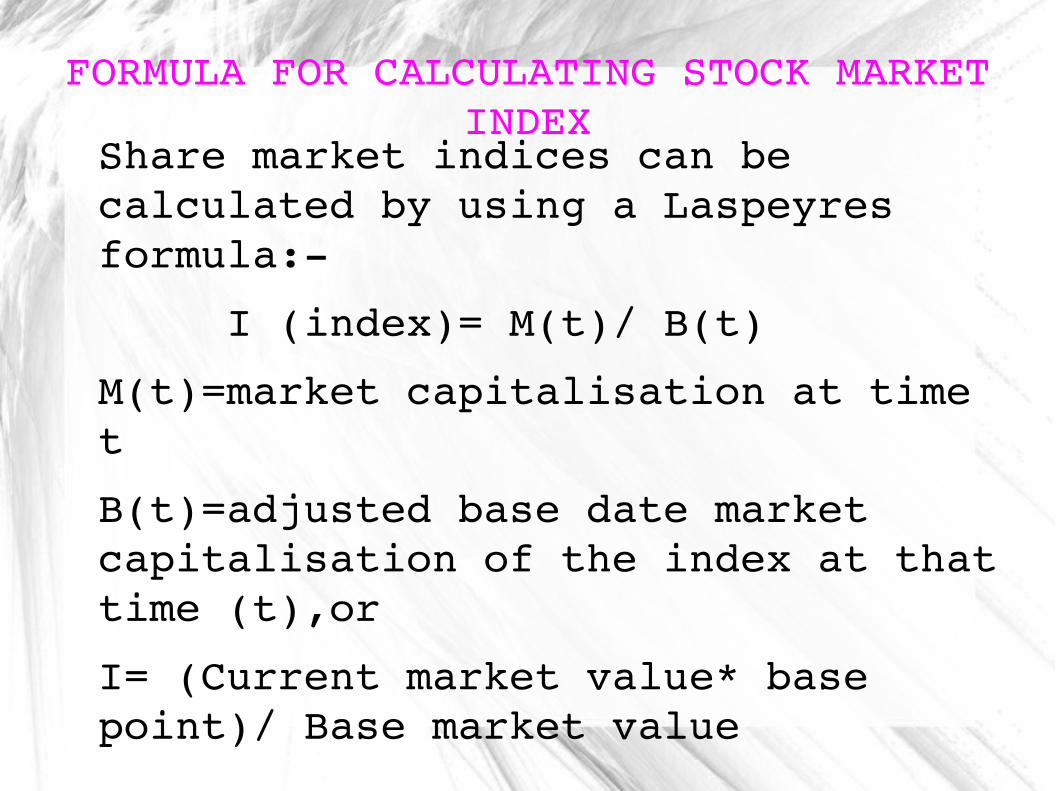
FORMULA FOR CALCULATING STOCK MARKET INDEX
Share market indices can be calculated by using a Laspeyres formula:
I (index)= M(t)/ B(t)
M(t)=market capitalisation at time t
B(t)=adjusted base date market capitalisation of the index at that time (t),or
I= (Current market value* base point)/ Base market value

So the easiest formula for calculating stock index is given as :
I(Index value)= Market value/ Divisor
Divisor= rebased index values
Base Market value= reflects the amount of capital that all companies had at the time the index was started. It depends on variation of index.

Gross Domestic Product (GDP) Gross Domestic Product (GDP) is the market value of all officially recognised financial goods and services produced within a country in a given period of time.
GDP is the sum of gross value added by all resident producers in the economy plus any product taxes and minus any subsidies not included in the value of products. It is often used as an indicator of standard of living of a country.

FORMULA FOR CALCULATING GDP OF A COUNTRY
GDP can be determined in three ways ,all of which should be in principle, give the same result. These are the product approach, the income approach and the expenditure approach.
● The Product Approach It sums the output of every class of enterprise, to arrive at the total. This method consists of two stages:
(1) Net value added= Gross value of output Value of intermediate consumption
(2)Value of output= Value of total sales of goods and

Services+ Value of changes in the inventories Income Approach It is sum total of income of
an individual living in a country during 1 year. Formula is given by:
GDP= Compensation of employees+ Gross operating surplus+ Gross mixed income+ Taxes Subsidies on production and imports
i.e. GDP= COE+ GOS+ GMI+ T S
Expenditure Approach It is the sum total of all the expenditure incurred by individuals during one year. Formula is given as:
GDP= Private consumption+ Gross investment+

Government spending+ (Exports Imports)
i.e. GDP= C+ I+ G+ (X- M)
Among the three defined above the most direct is product approach, which sums the output of every class of enterprise to arrive at the total. The expenditure approach works on the principle that all of the products must be brought by somebody, therefore the total value of product must be equal to people's total expenditure in buying things. The income approach works on the principle that the income of the productive factors must be equal to the value of their product and determines GDP by finding the sum of all producer's income.

Rupee/DollarWhat is Rupee?The rupee is the common name for the currency in countries like India, Pakistan, Bangladesh, etc. The first currency ” rupee” was introduced in 16th century by Sher Shah Suri. It is derived from sanskrit word 'rupya' meaning, wrought silver, a coin of silver.
What is Dollar?The dollar is the basic monetary unit of US,Canada,Australia and the certain countries in the Pacific,Caribbean,SE Asia,Africa and South America.
But the currency exchange rate in the stock market is calculated with respect to USDollar.

Methodology
● Stock Market is affected by various factors but in this project we have only considered GDP of a country, Stock Index and the exchange rate of the currency.
● The main purpose of this project is to check the correlation between GDP of a country, Stock Index and the exchange rate of the currency.
● For this we took the Stock Indices, GDP and exchange rate of the currency of four countries namely India , USA, Japan and Singapore and calculated correlation between them.
Later we found their multi-correlation cofficient and based on the result we developed Regression Coefficient Model.
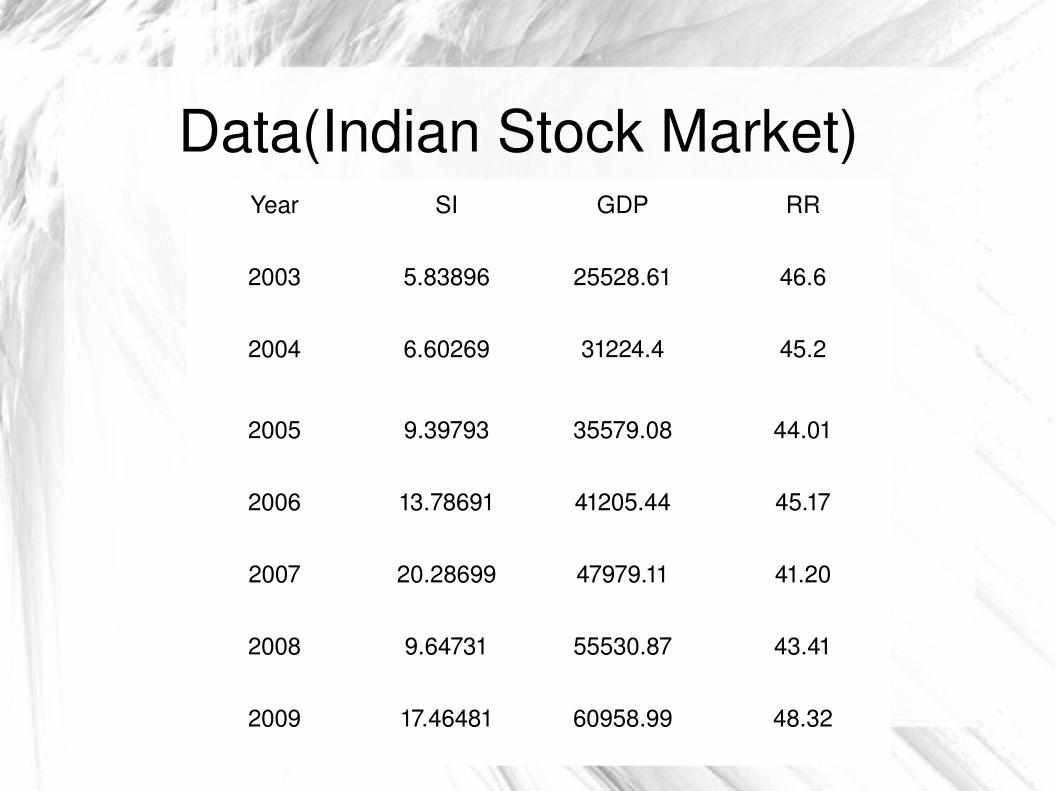
Data(Indian Stock Market)Year SI GDP RR
2003 5.83896 25528.61 46.6
2004 6.60269 31224.4 45.2
2005 9.39793 35579.08 44.01
2006 13.78691 41205.44 45.17
2007 20.28699 47979.11 41.20
2008 9.64731 55530.87 43.41
2009 17.46481 60958.99 48.32

2010 20.50909 74332.75 45.65
2011 15.45492 87002.42 46.61
2012 19.42671 97513.96 53.34
Here the Stock Index figures are takenin two digits.

Data (of USA)
Year GDP ( in billions) Stock Index
US Dollar
2003 11836.43 1595.91 91.62
2004 12246.93 1986.74 87.72
2005 12622.95 2075.73 84.61
2006 12958.48 2219.41 80.52
2007 13206.38 2613.92 79.04
2008 13161.93 2522.66 70.69

2009 12757.95 1774.33 76.21
2010 13062.98 2257.04 79.12
2011 13299.10 2796.86 69.51
2012 13593.20 2747.48 75.62

Data (of Singapore)Year GDP
(in billions)Stock Index( FTSE- 100)
Singapore dollar
2003 178.119 4113.00 1.74
2004 194.433 4393.20 1.69
2005 208.764 5242.40 1.66
2006 226.765 5896.90 1.59
2007 247.218 6630.90 1.51

2008 251. 539 5406. 80 1. 41
2009 249. 56 4127. 20 1. 45
2010 286. 447 5132. 90 1. 36
2011 301. 228 5868. 96 1. 26
2012 305. 202 5260. 19 1. 25
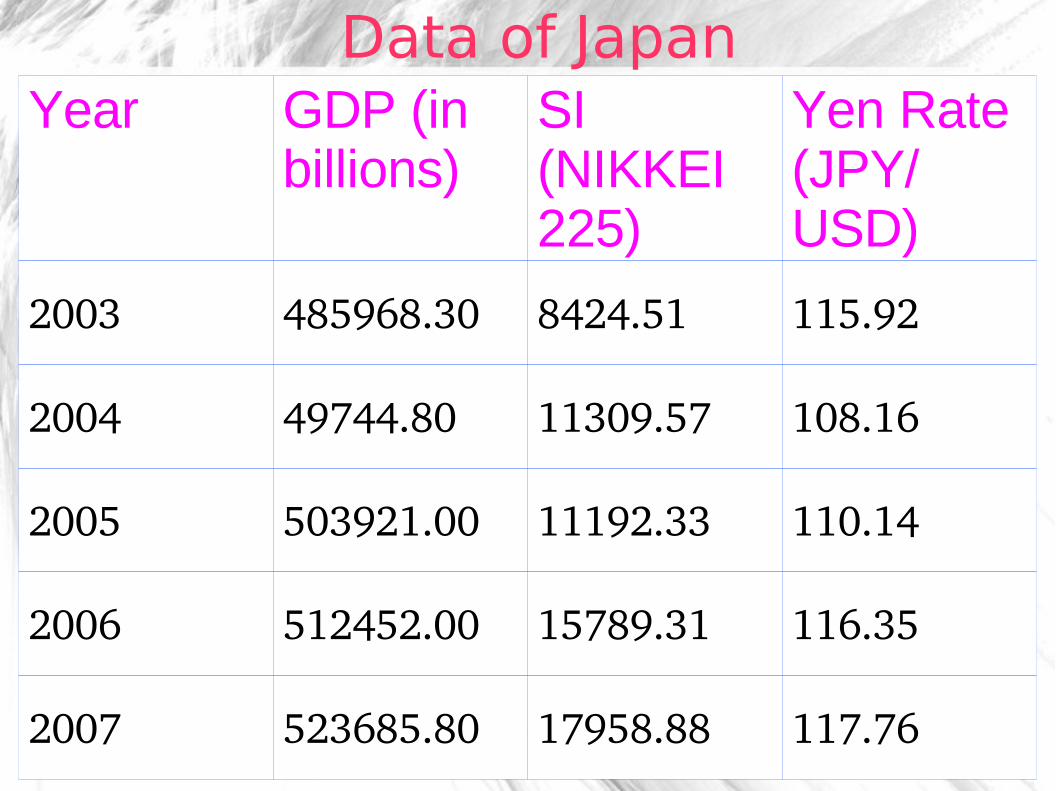
Data of JapanYear GDP (in
billions)SI (NIKKEI 225)
Yen Rate (JPY/ USD)
2003 485968.30 8424.51 115.92
2004 49744.80 11309.57 108.16
2005 503921.00 11192.33 110.14
2006 512452.00 15789.31 116.35
2007 523685.80 17958.88 117.76

2008 518230.90 14338.54 103.38
2009 489588.40 9522.50 93.60
2010 512364.60 9762.98 87.75
2011 509450.10 9521.94 79.71
2012 519621.00 8440.25 79.76

Correlation Correlation between the stock index , GDP and the currency exchange rate of the above markets have been calculated for finding out the more better picture of working and trading of stocks in International market. Considering the case of Indian market ̶
● Correlation coefficient between SI and GDP= 0.71029● Correlation coefficient between SI and RR = 0.23601● Correlation coefficient between GDP and RR=0.59608
(RRupee)

USA(NASDAQ)Correlation coefficient between
● SI and GDP= 0.89529● SI and USD = 0.74928
● GDP and USD=0.85286(USDUSDollar)

Singapore Stock ExchangeCorrelation coefficient between
● SI and GDP= 0.42638● SI and SD = 0.35697● GDP and SD=0.98706(SDSingapore Dollar)
Japan Stock ExchangeCorrelation coefficient between
● SI and GDP= 0.08210● SI and YenRate = 0.62003● GDP and Yen Rate=0.17228

Multiple CorrelationMultiple correlation coefficient(between stock index and GDP and Currency rate) of India= 0.55898
Multiple correlation coefficient of USA= 0.80230
Multiple Correlation coefficient of Singapore= 0.34062
Multiple Correlation coefficient of Japan= 0.42122
The above values shows that the Stock Index and GDP and Currency rate of all above markets are multicorrelated.

Therefore ,their regression model
X1= a + b X2 + c X3
where X1 is SI, X2 is GDP and X3 is Currency Rate
a=X1w121 /w112X 2w131 /w113X 3
, X 1=mean X 1 , X 2=mean X 2 , X 3=mean X 3 ,b=−w121 /w11 2 , c=−w131/w113
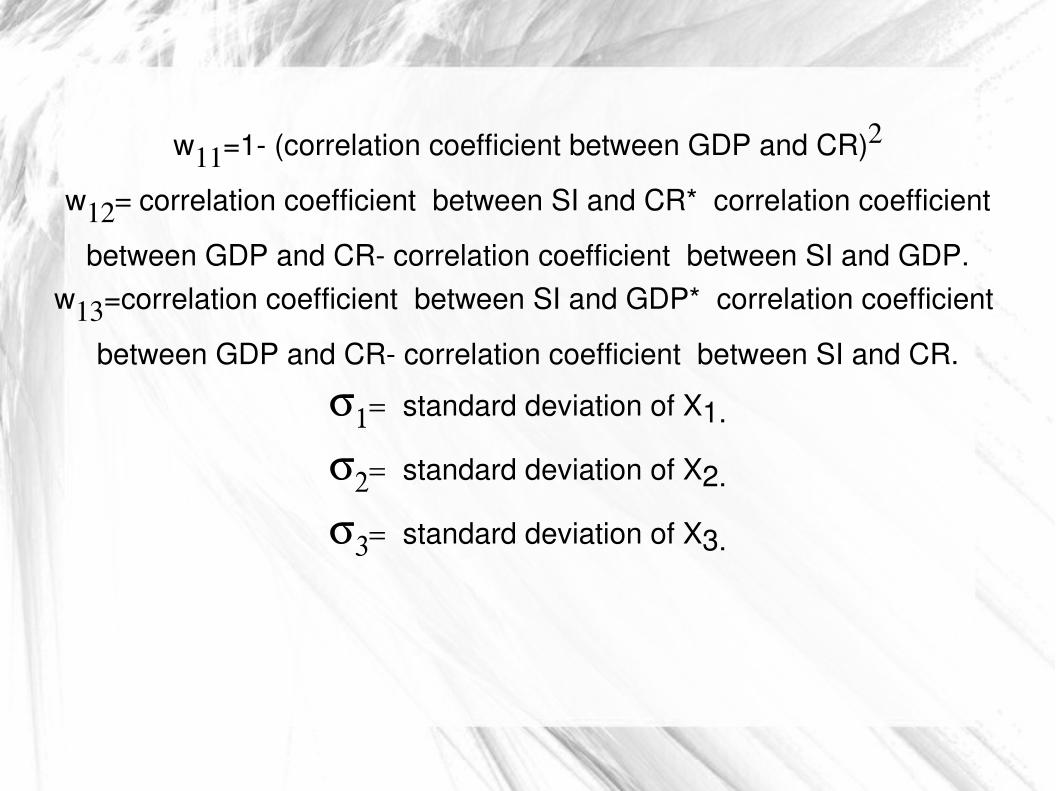
w11=1 (correlation coefficient between GDP and CR)2
w12= correlation coefficient between SI and CR* correlation coefficient
between GDP and CR correlation coefficient between SI and GDP.w13=correlation coefficient between SI and GDP* correlation coefficient
between GDP and CR correlation coefficient between SI and CR. standard deviation of X1.
standard deviation of X2.
standard deviation of X3.

Regression Model● Indian model X1= 26.87932 + 0.00021 X2 0.53932 X3
2003 2004 2005 2006 2007 2008 2009 2010 2011 20120
5
10
15
20
25
Indian Regression Model
SI
year
stoc
k in
dex

USA Regression Model
X1= 7416.76954 +0.73273 X2 + 3.04762 X3
2003 2004 2005 2006 2007 2008 2009 2010 2011 20120
500
1000
1500
2000
2500
3000 USA Regression Model
SI
Year
SI

Singapore Regression Model
X1= 25245.05456 + 53.7862 X2 +11580.8745 X3
2003 2004 2005 2006 2007 2008 2009 2010 2011 20120.00000
2000.00000
4000.00000
6000.00000
8000.00000

Japan Regression ModelX1= 11438.69414 +0.00032 X2 +0.31838 X3
2003 2004 2005 2006 2007 2008 2009 2010 2011 201211615
11620
11625
11630
11635
11640
11645
11650

ConclusionThe Regression model
X1= a + b X2 + c X3
where X1 is SI, X2 is GDP and X3 is Currency Rate
Coming year Stock Index can be predicted using the estimated GDP and estimated fluctuation in currency exchange rate of the
coming year.
The egression modelX1= a + b X2 + c X3
where X1 is SI, X2 is GDP and X3 is Currency Rate

BibliographyText books:Roy E. Bailey , ''The Economics of Financial Markets'',Cambridge University Press,2005
S.C Gupta and V.K. Kapoor , ''Fundamentals of Mathematical Statistics'',Sultan Chand and Sons,1970
Magzines and Newspaper:Business Today
Economic Times

Websites:www.economywatch.com
www.forecastchart.com
www.finance.yahoo.co.in
www.nasdaq.com
www.bseindia.com