Embed Size (px)
Citation preview

Acedemic Track; “Capital Market Implications of XBRL Adoption”,
S. Nurwahyu Harahap,
March 22, 2012
University of Indonesia

1. Studies of XBRL from the accounting discipline is very limited
2. In its comment on SEC’s XBRL Voluntary Filing Program, American Accounting Association (AAA) urged the academic community to conduct studies on this program, including capital market implications of the XBRL voluntary filings (Debreceny et al., 2005).

3. Debreceny and Gray (2001) a. proposed 2 research agendas:
identification of characteristics of the voluntary adopters of XBRL
identification of impact of voluntarily XBRL adoption
b. Suggested employment of theories and research approaches of the voluntary disclosure literature

4. In its release, SEC expresses its belief that financial information in XBRL format enables more efficient and effective retrieval, research, and analysis of financial information. It will lead to more analyst coverage and higher investor interest in registrants’ securities. Overall, these will result in increase liquidity in the market and lower the cost of capital (SEC, 2007). Need empirical support
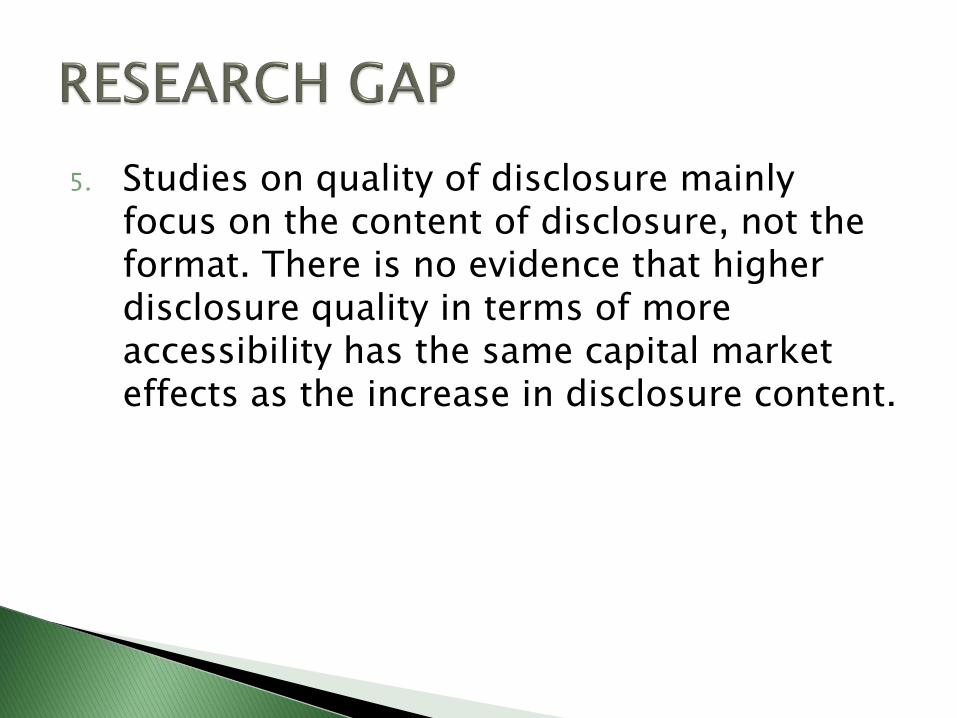
5. Studies on quality of disclosure mainly focus on the content of disclosure, not the format. There is no evidence that higher disclosure quality in terms of more accessibility has the same capital market effects as the increase in disclosure content.

What are the capital market implications of voluntary and mandatory XBRL adoption?
Information asymmetry
Number of Analyst Following
Cost of Capital

XBRL adoption in US
February 3, 2005: SEC established a voluntary program for registrants to file supplemental financial information using XBRL through EDGAR
Up to Dec 31, 2008: 25 firms and investment funds participated in the program.
Dec 18, 2008: SEC mandated XBRL for all filings on a phased-in schedule beginning 2009.

Tan and Shon (2009) : volunteers of SEC’s XBRL Filing Program experienced an increase in analyst following and a decrease in information asymmetry subsequent to their XBRL filing for the first time.
Yoon et al. (2011) : found a significant negative association between XBRL adoption and information asymmetry in Korean Stock Market .
Extension: ◦ impact of XBRL adoption on cost of capital
◦ Impact of mandatory adoption

voluntary disclosure generally associates with reduced information asymmetry, increased following by financial analysts, and reduction in the cost of capital (Healy and Palepu, 2001)
Mandatory disclosure results in (i) more information production by analyst that
leads to reduction in information asymmetry (Bushee et al., 2004; Gintschel and Markov, 2004; Chiyachantana et al., 2004),
(ii) positive abnormal returns for large firms Chhaochharia and Grinstein, 2007; Wu and Zimmerman, 2009).

A g e n c y T h e o r y
XBRL improves the quality of financial information
Less information
asymmetry
Lower information acquisition cost
More analyst following
Lower Cost of Capital
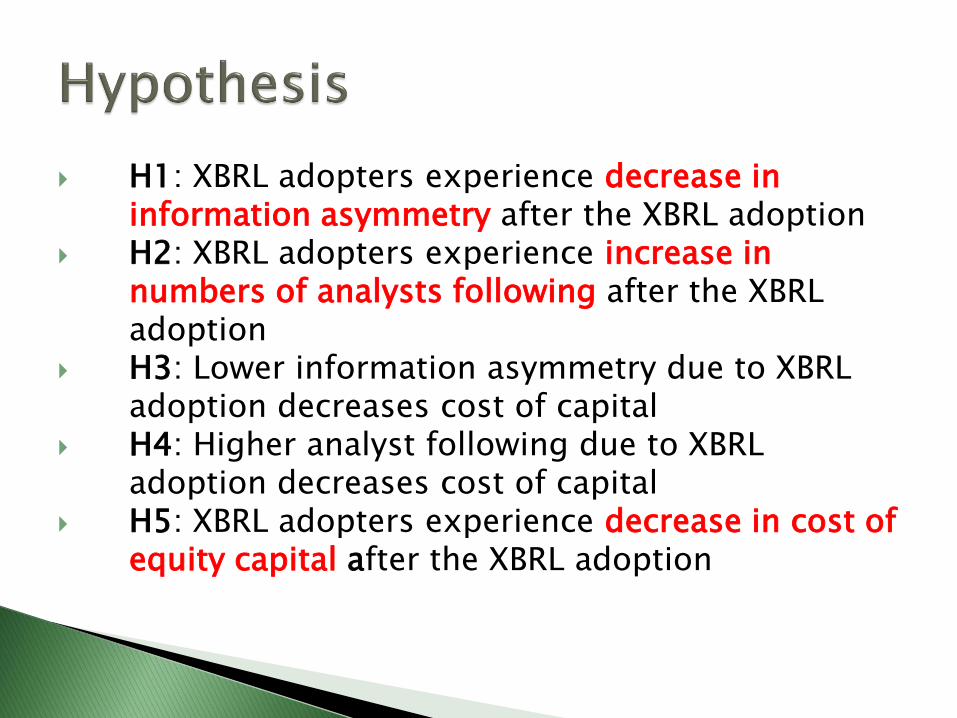
H1: XBRL adopters experience decrease in information asymmetry after the XBRL adoption
H2: XBRL adopters experience increase in numbers of analysts following after the XBRL adoption
H3: Lower information asymmetry due to XBRL adoption decreases cost of capital
H4: Higher analyst following due to XBRL adoption decreases cost of capital
H5: XBRL adopters experience decrease in cost of equity capital after the XBRL adoption

Higher Analysts
Following
Higher Quality of Financial Information
XBRL REPORTING
Lower Information Asymmetry
Lower Cost of Equity
H5
H4 H3
H2 H1

Regression model (H1) , voluntary adoption: ΔASYMMETRYt = β0 + β1 DISC + β2 XBLRt + β3 ΔSIZEt
+ β4 ΔE_VOL t + β5 ΔRE_CORRt + β6 ΔE_ SURPt (1) where, ASYMMETRY= Information asymmetry, measured as:
DISPERSION: standard deviation of inter analyst EPS forecast,
deflated by closing stock price in t-1
ACCURACY: difference between forecast and actual EPS, deflated
by closing stock price deflated by closing stock price in t-1
ΔASYMMETRYt = ASYMMETRYt – ASYMMETRYt-1 as in Botosan and
Harris (2000) that investigate the impact of changes in frequency of
segment dislocure
XBRL = 1 for firms participating in SEC’s voluntary XBRL program, 0
otherwise

Regression model (H1) cont: ΔASYMMETRYt = β0 + β1 DISC + β2 XBLRt + β3 ΔSIZEt
+ β4 ΔE_VOL t + β5 ΔRE_CORRt + β6 ΔE_ SURPt (1)
DISC, SIZE, E_VOL, RE_CORR and E_SURP serve as
control variables as in Lang and Lundholm (1996) where, DISC = S&P ranking, 1 for high-ranked firms, 0 otherwise SIZE = Ln of Total Assets
E_VOL = standard dev of ROE over previous 5 years RE_CORR = correlation between annual stock returns and ROE
over last 5 years E_SURP = absolute value of difference between EPS in year t and
t-1, deflated by closing stock price in t-1

Regression model (H2), voluntary adoption: ΔNAFt = β0 + β1 DISC + β2 XBLRt + β3 CG + β4 ΔSIZEt
+ β5 ΔE_VOL t + β6 ΔRE_CORRt (2) where,
• NAF = number of analysts following the firms • CG = Corporate Governance score
an additional control variable as in Lang et al. (2003) that find analysts are less likely to follow firms with potential incentives to withhold or manipulate information ◦ All other variables are as previously defined

Regression model (H3 and H4), voluntary adoption:
Δ CoEt = β0 + β1 E_ΔASYMMETRYt + β2 E_ΔNAFt
+ β3 DISC + β4 ΔSizet (3)
where, • CoE = Cost of Equity Capital, measured as Beta • E_ΔASYMMETRY = fitted value of ΔASYMMETRY
obtained from eq (1) • E_ΔNAF = fitted value of ΔNAF obtained from eq (2) • DISC and SIZE serve as control variables as in Botosan
(1997).

Regression model (H5), voluntary adoption:
Δ CoEt = β0 + β1 ΔASYMMETRYt + β2 ΔNAFt
+ β3 DISC + β4 XBLRt+ β5 ΔSIZEt (4)
Similar to Model (3) except that XBLR enters the equation as independent variable to test its direct impact to CoE, while ΔASYMMETRY and ΔNAF as control variables

Regression model to (H1-H5), mandatory adoption: ΔASYMMETRYt = β0 + β1 XBLRadopt + β2 ΔSIZEt
+ β3 ΔE_VOLt + β4 ΔRE_CORRt + β5 ΔE_ SURPt (5)
ΔNAFt = β0 + β1 XBLRadopt + β2 ΔSIZEt+ β3 ΔE_VOL t
+ β4 ΔRE_CORRt (6)
ΔCoEt = β0 + β1 ΔASYMMETRYt + β2 ΔNAFt + β3 DISC
+ β4 XBLRadopt + β4 ΔSIZEt (7)
Similar to Model 1-4 except the definition of XBLR variable as all companies in the sample are mandated to adopt XBRL, XBLRadopt = 1 in the year of adoption (2009), 0 for 2007&2008

SEC’s website: to identify participants of XBRL program http://viewerprototype1.com/viewer)
Institutional Shareholder Services (ISS): CG score data, 2003 – 2005 (available at www.robinson.gsu.edu/accountancy/gov_score.html
S&P: Transparency and Disclosure Ranking 2002 (available at http://www2.standardandpoors.com /portal/site/sp/en/ap/page.article/2,1,1,0,1034657119268.html?vregion=ap&vlang=en)
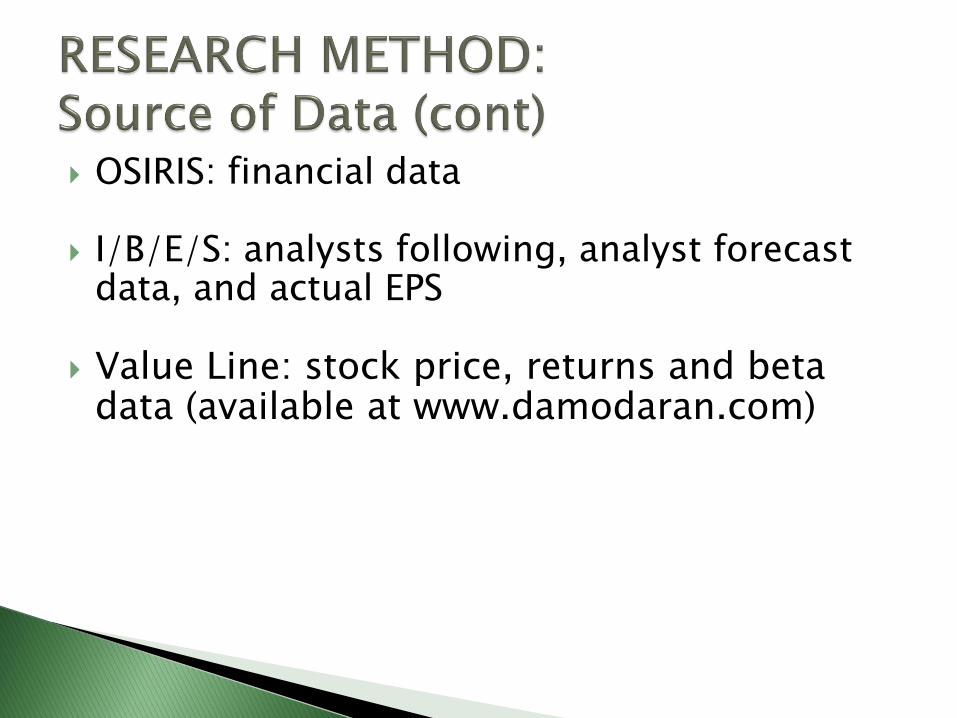
OSIRIS: financial data I/B/E/S: analysts following, analyst forecast
data, and actual EPS Value Line: stock price, returns and beta
data (available at www.damodaran.com)

Total
Data Requirement samples XBRL Non XBRL
S&P original data 460 61 399
Bank and insurance (48) (7) (41)
Delisted (77) - (77)
No CG data (42) (5) (37)
No analyst data (11) - (11)
No beta data (8) - (8)
Incomplete financial data (20) (2) (18)
Usable sample firms 254 47 207
Firm years (2005-2008): voluntary model 1016 188 828
Firm years (2007-2009): mandatory model 762 141 621
Sub Sample

Impacts on Information Asymmetry: Correlation Analysis
Variables ΔDISPt ΔACCt DISC XBRL ΔSIZEt ΔE_VOLt ΔRE_CORRt ΔSURPt
ΔDISPt 1 .610** -.046 .042 -.168** .231** .178** .004
ΔACCt 1 -.029 .042 -.161** .192** .218** .006
DISC 1 .050 -.020 -.036 -.043 -.057*
XBRL 1 -.009 -.029 .105** .015
ΔSIZEt 1 -.196** -.121** .016
ΔE_VOLt 1 .063* .007
ΔRE_CORRt 1 .003
ΔSURPt 1
*** significant at the 0.01 level (1-tailed).
** significant at the 0.05 level (1-tailed).

Variables Predicted
Sign Coeficient t-value
DISC - -0.000801 ** -1.2977
XBLR t - 0.001203 1.0199
ΔSIZE t - -0.007607 *** -2.3194
ΔE_VOL t + 0.353580 *** 2.8218
ΔRE CORR t - 0.067819 *** 3.0615
ΔSURP t + 0.000668 0.1054
Constant 0.002197 ** 1.9630
R2 0.0942
Adj. R2 0.0888
F 17.4804 ***
Durbin-Watson 2.1837 *** significant at the 0.01 level (1-tailed).
** significant at the 0.05 level (1-tailed).
* significant at the 0.10 level (1-tailed).
Model (1) : ΔDISPt = β0 + β1 DISC + β2 XBLR t + β3 ΔSIZE t + β4
ΔE_VOL t + β5 ΔRE CORR t + β6 Δ SURP t
Impacts on Information Asymmetry : regression analysis

XBRL does not have significant correlation with both measures of information asymmetry: ΔDISP and ΔACC
XBRL does not significant relationship to ΔDISP
Additional test using Δ ACC arrives in consistent result (H1 is not supported)
Contrary to Tan and Shon (2009) that used bid-ask spread as measure of information asymmetry
Impacts of voluntary adoption on Information Asymmetry : discussion

possible explanations: ◦ XBRL filings contain multiple errors (Bartley et al.,
2009)
◦ users, analysts in particular, are not aware of XBRL’s potential to improve the quality of financial information (CFA Institute, 2008)
◦ measures based on analysts forecast misstate the degree of information asymmetry (Clarke and Shastri, 2000)
Impacts of voluntary adoption on
Information Asymmetry : discussion
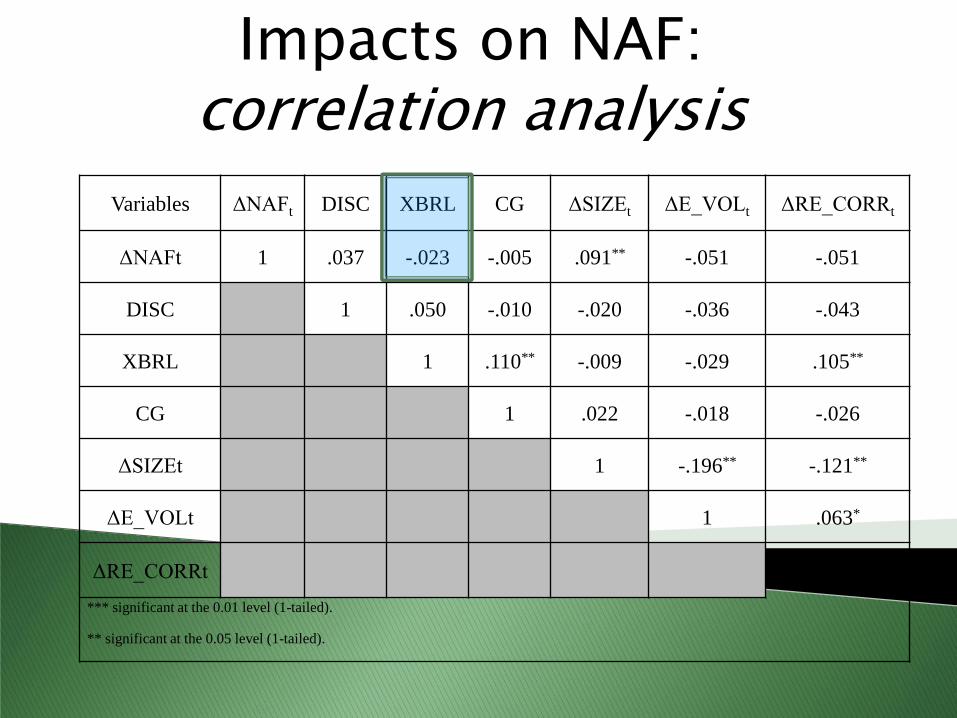
Variables ΔNAFt DISC XBRL CG ΔSIZEt ΔE_VOLt ΔRE_CORRt
ΔNAFt 1 .037 -.023 -.005 .091** -.051 -.051
DISC 1 .050 -.010 -.020 -.036 -.043
XBRL 1 .110** -.009 -.029 .105**
CG 1 .022 -.018 -.026
ΔSIZEt 1 -.196** -.121**
ΔE_VOLt 1 .063*
ΔRE_CORRt 1
*** significant at the 0.01 level (1-tailed).
** significant at the 0.05 level (1-tailed).
Impacts on NAF: correlation analysis

Variables Predicted
Sign Coeficient t-value
DISC + 0.2280 ** 1.7205
XBRL + -0.2162 -0.5620
CG + -0.0040 -0.2000
ΔSIZE t + 1.5475 *** 2.6654
ΔE_VOL t - -15.6655 -0.8849
ΔRE_CORR t + -4.4807 -0.9962
Constant -0.2839 -0.4308
R2 0.0127
Adj. R2 0.0069
F 2.1685 **
Durbin-Watson 2.3828 *** significant at the 0.01 level (1-tailed).
** significant at the 0.05 level (1-tailed).
* significant at the 0.10 level (1-tailed).
Model (2) : ΔNAFt = β0 + β1 DISC + β2 XBLR + β3 CG + β4ΔSIZE t
+ β5 ΔE_VOL t + β6 ΔRE_CORR t
Impacts on NAF : regression analysis

DISC : quality of disclosure is a factor that attract analyst attention (Lang & Lundholm, 1996; Francis et al., 1998; Healy et al., 1999)
further increase in quality of disclosure by providing financial info in XBRL format does not increase NAF
analysts have not used XBRL to support their analyses, therefore they do no put special interest to firms adopting XBRL
Contrary to Tan and Shon (2009) that use absolute NAF as dependent variable instead of change
Impactsof Voluntary Adoption on NAF: discussion
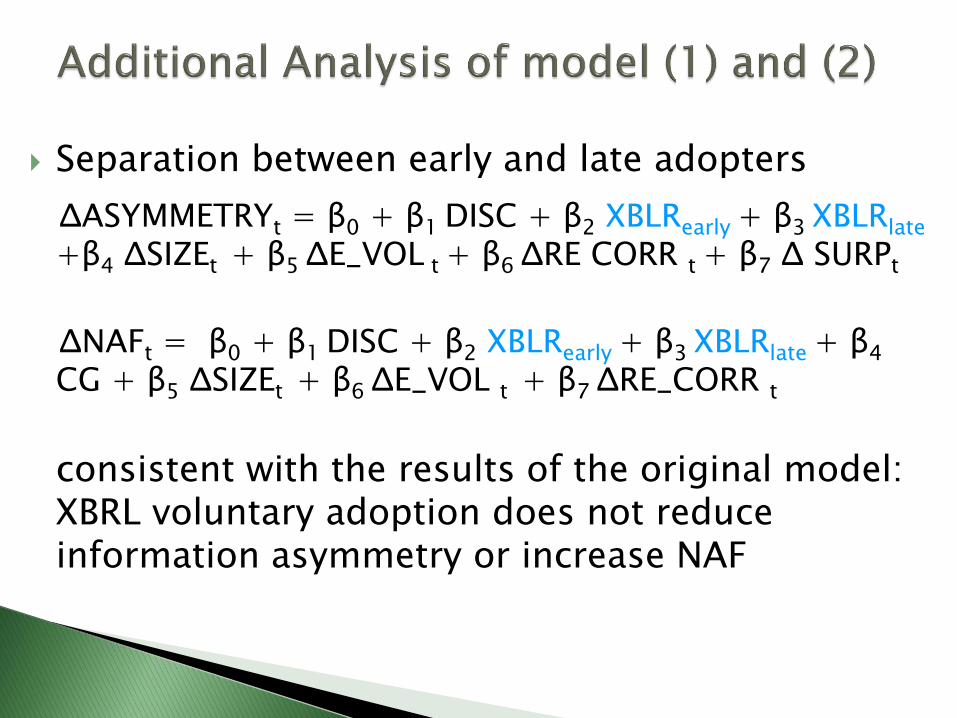
Separation between early and late adopters
ΔASYMMETRYt = β0 + β1 DISC + β2 XBLRearly + β3 XBLRlate
+β4 ΔSIZEt + β5 ΔE_VOL t + β6 ΔRE CORR t + β7 Δ SURPt
ΔNAFt = β0 + β1 DISC + β2 XBLRearly + β3 XBLRlate + β4 CG + β5 ΔSIZEt + β6 ΔE_VOL t + β7 ΔRE_CORR t
consistent with the results of the original model: XBRL voluntary adoption does not reduce information asymmetry or increase NAF

Impact in adoption year only
ΔASYMMETRYt = β0 + β1 DISC + β2 XBLRyear + β3 ΔSIZE
t + β4 ΔE_VOLt + β5 ΔRE CORR t + β6 Δ SURP t
ΔNAFt = β0 + β1 DISC + β2 XBLRyear + β3 CG + β4 ΔSIZE t + β5ΔE_VOL t + β6 ΔRE_CORR t
consistent with the results of the original model (2) and (3): XBRL voluntary adoption does not reduce information asymmetry or increase NAF

Addition of moderating variables
ΔASYMMETRYt = β0 + β1 DISC + β2 XBLR t + β3 ΔSIZEt
+ β4 ΔE_VOLt + β5 ΔRE CORR t + β6 Δ SURP t + β6 Δ SURP t + β7 ASYMMETRYt + β8 XBRL t *ASYMMETRYt
ΔNAFt = β0 + β1 DISC + β2 XBLRt + β3 CG + β4 ΔSIZE
t + β5ΔE_VOL t + β6 ΔRE_CORR t + β7 NAFt + β8
XBRLt*NAFt (2a)
results: XBRL voluntary adoption does not reduce information asymmetry

Variables
Predicted
Sign Coeficient t-value
DISC + 0.24531 ** 1.9894
XBRL + 0.97821 1.1426
CG + -0.00465 -0.2592
ΔSIZE t + 1.45827 *** 2.1845
ΔE_VOL t - -16.94197 -0.9843
ΔRE_CORR t + -4.45746 -0.9803
NAFt - 0.01666 0.4512
XBRLt*NAFt - -0.05485 * -1.4373
Constant -0.59854 -0.7863
R2 0.0127
Adj. R2 0.0069
F 2.1685 ** Durbin-Watson 2.3828 *** significant at the 0.01 level (1-tailed).
** significant at the 0.05 level (1-tailed).
* significant at the 0.10 level (1-tailed).
Model (2a)
impact of XBRL adoption on ΔNAF is moderated by the level of NAF. Adopters with relatively high NAF experience smaller NAF increase, implying that the impact of XBRL adoption to NAF applies only to adopters with relatively low NAF.

Variables ΔCOEt ΔDISPt ΔACCt ΔNAFt DISC XBRL ΔSIZEt
ΔCOEt 1 -.003 .014 .036 .030 -.075** -.031
ΔDISPt 1 .610** -.059* -.046 .042 -.168**
ΔACCt 1 -.016 -.029 .042 -.161**
ΔNAFt 1 .037 -.023 .091**
DISC 1 .050 -.020
XBRL 1 -0.009
ΔSIZEt 1
*** significant at the 0.01 level (1-tailed).
** significant at the 0.05 level (1-tailed).
Impacts on Cost of Equity Capital: correlation analysis

Variables Predicted
Sign Coeficient t-value
ΔDISPt + -0.0286 -0.0417
ΔNAFt - 0.0018 *
1.3117
DISC - 0.0098 *
1.4560
XBRLt - -0.0390 ***
-2.4377
ΔSIZEt - -0.0335 -1.0173
Constant -0.0229 *
-1.4459
R2 0.0090
Adj. R2 0.0041
F 1.8418 *
Durbin-Watson 2.1159
*** significant at the 0.01 level (1-tailed).
** significant at the 0.05 level (1-tailed).
* significant at the 0.10 level (1-tailed).
Model (4) : ΔCOE t = β0 + β1 ΔASYMMETRYt + β2 ΔNAF t + β3 DISC
+ β4 XBLR t + β5 Δ SIZE t
Impacts on Cost of Equity Capital: Regression Analysis

Voluntary participation may be perceived as firms’ willingness to improve the quality of disclosure so that inventors’ confidence on these firms increase. Investors may reduce their risk premiums on the stock, thus lowering the firms’ cost of capital (Li & Pinsker, 2005).

SUMMARY OF REGRESSION ANALYSIS
Hypothe-ses
Impact Expected sign Voluntary Mandatory
H12 Information Asymmetry - X Ѵ
H13 Number of Analysts Following + X Ѵ* Ѵ
H16 Cost of Equity - Ѵ X*
Ѵ = Accepted , X = Rejected, Ѵ* = applies to adopters with previous low NAF, X* = significant, sign +

When XBRL becomes mandatory, it associates to lower information asymmetry and higher NAF, implying that analysts postpone using XBRL until it is mandatory, when more firms file their financial information in XBRL format.
Contrary to voluntary adoption that associates to lower CoE, mandatory adoption associates to higher CoE, which may represent markets’ perception on the higher risk of XBRL mandatory adoption.

Impacts of XBRL voluntary adoption ◦ No support for hypotheses that XBRL adoption
results in lower information asymmetry and higher number of analyst following.
◦ Increase in NAF applies only to firms with previous low NAF
◦ support for direct impact on reduction of cost of capital.
Impacts of XBRL mandatory adoption ◦ mandatory adoption associates to reduction of
information asymmetry, increased analysts following, and increased cost of capital.
Academic
contributes to limited number of XBRL research, particularly in accounting discipline
providing evidences on the impacts of XBRL adoption
integrates previous studies on disclosure and studies in the use of technology for financial reporting.

Regulator
promote the fact that voluntary adopters enjoy decrease in cost of capital.
offer incentives for voluntary adoptions. As many firms participate in voluntary program, XBRL adoption impact on analysts following takes place.

Regulator
Once XBRL becomes mandatory, cost of capital increase, implying market’s perception that XBRL adoption associates to higher risk.
regulators may start with voluntary program and conduct careful evaluation before mandating XBRL adoption. XBRL adoption in two phases may minimize the negative impact such as higher info asymmetry.

Due to constraint in data availability, measurement of CG and DISC variables is based on out dated data, with the assumption that these data remain constant until 2008.
Constraint in availability of longitudinal data
does not differentiate the extent of disclosure prepared in XBRL format. Extent of XBRL adoption may have different impact

Thank You [email protected]


![2008-10-14 ita slides master.ppt [互換モード] - XBRL …archive.xbrl.org/18th/sites/18thconference.xbrl.org/... · · 2008-12-05Interoperable Taxonomy Architecture A joint](https://img.dokumen.tips/doc/110x75/5ac042187f8b9add5f8ebccc/2008-10-14-ita-slides-xbrl-archivexbrlorg18thsites18thconferencexbrlorg2008-12-05interoperable.jpg)


