Embed Size (px)
Citation preview
REVIEW PAPER
Accurately measuring willingness to pay for consumer goods:a meta-analysis of the hypothetical bias
Jonas Schmidt1 & Tammo H. A. Bijmolt2
Received: 30 August 2018 /Accepted: 21 May 2019# The Author(s) 2019
AbstractConsumers’willingness to pay (WTP) is highly relevant to managers and academics, and the various direct and indirect methodsused to measure it vary in their accuracy, defined as how closely the hypothetically measuredWTP (HWTP) matches consumers’real WTP (RWTP). The difference between HWTP and RWTP is the Bhypothetical bias.^ A prevalent assumption in marketingscience is that indirect methods measure WTP more accurately than do direct methods. With a meta-analysis of 77 studiesreported in 47 papers and resulting in 115 effect sizes, we test that assumption by assessing the hypothetical bias. The total sampleconsists of 24,347 included observations for HWTP and 20,656 for RWTP. Moving beyond extant meta-analyses in marketing,we introduce an effect size metric (i.e., response ratio) and a novel analysis method (i.e., multivariate mixed linear model) toanalyze the stochastically dependent effect sizes. Our findings are relevant for academic researchers and managers. First, onaverage, the hypothetical bias is 21%, and this study provides a reference point for the expected magnitude of the hypotheticalbias. Second, the deviation primarily depends on the use of a direct or indirect method for measuring HWTP. In contrast withconventional wisdom, indirect methods actually overestimate RWTP significantly stronger than direct methods. Third, thehypothetical bias is greater for higher valued products, specialty goods (cf. other product types), and within-subject designs(cf. between-subject designs), thus a stronger downward adjustment of HWTP values is necessary to reflect consumers’ RWTP.
Keywords Willingness to pay . Reservation price . Pricing . Conjoint analysis . Measurement accuracy . Hypothetical bias .
Meta-analysis . Response ratio . Stochastically dependent effect sizes
Introduction
In a state-of-practice study of consumer value assessments,Anderson et al. (1992, p. 3) point out that consumers’
willingness to pay (WTP) is Bthe cornerstone of marketingstrategy^ that drives important marketing decisions. First, con-sumers’WTP is the central input for price response models thatinform optimal pricing and promotion decisions. Second, a newproduct’s introductory price must be carefully chosen, because apoorly considered introductory price can jeopardize the invest-ments in its development and threaten innovation failures(Ingenbleek et al. 2013). Not only do companies need to knowwhat consumers are willing to pay early in their product devel-opment process, but WTP is also of interest to researchers inmarketing and economicswho seek to quantify concepts such asa product’s value (Steiner et al. 2016). Obtaining accurate mea-sures of consumers’WTP thus is essential.
Existing methods for measuring WTP can be assigned to a2 × 2 classification (Miller et al. 2011), according to whetherthey measure WTP in a hypothetical or real context, withdirect or indirect measurement methods (see Table 1). First,a hypothetical measure ofWTP (HWTP) does not impose anyfinancial consequences for participants’ decisions.Participants just state what they would pay for a product, if
Mark Houston and John Hulland served as Special Issue Editors for thisarticle.
Electronic supplementary material The online version of this article(https://doi.org/10.1007/s11747-019-00666-6) contains supplementarymaterial, which is available to authorized users.
* Jonas [email protected]
Tammo H. A. [email protected]
1 Marketing Center Muenster, University of Muenster, AmStadtgraben 13-15, 48143 Muenster, Germany
2 Department of Marketing, Faculty of Economics and Business,University of Groningen, Nettelbosje 2, 9747 AEGroningen, The Netherlands
https://doi.org/10.1007/s11747-019-00666-6
Published online: 7 June 2019/
Journal of the Academy of Marketing Science (2020) 48:499–518

given the opportunity to buy it. In contrast, participants maybe required to pay their stated WTP in a real context, whichprovides a real measure of WTP (RWTP). This could for ex-ample be in the context of an auction, where the winner in theend actually has to buy the product. The difference betweenRWTP and HWTP is induced by the hypothetical context andis called Bhypothetical bias.^ This hypothetical bias provides ameasure of the hypothetical method’s accuracy (Harrison andRutström 2008). In case HWTP is measured with two differ-ent methods, the one with the lower hypothetical bias gives amore accurate estimate of participants’ RWTP, increasing theestimate’s validity. We conceptualize the hypothetical bias asthe ratio of HWTP to RWTP. Amethod yielding an exemplaryhypothetical bias of 1.5 shows that those participants overstatetheir RWTP for a product by 50% when asked hypothetically.Second, direct methods ask consumers directly for their WTP,whereas indirect methods require consumers to evaluate, com-pare, and choose among different product alternatives, and theprice attribute is just one of several characteristics. Then,WTPcan be derived from their responses.
Many researchers assume thatdirectmethodscreate a strongerhypotheticalbias,because theyevokegreaterpriceconsciousness(Völckner 2006). In their pricing textbook, Nagle and Müller(2018) allege that direct questioning Bshould never be acceptedas a valid methodology. The results of such studies are at bestuseless and are potentially highly misleading^ (p. 186). Simon(2018) takes a similar line, stating, BIt doesn’t make sense to askconsumers directly for the utility or theirWTP, as they aren’t ableto give a direct and precise estimate. The most importantmethod to quantify utilities and WTP is the conjointanalysis^ (p. 53). Because indirect methods represent ashopping experience, they are expected to be more ac-curate for measuring HWTP (Breidert et al. 2006; Leighet al. 1984; Völckner 2006). Still, practitioners largelycontinue to rely on direct survey methods, which tend to beeasier to implement (Anderson et al. 1992; Hofstetter et al.2013; Steiner and Hendus 2012).
Various studies specify the accuracy of one or more director indirect methods by comparing HWTP with RWTP. Yet no
clear summary of these findings is available,1 and consideringthe discrepancy between theory and practice, Bthere is a lackof consensus on the ‘right’ way to measure […] consumer’sreservation price^ (Wang et al. 2007, p. 200). Therefore, withthis study we seek to shed new light on the relative accuracy ofalternative methods for measuring consumers’WTP, and par-ticularly the accuracy of direct versus indirect methods. Weperform a meta-analysis of existing studies that measureHWTP and RWTP for the same product or service, whichreveals some empirical generalizations regarding accuracy.We also acknowledge the potential influence of other factorson the accuracy of WTP measures (Hofstetter et al. 2013;Sichtmann et al. 2011), such that we anticipate substantialheterogeneity across extant studies. With a meta-regression,we accordingly identify moderators that might explain thisheterogeneity in WTP accuracy (Thompson and Sharp 1999;van Houwelingen et al. 2002). Our multivariate mixed linearmodel enables us to analyze the stochastically dependent ef-fect sizes (ESs) explicitly (Gleser and Olkin 2009; Kalaianand Raudenbush 1996), which provides the most accurateway to deal with dependent ESs (van den Noortgate et al.2013). As an effect size (ES) measure, we use the responseratio of HWTP and RWTP (Hedges et al. 1999), such that weobtain the relative deviation of HWTP. To the best of ourknowledge, no previous meta-analysis in marketing has ap-plied a mixed linear model nor a response ratio to measureESs.
On average, the hypothetical bias is about 21%. In addition,direct methods outperform indirect methods with regard totheir accuracy. The meta-regression shows that, comparedwith direct measurement methods, the hypothetical bias isconsiderably higher in indirect measures, by 10 percentage
Table 1 Classification ofmethods for measuring WTP Type of measurement
Context Direct Indirect
Hypothetical • Open questioning
• Closed-ended • Conjoint analysis
• Choice bracketing procedure
Real • Vickrey auction
• BDM lottery
• Random nth price auction • Incentive-aligned conjoint analysis
• English auction
• eBay
1 Three meta-analyses dealing with the hypothetical bias exist (Carson et al.1996; List and Gallet 2001; Murphy et al. 2005). However, they focus onpublic goods and their results are of limited use for marketing. In contrast tothe existing meta-analyses, we focus on private goods and include severalprivate good specific moderators of high interest for marketers. For a moredetailed discussion of the three existing meta-analyses, please refer to WebAppendix A.
J. of the Acad. Mark. Sci. (2020) 48:499–518500
points in a full model. This finding contradicts the prevailingwisdom in academic studies but supports current prac-tices in companies. In addition to the type of measure-ment, value of the product, product type, and type ofsubject design have a significant influence on the hypo-thetical bias.
In the next section, we prove an overview of WTPand its different measurement options. After detailingthe data collection and coding, we explicate our pro-posed ES measure, which informs the analysis approachwe take to deal with stochastically dependent ESs. Wepresent the results and affirm their robustness with multiplemethods. Finally, we conclude by highlighting our theoreticalcontributions, explaining the main managerial implications,and outlining some limitations and directions for furtherresearch.
Willingness to pay
Definition and classification
We take a standard economic view of WTP (or reservationprice) and define it as the maximum price a consumer is will-ing to pay for a given quantity of a product or a service(Wertenbroch and Skiera 2002). At that price, the con-sumer is indifferent to buying or not buying, becauseWTP reflects the product’s inherent value in monetaryterms. That is, the product and the money have thesame value, so spending to obtain a product is the same askeeping the money.
Hypothetical versus real WTP
The first dimension in Table 1 distinguishes between hypo-thetical and real contexts, according to whether the measureincludes a payment obligation or not. Most measures ofRWTP rely on incentive-compatible methods, which ensureit is the participant’s best option to reveal his or her true WTP.Several different incentive-compatible methods are available(Noussair et al. 2004) and have been used in prior empiricalstudies to measure RWTP. However, all methods that measureRWTP require a finished, sellable version of the product.Therefore, practitioners regularly turn to HWTP during theproduct development process, before the final product actuallyexists. In addition, measuring RWTP can be difficult and ex-pensive, for both practitioners and researchers. Therefore, theaccuracy of HWTP methods is of interest to practitioners andacademics alike. Because RWTP reflects consumers’ actualvaluation of a product, it provides a clear benchmark for com-parison with HWTP. We integrate existing empirical evidenceabout the accuracy of various direct and indirect methods tomeasure HWTP.
Direct methods to measure WTP
Direct measures usually include open questions, such as,BWhat is the maximum you would pay for this product?^Other methods use closed question formats (Völckner 2006)and require participants to state whether they would acceptcertain prices or not. Still others combine closed and openquestions. The choice bracketing procedure starts with severalclosed questions, each of which depends on the previous an-swer. If consumers do not accept the last price of the lastclosed question, they must answer an open question abouthow much they would be willing to pay (Wertenbroch andSkiera 2002).
In particular, the most widely used direct measures ofRWTP are the Vickrey auction (Vickrey 1961) and theBecker-DeGroot-Marschak lottery (BDM) (Becker et al.1964). In a Vickrey auction, every participant hands in onesealed bid. The highest bidder wins the auction but pays onlythe price of the second highest bid; accordingly, these auctionsalso are called second-price sealed bid auctions. Bydisentangling the bid and the potential price, no bidding strat-egy is superior to bidding actual WTP. Different adaptions ofthese Vickrey auctions are available, such as the random nthprice auction (Shogren et al. 2001), in which participants donot know the quantity being sold in the auction upfront. Incontrast, a BDM lottery does not require participants to com-pete for the product. Instead, participants first state their WTP,and then a price is drawn randomly. If her or his statedWTP isequal to or more than the drawn price, a participant must buythe product for the drawn price. If the stated WTP is less thanthe drawn price, she or he may not buy the product. Similar tothe Vickrey auction, the stated WTP does not influence thedrawn price and therefore does not determine the final price.Again then, the dominant strategy is to state actual WTP.
Not all direct measures of RWTP are theoretically incentivecompatible. For example, in an English auction, the price in-creases until only one interested buyer is left, who eventuallybuys the product for the highest announced bid. Every bidderhas an incentive to bid up WTP (Rutström 1998), so anEnglish auction reveals all bidders’ WTP, except for the win-ner’s, who stops bidding after the last competitor leaves.Therefore, the English auction is not theoretically incentivecompatible, yet the mean RWTP obtained tend to be similarto those resulting from incentive-compatible methods (Kagelet al. 1987). Therefore, we treat studies using an English auc-tion as direct measures of RWTP.
Finally, the online auction platform eBay can providea direct measure of RWTP. Unlike a Vickrey auction,the auction format implemented in eBay allows partici-pants to bid multiple times, and the auction has a fixedendpoint. Although multiple bids from one participantimply that not every bid reveals true WTP, the highest andlatest bid does provide this information (Ockenfels and Roth
J. of the Acad. Mark. Sci. (2020) 48:499–518 501

2006). Theoretically then, eBay auctions are not incentivecompatible either (Barrot et al. 2010), but the empirical resultsfrom eBay and Vickrey auctions are highly comparable(Ariely et al. 2005; Bolton and Ockenfels 2014). Schlag(2008) gauges RWTP from eBay by exclusively using thehighest bid from each participant but disregarding the win-ners’ bid. We include this study in our meta-analysis as anexample of a direct method.
Indirect methods to measure WTP
Among the variety of indirect methods to compute WTP(Lusk and Schroeder 2004), the most prominent is choice-based conjoint (CBC) analysis. Each participant chooses sev-eral times among multiple alternative products, including aBno choice^ option that indicates the participant does not likeany of the offered products. Each product features severalproduct attributes, and each attribute offers various levels.To measure WTP, price must be one of the attributes. Fromthe collected choices, it is possible to compute individual util-ities for each presented attribute level and, by interpolation,each intermediate value. Ultimately, WTP can be derived ac-cording to the following relationship (Kohli and Mahajan1991), which is the most often used approach in the studiesincluded in the meta-analysis:
uitj−p þ ui pð Þ≥u*i ;
where uit∣ − p is the utility of product t excluding the utility ofthe price, and ui(p) is the utility for a price level p forconsumer i. In accordance with Miller et al. (2011) andJedidi and Zhang (2002), we define u*i as the utility ofthe Bno choice^ option. The resulting WTP indicates thehighest price p that still fulfills the relationship. In theirweb appendix, Miller et al. (2011) provide a numericalexample.
In principle, indirect methods provide measures of HWTP,because the choices and other judgments expressed by theparticipants do not have any financial consequences. Effortsto measure RWTP indirectly attempt to insert a downstreammechanism that introduces a binding element (Wlömert andEggers 2016). For example, Ding et al. (2005) propose torandomly choose one of the selected alternatives and makethat choice binding. Every choice could be the binding one,so participants have an incentive to reveal their truepreferences throughout the task. Ding (2007) also incorporatesthe idea of the BDM lottery, proposing that participants couldtake part in a conjoint task, from which it is possible to infertheir WTP for one specific product, according to theperson’s choices in the conjoint task. The inferredWTP then enters the BDM lottery subsequently, so par-ticipants have an incentive to reveal their true preferences inthe conjoint task.
Hypotheses
We predict that several moderators may affect the hypotheticalbias. In addition, we control for several variables. Thepotential moderators constitute four main categories: (1)methods for measuring WTP, (2) research stimulus, (3)general research design of the study, and (4) the publi-cation in which the study appeared. The last category onlycontains control variables.
Moderators: HWTP measurement
Direct methods for measuring HWTP have some theoreticaldrawbacks compared to indirect methods. First, asking con-sumers directly for their HWTP tends to prime them to focuson the price (Breidert et al. 2006), which is unlike a naturalshopping experience in which consumers choose among sev-eral products that vary on multiple attributes. That is, directmethods may cause atypically high price consciousness(Völckner 2006). Indirect methods address this drawback byforcing participants to weigh the costs and benefits of differentalternatives. Second, when asked directly, consumers mighttry to answer strategically if they suspect their answers mightinfluence future retail prices (Jedidi and Jagpal 2009).Because indirect methods do not prompt participants to statetheir HWTP directly, strategic answering may be less likely.Third, direct statements of HWTP are cognitively challenging,whereas methods that mimic realistic shopping experiencesrequire less cognitive effort (Brown et al. 1996).
Indirect methods for measuring HWTP also have somedrawbacks that might influence the hypothetical bias. First,researchers using a CBC must take care to avoid a number-of-levels effect, especially in pricing studies (Eggers andSattler 2009). To do so, they generally can test only a fewdifferent prices, which might decrease accuracy if the limita-tion excludes the HWTP of people with higher (lower)WTP than the highest (lowest) price shown. Second,indirect methods assume a linear relationship betweenprice levels, through their use of linear interpolation(Jedidi and Zhang 2002).
Overall then, measuring HWTP with direct or indirectmethods could evoke the hypothetical bias, and extantevidence is mixed (e.g. Miller et al. 2011), featuringarguments for the superiority of both method types.Therefore, we formulate two competing hypotheses.
H1a:Measuring HWTP with an indirect method leads toa smaller hypothetical bias compared to directmethods.
H1b: Measuring HWTP with a direct method leads to asmaller hypothetical bias compared to indirectmethods.
J. of the Acad. Mark. Sci. (2020) 48:499–518502

Moderators: research stimulus
When asked for their HWTP, personal budget constraints donot exert an effect, because the consumer does not actuallyhave to pay any money. However, when measuring RWTP,budget constraints limit the amount that participants may con-tribute (Brown et al. 2003). For low-priced products, this con-straint should have little influence on the hypothetical bias,because the RWTP likely falls within this budget. For high-priced products though, budget constraints likely becomemore relevant; participants might state HWTP estimates thatthey could not afford in reality, thereby increasing the hypo-thetical bias. Thus, we hypothesize:
H2: The hypothetical bias is greater for products with a highervalue.
A classic categorization of consumer goods cites conve-nience, shopping, and specialty goods, depending on theamount of search and price comparison effort they require(Copeland 1923). Consumers engage in more search effortwhen they have trouble assessing a product’s utility.Hofstetter et al. (2013) in turn show that the hypothetical biasdecreases as people gain means to assess a product’s utility,and in a parallel finding, Sichtmann et al. (2011) show thathigher product involvement reduces the hypothetical bias.That is, higher product involvement likely reduces the needfor intensive search effort. Therefore, we hypothesize:
H3: The hypothetical bias is least for convenience goods,greater for shopping goods, and greatest for specialtygoods.
Consumers face uncertainty about an innovative prod-uct’s performance and their preferences for it (Hoeffler2003). According to Sichtmann et al. (2011), strongerconsumer preferences lower the hypothetical bias. Incontrast, greater uncertainty reduces their ability to as-sess a product’s utility, which increases the hypotheticalbias (Hofstetter et al. 2013). Finally, Hofstetter et al.(2013) show that the perceived innovativeness of aproduct increases the hypothetical bias. Consequently,
H4: The hypothetical bias is greater for innovations comparedto established products.
Moderators: research design
The research design also might influence the hypothetical bias(List and Gallet 2001; Murphy et al. 2005). In particular, thesubject design of an experiment determines the results, in thesense that between-subject designs tend to be more conserva-tive (Charness et al. 2012), whereas within-subject designs
tend to result in stronger effects (Ariely et al. 2006). Fox andTversky (1995) identify stronger effects for a within-subjectversus between-subject design in the context of ambiguityaversion; Ariely et al. (2006) similarly find such stronger ef-fects for a within-subject design for a study comparing WTPand willingness to accept. According to Frederick andFischhoff (1998), participants in a within-subject design ex-press greater WTP differences for small versus largequantities of a product than do those in a between-subject design. Therefore,
H5: The hypothetical bias is greater for within-subject designscompared with between-subject designs.
Another source of uncertainty pertains to product perfor-mance, and it increases when the consumer can only reviewimages (e.g., online) rather than inspect the product itselfphysically (Dimoka et al. 2012). Consequently, many con-sumers test products in a store to reduce their uncertaintybefore buying them online (showrooming) (Gensler et al.2017). Similarly, consumers’ uncertainty might be reducedin a WTP experiment by giving them an opportunity toinspect and test the product before bidding. Bushong et al.(2010) show that participants state a higher RWTP when realproducts, rather than images, have been displayed. AsHofstetter et al. (2013) note, greater uncertainty increases thehypothetical bias. We hypothesize:
H6:Giving participants the opportunity to test a product beforebidding reduces the hypothetical bias.
Finally, researchers often motivate participation in anexperiment by paying some remuneration or providingan initial balance to bid in an auction. Equipping par-ticipants with money might change their RWTP, becausethey gain an additional budget. They even might con-sider this additional budget like a coupon, which theyadd to their original RWTP. Consumers in general over-state their WTP in hypothetical contexts, so providing aparticipation fee could decrease the hypothetical bias.Yet Hensher (2010) criticizes the use of participationfees, noting that they can bias participants’ RWTP.
H7: Providing participants (a) a participation fee or (b) aninitial balance decreases the hypothetical bias.
Collection and coding of studies
Collection of studies
With our meta-analysis, we aim to generalize empirical find-ings about the relative accuracy of HWTP measures, so we
J. of the Acad. Mark. Sci. (2020) 48:499–518 503

conducted a search for studies that report ESs of these mea-sures. We used three inclusion criteria. First, the study had tomeasure consumers’ HWTP and RWTP for the same productor service, so that we could determine the hypothetical bias.Second, the research stimulus had to be private goods or ser-vices. Third, we included only studies that reported the meanand standard deviation (or values that allow us to compute it)of HWTP and RWTP or for which the authors provided thesevalues at our request.
To identify relevant studies, we applied a keyword searchin different established online databases (e.g., Science Direct,EBSCO) and Google Scholar across all research disciplinesand years. The keywords included Bwillingness-to-pay,^Breservation price,^ Bhypothetical bias,^ and Bconjointanalysis.^We also conducted a manual search among leadingmarketing and economics journals. To reduce the risk of apublication bias, we extended our search to the SocialScience Research Network, Research Papers in Economics,and the Researchgate network, and we checked for relevantdissertations whose results had not been published in journals.Moreover, we conducted a cross-reference search to find otherstudies. We contacted authors of studies that did not report allrelevant values and asked them for any further relevant studiesthey might have conducted. Ultimately, we identified 77 stud-ies reported in 47 articles, accounting for 117 ESs and totalsample sizes of 24,441 for HWTP and 20,766 for RWTP.
Coding
As mentioned previously and as indicated by Table 2, weclassify the moderators into four categories: (1) methods formeasuring WTP, (2) research stimulus, (3) general researchdesign of the study, and (4) the publication in which the studyappears. In the first category, the main moderator of interest isthe type of measurement HWTP, that is, the direct versus indi-rect measurement of HWTP. Two other moderators deal withRWTP measurement. Type of measurement RWTP similarlydistinguishes between direct and indirect measures, whereasincentive compatible reflects the incentive compatibility (ornot) of the method.
The second category of moderators, dealing with the re-search stimulus, includes value, or the mean RWTP for thecorresponding product. The experiments in our meta-analysisspan different countries and years, so we converted all valuesinto U.S. dollars using the corresponding exchange rates. Thevariable variance ES captures participants’ uncertainty andheterogeneity when evaluating a product. With regard to theproducts, we checked whether they were described as new tothe consumer or innovations, which enabled us to code theinnovation moderator. The moderator product/service distin-guishes products and services. Finally, the product type mod-erator requires more subjective judgment. Two independentcoders, unaware of the research project, coded product type
by using Copeland’s (1923) classification of consumer goodsaccording to the search and price comparison effort they re-quire, as convenience goods, shopping goods, or specialtygoods. We use an ordinal scale for product type and thereforeassessed interrater reliability with a two-way mixed, consis-tency-based, average-measure intraclass correlation coeffi-cient (ICC) (Hallgren 2012). The resulting ICC of 0.82 is ratedas excellent (Cicchetti 1994); the two independent codersagreed on most stimuli. The lack of any substantialmeasurement error indicates no notable influence onthe statistical power of the subsequent analyses(Hallgren 2012). Any inconsistent codes were resolvedthrough discussion between the two coders. We includeproduct type in the analyses with two dummy variablesfor shopping and specialty goods, and convenience goods arecaptured by the intercept.
In the third category, we consider moderators that deal withthe research design. The type of experiment HWTP and type ofexperiment RWTP capture whether the studies measureHWTP and RWTP in field or lab experiments, respectively.Experiments conducted during a lecture or class are designat-ed lab experiments. Offline/online HWTP and offline/onlineRWTP indicate whether the experiment is conducted onlineor offline; the type of subject design reveals if researchers useda between- or within-subject design. The moderator opportu-nity to test indicates whether participants could inspect theproduct in more detail before bidding. Participation fee andinitial balance capture whether participants received moneyfor showing up or for spending in the auction, respectively.We identify a student sample when the sample consists ofexclusively students; mixed samples are coded as not a studentsample. Methods for measuring RWTP often are not self-ex-planatory, so researchers introduce them to participants, usingvarious types of instruction. We focused on whether incentivecompatibility concepts or the dominant bidding strategy wereexplained, using a moderator introduction of method forRWTP with four values. It equals Bnone^ if the method wasnot introduced, Bexplanation^ if the method and its character-istics were explained, Btraining^ if mock auctions or questionsdesigned to understand the mechanism occurred before thefocal auction took place or questions were asked, and Bnotmentioned^ if the study does not indicate whether the methodwas introduced. With this nominal scale, we include this mod-erator by using three dummy variables for explanation, train-ing, and not mentioned, while the none category is capturedby the intercept. Finally, we include region. Almost allthe studies were conducted in North America or Europe;we distinguish North America from Bother countries(mostly Europe).^
The fourth category of moderators contains publicationcharacteristics. We checked whether a study underwent a peerreview process (peer reviewed), reflected a marketing or eco-nomics research domain (discipline), how many citations it
J. of the Acad. Mark. Sci. (2020) 48:499–518504

Table2
Moderators
Category
Moderator
Values
Variables
Descriptio
n
WTPmeasurement
Type
ofmeasurementH
WTP
Direct
Dum
myvariable(indirect=
1)Whether
HWTPismeasureddirectly
orindirectly.
Indirect
Type
ofmeasurementR
WTP
Direct
Dum
myvariable(indirect=
1)Whether
RWTPismeasureddirectly
orindirectly.
Indirect
Incentivecompatib
leNo
Dum
myvariable(yes=1)
Whether
themethodformeasuring
RWTP
isincentivecompatib
le.
Yes
Researchstim
ulus
Value
Metricvariable
The
meanRWTPconvertedinto
USdollars.
Producttype
Convenience
goods
Twodummyvariablesforshopping
andspecialty
goods;convenience
goodsarecaptured
bytheintercept
Classificationof
respectiv
estim
ulus
based
onan
Copeland(1923).
Shopping
goods
Specialty
goods
Innovatio
nNo
Dum
myvariable(yes=1)
Whether
thestim
ulus
isan
innovatio
n.Yes
Product/service
Product
Dum
myvariable(service
=1)
Whether
thestim
ulus
isaproducto
raservice.
Service
Variance
ES
Metricvariable
The
variance
oftheES.
Researchdesign
Type
ofsubjectd
esign
Between
Dum
myvariable(w
ithin=1)
Whether
itisabetweenor
awith
insubjectd
esign.
With
in
Opportunity
totest
No
Dum
myvariable(yes=1)
Whether
participantshadthechance
totest
theproductb
eforebidding.
Yes
Participationfee
No
Dum
myvariable(yes=1)
Whether
participantsreceived
aparticipationfee.
Yes
Initialbalance
No
Dum
myvariable(yes=1)
Whether
participantsreceived
aninitial
balancefortheauction.
Yes
Type
ofexperimentH
WTP
Field
Dum
myvariable(lab
=1)
Whether
HWTPismeasuredin
afield
oralabexperiment.
Lab
Type
ofexperimentR
WTP
Field
Dum
myvariable(lab
=1)
Whether
RWTPismeasuredin
afield
oralabexperiment.
Lab
Offline/onlin
eHWTP
Offlin
eDum
myvariable(online=1)
Whether
HWTPismeasuredofflineor
onlin
e.Online
Offline/onlin
eRWTP
Offlin
eDum
myvariable(online=1)
Whether
RWTPismeasuredofflineor
onlin
e.Online
Studentsam
ple
No
Dum
myvariable(yes=1)
Whether
thesampleconsistsof
studentsonly.
Yes
Introductio
nof
methodforRWTP
None
Three
dummyvariablesforexplanation,
training,and
notm
entio
ned;
None
iscaptured
bytheintercept
How
themethodformeasuring
RWTP
was
introduced.
Explanatio
n
Training
Not
mentio
ned
Region
Other
Countries
(mostly
Europe)
Dum
myvariable(N
orth
America=1)
Regionwhere
theexperimentw
asconducted.
North
America
J. of the Acad. Mark. Sci. (2020) 48:499–518 505

had on Google Scholar (citations), and in which year it waspublished (year).
Methodology
Effect size
To determine the hypothetical bias induced by differentmethods, we need an ES that represents the difference be-tween obtained values for HWTP and RWTP. When the dif-ferences stem from a comparison of a treatment and a controlgroup, standardized mean differences (SMD) are appropriatemeasures (e.g. Abraham and Hamilton 2018; Scheibehenneet al. 2010). Specifically, to compute SMD, researchers dividethe difference in the means of the treatment and the controlgroup by the standard deviation, which helps to control fordifferences in the scales of the dependent variables in theexperiments. Accordingly, it applies to studies that measurethe same outcome on different scales (Borenstein et al. 2009,p. 25). In contrast, the ESs in our meta-analysis rely on thesame scale; they differ in their position on the scale, becausethe products evoke different WTP values. In this case, thestandard deviation depends on not only the scale range butalso many other relevant factors, so the standard deviationshould not be used to standardize the outcomes. In addition,as studies may have used alternate experimental designs, dif-ferent standard deviations could be used across studies, lead-ing to standardized mean differences that are not directly com-parable (Morris and DeShon 2002). Rather than the SMD, wetherefore use a response ratio to assess ES, because it dependson the group means only.
Specifically, the response ratio is the mean outcome in anexperimental group divided by that in a corresponding controlgroup, such that it quantifies the percentage of variation be-tween the experimental and control groups (Hedges et al.1999). Unlike SMD, the response ratio applies when the out-come is measured on a ratio scale with a natural zero point,such as length ormoney (Borenstein et al. 2009). Accordingly,the response ratio often assesses ES in meta-analyses in ecol-ogy domains (Koricheva and Gurevitch 2014), for whichmany outcomes can be measured on ratio scales. To the bestof our knowledge though, the response ratio has not beenadopted in meta-analyses in marketing yet. However, it iscommon practice to specify a multiplicative, instead ofa linear, model when assessing the effects of marketinginstruments on product sales or other outcomes(Leeflang et al. 2015). Hence, it would be a naturaloption to use an effect measure representing proportion-ate changes, instead of additive changes, when derivingempirical generalizations on marketing subjects like re-sponse effects to mailing campaigns. For our effort, wedefine the response ratio asT
able2
(contin
ued)
Category
Moderator
Values
Variables
Descriptio
n
Publicationcharacteristics
Peerreview
edNo
Dum
myvariable(yes=1)
Whether
thestudywas
peer
review
ed.
Yes
Discipline
Economics
Dum
myvariable(m
arketin
g=1)
Corresponding
research
disciplin
eMarketin
g
Cita
tions
Metricvariable
Num
berof
citatio
nsin
GoogleScholar
Year
Metricvariable
Yearthestudywas
published
Moderatorsin
italicsarecontrolv
ariables
J. of the Acad. Mark. Sci. (2020) 48:499–518506

response ratio ¼ μHWTP
μRWTP;
where μHWTP and μRWTP are the means of a study’scorresponding HWTP and RWTP values.
For three reasons, we run statistical analyses using the nat-ural logarithm of the response ratio as the dependent variable.First, the use of the natural logarithm linearizes the metric, sodeviations in the numerator and denominator have the sameimpact (Hedges et al. 1999). Second, the parameters (β) forthe moderating effects in the meta-regression are easy to in-terpret, as a multiplication factor, by taking the exponent of theestimate (Exp(β)). Most moderators are dummy variables, anda change of the corresponding dummy value results in achange of (Exp(β) − 1) ∗ 100% in the hypothetical bias.However, this point should not be taken to mean that thedifference of the hypothetical bias between two conditionsof a moderator is Exp(β) − 1 percentage points, because thatvalue depends on the values of other moderators. Third, thedistribution of the natural logarithm of response ratios is ap-proximately normally distributed (Hedges et al. 1999).Consequently, we define ES as:
ES ¼ lnμHWTP
μRWTP
� �:
Modeling stochastically dependent effect sizesexplicitly
Most meta-analyses assume the statistical independence ofobserved ESs, but this assumption only applies to limitedcases; often, ESs are stochastically dependent. Two maintypes of dependencies arise between studies and ESs. First,studies can measure and compare several treatments or vari-ants of a type of treatment against a common control. In ourcontext, for example, a study might measure HWTP withdifferent methods and compare the results to the sameRWTP, leading to multiple ESs that correlate because theyshare the same RWTP. Treating them as independent woulderroneously add RWTP to the analysis twice. This type ofstudy is called a multiple-treatment study (Gleser and Olkin2009). Second, studies can produce several dependent ESs byobtaining more than one measure from each participant. Forexample, a study might measure HWTP and RWTP for sev-eral products from the same sample. The resulting ESscorrelate, because they are based on a common subject.This scenario represents a multiple-endpoint study(Gleser and Olkin 2009).
There are different approaches for dealing with stochasti-cally dependent ESs, such as ignoring or avoiding depen-dence, or else modeling dependence stochastically or explic-itly (Bijmolt and Pieters 2001; van den Noortgate et al. 2013).Inmarketing research, it is still common, and also suggested to
avoid dependent ESs (Grewal et al. 2017). However, nesteddata structures and the associated dependent ESs areprominent in marketing research, so Bijmolt and Pieters(2001) suggest using a three-level model to account for de-pendency, by adding error terms on all levels. In turn, market-ing researchers started to model dependence stochastically byapplying multi-level regression models (e.g. Abraham andHamilton 2018; Arts et al. 2011; Babić Rosario et al. 2016;Bijmolt et al. 2005; Edeling and Fischer 2016; Edeling andHimme 2018). However, when additional information aboutcorrelations among the ESs are available, it is most accurate tomodel dependence explicitly by incorporating the dependen-cies in the covariance matrix at the within-study level (Gleserand Olkin 2009). In contrast to modeling dependence stochas-tically, the covariances are not estimated but rather are calcu-lated on the basis of the provided information. To the best ofour knowledge, this approach has not been applied by meta-analyses in marketing previously.
To model stochastic dependence among ESs explicitly, wefollow Kalaian and Raudenbush (1996) and use a multivariatemixed linear model with two levels: a within-studies level anda between-studies level. On the former, we estimate a com-plete vector of the corresponding K true ESs, αi = (α1i,… ,αKi)
T, for each study i. However, not every study exam-ines all possibleK ESs, so the vector of ES estimates for study
i, ESi ¼ ES1i;…;ESLiið ÞT , contains Li of the total possible KESs, and by definition, Li ≤K. That is, K equals the maximumnumber of dependent ESs in one study (i.e., six in our sample),and every vector ESi contains between one and six estimates.The first-level model regresses αki on ESi with an indicatorvariable Zlki, which equals 1 if ESli estimates αki and 0 other-wise, according to the following linear model:
ESli ¼ ∑Kk¼1αkiZlki þ eli;
or in matrix notation,
ESi ¼ Ziαi þ ei:
The first-level errors ei are assumed to be multivariate nor-mal in their distribution, such that ei~N(0, Vi), where Vi is aKi ×Ki covariance matrix for study i, or the multivariate ex-tension of the V-known model for the meta-regression.The elements of Vi must be calculated according to thechosen ES measure (see Web Appendix B; Gleser andOlkin 2009; Lajeunesse 2011). In turn, they form thebasis for modeling the dependent ESs appropriately.The vector αi of a study’s true ES is estimated byweighted least squares, and each observation is weight-ed by the inverse of the corresponding covariance ma-trix (Gleser and Olkin 2009).
The linear model for the second stage is
αki ¼ βk0 þ ∑Mkm¼1βkmXmi þ uki;
J. of the Acad. Mark. Sci. (2020) 48:499–518 507
or in matrix notation
αi ¼ X iβ þ ui;
where the K ESs become the dependent variable. The resid-uals uki are assumed to be K-variate normal with zero averageand a covariance matrix τ. Then Xi reflects the moderatorvariables. By combining both levels, the resulting model is
ESi ¼ ZiX iβ þ Ziui þ ei:
Estimates for τ are based on restricted maximum likeli-hood. The analysis uses the metafor package for meta-analyses in R (Viechtbauer 2010).
Data screening and descriptive statistics
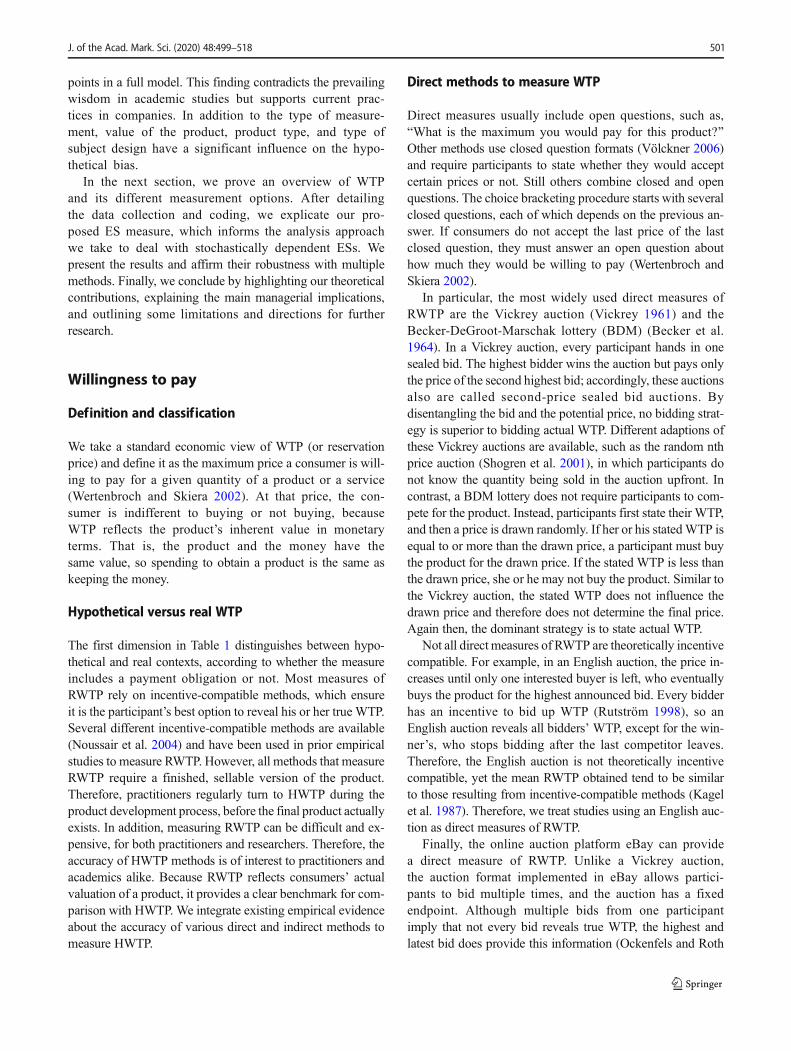
One of the criticisms of meta-analyses is the risk of publica-tion bias, such that all the included ESs would reflect the non-random sampling procedure. Including unpublished studiescan address this concern; in our sample, 22 of 117 ESs comefrom unpublished studies, for an unpublished work proportionof 19%, which favorably compares with other meta-analysespertaining to pricing, such as 10% in Tully and Winer (2014),9% in Bijmolt et al. (2005), or 16% in Abraham and Hamilton(2018). The funnel plot for the sample, as depicted in Fig. 1, is
symmetric, which indicates the absence of a publication bias.Finally, as the competing H1a and H1b indicate, we do notexpect a strong selectionmechanism in research or publicationprocesses that would favor significant or high (or low) ESs.Thus, we do not consider publication bias a serious concernfor our study.
To detect outliers in the data, we checked for extreme ESsusing the boxplot (seeWebAppendix D, FigureWA2).We areespecially interested in the moderator type of measurementHWTP, so we computed separate boxplots for the direct andindirect measures of HWTP and thereby identified one obser-vation for each measurement type (indirect Kimenju et al.2005; direct Neill et al. 1994) for which the ESs (0.9079;0.9582) exceeded the upper whisker, defined as the 75%quantile plus 1.5 times the box length. Kimenju et al. (2005)report HWTP ($11.68) values from an indirect method thatoverestimate RWTP ($94.48) by a factor of eight; we exclud-ed it from our analyses. Neill et al. (1994) report HWTP($109) that overestimates RWTP ($12) by a factor of ninewhen excluding outliers, and it is another outlier in our data-base. Thus, we excluded two of 117 observations, or less than5% of the full sample, which is a reasonable range (Cohenet al. 2003, p. 397).
The remaining 115 ESs represent 77 studies reported by 47different articles, with a total sample size of 24,347 for HWTPand 20,656 for RWTP. Sixteen out of these 115 ESs indicate
Notes: Six ESs with a very high standard error are not included here, to improve readability. A
funnel plot with all ESs in Web Appendix C confirms the lack of a publication bias.
Fig. 1 Funnel plot
J. of the Acad. Mark. Sci. (2020) 48:499–518508
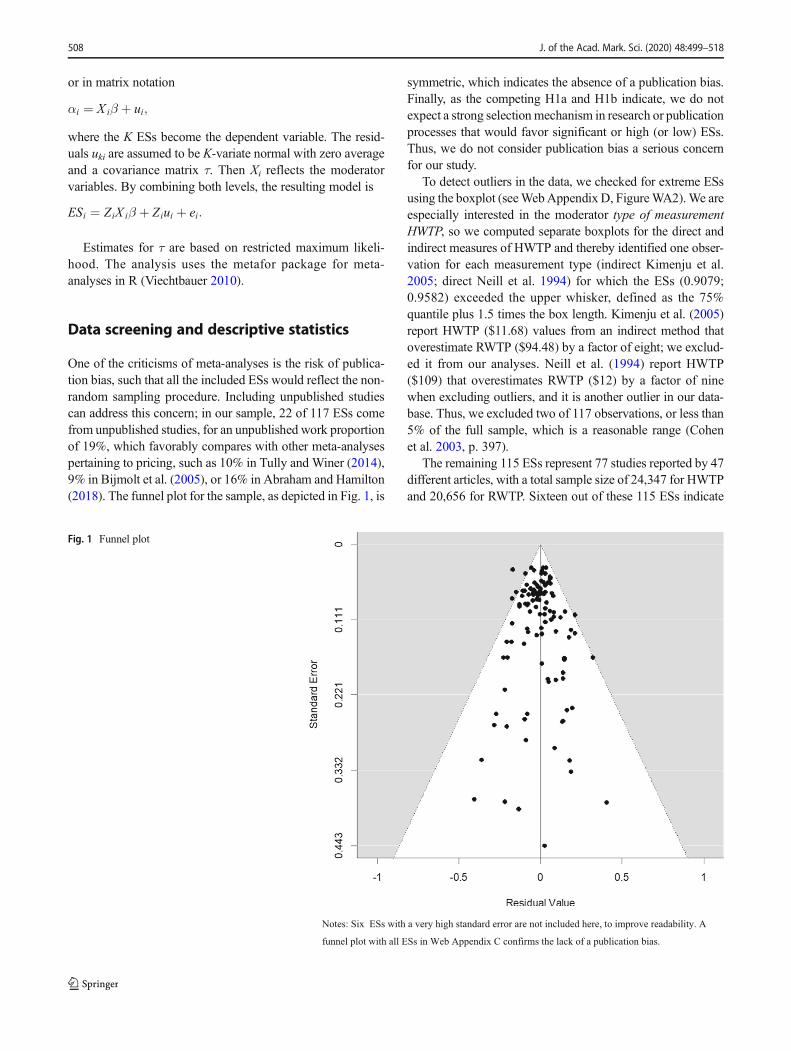
Table3
Descriptiv
estatistics
Mean
SD
NMean
SD
NMean
SDN
Mean
SD
N
Type
ofmeasurementH
WTP
Direct
Indirect
0.1818
0.1709
850.2280
0.2048
30
Type
ofmeasurementR
WTP
Direct
Indirect
0.1869
0.1776
106
0.2758
0.2055
9
Incentivecompatib
leNo
Yes
0.1294
0.1709
240.2109
0.1801
91
Producttype
Convenience
Shopping
Specialty
0.1954
0.1852
380.1339
0.1554
480.2911
0.1758
29
Innovatio
nNo
Yes
0.1760
0.1807
760.2287
0.1773
39
Product/service
Product
Service
0.2482
0.1797
800.0696
0.1840
35
Type
ofsubjectd
esign
Between
With
in
0.1800
0.1740
420.1800
0.1740
73
Opportunity
totest
No
Yes
0.1626
0.1746
750.2524
0.1789
40
Participationfee
No
Yes
0.1400
0.1731
106
0.2747
0.1617
9
Initialbalance
No
Yes
0.1774
0.1662
690.3879
0.2365
46
Type
ofexperimentH
WTP
Field
Lab
0.2716
0.1663
420.1491
0.1741
73
Type
ofexperimentR
WTP
Field
Lab
0.2743
0.1663
390.1526
0.1741
76
Offline/onlin
eHWTP
Offlin
eOnline
0.1888
0.1893
870.2096
0.1521
28
Offline/onlin
eRWTP
Offlin
eOnline
0.1880
0.1857
910.2159
0.1612
24
Studentsam
ple
No
Yes
0.2635
0.1571
570.1254
0.1769
58
Introductio
nof
methodforRWTP
None
Explanatio
nTraining
Not
mentio
ned
0.1689
0.1670
170.1657
0.1863
650.3464
0.2096
120.2201
0.1144
22
Region
Other
countries(m
ostly
Europe)
North
America
0.2678
0.1773
320.1653
0.1746
83
Peerreview
edNo
Yes
J. of the Acad. Mark. Sci. (2020) 48:499–518 509

an underestimation of RWTP, resulting from direct (12) andindirect (4) methods. Table 3 contains an overview of themoderators’ descriptive statistics. Type of measurementHWTP reveals some mean differences between direct(0.1818) and indirect (0.2280) measures, which representsmodel-free support for H1b. The descriptive statistics of prod-uct type suggest a higher mean ES for specialty goods(0.2911) than convenience (0.1954) or shopping (0.1399)goods, in accordance with H3. With regard to innovation,we find a higher ES mean for innovative (0.2287) comparedwith non-innovative (0.1760) products, as we predicted in H4.Model-free evidence gathered from the moderators that reflectthe research design also supports H5, in that the mean forbetween-subject designs is lower (0.1800) than that forwithin-subject designs (0.2798). The descriptive statistics can-not confirm H6 though, because giving participants an oppor-tunity to test a product before stating their WTP increases theES (0.2525) relatively to no such opportunity (0.1626). Wealso do not find support for H7 in the model-free evidence,because studies with an initial balance and participation feereport higher ESs than those without.
After detecting outliers and before conducting the meta-regressions, we checked for multicollinearity by calculatingthe generalized variance inflation factor GVIF1/(2 ∗ df), whichis used when there are dummy regressors from categoricalvariables; it is comparable to the square root of the variance
inflation factorffiffiffiffiffiffiffiffiVIF
p� �for 1 degree of freedom (df = 1) (Fox
andMonette 1992). In an iterative procedure, we excluded themoderator with the highest GVIF1/(2 ∗ df) and reestimated themodel repeatedly, until all moderators had a GVIF1/(2 ∗ df) < 2.This cut-off value of 2 has been applied in other disciplines(Pebsworth et al. 2012; Vega et al. 2010) and is comparable toa VIF cut-off value of 4, within the range of suggested values(i.e., 3–5; Hair Jr et al., 2019, p. 316). Accordingly, we ex-cluded moderators—all control variables that do not appear inany hypotheses—in the following order: type of experimentHWTP (GVIF1/(2 ∗ df) = 3.4723), offline/online RWTP(GVIF1/(2 ∗ df) = 3.2504), discipline (GVIF1/(2 ∗ df) = 2.2.4791),product/service (GVIF1/(2 ∗ df) = 2.2.3290), and peer reviewed(GVIF1/(2 ∗ df) = 2.0419).
Results
To address our research questions about the accuracy of WTPmeasurement methods and the moderators of this perfor-mance, we performed several meta-regressions in which wevaried the moderating effects included in the models. First, weran an analysis without any moderators. Second, we ran ameta-regression with all the moderators that met themulticollinearity criteria. Third, we conducted a stepwise anal-ysis, dropping the non-significant moderators one by one.T
able3
(contin
ued)
Mean
SD
NMean
SD
NMean
SDN
Mean
SD
N
0.1843
0.1938
210.1960
0.1785
94
Discipline
Economics
Marketin
g
0.1194
0.1435
650.2907
0.1789
50
Moderatorsin
italicsarecontrolv
ariables
J. of the Acad. Mark. Sci. (2020) 48:499–518510
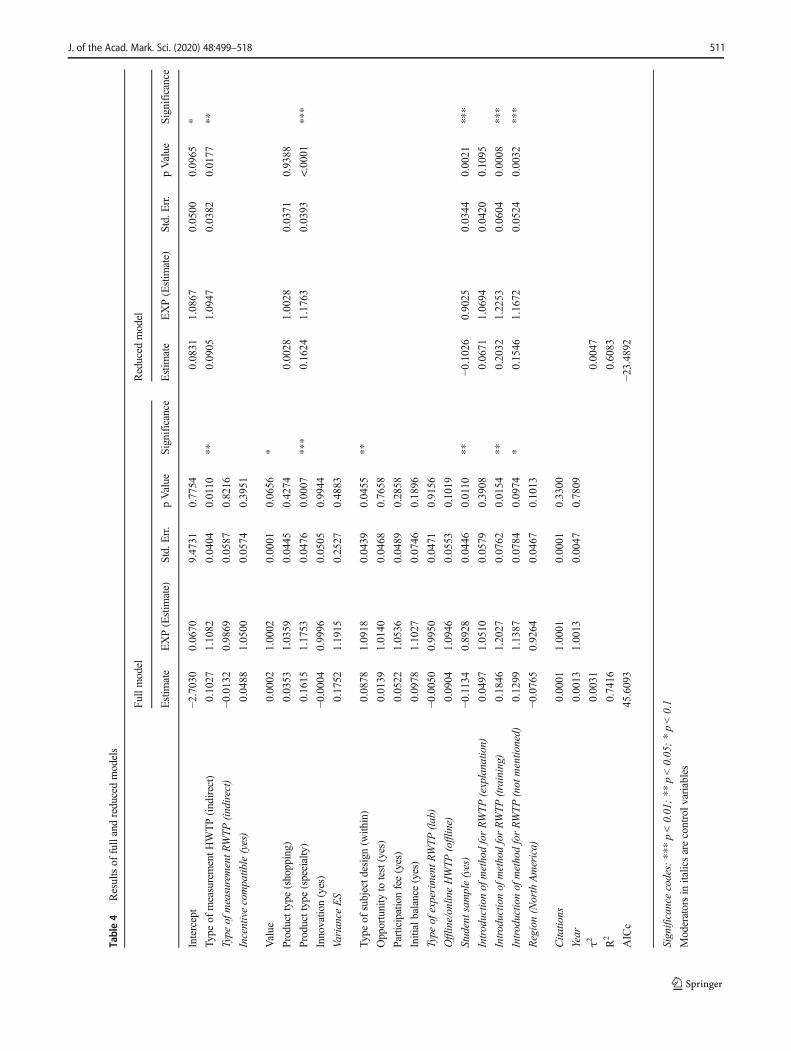
Table4
Resultsof
fullandreducedmodels
Fullmodel
Reduced
model
Estim
ate
EXP(Estim
ate)
Std.E
rr.
pValue
Significance
Estim
ate
EXP(Estim
ate)
Std.E
rr.
pValue
Significance
Intercept
−2.7030
0.0670
9.4731
0.7754
0.0831
1.0867
0.0500
0.0965
*
Type
ofmeasurementH
WTP(indirect)
0.1027
1.1082
0.0404
0.0110
**0.0905
1.0947
0.0382
0.0177
**
Type
ofmeasurementR
WTP
(indirect)
−0.0132
0.9869
0.0587
0.8216
Incentivecompatib
le(yes)
0.0488
1.0500
0.0574
0.3951
Value
0.0002
1.0002
0.0001
0.0656
*
Producttype(shopping)
0.0353
1.0359
0.0445
0.4274
0.0028
1.0028
0.0371
0.9388
Producttype(specialty)
0.1615
1.1753
0.0476
0.0007
***
0.1624
1.1763
0.0393
<.0001
***
Innovatio
n(yes)
−0.0004
0.9996
0.0505
0.9944
Variance
ES
0.1752
1.1915
0.2527
0.4883
Type
ofsubjectd
esign(w
ithin)
0.0878
1.0918
0.0439
0.0455
**
Opportunity
totest(yes)
0.0139
1.0140
0.0468
0.7658
Participationfee(yes)
0.0522
1.0536
0.0489
0.2858
Initialbalance(yes)
0.0978
1.1027
0.0746
0.1896
Type
ofexperimentR
WTP
(lab)
−0.0050
0.9950
0.0471
0.9156
Offline/onlin
eHWTP
(offline)
0.0904
1.0946
0.0553
0.1019
Studentsam
ple(yes)
−0.1134
0.8928
0.0446
0.0110
**−0
.1026
0.9025
0.0344
0.0021
***
Introductio
nof
methodforRWTP
(explanatio
n)0.0497
1.0510
0.0579
0.3908
0.0671
1.0694
0.0420
0.1095
Introductio
nof
methodforRWTP
(training)
0.1846
1.2027
0.0762
0.0154
**0.2032
1.2253
0.0604
0.0008
***
Introductio
nof
methodforRWTP
(not
mentio
ned)
0.1299
1.1387
0.0784
0.0974
*0.1546
1.1672
0.0524
0.0032
***
Region(North
America)
−0.0765
0.9264
0.0467
0.1013
Cita
tions
0.0001
1.0001
0.0001
0.3300
Year
0.0013
1.0013
0.0047
0.7809
τ20.0031
0.0047
R2
0.7416
0.6083
AICc
45.6093
−23.4892
Significancecodes:***p<0.01;**
p<0.05;*p<0.1
Moderatorsin
italicsarecontrolv
ariables
J. of the Acad. Mark. Sci. (2020) 48:499–518 511

The first model, including only the intercept, results in anestimate (β) of 0.1889 with a standard error (SE) of 0.0183and a p value < .0001. The estimate corresponds to an averagehypothetical bias of 20.79% (Exp(0.1889) = 1.2079), meaningthat on average, HWTP overestimates RWTP by almost 21%.
The analysis with all the moderators that met themulticollinearity threshold produces the estimation results inTable 4. The type of measurement HWTP has a significant,positive effect (β = 0.1027, Exp(β) = 1.1082, SE = 0.0404,p = 0.0110), indicating that indirect measures overestimateRWTP more than direct measures do. We reject H1a and con-firmH1b. In particular, the ratio of HWTP to RWTP should bemultiplied by 1.1082, resulting in an overestimation by indi-rect methods of an additional 10.82%. Value has a significant,positive effect at the 10% level (β = 0.0002, Exp(β) = 1.0002,SE = 0.0001, p = 0.0656), in weak support of H2. The percent-age overestimation of RWTP by HWTP increases slightly, byan additional 0.02%, with each additional U.S. dollar increasein value. For H3, we find no significant difference in thehypothetical bias between convenience and shopping goods,yet specialty goods evoke a significantly higher hypotheticalbias than convenience goods (β = 0.1615, Exp(β) = 1.1753,SE = 0.0476, p < .0001). This finding implies that the hypo-thetical bias is greater for products that demand extraordinarysearch effort, as we predicted in H3. We do not find supportfor H4, because innovation does not influence the hypotheticalbias significantly (β = − 0.0004, Exp(β) = 0.9996, SE =0.0505, p = 0.9944).
For moderators from the research design category, we con-firm the support we previously identified for H5. MeasuringHWTP and RWTP using a within-subject design results in agreater hypothetical bias than does a between-subject design(β = 0.0878, Exp(β) = 1.0918, SE = 0.0439, p = 0.0455), suchthat the hypothetical bias increases by an additional 9.18 per-centage points in this case. We do not find support for H6,
H7a, or H7b though, because opportunity to test (β = 0.0139,Exp(β) = 1.0140, SE = 0.0468, p = 0.7658), participation fee(β = 0.0522, Exp(β) = 1.0536, SE = 0.0489, p = 0.2858), andinitial balance (β = 0.0978, Exp(β) = 1.1027, SE = 0.0746,p = 0.1896) do not show significant effects.
Of the control variables, only student sample (β = −0.1134, Exp(β) = 0.8928, SE = 0.0446, p = 0.0110) and intro-duction of method for RWTP (training) (β = 0.1846,Exp(β) = 1.2027, SE = 0.0762, p = 0.0154) exert significanteffects in the full model. If a study only includes students,the hypothetical bias gets smaller by 11%; conducting mockauctions before measuring RWTP increases the hypotheticalbias by 20%.
Finally, we ran analyses in which we iteratively excludedmoderators until all remaining moderators were significant atthe 5% level. We excluded the moderator with the highest pvalue from the full model, reran the analysis, and repeated thisprocedure until we had only significant moderators left. Wetreated the dummy variables from the nominal/ordinal moder-ators product type and introduction of method for RWTP asbelonging together, and we considered these moderators assignificant when one of the corresponding dummy variablesshowed a significant effect. The exclusion order was as fol-lows: innovation, type of experiment RWTP, type of measure-ment RWTP, opportunity to test, year, variance ES, incentivecompatible, initial balance, citations, participation fee,region, value, type of subject design, and offline/onlineHWTP. The results in Table 4 reconfirm the support for H1b,because the type of measurement HWTP has a positive, sig-nificant effect (β = 0.0905, Exp(β) = 1.0947, SE = 0.0382, p =0.0177), resulting in a multiplication factor of 1.0947. Theoverestimation of RWTP increases considerably for measuresof WTP for specialty goods (β = 0.1624, Exp(β) = 1.1763,SE = 0.0393, p < .0001), in support of H3. Yet we do not findsupport for any other hypotheses in the reduced model.
Notes: The base scenario is as follows: product type = convenience good,introduction of method
for RWTP = explanation,student sample = no.
9
28
-2
27
33
19
40
7
39
46
-10%
0%
10%
20%
30%
40%
50%
Base scenario Product type
(specialty)
Student sample
(yes)
Introduction of
method for
RWTP (not
mentioned)
Introduction of
method for
RWTP (training)
Direct measurement of HWTP Indirect measurement of HWTP
Fig. 2 Overestimation of RWTP
J. of the Acad. Mark. Sci. (2020) 48:499–518512

Regarding the control variables, student sample (β = −0.1026, Exp(β) = 0.9025, SE = 0.0344, p = 0.0021) again hasa significant effect, and introduction of method forRWTP affects the hypothetical bias significantly. In thiscase, the hypothetical bias increases when the articledoes not mention any introduction of the method formeasuring RWTP to participants (β = 0.1546, Exp(β) =1.1672, SE = 0.0524, p = 0.0032) and when the methodinvolves mock auctions (β = 0.2032, Exp(β) = 1.2253,SE = 0.0604, p = 0.0008).
For ease of interpretation, we depict the hypothetical biasfor different scenarios in Fig. 2. The reduced model provides abetter model fit, according to the corrected Akaike informa-tion criterion (AICc) (AICcfull model = 45.61,AICcreduced model-
= − 23.49), so we use it as the basis for the simulation. Thebase scenario depicted in Fig. 2 measures WTP for conve-nience goods, explains the method for measuring RWTP toparticipants, and does not include solely students. The otherscenarios are adaptions of the base scenario, where one of thethree aforementioned characteristics is changed. In the basescenario, we predict that direct measurement overestimatesRWTP by 9%, and indirect measurement overestimates it by19%, so the difference is 10 percentage points. In contrast, forspecialty goods, the overestimation increases to 28% for directand to 40% for indirect measures. When using a pure studentsample instead of a mixed sample, the predictions are relative-ly accurate. Here, direct measurement even underestimatesRWTP by 2%, while indirect measurement yields an overes-timation of 7%.With respect to how the method for measuringRWTP is introduced to the participants, not mentioning it in apaper, as well as training the method beforehand increase thehypothetical bias.While the first option is hardly interpretable,running mock tasks increases the bias to 33% in case of directand to 46% in case of indirect methods used for measuringHWTP.
Robustness checks
We ran several additional analyses to check the robustness ofthe results, which we summarize in Table WA2 in WebAppendix F. To start, we analyzed Model 1 in Table WA2
by applying a cut-off value of GVIF1= 2*dfð Þ <ffiffiffiffiffi10
p, compa-
rable to the often used cut-off value of 10 for the VIF. In thiscase, we did not need to exclude any moderator, but the resultsdo not deviate in their signs or significance levels relatively tothe main results. Type of measurement HWTP still has a sig-nificant effect (5% level) on the hypothetical bias. Inaddition, value, product type (specialty), and type ofsubject design exert significant influences. Among thecontrol variables, introduction of method for RWTP(training), introduction of method for RWTP (not
mentioned), region, and peer reviewed have significanteffects (5% level). The moderators excluded from themain models due to multicollinearity (product/service,type of experiment HWTP, offline/online RWTP, anddiscipline) do not show significant influences.
Next, we estimated two models with all ESs, including thetwo outliers, but varied varied the number of included moder-ators (Models 2 and 3 in Table WA2). The results remainsimilar to our main findings. Perhaps most important,the type of measurement HWTP has a significant effecton the hypothetical bias, comparable in size to the ef-fect in the main model.
In addition, instead of the multivariate mixed linear model,we used a random-effects, three-level model, such that the ESmeasures nested within studies with a V-known model at thelowest level (Bijmolt and Pieters 2001; van den Noortgateet al. 2013), which can account for dependence between ob-servations. We estimated the two main models and the threerobustness check models with this random-effects three-levelmodel (Models 4–8 in Table WA2). Again, the results do notchange substantially, except for value, which becomes signif-icant at the 5% level.
Finally, we tested for possible interaction effects. That is,we took all significant moderators from the full model andtested, for each significant moderator, all possible interactions.The limited number of observations prevented us from simul-taneously including all interactions in one model. Therefore,we first estimated separate models for each of the significantmoderators from the full model, after dropping moderatorsdue to multicollinearity until all moderators had a GVIF1/(2 ∗df) < 2. Then, we estimated an additional extension of the fullmodel by adding all significant interactions that emerged fromthe previous interaction models. We next reduced that modeluntil all moderators were significant at a 5% level. Theresulting model achieved a higher AICc than our main re-duced model. Comparing all full models with interactions,the model with the lowest AICc (Burnham and Anderson2004) did not feature a significant interaction, indicating thatthe possible interactions are small and do not affect our results.All of these models are available in Web Appendix F.
Discussion
Theoretical contributions
Though three meta-analyses discussing the hypothetical biasexist (Carson et al. 1996; List and Gallet, 2001; Murphy et al.2005), this is the first comprehensive study giving marketingmanagers and scholars advices on how to accurately measureconsumers’ WTP. In contrast to the existing meta-analyses,we focus on private goods, instead of on public goods, in-creasing the applicability of our findings within a marketing
J. of the Acad. Mark. Sci. (2020) 48:499–518 513
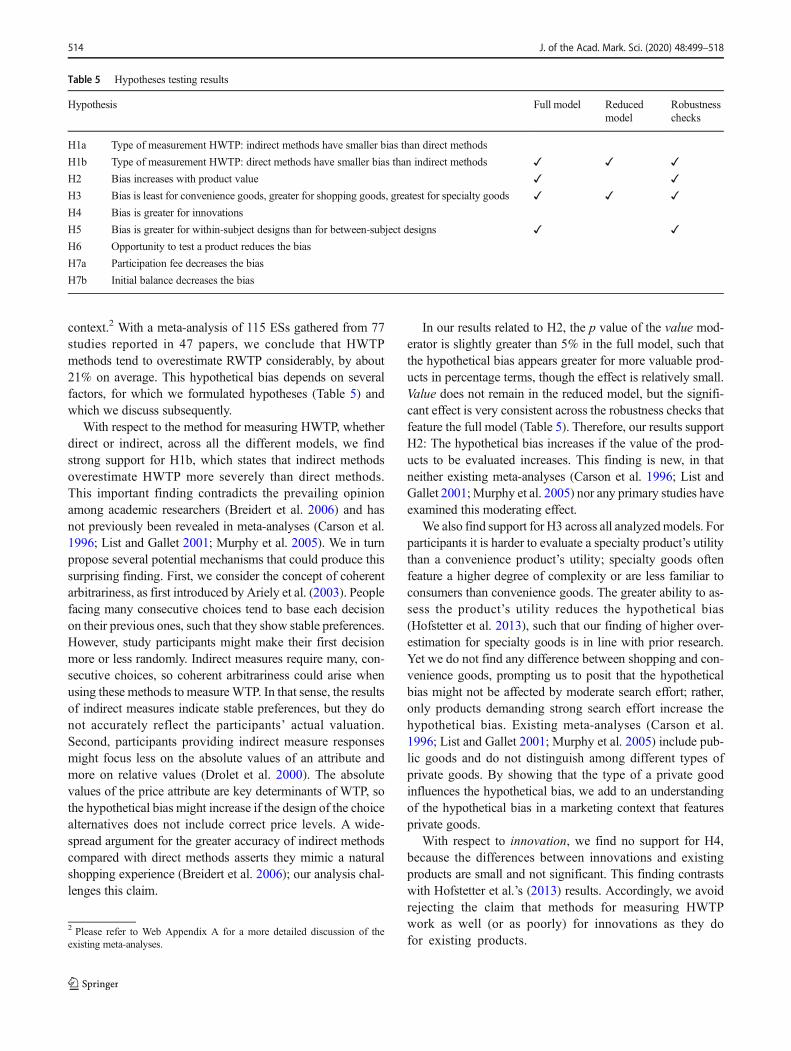
context.2 With a meta-analysis of 115 ESs gathered from 77studies reported in 47 papers, we conclude that HWTPmethods tend to overestimate RWTP considerably, by about21% on average. This hypothetical bias depends on severalfactors, for which we formulated hypotheses (Table 5) andwhich we discuss subsequently.
With respect to the method for measuring HWTP, whetherdirect or indirect, across all the different models, we findstrong support for H1b, which states that indirect methodsoverestimate HWTP more severely than direct methods.This important finding contradicts the prevailing opinionamong academic researchers (Breidert et al. 2006) and hasnot previously been revealed in meta-analyses (Carson et al.1996; List and Gallet 2001; Murphy et al. 2005). We in turnpropose several potential mechanisms that could produce thissurprising finding. First, we consider the concept of coherentarbitrariness, as first introduced by Ariely et al. (2003). Peoplefacing many consecutive choices tend to base each decisionon their previous ones, such that they show stable preferences.However, study participants might make their first decisionmore or less randomly. Indirect measures require many, con-secutive choices, so coherent arbitrariness could arise whenusing these methods to measureWTP. In that sense, the resultsof indirect measures indicate stable preferences, but they donot accurately reflect the participants’ actual valuation.Second, participants providing indirect measure responsesmight focus less on the absolute values of an attribute andmore on relative values (Drolet et al. 2000). The absolutevalues of the price attribute are key determinants of WTP, sothe hypothetical bias might increase if the design of the choicealternatives does not include correct price levels. A wide-spread argument for the greater accuracy of indirect methodscompared with direct methods asserts they mimic a naturalshopping experience (Breidert et al. 2006); our analysis chal-lenges this claim.
In our results related to H2, the p value of the value mod-erator is slightly greater than 5% in the full model, such thatthe hypothetical bias appears greater for more valuable prod-ucts in percentage terms, though the effect is relatively small.Value does not remain in the reduced model, but the signifi-cant effect is very consistent across the robustness checks thatfeature the full model (Table 5). Therefore, our results supportH2: The hypothetical bias increases if the value of the prod-ucts to be evaluated increases. This finding is new, in thatneither existing meta-analyses (Carson et al. 1996; List andGallet 2001;Murphy et al. 2005) nor any primary studies haveexamined this moderating effect.
We also find support for H3 across all analyzedmodels. Forparticipants it is harder to evaluate a specialty product’s utilitythan a convenience product’s utility; specialty goods oftenfeature a higher degree of complexity or are less familiar toconsumers than convenience goods. The greater ability to as-sess the product’s utility reduces the hypothetical bias(Hofstetter et al. 2013), such that our finding of higher over-estimation for specialty goods is in line with prior research.Yet we do not find any difference between shopping and con-venience goods, prompting us to posit that the hypotheticalbias might not be affected by moderate search effort; rather,only products demanding strong search effort increase thehypothetical bias. Existing meta-analyses (Carson et al.1996; List and Gallet 2001; Murphy et al. 2005) include pub-lic goods and do not distinguish among different types ofprivate goods. By showing that the type of a private goodinfluences the hypothetical bias, we add to an understandingof the hypothetical bias in a marketing context that featuresprivate goods.
With respect to innovation, we find no support for H4,because the differences between innovations and existingproducts are small and not significant. This finding contrastswith Hofstetter et al.’s (2013) results. Accordingly, we avoidrejecting the claim that methods for measuring HWTPwork as well (or as poorly) for innovations as they dofor existing products.
2 Please refer to Web Appendix A for a more detailed discussion of theexisting meta-analyses.
Table 5 Hypotheses testing results
Hypothesis Full model Reducedmodel
Robustnesschecks
H1a Type of measurement HWTP: indirect methods have smaller bias than direct methods
H1b Type of measurement HWTP: direct methods have smaller bias than indirect methods ✓ ✓ ✓
H2 Bias increases with product value ✓ ✓
H3 Bias is least for convenience goods, greater for shopping goods, greatest for specialty goods ✓ ✓ ✓
H4 Bias is greater for innovations
H5 Bias is greater for within-subject designs than for between-subject designs ✓ ✓
H6 Opportunity to test a product reduces the bias
H7a Participation fee decreases the bias
H7b Initial balance decreases the bias
J. of the Acad. Mark. Sci. (2020) 48:499–518514

Awithin-subject research design increases the hypotheticalbias, compared with a between-subject design, as we predict-ed in H5 and in accordance with prior research (Ariely et al.2006, Fox and Tversky 1995, Frederick and Fischhoff 1998).Yet this finding still seems surprising to some extent. Whenasking a participant for WTP twice (once hypothetically, oncein a real context), the first answer seemingly should serve asan anchor for the second, leading to an assimilation expectedto reduce the hypothetical bias. Instead, two similar questionsunder different conditions appear to evoke a contrast insteadof an assimilation effect, and they produce a greater hypothet-ical bias. Consequently, when designing marketing experi-ments to investigate the hypothetical bias, researchers shoulduse a between-subject design to prevent the answers frominfluencing each other. When researching the influence ofconsumer characteristics on the hypothetical bias though, itwould be more appropriate to choose a within-subject design(Hofstetter et al. 2013), though researchers must recognizethat the hypothetical bias might be overestimatedmore severe-ly in this case. Murphy et al. (2005) also distinguish differentsubject designs in their meta-analysis and find a significanteffect, though they use RWTP instead of the difference be-tween HWTP and RWTP as their dependent variable. In thissense, our finding of a moderating role of the study design onthe hypothetical bias is new to the literature.
Our results do not support H6; we do not find differences inthe hypothetical bias when participants have an opportunitythe test a product before stating their WTP or not. Testing aproduct in advance reduces uncertainty about product perfor-mance, and our finding is in contrast with Hofstetter et al.’s(2013) evidence that higher uncertainty increases the hypo-thetical bias. Note however, that the result by Hofstetteret al.’s (2013) refers to an effect of a consumer characteristic,and might be specific to the examined product, namely digitalcameras. Our results are more general across a widerange of product categories and experimental designs.Furthermore, this result on H6 is in line with our find-ings for H4; both hypotheses rest on the participants’uncertainty about product performance, and we do notfind support for either of them.
Finally, neither a participation fee nor initial balance re-duce the hypothetical bias significantly, so we find no supportfor H7a or H7b. Formally, we can only Bnot reject^ a nullhypothesis of no moderator effect, but these findings suggestthat we can dispel fears about influencing WTP results toomuch by offering participation fees or an initial balance.
In addition to these theoretical insights on WTP measures,we contribute to marketing literature by showing how to mod-el stochastically dependent ESs explicitly when the covari-ances and variances of the observed ESs are known or canbe computed. Moreover, we use (the log of) the responseratios as the ES in our meta-analysis, which has not been donepreviously in marketing. We provide a detailed rationale for
using response ratios and thus offer marketing scholars anoth-er ES option to use in their meta-analyses.
Managerial implications
This meta-analysis identifies a substantial hypothetical bias of21% on average inmeasures ofWTP. Although hypotheticallyderived WTP estimates are often the best estimates available,managers should realize that they generally overestimate con-sumers’ RWTP and take that bias into account when usingHWTP results to develop a pricing strategy or when settingan innovation’s launch price. In addition, we detail conditionsin which the bias is larger or smaller, and we provide a briefoverview of how extensive the expected biases might become.In particular, managers should anticipate a greater hypotheti-cal bias when measuringWTP for products with higher valuesor for specialty goods. For example, when measuring HWTPfor specialty goods, direct methods overestimate it by 28%and indirect methods do so by 40%. These predicted degreesof RWTP overestimation should be used to adjust decisionsbased on WTP studies in practice.
The study at hand also shows that direct methods result inmore accurate estimates of WTP than indirect methods do.Therefore, practitioners can resist, or at least consider withsome skepticism, the prevalent academic advice to use indirectmethods to measure WTP. In addition to being less accurate,indirect methods require more effort and costs (Leigh et al.1984). However, this recommendation only applies if the mea-surement of HWTP is necessary. If RWTP can be measuredwith an auction format, that option is preferable, since RWTPreflects actual WTP, whereas HWTP tends to overestimate it.This result also implies an exclusive focus on measuringWTPfor a specific product, such that it disregards some advantagesof the disaggregate information provided by indirect methods(e.g., demand due to cannibalization, brand switching, ormarket expansion; Jedidi and Jagpal 2009). In summary, thekey takeaway for managers who might use direct measures ofHWTP is that the Bquick and dirty solution^ is only quick, notdirty—or at least, not more dirty than indirect methods.
Limitations and research directions
This meta-analysis suggests several directions for further re-search, some of which are based on the limitations of ourmeta-analysis. First, several recent adaptations of indirectmethods seek to improve their accuracy (Gensler et al. 2012,Schlereth and Skiera 2017). These improvements might re-duce the variance in measurement accuracy between directand indirect measurements. These recently developedmethods have not been tested by empirical comparison stud-ies, so we could not include them in our meta-analysis. Anextensive comparison of those adaptions, in terms of theireffects on the hypothetical bias, would provide researchers
J. of the Acad. Mark. Sci. (2020) 48:499–518 515

and managers more comprehensive insights for choosing theright method when measuring WTP.
Second, the prevailing opinion of indirect methods yieldinga lower hypothetical bias than direct methods bases upon as-sumptions concerning individuals’ decision making; thoughour results are in contrast with this opinion. The underlyingmental processes when asked for the WTP through direct orindirect methods are not well understood yet. Investigatingthose processes would foster the understanding of differencesin the hypothetical bias between direct and indirect methodsand between other experimental conditions. This would en-able the development of new adaptions minimizing the hypo-thetical bias.
Third, the hypothetical bias depends on a variety of factors,including individual-level considerations (Hofstetter et al.2013; Sichtmann et al. 2011), that extend beyond the productor study level moderators as examined in our meta-regres-sions. Very few studies have investigated these factors, sowe could not incorporate them in our meta-analysis, thoughconsumer characteristics likely explain some differences.Therefore, we call for more research on whether and howindividual characteristics influence the hypothetical bias. Forexample, a possible explanation for the limited accuracy ofindirect measures could reflect coherent arbitrariness (Arielyet al. 2003). Continued research might examine whether andhow coherent arbitrariness affects different consumers, espe-cially in the context of CBCs. In addition, our findings onsome product-level factors are new, namely that the hypothet-ical bias is greater for higher valued products and for specialtygoods. These results could be cross-validated in future exper-imental studies.
Fourth, knowing and measuring WTP is crucial for firmsoperating in business-to-business (B2B) contexts (Andersonet al. 1992), yet all ESs in our study are from a business-to-consumer context. Because B2B products and services tend tobe more complex, customers might prefer to identify productcharacteristics and to include them separately when determin-ing their WTP in response to an indirect method. However,anecdotal evidence indicates that direct measurement worksbetter for industrial goods than for consumer goods (Dolanand Simon 1996). Researching the differential accuracy ofthe various methods in a B2B context would be espe-cially interesting; our study already indicates differencesbetween convenience and (more complex) specialtygoods. Therefore, we join Lilien (2016) in calling formore research in B2B marketing, including the measure-ment of WTP.
Fifth, the majority of studies included herein used openquestioning as the direct method for measuring WTP. In prac-tice, different direct methods are available (Steiner andHendus 2012), yet they rarely have been investigated in aca-demic research. Pricing research could increase in managerialrelevance (Borah et al. 2018), and help managers make better
pricing decisions, if it included assessments of different directmethods for measuring WTP.
Acknowledgments The authors appreciate helpful comments from FelixEggers, Manfred Krafft, and Hans Risselada.
Open Access This article is distributed under the terms of the CreativeCommons At t r ibut ion 4 .0 In te rna t ional License (h t tp : / /creativecommons.org/licenses/by/4.0/), which permits unrestricted use,distribution, and reproduction in any medium, provided you giveappropriate credit to the original author(s) and the source, provide a linkto the Creative Commons license, and indicate if changes were made.
References
Abraham, A. T., & Hamilton, R. W. (2018). When does partitioned pric-ing lead to more favorable consumer preferences? Meta-analyticevidence. Journal of Marketing Research, 55(5), 686–703.
Anderson, J. C., Jain, D. C., & Chintagunta, P. K. (1992). Customer valueassessment in business markets: A state-of-practice study. Journal ofBusiness-to-Business Marketing, 1(1), 3–29.
Ariely, D., Loewenstein, G., & Prelec, D. (2003). BCoherentarbitrariness^: Stable demand curves without stable preferences.The Quarterly Journal of Economics, 118(1), 73–106.
Ariely, D., Ockenfels, A., & Roth, A. E. (2005). An experimental analysisof ending rules in internet auctions. RAND Journal of Economics,36(4), 890–907.
Ariely, D., Loewenstein, G., & Prelec, D. (2006). Tom sawyer and theconstruction of value. Journal of Economic Behavior &Organization, 60(1), 1–10.
Arts, J. W., Frambach, R. T., & Bijmolt, T. H. A. (2011). Generalizationson consumer innovation adoption: A meta-analysis on drivers ofintention and behavior. International Journal of Research inMarketing, 28(2), 134–144.
Babić Rosario, A., Sotgiu, F., de Valck, K., & Bijmolt, T. H. A. (2016).The effect of electronic word of mouth on sales: A meta-analyticreview of platform, product, and metric factors. Journal ofMarketing Research, 53(3), 297–318.
Barrot, C., Albers, S., Skiera, B., & Schäfers, B. (2010). Why second-price sealed-bid auction leads to more realistic price-demand func-tions. International Journal of Electronic Commerce, 14(4), 7–38.
Becker, G.M., DeGroot, M. H., &Marschak, J. (1964). Measuring utilityby a single-response sequential method. Systems Research andBehavioral Science, 9(3), 226–232.
Bijmolt, T. H. A., & Pieters, R. G. M. (2001). Meta-analysis in marketingwhen studies contain multiple measurements. Marketing Letters,12(2), 157–169.
Bijmolt, T. H. A., van Heerde, H. J., & Pieters, R. G. M. (2005). Newempirical generalizations on the determinants of price elasticity.Journal of Marketing Research, 42(2), 141–156.
Bolton, G. E., & Ockenfels, A. (2014). Does laboratory trading mirrorbehavior in real world markets? Fair bargaining and competitivebidding on eBay. Journal of Economic Behavior & Organization,97, 143–154.
Borah, A., Wang, X., & Ryoo, J. H. (2018). Understanding influence ofmarketing thought on practice: An analysis of business journalsusing textual and latent Dirichlet allocation (LDA) analysis.Customer Needs and Solutions, 5(3–4), 146–161.
J. of the Acad. Mark. Sci. (2020) 48:499–518516

Borenstein, M., Hedges, L. V., Higgins, J. P. T., & Rothstein, H. R.(2009). Introduction to meta-analysis. Chichester, UnitedKingdom: John Wiley & Sons.
Breidert, C., Hahsler, M., & Reutterer, T. (2006). A review of methods formeasuring willingness-to-pay. Innovative Marketing, 2(4), 8–32.
Brown, T. C., Champ, P. A., Bishop, R. C., & McCollum, D. W. (1996).Which response format reveals the truth about donations to a publicgood? Land Economics, 72(2), 152–166.
Brown, T. C., Ajzen, I., & Hrubes, D. (2003). Further tests of entreaties toavoid hypothetical bias in referendum contingent valuation. Journalof Environmental Economics and Management, 46(2), 353–361.
Burnham, K. P., & Anderson, D. R. (2004). Multimodel inference:Understanding AIC and BIC in model selection. SociologicalMethods & Research, 33(2), 261–304.
Bushong, B., King, L. M., Camerer, C. F., & Rangel, A. (2010).Pavlovian processes in consumer choice: The physical presence ofa good increases willingness-to-pay. American Economic Review,100(4), 1556–1571.
Carson, R. T., Flores, N. E., Martin, K. M., & Wright, J. L. (1996).Contingent valuation and revealed preference methodologies:Comparing the estimates for quasi-public goods. Land Economics,72(1), 80–99.
Charness, G., Gneezy, U., & Kuhn,M. A. (2012). Experimental methods:Between-subject and within subject designs. Journal of EconomicBehavior & Organization, 81(1), 1–8.
Cicchetti, D. V. (1994). Guidelines, criteria, and rules of thumb for eval-uating normed and standardized assessment instruments in psychol-ogy. Psychological Assessment, 6(4), 284–290.
Cohen, J., Cohen, P., West, S. G., & Aiken, L. S. (2003). Applied multipleregression/correlation analysis for the behavioral sciences (3rd ed.).Mahwah, NJ: Lawrence Erlbaum Associates.
Copeland, M. T. (1923). Relation of consumers’ buying habits to market-ing methods. Harvard Business Review, 1(3), 282–289.
Dimoka, A., Hong, Y., & Pavlou, P. A. (2012). On product uncertainty inonline markets: Theory and evidence. MIS Quarterly, 36(2), 395–426.
Ding, M. (2007). An incentive-aligned mechanism for conjoint analysis.Journal of Marketing Research, 44(2), 214–223.
Ding, M., Grewal, R., & Liechty, J. (2005). Incentive-aligned conjointanalysis. Journal of Marketing Research, 42(1), 67–82.
Dolan, R. J., & Simon, H. (1996). Power pricing: how managing pricetransforms the bottom line. New York: The Free Press.
Drolet, A., Simonson, I., & Tversky, A. (2000). Indifference curves thattravel with the choice set. Marketing Letters, 11(3), 199.209.
Edeling, A., & Fischer, M. (2016). Marketing’s impact on firm value:Generalizations from a meta-analysis. Journal of MarketingResearch, 53(4), 515–534.
Edeling, A., & Himme, A. (2018). When does market share matter? Newempirical generalizations from a meta-analysis of the market share–performance relationship. Journal of Marketing, 82(3), 1–24.
Eggers, F., & Sattler, H. (2009). Hybrid individualized two-level choice-based conjoint (HIT-CBC): A newmethod for measuring preferencestructures with many attribute levels. International Journal ofResearch in Marketing, 26(2), 108–118.
Fox, J., & Monette, G. (1992). Generalized collinearity diagnostics.Journal of the American Statistical Association, 87(417), 178–183.
Fox, C. R., & Tversky, A. (1995). Ambiguity aversion and comparativeignorance. The Quarterly Journal of Economics, 110(3), 585–603.
Frederick, S., & Fischhoff, B. (1998). Scope (in)sensitivity in elicitedvaluations. Risk Decision and Policy, 3(2), 109–123.
Gensler, S., Hinz, O., Skiera, B., & Theysohn, S. (2012). Willingness-to-pay estimation with choice-based conjoint analysis: Addressing ex-treme response behavior with individually adapted designs.European Journal of Operational Research, 219(2), 368–378.
Gensler, S., Neslin, S. A., & Verhoef, P. C. (2017). The showroomingphenomenon: It’s more than just about price. Journal of InteractiveMarketing, 38, 29–43.
Gleser, L. J., & Olkin, I. (2009). Stochastically dependent effect sizes. InH. Cooper, L. V. Hedges, & J. C. Valentine (Eds.), The handbook ofresearch synthesis and meta-analysis (2nd ed., pp. 357–376). NewYork: Russel Sage Foundation.
Grewal, D., Puccinelli, N., & Monroe, K. B. (2017). Meta-analysis:Integrating accumulated knowledge. Journal of the Academy ofMarketing Science, 47(5), 840.
Hair J.F. Jr, Black, W. C., Babin, B. J., & Anderson, R. E. (2019).Multivariate data analysis (8th ed.). Hampshire, United Kingdom:Cengage Learning EMEA.
Hallgren, K. A. (2012). Computing inter-rater reliability for observationaldata: An overview and tutorial. Tutorial in Quantitative Methods forPsychology, 8(1), 23–34.
Harrison, G.W., & Rutström, E. E. (2008). Experimental evidence on theexistence of hypothetical bias in value elicitation methods. In C. R.Plott & V. L. Smith (Eds.), Handbook of experimental economicsresults (Vol. 1, pp. 752–767). Amsterdam, Netherlands: Elsevier.
Hedges, L. V., Gurevitch, J., & Curtis, P. S. (1999). The meta-analysis ofresponse ratios in experimental ecology. Ecology, 80(4), 1150–1156.
Hensher, D. A. (2010). Hypothetical bias, choice experiments and will-ingness to pay. Transportation Research Part B: Methodological,44(6), 735–752.
Hoeffler, S. (2003). Measuring preferences for really new products.Journal of Marketing Research, 40(4), 406–420.
Hofstetter, R., Miller, K.M., Krohmer, H., & Zhang, Z. J. (2013). How doconsumer characteristics affect the bias in measuring willingness topay for innovative products? Journal of Product InnovationManagement, 30(5), 1042–1053.
Ingenbleek, P. T.M., Frambach, R. T., &Verhallen, T. M.M. (2013). Bestpractices for new product pricing: Impact on market performanceand price level under different conditions. Journal of ProductInnovation Management, 30(3), 560–573.
Jedidi, K., & Jagpal, S. (2009). Willingness to pay: Measurement andmanagerial implications. In V. R. Rao (Eds.), Handbook of pricingresearch in marketing (pp. 37–60). Cheltenham, United Kingdom:Edward Elgar Publishing.
Jedidi, K., & Zhang, Z. J. (2002). Augmenting conjoint analysis to esti-mate consumer reservation price. Management Science, 48(10),1350–1368.
Kagel, J. H., Harstad, R. M., & Levin, D. (1987). Information impact andallocation rules in auctions with affiliated private values: A labora-tory study. Econometrica, 55(6), 1275–1304.
Kalaian, H. A., & Raudenbush, S. W. (1996). A multivariate mixed linearmodel for meta-analysis. Psychological Methods, 1(3), 227–235.
Kimenju, S. C., Morawetz, U. B., & De Groote, H. (2005). Comparingcontingent valuation method, choice experiments and experimentalauctions in soliciting consumer preference for maize in WesternKenya: Preliminary results (Presentation at the AfricanEconometric Society 10th annual conference on econometric model-ing in Africa, Nairobi, Kenya).
Kohli, R., & Mahajan, V. (1991). A reservation-price model for optimalpricing of multiattribute products in conjoint analysis. Journal ofMarketing Research, 28(3), 347–354.
Koricheva, J., & Gurevitch, J. (2014). Uses and misuses of meta-analysisin plant ecology. Journal of Ecology, 102(4), 828–844.
Lajeunesse, M. J. (2011). On the meta-analysis of response ratios forstudies with correlated and multi-group designs. Ecology, 92(11),2049–2055.
Leeflang, P.S.H., Wieringa, J.E., Bijmolt, T.H.A., & Pauwels, K.H.(2015). Modeling markets; analyzing marketing phenomena andimproving marketing decision making. New York, NY: Springer.
J. of the Acad. Mark. Sci. (2020) 48:499–518 517

Leigh, T. W., MacKay, D. B., & Summers, J. O. (1984). Reliability andvalidity of conjoint analysis and self-explicated weights: A compar-ison. Journal of Marketing Research, 21(4), 456–462.
Lilien, G. (2016). L. (2016). The b2b knowledge gap. InternationalJournal of Research in Marketing, 33, 543–556.
List, J. A., & Gallet, C. A. (2001). What experimental protocol influencedisparities between actual and hypothetical stated values? Evidencefrom a meta-analysis. Environmental and Resource Economics,20(3), 241–254.
Lusk, J. L., & Schroeder, T. C. (2004). Are choice experiments incentivecompatible? A test with quality differentiated beef steaks. AmericanJournal of Agricultural Economics, 86(2), 467–482.
Miller, K. M., Hofstetter, R., Krohmer, H., & Zhang, Z. J. (2011). Howshould consumers’ willingness to pay be measured? An empiricalcomparison of state-of-the-art approaches. Journal of MarketingResearch, 48(1), 172–184.
Morris, S. B., & DeShon, R. P. (2002). Combining effect size estimates inmeta-analysis with repeated measures and independent-groups de-signs. Psychological Methods, 7(1), 105–125.
Murphy, J. J., Allen, P. G., Stevens, T. H., & Weatherhead, D. (2005). Ameta-analysis of hypothetical bias in stated preference valuation.Environmental and Resource Economics, 30(3), 313–325.
Nagle, T. T., & Müller, G. (2018). The strategy and tactics of pricing: Aguide to growing more profitably (6th ed.). New York, NY:Routledge.
Neill, H. R., Cummings, R. G., Ganderton, P. T., Harrison, G. W., &McGuckin, T. (1994). Hypothetical surveys and real economic com-mitments. Land Economics, 70(2), 145–154.
Noussair, C., Robin, S., & Ruffieux, B. (2004). Revealing consumers’willingness-to-pay: A comparison of the BDM mechanism and theVickrey auction. Journal of Economic Psychology, 25(6), 725–741.
Ockenfels, A., & Roth, A. E. (2006). Late and multiple bidding in secondprice internet auctions: Theory and evidence concerning differentrules for ending an auction. Games and Economic Behavior, 55(2),297–320.
Pebsworth, P. A., MacIntosh, A. J. J., Morgan, H. R., & Huffman, M. A.(2012). Factors influencing the ranging behavior of chacma baboons(papio hamadryas ursinus) living in a human-modified habitat.International Journal of Primatology, 33(4), 872–887.
Rutström, E. E. (1998). Home-grown values and incentive compatibleauction design. International Journal of Game Theory, 27(3),427–441.
Scheibehenne, B., Greifeneder, R., & Todd, P. M. (2010). Can there everbe too many options? A meta-analytic overview of choice overload.Journal of Consumer Research, 37(3), 409–425.
Schlag, N. (2008). Validierung der Conjoint-Analyse zur Prognose vonPreisreaktionen mithilfe realer Zahlungsbereitschaften. In Lohmar.Germany: Josef Eul Verlag.
Schlereth, C., & Skiera, B. (2017). Two new features in discrete choiceexperiments to improve willingness-to-pay estimation that result inSDR and SADR: Separated (adaptive) dual response. ManagementScience, 63(3), 829–842.
Shogren, J. F., Margolis, M., Koo, C., & List, J. A. (2001). A random nth-price auction. Journal of Economic Behavior & Organization,46(4), 409–421.
Sichtmann, C., Wilken, R., & Diamantopoulos, A. (2011). Estimatingwillingness-to-pay with choice-based conjoint analysis: Can con-sumer characteristics explain variations in accuracy? BritishJournal of Management, 22(4), 628–645.
Simon, H. (2018). Irrationals Verhalten. Interview. Harvard BusinessManager, 40(8), 52–54.
Steiner, M., & Hendus, J. (2012). How consumers’ willingness to pay ismeasured in practice: An empirical analysis of common approaches’relevance. Retrieved from SSRN: https://ssrn.com/abstract=2025618. Accessed 20 Aug 2018
Steiner, M., Eggert, A., Ulaga, W., & Backhaus, K. (2016). Do custom-ized service packages impede value capture in industrial markets?Journal of the Academy of Marketing Science, 44(2), 151–165.
Thompson, S. G., & Sharp, S. J. (1999). Explaining heterogeneity inmeta-analysis: A comparison of methods. Statistics in Medicine,18(20), 2693–2708.
Tully, S. M., & Winer, R. S. (2014). The role of the beneficiary in will-ingness to pay for socially responsible products: a meta-analysis.Journal of Retailing, 90(2), 255–274.
van den Noortgate, W., López-López, J. A., Marín-Martínez, F., &Sánchez-Meca, J. (2013). Three-level meta-analysis of dependenteffect sizes. Behavior Research Methods, 45(2), 576–594.
van Houwelingen, H. C., Arends, L. R., & Stijnen, T. (2002). Advancedmethods in meta-analysis: Multivariate approach and meta-regres-sion. Statistics in Medicine, 21(4), 589–624.
Vega, L. A., Koike, F., & Suzuki, M. (2010). Conservation study ofmyrsine seguinii in Japan: Current distribution explained by pastland use and prediction of distribution by land use-planning simula-tion. Ecological Research, 25(6), 1091–1099.
Vickrey, W. (1961). Counterspeculation, auctions, and competitive sealedtenders. Journal of Finance, 16(1), 8–37.
Viechtbauer, W. (2010). Conducting meta-analyses in R with the metaforpackage. Journal of Statistical Software, 36(3).
Völckner, F. (2006). Methoden zur Messung individuellerZahlungsbereitschaften: Ein Überblick zum State of the Art.Journal für Betriebswirtschaft, 56(1), 33–60.
Wang, T., Venkatesh, R., & Chatterjee, R. (2007). Reservation price as arange: An incentive-compatible measurement approach. Journal ofMarketing Research, 44(2), 200–213.
Wertenbroch, K., & Skiera, B. (2002). Measuring consumers’willingnessto pay at the point of purchase. Journal of Marketing Research,39(2), 228–241.
Wlömert, N., & Eggers, F. (2016). Predicting new service adoption withconjoint analysis: External validity of BDM-based incentive-alignedand dual-response choice designs. Marketing Letters, 27(1), 195–210.
Publisher’s note Springer Nature remains neutral with regard to jurisdic-tional claims in published maps and institutional affiliations.
J. of the Acad. Mark. Sci. (2020) 48:499–518518