Embed Size (px)
Citation preview

Accurately Identify and Quantify One Hundred Pesticides in a Single GC Run
Application Note
Author
Jessica Westland Agilent Technologies, Inc.
Abstract
A selected target compound list of 195 various pesticides was chosen for the evaluation of both the traditional time segment (TS) acquisition and the dMRM acquisition structures. Not only were the MRM acquisition setup procedures examined, but the acquired data were also evaluated. As sample complexity increases, the ability to use dMRM will provide laboratories with the capability to better tackle their large multi-analyte analysis, and to accurately quantify trace quantities of pesticides from high-throughput methods. The use of dynamic MRM (dMRM) acquisition method development provides users the ability to achieve equivalent or better quality data and results by:
• Monitoring the MRM transitions based on the compounds’ retention times as they elute from GC
• Reducing the number of MRM transitions active at any given time, allowing for longer dwell times
• Optimizing the dwell times to maintain a constant MS cycle time and constant sampling rate across all peaks

2
A selection of eight different matrices were analyzed. These commodities included yellow onion, navel orange, organic honey, basic cucumber, jasmine rice, fresh leaf baby spinach, black loose leaf tea, and extra virgin olive oil [3]. Each matrix was extracted with a specified QuEChERS methodology, in which various dispersive SPE (dSPE) were used for matrix cleanup (Table 1).
InstrumentationAll analyses were run on an Agilent 7890B GC equipped with an Agilent 7693B Autosampler and an Agilent 7010A Triple Quadrupole GC/MS. Table 2 displays the GC and backflush parameters, and Tables 3 and 4 show the MS/MS method parameters for TS and dMRM, respectively. The GC was configured with a multimode inlet (MMI) equipped with an 4 mm ultra inert, splitless, single taper, glass wool liner (p/n 5190-2293). From the inlet, two Agilent J&W HP-5ms Ultra Inert columns (15 m × 0.25 mm, 0.25 µm; p/n 19091S-431 UI) were coupled to each other through a purged ultimate union (PUU) for the use of midcolumn/post run backflushing (Figure 1).
IntroductionThe global agriculture industry uses over a thousand different pesticides for the production of food and foodstuffs. Producers require pesticides to meet the increasing demand for reasonably priced food. Analytical laboratories are then strained to evaluate and quantitate hundreds of pesticides in a single run. Currently, GC/MS/MS MRM analyses use time segment (TS) acquisition methods. TS methods focus on specified MRM transitions within a fixed retention time (RT) window. The more transitions in a time segment, the lower the dwell time and thus the sensitivity of the data acquired. Adding new compounds to the method usually results in redoing the time segments manually, and can be very time-consuming. Using the automated process of dynamic MRM (dMRM) acquisition saves a large amount of method development time. dMRM uses retention time locking (RLT) of the GC/MS system to set the RT of concurrent MRM transitions in a RT window. This automated procedure determines the number of these transitions to group in a RT window based on dwell criteria entered by the user to determine optimal sensitivity for the instrument.
Experimental
Sample preparationMany laboratories focused on pesticide residue analysis in food commodities routinely use the Quick, Easy, Cheap, Effective, Rugged, and Safe (QuEChERS) method [1,2]. This straightforward sample preparation allows for the analysis of hundreds of pesticides at low concentrations with a single extraction.
Table 1. Matrix Selection and Sample Preparation Used for Optimal MRM Application.Category Matrix Sample PrepHigh oil Extra virgin olive oil 3 g oil/7 mL water, EN salts (5982-5650), EMR—L (5982-1010), Polish Pouch (5982-0102), Dry stepDifficult Black loose leaf tea 3 g tea/7 mL water, EN salts, EN dSPE pigment (5982-5256)High pigment Fresh leaf baby spinach 10 g, EN salts, EN dSPE pigment (5982-5356)High starch Jasmine rice 3 g rice/7 mL water, EN salts, EN dSPE Fatty (5982-5156)High water Basic cucumber 10 g, EN salts, EN dSPE General (5982-5056)High sugar Organic honey 5 g honey/5 mL water, EN salts, EN dSPE General (5982-5056)High acid Navel orange 10 g, EN salts, EN dSPE Fatty (5982-5156)Clean 15 Yellow onion (not sweet) 10 g, EN salts, EN dSPE Fatty (5982-5156)
Figure 1. Column configuration for an optimal MRM application.
MMI15 m column 15 m column
Agilent 7010A Triple Quadrupole
GC/MS
Bleedline
EPC

3
MS Acquisition Method DevelopmentThe Agilent MassHunter Pesticide & Environmental Pollutant MRM Database (Rev. A.04.00) and Matrix Optimized Transitions [3] were used to develop the MRM acquisition methods for the evaluation of 195 target pesticides in each matrix (Figure 2). Both the 40 minute and 20 minute constant flow methods referenced in the MRM Database were followed. The top three (highest responding) MRMs for each compound were selected for analysis.
Table 2. Agilent 7890B GC method conditions.Parameter ValueMMI Injection mode Hot-splitlessInjection volume 1 µLInlet temperature 280 °CCarrier gas He, constant flow 1.00 mL/min
(column 2 = 1.20 mL/min)MS transfer line temperature 280 °COven program (40 minute method)
60 °C for 1 min 40 °C/min to 120 °C, 0 min 5 °C/min to 310 °C, 0 min
Oven program (20 minute method)
60 °C for 1 min 40 °C/min to 170 °C, 0 min 10 °C/min to 310 °C, 3 min
PUU Backflush settings*Timing 1.5 min duration during post runOven temperature 310 °CAux EPC pressure ~50 psiInlet pressure ~2 psi
* Backflush conditions are optimized for an application method in an Agilent Laboratory. A 1.5 minute backflush duration may be too short for other methods; recommendations can be made for a 5 minute backflush duration.
Table 3. Agilent 7010A Triple Quadrupole GC/MS time segment (TS) MRM parameters.Parameter ValueElectron energy 70 eVTune atunes.eihs.tune.xmLEM gain 10MS1 and MS2 resolution WideCollision cell 1.5 mL/min N2 and 2.25 mL/min He Quant/Qual transitions Matrix OptimizedDwell times Time Segment (TS) specific*Source temperature 300 °C**Quad temperatures 150 °C
* All dwells in each TS were given the same value (no value under 10 was set) to attain a scan rate of ~5 scans/sec for the TS.
** The recommended source temperature is 280 °C. The source temperature here was run hotter due to internal lab settings.
Table 4. Agilent 7010A Triple Quadrupole GC/MS dynamic MRM (dMRM) parameters.
* All dwells in each dMRM RT window were given the same value (no value under 10 was set) to attain a scan rate of ~5 scans/sec for the TS.
Parameter ValueElectron energy 70 eVTune atunes.eihs.tune.xmLEM gain 10MS1 and MS2 resolution dMRM unitCollision cell 1.5 mL/min N2 and 2.25 mL/min He Quant/Qual transitions Matrix optimizedDwell times Optimized by dMRM*Source temperature 300 °CQuad temperatures 150 °C
Figure 2. Screen capture of the top portion of the Target Compound List from the P&EP MRM Database (A.04.00).

4
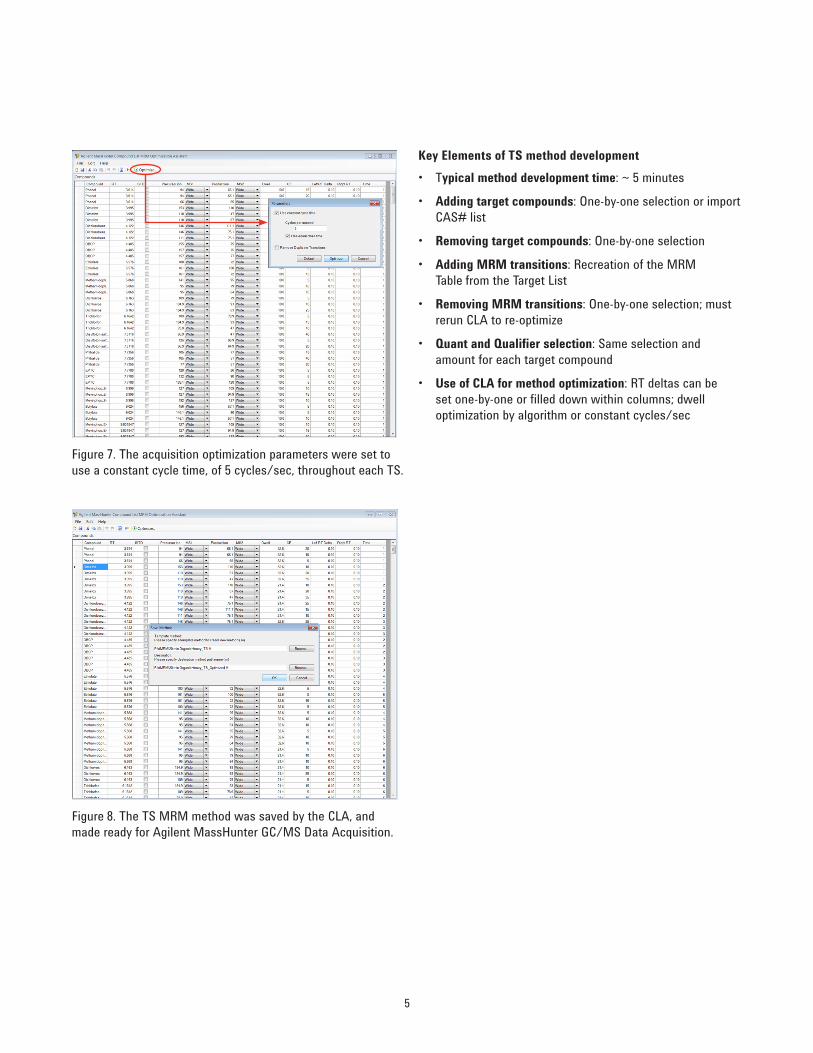
Once the MRM Table was completed, the Export for CLA Optimizer option was selected, and the CLA program was launched. The Database saved this export file as a .csv file, and was then imported into the CLA (Figure 6). The optimization parameters were set to use a constant cycle time of 5 msec throughout each TS (Figure 7). The RT deltas can also be edited within the CLA. The method was saved and loaded into MassHunter GC/MS Data Acquisition (DA) B.07.05 (Figure 8).
Time Segment Method DevelopmentTime segment acquisition development was completed using the graphical user interface (GUI) in the MRM Database and the MassHunter Compound List Assistant (CLA). The Organic Honey Matrix Optimized MRM Database was used as an example for the TS method development (Figure 3). After the Target List was created, the Build MRM Table option was selected (Figure 4). Two selections are needed for the development of the MRM Table:
• Method selection (the 40 minute constant flow method was selected in this example)
• Quantifier and qualifier ion selections (Figure 5)
Figure 3. The GUI Homepage of the Organic Honey Matrix Optimized MRM Database, used for TS method development.
Figure 4. Selecting Build MRM Table from the generated Target Compound List.
Figure 5. Two selections for MRM Table development: A) Method Selection (the 40 minute M7412AA method option was selected here); B) Quant and Qual Ion selections.
A
B
Figure 6. Exporting the MRM Table to a .csv file for the CLA.
5
Key Elements of TS method development• Typical method development time: ~ 5 minutes
• Adding target compounds: One-by-one selection or import CAS# list
• Removing target compounds: One-by-one selection
• Adding MRM transitions: Recreation of the MRM Table from the Target List
• Removing MRM transitions: One-by-one selection; must rerun CLA to re-optimize
• Quant and Qualifier selection: Same selection and amount for each target compound
• Use of CLA for method optimization: RT deltas can be set one-by-one or filled down within columns; dwell optimization by algorithm or constant cycles/sec
Figure 8. The TS MRM method was saved by the CLA, and made ready for Agilent MassHunter GC/MS Data Acquisition.
Figure 7. The acquisition optimization parameters were set to use a constant cycle time, of 5 cycles/sec, throughout each TS.

6
compounds and their respective MRMs (the same target list and ions were used as the TS method development). Once chosen, the MRMs are applied to the Import List (Figure 11). The Import List maintains all of the target compounds that are to be used in the method, and their respective MRMs. Once the target list is finalized, they are imported to the Method (Figure 12). The Method Acquisition page is where the RT deltas can be edited, the cycles/sec can be defined, and the dwell times are optimized (Figure 13). Figure 14 displays a view of the 20 minute dMRM acquisition method for the same Target List and respective MRMs.
dMRM Method DevelopmentdMRM acquisition development was completed using the MS Method Editor within MassHunter Workstation GC/MS Acquisition Software. From within the MS Parameters of MassHunter GC/MS Data Acquisition (B.07.05), the Organic Honey Matrix Optimized MRM Database was imported, and the 40 minute M7412AA constant flow method was selected (Figure 9). The MRM Acquisition Method page is where all of the target compounds for the method are shown (Figure 10). The Compound Browser was used to locate target
Figure 9. The Organic Honey Matrix Optimized MRM Database was imported into the MS Parameters of Agilent MassHunter GC/MS Data Acquisition B.07.05.
Figure 10. A blank Agilent MRM Acquisition Method page.

7
Figure 11. The compound browser displays all of the compounds and respective MRMs that are within the loaded Database.

8
Figure 12. The Import List maintains all of the target compounds and their respective MRMs that are intended for the acquisition method.

9
Figure 13. The Method Acquisition page shows the Target List and respective MRMs for the 40 minute method.
Figure 14. The Method Acquisition page shows the same Target List and respective MRMs for the 20 minute method.

10
Results and DiscussionThere are two ways to view the difference in the chromatographic displays:
• MassHunter Qualitative Analysis Software (B.07.00 SP1, or later)
• MassHunter Quantitative Analysis Software (B.07.01, or later)
Figures 19-26 show a selected representation of the 195 target compounds in various matrices. The concentration shown for the various target analytes ranged between 180-380 ppb. A higher concentration was used for viewing ability; further analysis was done showing that 90% of all target compounds achieved a calibration curve with R2 ≥ 0.990. All analyzed pesticides obtained a %RSD of repeated measurements of ≤30%, and 90% of the analyzed pesticides were found to have a limit of quantitation (LOQ) ≤1.5 pg/µL [3].
Key elements of dMRM method development• Typical method development time: ~5-10 minutes
depending on how detailed the MS method is
• Adding target compounds: One-by-one selection, group selection, or searching a CAS# list
• Removing target compounds: One-by-one or multiple selection
• Adding MRM transitions: One-by-one or multiple selection
• Removing MRM transitions: One-by-one or multiple selection removal
• Quant and qualifier selection: Same selection for all or choice for each target compound
• Use of MassHunter DA for method optimization: RT deltas can be set one-by-one or filled down within columns; dwell optimization by algorithm or user-defined settings
EvaluationThe dMRM acquisition method provides users with another way to set up their MS acquisition method parameters. Whether the user chooses to use TSs or the dMRM functionalities, they both aid in achieving optimal analysis. Figures 15-20 are various selected chromatograms that were observed and analyzed in both TS and dMRM acquisition methods.
Figure 15. Organic honey 40 minute analysis chromatogram of 195 target compounds with three MRM transitions per compound using the TS MS parameters.
4 6 8 10 12 14 16 18 20 22 24 26 28 30 32 34 360
0.10.20.30.40.50.60.70.80.91.01.11.21.31.41.51.61.71.81.92.0
×107
Acquisition time (min)
Coun
ts

11
Figure 16. Organic honey 40 minute analysis chromatogram of 195 target compounds with three MRM transitions per compound using the dMRM MS parameters.
4 6 8 10 12 14 16 18 20 22 24 26 28 30 32 34 360
0.10.20.30.40.50.60.70.80.91.01.11.21.31.41.51.61.71.81.92.0
×107
Acquisition time (min)
Coun
ts
Figure 17. Organic honey 20 minute analysis chromatogram of 195 target compounds with three MRM transitions per compound using the dMRM MS parameters.
4 5 6 7 8 9 10 11 12 13 14 15 16 17 180
0.4
0.8
1.2
1.6
2.0
2.4
2.8
3.2
3.6
4.0
4.4
4.8
5.2
×107
Acquisition time (min)
Coun
ts

12
4 5 6 7 8 9 10 11 12 13 14 15 16 17 180
×107
Acquisition time (min)
Coun
ts
0.10.20.30.40.50.60.70.80.91.01.11.21.31.41.51.61.7
Figure 18. Extra virgin olive oil 20 minute analysis chromatogram of 195 target compounds with three MRM transitions per compound using the dMRM MS parameters.
4 5 6 7 8 9 10 11 12 13 14 15 16 17 180
0.10.20.30.40.50.60.70.80.91.01.11.21.31.41.51.61.71.81.9
×107
Acquisition time (min)
Coun
ts
Figure 19. Navel orange 20 minute analysis chromatogram of 195 target compounds with three MRM transitions per compound using the dMRM MS parameters.

13
Figure 20. Fresh leaf baby spinach 20 minute analysis chromatogram of 195 target compounds with three MRM transitions per compound using the dMRM MS parameters.
4 5 6 7 8 9 10 11 12 13 14 15 16 17 180
0.2
0.4
0.6
0.8
1.0
1.2
1.4
1.6
1.8
2.0
2.2
2.4
×107
Acquisition time (min)
Coun
ts
Figure 21. Organic honey TS chromatogram of RT range (40 minute method) in Agilent MassHunter Qualitative Analysis.
10.85 10.90 10.95 11.00 11.05 11.10 11.15 11.20 11.25 11.30 11.35 11.40 11.45 11.50 11.55 11.60 11.65 11.70 11.75 11.80 11.850
0.20.40.60.81.01.21.41.61.82.02.22.42.62.83.03.23.43.63.8
×107
Acquisition time (min)
Coun
ts
14
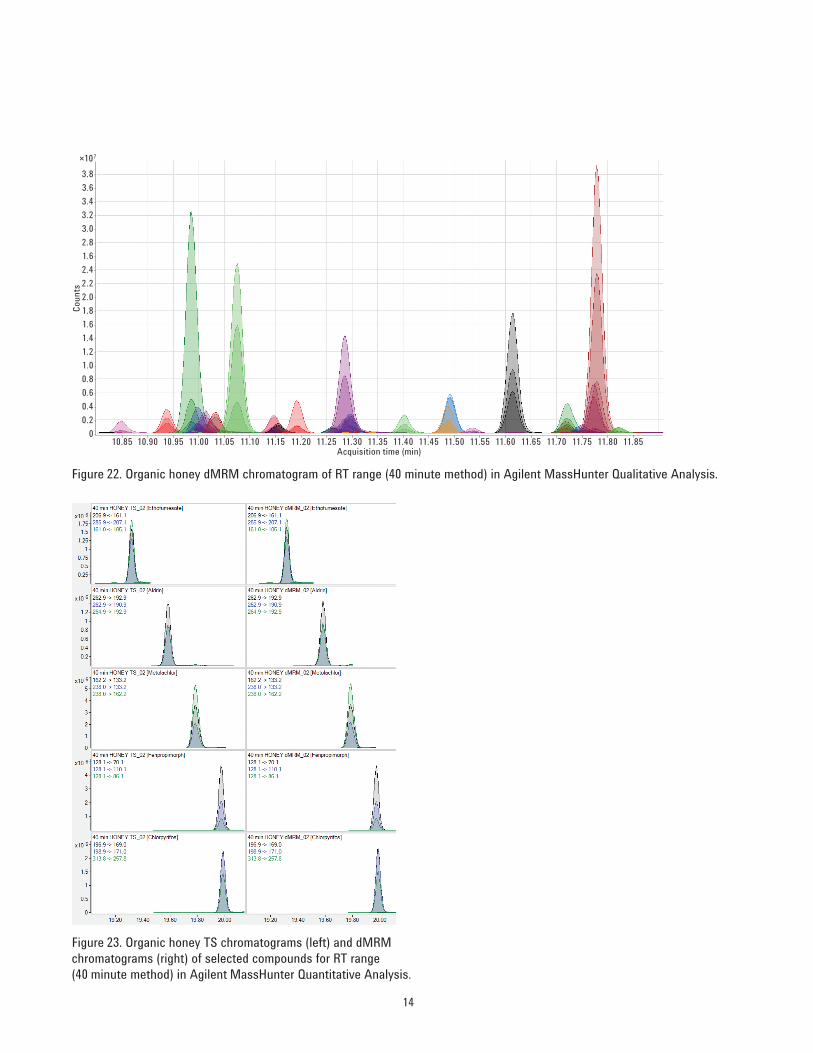
Figure 22. Organic honey dMRM chromatogram of RT range (40 minute method) in Agilent MassHunter Qualitative Analysis.
00.2
0.6
1.0
1.4
1.8
2.2
1.6
3.0
3.4
3.8
0.4
0.8
1.2
1.6
2.0
2.4
2.8
3.2
3.6
×107
Acquisition time (min)
Coun
ts
10.85 10.90 10.95 11.00 11.05 11.10 11.15 11.20 11.25 11.30 11.35 11.40 11.45 11.50 11.55 11.60 11.65 11.70 11.75 11.80 11.85
Figure 23. Organic honey TS chromatograms (left) and dMRM chromatograms (right) of selected compounds for RT range (40 minute method) in Agilent MassHunter Quantitative Analysis.

15
Figure 24. Organic honey TS chromatograms (left) and dMRM chromatograms (right) of selected compounds for RT range (40 minute method) in Agilent MassHunter Quantitative Analysis.

16
Figure 25. Organic honey TS chromatograms (left) and dMRM chromatograms (right) of selected compounds for RT range (20 minute method) in Agilent MassHunter Quantitative Analysis

17
Figure 26. Organic honey TS chromatograms (left) and dMRM chromatograms (right) of selected compounds for RT range (20 minute method) in Agilent MassHunter Quantitative Analysis.

www.agilent.com/chemAgilent shall not be liable for errors contained herein or for incidental or consequential damages in connection with the furnishing, performance, or use of this material.
Information, descriptions, and specifications in this publication are subject to change without notice.
© Agilent Technologies, Inc., 2016, 2017 Printed in the USA April 12, 2017 5991-7302EN
For More InformationThese data represent typical results. For more information on our products and services, visit our Web site at www.agilent.com/chem.
References1. Anastassiades, M.; Lehotay, S. J.; Štajnbaher, D.;
Schenck, F. S. J. AOAC Int. 2003, 86, 412-431.
2. Lehotay, S. J.; Mastovská, K.; Lightfield, A. R. J. AOAC Int. 2005, 88, 615-629.
3. Westland, J.; Stevens, J. An Optimal Method for the Analysis of Pesticides in a Variety of Matrices; Application note, Agilent Technologies, Inc. Publication number 5991-7303EN, 2016.
ConclusionsStandard GC/MS/MS Pesticide methods use TS acquisition methods with a gain of 10, dwell times of 10 msec, and 2-3 MRMs/compound. The Agilent MassHunter Data Acquisition’s dMRM functionality for MS acquisition method development provides users the ability to achieve equivalent or better quality data and results by:
• Monitoring the MRM transitions based on the compounds’ retention times as they elute from the GC
• Reducing the number of MRM transitions active at any given time allowing for longer dwell times
• Optimizing the dwell times to maintain a constant MS cycle time and constant sampling rate across all peaks
As sample complexity increases, the ability to use dMRM will provide laboratories with the capability to better tackle their large multi-analyte analysis, and to accurately quantify trace quantities of pesticides from high-throughput methods.