Embed Size (px)
Citation preview

Accuracy of transient elastography-FibroScans, acousticradiation force impulse (ARFI) imaging, the enhancedliver fibrosis (ELF) test, APRI, and the FIB-4 indexcompared with liver biopsy in patients with chronichepatitis CTaisa Grotta Ragazzo,I,* Denise Paranagua-Vezozzo,I Fabiana Roberto Lima,II Daniel Ferraz de Campos Mazo,I,II
Mario Guimaraes Pessoa,I Claudia Pinto Oliveira,I Venancio Avancini Ferreira Alves,III Flair Jose CarrilhoI
IDivisao de Gastroenterologia e Hepatologia Clinica, Departamento de Gastroenterologia, Hospital das Clinicas HCFMUSP, Faculdade de Medicina,
Universidade de Sao Paulo, Sao Paulo, SP, BR. IIDivisao de Gastroenterologia, Faculdade de Ciencias Medicas, Universidade Estadual de Campinas,
Campinas, SP, BR. IIIDepartamento de Patologia, Faculdade de Medicina FMUSP, Universidade de Sao Paulo, Sao Paulo, SP, BR.
OBJECTIVES: Although liver biopsy is the gold standard for determining the degree of liver fibrosis, issuesregarding its invasiveness and the small amount of liver tissue evaluated can limit its applicability andinterpretation in clinical practice. Non-invasive evaluation methods for liver fibrosis can address some of theselimitations. The aim of this study was to evaluate the accuracy of transient elastography-FibroScans, acousticradiation force impulse (ARFI), enhanced liver fibrosis (ELF), the aspartate aminotransferase-to-platelet ratioindex (APRI), and the FIB-4 index compared with liver biopsy in hepatitis C.
METHODS: We evaluated chronic hepatitis C patients who were followed at the Division of Clinical Gastroenter-ology and Hepatology, Hospital das Clınicas, Department of Gastroenterology of University of Sao Paulo School ofMedicine, Sao Paulo, Brazil, and who underwent liver biopsy. The accuracy of each method was determined by areceiver operating characteristic (ROC) curve analysis, and fibrosis was classified as significant fibrosis (XF2),advanced fibrosis (XF3), or cirrhosis (F4). The Obuchowski method was also used to determine the diagnosticaccuracy of each method at the various stages of fibrosis. In total, 107 FibroScans, 51 ARFI, 68 ELF, 106 APRI, and106 FIB-4 analyses were performed.
RESULTS: A total of 107 patients were included in the study. The areas under the ROC curve (AUROCs) accordingto fibrosis degree were as follows: significant fibrosis (XF2): FibroScans: 0.83, FIB-4: 0.76, ELF: 0.70, APRI: 0.69,and ARFI: 0.67; advanced fibrosis (XF3): FibroScans: 0.85, ELF: 0.82, FIB-4: 0.77, ARFI: 0.74, and APRI: 0.71; andcirrhosis (F4): APRI: 1, FIB-4: 1, FibroScans: 0.99, ARFI: 0.96, and ELF: 0.94. The accuracies of transient elasto-graphy, ARFI, ELF, APRI and FIB-4 determined by the Obuchowski method were F0-F1: 0.81, 0.78, 0.44, 0.72 and0.67, respectively; F1-F2: 0.73, 0.53, 0.62, 0.60, and 0.68, respectively; F2-F3: 0.70, 0.64, 0.77, 0.60, and 0.67,respectively; and F3-F4: 0.98, 0.96, 0.82, 1, and 1, respectively.
CONCLUSION: Transient elastography remained the most effective method for evaluating all degrees of fibrosis.The accuracy of all methodologies was best at F4.
KEYWORDS: Hepatitis C Chronic; Liver Cirrhosis; Elastography; Biomarkers/Blood; Disease Progression;Data Accuracy.
Ragazzo TG, Paranagua-Vezozzo D, Lima FR, Mazo DF, Pessoa MG, Oliveira CP, et al. Accuracy of transient elastography-FibroScans, acousticradiation force impulse (ARFI) imaging, the enhanced liver fibrosis (ELF) test, APRI, and the FIB-4 index compared with liver biopsy in patientswith chronic hepatitis C. Clinics. 2017;72(9):516-525
Received for publication on December 15, 2016; First review completed on February 9, 2017; Accepted for publication on March 15, 2017
*Corresponding author. E-mail: [email protected]
’ INTRODUCTION
There are approximately 130 to 150 million carriers of thehepatitis C virus (HCV) worldwide. Approximately 55-85%of patients with HCV develop the chronic form of the disease,and approximately 15-30% of these patients are at risk ofdeveloping cirrhosis within 20 years of diagnosis. Approxi-mately 300,000-500,000 people die each year as a result ofDOI: 10.6061/clinics/2017(09)01
Copyright & 2017 CLINICS – This is an Open Access article distributed under theterms of the Creative Commons License (http://creativecommons.org/licenses/by/4.0/) which permits unrestricted use, distribution, and reproduction in anymedium or format, provided the original work is properly cited.
No potential conflict of interest was reported.
516
CLINICAL SCIENCE

complications arising from HCV (1). In Brazil, hepatocellularcarcinoma (HCC) is one of the most frequent complicationsof cirrhosis caused by HCV (2,3).Liver biopsy is still considered the gold standard for liver
tissue evaluation, allowing the ascertainment not only ofthe degree of fibrosis but also of other important parame-ters, such as inflammation, necrosis, steatosis, and the pre-sence of hepatic iron in the sample obtained (4). However,liver biopsy is an invasive procedure that carries risks,sometimes causing pain, hemorrhage, and even death,among other complications (5). Issues regarding the qualityof the liver samples and interpretation of the results canalso occur. The quality of a liver biopsy is generally relatedto the length and number of portal spaces evaluated (6,7).The results of the pathological anatomy can vary accord-ing to the subjective interpretation of the individual patho-logist (8).Due to these limitations, non-invasive methods of liver
fibrosis evaluation have been studied intensely and haveimproved over recent decades. These methods can be divi-ded into two categories, namely, indirect markers, which canbe assessed by routine clinical exams (e.g., aminotransferasesand platelet count) (9), and direct markers, which includeserum levels of substances involved in the molecular patho-genesis of fibrosis, such as matrix metalloproteinases, hyalu-ronic acid, and cytokines [tumor necrosis factor a (TNF-a)and transforming growth factor b (TGF-b)] (10).Elastography methods use an existing modality, such as
ultrasound (US), to observe the internal tissue deformationsthat occur in response to an applied force and convert theresulting information to a suitable form for display. A widevariety of approaches have evolved, both for applyingthe force and for measuring and displaying the tissue’sresponse after applying a force that is either dynamic(e.g., by thumping or vibrating) or that varies so slowly thatit is considered "quasi-static" (e.g., by probe palpation). Thedeformation may be represented in an elasticity image(elastogram) or as a local measurement of tissue displace-ment that may be detected and displayed directly [AcousticRadiation Force Impulse (ARFI) imaging]. Another form ofrepresentation is through the regional values of their speed(without making images) using methods referred to herein astransient elastography (TE) (11).The aim of this study was to evaluate the accuracy of
TE-FibroScans, ARFI imaging, enhanced liver fibrosis (ELF),the aspartate aminotransferase-to-platelet ratio index (APRI),and FIB-4 compared with liver biopsy in chronic hepatitis Cpatients.
’ PATIENTS AND METHODS
We performed a prospective study evaluating treatment-naive patients chronically infected with HCV, who were onthe waiting list for liver biopsy at the outpatient clinic of theDivision of Clinical Gastroenterology and Hepatology, Hospi-tal das Clínicas, Department of Gastroenterology of Univer-sity of São Paulo School of Medicine, São Paulo, Brazil(HC-FMUSP), from August 3, 2012, to May 31, 2014. A total of107 patients were included, with 107 liver biopsies, 107 TEexams, 106 APRI and FIB-4 exams, 68 ELF exams and 51 ARFIexams performed.The liver biopsies were performed with a 14-G Tru-Cutt
needle (15cm) (Medical Technology, Gainesville, FL, USA).Liver histology was examined by the same experienced liver
pathologist from the Department of Pathology of HC-FMUSPto avoid operator bias in the analysis. The selected sampleshad a minimum of 5 portal spaces (a mean of 13 portal spaces:43 biopsies had between 5 and 10 portal spaces and 64 hadbetween 11 and more than 35 portal spaces) and a mean sizeof 15 mm (varying between 7 and 23 mm). The classifica-tion score used for analysis of the biopsies was the METAVIRscore (12).The inclusion criteria were as follows: 1. HCV PCR-RNA
positivity for at least 6 months and a clinical or histopatho-logical diagnosis of treatment- naive HCV; 2. negativeserological test for hepatitis B or HIV co-infection; and3. representative liver biopsy (minimum of 5 portal spaces,non-subcapsular fragment) performed 60 days prior tothe exams. The exclusion criteria were as follows: 1. refusalto provide informed consent; 2. patient under 18 or over70 years of age; 3. unavailability of liver biopsy (contra-indication); 4. biopsies performed more than 60 days beforethe evaluation; 5. non-representative liver biopsy; 6. clinicalsuspicion or image evidence of HCC; 7. ascites; 8. body massindex (BMI) X30kg/m2 and 9. previous treatment for HCV.10. unreliable FibroScans results (as described later).The following examinations were utilized for fibrosis
evaluation: TE-FibroScans, ARFI, ELF, APRI, and FIB-4.FibroScans was developed by Echosens (Paris, France) in
2003 (13). The equipment consists of a 5-MHz US transducercoupled to a base with a vibratory axis, and it uses VCTEtechnology (elastography technology with velocity-control-led impulses). The vibration emitted by the transducer isof medium amplitude (2 mm) and low frequency (50 Hz).It produces a wave through the liver tissue, which allowsestimation of the elasticity of the hepatic parenchymathrough the equation E=3pV2, where: E=elasticity, p=density(a constant in tissue), and V=velocity of wave propagation.The denser the tissue, the faster the wave propagates. Theresults of liver elasticity measurements are expressed inkilopascals (kPa) in an interval of 2.5-75 kPa. The sectionanalyzed corresponds to a cylinder 1 cm in diameter and4 cm in length, corresponding to a volume 100-fold largerthan that obtained with liver biopsy (11,13-15). A liver stif-fness assessment is generally considered reliable when thefollowing criteria are fulfilled: 10 valid measurements, suc-cess rate 460%, and ratio of the interquartile range to themedian (IQR/M) p30% (16-18). Patients with invalid/ unre-liable measurements were excluded from the study. The TEexaminations in this study were performed by the sameexperienced and highly trained operator, thus eliminatingthe risk of inter-observer bias. All patients fasted for at leastthree hours prior to examination because the FibroScans
reading (in kPa) varies immediately following food con-sumption, altering the result (19). The inclusion criteria ofBMIp30 kg/m2 and skin-liver distance are factors that affectthe choice of transducer used. The M transducer was used forall TE examinations in this study to avoid potential bias ininterpreting the results in kPa because when both the M, andXL transducers are used, different results can occur (20-22).ARFI imaging (Siemens Acuson S2000, Virtual Touchä tis-
sue quantification; Siemens, Erlangen, Germany) is anothertool for evaluating liver stiffness that can be incorporatedinto a conventional US machine. Transducers sensitive to thepropagation of acoustic pulses of a frequency of 2.67 Hzgenerate shear waves that propagate in the tissue perpendi-cular to the direction of the acoustic impulse. The shearwaves are then tracked using US based on correlation in a
517
CLINICS 2017;72(9):516-525 Accuracy of transient elastrographyRagazzo TG et al.

small region of interest (ROI) of 5 mm x 10 mm, which theoperator can easily locate in the field of vision up to a depthof 8 cm with a convex catheter. This allows the detection ofliver stiffness through the velocity of propagation of theshear wave, which is linearly correlated with the stiffness ofthe liver (11,23,24). The results are expressed in meters persecond (m/s) with an interval scale of 0.5-4.4 m/s andprecision of ±20% related to the interval (25). A result isconsidered high quality when 10 valid measurements arerecorded with an IQR/M ratio o30% and a success rate ofX60% (26). The examination is performed at the height ofthe medial axillary line and the xiphoid appendage with aprojection of S8.As a direct method utilizing biomarkers in the blood,
ELF is a serum test that yields a single value, combiningquantitative measures of hyaluronic acid (HA), pro-peptideamino-terminal of pro-collagen type III (PIIINP), and tissueinhibitor metalloproteinase 1 (TIMP-1) in human serum inan algorithm (10,27). The ADVIA Centaurs CP was usedfor ELF, following formula was applied to yield results:2.494+0.846 In (C HA) + 0.735 In (C PIIINP) + 0.391 In(C TIMP-1).Regarding the methods using indirect biomarkers, APRI
and FIB-4 were calculated through the following scores:APRI score= [(AST/ULN) 100]/platelet count 109/L. (28)(ULN: upper limit of normal)FIB-4 score= {[age (yr) x AST (U/L)] / [platelet count (109/L)
x ALT (U/L)]} (29)The study was approved by the Ethics Committee of HC-
FMUSP. Of the 250 patients eligible for the study, 143 wereexcluded for various reasons, as described in Figure 1. Amongthe patients with liver biopsy, 20 were excluded due to non-representative liver histology (o5 portal spaces and/or non-subcapsular fragment), and 5 patients were excluded becauseof unreliable FibroScans results (one patient presented withnarrow intercostal space, 3 patients had IQR/M 430%and one patient had an exam success rate o60%). A total of107 patients were included, as shown in Figure 1.
Statistical analysesThe R package version 3.2.1(R Core Team, Vienna, Austria)
was used for statistical and graph analyses. The performanceof the non-invasive methods was estimated using ROCcurves (using the package pROC version 1.8) by identifyingthe optimal cut-off points of different degrees of liver fibrosisin terms of sensitivity and specificity. The area under theROC curve (AUROC) indicates the accuracy of the studiedmethods. The Obuchowski method was used to determinethe accuracy of the non-invasive methods of liver fibrosisevaluation (30,31)
Comparative analyses of more than two groups wereperformed using analysis of variance (ANOVA), the Levenestatistic and the Kruskal-Wallis test. For multiple analyses,or analyses of two groups with more than two other groups,the Tukey and non-parametric Tukey tests were used. Forqualitative (categorical) variables, Fisher’s exact test andthe chi-squared test were used. Statistical significance wasdefined as po0.05.
’ RESULTS
A total of 107 patients were included. The population’sgender was 50.4% (n=54) female, with 67.2% (n=72) of whiteethnicity and 31.7% (n=34) of black ethnicity. In terms ofexposure to HCV, 27.2% (n=29) had a history of blood trans-fusion and 25.2% (n=27) contracted the virus through tattooing.Genotype 1 was the most common, found in 81.9% of cases.One of the assessed patients had genotype 1 and genotype 2co-infection. The degree of fibrosis according to the METAVIRscale was as follows: F0=7.4% (n=8), F1=40.1% (n=43), F2=28.9%(n=31), F3=21.5% (n=23), and F4=1.8% (n=2). Table 1 showsanthropometric and laboratory data according to the degree offibrosis, demonstrating the importance of clinical and laboratoryparameters according to liver disease severity.
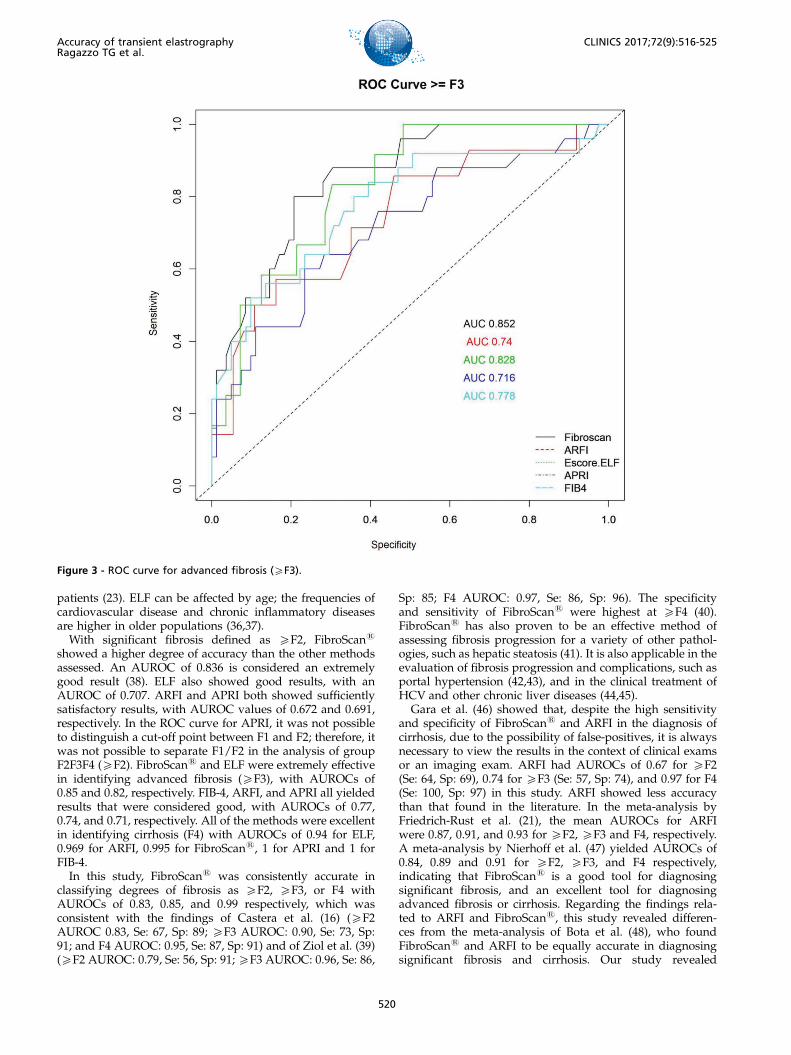
Figures 2, 3 and 4 and Tables 2, 3 and 4 present ROCcurves and statistical characteristics for significant fibrosis(XF2), advanced fibrosis (XF3) and cirrhosis (F4), respectively.
Figure 1 - Flowchart of study population enrollment.HCV= hepatitis C virus, HCC= hepatocellular carcinoma.
518
Accuracy of transient elastrographyRagazzo TG et al.
CLINICS 2017;72(9):516-525
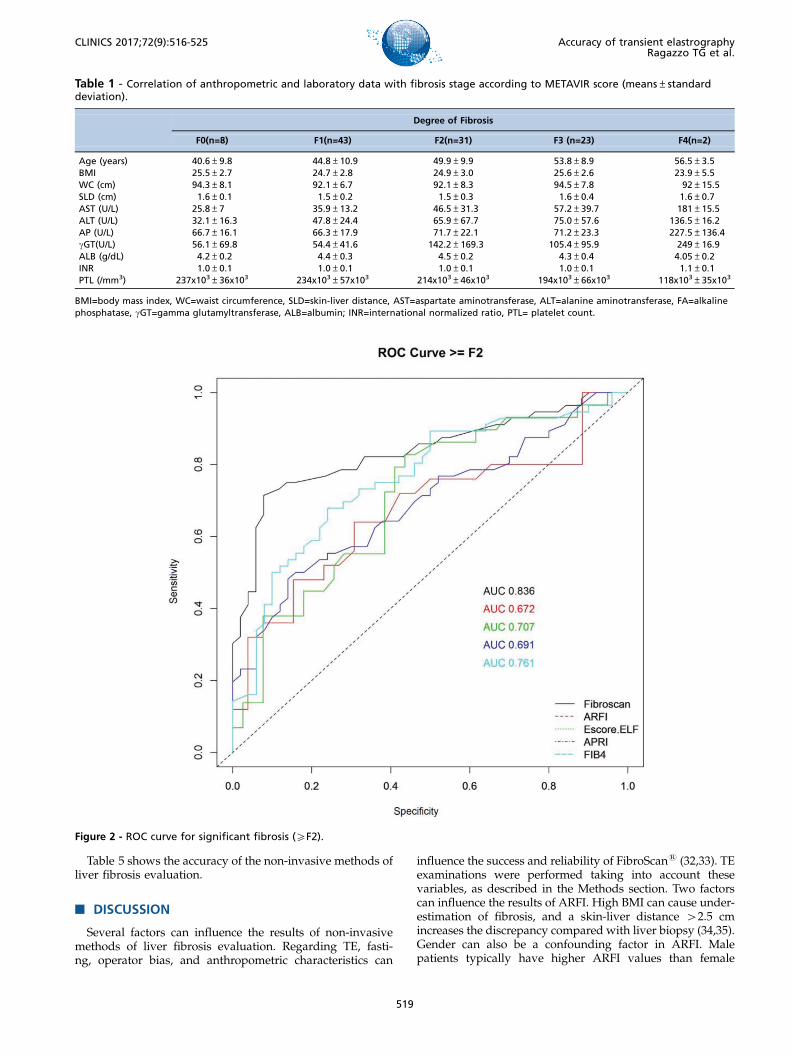
Table 5 shows the accuracy of the non-invasive methods ofliver fibrosis evaluation.
’ DISCUSSION
Several factors can influence the results of non-invasivemethods of liver fibrosis evaluation. Regarding TE, fasti-ng, operator bias, and anthropometric characteristics can
influence the success and reliability of FibroScans (32,33). TEexaminations were performed taking into account thesevariables, as described in the Methods section. Two factorscan influence the results of ARFI. High BMI can cause under-estimation of fibrosis, and a skin-liver distance 42.5 cmincreases the discrepancy compared with liver biopsy (34,35).Gender can also be a confounding factor in ARFI. Malepatients typically have higher ARFI values than female
Table 1 - Correlation of anthropometric and laboratory data with fibrosis stage according to METAVIR score (means±standarddeviation).
Degree of Fibrosis
F0(n=8) F1(n=43) F2(n=31) F3 (n=23) F4(n=2)
Age (years) 40.6±9.8 44.8±10.9 49.9±9.9 53.8±8.9 56.5±3.5BMI 25.5±2.7 24.7±2.8 24.9±3.0 25.6±2.6 23.9±5.5WC (cm) 94.3±8.1 92.1±6.7 92.1±8.3 94.5±7.8 92±15.5SLD (cm) 1.6±0.1 1.5±0.2 1.5±0.3 1.6±0.4 1.6±0.7AST (U/L) 25.8±7 35.9±13.2 46.5±31.3 57.2±39.7 181±15.5ALT (U/L) 32.1±16.3 47.8±24.4 65.9±67.7 75.0±57.6 136.5±16.2AP (U/L) 66.7±16.1 66.3±17.9 71.7±22.1 71.2±23.3 227.5±136.4gGT(U/L) 56.1±69.8 54.4±41.6 142.2±169.3 105.4±95.9 249±16.9ALB (g/dL) 4.2±0.2 4.4±0.3 4.5±0.2 4.3±0.4 4.05±0.2INR 1.0±0.1 1.0±0.1 1.0±0.1 1.0±0.1 1.1±0.1PTL (/mm3) 237x103±36x103 234x103±57x103 214x103±46x103 194x103±66x103 118x103±35x103
BMI=body mass index, WC=waist circumference, SLD=skin-liver distance, AST=aspartate aminotransferase, ALT=alanine aminotransferase, FA=alkalinephosphatase, gGT=gamma glutamyltransferase, ALB=albumin; INR=international normalized ratio, PTL= platelet count.
Figure 2 - ROC curve for significant fibrosis (XF2).
519
CLINICS 2017;72(9):516-525 Accuracy of transient elastrographyRagazzo TG et al.
patients (23). ELF can be affected by age; the frequencies ofcardiovascular disease and chronic inflammatory diseasesare higher in older populations (36,37).With significant fibrosis defined as XF2, FibroScans
showed a higher degree of accuracy than the other methodsassessed. An AUROC of 0.836 is considered an extremelygood result (38). ELF also showed good results, with anAUROC of 0.707. ARFI and APRI both showed sufficientlysatisfactory results, with AUROC values of 0.672 and 0.691,respectively. In the ROC curve for APRI, it was not possibleto distinguish a cut-off point between F1 and F2; therefore, itwas not possible to separate F1/F2 in the analysis of groupF2F3F4 (XF2). FibroScans and ELF were extremely effectivein identifying advanced fibrosis (XF3), with AUROCs of0.85 and 0.82, respectively. FIB-4, ARFI, and APRI all yieldedresults that were considered good, with AUROCs of 0.77,0.74, and 0.71, respectively. All of the methods were excellentin identifying cirrhosis (F4) with AUROCs of 0.94 for ELF,0.969 for ARFI, 0.995 for FibroScans, 1 for APRI and 1 forFIB-4.In this study, FibroScans was consistently accurate in
classifying degrees of fibrosis as XF2, XF3, or F4 withAUROCs of 0.83, 0.85, and 0.99 respectively, which wasconsistent with the findings of Castera et al. (16) (XF2AUROC 0.83, Se: 67, Sp: 89; XF3 AUROC: 0.90, Se: 73, Sp:91; and F4 AUROC: 0.95, Se: 87, Sp: 91) and of Ziol et al. (39)(XF2 AUROC: 0.79, Se: 56, Sp: 91; XF3 AUROC: 0.96, Se: 86,
Sp: 85; F4 AUROC: 0.97, Se: 86, Sp: 96). The specificityand sensitivity of FibroScans were highest at XF4 (40).FibroScans has also proven to be an effective method ofassessing fibrosis progression for a variety of other pathol-ogies, such as hepatic steatosis (41). It is also applicable in theevaluation of fibrosis progression and complications, such asportal hypertension (42,43), and in the clinical treatment ofHCV and other chronic liver diseases (44,45).
Gara et al. (46) showed that, despite the high sensitivityand specificity of FibroScans and ARFI in the diagnosis ofcirrhosis, due to the possibility of false-positives, it is alwaysnecessary to view the results in the context of clinical examsor an imaging exam. ARFI had AUROCs of 0.67 for XF2(Se: 64, Sp: 69), 0.74 for XF3 (Se: 57, Sp: 74), and 0.97 for F4(Se: 100, Sp: 97) in this study. ARFI showed less accuracythan that found in the literature. In the meta-analysis byFriedrich-Rust et al. (21), the mean AUROCs for ARFIwere 0.87, 0.91, and 0.93 for XF2, XF3 and F4, respectively.A meta-analysis by Nierhoff et al. (47) yielded AUROCs of0.84, 0.89 and 0.91 for XF2, XF3, and F4 respectively,indicating that FibroScans is a good tool for diagnosingsignificant fibrosis, and an excellent tool for diagnosingadvanced fibrosis or cirrhosis. Regarding the findings rela-ted to ARFI and FibroScans, this study revealed differen-ces from the meta-analysis of Bota et al. (48), who foundFibroScans and ARFI to be equally accurate in diagnosingsignificant fibrosis and cirrhosis. Our study revealed
Figure 3 - ROC curve for advanced fibrosis (XF3).
520
Accuracy of transient elastrographyRagazzo TG et al.
CLINICS 2017;72(9):516-525

FibroScans to be superior to ARFI in diagnosing significantfibrosis. Perhaps the predominance in this study of fibrosisat stages F0, F1, and F2 could account for this divergencefrom the literature. However, there are studies that foundequivalency between FibroScans and ARFI for diagnosingadvanced fibrosis and cirrhosis but that revealed FibroScans
as the better choice for identifying significant fibrosis (49).In two comparative analyses (50,51), both ARFI and APRIdemonstrated the ability to evaluate the progression ofadvanced fibrosis and cirrhosis in HCV, with ARFI exhibitingslightly better accuracy (50,51).For ELF, we found AUROCs of 0.71 for XF2 fibrosis
(Se: 82, Sp: 56), 0.82 for XF3 fibrosis (Se: 83, Sp: 69), and 0.94for F4 fibrosis (Se: 100, Sp: 100). Despite presenting inferioraccuracy for XF2 fibrosis compared with other studies(10,52), ELF produced results similar to those of Parkes et al.(53), with AUROCs of 0.74, 0.84 and 0.90 for XF2, XF3, andF4 fibrosis, respectively, in a specific HCV population. Faganet al. (54) found that a cut-off score for ELF of X9.8 had asensitivity of 74.4% and a specificity of 92.4% for advancedfibrosis. In this study, the cut-off for XF3 fibrosis was 9.4with Se=83 and Sp=69.In the present study, APRI had a XF3 AUROC: 0.71 and
an F4 AUROC of 1. This result differ from the original work,which revealed a XF3 AUROC of 0.88 and an F4 AUROC of0.94 (24). APRI could not identify the individual stages of
fibrosis, and the fibrosis of some patients remained unclassi-fied when the initial cut-off was applied. Furthermore, theappropriate definition of the limits of normal AST remainsuncertain. Each laboratory establishes a different value forthe upper limit of normal (55). APRI and FIB-4 are excellentfor cirrhosis, but care should be taken with regard to thefew patients who have test results close to normal levels.These patients are at risk for false-negative results; therefore,the tests should be performed alongside imaging examina-tions (56).Among the various comparative studies of non-invasive
methods of liver fibrosis assessment, Crisan et al. (57)showed good results for the accuracy of APRI, FIB-4, andFibroScans in diagnosing XF3 fibrosis. Peterson et al. (58)evaluated APRI and ELF in case of significant fibrosis.That study differed from the others in that it did not usethe METAVIR classification, but it demonstrated thatone methodology can complement the others in some cases.Poynard et al. (59) conducted a meta-analysis of a variety ofchronic liver diseases and confirmed the accuracy of FIB-4and APRI in identifying advanced fibrosis and cirrhosis inHCV.The results using the Obuchowski method revealed the
degree of fibrosis, and it was impossible to distinguishbetween significant fibrosis, advanced fibrosis, and cirrhosis.In almost all stages of fibrosis, FibroScans was the most
Figure 4 - ROC curve for cirrhosis (F4).
521
CLINICS 2017;72(9):516-525 Accuracy of transient elastrographyRagazzo TG et al.

Table
2-Statisticalch
aracteristicsofsignificantfibrosis(X
F2).
FibroScans
ARFI
ELF
APRI
FIB4
Estim
ate
95%
CI
Estim
ate
95%
CI
Estim
ate
95%
CI
Estim
ate
95%
CI
Estim
ate
95%
CI
cut-off
6.5
kPa
1.22m/s2
8.98
0.67
1.29
Se0.71
0.58-0.83
0.64
0.43-0.82
0.83
0.64-0.94
0.48
0.35-0.62
0.68
0.54-0.8
Sp0.92
0.81-0.98
0.69
0.48-0.86
0.56
0.4
-0.72
0.86
0.73-0.94
0.76
0.62-0.87
PPV
0.91
0.79-0.95
0.67
0.45-0.84
0.59
0.42-0.83
0.79
0.63-0.87
0.76
0.62-0.85
NPV
0.75
0.62-0.92
0.67
0.45-0.84
0.81
0.62-0.9
0.6
0.46-0.8
0.68
0.54-0.82
dlr.positive
9.11
3.5
-23.67
2.08
1.09-3.97
1.9
1.28-2.81
3.44
1.65-7.21
2.83
1.67-4.78
dlr.negative
0.31
0.2
-0.47
0.52
0.29-0.93
0.31
0.13-0.71
0.6
0.46-0.79
0.42
0.28-0.64
AUROC
0.83
0.75-0.91
0.67
0.51-0.82
0.70
0.58-0.83
0.69
0.59-0.79
0.76
0.66-0.85
Se=sensitivity,Sp
=specificity,PPV=positive
predictive
value,NPV=negative
predictive
value,dlr.positive
=likelihoodratiopositive
,dlr.negative
=likelihoodrationegative
,AUROC=areaundertheROCcu
rve.
Table
3-Statisticalch
aracteristicsofadva
ncedfibrosis(X
F3).
FibroScans
ARFI
ELF
APRI
FIB4
Estim
ate
95%
CI
Estim
ate
95%
CI
Estim
ate
95%
CI
Estim
ate
95%
CI
Estim
ate
95%
CI
cut-off
7.1kPa
1.41m/s2
9.47
0.67
1.22
Se0.8
0.59-0.93
0.57
0.29-0.82
0.83
0.52-0.98
0.6
0.39-0.79
0.84
0.64-0.95
Sp0.79
0.69-0.87
0.84
0.68-0.94
0.7
0.56-0.81
0.77
0.66-0.85
0.6
0.49-0.71
PPV
0.54
0.41-0.8
0.57
0.35-0.82
0.37
0.25-0.85
0.44
0.32-0.66
0.4
0.29-0.72
NPV
0.93
0.83-0.96
0.84
0.61-0.94
0.95
0.81-0.97
0.86
0.72-0.92
0.92
0.81-0.95
dlr.positive
3.86
2.42-6.15
3.52
1.49-8.34
2.75
1.71-4.39
2.56
1.54-4.25
2.13
1.55-2.93
dlr.negative
0.25
0.11-0.56
0.51
0.27-0.95
0.24
0.07-0.86
0.52
0.32-0.86
0.26
0.11-0.66
AUROC
0.85
0.77-0.92
0.74
0.57-0.90
0.82
0.71-0.93
0.71
0.59-0.83
0.77
0.66-0.89
Se=sensitivity,Sp
=specificity,PPV=positive
predictive
value,NPV=negative
predictive
value,dlr.positive
=likelihoodratiopositive
,dlr.negative
=likelihoodrationegative
,AUROCareaundertheROCcu
rve.
522
Accuracy of transient elastrographyRagazzo TG et al.
CLINICS 2017;72(9):516-525
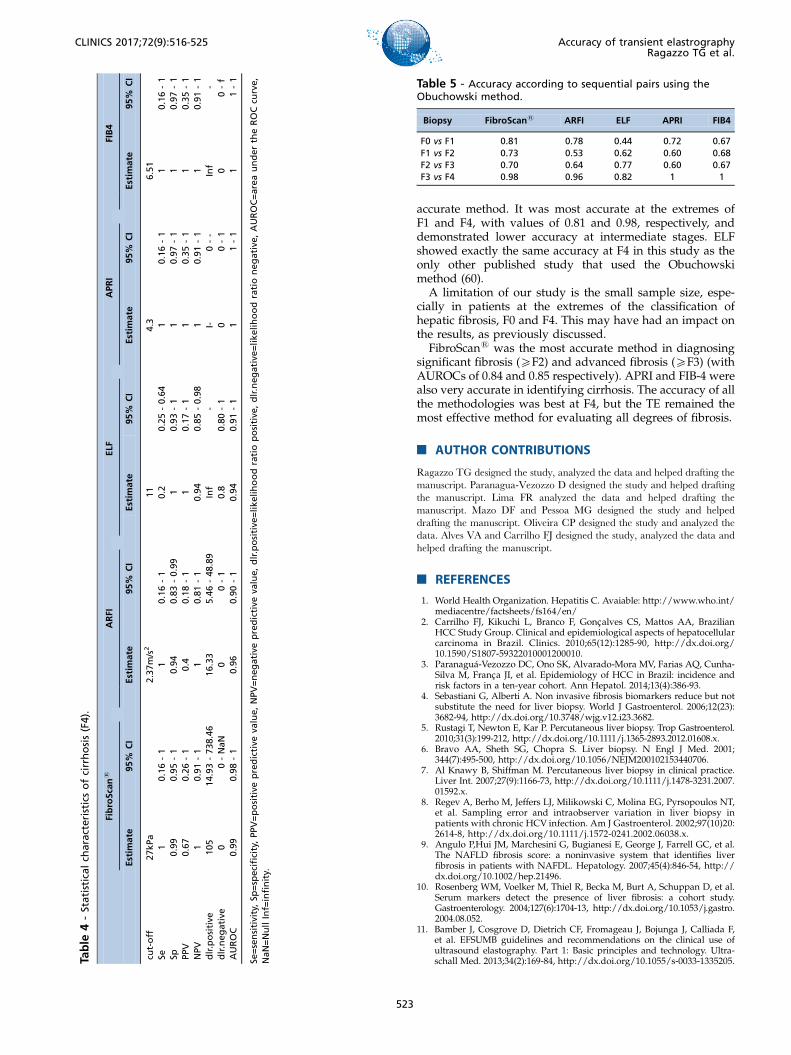
accurate method. It was most accurate at the extremes ofF1 and F4, with values of 0.81 and 0.98, respectively, anddemonstrated lower accuracy at intermediate stages. ELFshowed exactly the same accuracy at F4 in this study as theonly other published study that used the Obuchowskimethod (60).A limitation of our study is the small sample size, espe-
cially in patients at the extremes of the classification ofhepatic fibrosis, F0 and F4. This may have had an impact onthe results, as previously discussed.FibroScans was the most accurate method in diagnosing
significant fibrosis (XF2) and advanced fibrosis (XF3) (withAUROCs of 0.84 and 0.85 respectively). APRI and FIB-4 werealso very accurate in identifying cirrhosis. The accuracy of allthe methodologies was best at F4, but the TE remained themost effective method for evaluating all degrees of fibrosis.
’ AUTHOR CONTRIBUTIONS
Ragazzo TG designed the study, analyzed the data and helped drafting themanuscript. Paranagua-Vezozzo D designed the study and helped draftingthe manuscript. Lima FR analyzed the data and helped drafting themanuscript. Mazo DF and Pessoa MG designed the study and helpeddrafting the manuscript. Oliveira CP designed the study and analyzed thedata. Alves VA and Carrilho FJ designed the study, analyzed the data andhelped drafting the manuscript.
’ REFERENCES
1. World Health Organization. Hepatitis C. Avaiable: http://www.who.int/mediacentre/factsheets/fs164/en/
2. Carrilho FJ, Kikuchi L, Branco F, Goncalves CS, Mattos AA, BrazilianHCC Study Group. Clinical and epidemiological aspects of hepatocellularcarcinoma in Brazil. Clinics. 2010;65(12):1285-90, http://dx.doi.org/10.1590/S1807-59322010001200010.
3. Paranaguá-Vezozzo DC, Ono SK, Alvarado-Mora MV, Farias AQ, Cunha-Silva M, Franca JI, et al. Epidemiology of HCC in Brazil: incidence andrisk factors in a ten-year cohort. Ann Hepatol. 2014;13(4):386-93.
4. Sebastiani G, Alberti A. Non invasive fibrosis biomarkers reduce but notsubstitute the need for liver biopsy. World J Gastroenterol. 2006;12(23):3682-94, http://dx.doi.org/10.3748/wjg.v12.i23.3682.
5. Rustagi T, Newton E, Kar P. Percutaneous liver biopsy. Trop Gastroenterol.2010;31(3):199-212, http://dx.doi.org/10.1111/j.1365-2893.2012.01608.x.
6. Bravo AA, Sheth SG, Chopra S. Liver biopsy. N Engl J Med. 2001;344(7):495-500, http://dx.doi.org/10.1056/NEJM200102153440706.
7. Al Knawy B, Shiffman M. Percutaneous liver biopsy in clinical practice.Liver Int. 2007;27(9):1166-73, http://dx.doi.org/10.1111/j.1478-3231.2007.01592.x.
8. Regev A, Berho M, Jeffers LJ, Milikowski C, Molina EG, Pyrsopoulos NT,et al. Sampling error and intraobserver variation in liver biopsy inpatients with chronic HCV infection. Am J Gastroenterol. 2002;97(10)20:2614-8, http://dx.doi.org/10.1111/j.1572-0241.2002.06038.x.
9. Angulo P,Hui JM, Marchesini G, Bugianesi E, George J, Farrell GC, et al.The NAFLD fibrosis score: a noninvasive system that identifies liverfibrosis in patients with NAFDL. Hepatology. 2007;45(4):846-54, http://dx.doi.org/10.1002/hep.21496.
10. Rosenberg WM, Voelker M, Thiel R, Becka M, Burt A, Schuppan D, et al.Serum markers detect the presence of liver fibrosis: a cohort study.Gastroenterology. 2004;127(6):1704-13, http://dx.doi.org/10.1053/j.gastro.2004.08.052.
11. Bamber J, Cosgrove D, Dietrich CF, Fromageau J, Bojunga J, Calliada F,et al. EFSUMB guidelines and recommendations on the clinical use ofultrasound elastography. Part 1: Basic principles and technology. Ultra-schall Med. 2013;34(2):169-84, http://dx.doi.org/10.1055/s-0033-1335205.Ta
ble
4-Statisticalch
aracteristicsofcirrhosis(F4).
FibroScans
ARFI
ELF
APRI
FIB4
Estim
ate
95%
CI
Estim
ate
95%
CI
Estim
ate
95%
CI
Estim
ate
95%
CI
Estim
ate
95%
CI
cut-off
27kPa
2.37m/s2
11
4.3
6.51
Se1
0.16-1
10.16-1
0.2
0.25-0.64
10.16-1
10.16-1
Sp0.99
0.95-1
0.94
0.83-0.99
10.93-1
10.97-1
10.97-1
PPV
0.67
0.26-1
0.4
0.18-1
10.17-1
10.35-1
10.35-1
NPV
10.91-1
10.81-1
0.94
0.85-0.98
10.91-1
10.91-1
dlr.positive
105
14.93-738.46
16.33
5.46-48.89
Inf
-I-
0--
Inf
-dlr.negative
00-NaN
00-1
0.8
0.80-1
00-1
00-f
AUROC
0.99
0.98-1
0.96
0.90-1
0.94
0.91-1
11-1
11-1
Se=sensitivity,Sp
=specificity,PPV=positive
predictive
value,NPV=negative
predictive
value,dlr.positive
=likelihoodratiopositive
,dlr.negative
=likelihoodrationegative
,AUROC=areaundertheROCcu
rve,
NaN=NullInf=infinity.
Table 5 - Accuracy according to sequential pairs using theObuchowski method.
Biopsy FibroScans ARFI ELF APRI FIB4
F0 vs F1 0.81 0.78 0.44 0.72 0.67F1 vs F2 0.73 0.53 0.62 0.60 0.68F2 vs F3 0.70 0.64 0.77 0.60 0.67F3 vs F4 0.98 0.96 0.82 1 1
523
CLINICS 2017;72(9):516-525 Accuracy of transient elastrographyRagazzo TG et al.

12. The French METAVIR Cooperative Study Group. Intraobserver andinterobserver variations in liver biopsy interpretation in patients withchronic hepatitis C. Hepatology. 1994;20(1 Pt 1):15-20, http://dx.doi.org/10.1002/hep.1840200104.
13. Castera L. Use of elastometry (FibroScan) for the non-invasive staging ofliver fibrosis. Gastroenterol Clin Biol. 2007;31(5):524-30, http://dx.doi.org/10.1016/S0399-8320(07)89422-X.
14. de Lédinghen V, Vergniol J. Transient elastography (FibroScan). Gastro-enterol Clin Biol. 2008;32(6 Suppl 1):58-67, http://dx.doi.org/10.1016/S0399-8320(08)73994-0.
15. Foucher J, Chanteloup E, Vergniol J, Castéra L, Le Bail B, Adhoute X,Bertet J, Couzigou P, de Lédinghen V. Diagnosis of cirrhosis by transientelastography (Fibroscan): a prospective study. Gut. 2006;55(3):403-8,http://dx.doi.org/10.1136/gut.2005.069153.
16. Castera L, Vergniol J, Foucher J, Le Bail B, Chanteloup E, Haaser M, et al.Prospective comparison of transient elastography, Fibrotest, APRI, andliver biopsy for the assessment of fibrosis in chronic hepatitis C. Gastro-enterology. 2005;128(2):343-50, http://dx.doi.org/10.1053/j.gastro.2004.11.018.
17. Bousier J, Zarski JP, de Ledinghen V, Rousselet MC, Sturm N, Lebail B,et al. Determination of reliability criteria for liver stiffness evaluationby transient elastography. Hepatology. 2013;57(3):1182-91, http://dx.doi.org/10.1002/hep.25993.
18. Castera L, Foucher J, Bernard PH, Carvalho F, Allaix D, Merrouche W,et al. Pitfalls of liver stiffness measurement: a 5-year prospective study of13,369 examinations. Hepatology. 2010;51(3):828-35, http://dx.doi.org/10.1002/hep.23425.
19. Mederacke I, Wursthorn K, Kirschner J, Rifai K, Manns MP, WedemeyerH, et al. Food intake increases liver stiffness in patients with chronic orresolved hepatitis C virus infection. Liver Int. 2009;29(10):1500-6, http://dx.doi.org/10.1111/j.1478-3231.2009.02100.x.
20. Myers RP, Pomier-Layrargues G, Kirsch R, Pollett A, Beaton M, LevstikM, et al. Discordance in fibrosis staging between liver biopsy and tran-sient elastography using the FibroScan XL probe. J Hepatol. 2012;56(3):564-70, http://dx.doi.org/10.1016/j.jhep.2011.10.007.
21. Myers RP, Crotty P, Pomier-Layrargues G, Ma M, Urbanski SJ, ElkashabM. Prevalence, risk factors and causes of discordance in fibrosis staging bytransient elastography and liver biopsy. Liver Int. 2010;30(10):1471-80,http://dx.doi.org/10.1111/j.1478-3231.2010.02331.x.
22. Herrero JI, Inarrairaegui M, D’Avola D, Sangro B, Prieto J, Quiroga J.Comparison of the M and XL FibroScan(s) probes to estimate liver stiff-ness by transient elastography. Gastroenterol Hepatol. 2014;37(4):233-9,http://dx.doi.org/10.1016/j.gastrohep.2013.10.009.
23. Liao LY, Kuo KL, Chiang HS, Lin CZ, Lin YP, Lin CL. Acoustic radiationforce impulse elastography of the liver in healthy patients: test location,reference range and influence of gender and body mass index. UltrasoundMed Biol. 2015;41(3):698-704, http://dx.doi.org/10.1016/j.ultrasmedbio.2014.09.030.
24. Piscaglia F, Marinelli S, Bota S, Serra C, Venerandi L, Leoni S, et al.The role of ultrasound elastographic techniques in chronic liver disease:current status and future perspectives. Eur J Radiol. 2014;83(3):450-5,http://dx.doi.org/10.1016/j.ejrad.2013.06.009.
25. Friedrich-Rust M, Nierhoff J, Lupsor M, Sporea I, Fierbinteanu-BraticeviciC, Strobel D, et al. Performance of Acoustic Radiation Force Impulse ima-ging for the staging of liver fibrosis: a pooled meta-analysis. J Viral Hepat.2012;19(2):e212-9, http://dx.doi.org/10.1111/j.1365-2893.2011.01537.x.
26. Bota S, Sporea I, Sirli R, Popescu A, Gradinaru-Tascau O. How useful areARFI elastography cut-off values proposed by meta- analysis for predictingthe significant fibrosis and compensated liver cirrhosis. Med Ultrason.2015;17(2):200-5, http://dx.doi.org/10.11152/mu.2013.2066.172.arf.
27. Lichtinghagen R, Pietsch D, Bantel H, Manns MP, Brand K, Bahr MJ. TheEnhanced Liver Fibrosis (ELF) score: normal values, influence factors andproposed cut-off values. J Hepatol. 2013;59(2):236-42, http://dx.doi.org/10.1016/j.jhep.2013.03.016.
28. Wai CT, Greenson JK, Fontana RJ, Kalbfleisch JD, Marrero JA,Conjeevaram HS, et al. A simple noninvasive index can predict bothsignificant fibrosis and cirrhosis in patients with chronic hepatitis C.Hepatology. 2003;38(2):518-26, http://dx.doi.org/10.1053/jhep.2003.50346.
29. Vallet-Pichard A, Mallet V, Nalpas B, Verkarre V, Nalpas A, Dhalluin-Venier V, et al. FIB-4: an inexpensive and accurate marker of fibrosis inHCV infection-comparison with liver biopsy and fibrotest. Hepatology.2007;46(1):32-6, http://dx.doi.org/10.1002/hep.21669.
30. Obuchowski NA. An ROC-type measure of diagnostic accuracy when thegold standard is continuous-scale. Stat. Med. 2006;25(3):481-93, http://dx.doi.org/10.1002/sim.2228.
31. Obuchowski NA, Goske MJ, Applegate KE. Assessing physicians’ accu-racy in diagnosing paediatric patients with acute abdominal pain: mea-suring accuracy for multiple diseases. Statist Med. 2001;20(21):3261-78,http://dx.doi.org/10.1002/sim.944.
32. Juárez-Hernández E, Uribe-Ramos MH, Ramos-Ostos MH, López-Ramírez AY, Ornelas-Arroyo S, Romero-Flores JL, et al. Factors associatedwith the quality of transient elastography. Dig Dis Sci. 2015;60(7):2177-82,http://dx.doi.org/10.1007/s10620-015-3611-2.
33. Perazzo H, Fernandes FF, Gomes A, Terra C, Perez RM, Figueiredo FA.Interobserver variability in transient elastography analysis of patientswith chronic hepatitis C. Liver Int. 2015;35(5):1533-9, http://dx.doi.org/10.1111/liv.12551.
34. Nishikawa T, Hashimoto S, Kawabe N, Harata M, Nitta Y, Murao M, et al.Factors correlating with acoustic radiation force impulse elastography inchronic hepatitis C. World J Gastroenterol. 2014;20(5):1289-97, http://dx.doi.org/10.3748/wjg.v20.i5.1289.
35. Nadebaum D, Gibson R, Howell J, Christie M, Gorelik A, Liew D, et al.Central obesity negatively impacts the performance of acoustic radiationforce impulse imaging (ARFI) in the assessment of liver fibrosis. AmericanAssociation for the Study of Liver Diseases. The Liver Meeting; 2014;November 7th-11th, Boston.
36. Pinzani M. The ELF panel: a new crystal ball in hepatology? Gut. 2010;59(9):1165-7, http://dx.doi.org/10.1136/gut.2010.214932.
37. Parkes J, Roderick P, Harris S, Day C, Mutimer D, Collier J, et al.Enhanced liver fibrosis test can predict clinical outcomes in patientswith chronic liver disease. Gut. 2010;59(9):1245-51, http://dx.doi.org/10.1136/gut.2009.203166.
38. Šimundić AM. Measures of diagnostic accuracy: basic definitions. EJIFCC.2009;19(4):203-11.
39. Ziol M, Handra-Luca A, Kettaneh A, Christidis C, Mal F, Kazemi F, et al.Noninvasive assessment of liver fibrosis by measurement of stiffness inpatients with chronic hepatitis C. Hepatology. 2005;41(1):48-54, http://dx.doi.org/10.1002/hep.20506.
40. Castera L, Forns X, Alberti A. Non-invasive evaluation of liver fibrosisusing transient elastography. J Hepatol. 2008;48(5):835-47, http://dx.doi.org/10.1016/j.jhep.2008.02.008.
41. You SC, Kim KJ, Kim SU, Kim BK, Park JY, Kim DY, et al. Factors asso-ciated with significant liver fibrosis assessed using transient elastographyin general population. World J Gastroenterol. 2015;21(4):1158-66, http://dx.doi.org/10.3748/wjg.v21.i4.1158.
42. Bureau C, Metivier S, Peron JM, Selves J, Robic MA, Gourraud PA, et al.Transient elastography accurately predicts presence of significant portalhypertension in patients with chronic liver disease. Aliment PharmacolTher. 2008;27(12):1261-8, http://dx.doi.org/10.1111/j.1365-2036.2008.03701.x.
43. Hong WK, Kim MY, Baik SK, Shin SY, Kim JM, Kang YS, et al. Theusefulness of non-invasive liver stiffness measurements in predictingclinically significant portal hypertension in cirrhotic patients: Korean data.Clin Mol Hepatol. 2013;19(4):370-5, http://dx.doi.org/10.3350/cmh.2013.19.4.370.
44. Bonder A, Afdhal N. Utilization of FibroScan in clinical practice. CurrGastroenterol Rep. 2014;16(2):372, http://dx.doi.org/10.1007/s11894-014-0372-6.
45. Serejo F, Marinho R, Velosa J, Costa A, Carneiro de Moura M. ElastografiaHepática Transitória, um método não invasivo para avaliacão da fibroseem doentes com hepatite C crônica. J Port Gastrenterol. 2007;14(1):8-14.
46. Gara N, Zhao X, Kleiner DE, Liang TJ, Hoofnagle JH, Ghany MG. Dis-cordance among transient elastography, aspartate aminotransferase toplatelet ratio index, and histologic assessments of liver fibrosis in patientswith chronic hepatitis C. Clin Gatroenterol Hepatol. 2013;11(3):303-8,http://dx.doi.org/10.1016/j.cgh.2012.10.044.
47. Nierhoff J, Chávez Ortiz AA, Herrmann E, Zeuzem S, Friedrich-Rust M.The efficiency of acoustic radiation force impulse imaging for the stagingof liver fibrosis: a meta-analysis. Eur Radiol. 2013;23(11):3040-53, http://dx.doi.org/10.1007/s00330-013-2927-6.
48. Bota S, Herkner H, Sporea I, Salzl P, Sirli R, Neghina AM, et al. Meta-analysis: ARFI elastography versus transient elastography for the eva-luation of liver fibrosis. Liver Int. 2013;33(8):1138-47, http://dx.doi.org/10.1111/liv.12240.
49. Sporea I, Badea R, Sirli R, Lupsor M, Popescu A, Danila M, et al. Howefficient is acoustic radiation force impulse elastography for the evalua-tion of liver stiffness? Hepat Mon. 2011;11(7):532-8.
50. Fierbinteanu-Braticevici C, Andronescu D, Usvat R, Cretoiu D, Baicus C,Marinoschi G. Acoustic radiation force imaging sonoelastography fornoninvasive staging of liver fibrosis. World J Gastroenterol. 2009;15(44):5525-32, http://dx.doi.org/10.3748/wjg.15.5525.
51. Li SM, Li GX, Fu DM, Wang Y, Dang LQ. Liver fibrosis evaluation byARFI and APRI in chronic hepatitis C. World J Gastroenterol. 2014;20(28):9528-33, http://dx.doi.org/10.3748/wjg.v20.i28.9528.
52. Wahl K, Rosenberg W, Vaske B, Manns MP, Schulze-Osthoff K, Bahr MJ,et al. Biopsy-controlled liver fibrosis staging using the enhanced liverfibrosis (ELF) score compared to transient elastography. PLoS ONE.2012;7(12):e51906, http://dx.doi.org/10.1371/journal.pone.0051906.
53. Parkes J, Guha IN, Roderick P, Harris S, Cross R, Manos MM, et al.Enhanced Liver Fibrosis (ELF) test accurately identifies liver fibrosis inpatients with chronic hepatitis C. J Viral Hepat. 2011;18(1):23-31, http://dx.doi.org/10.1111/j.1365-2893.2009.01263.x.
54. Fagan KJ, Pretorius CJ, Horsfall LU, Irvine KM, Wilgen U, Choi K, et al.ELF score X9.8 indicates advanced hepatic fibrosis and is influencedby age, steatosis and histological activity. Liver Int. 2015;35(6):1673-81,http://dx.doi.org/10.1111/liv.12760.
524
Accuracy of transient elastrographyRagazzo TG et al.
CLINICS 2017;72(9):516-525

55. Silva Jr RG, Fakhouri R, Nascimento TV, Santos IM, Barbosa LM.Aspartate aminotransferase-to-platelet ratio index for fibrosis and cirrho-sis prediction in chronic hepatitis C patients. Braz J Infect Dis. 2008;12(1):15-9, http://dx.doi.org/10.1590/S1413-86702008000100005.
56. Martin J, Khatri G, Gopal P, Singal AG. Accuracy of ultrasound andnoninvasive markers of fibrosis to identify patients with cirrhosis.Dig Dis Sci. 2015;60(6):1841-7, http://dx.doi.org/10.1007/s10620-015-3531-1.
57. Crisan D, Radu C, Lupsor M, Sparchez Z, Grigorescu MD, Grigorescu M.Two or more synchronous combination of noninvasive tests to increaseaccuracy of liver fibrosis assessement in chronic hepatitis C; results from acohort of 446 patients. Hepat Mon. 2012;12(3):177-84, http://dx.doi.org/10.5812/hepatmon.5106.
58. Petersen JR, Stevenson HL, Kasturi KS, Naniwadekar A, Parkes J, Cross R,et al. Evaluation of the aspartate aminotransferase/platelet ratio indexand enhanced liver fibrosis tests to detect significant fibrosis due tochronic hepatitis C. J Clin Gastroenterol. 2014;48(4):370-6, http://dx.doi.org/10.1097/MCG.0b013e3182a87e78.
59. Poynard T, Ngo Y, Perazzo H, Munteanu M, Lebray P, Moussalli J, et al.Prognostic value of liver fibrosis biomarkers: a meta-analysis. Gastro-enterol Hepatol (N Y). 2011;7(7):445-54.
60. Guéchot J, Trocmé C, Renversez JC, Sturm N, Zarski J P; ANRS HC EP 23Fibrostar Study Group. Independent validation of the Enhanced LiverFibrosis (ELF) score in the ANRS HC EP 23 Fibrostar cohort of patientswith chronic hepatitis C. Clin Chem Lab Med. 2012;50(4):693-9, http://dx.doi.org/10.7326/0003-4819-158-11-201306040-00005.
525
CLINICS 2017;72(9):516-525 Accuracy of transient elastrographyRagazzo TG et al.