Embed Size (px)
Citation preview
AccuLoc: Practical Localization of PerformanceMeasurements in 3G Networks
Qiang XuUniversity of Michigan
Ann Arbor, [email protected]
Alexandre GerberAT&T Labs Research
Florham Park, [email protected]
Z. Morley MaoUniversity of Michigan
Ann Arbor, [email protected]
Jeffrey PangAT&T Labs Research
Florham Park, [email protected]
ABSTRACTOperators of 3G data networks need to distinguish the performanceof each geographic area in their 3G networks to detect and resolvelocal network problems. This is because the quality of the “lastmile” radio link between 3G base stations and end-user devices isa crucial factor in the end-to-end performance that each user expe-riences. It is relatively straightforward to measure the performanceof all IP traffic in the 3G network from a small number of van-tage points in the core network. However, the location informationavailable about each mobile device (e.g., the cell sector/site thatit is in) is often too stale to be accurate because of user mobility.Moreover, very costly infrastructure deployment and maintenanceof custom equipment would be required to collect fine-grained lo-cation information about all mobile devices on an on-going basisin large 3G networks. Thus, it is a challenge to accurately assignIP performance measurements to fine-grained geographic regionsof the 3G network using existing standard network components.Fortunately, previous studies have observed that human mobilitypatterns are very predictable. In this paper, we exploit this pre-dictability to develop a novel clustering algorithm grouping relatedcell sectors that accurately assigns IP performance measurementsto fine-grained geographic regions. We present results froma pro-totype in a real 3G network that shows our approach provides moreaccurate performance localization than existing approaches. Even-tually, we can either narrow down individual IP performancemea-surements into only 4 candidate cell sectors consistently with theaccuracy of 70% over one week based on a one-day snapshot offine-grained 3GPP events, or increase the accuracy 20% compar-ing with site-level accuracy through lightweight handoverstatis-tics hourly collected at RNCs. Using our approach, we improveanomaly detection based on IP performance measurements by re-ducing the number of false positives and false negatives. Our studyalso sheds light on the mobility patterns of 3G devices.
Permission to make digital or hard copies of all or part of this work forpersonal or classroom use is granted without fee provided that copies arenot made or distributed for profit or commercial advantage and that copiesbear this notice and the full citation on the first page. To copy otherwise, torepublish, to post on servers or to redistribute to lists, requires prior specificpermission and/or a fee.MobiSys’11, June 28–July 1, 2011, Bethesda, Maryland, USA.Copyright 2011 ACM 978-1-4503-0643-0/11/06 ...$10.00.
Categories and Subject DescriptorsC.2.1 [Network Architecture and Design]: Wireless communi-cation; C.2.3 [Network Operations]: Network monitoring; C.4[Performance of Systems]: Measurement techniques
General TermsExperimentation, Measurement, Performance
KeywordsCellular Network Architecture, Localization, Performance AnomalyDetection
1. INTRODUCTIONMobile applications over 3G networks are among the fastest grow-
ing classes of network applications today. Network operators thushave a substantial interest in monitoring the performance of IP datatraffic on their 3G data networks. In particular, operators wouldlike to continuously monitor which geographical regions intheir3G networks are performing well and which ones are performingpoorly. This is because the quality of the “last mile” radio link be-tween 3G base stations and end-user devices is a crucial factor inthe end-to-end performance that each user experiences. Unfortu-nately, due to protocol, equipment, capacity, and cost limitations,it is not trivial to accurately associate an end-to-end performancemeasurement to the 3G network path that it traversed. We redressthis problem in this paper by developing a novel clustering algo-rithm and evaluating a prototype system in a real 3G wirelessnet-work.
The collection of IP-level statistics, such as packet or flowrecords,is crucial for an operator to understand the end-to-end performanceof its users because they are basic to compute metrics such asend-to-end throughput, RTT, and loss. Due to the standard organizationof 3G data networks, such as the UMTS network shown in Fig-ure 1, it is impractical for operators of large 3G networks tocollectIP-level statistics for all users that can readily be associated with thegeographical regions where they are located. Vendor equipment ina 3G network does not typically support the capture of IP-level flowstatistics because IP packets are carried in an opaque lower-layertunnel from the end-user device all the way to the Gateway GRPSSupport Node (GGSN). Since the capital and labor costs associatedwith deploying additional monitoring equipment and backhaul ca-pacity at all Radio Network Controller (RNC) or Serving GatewaySupport Node (SGSN) locations is prohibitive, monitoring of IP-

!"#$%"$#&
!"#$%"$#&
'$%($%&)*+,-&
.$#/-%0&
1-"#%-22$%&
3*4$&
'#*5-"&
'$%(,"6&
78)'&
'9::-%#&
.-+$&
7*#$/*;&
78)'&
'9::-%#&
.-+$&
<-=,2$&
>$(,?$&
!"#$%&'()%$%*+'#
,*-./%01%#-2#
3())%*+#0%453%#
/-3&6-*#
@
@@
!"##$
%"&'()$
Figure 1: Logical architecture of a UMTS network.
level statistics is only practically performed at the GGSNs, whichare located in only a handful of different locations. However, fromthe perspective of a GGSN, it is not possible to determine when amobile device moves from one cell sector to another because han-dover signaling information is not propagated up. The GGSN onlyobserves the cell sector where the user began his session, the cellsector when the user moves far enough away from his original loca-tion that his network path traverses a different SGSN (each SGSNgenerally covers an entire metro area), or when the device changesfrom 3G to 2.5G coverage. Because users are often mobile, han-dovers are frequent and the GGSN will often have a stale view ofwhere users are currently located. This staleness makes it non-trivial to associate current IP-level performance measurements tothe cell sectors that they are associated with using only informationcollected at the GGSN.
RNCs, which observe all handovers that users experience, cancollect accurate information about which cell sector each user isusing at all times. However, not all equipment supports suchfine-grained user tracking. Moreover, because RNCs are geographi-cally distributed, significant additional long-haul capacity wouldbe needed to collect all handover events in a centralized location.Thus, in large 3G networks, it is only practical to collect such infor-mation infrequently or in aggregate form. For example, the RNCsin the UMTS network that we study in this paper only collect hourlyhandover statistics per cell sector, rather than real-timecell sectorinformation per user. This information indicates how many usersmove from cell sector to cell sector in aggregate, but not where anyuser is at any point in time.
In this paper, we develop a system calledAccuLoc that takesthese two sources of 3G network data — IP-level flow records col-lected at GGSNs and aggregate handover statistics at RNCs — andaccurately associates end-to-end metrics to different fine-grainedregions of the 3G network.AccuLoc leverages the observation thathuman mobility patterns are typically predictable and mostusersdo not tend to move long distances at short time scales. Thus,itis possible to cluster related cell sectors together using aggregatehandover information. By associating end-to-end measurements tothe cluster in which a user began his session, we can accuratelyassociate these measurements with fine-grained geographicareascovered by the 3G network. To evaluateAccuLoc’s accuracy inassociating the end-to-end metrics to fine-grained regions, we havedeveloped a prototype system in a real 3G wireless network andevaluate it on data from a large metropolitan area. We show that byclustering based on aggregate handover statistics,AccuLoc is moreaccurate than naïve forms of clustering, such as clusteringpurelyby geographic proximity.
To our best knowledge, our study is the first one quantifying the
localization inaccuracy of IP-level statistics at GGSNs due to staleviews. and leveraging human mobility patterns for cellularopera-tors to achieve better localization. Through the design anddevel-opment ofAccuLoc, we make the following five contributions:
• We characterize the localization inaccuracy for mapping theIP-level statistics at the GGSN to different fine-grained net-work elements,i.e., cell sectors, base stations, RNCs, andLACs. The localization accuracy is around 20% at the gran-ularity of cell sector level. Even if at higher aggregation lev-els, the accuracy is only around 50% at the cell-site leveland 70% at the RNC level. The low accuracy is because us-ing cell sites and RNCs to determine which cell sectors arerelated cannot capture the dynamics of user moving behav-iors, which motivates us to obtain human mobility patternsin advance and leverage it for locating IP-level statisticsac-cordingly.
• We propose two measurement-driven solutions forAccuLocto build human mobility patterns in the terms of which cellsectors are strongly related,i.e., identifying clusters of re-lated cell sectors that subscribers have very high probabil-ity commuting within individual clusters, and leverage themobility knowledge to accurately localize IP-level statistics.The two solutions have different advantages and complementeach other from aspects of the localization accuracy and theoverhead for conducting human mobility patterns. Since hu-man mobility patterns are dynamic, capturing the variabilityof mobility patterns is critical forAccuLoc to outperformother naïve solutions.
• Our first solution,i.e., BIGRAPH , requires a snapshot of3GPP signaling events at RNCs which is expensive for long-term collection. In order to construct the human mobilitypatterns,BIGRAPH groups related cell sectors into smallclusters.BIGRAPH can locate IP-level statistics into only 4cell sectors with the accuracy of 70% over one week and 50%after the snapshot of 3GPP signaling events is 5.5-month old.Note that the mapping IP-level statistics to the correct RNCis around 70%, but one RNC usually contains 200 – 300 cellsectors, which is significantly larger thanBIGRAPH ’s clus-ters.
• Our second solution,i.e., HANDOVER , relies on hourly ag-gregate handover statistics at cell sectors instead of expensive3GPP signaling events at RNCs.HANDOVER performs asan alternative toBIGRAPH on condition that the collectionof 3GPP signaling events is not supported or is restricted.Since it is an inherit tradeoff between the overhead of mea-surement and localization accuracy.HANDOVER is notas accurate asBIGRAPH . However, inferring the mobilitypatterns from lightweight handover statistics,HANDOVERstill achieves reasonable localization accuracy. Comparedwith intuitive solutions such as grouping sectors purely bycell sites,HANDOVER can overall increase the accuracy20%.
• We demonstrate thatAccuLoc improves the accuracy of per-formance anomaly detection, a critical application for net-work operators. Based on the information inferred from ei-ther BIGRAPH or HANDOVER of which cell sectors arerelated,AccuLoc re-assign the measured IP-level statisticsin order to accurately associate the end-to-end performancemetrics to the correct fine-grained network elements,i.e.,cell sectors, cell sites, RNCs. Through the re-assignment,

the performance metrics observed at GGSNs are more closeto the ground truth ones directly measured at RNCs. Ap-plying BIGRAPH in performance anomaly detection,Ac-cuLoc achieves both the lowest false positive and negativecompared with solutions based on other forms of clusteringsectors.
The rest of this paper is organized as follows: §2 describes the ar-chitecture of cellular networks and associated protocols,followedby §3 explaining the main data sources for the input, the groundtruth, and the evaluation. §4 proposes the two solutions,BIGRAPHandHANDOVER adopted byAccuLoc to build the knowledge ofhuman mobility patterns. §5 quantifies the performance ofAccu-Loc in associating metrics to fine-grained network locations. Wediscuss the generalizability ofAccuLoc on other types of networksin §6. Related work is discussed in §7 and we conclude our studyin §8.
2. UMTS BACKGROUNDIn order to understand the difficulty in locating IP performance
measurements in UMTS networks, it is useful to have an under-standing of how a UMTS data network is structured.Network Elements and Architecture. Figure 1 shows the logi-cal architecture of a UMTS data network according to the 3GPPstandard. As depicted, a UMTS network is hierarchical. At theroot of the network is a Gateway GRPS Support Node (GGSN). Inpractice, there are multiple GGSNs, but they are located in only ahandful of locations [25]. Due to their limited number of physi-cal locations, it is relatively straightforward to monitorall IP trafficin the UMTS network at these locations. At the leaves are mobiledevices (user equipment (UE), in 3GPP parlance), which connectto the UMTS network in a particular cell sector. Each base sta-tion (NodeB or cell site, in 3GPP parlance) has multiple cellsec-tors, one for each antenna attached to its cell tower. Typically thesepoint in different directions and/or operate on different frequencies.Base stations send their data traffic to Radio Network Controllers(RNCs), which forward traffic to Serving GPRS Support Nodes(SGSNs), which, in turn, send the traffic to GGSNs. The GGSNsends and receives traffic from the Internet.IP Tunneling. An important characteristic of UMTS networks isthat IP traffic sent by mobile devices is tunneled to the GGSN usinglower layer 3GPP tunneling protocols. As a consequence, none ofthe intermediary nodes in the UMTS network can directly inspectthe sent IP packets and a mobile device’s IP address is “anchored”to the GGSN, regardless of where it moves in the network. Thischaracteristic ensures that the mobile device can maintainits IP ad-dress (and thus, its IP connections) even as it is mobile. In this pa-per, we will focus on the tunnel between the SGSN and the GGSN,which is called a PDP Context and uses the GPRS Tunneling Pro-tocol (GTP) (GTP-U to carry data traffic and GTP-C for signalingcontrol messages).Session Establishment and Mobility.When a mobile device firstconnects to the UMTS network, the PDP Context that carries itsIP traffic is set up. At this point, the originating cell sector andRNC is reported to the GGSN via GTP-C protocol. When a mobiledevice moves to a different sector, the path its data takes throughthe UMTS network changes.1 RNCs manage the operation of han-
1In practice, a device can be connected to multiple nearby sectorsat the same time. This set of sectors, typically 1 to 4 in size,iscalled the active set. While all sectors in the active set coordinateto receive uplink data sent by the device, only one, the serving cell,transmits downlink data to the device at a given time. This istyp-ically the sector with the highest signal-to-noise ratio. Since the
dovers when a mobile device moves from one sector to another(e.g., by coordinating base stations and other RNCs). However, toavoid unnecessary signaling overhead, the change of cell sectors isnot reported to the higher in the hierarchy. Thus, the GGSN isnotinformed that a mobile device has moved unless the SGSN in itsnetwork path changes. This can occur for two reasons: (1) it movesfar enough away that the SGSN changes — typically into a differ-ent metro area; or (2) the device changes from 3G to 2.5G, WiFi,orvice versa. The second scenario causes an SGSN change becausethe 2.5G hierarchy is different from the 3G hierarchy. This scenariotypically occurs if a device moves from 3G areas that cover primaryurban and suburban areas to 2.5G areas that cover less populatedareas. In addition, the PDP Context is destroyed after an inactivityperiod of 2–4 hours or if the device is turned off. Note that the PDPContext remains alive even if the device is idle. Since smartphoneapplications may send periodic keep-alives or “push” notifications,a PDP Context may persist for hours or even days. Therefore, theinitial cell sector reported to the GGSN when a device first sets upthe PDP Context often is not the sector in which the device cur-rently is connected.
3. DATA SOURCESThere are several sources of data in a UMTS network that we
can utilize to measure the end-to-end performance experience ofeach cell sector. In this section, we describe these sourcesand thedata sets we use to evaluate our prototype system. Note that due toprivacy concerns, all user and device identifiers are anonymized be-fore any data analysis (e.g., IMSI and IMEI). Anonymization doesnot compromise the usefulness of our results.
3.1 Continuously Available Data SetsWe are primarily interested in the performance of IP data traffic
— e.g., the throughput, RTT, loss, etc. of IP data flows. These met-rics can be extracted from statistics captured about each IPflow [7,10, 20]. Ideally, we would like to be able to collect IP flow datasuch that each IP flow can be mapped to the cell sector where itoriginates from or is destined to. Unfortunately, as described inSection 2, this is not trivial due to lack of available data sources.This section describes the data sources that can be available on aregular basis in practice.Real-time IP Flow Records.It is relatively straightforward to cap-ture IP flow data from all 3G traffic at all GGSNs because they arefew in number. In the large UMTS network that we study, mea-surement infrastructure [9] is in place to capture IP flow recordssimilar to NetFlow records [8] in near real time. GTP-C signalingmessages, described in the next paragraph, are used to map eachIP flow to the originating or destination device, which is identifiedby its anonymized IMSI and IMEI. Hereafter, we call these IP flowrecordsIPFlowRecords.PDP Context Setup Messages.Similarly, it is straightforward forthe same infrastructure to capture the signaling messages sent be-tween SGSNs and GGSNs via the GTP-C protocol. Most impor-tantly, PDP Context Setup messages that are exchanged when adevice initially establishes a PDP Context indicate the initial sectorthat the device communicates with. PDP Context Update messagesmay also indicate a device’s sector when it moves far enough awayfrom the original sector so that the SGSN changes. Without anyinformation collected outside the GGSN locations, these are thebest estimates of device location that are available. Hereafter, we
vast majority of data is downlink traffic, in this paper we areonlyconcerned with identifying the serving cell correctly.
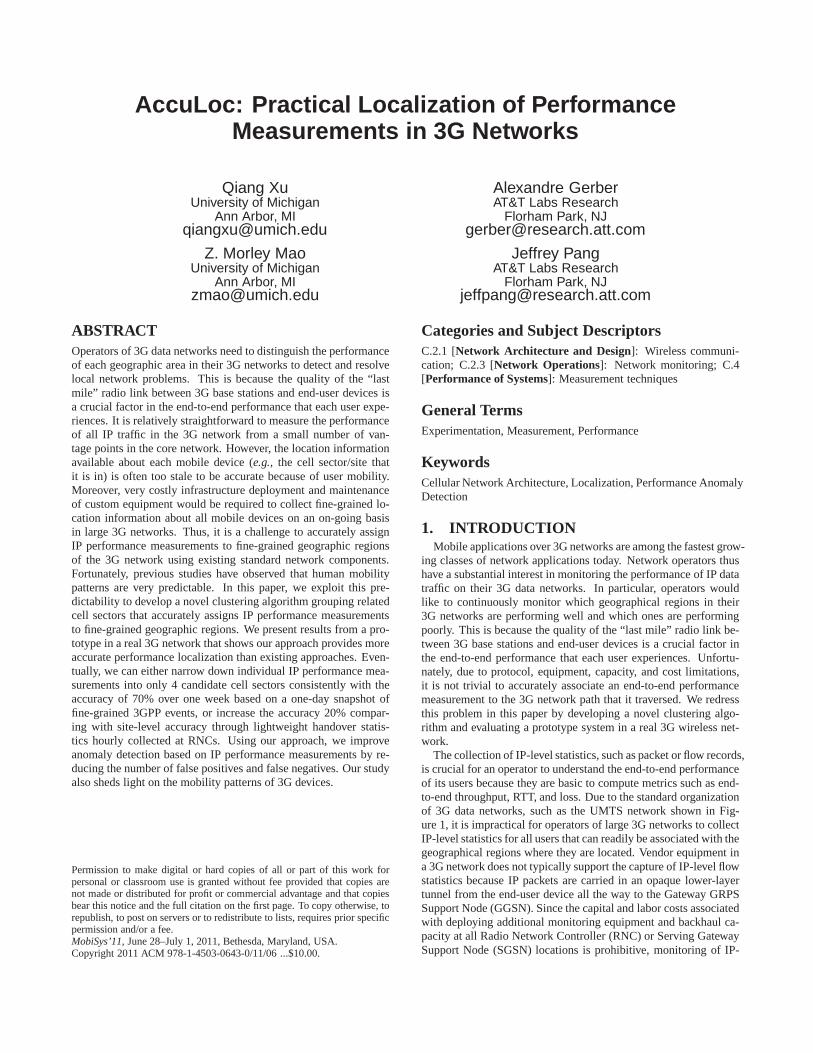
dataset availability duration descriptionIPFlowRecords continuously 1 day real-time IP flow records collected at theGGSNPDPSetupLocations continuously 1 week sector information in PDP Context Setupmessages collected at the GGSNHandoverCounters continuously 1 week hourly aggregate handover counters foreach sector pair reported by RNCsRNCGroundTruth infrequently 1 week ground truth sector information for each device from 3GPP events collected at RNCs
Table 1: Datasets used in the evaluation of AccuLoc.
call the estimates of device location derived from these messagesPDPSetupLocations.Aggregate Handover Counters. Each RNC keeps track of thecurrent cell a device is using as part of normal operation. However,due to vendor limitations and resource constraints, this informationis not recorded. Instead, it is typically only practical to keep ag-gregate statistics about each sector. For example, the total numberof connections, total number of disconnects, etc. One aggregatestatistic that we can leverage is the total number of handovers be-tween two sectors. In other words, for each pair of sectors(A,B),a counter is kept that indicates the number of handovers fromA toB processed per hour. From these handover statistics, we can inferthe aggregate mobility behavior of devices. Hereafter, we call thisset of handover countersHandoverCounters.
3.2 Ground Truth DataSome RNC equipment can record the current sector that each
device is using at fine time scales. More specifically, some equip-ment can capture all 3GPP signaling events at the RNC level, suchas handover events. However, this recording places additional loadon RNC equipment that can interfere with normal operation, as theCPU, memory, and storage constraints of RNC equipment are notdesigned for continuous operation of such recording. Recording istypically only enabled for troubleshooting. In addition, the volumeof such data is substantial (tens of GB per day for a single RNC),so backhauling the data to a central data collector for correlationwith IPFlowRecords requires investment of additional resources.Finally, not all RNC vendors support such recording. Therefore,although it is possible to collect such data from a small number ofRNCs periodically (e.g., once every few days), continuous collec-tion to support real-time performance localization is not possible.
In order to evaluate different approaches to our localization prob-lem, we collect a sample of this “ground truth” data. Hereafter, werefer to this data asRNCGroundTruth .
3.3 Evaluation Data SetsTo evaluate our prototype and other approaches to the localiza-
tion problem, we use one contiguous week of data in July 2010for each of these datasets:PDPSetupLocations, HandoverCoun-ters, RNCGroundTruth . To evaluate the accuracy of performancemeasurements based on these localization approaches, we use oneday of IPFlowRecordsdata during this week. The data we exam-ine covers all 3G sectors in the greater Los Angeles area. We notethat not all areas have 3G coverage (some only have 2.5G cover-age). However, since our focus is on 3G performance, we do notconsider data from 2.5G sectors.
The datasets are summarized in Table 1.
4. LOCALIZATIONAs we described in the previous section, the originating cell sec-
tor/cell site/RNC of performance measurements is not captured atthe GGSN, so it is difficult to collect fine-grained location infor-
mation about all mobile devices on an on-going basis in large3Gnetworks.
In this section, we first characterize the localization inaccuracybased uponRNCGroundTruth . Then we propose two solutionsadopted byAccuLoc to group related sectors together that take ad-vantage of the predictability of human mobility patterns. Finally,we evaluate the performance ofAccuLoc in terms of localizationaccuracy at the end of this section.
4.1 Characterizing the Inaccuracy of InitialSectors
Understanding the duration of PDP Contexts, frequency of han-dovers, and their relationship to each other is important both forunderstanding the performance localization problem we address inthis paper and to shed light on user mobility patterns in cellular net-works. For example, the persistence of the same location in aPDPContext suggests how long modern smartphones are active andre-main in the same metro area, as PDP Contexts only change if auser changes SGSN due to travel to another metro area, or depar-ture from the 3G coverage area. Frequency of handovers suggestshow often user mobility and environmental changes cause local ra-dio characteristics to change substantially (within 1-2 km), as theytypically occur only when the sector with the best signal-to-noiseratio changes. These characteristics are important for a range ofcellular applications so we study them in detail in this section.
GTP-C signaling messages,i.e., PDPSetupLocations, duringthe initial PDP Context Setup provide the location of mobilede-vices at the time a device is turned on or after several hours of inac-tivity. 3GPP events collected from RNCs,i.e., RNCGroundTruth ,provide the location of the mobile devices every 2 seconds intermsof the cell sector where each device is located. By comparingthelocation information ofPDPSetupLocationswith that of RNC-GroundTruth , we can evaluate how accuratelyPDPSetupLoca-tions estimates where mobile devices currently are.
0
20
40
60
80
100
0.1 1 10 100 1000
CD
F (
%)
handover interval (sec)
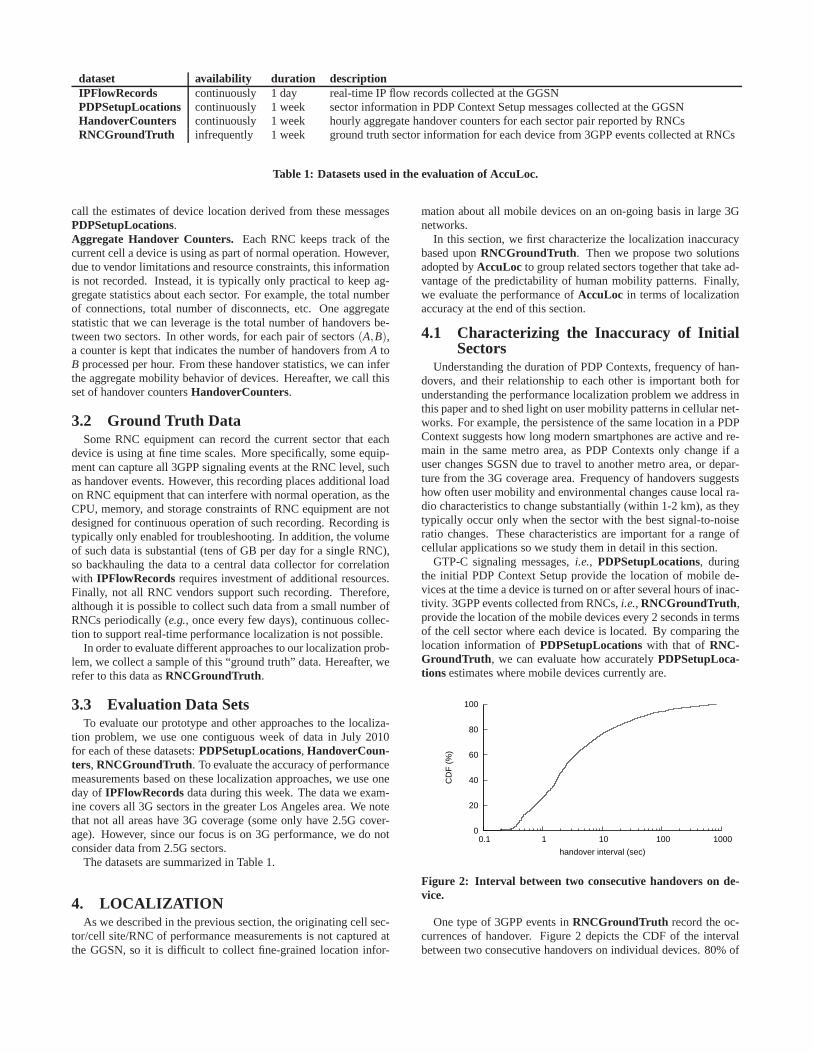
Figure 2: Interval between two consecutive handovers on de-vice.
One type of 3GPP events inRNCGroundTruth record the oc-currences of handover. Figure 2 depicts the CDF of the intervalbetween two consecutive handovers on individual devices. 80% of
0
20
40
60
80
100
20 21 22 23 24 25 26 27 28 29 210 211 212 213
min hourday week
CD
F (
%)
PDP Context age (100 secs)
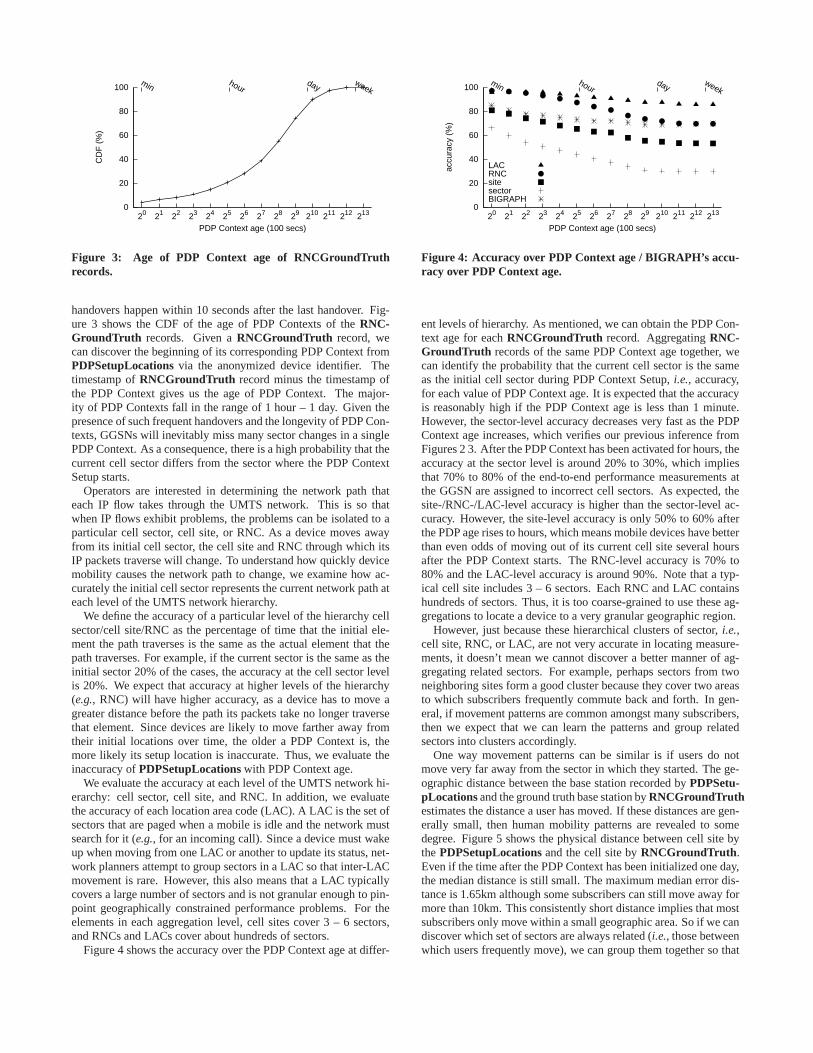
Figure 3: Age of PDP Context age of RNCGroundTruthrecords.
handovers happen within 10 seconds after the last handover.Fig-ure 3 shows the CDF of the age of PDP Contexts of theRNC-GroundTruth records. Given aRNCGroundTruth record, wecan discover the beginning of its corresponding PDP ContextfromPDPSetupLocationsvia the anonymized device identifier. Thetimestamp ofRNCGroundTruth record minus the timestamp ofthe PDP Context gives us the age of PDP Context. The major-ity of PDP Contexts fall in the range of 1 hour – 1 day. Given thepresence of such frequent handovers and the longevity of PDPCon-texts, GGSNs will inevitably miss many sector changes in a singlePDP Context. As a consequence, there is a high probability that thecurrent cell sector differs from the sector where the PDP ContextSetup starts.
Operators are interested in determining the network path thateach IP flow takes through the UMTS network. This is so thatwhen IP flows exhibit problems, the problems can be isolated to aparticular cell sector, cell site, or RNC. As a device moves awayfrom its initial cell sector, the cell site and RNC through which itsIP packets traverse will change. To understand how quickly devicemobility causes the network path to change, we examine how ac-curately the initial cell sector represents the current network path ateach level of the UMTS network hierarchy.
We define the accuracy of a particular level of the hierarchy cellsector/cell site/RNC as the percentage of time that the initial ele-ment the path traverses is the same as the actual element thatthepath traverses. For example, if the current sector is the same as theinitial sector 20% of the cases, the accuracy at the cell sector levelis 20%. We expect that accuracy at higher levels of the hierarchy(e.g., RNC) will have higher accuracy, as a device has to move agreater distance before the path its packets take no longer traversethat element. Since devices are likely to move farther away fromtheir initial locations over time, the older a PDP Context is, themore likely its setup location is inaccurate. Thus, we evaluate theinaccuracy ofPDPSetupLocationswith PDP Context age.
We evaluate the accuracy at each level of the UMTS network hi-erarchy: cell sector, cell site, and RNC. In addition, we evaluatethe accuracy of each location area code (LAC). A LAC is the setofsectors that are paged when a mobile is idle and the network mustsearch for it (e.g., for an incoming call). Since a device must wakeup when moving from one LAC or another to update its status, net-work planners attempt to group sectors in a LAC so that inter-LACmovement is rare. However, this also means that a LAC typicallycovers a large number of sectors and is not granular enough topin-point geographically constrained performance problems. For theelements in each aggregation level, cell sites cover 3 – 6 sectors,and RNCs and LACs cover about hundreds of sectors.
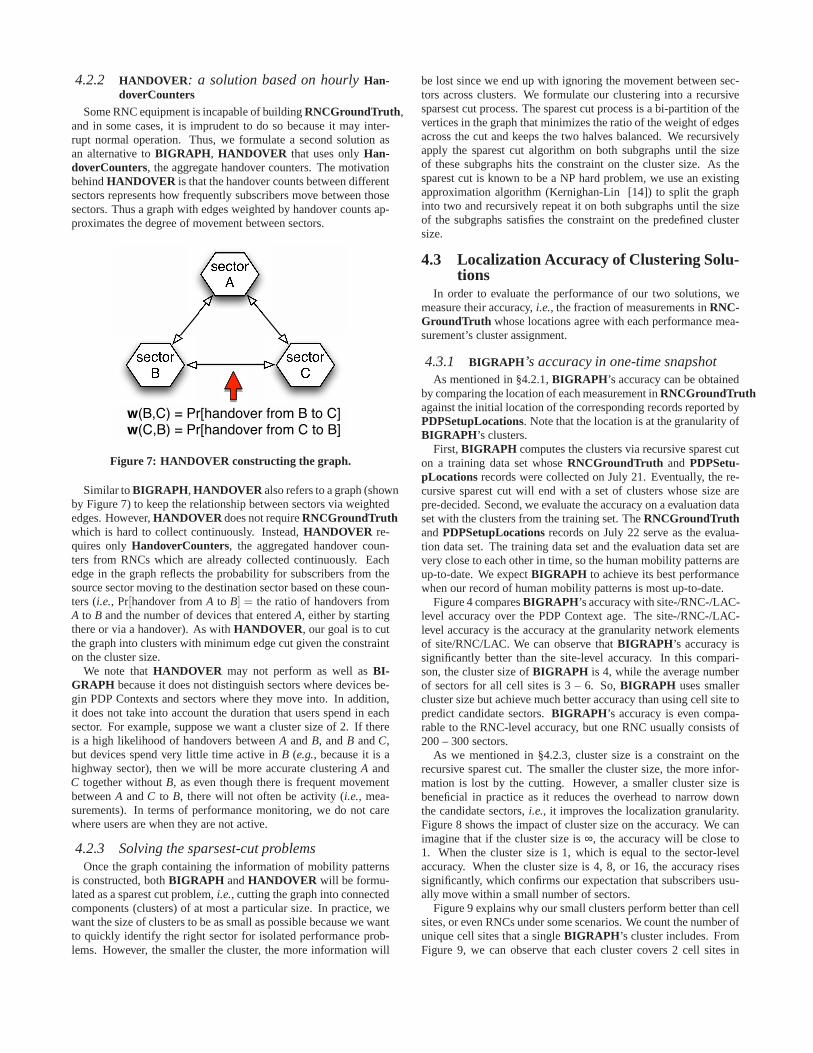
Figure 4 shows the accuracy over the PDP Context age at differ-
0
20
40
60
80
100
20 21 22 23 24 25 26 27 28 29 210 211 212 213
min hourday week
accu
racy
(%
)
PDP Context age (100 secs)
LACRNCsitesectorBIGRAPH
Figure 4: Accuracy over PDP Context age / BIGRAPH’s accu-racy over PDP Context age.
ent levels of hierarchy. As mentioned, we can obtain the PDP Con-text age for eachRNCGroundTruth record. AggregatingRNC-GroundTruth records of the same PDP Context age together, wecan identify the probability that the current cell sector isthe sameas the initial cell sector during PDP Context Setup,i.e., accuracy,for each value of PDP Context age. It is expected that the accuracyis reasonably high if the PDP Context age is less than 1 minute.However, the sector-level accuracy decreases very fast as the PDPContext age increases, which verifies our previous inference fromFigures 2 3. After the PDP Context has been activated for hours, theaccuracy at the sector level is around 20% to 30%, which impliesthat 70% to 80% of the end-to-end performance measurements atthe GGSN are assigned to incorrect cell sectors. As expected, thesite-/RNC-/LAC-level accuracy is higher than the sector-level ac-curacy. However, the site-level accuracy is only 50% to 60% afterthe PDP age rises to hours, which means mobile devices have betterthan even odds of moving out of its current cell site several hoursafter the PDP Context starts. The RNC-level accuracy is 70% to80% and the LAC-level accuracy is around 90%. Note that a typ-ical cell site includes 3 – 6 sectors. Each RNC and LAC containshundreds of sectors. Thus, it is too coarse-grained to use these ag-gregations to locate a device to a very granular geographic region.
However, just because these hierarchical clusters of sector, i.e.,cell site, RNC, or LAC, are not very accurate in locating measure-ments, it doesn’t mean we cannot discover a better manner of ag-gregating related sectors. For example, perhaps sectors from twoneighboring sites form a good cluster because they cover twoareasto which subscribers frequently commute back and forth. In gen-eral, if movement patterns are common amongst many subscribers,then we expect that we can learn the patterns and group relatedsectors into clusters accordingly.
One way movement patterns can be similar is if users do notmove very far away from the sector in which they started. The ge-ographic distance between the base station recorded byPDPSetu-pLocationsand the ground truth base station byRNCGroundTruthestimates the distance a user has moved. If these distances are gen-erally small, then human mobility patterns are revealed to somedegree. Figure 5 shows the physical distance between cell site bythePDPSetupLocationsand the cell site byRNCGroundTruth .Even if the time after the PDP Context has been initialized one day,the median distance is still small. The maximum median errordis-tance is 1.65km although some subscribers can still move away formore than 10km. This consistently short distance implies that mostsubscribers only move within a small geographic area. So if we candiscover which set of sectors are always related (i.e., those betweenwhich users frequently move), we can group them together so that

if we want to predict the current sector of performance measure-ments inIPFlowRecords based onPDPSetupLocations, we canhave a small set of candidate sectors but in very high confidence.This technique can be beneficial for detecting performance anoma-lies and narrowing down problems into a small number of sectors.
Note that Figure 4 shows that the site-level accuracy is poor,which means subscribers often move in an area served by morethan one cell site. However, subscribers moving across sites do notnecessarily means they moving across many sectors. Subscribersmay always move across a few sectors but these sectors may be indifferent cell sites. In the next section, we describe how wecanlearn these small clusters of related sectors, regardless of cell site.
0
5
10
15
20
25
30
35
40
20 21 22 23 24 25 26 27 28 29 210 211 212 213
min hourday week
dist
ance
(km
)
PDP Context age (100 secs)
5th - 95th %ilemedian
Figure 5: Distance from the site by PDPSetupLocations to thesite by RNCGroundTruth.
4.2 Practical Localization SolutionsAs we observed in the previous section, using only static infor-
mation to cluster sectors (e.g., by the cell site each sector belongsto) is not accurate because they do not capture mobility patterns.We expect that a good heuristic is to learn common movement be-havior of users and leverage this knowledge to predict the currentsector more accurately.
As mentioned in Section 3, there are two available sources ofdata collected at RNCs in addition to theIPFlowRecordsandPDPSe-tupLocations data collected at the GGSN:HandoverCountersandRNCGroundTruth . HandoverCounters, aggregate countersof handovers between each sector, are collected continuously. RNC-GroundTruth , precise location information based on RNC eventinformation, cannot be collected continuously, but can be sampledfrom small segments of the network every few days. In this section,we propose two algorithms to build mobility models using thesedata sources, given their collection and granularity constraints:BI-GRAPH andHANDOVER . UsingRNCGroundTruth , BIGRAPHhas higher data collection overhead and is more accurate. However,we find that the algorithm usingHandoverCounters, i.e., HAN-DOVER, also provides acceptable accuracy. Both solutions canbe formulated as a version of the sparsest cut of a graph cut prob-lem [14], so we first describe how to formulate each graph. Thepractical algorithm to solve the sparsest cut problem on each graphis the same.
4.2.1 BIGRAPH : a solution based on one-time snap-shot of RNCGroundTruth
Since there are often common travel routes between areas thatmost people follow, we conjecture that subscribers that begin theirPDP Contexts in the same sector tend to move to similar sectors.In addition, as we see in Figure 5, most devices do not move veryfar away from their initial sector. Based on these observations, we
expect that there will be small clusters of sectors close to each otherthat can be grouped together. Subscribers have high probability ofmoving within the sectors in the same cluster.
BIGRAPH requires (i) a snapshot ofRNCGroundTruth , and(ii) the corresponding snapshot ofPDPSetupLocationswhose PDPContexts covers the records in the snapshot ofRNCGroundTruth .BIGRAPH attempts to learn these clusters by creating a graphof the relationships between the initial sectors inPDPSetupLo-cationsand the current sectors where devices are located inRNC-GroundTruth . SinceRNCGroundTruth can only be collectedinfrequently,BIGRAPH builds a model of these clusters based ona set of training data (e.g., collected over one day from all RNCs ina greater metro area), then the model can be used to predict rela-tionships in future data whenRNCGroundTruth is not available.
sectorA
sectorB
sectorA
sectorC
sectorB
sectorC
initial sectors(in PDPSetupLocations)
actual sectors(in RNCGroundTruth)
w(B,C) = # RNCGroundTruth measurementssuch that initial location is B but actual is C
Figure 6: BIGRAPH constructing the bipartite graph.
As shown by Figure 6, theBIGRAPH builds a bipartite graphconnectingRNCGroundTruth andPDPSetupLocations. Let usdenote the graph asG = (U,V,E), where vertexu in U repre-sents a sector inPDPSetupLocationsandv in V represents a sec-tor in RNCGroundTruth . Let w(u,v) be the number ofRNC-GroundTruth records (once every 2 seconds when a user is ac-tive) such thatRNCGroundTruth reports a subscriber is inv andPDPSetupLocationssays the subscriber is inu. M(u) returns thevertices inV that corresponds to the sector thatu represents inU .Edges inG that have high weights are strongly related (i.e., lots ofusers move from those source sectors to those other sectors). Thus,we would like to cluster strongly related nodes inV together.
Let a clusteringC1,C2, ...,Cn each be a disjoint subset ofV .The accuracy of a clustering of sectors (for any clustering method)
is computed as1−E(C1,C2,...,Cn)N , whereN is the number ofRNC-
GroundTruth records, andE(C1,C2, ...,Cn) is the sum ofw(u,v)for all (u,v) such thatM(u) is in one clusterCi andM(v) is in an-other clusterC j, i.e., this sum counts the number ofRNCGroundTruthrecords that get assigned to the incorrect cluster. Location accuracyis thus maximized whenE(C1,C2, ...,Cn) is minimized.
Therefore, given constraints on the size of clusters, the goal is tominimize the weight of edges that cross clusters. For example, ifwe want to clusters to be of size 4, then we want to cut the graphsuch that each connected component is only size 4 and the weightof the edges that cross connected components is minimized. We canmerge the verticesu andM(u) to make the problem be a sparsestcut problem. We describe how to solve the sparsest cut problembelow in §4.2.3
4.2.2 HANDOVER : a solution based on hourly Han-doverCounters
Some RNC equipment is incapable of buildingRNCGroundTruth ,and in some cases, it is imprudent to do so because it may inter-rupt normal operation. Thus, we formulate a second solutionasan alternative toBIGRAPH , HANDOVER that uses onlyHan-doverCounters, the aggregate handover counters. The motivationbehindHANDOVER is that the handover counts between differentsectors represents how frequently subscribers move between thosesectors. Thus a graph with edges weighted by handover countsap-proximates the degree of movement between sectors.
sectorA
sectorB
sectorC
w(B,C) = Pr[handover from B to C]w(C,B) = Pr[handover from C to B]
Figure 7: HANDOVER constructing the graph.
Similar toBIGRAPH , HANDOVER also refers to a graph (shownby Figure 7) to keep the relationship between sectors via weightededges. However,HANDOVER does not requireRNCGroundTruthwhich is hard to collect continuously. Instead,HANDOVER re-quires onlyHandoverCounters, the aggregated handover coun-ters from RNCs which are already collected continuously. Eachedge in the graph reflects the probability for subscribers from thesource sector moving to the destination sector based on these coun-ters (i.e., Pr[handover fromA to B] = the ratio of handovers fromA to B and the number of devices that enteredA, either by startingthere or via a handover). As withHANDOVER , our goal is to cutthe graph into clusters with minimum edge cut given the constrainton the cluster size.
We note thatHANDOVER may not perform as well asBI-GRAPH because it does not distinguish sectors where devices be-gin PDP Contexts and sectors where they move into. In addition,it does not take into account the duration that users spend ineachsector. For example, suppose we want a cluster size of 2. If thereis a high likelihood of handovers betweenA andB, andB andC,but devices spend very little time active inB (e.g., because it is ahighway sector), then we will be more accurate clusteringA andC together withoutB, as even though there is frequent movementbetweenA andC to B, there will not often be activity (i.e., mea-surements). In terms of performance monitoring, we do not carewhere users are when they are not active.
4.2.3 Solving the sparsest-cut problemsOnce the graph containing the information of mobility patterns
is constructed, bothBIGRAPH andHANDOVER will be formu-lated as a sparest cut problem,i.e., cutting the graph into connectedcomponents (clusters) of at most a particular size. In practice, wewant the size of clusters to be as small as possible because wewantto quickly identify the right sector for isolated performance prob-lems. However, the smaller the cluster, the more information will
be lost since we end up with ignoring the movement between sec-tors across clusters. We formulate our clustering into a recursivesparsest cut process. The sparest cut process is a bi-partition of thevertices in the graph that minimizes the ratio of the weight of edgesacross the cut and keeps the two halves balanced. We recursivelyapply the sparest cut algorithm on both subgraphs until the sizeof these subgraphs hits the constraint on the cluster size. As thesparest cut is known to be a NP hard problem, we use an existingapproximation algorithm (Kernighan-Lin [14]) to split thegraphinto two and recursively repeat it on both subgraphs until the sizeof the subgraphs satisfies the constraint on the predefined clustersize.
4.3 Localization Accuracy of Clustering Solu-tions
In order to evaluate the performance of our two solutions, wemeasure their accuracy,i.e., the fraction of measurements inRNC-GroundTruth whose locations agree with each performance mea-surement’s cluster assignment.
4.3.1 BIGRAPH ’s accuracy in one-time snapshotAs mentioned in §4.2.1,BIGRAPH ’s accuracy can be obtained
by comparing the location of each measurement inRNCGroundTruthagainst the initial location of the corresponding records reported byPDPSetupLocations. Note that the location is at the granularity ofBIGRAPH ’s clusters.
First,BIGRAPH computes the clusters via recursive sparest cuton a training data set whoseRNCGroundTruth and PDPSetu-pLocations records were collected on July 21. Eventually, the re-cursive sparest cut will end with a set of clusters whose sizearepre-decided. Second, we evaluate the accuracy on a evaluation dataset with the clusters from the training set. TheRNCGroundTruthandPDPSetupLocationsrecords on July 22 serve as the evalua-tion data set. The training data set and the evaluation data set arevery close to each other in time, so the human mobility patterns areup-to-date. We expectBIGRAPH to achieve its best performancewhen our record of human mobility patterns is most up-to-date.
Figure 4 comparesBIGRAPH ’s accuracy with site-/RNC-/LAC-level accuracy over the PDP Context age. The site-/RNC-/LAC-level accuracy is the accuracy at the granularity network elementsof site/RNC/LAC. We can observe thatBIGRAPH ’s accuracy issignificantly better than the site-level accuracy. In this compari-son, the cluster size ofBIGRAPH is 4, while the average numberof sectors for all cell sites is 3 – 6. So,BIGRAPH uses smallercluster size but achieve much better accuracy than using cell site topredict candidate sectors.BIGRAPH ’s accuracy is even compa-rable to the RNC-level accuracy, but one RNC usually consists of200 – 300 sectors.
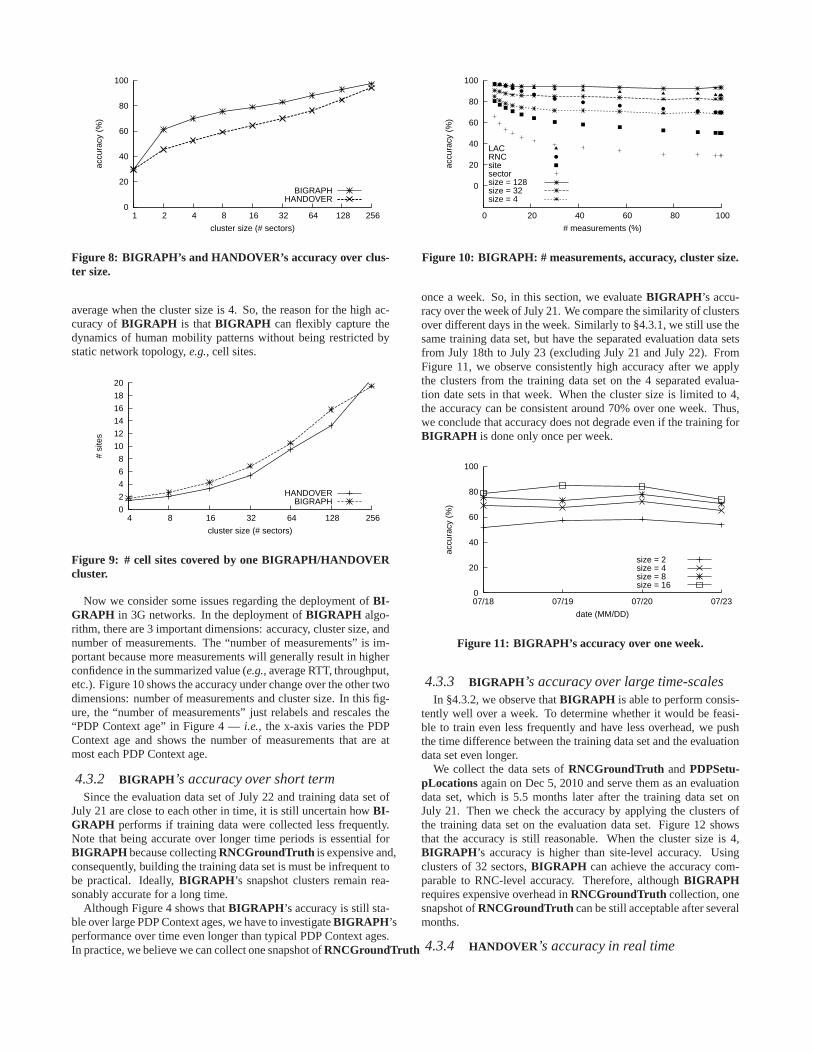
As we mentioned in §4.2.3, cluster size is a constraint on therecursive sparest cut. The smaller the cluster size, the more infor-mation is lost by the cutting. However, a smaller cluster size isbeneficial in practice as it reduces the overhead to narrow downthe candidate sectors,i.e., it improves the localization granularity.Figure 8 shows the impact of cluster size on the accuracy. We canimagine that if the cluster size is∞, the accuracy will be close to1. When the cluster size is 1, which is equal to the sector-levelaccuracy. When the cluster size is 4, 8, or 16, the accuracy risessignificantly, which confirms our expectation that subscribers usu-ally move within a small number of sectors.
Figure 9 explains why our small clusters perform better thancellsites, or even RNCs under some scenarios. We count the numberofunique cell sites that a singleBIGRAPH ’s cluster includes. FromFigure 9, we can observe that each cluster covers 2 cell sitesin
0
20
40
60
80
100
1 2 4 8 16 32 64 128 256
accu
racy
(%
)
cluster size (# sectors)
BIGRAPHHANDOVER
Figure 8: BIGRAPH’s and HANDOVER’s accuracy over clus-ter size.
average when the cluster size is 4. So, the reason for the highac-curacy ofBIGRAPH is thatBIGRAPH can flexibly capture thedynamics of human mobility patterns without being restricted bystatic network topology,e.g., cell sites.
0
2
4
6
8
10
12
14
16
18
20
4 8 16 32 64 128 256
# si
tes
cluster size (# sectors)
HANDOVERBIGRAPH
Figure 9: # cell sites covered by one BIGRAPH/HANDOVERcluster.
Now we consider some issues regarding the deployment ofBI-GRAPH in 3G networks. In the deployment ofBIGRAPH algo-rithm, there are 3 important dimensions: accuracy, clustersize, andnumber of measurements. The “number of measurements” is im-portant because more measurements will generally result inhigherconfidence in the summarized value (e.g., average RTT, throughput,etc.). Figure 10 shows the accuracy under change over the other twodimensions: number of measurements and cluster size. In this fig-ure, the “number of measurements” just relabels and rescales the“PDP Context age” in Figure 4 —i.e., the x-axis varies the PDPContext age and shows the number of measurements that are atmost each PDP Context age.
4.3.2 BIGRAPH ’s accuracy over short termSince the evaluation data set of July 22 and training data setof
July 21 are close to each other in time, it is still uncertain how BI-GRAPH performs if training data were collected less frequently.Note that being accurate over longer time periods is essential forBIGRAPH because collectingRNCGroundTruth is expensive and,consequently, building the training data set is must be infrequent tobe practical. Ideally,BIGRAPH ’s snapshot clusters remain rea-sonably accurate for a long time.
Although Figure 4 shows thatBIGRAPH ’s accuracy is still sta-ble over large PDP Context ages, we have to investigateBIGRAPH ’sperformance over time even longer than typical PDP Context ages.In practice, we believe we can collect one snapshot ofRNCGroundTruth
0
20
40
60
80
100
0 20 40 60 80 100
accu
racy
(%
)
# measurements (%)
LACRNCsitesectorsize = 128size = 32size = 4
Figure 10: BIGRAPH: # measurements, accuracy, cluster size.
once a week. So, in this section, we evaluateBIGRAPH ’s accu-racy over the week of July 21. We compare the similarity of clustersover different days in the week. Similarly to §4.3.1, we still use thesame training data set, but have the separated evaluation data setsfrom July 18th to July 23 (excluding July 21 and July 22). FromFigure 11, we observe consistently high accuracy after we applythe clusters from the training data set on the 4 separated evalua-tion date sets in that week. When the cluster size is limited to 4,the accuracy can be consistent around 70% over one week. Thus,we conclude that accuracy does not degrade even if the training forBIGRAPH is done only once per week.
0
20
40
60
80
100
07/18 07/19 07/20 07/23
accu
racy
(%
)
date (MM/DD)
size = 2size = 4size = 8size = 16
Figure 11: BIGRAPH’s accuracy over one week.
4.3.3 BIGRAPH ’s accuracy over large time-scalesIn §4.3.2, we observe thatBIGRAPH is able to perform consis-
tently well over a week. To determine whether it would be feasi-ble to train even less frequently and have less overhead, we pushthe time difference between the training data set and the evaluationdata set even longer.
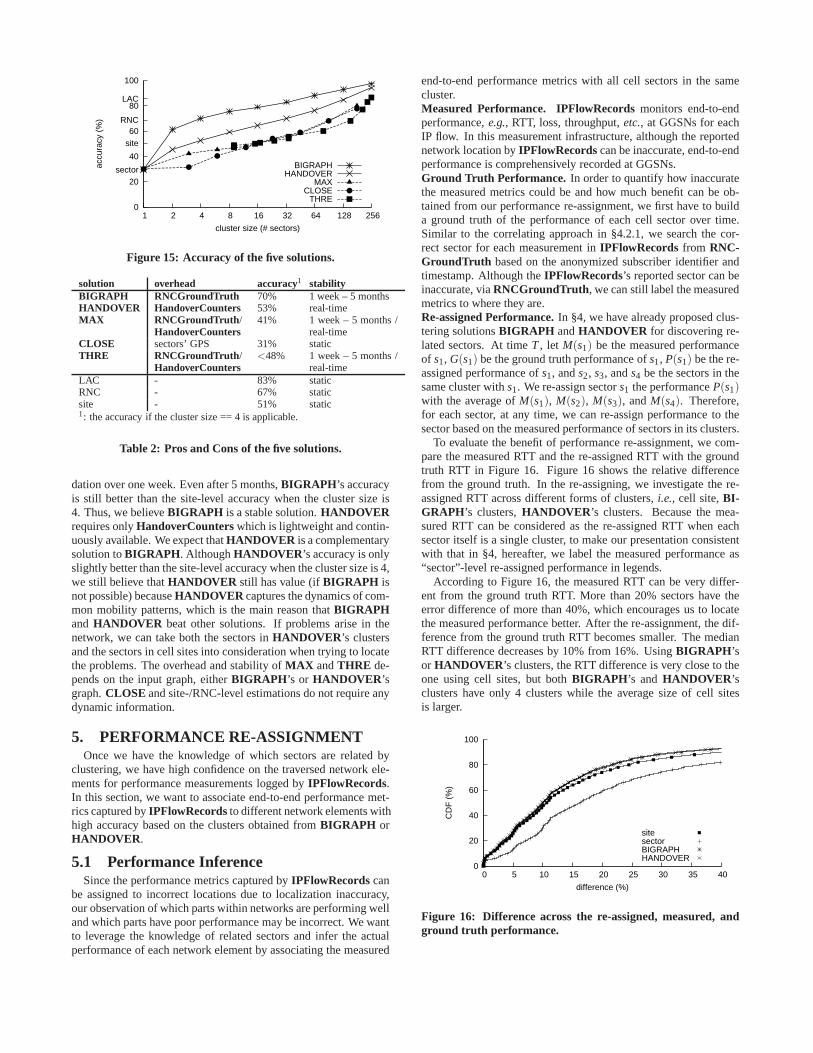
We collect the data sets ofRNCGroundTruth andPDPSetu-pLocations again on Dec 5, 2010 and serve them as an evaluationdata set, which is 5.5 months later after the training data set onJuly 21. Then we check the accuracy by applying the clusters ofthe training data set on the evaluation data set. Figure 12 showsthat the accuracy is still reasonable. When the cluster sizeis 4,BIGRAPH ’s accuracy is higher than site-level accuracy. Usingclusters of 32 sectors,BIGRAPH can achieve the accuracy com-parable to RNC-level accuracy. Therefore, althoughBIGRAPHrequires expensive overhead inRNCGroundTruth collection, onesnapshot ofRNCGroundTruth can be still acceptable after severalmonths.
4.3.4 HANDOVER ’s accuracy in real time

0
20
sector 40
site 60
RNC 80
LAC
100
1 2 4 8 16 32 64 128 256
accu
racy
(%
)
cluster size (# sectors)
BIGRAPH
Figure 12: BIGRAPH’s accuracy over 5 months.
HANDOVER is an alternative ofBIGRAPH on condition thatRNCGroundTruth is not available, since it computes clusters inreal time based on lightweightHandoverCounters. Once per hour,HANDOVER updates its graph, computes the sparest cut for thegraph, and ends up with a set of clusters. This section evaluatesHANDOVER ’s accuracy.
Figure 13 showsHANDOVER ’s real-time accuracy. Similar asBIGRAPH ’s accuracy,HANDOVER ’s accuracy is the probabilitythat the current locations of a measurement ofRNCGroundTruthagrees with the corresponding initial location byPDPSetupLoca-tions at the granularity ofHANDOVER ’s clusters. We observethatHANDOVER is consistently and significantly better then thesite-level accuracy. Also, we can see that the accuracy is alwayshigher in the earlier hours of day, which is probably due to usersless movement during the early morning.
Previous Figure 8 shows thatHANDOVER ’s performance isworse thanBIGRAPH , which is expected becauseRNCGroundTruthin BIGRAPH captures more information thanHandoverCountersin HANDOVER such as the start of PDP Contexts. Figure 9 alsoconfirms thatHANDOVER ’s clusters have slightly smaller cover-age over the number of cell sites thanBIGRAPH ’s clusters.
0
20
40
60
80
100
0 2 4 6 8 10 12 14 16
accu
racy
(%
)
time (hour)
sitesize = 4size = 8
Figure 13: HANDOVER’s accuracy over hours.
The impact of cluster size onHANDOVER is reflected by pre-vious Figure 8. As withBIGRAPH , the smallerHANDOVER ’scluster size is, the more information is lost by the cut. Figure 8shows that the accuracy degradation ifHANDOVER serves as analternative ofBIGRAPH . BIGRAPH ’s accuracy is 20% higherthanHANDOVER ’s when cluster size is between 2 – 8.
4.4 Naïve Heuristics Perform PoorlyBesidesBIGRAPH andHANDOVER , we investigate another
three solutions based on some straightforward heuristics.Thesesolutions are potential solutions under extreme cases, such as when
BIGRAPH ’s or HANDOVER ’s prerequisites at RNCs are com-pletely unavailable.MAX. This approach is based on eitherBIGRAPH ’s bipartite graphor HANDOVER ’s graph. Before the approach starts, each sectoritself is a cluster. Once started, each cluster repeatedly absorbs theneighboring sector that has the maximum edge cost with the sectorsinside this cluster. One cluster stops from growing as soon as it hitsthe constraint on cluster size. The whole absorbing processstops ifall clusters are determined.CLOSE. This approach is similar toMAX , but does not dependon any knowledge except the latitude and longitude of cell sectors.Since cell sectors are geographic areas directionally covered by cellsites, we use the (latitude, longitude) of the corresponding cell sitesto estimate the geographic coverage of cell sectors. Each clusterrepeatedly absorbs the sector with the closest physical distance toit until it hits the restricted the size.THRE. This approach is based on eitherBIGRAPH ’s or HAN-DOVER’s graph. It directly filters out those edges whose weightare smaller than a predefined threshold. The filtering will poten-tially leave the graph a set of disjoint clusters. The average clustersize, the maximum cluster size, and the accuracy is affectedby thethreshold. Note that one disadvantage of this approach is the un-certainty on the cluster size: the size could be very different acrossclusters as shown by Figure 14.THRE ’s maximum cluster size ismuch larger than the average cluster size, which indicates the im-balance of the graph is a natural phenomena. Larger cluster sizesmake it more difficult to assign performance to fine-grained net-work locations. Increasing the threshold on the minimum cost canreduce the maximum cluster size, but it results in high inaccuracyas well.
0
20
40
60
80
100
0.1 0.12 0.14 0.16 0.18 0.2 1
2
4
8
16
32
64
128
256
accu
racy
(%
)
clus
ter
size
(#
sect
ors)
edge threshold
accuracyavg. sizemax. size
Figure 14: THRE’s accuracy and average/maximum clustersize over threshold.
4.5 Pros and ConsFigure 15 shows the accuracy of all five solutions as we vary
the cluster size. Comparing the accuracy,BIGRAPH > HAN-DOVER > MAX ≈ CLOSE ≈ THRE . When the cluster size is 1,all five solutions have the same accuracy as the sector-levelaccu-racy. BIGRAPH performs better than site-level accuracy when itscluster contains more than two cell sectors. With the cluster size is4, HANDOVER can perform as good as site-level accuracy. Theaccuracy ofMAX , CLOSE, andTHRE is not sensitive to clustersize. Even if the cluster size is 64, these three solutions still cannotachieve the RNC-level accuracy.
Table 2 summarizes the properties of the five solutions.BI-GRAPH has the best accuracy, but has the highest measurementoverhead. In order to reduce the overhead, we can create snap-shot ofRNCGroundTruth periodically. As we discussed before,a one-day snapshot can perform very well without accuracy degra-
0
20sector
40
site 60
RNC
80LAC
100
1 2 4 8 16 32 64 128 256
accu
racy
(%
)
cluster size (# sectors)
BIGRAPHHANDOVER
MAXCLOSE
THRE
Figure 15: Accuracy of the five solutions.
solution overhead accuracy1 stabilityBIGRAPH RNCGroundTruth 70% 1 week – 5 monthsHANDOVER HandoverCounters 53% real-timeMAX RNCGroundTruth /
HandoverCounters41% 1 week – 5 months /
real-timeCLOSE sectors’ GPS 31% staticTHRE RNCGroundTruth /
HandoverCounters<48% 1 week – 5 months /
real-timeLAC - 83% staticRNC - 67% staticsite - 51% static1: the accuracy if the cluster size == 4 is applicable.
Table 2: Pros and Cons of the five solutions.
dation over one week. Even after 5 months,BIGRAPH ’s accuracyis still better than the site-level accuracy when the cluster size is4. Thus, we believeBIGRAPH is a stable solution.HANDOVERrequires onlyHandoverCounterswhich is lightweight and contin-uously available. We expect thatHANDOVER is a complementarysolution toBIGRAPH . AlthoughHANDOVER ’s accuracy is onlyslightly better than the site-level accuracy when the cluster size is 4,we still believe thatHANDOVER still has value (ifBIGRAPH isnot possible) becauseHANDOVER captures the dynamics of com-mon mobility patterns, which is the main reason thatBIGRAPHand HANDOVER beat other solutions. If problems arise in thenetwork, we can take both the sectors inHANDOVER ’s clustersand the sectors in cell sites into consideration when tryingto locatethe problems. The overhead and stability ofMAX andTHRE de-pends on the input graph, eitherBIGRAPH ’s or HANDOVER ’sgraph.CLOSE and site-/RNC-level estimations do not require anydynamic information.
5. PERFORMANCE RE-ASSIGNMENTOnce we have the knowledge of which sectors are related by
clustering, we have high confidence on the traversed networkele-ments for performance measurements logged byIPFlowRecords.In this section, we want to associate end-to-end performance met-rics captured byIPFlowRecordsto different network elements withhigh accuracy based on the clusters obtained fromBIGRAPH orHANDOVER .
5.1 Performance InferenceSince the performance metrics captured byIPFlowRecordscan
be assigned to incorrect locations due to localization inaccuracy,our observation of which parts within networks are performing welland which parts have poor performance may be incorrect. We wantto leverage the knowledge of related sectors and infer the actualperformance of each network element by associating the measured
end-to-end performance metrics with all cell sectors in thesamecluster.Measured Performance. IPFlowRecordsmonitors end-to-endperformance,e.g., RTT, loss, throughput,etc., at GGSNs for eachIP flow. In this measurement infrastructure, although the reportednetwork location byIPFlowRecordscan be inaccurate, end-to-endperformance is comprehensively recorded at GGSNs.Ground Truth Performance. In order to quantify how inaccuratethe measured metrics could be and how much benefit can be ob-tained from our performance re-assignment, we first have to builda ground truth of the performance of each cell sector over time.Similar to the correlating approach in §4.2.1, we search thecor-rect sector for each measurement inIPFlowRecords from RNC-GroundTruth based on the anonymized subscriber identifier andtimestamp. Although theIPFlowRecords’s reported sector can beinaccurate, viaRNCGroundTruth , we can still label the measuredmetrics to where they are.Re-assigned Performance.In §4, we have already proposed clus-tering solutionsBIGRAPH andHANDOVER for discovering re-lated sectors. At timeT , let M(s1) be the measured performanceof s1, G(s1) be the ground truth performance ofs1, P(s1) be the re-assigned performance ofs1, ands2, s3, ands4 be the sectors in thesame cluster withs1. We re-assign sectors1 the performanceP(s1)with the average ofM(s1), M(s2), M(s3), andM(s4). Therefore,for each sector, at any time, we can re-assign performance tothesector based on the measured performance of sectors in its clusters.
To evaluate the benefit of performance re-assignment, we com-pare the measured RTT and the re-assigned RTT with the groundtruth RTT in Figure 16. Figure 16 shows the relative differencefrom the ground truth. In the re-assigning, we investigate the re-assigned RTT across different forms of clusters,i.e., cell site,BI-GRAPH’s clusters,HANDOVER ’s clusters. Because the mea-sured RTT can be considered as the re-assigned RTT when eachsector itself is a single cluster, to make our presentation consistentwith that in §4, hereafter, we label the measured performance as“sector”-level re-assigned performance in legends.
According to Figure 16, the measured RTT can be very differ-ent from the ground truth RTT. More than 20% sectors have theerror difference of more than 40%, which encourages us to locatethe measured performance better. After the re-assignment,the dif-ference from the ground truth RTT becomes smaller. The medianRTT difference decreases by 10% from 16%. UsingBIGRAPH ’sor HANDOVER ’s clusters, the RTT difference is very close to theone using cell sites, but bothBIGRAPH ’s and HANDOVER ’sclusters have only 4 clusters while the average size of cell sitesis larger.
0
20
40
60
80
100
0 5 10 15 20 25 30 35 40
CD
F (
%)
difference (%)
sitesectorBIGRAPHHANDOVER
Figure 16: Difference across the re-assigned, measured, andground truth performance.
5.2 Anomaly DetectionThe relative difference of RTT is only one dimension for evalu-
ating the performance re-assignment. The accuracy with which there-assignment reflects performance changes is of particular interestas well because monitoring exceptional performance increases ordecreases is one way for cellular operators to detect anomalies.
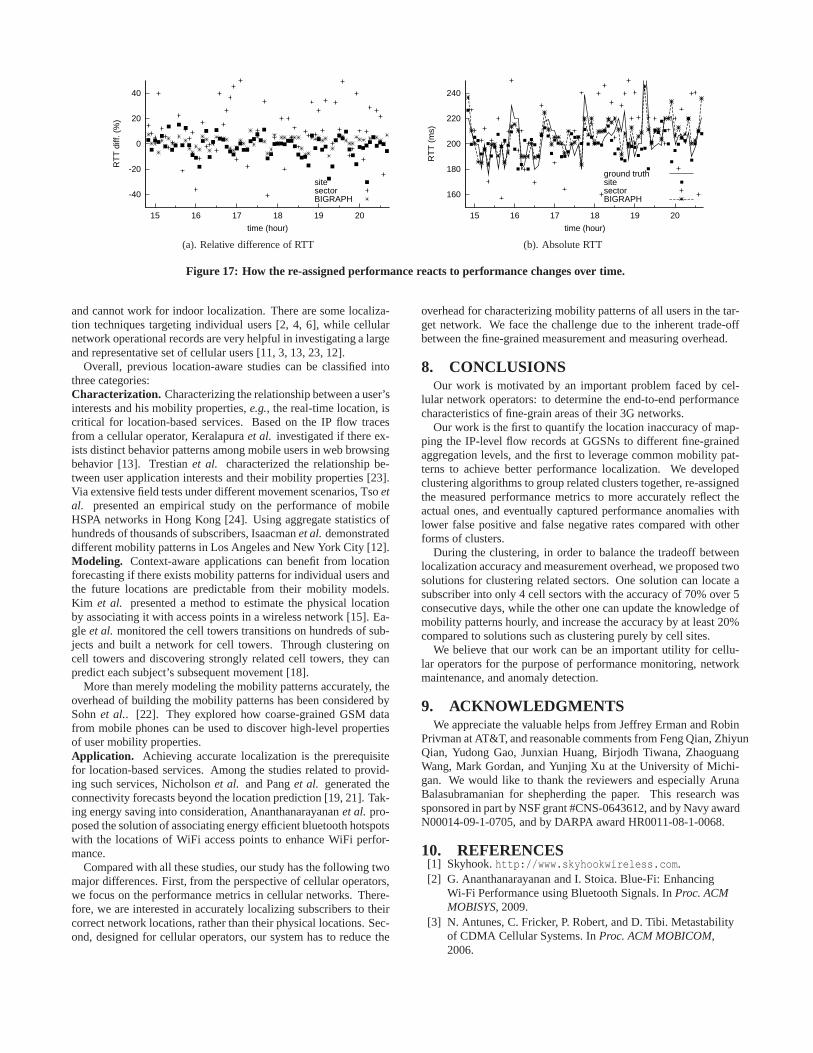
Figure 17 shows an example that re-assignment does well in cap-turing RTT spikes by comparing the re-assigned RTT and the mea-sured RTT with the ground truth one over a few hours. Figure 17(a)depicts the relative RTT difference over time, which confirms theobservation from Figure 16: before the re-assignment, the relativedifference has many outliers larger than 40%, but the RTT is mostlywithin +/-20% ground truth RTT after the re-assignment.
Instead of the relative difference, Figure 17(b) compares the ab-solute RTT over Figure 17(a). Most of the time, RTT spikes inthe ground truth are well captured by the re-assigned RTT basedon BIGRAPH ’s clusters, but not by the measured performanceand the re-assigned one based on cell sites. The measured per-formance is erratic and may have significant inaccuracy. Hereafter,for brevity, we do not include the re-assigned performance basedonHANDOVER ’s clusters if it has similar patterns toBIGRAPH .
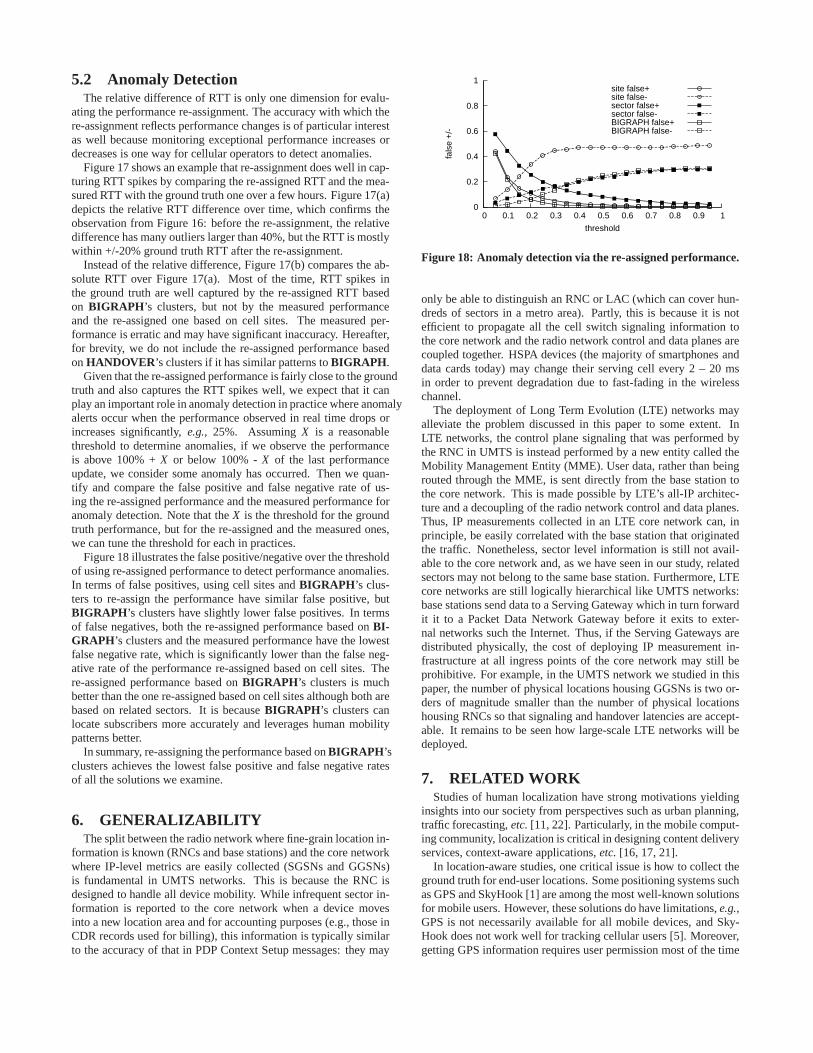
Given that the re-assigned performance is fairly close to the groundtruth and also captures the RTT spikes well, we expect that itcanplay an important role in anomaly detection in practice where anomalyalerts occur when the performance observed in real time drops orincreases significantly,e.g., 25%. AssumingX is a reasonablethreshold to determine anomalies, if we observe the performanceis above 100% +X or below 100% -X of the last performanceupdate, we consider some anomaly has occurred. Then we quan-tify and compare the false positive and false negative rate of us-ing the re-assigned performance and the measured performance foranomaly detection. Note that theX is the threshold for the groundtruth performance, but for the re-assigned and the measuredones,we can tune the threshold for each in practices.
Figure 18 illustrates the false positive/negative over thethresholdof using re-assigned performance to detect performance anomalies.In terms of false positives, using cell sites andBIGRAPH ’s clus-ters to re-assign the performance have similar false positive, butBIGRAPH ’s clusters have slightly lower false positives. In termsof false negatives, both the re-assigned performance basedon BI-GRAPH’s clusters and the measured performance have the lowestfalse negative rate, which is significantly lower than the false neg-ative rate of the performance re-assigned based on cell sites. There-assigned performance based onBIGRAPH ’s clusters is muchbetter than the one re-assigned based on cell sites althoughboth arebased on related sectors. It is becauseBIGRAPH ’s clusters canlocate subscribers more accurately and leverages human mobilitypatterns better.
In summary, re-assigning the performance based onBIGRAPH ’sclusters achieves the lowest false positive and false negative ratesof all the solutions we examine.
6. GENERALIZABILITYThe split between the radio network where fine-grain location in-
formation is known (RNCs and base stations) and the core networkwhere IP-level metrics are easily collected (SGSNs and GGSNs)is fundamental in UMTS networks. This is because the RNC isdesigned to handle all device mobility. While infrequent sector in-formation is reported to the core network when a device movesinto a new location area and for accounting purposes (e.g., those inCDR records used for billing), this information is typically similarto the accuracy of that in PDP Context Setup messages: they may
0
0.2
0.4
0.6
0.8
1
0 0.1 0.2 0.3 0.4 0.5 0.6 0.7 0.8 0.9 1
fals
e +
/-
threshold
site false+site false-sector false+sector false-BIGRAPH false+BIGRAPH false-
Figure 18: Anomaly detection via the re-assigned performance.
only be able to distinguish an RNC or LAC (which can cover hun-dreds of sectors in a metro area). Partly, this is because it is notefficient to propagate all the cell switch signaling information tothe core network and the radio network control and data planes arecoupled together. HSPA devices (the majority of smartphones anddata cards today) may change their serving cell every 2 – 20 msin order to prevent degradation due to fast-fading in the wirelesschannel.
The deployment of Long Term Evolution (LTE) networks mayalleviate the problem discussed in this paper to some extent. InLTE networks, the control plane signaling that was performed bythe RNC in UMTS is instead performed by a new entity called theMobility Management Entity (MME). User data, rather than beingrouted through the MME, is sent directly from the base station tothe core network. This is made possible by LTE’s all-IP architec-ture and a decoupling of the radio network control and data planes.Thus, IP measurements collected in an LTE core network can, inprinciple, be easily correlated with the base station that originatedthe traffic. Nonetheless, sector level information is stillnot avail-able to the core network and, as we have seen in our study, relatedsectors may not belong to the same base station. Furthermore, LTEcore networks are still logically hierarchical like UMTS networks:base stations send data to a Serving Gateway which in turn forwardit it to a Packet Data Network Gateway before it exits to exter-nal networks such the Internet. Thus, if the Serving Gateways aredistributed physically, the cost of deploying IP measurement in-frastructure at all ingress points of the core network may still beprohibitive. For example, in the UMTS network we studied in thispaper, the number of physical locations housing GGSNs is twoor-ders of magnitude smaller than the number of physical locationshousing RNCs so that signaling and handover latencies are accept-able. It remains to be seen how large-scale LTE networks willbedeployed.
7. RELATED WORKStudies of human localization have strong motivations yielding
insights into our society from perspectives such as urban planning,traffic forecasting,etc. [11, 22]. Particularly, in the mobile comput-ing community, localization is critical in designing content deliveryservices, context-aware applications,etc. [16, 17, 21].
In location-aware studies, one critical issue is how to collect theground truth for end-user locations. Some positioning systems suchas GPS and SkyHook [1] are among the most well-known solutionsfor mobile users. However, these solutions do have limitations,e.g.,GPS is not necessarily available for all mobile devices, andSky-Hook does not work well for tracking cellular users [5]. Moreover,getting GPS information requires user permission most of the time
-40
-20
0
20
40
15 16 17 18 19 20
RT
T d
iff. (
%)
time (hour)
sitesectorBIGRAPH 160
180
200
220
240
15 16 17 18 19 20
RT
T (
ms)
time (hour)
ground truthsitesectorBIGRAPH
(a). Relative difference of RTT (b). Absolute RTT
Figure 17: How the re-assigned performance reacts to performance changes over time.
and cannot work for indoor localization. There are some localiza-tion techniques targeting individual users [2, 4, 6], whilecellularnetwork operational records are very helpful in investigating a largeand representative set of cellular users [11, 3, 13, 23, 12].
Overall, previous location-aware studies can be classifiedintothree categories:Characterization. Characterizing the relationship between a user’sinterests and his mobility properties,e.g., the real-time location, iscritical for location-based services. Based on the IP flow tracesfrom a cellular operator, Keralapuraet al. investigated if there ex-ists distinct behavior patterns among mobile users in web browsingbehavior [13]. Trestianet al. characterized the relationship be-tween user application interests and their mobility properties [23].Via extensive field tests under different movement scenarios, Tsoetal. presented an empirical study on the performance of mobileHSPA networks in Hong Kong [24]. Using aggregate statisticsofhundreds of thousands of subscribers, Isaacmanet al. demonstrateddifferent mobility patterns in Los Angeles and New York City[12].Modeling. Context-aware applications can benefit from locationforecasting if there exists mobility patterns for individual users andthe future locations are predictable from their mobility models.Kim et al. presented a method to estimate the physical locationby associating it with access points in a wireless network [15]. Ea-gle et al. monitored the cell towers transitions on hundreds of sub-jects and built a network for cell towers. Through clustering oncell towers and discovering strongly related cell towers, they canpredict each subject’s subsequent movement [18].
More than merely modeling the mobility patterns accurately, theoverhead of building the mobility patterns has been considered bySohnet al.. [22]. They explored how coarse-grained GSM datafrom mobile phones can be used to discover high-level propertiesof user mobility properties.Application. Achieving accurate localization is the prerequisitefor location-based services. Among the studies related to provid-ing such services, Nicholsonet al. and Panget al. generated theconnectivity forecasts beyond the location prediction [19, 21]. Tak-ing energy saving into consideration, Ananthanarayananet al. pro-posed the solution of associating energy efficient bluetooth hotspotswith the locations of WiFi access points to enhance WiFi perfor-mance.
Compared with all these studies, our study has the followingtwomajor differences. First, from the perspective of cellularoperators,we focus on the performance metrics in cellular networks. There-fore, we are interested in accurately localizing subscribers to theircorrect network locations, rather than their physical locations. Sec-ond, designed for cellular operators, our system has to reduce the
overhead for characterizing mobility patterns of all usersin the tar-get network. We face the challenge due to the inherent trade-offbetween the fine-grained measurement and measuring overhead.
8. CONCLUSIONSOur work is motivated by an important problem faced by cel-
lular network operators: to determine the end-to-end performancecharacteristics of fine-grain areas of their 3G networks.
Our work is the first to quantify the location inaccuracy of map-ping the IP-level flow records at GGSNs to different fine-grainedaggregation levels, and the first to leverage common mobility pat-terns to achieve better performance localization. We developedclustering algorithms to group related clusters together,re-assignedthe measured performance metrics to more accurately reflecttheactual ones, and eventually captured performance anomalies withlower false positive and false negative rates compared withotherforms of clusters.
During the clustering, in order to balance the tradeoff betweenlocalization accuracy and measurement overhead, we proposed twosolutions for clustering related sectors. One solution canlocate asubscriber into only 4 cell sectors with the accuracy of 70% over 5consecutive days, while the other one can update the knowledge ofmobility patterns hourly, and increase the accuracy by at least 20%compared to solutions such as clustering purely by cell sites.
We believe that our work can be an important utility for cellu-lar operators for the purpose of performance monitoring, networkmaintenance, and anomaly detection.
9. ACKNOWLEDGMENTSWe appreciate the valuable helps from Jeffrey Erman and Robin
Privman at AT&T, and reasonable comments from Feng Qian, ZhiyunQian, Yudong Gao, Junxian Huang, Birjodh Tiwana, ZhaoguangWang, Mark Gordan, and Yunjing Xu at the University of Michi-gan. We would like to thank the reviewers and especially ArunaBalasubramanian for shepherding the paper. This research wassponsored in part by NSF grant #CNS-0643612, and by Navy awardN00014-09-1-0705, and by DARPA award HR0011-08-1-0068.
10. REFERENCES[1] Skyhook.http://www.skyhookwireless.com.[2] G. Ananthanarayanan and I. Stoica. Blue-Fi: Enhancing
Wi-Fi Performance using Bluetooth Signals. InProc. ACMMOBISYS, 2009.
[3] N. Antunes, C. Fricker, P. Robert, and D. Tibi. Metastabilityof CDMA Cellular Systems. InProc. ACM MOBICOM,2006.
[4] M. Azizyan, I. Constandache, and R. R. Choudhury.SurroundSense: Mobile Phone Localization via AmbienceFingerprinting. InProc. ACM MOBICOM, 2009.
[5] M. Balakrishnan, I. Mohomed, and V. Ramasubramanian.Where’s that Phone?: Geolocating IP Addresses on 3GNetworks. InProc. ACM SIGCOMM IMC, 2009.
[6] N. Banerjee, S. Agarwal, P. Bahl, R. Chandra, A. Wolman,and M. Corner. Virtual Compass: Relative Positioning toSense Mobile Social Interactions. InProc. IEEEPERVASIVE, 2010.
[7] J. But, U. Keller, and G. Armitage. Passive TCP StreamEstimation of RTT and Jitter Parameters. InProc. IEEELCN, 2005.
[8] B. Claise. Cisco Systems NetFlow Services Export Version9. IETF RFC 3954, 2004.
[9] C. Cranor, T. Johnson, O. Spatscheck, and V. Shkapenyuk.Gigascope: A Stream Satabase for Network Applications. InProc. ACM SIGMOD, 2003.
[10] A. Gerber, J. Pang, O. Spatscheck, and S. Venkataraman.Speed Testing without Speed Tests: Estimating AchievableDownload Speed from Passive Measurements. InProc. ACMSIGCOMM IMC, 2010.
[11] M. C. Gonzalez, C. A. Hidalgo, and A.-L. Barabasi.Understanding Individual Human Mobility Patterns.453(7196):779–782, June 2008.
[12] S. Isaacman, R. Becker, R. CÃaceres, S. Kobourov, J. Rowl,and E. Varshavsky. A Tale of Two Cities. InProc. Workshopon Mobile Computing Systems and Applications(HotMobile), 2010.
[13] R. Keralapura, A. Nucci, Z.-L. Zhang, and L. Gao. ProfilingUsers in a 3G Network Using Hourglass Co-Clustering. InProc. ACM MOBICOM, 2010.
[14] B. W. Kernighan and S. Lin. An Efficient HeuristicProcedure for Partitioning Graphs.Bell Systems TechnicalJournal, 49, 1970.
[15] M. Kim, D. Kotz, and S. Kim. Extracting a mobility modelfrom real user traces. InProc. IEEE INFOCOM, 2006.
[16] Z. M. Mao, C. D. Cranor, F. Bouglis, M. Rabinovich,O. Spatscheck, and J. Wang. A Precise and EfficientEvaluation of the Proximity between Web Clients and theirLocal DNS Servers. InProc. USENIX Annual TechnicalConference, 2002.
[17] S. Mathur, T. Jin, N. Kasturirangan, J. Ch, W. Xue, andM. Gruteser. ParkNet: Drive-by Sensing of Road-SideParking Statistics. InProc. ACM MOBISYS, 2010.
[18] J. Q. N. Eagle, A. Clauset. Methodologies for ContinuousCellular Tower Data Analysis. InProc. IEEE PERVASIVE,2009.
[19] A. J. Nicholson and B. D. Noble. BreadCrumbs: ForecastingMobile Connectivity. InProc. ACM MOBICOM, 2008.
[20] J. Pahdye and S. Floyd. On inferring TCP behavior. InProc.ACM SIGCOMM, 2001.
[21] J. Pang, B. Greenstein, M. Kaminsky, D. Mccoy, andS. Seshan. WiFi-Reports: Improving Wireless NetworkSelection with Collaboration. InProc. ACM MOBISYS, 2009.
[22] T. Sohn, A. Varshavsky, A. Lamarca, M. Y. Chen,T. Choudhury, I. Smith, S. Consolvo, J. Hightower, W. G.Griswold, and E. D. Lara. Mobility Detection UsingEveryday GSM Traces. InProc. ACM UBICOMP, 2006.
[23] I. Trestian, S. Ranjan, A. Kuzmanovic, and A. Nucci.Measuring Serendipity: Connecting People, Locations AndInterests In A Mobile 3G Network. InProc. ACMSIGCOMM IMC, 2009.
[24] F. P. Tso, J. Teng, W. Jia, and D. Xuan. Mobility: ADouble-Edged Sword for HSPA Networks. InProc. ACMMOBIHOC, 2010.
[25] Q. Xu, J. Huang, Z. Wang, F. Qian, A. Gerber, and Z. Mao.Cellular Data Network Infrastructure Characterization andImplication on Mobile Content Placement. InProc. ACMSIGMETRICS, 2011.