Embed Size (px)
Citation preview
Financial statements aim at providing financialinformation about a business enterprise to meet
the information needs of the decision-makers.Financial statements prepared by a businessenterprise in the corporate sector are published andare available to the decision-makers. Thesestatements provide financial data which requireanalysis, comparison and interpretation for takingdecision by the external as well as internal users ofaccounting information. This act is termed asfinancial statement analysis. It is regarded as anintegral and important part of accounting. Asindicated in the previous chapter, the mostcommonly used techniques of financial statements,analysis are comparative statements, common sizestatements, trend analysis, accounting ratios andcash flow analysis. The first three have beendiscussed in detail in the previous chapter. Thischapter covers the technique of accounting ratiosfor analysing the information contained in financialstatements for assessing the solvency, efficiency andprofitability of the enterprises.
5.15.15.15.15.1 Meaning of Accounting RatiosMeaning of Accounting RatiosMeaning of Accounting RatiosMeaning of Accounting RatiosMeaning of Accounting Ratios
As stated earlier, accounting ratios are an importanttool of financial statements analysis. A ratio is amathematical number calculated as a reference torelationship of two or more numbers and can beexpressed as a fraction, proportion, percentage anda number of times. When the number is calculatedby referring to two accounting numbers derived from
LLLLLEARNINGEARNINGEARNINGEARNINGEARNING O O O O OBJECTIVESBJECTIVESBJECTIVESBJECTIVESBJECTIVES
After studying this chapter,you will be able to :• Explain the meaning,
objectives andlimitations of analysisusing accounting ratios;
• Identify the varioustypes of ratioscommonly used ;
• Calculate various ratiosto assess solvency,liquidity, efficiency andprofitability of the firm;
• Interpret the variousratios calculated forintra-firm and inter-firm comparisons.
Accounting RatiosAccounting RatiosAccounting RatiosAccounting RatiosAccounting Ratios 55555
203Accounting Ratios
the financial statements, it is termed as accounting ratio. For example, if thegross profit of the business is Rs. 10,000 and the ‘Revenue from Operations’ areRs. 1,00,000, it can be said that the gross profit is 10% (10,000/1,00,000) ofthe ‘Revenue from Operations’ . This ratio is termed as gross profit ratio. Similarly,inventory turnover ratio may be 6 which implies that inventory turns into‘Revenue from Operations’ six times in a year.
It needs to be observed that accounting ratios exhibit relationship, if anybetween accounting numbers extracted from financial statements, they areessentially derived numbers and their efficacy depends a great deal upon thebasic numbers from which they are calculated. Hence, if the financial statementscontain some errors, the derived numbers in terms of ratio analysis would alsopresent an erroneous scenerio. Further, a ratio must be calculated usingnumbers which are meaningfully correlated. A ratio calculated by using twounrelated numbers would hardly serve any purpose. For example, the furnitureof the business is Rs. 1,00,000 and Purchases are Rs. 3,00,000. The ratio ofpurchases to furniture is 3 (3,00,000/1,00,000) but it hardly has any relevance.The reason is that there is no relationship between these two aspects.
5.25.25.25.25.2 Objectives of Ratio AnalysisObjectives of Ratio AnalysisObjectives of Ratio AnalysisObjectives of Ratio AnalysisObjectives of Ratio Analysis
Ratio analysis is indispensable part of interpretation of results revealed by thefinancial statements. It provides users with crucial financial information andpoints out the areas which require investigation. Ratio analysis is a techniquewhich involves regrouping of data by application of arithmetical relationships,though its interpretation is a complex matter. It requires a fine understandingof the way and the rules used for preparing financial statements. Once doneeffectively, it provides a wealth of information which helps the analyst:
1. To know the areas of the business which need more attention;2. To know about the potential areas which can be improved with the
effort in the desired direction;3. To provide a deeper analysis of the profitability, liquidity, solvency
and efficiency levels in the business;4. To provide information for making cross sectional analysis by
comparing the performance with the best industry standards; and5. To provide information derived from financial statements useful for
making projections and estimates for the future.
5.35.35.35.35.3 Advantages of Ratio AnalysisAdvantages of Ratio AnalysisAdvantages of Ratio AnalysisAdvantages of Ratio AnalysisAdvantages of Ratio Analysis
The ratio analysis if properly done improves the user’s understanding of theefficiency with which the business is being conducted. The numericalrelationships throw light on many latent aspects of the business. If properlyanalysed, the ratios make us understand various problem areas as well as the
204 Accountancy : Company Accounts and Analysis of Financial Statements
bright spots of the business. The knowledge of problem areas help managementtake care of them in future. The knowledge of areas which are working betterhelps you improve the situation further. It must be emphasised that ratios aremeans to an end rather than the end in themselves. Their role is essentiallyindicative and that of a whistle blower. There are many advantages derived fromratio analysis. These are summarised as follows:
1. Helps understand efficacy of decisions: The ratio analysis helps youunderstand whether the business firm has taken the right kind ofoperating, investing and financing decisions. It indicates how far theyhave helped in improving the performance.
2. Simplify complex figures and establish relationships: Ratios help insimplifying the complex accounting figures and bring out theirrelationships. They help summarise the financial information effectivelyand assess the managerial efficiency, firm’s credit worthiness, earningcapacity, etc.
3. Helpful in comparative analysis: The ratios are not be calculated forone year only. When many year figures are kept side by side, they helpa great deal in exploring the trends visible in the business. Theknowledge of trend helps in making projections about the businesswhich is a very useful feature.
4. Identification of problem areas: Ratios help business in identifyingthe problem areas as well as the bright areas of the business. Problemareas would need more attention and bright areas will need polishingto have still better results.
5. Enables SWOT analysis: Ratios help a great deal in explaining thechanges occurring in the business. The information of change helpsthe management a great deal in understanding the current threatsand opportunities and allows business to do its own SWOT (Strength-Weakness-Opportunity-Threat) analysis.
6. Various comparisons: Ratios help comparisons with certain benchmarks to assess as to whether firm, performance is better or otherwise.For this purpose, the profitability, liquidity, solvency, etc. of a businessmay be compared: (i) over a number of accounting periods with itself(Intra-firm Comparison/Time Series Analysis), (ii) with other businessenterprises (Inter-firm Comparison/Cross-sectional Analysis), and(iii) with standards set for that firm/industry (comparison with standard(or industry) expectations).
5.45.45.45.45.4 Limitations of Ratio AnalysisLimitations of Ratio AnalysisLimitations of Ratio AnalysisLimitations of Ratio AnalysisLimitations of Ratio Analysis
Since the ratios are derived from the financial statements, any weakness in theoriginal financial statements will also creep in the derived analysis in the form of
205Accounting Ratios
ratio analysis. Thus, the limitations of financial statements also form thelimitations of the ratio analysis. Hence, to interpret the ratios, the user shouldbe aware of the rules followed in the preparation of financial statements andalso their nature and limitations. The limitations of ratio analysis which ariseprimarily from the nature of financial statements are as under:
1. Limitations of Accounting Data: Accounting data give an unwarrantedimpression of precision and finality. In fact, accounting data “reflect acombination of recorded facts, accounting conventions and personaljudgements and the judgements and conventions applied affect themmaterially. For example, profit of the business is not a precise andfinal figure. It is merely an opinion of the accountant based onapplication of accounting policies. The soundness of the judgementnecessarily depends on the competence and integrity of those whomake them and on their adherence to Generally Accepted AccountingPrinciples and Conventions”. Thus, the financial statements may notreveal the true state of affairs of the enterprises and so the ratios willalso not give the true picture.
2. Ignores Price-level Changes: The financial accounting is based onstable money measurement principle. It implicitly assumes that pricelevel changes are either non-existent or minimal. But the truth isotherwise. We are normally living in inflationary economies where thepower of money declines constantly. A change in the price level makesanalysis of financial statement of different accounting years meaninglessbecause accounting records ignore changes in value of money.
3. Ignore Qualitative or Non-monetary Aspects: Accounting providesinformation about quantitative (or monetary) aspects of business.Hence, the ratios also reflect only the monetary aspects, ignoringcompletely the non-monetary (qualitative) factors.
4. Variations in Accounting Practices: There are differing accountingpolicies for valuation of inventory, calculation of depreciation, treatmentof intangibles, definition of certain financial variables etc. available forvarious aspects of business transactions. These variations leave a bigquestion mark on the cross sectional analysis. As there are variationsin accounting practices followed by different business enterprises, avalid comparison of their financial statements is not possible.
5. Forecasting: Forecasting of future trends based only on historicalanalysis is not feasible. Proper forecasting requires consideration ofnon-financial factors as well.
Now let us talk about the limitations of the ratios. The various limitationsare:
1. Means and not the End: Ratios are means to an end rather than theend by itself.

206 Accountancy : Company Accounts and Analysis of Financial Statements
2. Lack of ability to resolve problems: Their role is essentially indicativeand of whistle blowing and not providing a solution to the problem.
3. Lack of standardised definitions: There is a lack of standardiseddefinitions of various concepts used in ratio analysis. For example,there is no standard definition of liquid liabilities. Normally, it includesall current liabilities, but sometimes it refers to current liabilities lessbank overdraft.
4. Lack of universally accepted standard levels: There is no universalyardstick which specifies the level of ideal ratios. There is no standardlist of the levels universally acceptable, and, in India, the industryaverages are also not available.
5. Ratios based on unrelated figures: A ratio calculated for unrelatedfigures would essentially be a meaningless exercise. For example,creditors of Rs. 1,00,000 and furniture of Rs. 1,00,000 represent aratio of 1:1. But it has no relevance to assess efficiency or solvency.
Hence, ratios should be used with due consciousness of their limitationswhile evaluatory the performance of an organisation and planning the futurestrategies for its improvement.
Test your Understanding – ITest your Understanding – ITest your Understanding – ITest your Understanding – ITest your Understanding – I
1.1.1.1.1. State which of the following statements are True or False.State which of the following statements are True or False.State which of the following statements are True or False.State which of the following statements are True or False.State which of the following statements are True or False.
(a) The only purpose of financial reporting is to keep the managers informedabout the progress of operations.
(b) Analyses of data provided in the financial statements is termed as financialanalysis.
(c) Long-term borrowing are concerned about the ability of a firm to dischargeits obligations to pay interest and repay the principal amount.
(d) A ratio is always expressed as a quotient of one number divided by another.
(e) Ratios help in comparisons of a firm’s results over a number of accountingperiods as well as with other business enterprises.
(f) A ratio reflects quantitative and qualitative aspects of results.
5.55.55.55.55.5 Types of RatiosTypes of RatiosTypes of RatiosTypes of RatiosTypes of Ratios
There is a two way classification of ratios: (1) traditional classification, and(2) functional classification. The traditional classification has been on the basisof financial statements to which the determinants of ratios belong. On this basisthe ratios are classified as follows:
1. ‘Statement of Profit and Loss’ Ratios: A ratio of two variables from thestatement of profit and loss is known as statement of profit and lossratio. For example, ratio of gross profit to revenue from operationsknown as gross profit ratio is calculated using both figures from thestatement of profit and loss.
207Accounting Ratios
2. Balance Sheet Ratios: In case both variables are from the balancesheet, it is classified as balance sheet ratios. For example, ratio ofcurrent assets to current liabilities known as current ratio is calculatedusing both figures from balance sheet.
3. Composite Ratios: If a ratio is computed with one variable from thestatement of profit and loss and another variable from the balancesheet, it is called composite ratio. For example, ratio of credit revenuefrom operations to trade receivables, known as trade receivablesturnover ratio, is calculated using one figure from the statement ofprofit and loss (credit revenue from operations) and another figurefrom the balance sheet.
Although accounting ratios are calculated by taking data from financialstatements but classification of ratios on the basis of financial statements israrely used in practice. It must be recalled that basic purpose of accounting isto throw light on the financial performance (profitability) and financial position(its capacity to raise money and invest them wisely) as well as changes occurringin financial position (possible explanation of changes in the activity level). Assuch, the alternative classification (functional classification) based on the purposefor which a ratio is computed, is the most commonly used classification which isas follows:
1. Liquidity Ratios: To meet its commitments, business needs liquidfunds. The ability of the business to pay the amount due tostakeholders as and when it is due is known as liquidity, and theratios calculated to measure it are known as ‘Liquidity Ratios’. Theseare essentially short-term in nature.
2. Solvency Ratios: Solvency of business is determined by its ability tomeet its contractual obligations towards stakeholders, particularlytowards external stakeholders, and the ratios calculated to measuresolvency position are known as ‘Solvency Ratios’. These are essentiallylong-term in nature.
3. Activity (or Turnover) Ratios: This refers to the ratios that are calculatedfor measuring the efficiency of operations of business based on effectiveutilisation of resources. Hence, these are also known as ‘EfficiencyRatios’.
4. Profitability Ratios: It refers to the analysis of profits in relation torevenue from operations or funds (or assets) employed in the businessand the ratios calculated to meet this objective are known as ‘ProfitabilityRatios’.
208 Accountancy : Company Accounts and Analysis of Financial Statements
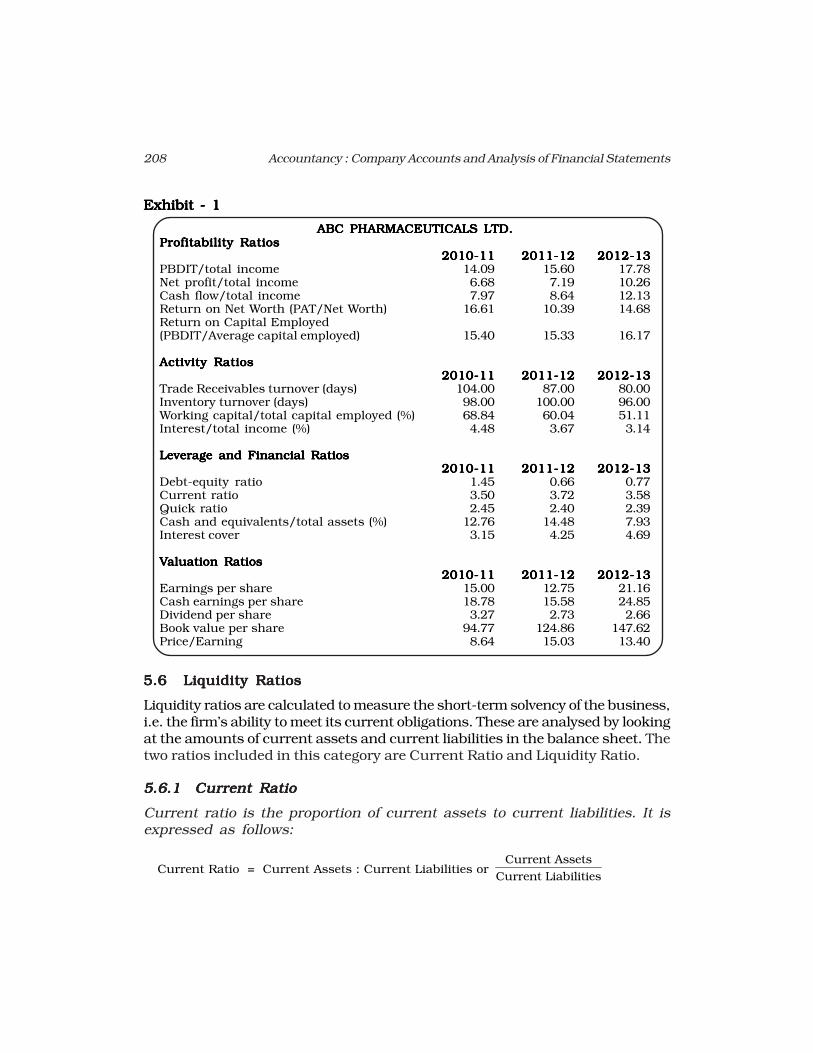
Exhibit - 1Exhibit - 1Exhibit - 1Exhibit - 1Exhibit - 1
ABC PHARMACEUTICALS LTD.ABC PHARMACEUTICALS LTD.ABC PHARMACEUTICALS LTD.ABC PHARMACEUTICALS LTD.ABC PHARMACEUTICALS LTD.Profitability RatiosProfitability RatiosProfitability RatiosProfitability RatiosProfitability Ratios
2010-112010-112010-112010-112010-11 2011-122011-122011-122011-122011-12 2012-132012-132012-132012-132012-13PBDIT/total income 14.09 15.60 17.78Net profit/total income 6.68 7.19 10.26Cash flow/total income 7.97 8.64 12.13Return on Net Worth (PAT/Net Worth) 16.61 10.39 14.68Return on Capital Employed(PBDIT/Average capital employed) 15.40 15.33 16.17
Activity RatiosActivity RatiosActivity RatiosActivity RatiosActivity Ratios2010-112010-112010-112010-112010-11 2011-122011-122011-122011-122011-12 2012-132012-132012-132012-132012-13
Trade Receivables turnover (days) 104.00 87.00 80.00Inventory turnover (days) 98.00 100.00 96.00Working capital/total capital employed (%) 68.84 60.04 51.11Interest/total income (%) 4.48 3.67 3.14
Leverage and Financial RatiosLeverage and Financial RatiosLeverage and Financial RatiosLeverage and Financial RatiosLeverage and Financial Ratios2010-112010-112010-112010-112010-11 2011-122011-122011-122011-122011-12 2012-132012-132012-132012-132012-13
Debt-equity ratio 1.45 0.66 0.77Current ratio 3.50 3.72 3.58Quick ratio 2.45 2.40 2.39Cash and equivalents/total assets (%) 12.76 14.48 7.93Interest cover 3.15 4.25 4.69
VVVVValuation Ratiosaluation Ratiosaluation Ratiosaluation Ratiosaluation Ratios2010-112010-112010-112010-112010-11 2011-122011-122011-122011-122011-12 2012-132012-132012-132012-132012-13
Earnings per share 15.00 12.75 21.16Cash earnings per share 18.78 15.58 24.85Dividend per share 3.27 2.73 2.66Book value per share 94.77 124.86 147.62Price/Earning 8.64 15.03 13.40
5.65.65.65.65.6 Liquidity RatiosLiquidity RatiosLiquidity RatiosLiquidity RatiosLiquidity Ratios
Liquidity ratios are calculated to measure the short-term solvency of the business,i.e. the firm’s ability to meet its current obligations. These are analysed by lookingat the amounts of current assets and current liabilities in the balance sheet. Thetwo ratios included in this category are Current Ratio and Liquidity Ratio.
5.6.1 Current Ratio5.6.1 Current Ratio5.6.1 Current Ratio5.6.1 Current Ratio5.6.1 Current Ratio
Current ratio is the proportion of current assets to current liabilities. It isexpressed as follows:
Current Ratio = Current Assets : Current Liabilities or Current Assets
Current Liabilities
209Accounting Ratios
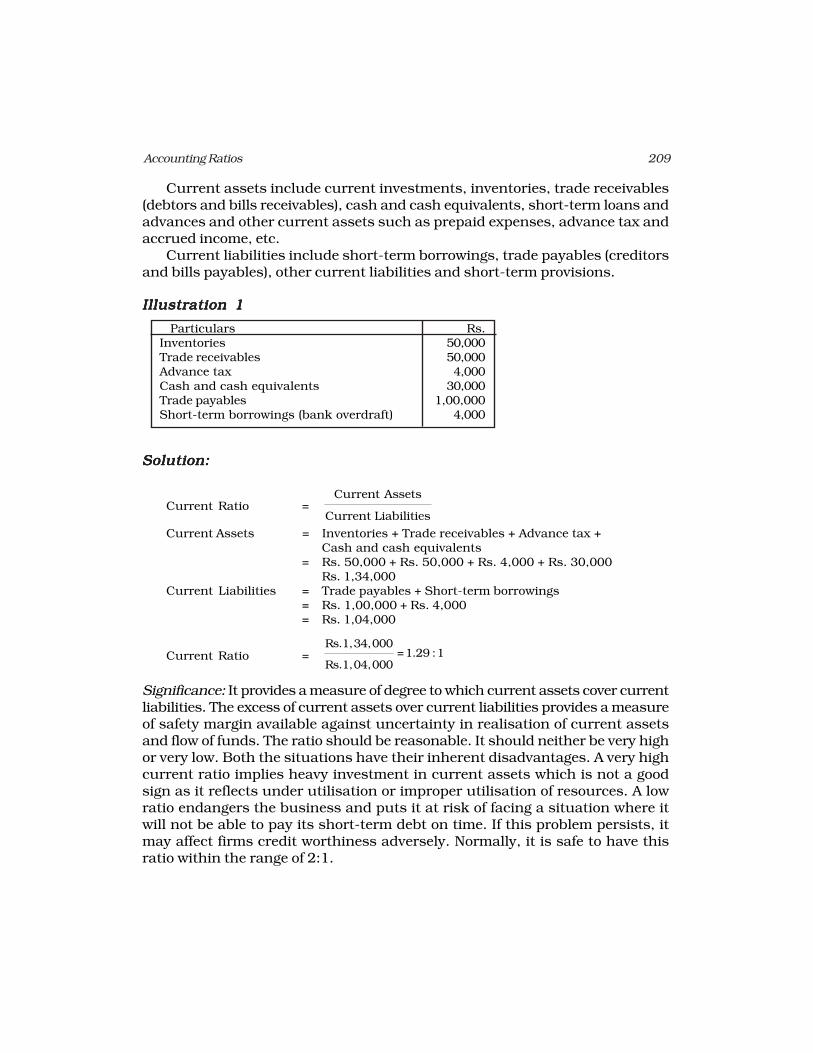
Current assets include current investments, inventories, trade receivables(debtors and bills receivables), cash and cash equivalents, short-term loans andadvances and other current assets such as prepaid expenses, advance tax andaccrued income, etc.
Current liabilities include short-term borrowings, trade payables (creditorsand bills payables), other current liabilities and short-term provisions.
Illustration 1Illustration 1Illustration 1Illustration 1Illustration 1
Particulars Rs.Inventories 50,000Trade receivables 50,000Advance tax 4,000Cash and cash equivalents 30,000Trade payables 1,00,000Short-term borrowings (bank overdraft) 4,000
Solution:Solution:Solution:Solution:Solution:
Current Ratio =Current Assets
Current Liabilities
Current Assets = Inventories + Trade receivables + Advance tax +Cash and cash equivalents
= Rs. 50,000 + Rs. 50,000 + Rs. 4,000 + Rs. 30,000Rs. 1,34,000
Current Liabilities = Trade payables + Short-term borrowings= Rs. 1,00,000 + Rs. 4,000= Rs. 1,04,000
Current Ratio =Rs.1,34,000
=1.29 :1Rs.1,04,000
Significance: It provides a measure of degree to which current assets cover currentliabilities. The excess of current assets over current liabilities provides a measureof safety margin available against uncertainty in realisation of current assetsand flow of funds. The ratio should be reasonable. It should neither be very highor very low. Both the situations have their inherent disadvantages. A very highcurrent ratio implies heavy investment in current assets which is not a goodsign as it reflects under utilisation or improper utilisation of resources. A lowratio endangers the business and puts it at risk of facing a situation where itwill not be able to pay its short-term debt on time. If this problem persists, itmay affect firms credit worthiness adversely. Normally, it is safe to have thisratio within the range of 2:1.
210 Accountancy : Company Accounts and Analysis of Financial Statements
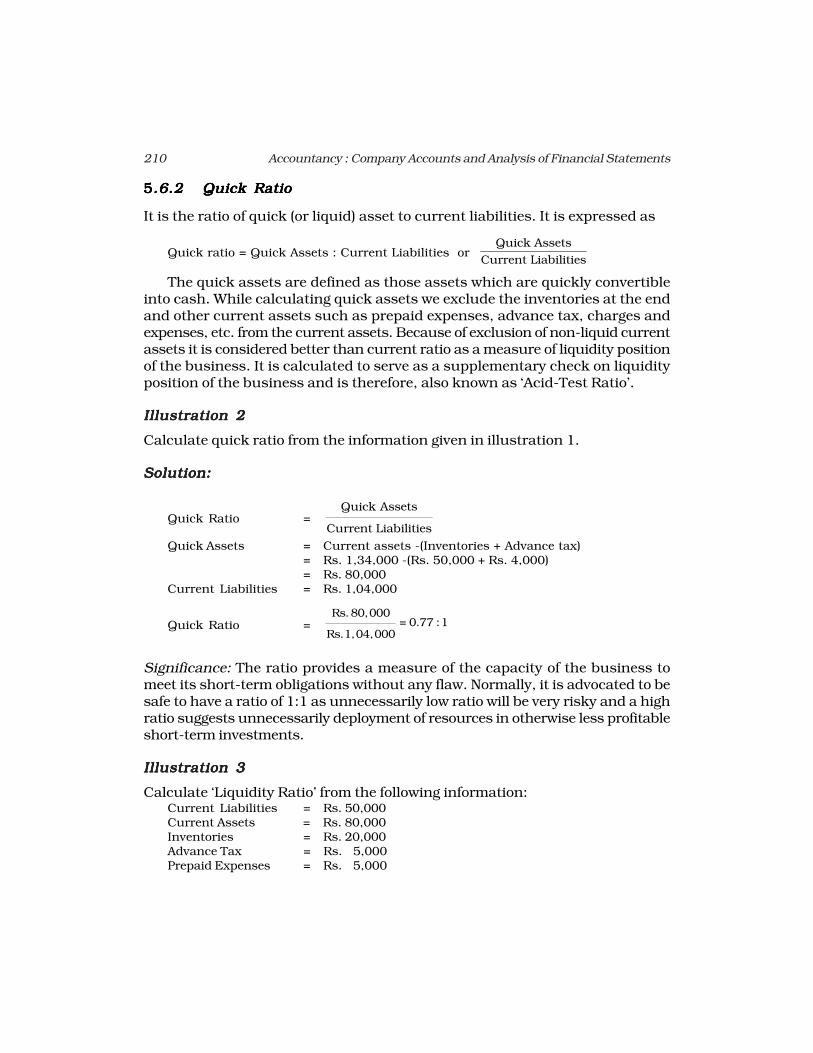
55555.6.2.6.2.6.2.6.2.6.2 Quick RatioQuick RatioQuick RatioQuick RatioQuick Ratio
It is the ratio of quick (or liquid) asset to current liabilities. It is expressed as
Quick ratio = Quick Assets : Current Liabilities or Quick Assets
Current Liabilities
The quick assets are defined as those assets which are quickly convertibleinto cash. While calculating quick assets we exclude the inventories at the endand other current assets such as prepaid expenses, advance tax, charges andexpenses, etc. from the current assets. Because of exclusion of non-liquid currentassets it is considered better than current ratio as a measure of liquidity positionof the business. It is calculated to serve as a supplementary check on liquidityposition of the business and is therefore, also known as ‘Acid-Test Ratio’.
Illustration 2Illustration 2Illustration 2Illustration 2Illustration 2
Calculate quick ratio from the information given in illustration 1.
Solution:Solution:Solution:Solution:Solution:
Quick Ratio =Quick Assets
Current Liabilities
Quick Assets = Current assets -(Inventories + Advance tax)= Rs. 1,34,000 -(Rs. 50,000 + Rs. 4,000)= Rs. 80,000
Current Liabilities = Rs. 1,04,000
Quick Ratio =Rs. 80,000
= 0.77 :1Rs. 1,04,000
Significance: The ratio provides a measure of the capacity of the business tomeet its short-term obligations without any flaw. Normally, it is advocated to besafe to have a ratio of 1:1 as unnecessarily low ratio will be very risky and a highratio suggests unnecessarily deployment of resources in otherwise less profitableshort-term investments.
Illustration 3Illustration 3Illustration 3Illustration 3Illustration 3
Calculate ‘Liquidity Ratio’ from the following information:Current Liabilities = Rs. 50,000Current Assets = Rs. 80,000Inventories = Rs. 20,000Advance Tax = Rs. 5,000Prepaid Expenses = Rs. 5,000
211Accounting Ratios
Solution:Solution:Solution:Solution:Solution:
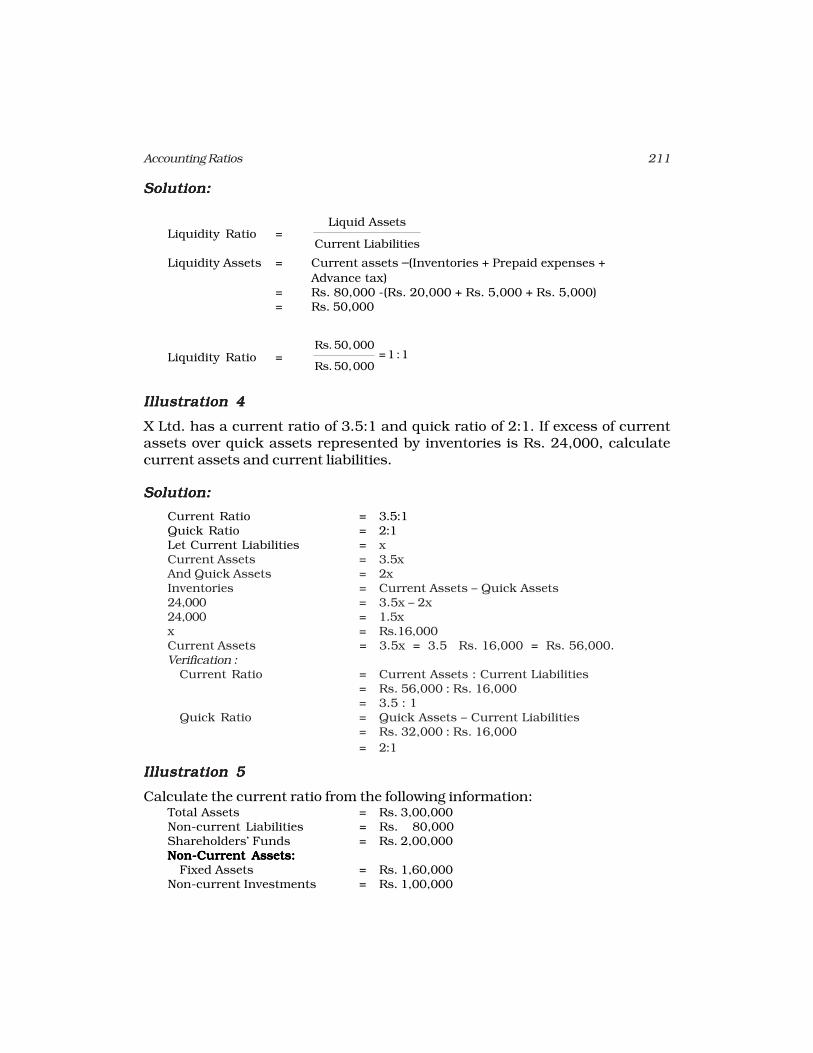
Liquidity Ratio =Liquid Assets
Current Liabilities
Liquidity Assets = Current assets –(Inventories + Prepaid expenses +
Advance tax)= Rs. 80,000 -(Rs. 20,000 + Rs. 5,000 + Rs. 5,000)= Rs. 50,000
Liquidity Ratio =Rs. 50,000
=1 :1Rs. 50,000
Illustration 4Illustration 4Illustration 4Illustration 4Illustration 4
X Ltd. has a current ratio of 3.5:1 and quick ratio of 2:1. If excess of currentassets over quick assets represented by inventories is Rs. 24,000, calculatecurrent assets and current liabilities.
Solution:Solution:Solution:Solution:Solution:
Current Ratio = 3.5:1Quick Ratio = 2:1Let Current Liabilities = xCurrent Assets = 3.5xAnd Quick Assets = 2xInventories = Current Assets – Quick Assets24,000 = 3.5x – 2x24,000 = 1.5xx = Rs.16,000Current Assets = 3.5x = 3.5 × Rs. 16,000 = Rs. 56,000.Verification :
Current Ratio = Current Assets : Current Liabilities= Rs. 56,000 : Rs. 16,000= 3.5 : 1
Quick Ratio = Quick Assets – Current Liabilities= Rs. 32,000 : Rs. 16,000
= 2:1
Illustration 5Illustration 5Illustration 5Illustration 5Illustration 5
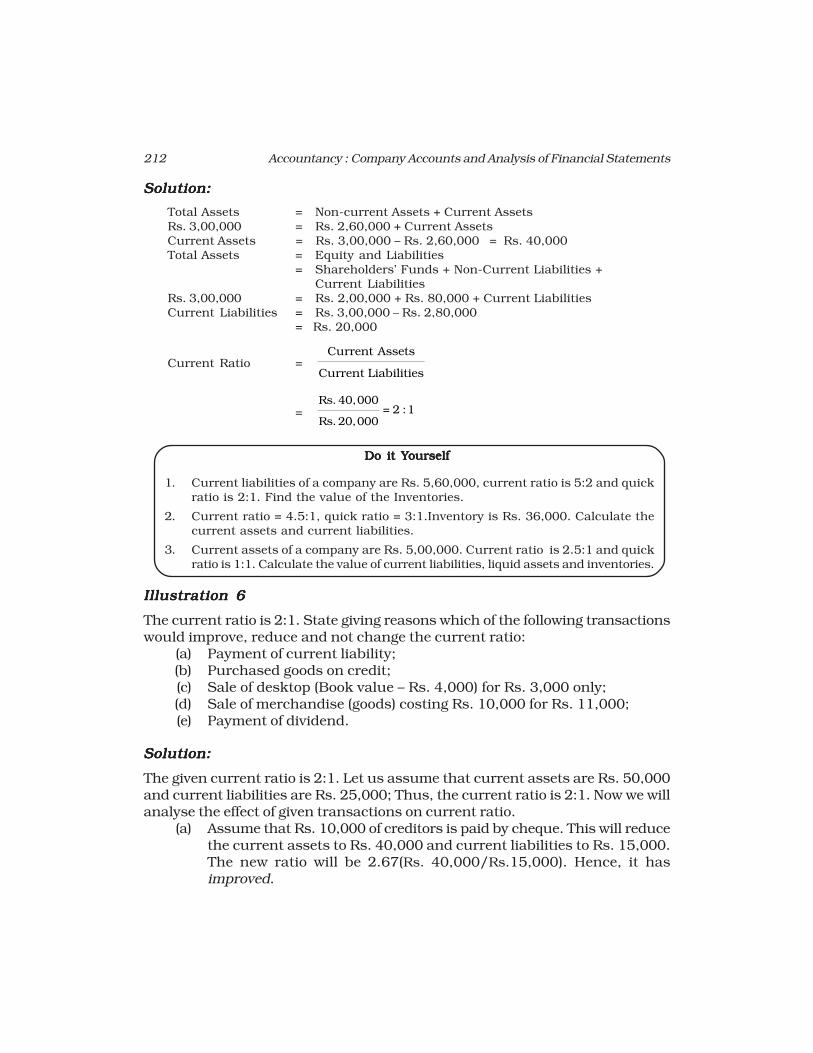
Calculate the current ratio from the following information:Total Assets = Rs. 3,00,000Non-current Liabilities = Rs. 80,000Shareholders’ Funds = Rs. 2,00,000Non-Current Assets:Non-Current Assets:Non-Current Assets:Non-Current Assets:Non-Current Assets:
Fixed Assets = Rs. 1,60,000Non-current Investments = Rs. 1,00,000
212 Accountancy : Company Accounts and Analysis of Financial Statements
Solution:Solution:Solution:Solution:Solution:
Total Assets = Non-current Assets + Current AssetsRs. 3,00,000 = Rs. 2,60,000 + Current AssetsCurrent Assets = Rs. 3,00,000 – Rs. 2,60,000 = Rs. 40,000Total Assets = Equity and Liabilities
= Shareholders’ Funds + Non-Current Liabilities +Current Liabilities
Rs. 3,00,000 = Rs. 2,00,000 + Rs. 80,000 + Current LiabilitiesCurrent Liabilities = Rs. 3,00,000 – Rs. 2,80,000
= Rs. 20,000
Current Ratio =Current Assets
Current Liabilities
=Rs. 40,000
= 2 :1Rs. 20,000
Do it YDo it YDo it YDo it YDo it Yourselfourselfourselfourselfourself
1. Current liabilities of a company are Rs. 5,60,000, current ratio is 5:2 and quickratio is 2:1. Find the value of the Inventories.
2. Current ratio = 4.5:1, quick ratio = 3:1.Inventory is Rs. 36,000. Calculate thecurrent assets and current liabilities.
3. Current assets of a company are Rs. 5,00,000. Current ratio is 2.5:1 and quickratio is 1:1. Calculate the value of current liabilities, liquid assets and inventories.
Illustration 6Illustration 6Illustration 6Illustration 6Illustration 6
The current ratio is 2:1. State giving reasons which of the following transactionswould improve, reduce and not change the current ratio:
(a) Payment of current liability;(b) Purchased goods on credit;(c) Sale of desktop (Book value – Rs. 4,000) for Rs. 3,000 only;(d) Sale of merchandise (goods) costing Rs. 10,000 for Rs. 11,000;(e) Payment of dividend.
Solution:Solution:Solution:Solution:Solution:
The given current ratio is 2:1. Let us assume that current assets are Rs. 50,000and current liabilities are Rs. 25,000; Thus, the current ratio is 2:1. Now we willanalyse the effect of given transactions on current ratio.
(a) Assume that Rs. 10,000 of creditors is paid by cheque. This will reducethe current assets to Rs. 40,000 and current liabilities to Rs. 15,000.The new ratio will be 2.67(Rs. 40,000/Rs.15,000). Hence, it hasimproved.
213Accounting Ratios
(b) Assume that Rs. 10,000 goods are purchased on credit. This willincrease the current assets to Rs. 60,000 and current liabilities toRs. 35,000. The new ratio will be 1.7:1 (Rs. 60,000/Rs. 35,000). Hence,it has reduced.
(c) Due to sale of a Desktop (a fixed asset) the current assets will increaseup to Rs. 53,000 without any change in the current liabilities. Thenew ratio will be 2.1:2 (Rs. 53,000/Rs. 25,000). Hence, it has improved.
(d) This transaction will decrease the inventories by Rs. 10,000 andincrease the cash by Rs. 11,000 thereby increasing the current assetsby Rs. 1,000 without any change in the current liabilities. The newratio will be 2.04:1 (Rs. 51,000/Rs. 25,000). Hence, it has improved.
(e) Assume that Rs. 5,000 is given by way of dividend. It will reduce thecurrent assets to Rs. 45,000 without any change in the currentliabilities. The new ratio will be 1.8:1 (Rs. 45,000/Rs. 25,000). Hence,it has reduced.
5.75.75.75.75.7 Solvency RatiosSolvency RatiosSolvency RatiosSolvency RatiosSolvency Ratios
The persons who have advanced money to the business on long-term basis areinterested in safety of their payment of interest periodically as well as therepayment of principal amount at the end of the loan period. Solvency ratios arecalculated to determine the ability of the business to service its debt in the longrun. The following ratios are normally computed for evaluating solvency of thebusiness.
1. Debt-Equity Ratio;
2. Debt to Capital Employed Ratio;
3. Proprietary Ratio;
4. Total Assets to Debt Ratio;
5. Interest Coverage Ratio.
5.7.15.7.15.7.15.7.15.7.1 Debt-Equity RatioDebt-Equity RatioDebt-Equity RatioDebt-Equity RatioDebt-Equity Ratio
Debt-Equity Ratio measures the relationship between long-term debt and equity.If debt component of the total long-term funds employed is small, outsiders feelmore secure. From security point of view, capital structure with less debt andmore equity is considered favourable as it reduces the chances of bankruptcy.However, it may vary from industry to industry. Normally, it is considered to besafe if debt equity ratio is 2:1. However, it may vary from industry to industry. Itis computed as follows:
Debt-Equity Ratio = Long-term Debts/Shareholders’ Fundsor
=Long - term Debts
Shareholders' Funds
214 Accountancy : Company Accounts and Analysis of Financial Statements
Where:Shareholders’ Funds/Equity = Share Capital + Reserves and Surplus +
Money received against warrantsShare Capital = Equity Share Capital + Preference Share Capital
or
Shareholders’ Funds/Equity = Non-Current Assets + Working Capital–Non-Current Liabilities
Working Capital = Current Assets –Current Liabilities
Significance: This ratio measures the degree of indebtedness of an enterpriseand gives an idea to the long-term lender regarding extent of security of thedebt. As indicated earlier, a low debt equity ratio reflects more security. A highratio, on the other hand, is considered risky as it may put the firm into difficultyin meeting its obligations to outsiders. However, from the perspective of theowners, greater use of debt (trading on equity) may help in ensuring higherreturns for them if the rate of earnings on capital employed is higher than therate of interest payable.
Illustration 7Illustration 7Illustration 7Illustration 7Illustration 7
From the following balance sheet of ABC Co. Ltd. as on March 31, 2013. Calculatedebt equity ratio:
ABC Co. Ltd.ABC Co. Ltd.ABC Co. Ltd.ABC Co. Ltd.ABC Co. Ltd.
Balance Sheet as at 31 March, 2013Balance Sheet as at 31 March, 2013Balance Sheet as at 31 March, 2013Balance Sheet as at 31 March, 2013Balance Sheet as at 31 March, 2013Particulars Note Amount
No. (Rs.)I.I.I.I.I. Equity and LiabilitiesEquity and LiabilitiesEquity and LiabilitiesEquity and LiabilitiesEquity and Liabilities
1.1.1.1.1. Shareholders’ fundsShareholders’ fundsShareholders’ fundsShareholders’ fundsShareholders’ fundsa) Share capital 12,00,000b) Reserves and surplus 2,00,000c) Money received against share warrants 1,00,000
2.2.2.2.2. Non-current LiabilitiesNon-current LiabilitiesNon-current LiabilitiesNon-current LiabilitiesNon-current Liabilitiesa) Long-term borrowings 4,00,000b) Other long-term liabilities 40,000c) Long-term provisions 60,000
3.3.3.3.3. Current LiabilitiesCurrent LiabilitiesCurrent LiabilitiesCurrent LiabilitiesCurrent Liabilitiesa) Short-term borrowings 2,00,000b) Trade payables 1,00,000c) Other current liabilities 50,000d) Short-term provisions 1,50,000
25,00,00025,00,00025,00,00025,00,00025,00,000II.II.II.II.II. AssetsAssetsAssetsAssetsAssets
1.1.1.1.1. Non-Current AssetsNon-Current AssetsNon-Current AssetsNon-Current AssetsNon-Current Assetsa) Fixed assets 15,00,000b) Non-current investments 2,00,000c) Long-term loans and advances 1,00,000
215Accounting Ratios
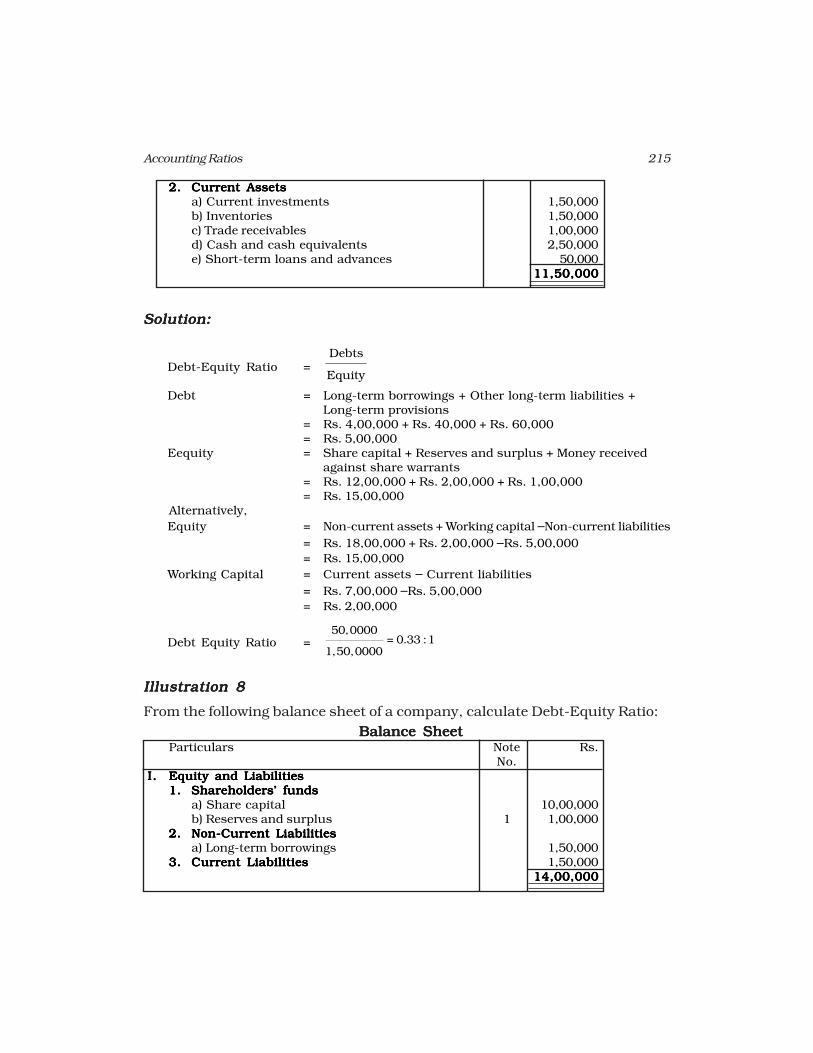
2.2.2.2.2. Current AssetsCurrent AssetsCurrent AssetsCurrent AssetsCurrent Assetsa) Current investments 1,50,000b) Inventories 1,50,000c) Trade receivables 1,00,000d) Cash and cash equivalents 2,50,000e) Short-term loans and advances 50,000
11,50,00011,50,00011,50,00011,50,00011,50,000
Solution:Solution:Solution:Solution:Solution:
Debt-Equity Ratio =Debts
Equity
Debt = Long-term borrowings + Other long-term liabilities +Long-term provisions
= Rs. 4,00,000 + Rs. 40,000 + Rs. 60,000= Rs. 5,00,000
Eequity = Share capital + Reserves and surplus + Money receivedagainst share warrants
= Rs. 12,00,000 + Rs. 2,00,000 + Rs. 1,00,000= Rs. 15,00,000
Alternatively,
Equity = Non-current assets + Working capital –Non-current liabilities
= Rs. 18,00,000 + Rs. 2,00,000 –Rs. 5,00,000
= Rs. 15,00,000
Working Capital = Current assets – Current liabilities
= Rs. 7,00,000 –Rs. 5,00,000
= Rs. 2,00,000
Debt Equity Ratio =50,0000
= 0.33 :11,50,0000
Illustration 8Illustration 8Illustration 8Illustration 8Illustration 8
From the following balance sheet of a company, calculate Debt-Equity Ratio:
Balance SheetBalance SheetBalance SheetBalance SheetBalance SheetParticulars Note Rs.
No.I.I.I.I.I. Equity and LiabilitiesEquity and LiabilitiesEquity and LiabilitiesEquity and LiabilitiesEquity and Liabilities
1.1.1.1.1. Shareholders’ fundsShareholders’ fundsShareholders’ fundsShareholders’ fundsShareholders’ fundsa) Share capital 10,00,000b) Reserves and surplus 1 1,00,000
2.2.2.2.2. Non-Current LiabilitiesNon-Current LiabilitiesNon-Current LiabilitiesNon-Current LiabilitiesNon-Current Liabilitiesa) Long-term borrowings 1,50,000
3.3.3.3.3. Current LiabilitiesCurrent LiabilitiesCurrent LiabilitiesCurrent LiabilitiesCurrent Liabilities 1,50,00014,00,00014,00,00014,00,00014,00,00014,00,000
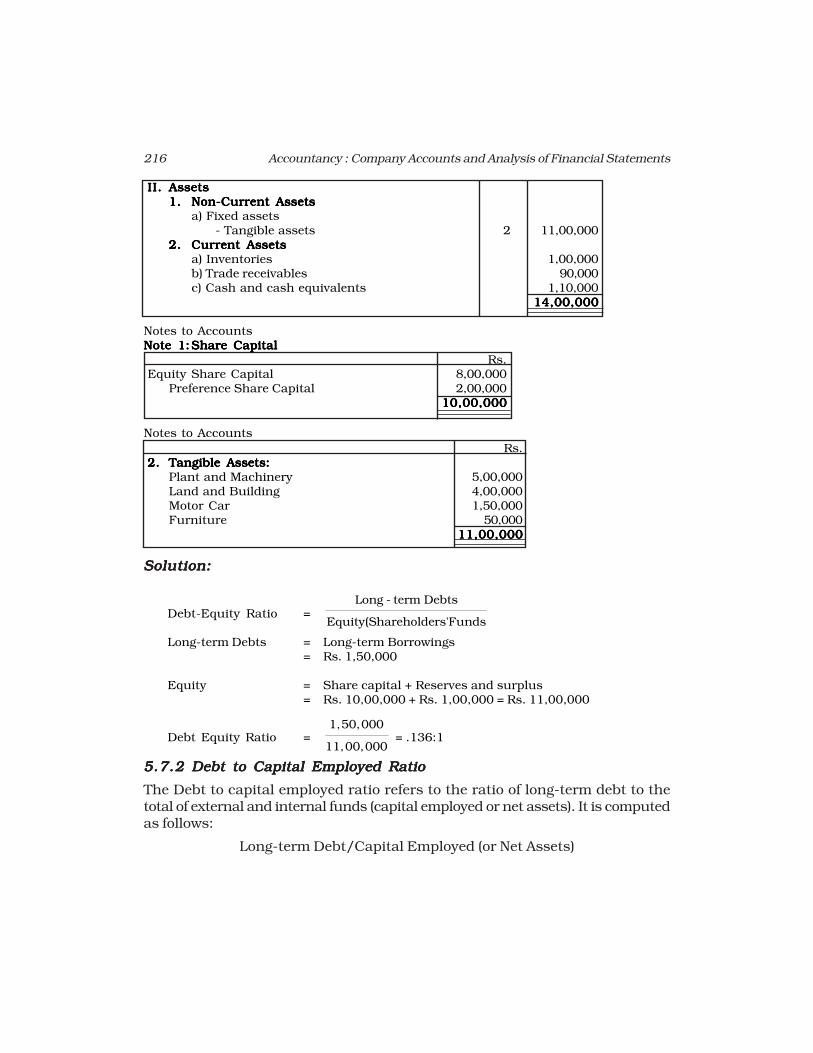
216 Accountancy : Company Accounts and Analysis of Financial Statements
II.II.II.II.II. AssetsAssetsAssetsAssetsAssets1.1.1.1.1. Non-Current AssetsNon-Current AssetsNon-Current AssetsNon-Current AssetsNon-Current Assets
a) Fixed assets- Tangible assets 2 11,00,000
2.2.2.2.2. Current AssetsCurrent AssetsCurrent AssetsCurrent AssetsCurrent Assetsa) Inventories 1,00,000b) Trade receivables 90,000c) Cash and cash equivalents 1,10,000
14,00,00014,00,00014,00,00014,00,00014,00,000
Notes to AccountsNote 1:Note 1:Note 1:Note 1:Note 1: Share CapitalShare CapitalShare CapitalShare CapitalShare Capital
Rs.Equity Share Capital 8,00,000
Preference Share Capital 2,00,00010,00,00010,00,00010,00,00010,00,00010,00,000
Notes to Accounts
Rs.2.2.2.2.2. Tangible Assets:Tangible Assets:Tangible Assets:Tangible Assets:Tangible Assets:
Plant and Machinery 5,00,000Land and Building 4,00,000Motor Car 1,50,000Furniture 50,000
11,00,00011,00,00011,00,00011,00,00011,00,000
Solution:Solution:Solution:Solution:Solution:
Debt-Equity Ratio =Long - term Debts
Equity(Shareholders'Funds
Long-term Debts = Long-term Borrowings= Rs. 1,50,000
Equity = Share capital + Reserves and surplus= Rs. 10,00,000 + Rs. 1,00,000 = Rs. 11,00,000
Debt Equity Ratio =1,50,000
11,00,000 = .136:1
5.7.25.7.25.7.25.7.25.7.2 Debt to Capital Employed RatioDebt to Capital Employed RatioDebt to Capital Employed RatioDebt to Capital Employed RatioDebt to Capital Employed Ratio
The Debt to capital employed ratio refers to the ratio of long-term debt to thetotal of external and internal funds (capital employed or net assets). It is computedas follows:
Long-term Debt/Capital Employed (or Net Assets)
217Accounting Ratios
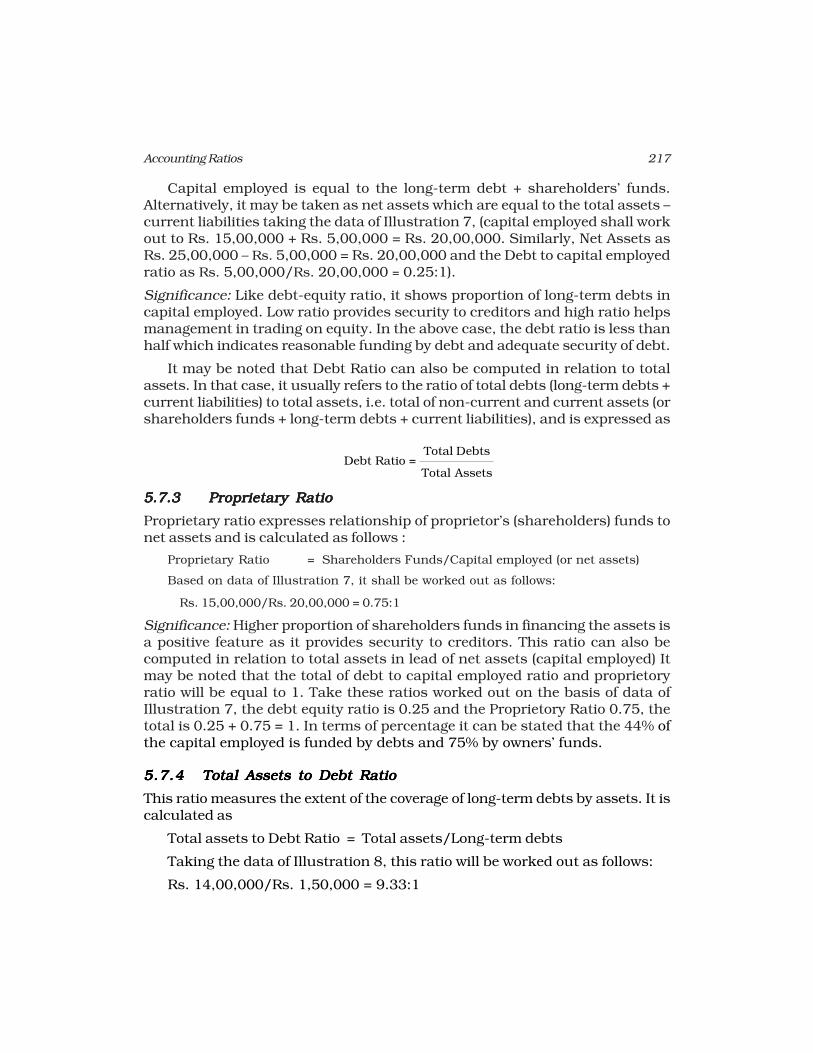
Capital employed is equal to the long-term debt + shareholders’ funds.Alternatively, it may be taken as net assets which are equal to the total assets –current liabilities taking the data of Illustration 7, (capital employed shall workout to Rs. 15,00,000 + Rs. 5,00,000 = Rs. 20,00,000. Similarly, Net Assets asRs. 25,00,000 – Rs. 5,00,000 = Rs. 20,00,000 and the Debt to capital employedratio as Rs. 5,00,000/Rs. 20,00,000 = 0.25:1).
Significance: Like debt-equity ratio, it shows proportion of long-term debts incapital employed. Low ratio provides security to creditors and high ratio helpsmanagement in trading on equity. In the above case, the debt ratio is less thanhalf which indicates reasonable funding by debt and adequate security of debt.
It may be noted that Debt Ratio can also be computed in relation to totalassets. In that case, it usually refers to the ratio of total debts (long-term debts +current liabilities) to total assets, i.e. total of non-current and current assets (orshareholders funds + long-term debts + current liabilities), and is expressed as
Total DebtsDebt Ratio =
Total Assets
5.7.3 Proprietary Ratio5.7.3 Proprietary Ratio5.7.3 Proprietary Ratio5.7.3 Proprietary Ratio5.7.3 Proprietary Ratio
Proprietary ratio expresses relationship of proprietor’s (shareholders) funds tonet assets and is calculated as follows :
Proprietary Ratio = Shareholders Funds/Capital employed (or net assets)
Based on data of Illustration 7, it shall be worked out as follows:
Rs. 15,00,000/Rs. 20,00,000 = 0.75:1
Significance: Higher proportion of shareholders funds in financing the assets isa positive feature as it provides security to creditors. This ratio can also becomputed in relation to total assets in lead of net assets (capital employed) Itmay be noted that the total of debt to capital employed ratio and proprietoryratio will be equal to 1. Take these ratios worked out on the basis of data ofIllustration 7, the debt equity ratio is 0.25 and the Proprietory Ratio 0.75, thetotal is 0.25 + 0.75 = 1. In terms of percentage it can be stated that the 44% ofthe capital employed is funded by debts and 75% by owners’ funds.
5.7.45.7.45.7.45.7.45.7.4 Total Assets to Debt RatioTotal Assets to Debt RatioTotal Assets to Debt RatioTotal Assets to Debt RatioTotal Assets to Debt Ratio
This ratio measures the extent of the coverage of long-term debts by assets. It iscalculated as
Total assets to Debt Ratio = Total assets/Long-term debts
Taking the data of Illustration 8, this ratio will be worked out as follows:
Rs. 14,00,000/Rs. 1,50,000 = 9.33:1
218 Accountancy : Company Accounts and Analysis of Financial Statements
The higher ratio indicates that assets have been mainly financed by ownersfunds and the long-term is adequately covered by assets.
It is better to take the net assets (capital employed) instead of total assets forcomputing this ratio also. It will be observed that in that case, the ratio will bethe reciprocal of the debt to capital employed ratio.
Significance. This ratio primarily indicators the rate of external funds in financingthe assets and the extent of coverage of their debts are covered by assets.
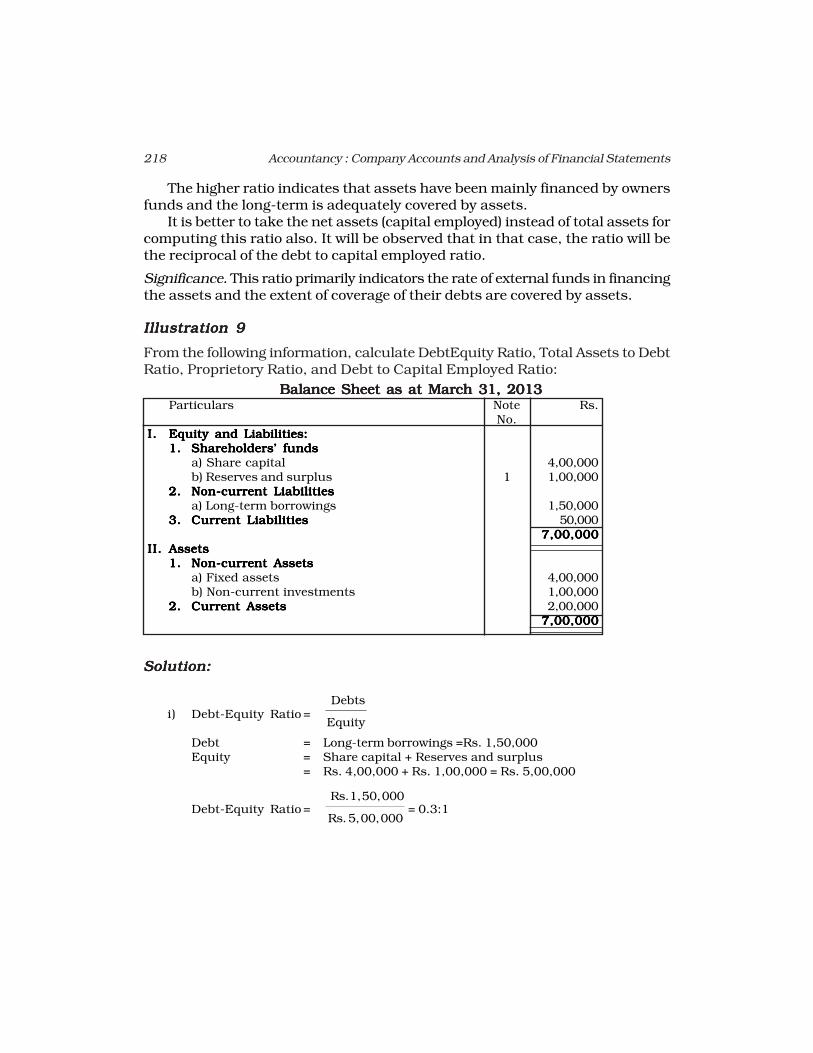
Illustration 9Illustration 9Illustration 9Illustration 9Illustration 9
From the following information, calculate DebtEquity Ratio, Total Assets to DebtRatio, Proprietory Ratio, and Debt to Capital Employed Ratio:
Balance Sheet as at March 31, 2013Balance Sheet as at March 31, 2013Balance Sheet as at March 31, 2013Balance Sheet as at March 31, 2013Balance Sheet as at March 31, 2013Particulars Note Rs.
No.I.I.I.I.I. Equity and Liabilities:Equity and Liabilities:Equity and Liabilities:Equity and Liabilities:Equity and Liabilities:
1.1.1.1.1. Shareholders’ fundsShareholders’ fundsShareholders’ fundsShareholders’ fundsShareholders’ fundsa) Share capital 4,00,000b) Reserves and surplus 1 1,00,000
2.2.2.2.2. Non-current LiabilitiesNon-current LiabilitiesNon-current LiabilitiesNon-current LiabilitiesNon-current Liabilitiesa) Long-term borrowings 1,50,000
3.3.3.3.3. Current LiabilitiesCurrent LiabilitiesCurrent LiabilitiesCurrent LiabilitiesCurrent Liabilities 50,0007,00,0007,00,0007,00,0007,00,0007,00,000
II.II.II.II.II. AssetsAssetsAssetsAssetsAssets1.1.1.1.1. Non-current AssetsNon-current AssetsNon-current AssetsNon-current AssetsNon-current Assets
a) Fixed assets 4,00,000b) Non-current investments 1,00,000
2.2.2.2.2. Current AssetsCurrent AssetsCurrent AssetsCurrent AssetsCurrent Assets 2,00,0007,00,0007,00,0007,00,0007,00,0007,00,000
Solution:Solution:Solution:Solution:Solution:
i) Debt-Equity Ratio = Debts
Equity
Debt = Long-term borrowings =Rs. 1,50,000Equity = Share capital + Reserves and surplus
= Rs. 4,00,000 + Rs. 1,00,000 = Rs. 5,00,000
Debt-Equity Ratio = Rs. 1,50,000
Rs. 5,00,000= 0.3:1
219Accounting Ratios
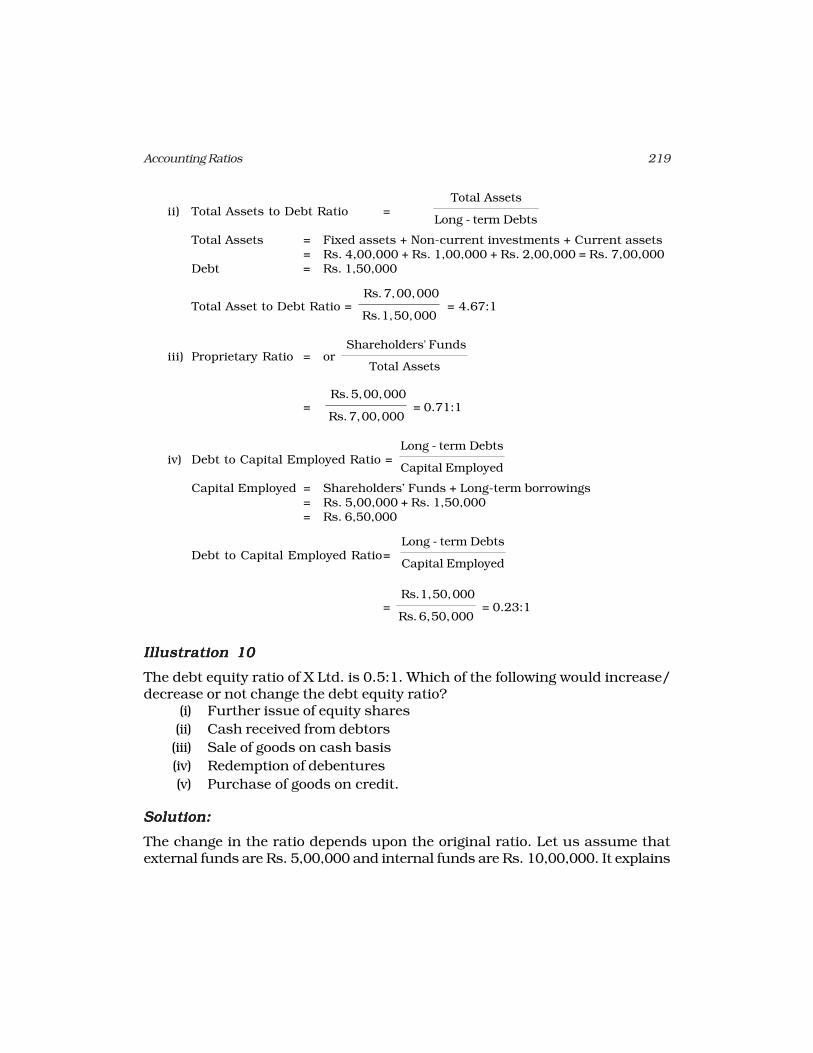
ii) Total Assets to Debt Ratio = Total Assets
Long - term Debts
Total Assets = Fixed assets + Non-current investments + Current assets= Rs. 4,00,000 + Rs. 1,00,000 + Rs. 2,00,000 = Rs. 7,00,000
Debt = Rs. 1,50,000
Total Asset to Debt Ratio = Rs. 7,00,000
Rs. 1,50,000 = 4.67:1
iii) Proprietary Ratio = or Shareholders' Funds
Total Assets
= Rs. 5,00,000
Rs. 7,00,000 = 0.71:1
iv) Debt to Capital Employed Ratio = Long - term Debts
Capital Employed
Capital Employed = Shareholders’ Funds + Long-term borrowings= Rs. 5,00,000 + Rs. 1,50,000= Rs. 6,50,000
Debt to Capital Employed Ratio= Long - term Debts
Capital Employed
= Rs. 1,50,000
Rs. 6,50,000 = 0.23:1
Illustration 10Illustration 10Illustration 10Illustration 10Illustration 10
The debt equity ratio of X Ltd. is 0.5:1. Which of the following would increase/decrease or not change the debt equity ratio?
(i) Further issue of equity shares
(ii) Cash received from debtors
(iii) Sale of goods on cash basis
(iv) Redemption of debentures
(v) Purchase of goods on credit.
Solution:Solution:Solution:Solution:Solution:
The change in the ratio depends upon the original ratio. Let us assume thatexternal funds are Rs. 5,00,000 and internal funds are Rs. 10,00,000. It explains
220 Accountancy : Company Accounts and Analysis of Financial Statements
the debt equity ratio of 0:5:1 Now we will analyse the effect of given transactionson debt equity ratio.
(i) Assume that Rs. 1,00,000 worth of equity shares are issued. This willincrease the internal funds to Rs. 11,00,000. The new ratio will be0.45:1 (5,00,000/11,00,000). Thus, it is clear that further issue ofequity shares decreases the debt-equity ratio.
(ii) Cash received from debtors will leave the internal and external fundsunchanged as this will only affect the composition of current assets.Hence, the debt-equity ratio will remain unchanged.
(iii) This will also leave the ratio unchanged.
(iv) Assume that Rs. 1,00,000 debentures are redeemed. This will decrease thelong-term debt to Rs. 4,00,000. The new ratio will be 0.4:1 (4,00,000/10,00,000). Redemption of debentures will decrease the debit equity ratio.
(v) This will also leave the ratio unchanged.
5.7.55.7.55.7.55.7.55.7.5 Interest Coverage RatioInterest Coverage RatioInterest Coverage RatioInterest Coverage RatioInterest Coverage Ratio
It is a ratio which deals with the servicing of interest on loan. It is a measure ofsecurity of interest payable on long-term debts. It expresses the relationshipbetween profits available for payment of interest and the amount of interestpayable. It is calculated as follows:
Interest Coverage Ratio = Net Profit before Interest and Tax Interest on long-term debts
Significance: It reveals the number of times interest on long-term debts is coveredby the profits available for interest. A higher ratio ensures safety of interest ondebts.
Illustration 11Illustration 11Illustration 11Illustration 11Illustration 11
From the following details, calculate interest coverage ratio:
Net Profit after tax Rs. 60,000; 15% Long-term Debt 10,00,000; and Tax Rate40%.
Solution:Solution:Solution:Solution:Solution:
Net Profit after Tax = Rs. 60,000Tax Rate = 40%
Net Profit before tax = Net profit after tax X 100/(100 – Tax rate)
= Rs. 60,000 X 100/(100 – 40)
= Rs. 1,00,000
Interest on Long term Debt = 15% of Rs. 10,00,000 = Rs. 1,50,000
221Accounting Ratios
Net profit before interest and tax = Net profit before tax + Interest
= Rs. 1,00,000 + Rs. 1,50,000 = Rs. 2,50,000
Interest Coverage Ratio = Net Profit before Interest andTax/Interest on long-term debt
= Rs. 2,50,000/Rs. 1,50,000
= 1.67 times.
5.85.85.85.85.8 Activity (or Turnover) RatioActivity (or Turnover) RatioActivity (or Turnover) RatioActivity (or Turnover) RatioActivity (or Turnover) Ratio
These ratios indicate the speed at which, activities of the business are beingperformed. The activity ratios express the number of times assets employed, or,for that matter, any constituent of assets, is turned into sales during an accountingperiod. Higher turnover ratio means better utilisation of assets and signifiesimproved efficiency and profitability, and as such are known as efficiency ratios.The important activity ratios calculated under this category are :
1. Inventory Turnover;
2. Trade Receivable Turnover;
3. Trade Payable Turnover;
4. Investment (Net Assets) Turnover
5. Fixed Assets Turnover; and
6. Working Capital Turnover.
5.8.15.8.15.8.15.8.15.8.1 Inventory TInventory TInventory TInventory TInventory Turururururn-over Ration-over Ration-over Ration-over Ration-over Ratio
It determines the number of times inventory is converted in to revenue fromoperations during the accounting period under consideration. It expresses therelationship between the cost of revenue from operations and average inventory.The formula for its calculation is as follows:
Inventory Turnover Ratio = Cost of Revenue from Operations / Average Inventory
Where average inventory refers to arithmetic average of opening and closinginventory, and the cost of revenue from operations means revenue from operationsless gross profit.
Significance : It studies the frequency of conversion of inventory of finishedgoods into revenue from operations. It is also a measure of liquidity. It determineshow many times inventory is purchased or replaced during a year. Low turnoverof inventory may be due to bad buying, obsolete inventory , etc. and is a dangersignal. High turnover is good but it must be carefully interpreted as it may bedue to buying in small lots or selling quickly at low margin to realise cash.Thus, it throws light on utilisation of inventory of goods.
222 Accountancy : Company Accounts and Analysis of Financial Statements
Test your Understanding – IITest your Understanding – IITest your Understanding – IITest your Understanding – IITest your Understanding – II
(i) The following groups of ratios are primarily measure risk:
A. liquidity, activity, and profitability
B. liquidity, activity, and inventory
C. liquidity, activity, and debt
D. activity, debt and profitability
(ii) The _________ ratios are primarily measures of return:
A. liquidity
B. activity
C. debt
D. profitability
(iii) The _________ of business firm is measured by its ability to satisfy its short-term obligations as they come due:
A. activity
B. liquidity
C. debt
D. profitability
(iv) _________ ratios are a measure of the speed with which various accounts areconverted into revenue from operations or cash:
A. Activity
B. Liquidity
C. Debt
D. Profitability
(v) The two basic measures of liquidity are:
A. inventory turnover and current ratio
B. current ratio and liquid ratio
C. gross profit margin and operating ratio
D. current ratio and average collection period
(vi) The _________ is a measure of liquidity which excludes _______, generally theleast liquid asset:
A. current ratio, accounts debtors
B. liquid ratio, accounts debtors
C. current ratio, inventory
D. liquid ratio, inventory
Illustration 12Illustration 12Illustration 12Illustration 12Illustration 12
From the following information, calculate inventory turnover ratio :
223Accounting Ratios
Rs.Turnover Ratio:Turnover Ratio:Turnover Ratio:Turnover Ratio:Turnover Ratio:
Inventory in the beginning = 18,000Inventory at the end = 22,000Net purchases = 46,000Wages = 14,000Revenue from operations = 80,000Carriage inwards = 4,000
Inventory Turnover Ratio =Cost of Revenue from Operations
Average Inventory
Cost of Revenue from Operations = Inventory in the beginning + NetPurchases + Wages + Carriage inwards- Inventory at the end
= Rs. 18,000 + Rs. 46,000 + Rs. 14,000
+ Rs. 4,000 – Rs. 22,000
= Rs. 60,000
Average Inventory =Inventory in the beginning + Inventory at the end
2
=Rs. 18,000 + Rs. 22,000
2 = Rs. 20,000
Inventory Turnover Ratio =Rs. 60,000
Rs. 20,000 = 3 Times
Illustration 13Illustration 13Illustration 13Illustration 13Illustration 13
From the following information, calculate inventory turnover ratio:
Rs.Turnover Ratio:Turnover Ratio:Turnover Ratio:Turnover Ratio:Turnover Ratio:
Revenue from operations = 4,00,000Average Inventory = 55,000Gross Loss Ratio = 10%
Solution:Solution:Solution:Solution:Solution:
Revenue from operations = Rs. 4,00,000
Gross Loss = 10% of Rs. 4,00,000 = Rs. 40,000
Cost of goods Sold = Revenue from operations + Gross Loss
= Rs. 4,00,000 + Rs. 40,000 = Rs. 4,40,000
224 Accountancy : Company Accounts and Analysis of Financial Statements
Inventory Turnover Ratio =Cost of Revenue from Operations
Average Inventory
=Rs. 4,40,000
Rs. 55,000 = 8 times
Illustration 14Illustration 14Illustration 14Illustration 14Illustration 14
A trader carries an average inventory of Rs. 40,000. His inventory turnover ratiois 8 times. If he sells goods at a profit of 20% on Revenue from operations, findout the profit.
Solution:Solution:Solution:Solution:Solution:
Inventory Turnover Ratio =Cost of Revenue from Operations
Average Inventory
8 = Cost of Revenue from Operations
Rs. 40,000
Cost of Revenue from operations = 8 x Rs. 40,000
= Rs. 3,20,000
Revenue from operations = Cost of Revenue from operations x 100
80
= Rs. 3,20,000 x 100
80 = Rs. 4,00,000
Profit = Revenue from operations - Cost of Revenue from operations
= Rs. 4,00,000 – Rs. 3,20,000 = Rs. 80,000
Do it YDo it YDo it YDo it YDo it Yourselfourselfourselfourselfourself
1. Calculate the amount of gross profit:Average inventory = Rs. 80,000Inventory turnover ratio = 6 timesSelling price = 25% above cost
2. Calculate Inventory Turnover Ratio:Annual sales = Rs. 2,00,000Gross Profit = 20% on cost of Revenue from
operationsInventory in the beginning = Rs. 38,500
225Accounting Ratios
Inventory at the end = Rs. 41,500
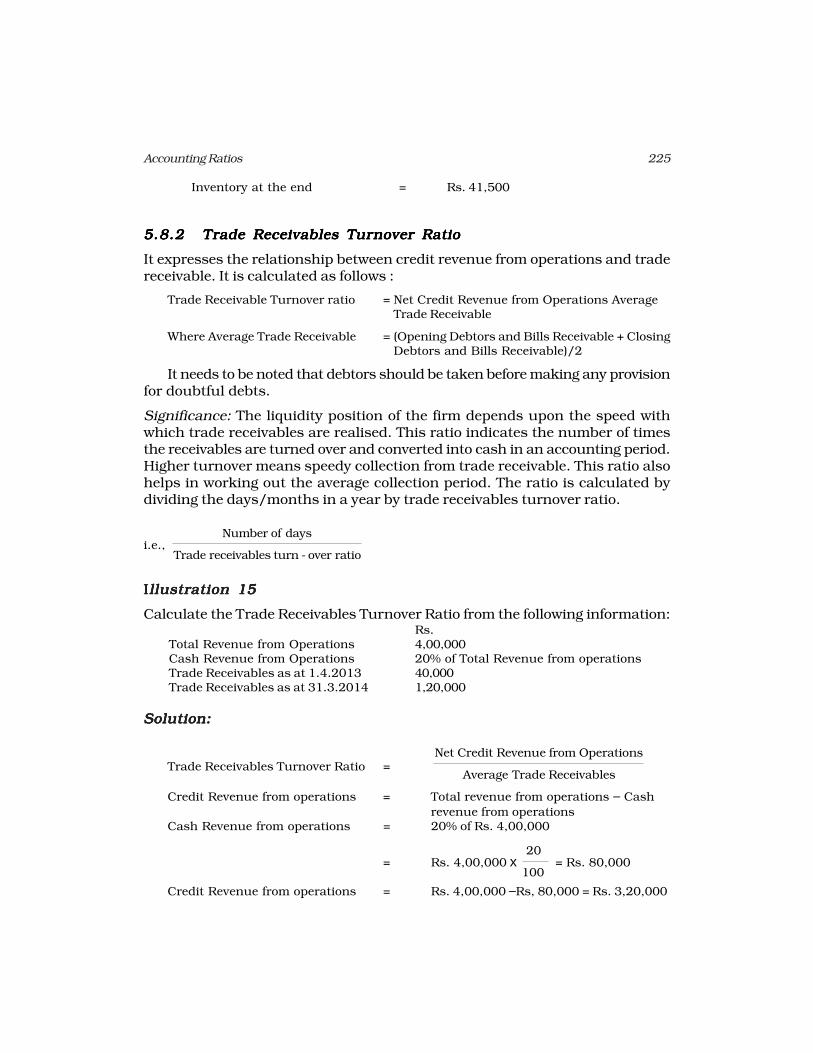
5.8.25.8.25.8.25.8.25.8.2 TTTTTrade Receivables Trade Receivables Trade Receivables Trade Receivables Trade Receivables Turururururnover Rationover Rationover Rationover Rationover Ratio
It expresses the relationship between credit revenue from operations and tradereceivable. It is calculated as follows :
Trade Receivable Turnover ratio = Net Credit Revenue from Operations AverageTrade Receivable
Where Average Trade Receivable = (Opening Debtors and Bills Receivable + ClosingDebtors and Bills Receivable)/2
It needs to be noted that debtors should be taken before making any provisionfor doubtful debts.
Significance: The liquidity position of the firm depends upon the speed withwhich trade receivables are realised. This ratio indicates the number of timesthe receivables are turned over and converted into cash in an accounting period.Higher turnover means speedy collection from trade receivable. This ratio alsohelps in working out the average collection period. The ratio is calculated bydividing the days/months in a year by trade receivables turnover ratio.
i.e., Number of days
Trade receivables turn - over ratio
IIIIIllustration 15llustration 15llustration 15llustration 15llustration 15
Calculate the Trade Receivables Turnover Ratio from the following information:Rs.
Total Revenue from Operations 4,00,000Cash Revenue from Operations 20% of Total Revenue from operationsTrade Receivables as at 1.4.2013 40,000Trade Receivables as at 31.3.2014 1,20,000
Solution:Solution:Solution:Solution:Solution:
Trade Receivables Turnover Ratio =Net Credit Revenue from Operations
Average Trade Receivables
Credit Revenue from operations = Total revenue from operations – Cash
revenue from operationsCash Revenue from operations = 20% of Rs. 4,00,000
= Rs. 4,00,000 x 20
100 = Rs. 80,000
Credit Revenue from operations = Rs. 4,00,000 –Rs, 80,000 = Rs. 3,20,000
226 Accountancy : Company Accounts and Analysis of Financial Statements
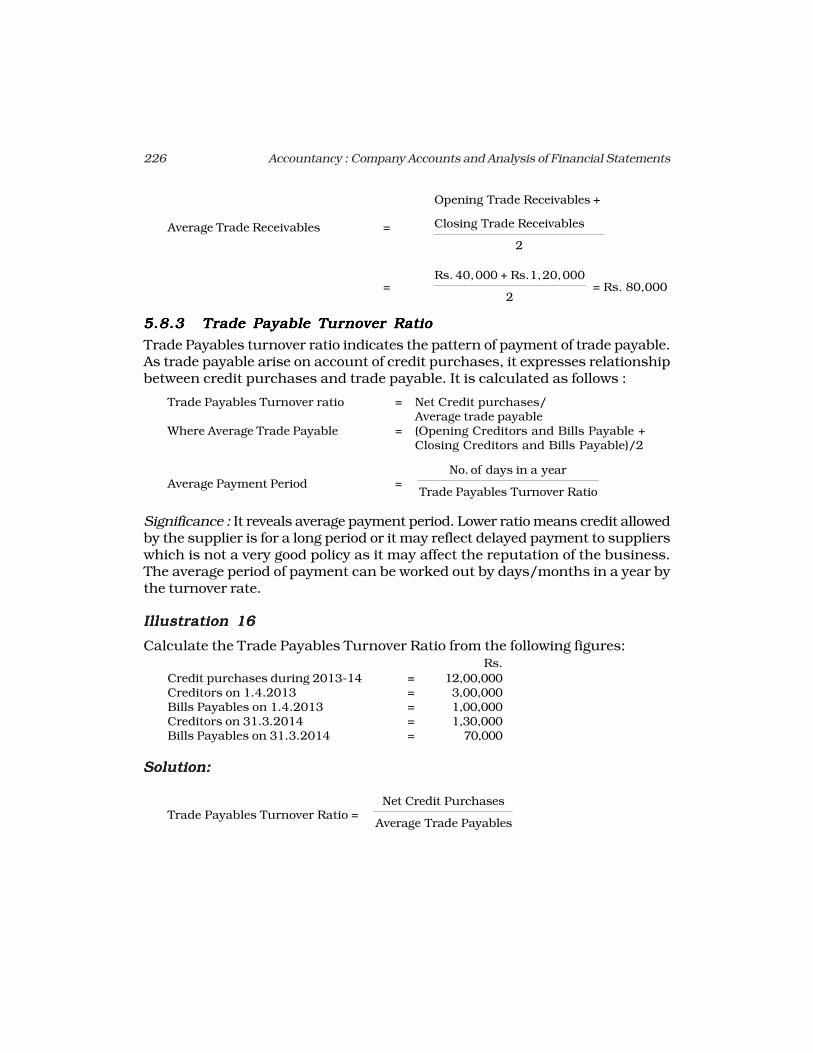
Average Trade Receivables =
Opening Trade Receivables +
Closing Trade Receivables
2
=Rs. 40,000 + Rs. 1,20,000
2 = Rs. 80,000
5.8.35.8.35.8.35.8.35.8.3 TTTTTrade Payable Trade Payable Trade Payable Trade Payable Trade Payable Turururururnover Rationover Rationover Rationover Rationover Ratio
Trade Payables turnover ratio indicates the pattern of payment of trade payable.As trade payable arise on account of credit purchases, it expresses relationshipbetween credit purchases and trade payable. It is calculated as follows :
Trade Payables Turnover ratio = Net Credit purchases/Average trade payable
Where Average Trade Payable = (Opening Creditors and Bills Payable +Closing Creditors and Bills Payable)/2
Average Payment Period =No. of days in a year
Trade Payables Turnover Ratio
Significance : It reveals average payment period. Lower ratio means credit allowedby the supplier is for a long period or it may reflect delayed payment to supplierswhich is not a very good policy as it may affect the reputation of the business.The average period of payment can be worked out by days/months in a year bythe turnover rate.
Illustration 16Illustration 16Illustration 16Illustration 16Illustration 16
Calculate the Trade Payables Turnover Ratio from the following figures:Rs.
Credit purchases during 2013-14 = 12,00,000Creditors on 1.4.2013 = 3,00,000Bills Payables on 1.4.2013 = 1,00,000Creditors on 31.3.2014 = 1,30,000Bills Payables on 31.3.2014 = 70,000
Solution:Solution:Solution:Solution:Solution:
Trade Payables Turnover Ratio =Net Credit Purchases
Average Trade Payables
227Accounting Ratios
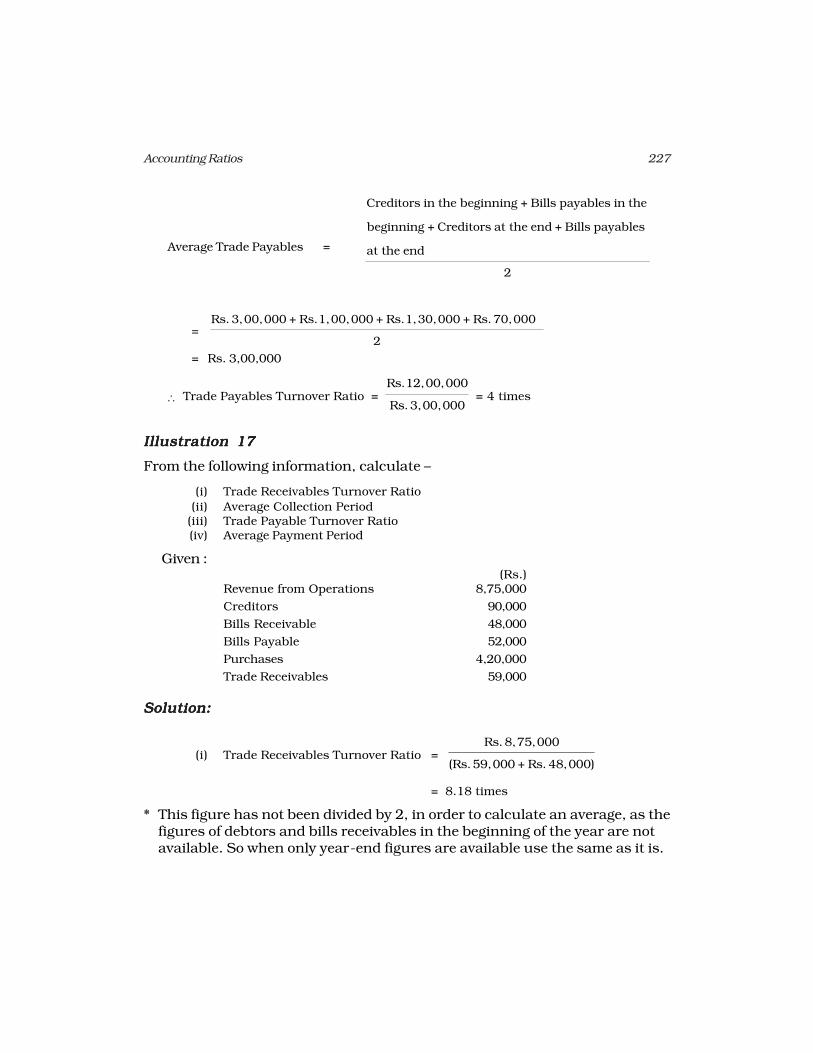
Average Trade Payables =
Creditors in the beginning + Bills payables in the
beginning + Creditors at the end + Bills payables
at the end
2
=Rs. 3,00,000 + Rs. 1,00,000 + Rs. 1,30,000 + Rs. 70,000
2
= Rs. 3,00,000
Trade Payables Turnover Ratio =Rs. 12,00,000
Rs. 3,00,000 = 4 times
Illustration 17Illustration 17Illustration 17Illustration 17Illustration 17
From the following information, calculate –
(i) Trade Receivables Turnover Ratio
(ii) Average Collection Period(iii) Trade Payable Turnover Ratio(iv) Average Payment Period
Given :(Rs.)
Revenue from Operations 8,75,000
Creditors 90,000
Bills Receivable 48,000
Bills Payable 52,000
Purchases 4,20,000
Trade Receivables 59,000
Solution:Solution:Solution:Solution:Solution:
(i) Trade Receivables Turnover Ratio = Rs. 8,75,000
(Rs. 59,000 + Rs. 48,000)
= 8.18 times
* This figure has not been divided by 2, in order to calculate an average, as thefigures of debtors and bills receivables in the beginning of the year are notavailable. So when only year-end figures are available use the same as it is.
228 Accountancy : Company Accounts and Analysis of Financial Statements
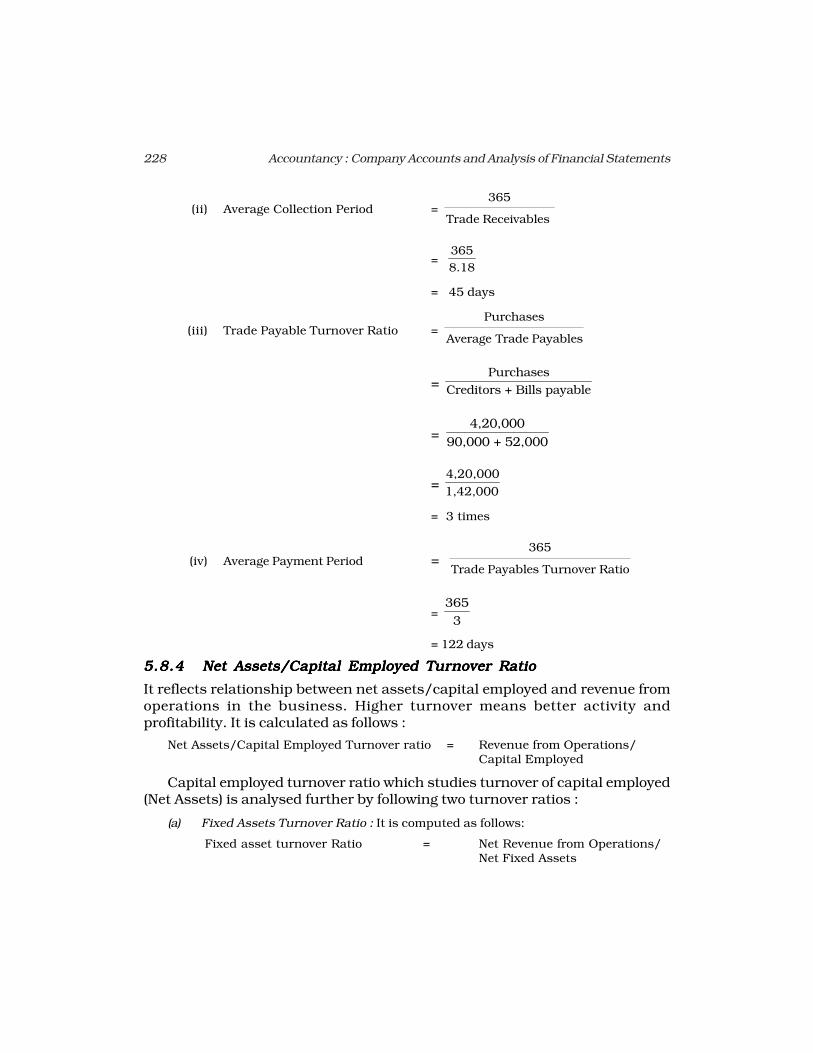
(ii) Average Collection Period = 365
Trade Receivables
= 3658.18
= 45 days
(iii) Trade Payable Turnover Ratio = Purchases
Average Trade Payables
= Purchases
Creditors + Bills payable
= 4,20,000
90,000 + 52,000
= 4,20,0001,42,000
= 3 times
(iv) Average Payment Period = 365
Trade Payables Turnover Ratio
= 3653
= 122 days
5.8.45.8.45.8.45.8.45.8.4 Net Assets/Capital Employed TNet Assets/Capital Employed TNet Assets/Capital Employed TNet Assets/Capital Employed TNet Assets/Capital Employed Turururururnover Rationover Rationover Rationover Rationover Ratio
It reflects relationship between net assets/capital employed and revenue fromoperations in the business. Higher turnover means better activity andprofitability. It is calculated as follows :
Net Assets/Capital Employed Turnover ratio = Revenue from Operations/Capital Employed
Capital employed turnover ratio which studies turnover of capital employed(Net Assets) is analysed further by following two turnover ratios :
(a) Fixed Assets Turnover Ratio : It is computed as follows:
Fixed asset turnover Ratio = Net Revenue from Operations/Net Fixed Assets
229Accounting Ratios
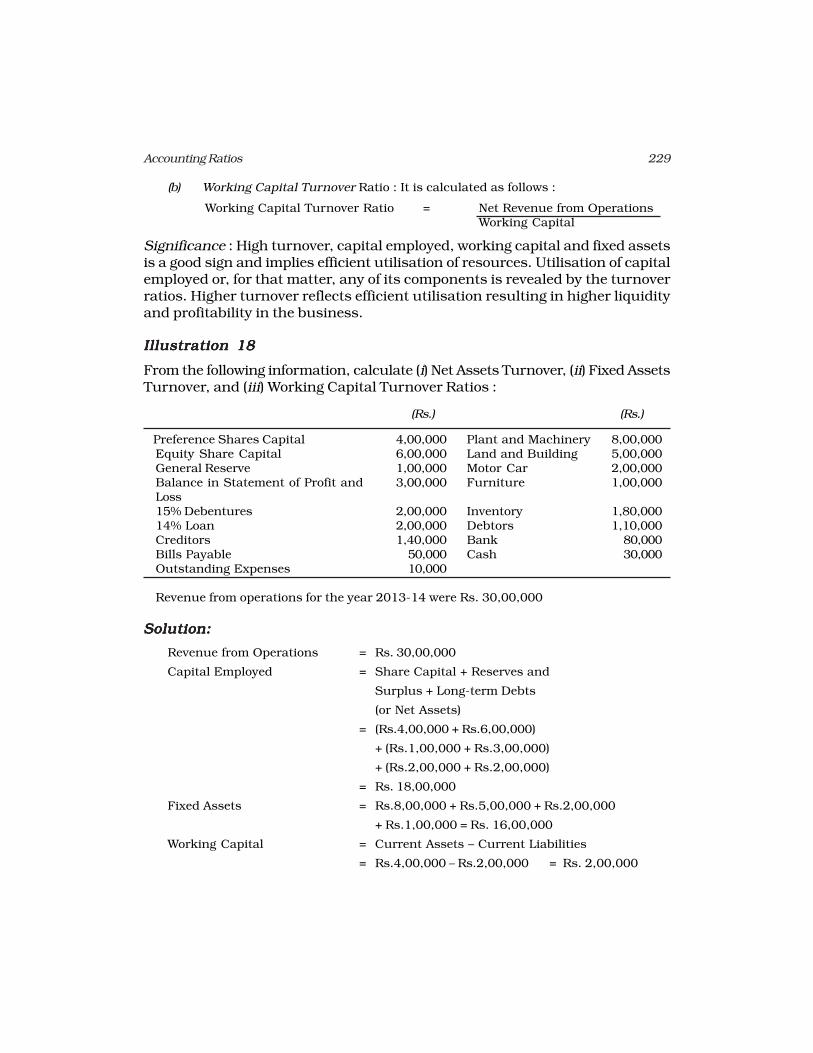
(b) Working Capital Turnover Ratio : It is calculated as follows :
Working Capital Turnover Ratio = Net Revenue from OperationsWorking Capital
Significance : High turnover, capital employed, working capital and fixed assetsis a good sign and implies efficient utilisation of resources. Utilisation of capitalemployed or, for that matter, any of its components is revealed by the turnoverratios. Higher turnover reflects efficient utilisation resulting in higher liquidityand profitability in the business.
Illustration 18Illustration 18Illustration 18Illustration 18Illustration 18
From the following information, calculate (i) Net Assets Turnover, (ii) Fixed AssetsTurnover, and (iii) Working Capital Turnover Ratios :
(Rs.) (Rs.)
Preference Shares Capital 4,00,000 Plant and Machinery 8,00,000Equity Share Capital 6,00,000 Land and Building 5,00,000General Reserve 1,00,000 Motor Car 2,00,000Balance in Statement of Profit and 3,00,000 Furniture 1,00,000Loss15% Debentures 2,00,000 Inventory 1,80,00014% Loan 2,00,000 Debtors 1,10,000Creditors 1,40,000 Bank 80,000Bills Payable 50,000 Cash 30,000Outstanding Expenses 10,000
Revenue from operations for the year 2013-14 were Rs. 30,00,000
Solution:Solution:Solution:Solution:Solution:
Revenue from Operations = Rs. 30,00,000
Capital Employed = Share Capital + Reserves and
Surplus + Long-term Debts
(or Net Assets)
= (Rs.4,00,000 + Rs.6,00,000)
+ (Rs.1,00,000 + Rs.3,00,000)
+ (Rs.2,00,000 + Rs.2,00,000)
= Rs. 18,00,000
Fixed Assets = Rs.8,00,000 + Rs.5,00,000 + Rs.2,00,000
+ Rs.1,00,000 = Rs. 16,00,000
Working Capital = Current Assets – Current Liabilities
= Rs.4,00,000 – Rs.2,00,000 = Rs. 2,00,000
230 Accountancy : Company Accounts and Analysis of Financial Statements
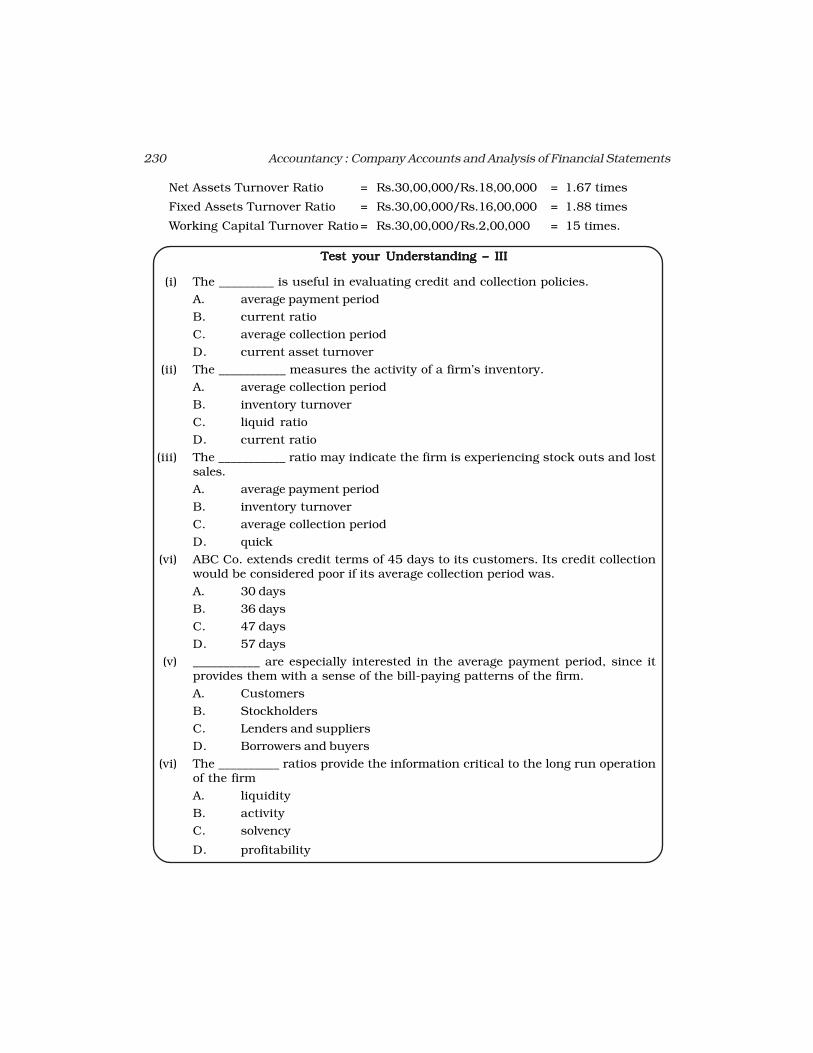
Net Assets Turnover Ratio = Rs.30,00,000/Rs.18,00,000 = 1.67 times
Fixed Assets Turnover Ratio = Rs.30,00,000/Rs.16,00,000 = 1.88 times
Working Capital Turnover Ratio = Rs.30,00,000/Rs.2,00,000 = 15 times.
Test your Understanding – IIITest your Understanding – IIITest your Understanding – IIITest your Understanding – IIITest your Understanding – III
(i) The _________ is useful in evaluating credit and collection policies.
A. average payment period
B. current ratio
C. average collection period
D. current asset turnover
(ii) The ___________ measures the activity of a firm’s inventory.
A. average collection period
B. inventory turnover
C. liquid ratio
D. current ratio
(iii) The ___________ ratio may indicate the firm is experiencing stock outs and lostsales.
A. average payment period
B. inventory turnover
C. average collection period
D. quick
(vi) ABC Co. extends credit terms of 45 days to its customers. Its credit collectionwould be considered poor if its average collection period was.
A. 30 days
B. 36 days
C. 47 days
D. 57 days
(v) ___________ are especially interested in the average payment period, since itprovides them with a sense of the bill-paying patterns of the firm.
A. Customers
B. Stockholders
C. Lenders and suppliers
D. Borrowers and buyers
(vi) The __________ ratios provide the information critical to the long run operationof the firm
A. liquidity
B. activity
C. solvency
D. profitability
231Accounting Ratios
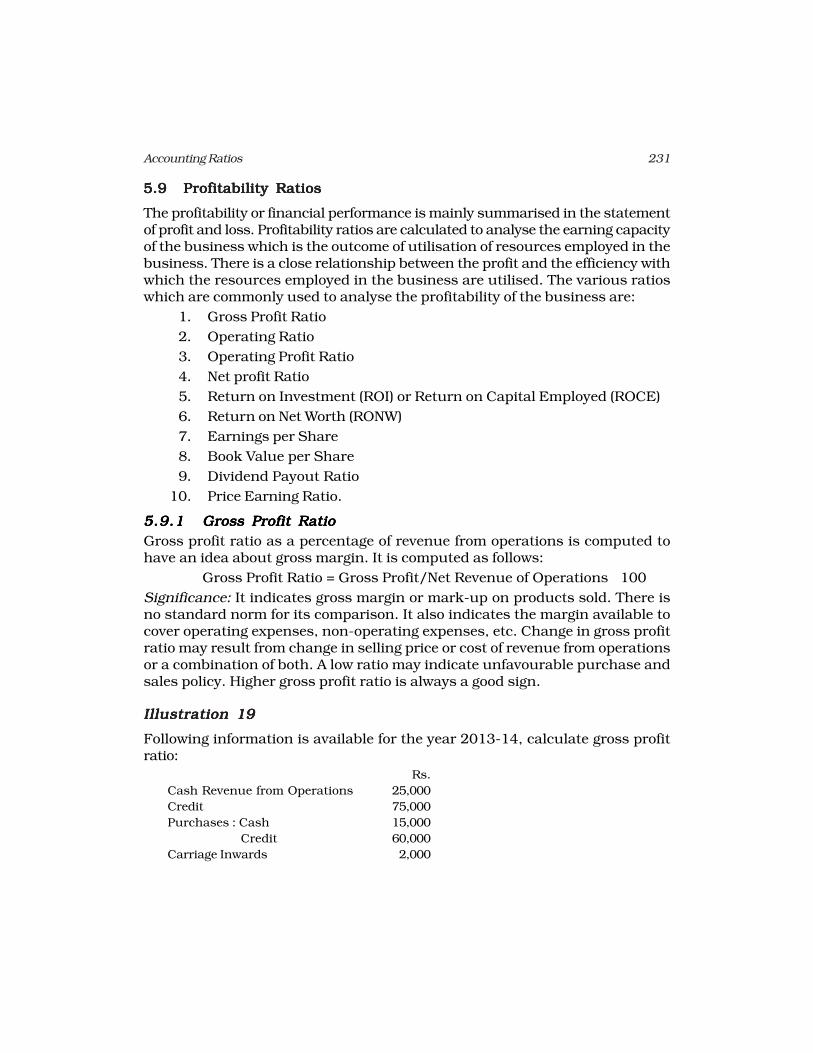
5.95.95.95.95.9 Profitability RatiosProfitability RatiosProfitability RatiosProfitability RatiosProfitability Ratios
The profitability or financial performance is mainly summarised in the statementof profit and loss. Profitability ratios are calculated to analyse the earning capacityof the business which is the outcome of utilisation of resources employed in thebusiness. There is a close relationship between the profit and the efficiency withwhich the resources employed in the business are utilised. The various ratioswhich are commonly used to analyse the profitability of the business are:
1. Gross Profit Ratio
2. Operating Ratio
3. Operating Profit Ratio
4. Net profit Ratio
5. Return on Investment (ROI) or Return on Capital Employed (ROCE)
6. Return on Net Worth (RONW)
7. Earnings per Share
8. Book Value per Share
9. Dividend Payout Ratio
10. Price Earning Ratio.
5.9.15.9.15.9.15.9.15.9.1 Gross Profit RatioGross Profit RatioGross Profit RatioGross Profit RatioGross Profit Ratio
Gross profit ratio as a percentage of revenue from operations is computed tohave an idea about gross margin. It is computed as follows:
Gross Profit Ratio = Gross Profit/Net Revenue of Operations × 100
Significance: It indicates gross margin or mark-up on products sold. There isno standard norm for its comparison. It also indicates the margin available tocover operating expenses, non-operating expenses, etc. Change in gross profitratio may result from change in selling price or cost of revenue from operationsor a combination of both. A low ratio may indicate unfavourable purchase andsales policy. Higher gross profit ratio is always a good sign.
Illustration 19Illustration 19Illustration 19Illustration 19Illustration 19
Following information is available for the year 2013-14, calculate gross profitratio:
Rs.
Cash Revenue from Operations 25,000
Credit 75,000
Purchases : Cash 15,000
Credit 60,000
Carriage Inwards 2,000
232 Accountancy : Company Accounts and Analysis of Financial Statements
Salaries 25,000
Decrease in Inventory 10,000
Return Outwards 2,000
Wages 5,000
Solution:Solution:Solution:Solution:Solution:
Revenue from Operations = Cash Revenue from Operations + Credit Inventory
= Rs.25,000 + Rs.75,000 = Rs. 1,00,000
Net Purchases = Cash Purchases + Credit Purchases – Return Outwards
= Rs.15,000 + Rs.60,000 – Rs.2,000 = Rs. 73,000
Cost of Inventory = Purchases + (Opening Inventory – Closing Inventory) +
Direct Expenses
= Purchases + Decrease in inventory + Direct Expenses
= Rs.73,000 + Rs.10,000 + (Rs.2,000 + Rs.5,000)
= Rs.90,000
Gross Profit = Revenue from Operations – Cost of Inventory
= Rs.1,00,000 –Rs.90,000
= Rs. 10,000
Gross Profit Ratio = Gross Profit/Net Revenue from Operations × 100
= Rs.10,000/Rs.1,00,000 × 100
= 10%.
5.9.25.9.25.9.25.9.25.9.2 Operating RatioOperating RatioOperating RatioOperating RatioOperating Ratio
It is computed to analyse cost of operation in relation to revenue from operations.It is calculated as follows:
Operating Ratio = (Cost of Revenue from Operations + Operating Expenses)/
Net Sales × 100
Operating expenses include office expenses, administrative expenses, sellingexpenses, distribution expenses, depreciation and employee benefit expenses etc.
Cost of operation is determined by excluding non-operating incomes andexpenses such as loss on sale of assets, interest paid, dividend received, loss byfire, speculation gain and so on.
5.9.35.9.35.9.35.9.35.9.3 Operating Profit RatioOperating Profit RatioOperating Profit RatioOperating Profit RatioOperating Profit Ratio
It is calculated to reveal operating margin. It may be computed directly or as aresidual of operating ratio.
Operating Profit Ratio = 100 – Operating Ratio
233Accounting Ratios
Alternatively, it is calculated as under:
Operating Profit Ratio = Operating Profit/ Revenue from Operations × 100
Where Operating Profit = Revenue from Operations – Cost of Operation
Significance: Operating Ratio is computed to express cost of operations excludingfinancial charges in relation to revenue from operations. A corollary of it is‘Operating Profit Ratio’. It helps to analyse the performance of business andthrows light on the operational efficiency of the business. It is very useful forinter-firm as well as intra-firm comparisons. Lower operating ratio is a veryhealthy sign.
Illustration 20Illustration 20Illustration 20Illustration 20Illustration 20
Given the following information:Rs.
Revenue from Operations 3,40,000Cost of Revenue from Operations 1,20,000Selling expenses 80,000Administrative Expenses 40,000
Calculate Gross Profit Ratio and Operating Ratio.
Solution:Solution:Solution:Solution:Solution:
Gross Profit = Revenue from Operations – Cost of Revenue fromOperations
= Rs. 3,40,000 – Rs. 1,20,000= Rs. 2,20,000
Gross Profit Ratio =Gross Profit
100Sales
´
=Rs. 2,20,000
100Rs. 3,40,000
´
= 64.71%Operating Expenses = Cost of Revenue from Operations + Selling Expenses
+ Administrative Expenses= Rs. 1,20,000 + 80,000 + 40,000= Rs. 2,40,000
Operating Ratio =Operating Expenses
Net Revenue from Operations x 100
=Rs. 2,40,000
100Rs. 3,40,000
´
= 70.58%
234 Accountancy : Company Accounts and Analysis of Financial Statements
5.9.45.9.45.9.45.9.45.9.4 Net Profit RatioNet Profit RatioNet Profit RatioNet Profit RatioNet Profit Ratio
Net Profit Ratio is based on all inclusive concept of profit. It relates revenue fromoperations to net profit after operational as well as non-operational expensesand incomes. It is calculated as under:
Net Profit Ratio = Net profit/Revenue from Operations × 100
Generally, net profit refers to Profit after Tax (PAT).
Significance: It is a measure of net profit margin in relation to revenue fromoperations. Besides revealing profitability, it is the main variable in computationof Return on Investment. It reflects the overall efficiency of the business, assumesgreat significance from the point of view of investors.
Illustration 21Illustration 21Illustration 21Illustration 21Illustration 21
Gross profit ratio of a company was 25%. Its credit revenue from operations wasRs. 20,00,000 and its cash revenue from operations was 10% of the total revenuefrom operations. If the indirect expenses of the company were Rs. 50,000,calculate its net profit ratio.
Solution:Solution:Solution:Solution:Solution:
Cash Revenue from Operations = Rs.20,00,000 × 10/90= Rs.2,22,222
Hence, total Revenue from Operations are = Rs.22,22,222Gross profit = .25 × 22,22,222 = Rs. 5,55,555Net profit = Rs.5,55,555 – 50,000
= Rs.5,05,555Net profit ratio = Net profit/Revenue from Operations
× 100= Rs.5,05,555/Rs.22,22,222 × 100= 22.75%.
5.9.55.9.55.9.55.9.55.9.5 ReturReturReturReturReturn on Capital Employed or Investment (ROCE or ROI)n on Capital Employed or Investment (ROCE or ROI)n on Capital Employed or Investment (ROCE or ROI)n on Capital Employed or Investment (ROCE or ROI)n on Capital Employed or Investment (ROCE or ROI)
It explains the overall utilisation of funds by a business enterprise. Capitalemployed means the long-term funds employed in the business and includesshareholders’ funds, debentures and long-term loans. Alternatively, capitalemployed may be taken as the total of non-current assets and working capital.Profit refers to the Profit before Interest and Tax (PBIT) for computation of thisratio. Thus, it is computed as follows:
Return on Investment (or Capital Employed) = Profit before Interest and Tax/Capital Employed × 100
Significance: It measures return on capital employed in the business. It revealsthe efficiency of the business in utilisation of funds entrusted to it by shareholders,
235Accounting Ratios
debenture-holders and long-term loans. For inter-firm comparison, return oncapital employed funds is considered good measure of profitability. It also helpsin assessing whether the firm is earning a higher return on capital employed ascompared to the interest rate paid.
5.9.65.9.65.9.65.9.65.9.6 ReturReturReturReturReturn on Sharn on Sharn on Sharn on Sharn on Shareholders’ Fundseholders’ Fundseholders’ Fundseholders’ Fundseholders’ Funds
This ratio is very important from shareholders’ point of view in assessing whethertheir investment in the firm generates a reasonable return or not. It should behigher than the return on investment otherwise it would imply that company’sfunds have not been employed profitably.
A better measure of profitability from shareholders point of view is obtainedby determining return on total shareholders’ funds, it is also termed as Returnon Net Worth (RONW) and is calculated as under :
Return on Shareholders’ Fund = Profit after Tax
Shareholders' Funds
5.9.75.9.75.9.75.9.75.9.7 EarEarEarEarEarnings Per Sharnings Per Sharnings Per Sharnings Per Sharnings Per Shareeeee
The ratio is defined as –
EPS = Profit available for equity shareholders/No. of Equity Shares
In this context, earnings refer to profit available for equity shareholders whichis worked out as Profit after Tax – Dividend on Preference Shares.
This ratio is very important from equity shareholders point of view andalso for the share price in the stock market. This also helps comparison withother to ascertain its reasonableness and capacity to pay dividend.
5.9.85.9.85.9.85.9.85.9.8 Book VBook VBook VBook VBook Value per Sharalue per Sharalue per Sharalue per Sharalue per Shareeeee
This ratio is calculated as –
Book Value per share = Equity shareholders’ funds/No. of Equity Shares
Equity shareholder fund refers to Shareholders’ Funds – Preference ShareCapital. This ratio is again very important from equity shareholders point ofview as it gives an idea about the value of their holding and affects market priceof the shares.
5.9.95.9.95.9.95.9.95.9.9 Dividend Payout RatioDividend Payout RatioDividend Payout RatioDividend Payout RatioDividend Payout Ratio
This refers to the proportion of earning that are distributed to the shareholders.It is calculated as –
Dividend Payout Ratio = Dividend per share
Earnings per share
This reflects company’s dividend policy and growth in owner’s equity.
236 Accountancy : Company Accounts and Analysis of Financial Statements
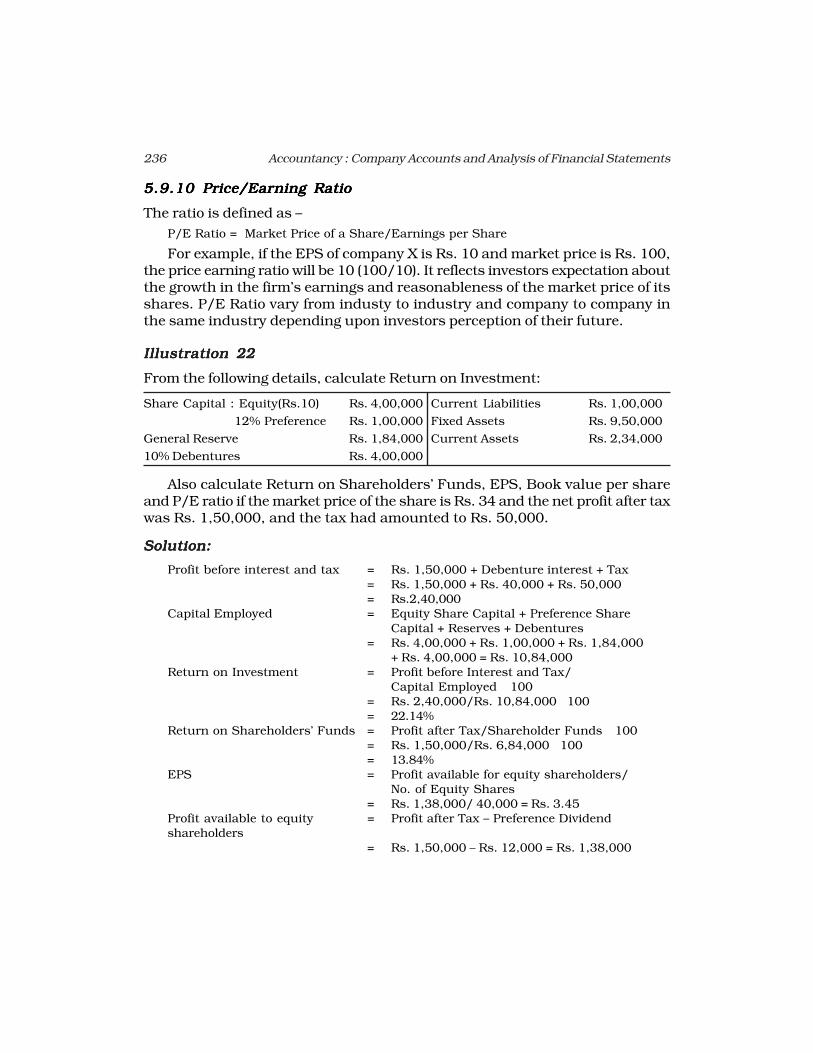
5.9.105.9.105.9.105.9.105.9.10 Price/EarPrice/EarPrice/EarPrice/EarPrice/Earning Rationing Rationing Rationing Rationing Ratio
The ratio is defined as –
P/E Ratio = Market Price of a Share/Earnings per Share
For example, if the EPS of company X is Rs. 10 and market price is Rs. 100,the price earning ratio will be 10 (100/10). It reflects investors expectation aboutthe growth in the firm’s earnings and reasonableness of the market price of itsshares. P/E Ratio vary from industy to industry and company to company inthe same industry depending upon investors perception of their future.
Illustration 22Illustration 22Illustration 22Illustration 22Illustration 22
From the following details, calculate Return on Investment:
Share Capital : Equity(Rs.10) Rs. 4,00,000 Current Liabilities Rs. 1,00,000
12% Preference Rs. 1,00,000 Fixed Assets Rs. 9,50,000
General Reserve Rs. 1,84,000 Current Assets Rs. 2,34,000
10% Debentures Rs. 4,00,000
Also calculate Return on Shareholders’ Funds, EPS, Book value per shareand P/E ratio if the market price of the share is Rs. 34 and the net profit after taxwas Rs. 1,50,000, and the tax had amounted to Rs. 50,000.
Solution:Solution:Solution:Solution:Solution:
Profit before interest and tax = Rs. 1,50,000 + Debenture interest + Tax= Rs. 1,50,000 + Rs. 40,000 + Rs. 50,000= Rs.2,40,000
Capital Employed = Equity Share Capital + Preference ShareCapital + Reserves + Debentures
= Rs. 4,00,000 + Rs. 1,00,000 + Rs. 1,84,000+ Rs. 4,00,000 = Rs. 10,84,000
Return on Investment = Profit before Interest and Tax/Capital Employed × 100
= Rs. 2,40,000/Rs. 10,84,000 × 100= 22.14%
Return on Shareholders’ Funds = Profit after Tax/Shareholder Funds × 100= Rs. 1,50,000/Rs. 6,84,000 × 100= 13.84%
EPS = Profit available for equity shareholders/No. of Equity Shares
= Rs. 1,38,000/ 40,000 = Rs. 3.45Profit available to equity = Profit after Tax – Preference Dividendshareholders
= Rs. 1,50,000 – Rs. 12,000 = Rs. 1,38,000
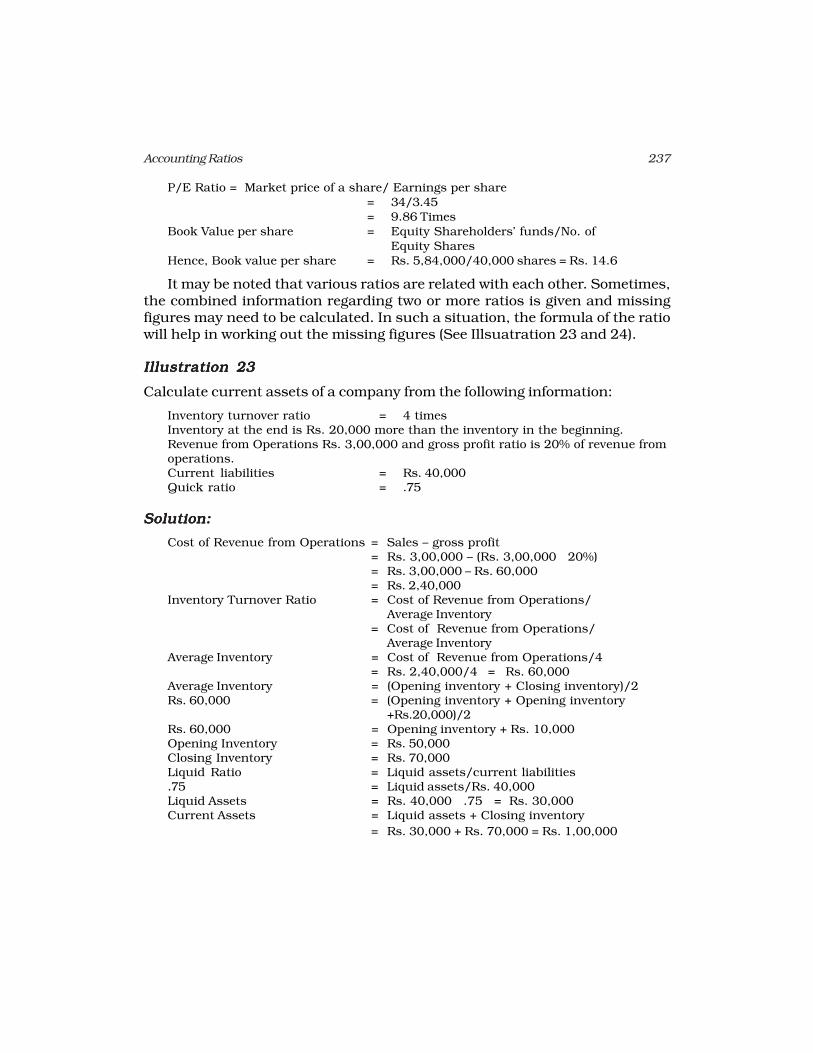
237Accounting Ratios
P/E Ratio = Market price of a share/ Earnings per share= 34/3.45= 9.86 Times
Book Value per share = Equity Shareholders’ funds/No. ofEquity Shares
Hence, Book value per share = Rs. 5,84,000/40,000 shares = Rs. 14.6
It may be noted that various ratios are related with each other. Sometimes,the combined information regarding two or more ratios is given and missingfigures may need to be calculated. In such a situation, the formula of the ratiowill help in working out the missing figures (See Illsuatration 23 and 24).
Illustration 23Illustration 23Illustration 23Illustration 23Illustration 23
Calculate current assets of a company from the following information:
Inventory turnover ratio = 4 timesInventory at the end is Rs. 20,000 more than the inventory in the beginning.Revenue from Operations Rs. 3,00,000 and gross profit ratio is 20% of revenue fromoperations.Current liabilities = Rs. 40,000Quick ratio = .75
Solution:Solution:Solution:Solution:Solution:
Cost of Revenue from Operations = Sales – gross profit= Rs. 3,00,000 – (Rs. 3,00,000 × 20%)= Rs. 3,00,000 – Rs. 60,000= Rs. 2,40,000
Inventory Turnover Ratio = Cost of Revenue from Operations/Average Inventory
= Cost of Revenue from Operations/Average Inventory
Average Inventory = Cost of Revenue from Operations/4= Rs. 2,40,000/4 = Rs. 60,000
Average Inventory = (Opening inventory + Closing inventory)/2Rs. 60,000 = (Opening inventory + Opening inventory
+Rs.20,000)/2Rs. 60,000 = Opening inventory + Rs. 10,000Opening Inventory = Rs. 50,000Closing Inventory = Rs. 70,000Liquid Ratio = Liquid assets/current liabilities.75 = Liquid assets/Rs. 40,000Liquid Assets = Rs. 40,000 × .75 = Rs. 30,000Current Assets = Liquid assets + Closing inventory
= Rs. 30,000 + Rs. 70,000 = Rs. 1,00,000
238 Accountancy : Company Accounts and Analysis of Financial Statements
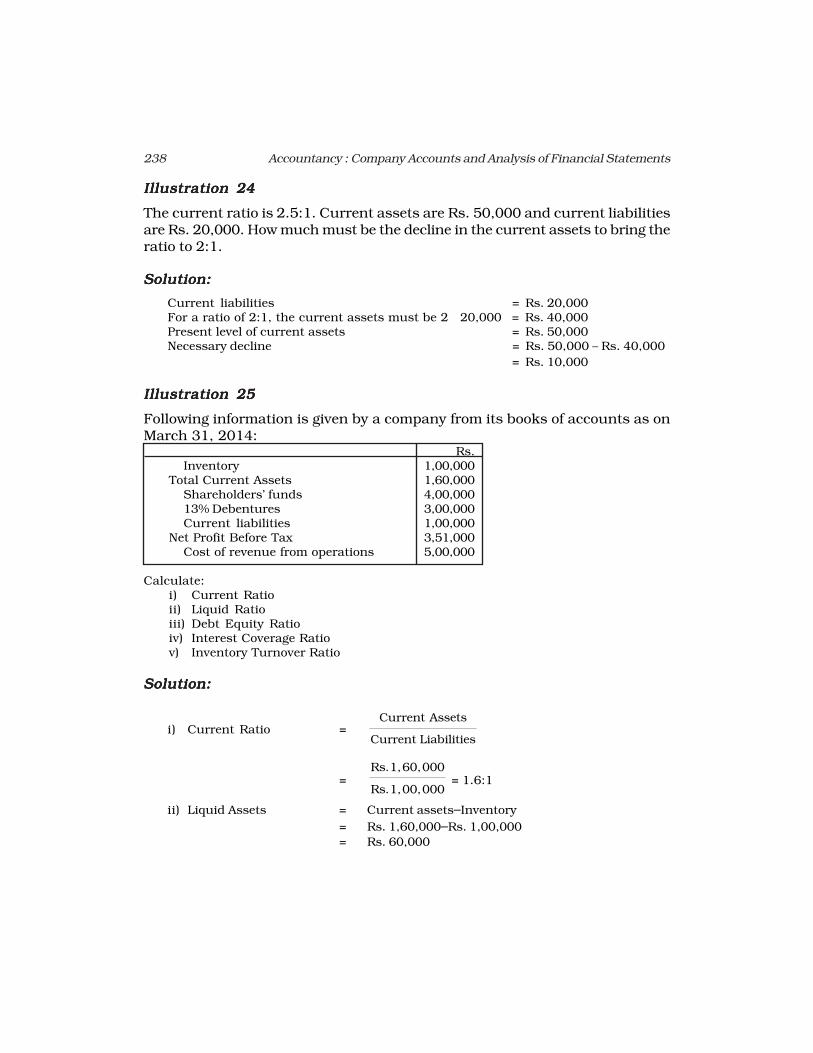
Illustration 24Illustration 24Illustration 24Illustration 24Illustration 24
The current ratio is 2.5:1. Current assets are Rs. 50,000 and current liabilitiesare Rs. 20,000. How much must be the decline in the current assets to bring theratio to 2:1.
Solution:Solution:Solution:Solution:Solution:
Current liabilities = Rs. 20,000For a ratio of 2:1, the current assets must be 2 × 20,000 = Rs. 40,000Present level of current assets = Rs. 50,000Necessary decline = Rs. 50,000 – Rs. 40,000
= Rs. 10,000
Illustration 25Illustration 25Illustration 25Illustration 25Illustration 25
Following information is given by a company from its books of accounts as onMarch 31, 2014:
Rs.Inventory 1,00,000
Total Current Assets 1,60,000Shareholders’ funds 4,00,00013% Debentures 3,00,000Current liabilities 1,00,000
Net Profit Before Tax 3,51,000Cost of revenue from operations 5,00,000
Calculate:i) Current Ratioii) Liquid Ratioiii) Debt Equity Ratioiv) Interest Coverage Ratiov) Inventory Turnover Ratio
Solution:Solution:Solution:Solution:Solution:
i) Current Ratio =Current Assets
Current Liabilities
=Rs. 1,60,000
Rs. 1,00,000 = 1.6:1
ii) Liquid Assets = Current assets–Inventory
= Rs. 1,60,000–Rs. 1,00,000
= Rs. 60,000
239Accounting Ratios
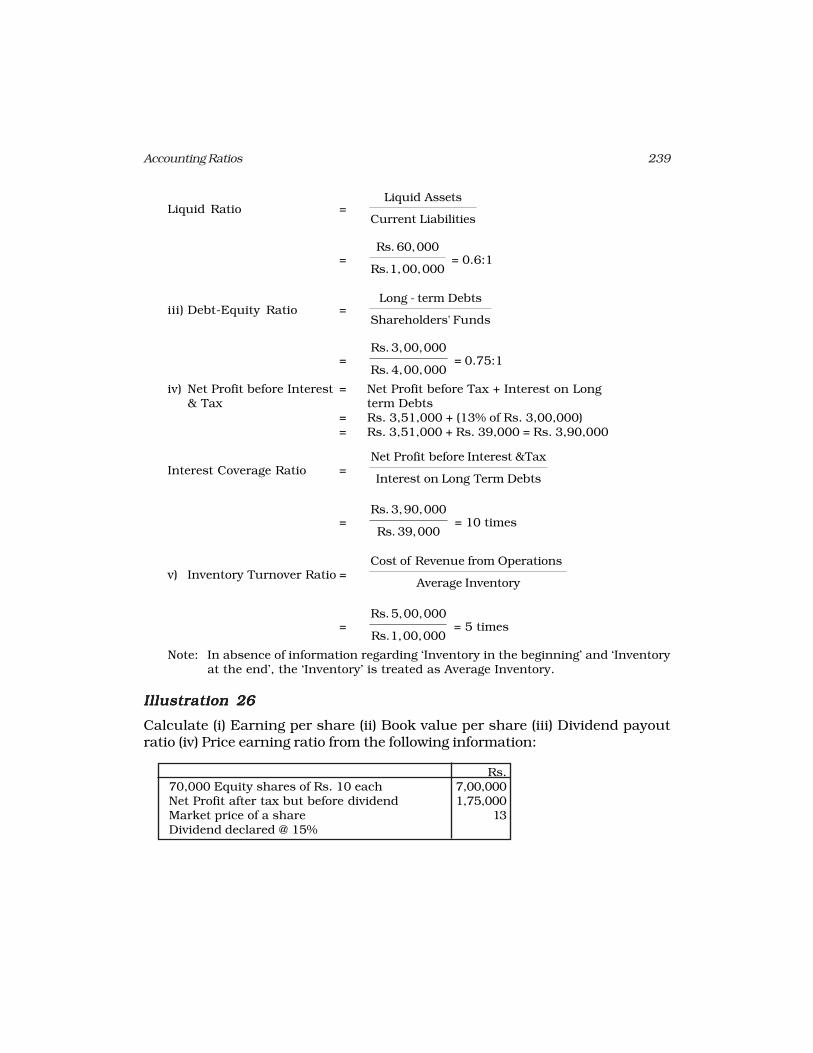
Liquid Ratio =Liquid Assets
Current Liabilities
=Rs. 60,000
Rs. 1,00,000 = 0.6:1
iii) Debt-Equity Ratio =Long - term Debts
Shareholders' Funds
=Rs. 3,00,000
Rs. 4,00,000 = 0.75:1
iv) Net Profit before Interest = Net Profit before Tax + Interest on Long& Tax term Debts
= Rs. 3,51,000 + (13% of Rs. 3,00,000)= Rs. 3,51,000 + Rs. 39,000 = Rs. 3,90,000
Interest Coverage Ratio =Net Profit before Interest &Tax
Interest on Long Term Debts
=Rs. 3,90,000
Rs. 39,000 = 10 times
v) Inventory Turnover Ratio =Cost of Revenue from Operations
Average Inventory
=Rs. 5,00,000
Rs. 1,00,000 = 5 times
Note: In absence of information regarding ‘Inventory in the beginning’ and ‘Inventoryat the end’, the ‘Inventory’ is treated as Average Inventory.
Illustration 26Illustration 26Illustration 26Illustration 26Illustration 26
Calculate (i) Earning per share (ii) Book value per share (iii) Dividend payoutratio (iv) Price earning ratio from the following information:
Rs.70,000 Equity shares of Rs. 10 each 7,00,000Net Profit after tax but before dividend 1,75,000Market price of a share 13Dividend declared @ 15%
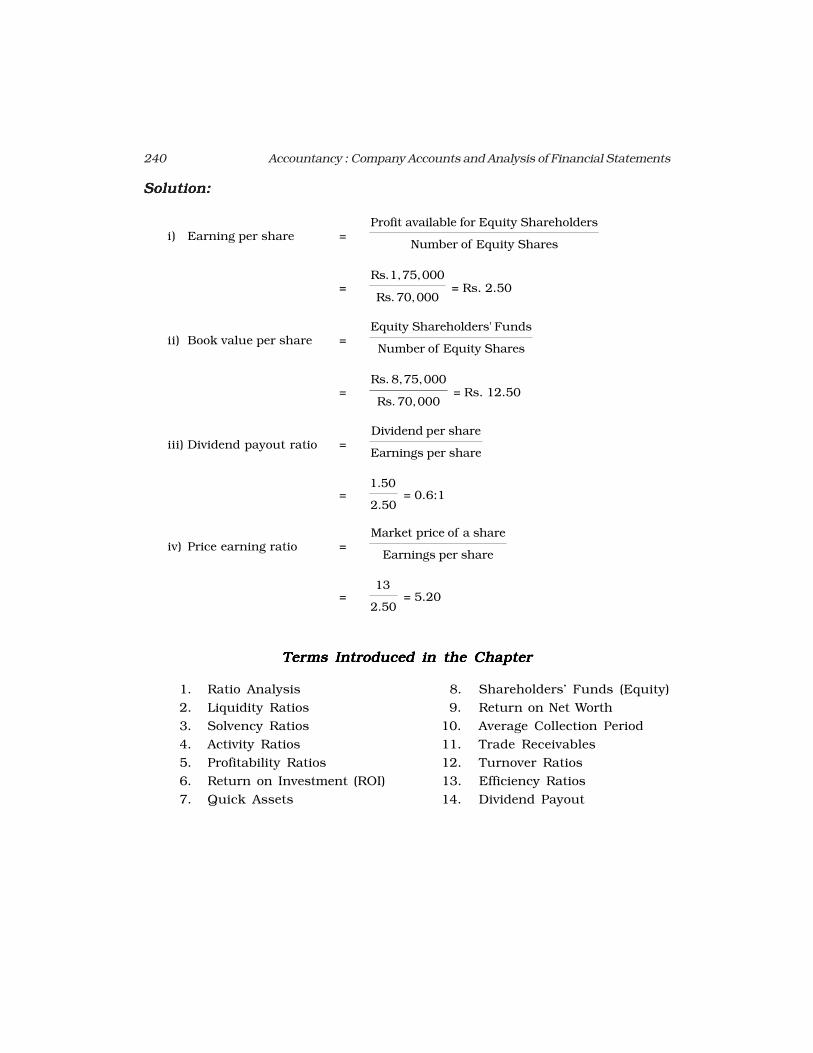
240 Accountancy : Company Accounts and Analysis of Financial Statements
Solution:Solution:Solution:Solution:Solution:
i) Earning per share =Profit available for Equity Shareholders
Number of Equity Shares
=Rs. 1,75,000
Rs. 70,000 = Rs. 2.50
ii) Book value per share =Equity Shareholders' Funds
Number of Equity Shares
=Rs. 8,75,000
Rs. 70,000 = Rs. 12.50
iii) Dividend payout ratio =Dividend per share
Earnings per share
=1.50
2.50 = 0.6:1
iv) Price earning ratio =Market price of a share
Earnings per share
=13
2.50 = 5.20
TTTTTerererererms Intrms Intrms Intrms Intrms Introduced in the Chapteroduced in the Chapteroduced in the Chapteroduced in the Chapteroduced in the Chapter
1. Ratio Analysis 8. Shareholders’ Funds (Equity)
2. Liquidity Ratios 9. Return on Net Worth
3. Solvency Ratios 10. Average Collection Period
4. Activity Ratios 11. Trade Receivables
5. Profitability Ratios 12. Turnover Ratios
6. Return on Investment (ROI) 13. Efficiency Ratios
7. Quick Assets 14. Dividend Payout
241Accounting Ratios
SummarySummarySummarySummarySummary
Ratio Analysis: An important tool of financial statement analysis is ratioanalysis. Accounting ratios represent relationship between two accountingnumbers.Objective of Ratio Analysis:The objective of ratio analysis is to provide adeeper analysis of the profitability, liquidity, solvency and activity levels inthe business. It is also to identify the problem areas as well as the strongareas of the business.Advantages of Ratio Analysis: Ratio analysis offers many advantagesincluding enabling financial statement analysis, helping understand efficacyof decisions, simplifying complex figures and establish relationships, beinghelpful in comparative analysis, identification of problem areas, enablesSWOT analysis, and allows various comparisons.Limitations of Ratio Analysis: There are many limitations of ratio analysis.Few are based because of the basic limitations of the accounting data onwhich it is based. The other set includes the limitation of the ratio analysisper set. In the first set are included factors like Historical Analysis, IgnoresPrice-level Changes, Ignore Qualitative or Non-monetary Aspects,Limitations of Accounting Data, Variations in Accounting Practices, andForecasting. In the second set are included factor like means and not theend, lack of ability to resolve problems, lack of standardised definitions,lack of universally accepted standard levels, and ratios based on unrelatedfigures.Types of Ratios: There are many types of ratios, viz. liquidity, solvency,activity and profitability ratios. The liquidity ratios include current ratioand acid test ratio. Solvency ratios are calculated to determine the abilityof the business to service its debt in the long run instead of in the shortrun. They include debt equity ratio, total assets to debt ratio, proprietaryratio and interest coverage ratio. The turnover ratios basically exhibit theactivity levels characterised by the capacity of the business to make moresales or turnover and include Inventory Turnover, Trade ReceivablesTurnover, Trade Payables Turnover, Working Capital Turnover, Fixed AssetsTurnover and Current assets Turnover. Profitability ratios are calculatedto analyse the earning capacity of the business which is the outcome ofutilisation of resources employed in the business. The ratios include GrossProfit ratio, Operating ratio, Net Profit Ratio, Return on investment (Capitalemployed), Earnings per Share, Book Value per Share, Dividend per Share
and Price/Earning ratio.
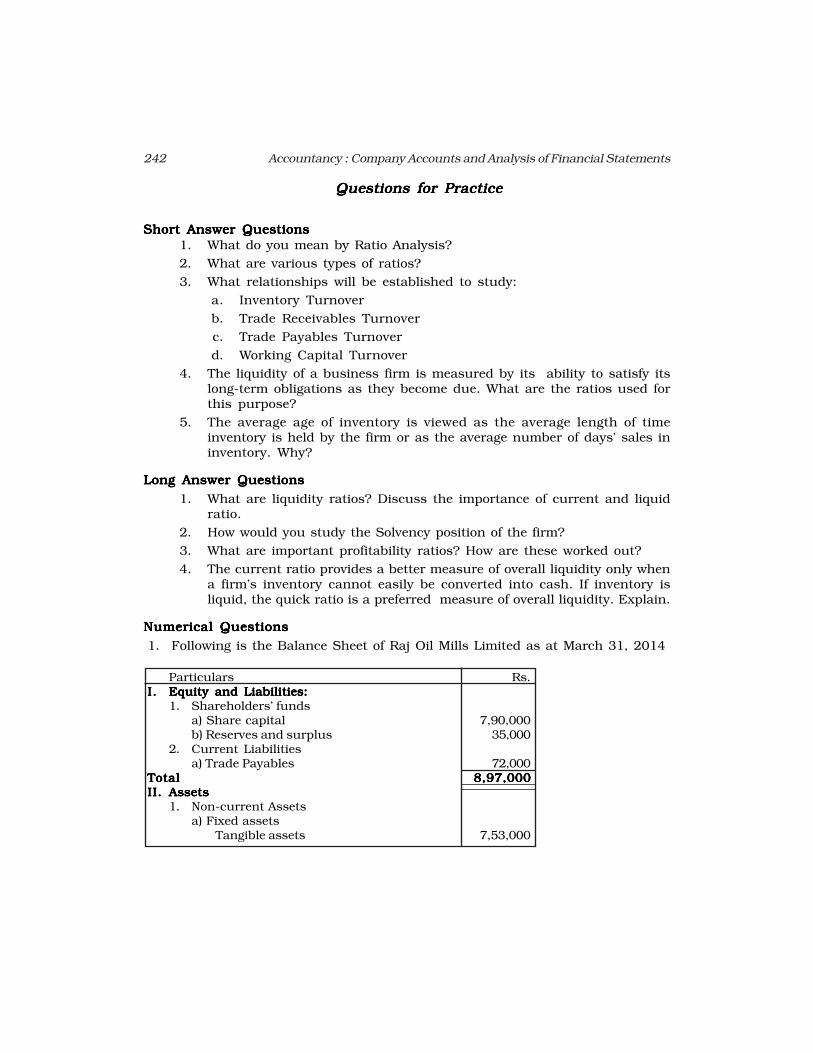
242 Accountancy : Company Accounts and Analysis of Financial Statements
Questions for PracticeQuestions for PracticeQuestions for PracticeQuestions for PracticeQuestions for Practice
Short Answer QuestionsShort Answer QuestionsShort Answer QuestionsShort Answer QuestionsShort Answer Questions
1. What do you mean by Ratio Analysis?
2. What are various types of ratios?
3. What relationships will be established to study:
a. Inventory Turnover
b. Trade Receivables Turnover
c. Trade Payables Turnover
d. Working Capital Turnover
4. The liquidity of a business firm is measured by its ability to satisfy itslong-term obligations as they become due. What are the ratios used forthis purpose?
5. The average age of inventory is viewed as the average length of timeinventory is held by the firm or as the average number of days’ sales ininventory. Why?
Long Answer QuestionsLong Answer QuestionsLong Answer QuestionsLong Answer QuestionsLong Answer Questions
1. What are liquidity ratios? Discuss the importance of current and liquidratio.
2. How would you study the Solvency position of the firm?
3. What are important profitability ratios? How are these worked out?
4. The current ratio provides a better measure of overall liquidity only whena firm’s inventory cannot easily be converted into cash. If inventory isliquid, the quick ratio is a preferred measure of overall liquidity. Explain.
Numerical QuestionsNumerical QuestionsNumerical QuestionsNumerical QuestionsNumerical Questions
1. Following is the Balance Sheet of Raj Oil Mills Limited as at March 31, 2014
Particulars Rs.I.I.I.I.I. Equity and Liabilities:Equity and Liabilities:Equity and Liabilities:Equity and Liabilities:Equity and Liabilities:
1. Shareholders’ fundsa) Share capital 7,90,000b) Reserves and surplus 35,000
2. Current Liabilitiesa) Trade Payables 72,000
TotalTotalTotalTotalTotal 8,97,0008,97,0008,97,0008,97,0008,97,000II.II.II.II.II. AssetsAssetsAssetsAssetsAssets
1. Non-current Assetsa) Fixed assets
Tangible assets 7,53,000
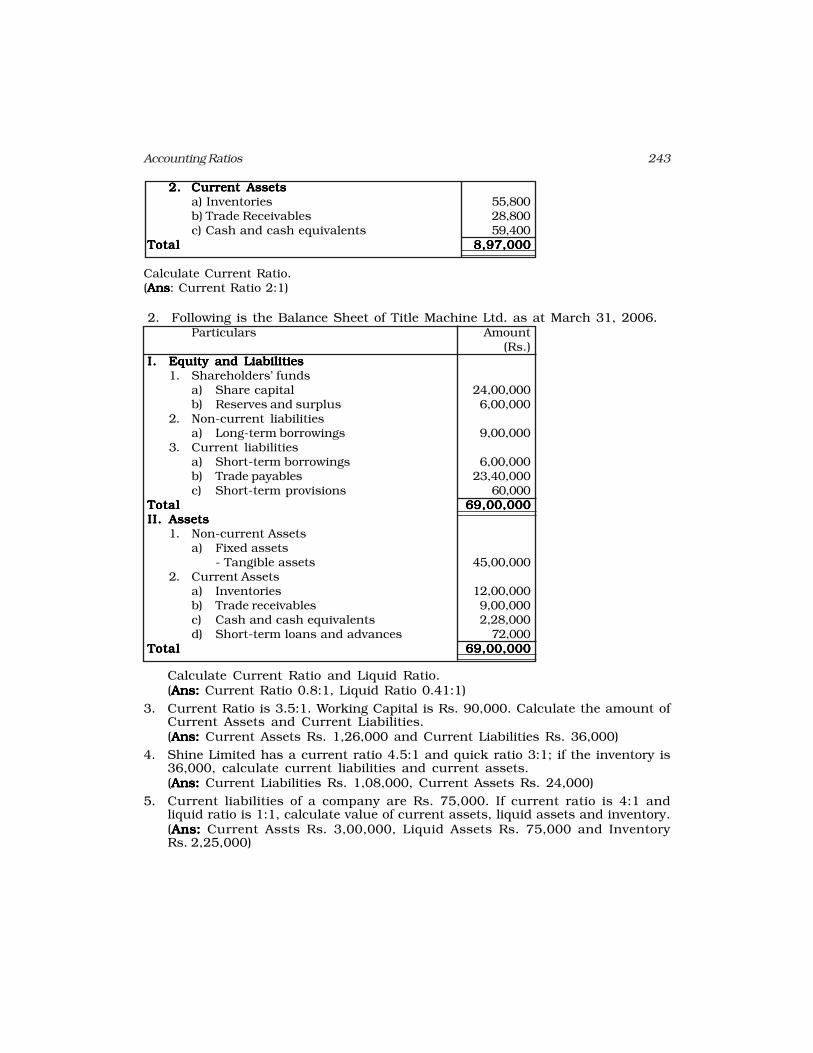
243Accounting Ratios
2.2.2.2.2. Current AssetsCurrent AssetsCurrent AssetsCurrent AssetsCurrent Assetsa) Inventories 55,800b) Trade Receivables 28,800c) Cash and cash equivalents 59,400
TotalTotalTotalTotalTotal 8,97,0008,97,0008,97,0008,97,0008,97,000
Calculate Current Ratio.(AnsAnsAnsAnsAns: Current Ratio 2:1)
2. Following is the Balance Sheet of Title Machine Ltd. as at March 31, 2006.Particulars Amount
(Rs.)I.I.I.I.I. Equity and LiabilitiesEquity and LiabilitiesEquity and LiabilitiesEquity and LiabilitiesEquity and Liabilities
1. Shareholders’ fundsa) Share capital 24,00,000b) Reserves and surplus 6,00,000
2. Non-current liabilitiesa) Long-term borrowings 9,00,000
3. Current liabilitiesa) Short-term borrowings 6,00,000b) Trade payables 23,40,000c) Short-term provisions 60,000
TotalTotalTotalTotalTotal 69,00,00069,00,00069,00,00069,00,00069,00,000II.II.II.II.II. AssetsAssetsAssetsAssetsAssets
1. Non-current Assetsa) Fixed assets
- Tangible assets 45,00,0002. Current Assets
a) Inventories 12,00,000b) Trade receivables 9,00,000c) Cash and cash equivalents 2,28,000d) Short-term loans and advances 72,000
TotalTotalTotalTotalTotal 69,00,00069,00,00069,00,00069,00,00069,00,000
Calculate Current Ratio and Liquid Ratio.(Ans:Ans:Ans:Ans:Ans: Current Ratio 0.8:1, Liquid Ratio 0.41:1)
3. Current Ratio is 3.5:1. Working Capital is Rs. 90,000. Calculate the amount ofCurrent Assets and Current Liabilities.(Ans:Ans:Ans:Ans:Ans: Current Assets Rs. 1,26,000 and Current Liabilities Rs. 36,000)
4. Shine Limited has a current ratio 4.5:1 and quick ratio 3:1; if the inventory is36,000, calculate current liabilities and current assets.(Ans:Ans:Ans:Ans:Ans: Current Liabilities Rs. 1,08,000, Current Assets Rs. 24,000)
5. Current liabilities of a company are Rs. 75,000. If current ratio is 4:1 andliquid ratio is 1:1, calculate value of current assets, liquid assets and inventory.(Ans:Ans:Ans:Ans:Ans: Current Assts Rs. 3,00,000, Liquid Assets Rs. 75,000 and InventoryRs. 2,25,000)
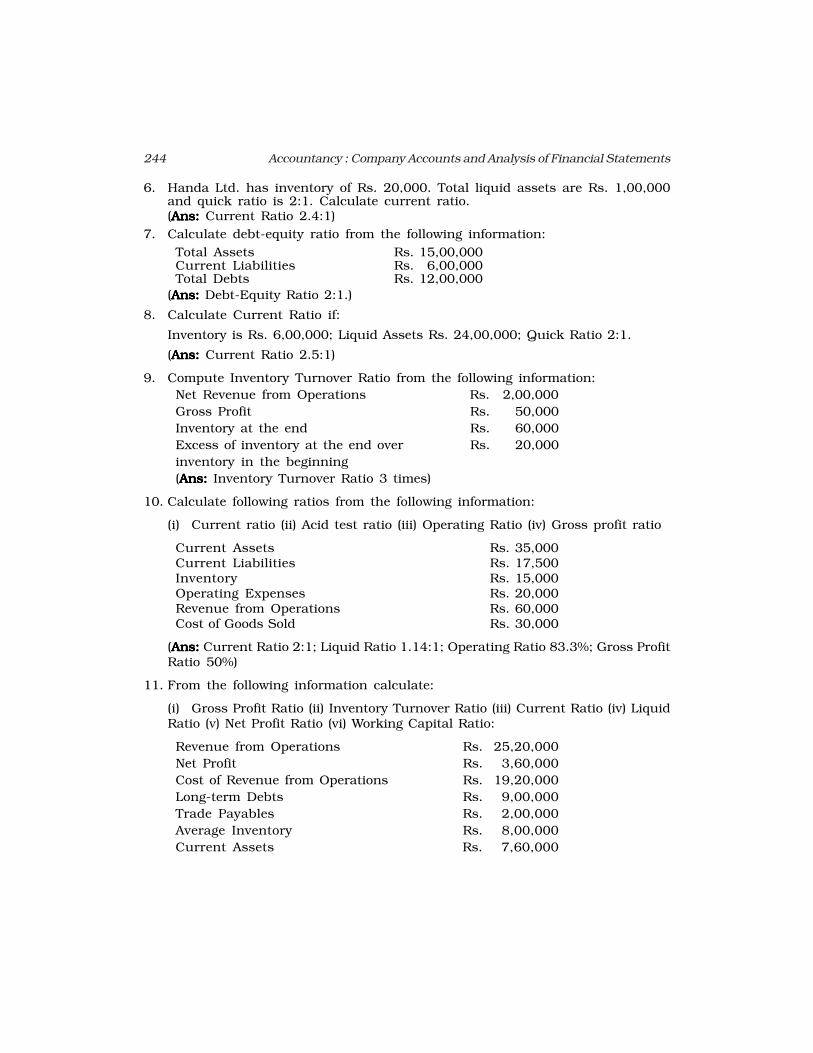
244 Accountancy : Company Accounts and Analysis of Financial Statements
6. Handa Ltd. has inventory of Rs. 20,000. Total liquid assets are Rs. 1,00,000and quick ratio is 2:1. Calculate current ratio.(Ans:Ans:Ans:Ans:Ans: Current Ratio 2.4:1)
7. Calculate debt-equity ratio from the following information:
Total Assets Rs. 15,00,000Current Liabilities Rs. 6,00,000Total Debts Rs. 12,00,000
(Ans: Ans: Ans: Ans: Ans: Debt-Equity Ratio 2:1.)
8. Calculate Current Ratio if:
Inventory is Rs. 6,00,000; Liquid Assets Rs. 24,00,000; Quick Ratio 2:1.
(Ans:Ans:Ans:Ans:Ans: Current Ratio 2.5:1)
9. Compute Inventory Turnover Ratio from the following information:
Net Revenue from Operations Rs. 2,00,000
Gross Profit Rs. 50,000
Inventory at the end Rs. 60,000
Excess of inventory at the end over Rs. 20,000
inventory in the beginning
(Ans:Ans:Ans:Ans:Ans: Inventory Turnover Ratio 3 times)
10. Calculate following ratios from the following information:
(i) Current ratio (ii) Acid test ratio (iii) Operating Ratio (iv) Gross profit ratio
Current Assets Rs. 35,000Current Liabilities Rs. 17,500Inventory Rs. 15,000Operating Expenses Rs. 20,000Revenue from Operations Rs. 60,000Cost of Goods Sold Rs. 30,000
(Ans:Ans:Ans:Ans:Ans: Current Ratio 2:1; Liquid Ratio 1.14:1; Operating Ratio 83.3%; Gross ProfitRatio 50%)
11. From the following information calculate:
(i) Gross Profit Ratio (ii) Inventory Turnover Ratio (iii) Current Ratio (iv) LiquidRatio (v) Net Profit Ratio (vi) Working Capital Ratio:
Revenue from Operations Rs. 25,20,000
Net Profit Rs. 3,60,000
Cost of Revenue from Operations Rs. 19,20,000
Long-term Debts Rs. 9,00,000
Trade Payables Rs. 2,00,000
Average Inventory Rs. 8,00,000
Current Assets Rs. 7,60,000
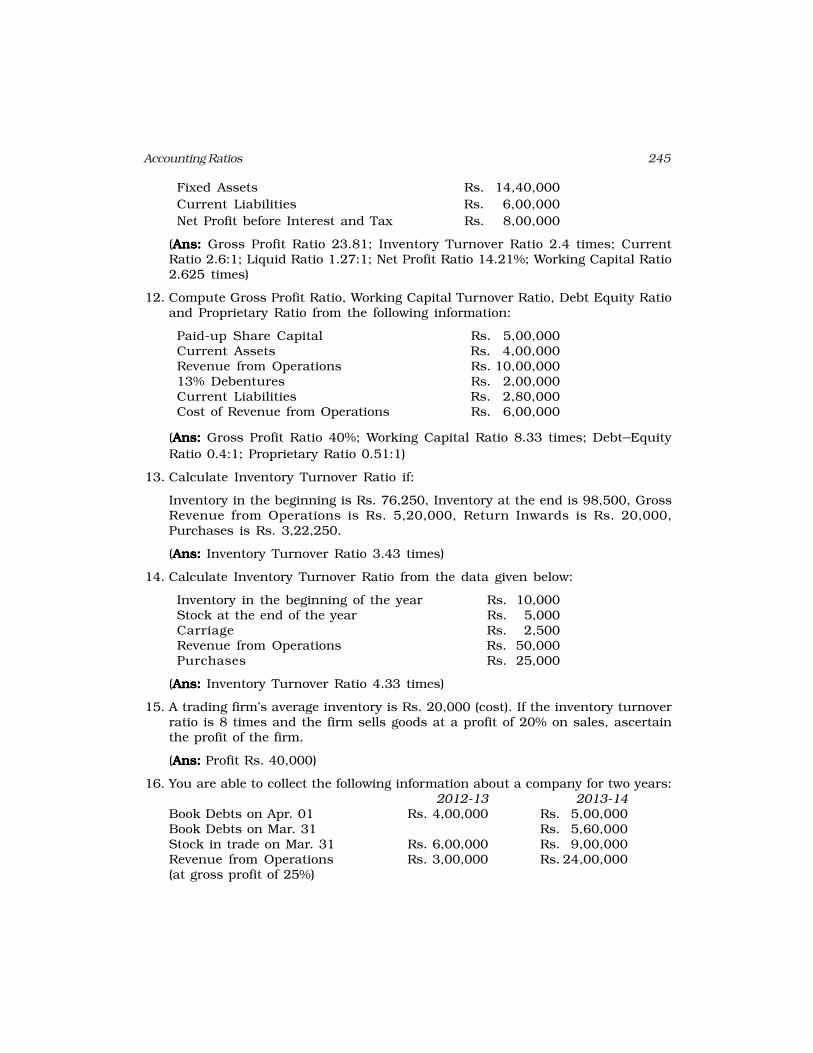
245Accounting Ratios
Fixed Assets Rs. 14,40,000
Current Liabilities Rs. 6,00,000
Net Profit before Interest and Tax Rs. 8,00,000
(Ans: Ans: Ans: Ans: Ans: Gross Profit Ratio 23.81; Inventory Turnover Ratio 2.4 times; CurrentRatio 2.6:1; Liquid Ratio 1.27:1; Net Profit Ratio 14.21%; Working Capital Ratio2.625 times)
12. Compute Gross Profit Ratio, Working Capital Turnover Ratio, Debt Equity Ratioand Proprietary Ratio from the following information:
Paid-up Share Capital Rs. 5,00,000Current Assets Rs. 4,00,000Revenue from Operations Rs. 10,00,00013% Debentures Rs. 2,00,000Current Liabilities Rs. 2,80,000Cost of Revenue from Operations Rs. 6,00,000
(Ans:Ans:Ans:Ans:Ans: Gross Profit Ratio 40%; Working Capital Ratio 8.33 times; Debt–Equity
Ratio 0.4:1; Proprietary Ratio 0.51:1)
13. Calculate Inventory Turnover Ratio if:
Inventory in the beginning is Rs. 76,250, Inventory at the end is 98,500, GrossRevenue from Operations is Rs. 5,20,000, Return Inwards is Rs. 20,000,Purchases is Rs. 3,22,250.
(Ans:Ans:Ans:Ans:Ans: Inventory Turnover Ratio 3.43 times)
14. Calculate Inventory Turnover Ratio from the data given below:
Inventory in the beginning of the year Rs. 10,000Stock at the end of the year Rs. 5,000Carriage Rs. 2,500Revenue from Operations Rs. 50,000Purchases Rs. 25,000
(Ans:Ans:Ans:Ans:Ans: Inventory Turnover Ratio 4.33 times)
15. A trading firm’s average inventory is Rs. 20,000 (cost). If the inventory turnoverratio is 8 times and the firm sells goods at a profit of 20% on sales, ascertainthe profit of the firm.
(Ans:Ans:Ans:Ans:Ans: Profit Rs. 40,000)
16. You are able to collect the following information about a company for two years:2012-13 2013-14
Book Debts on Apr. 01 Rs. 4,00,000 Rs. 5,00,000Book Debts on Mar. 31 Rs. 5,60,000Stock in trade on Mar. 31 Rs. 6,00,000 Rs. 9,00,000Revenue from Operations Rs. 3,00,000 Rs. 24,00,000(at gross profit of 25%)
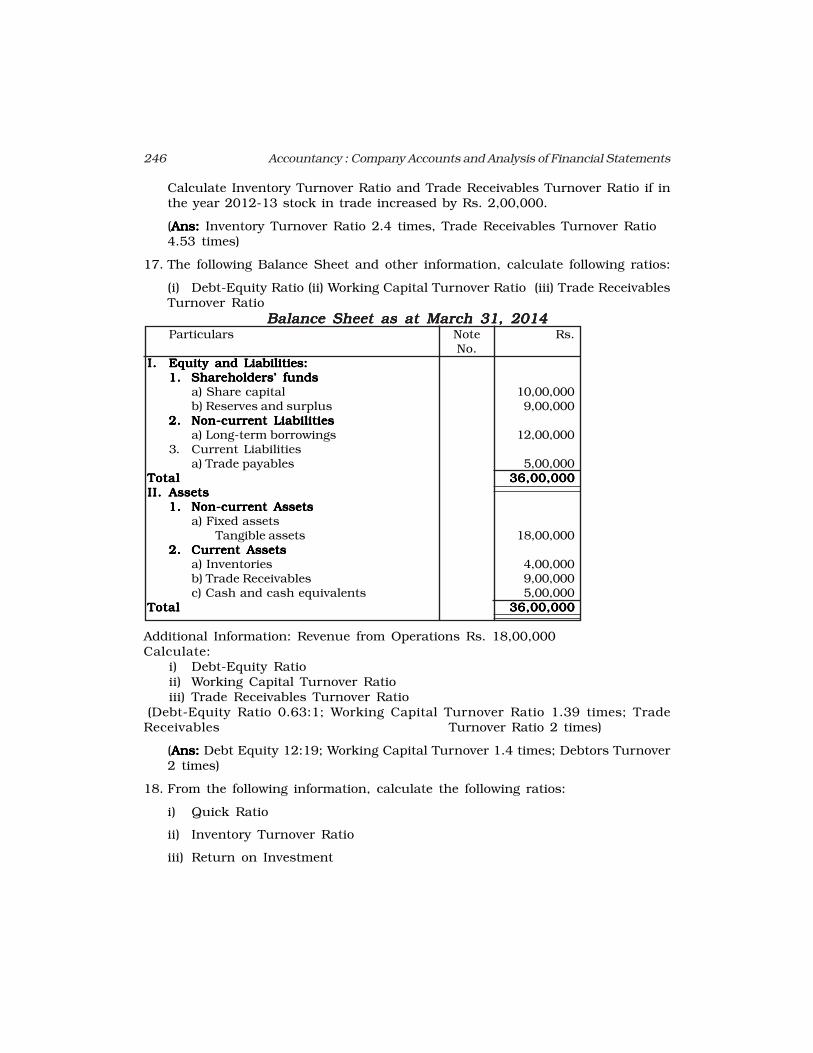
246 Accountancy : Company Accounts and Analysis of Financial Statements
Calculate Inventory Turnover Ratio and Trade Receivables Turnover Ratio if inthe year 2012-13 stock in trade increased by Rs. 2,00,000.
(Ans:Ans:Ans:Ans:Ans: Inventory Turnover Ratio 2.4 times, Trade Receivables Turnover Ratio4.53 times)
17. The following Balance Sheet and other information, calculate following ratios:
(i) Debt-Equity Ratio (ii) Working Capital Turnover Ratio (iii) Trade ReceivablesTurnover Ratio
Balance Sheet as at March 31, 2014Balance Sheet as at March 31, 2014Balance Sheet as at March 31, 2014Balance Sheet as at March 31, 2014Balance Sheet as at March 31, 2014Particulars Note Rs.
No.I.I.I.I.I. Equity and Liabilities:Equity and Liabilities:Equity and Liabilities:Equity and Liabilities:Equity and Liabilities:
1.1.1.1.1. Shareholders’ fundsShareholders’ fundsShareholders’ fundsShareholders’ fundsShareholders’ fundsa) Share capital 10,00,000b) Reserves and surplus 9,00,000
2.2.2.2.2. Non-current LiabilitiesNon-current LiabilitiesNon-current LiabilitiesNon-current LiabilitiesNon-current Liabilitiesa) Long-term borrowings 12,00,000
3. Current Liabilitiesa) Trade payables 5,00,000
TotalTotalTotalTotalTotal 36,00,00036,00,00036,00,00036,00,00036,00,000II.II.II.II.II. AssetsAssetsAssetsAssetsAssets
1.1.1.1.1. Non-current AssetsNon-current AssetsNon-current AssetsNon-current AssetsNon-current Assetsa) Fixed assets
Tangible assets 18,00,0002.2.2.2.2. Current AssetsCurrent AssetsCurrent AssetsCurrent AssetsCurrent Assets
a) Inventories 4,00,000b) Trade Receivables 9,00,000c) Cash and cash equivalents 5,00,000
TotalTotalTotalTotalTotal 36,00,00036,00,00036,00,00036,00,00036,00,000
Additional Information: Revenue from Operations Rs. 18,00,000Calculate:
i) Debt-Equity Ratioii) Working Capital Turnover Ratioiii) Trade Receivables Turnover Ratio
(Debt-Equity Ratio 0.63:1; Working Capital Turnover Ratio 1.39 times; TradeReceivables Turnover Ratio 2 times)
(Ans:Ans:Ans:Ans:Ans: Debt Equity 12:19; Working Capital Turnover 1.4 times; Debtors Turnover2 times)
18. From the following information, calculate the following ratios:
i) Quick Ratio
ii) Inventory Turnover Ratio
iii) Return on Investment
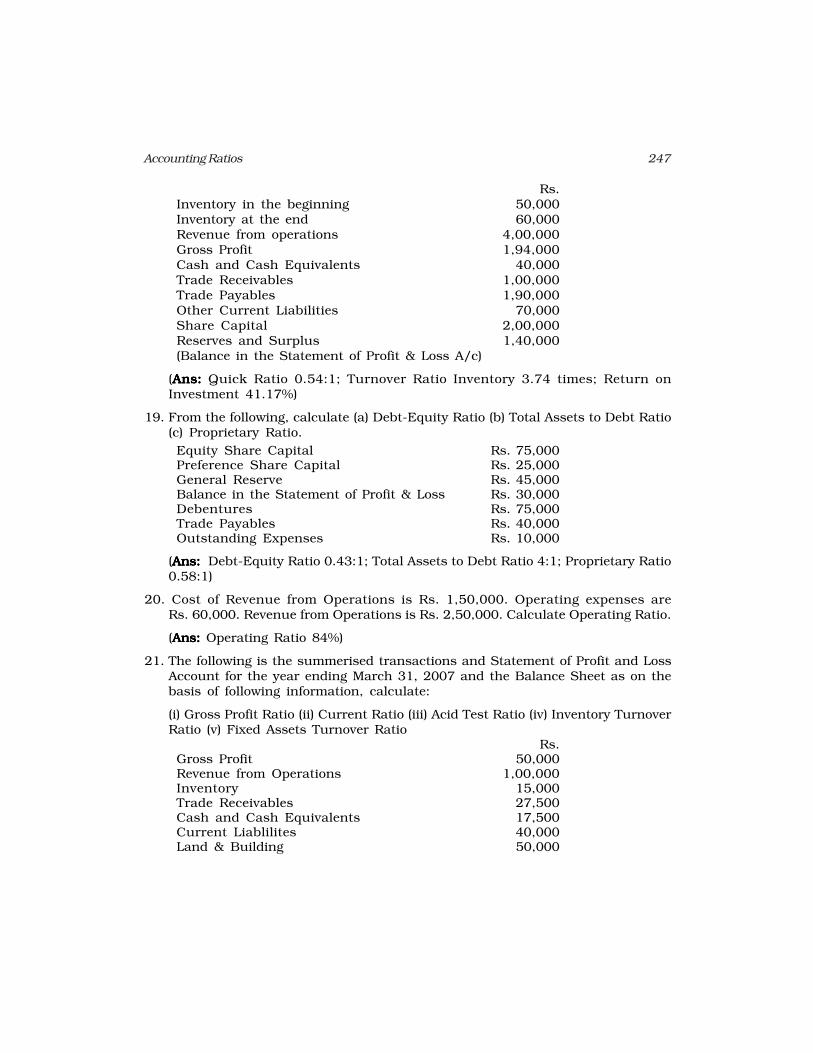
247Accounting Ratios
Rs.Inventory in the beginning 50,000Inventory at the end 60,000Revenue from operations 4,00,000Gross Profit 1,94,000Cash and Cash Equivalents 40,000Trade Receivables 1,00,000Trade Payables 1,90,000Other Current Liabilities 70,000Share Capital 2,00,000Reserves and Surplus 1,40,000(Balance in the Statement of Profit & Loss A/c)
(Ans:Ans:Ans:Ans:Ans: Quick Ratio 0.54:1; Turnover Ratio Inventory 3.74 times; Return onInvestment 41.17%)
19. From the following, calculate (a) Debt-Equity Ratio (b) Total Assets to Debt Ratio(c) Proprietary Ratio.
Equity Share Capital Rs. 75,000Preference Share Capital Rs. 25,000General Reserve Rs. 45,000Balance in the Statement of Profit & Loss Rs. 30,000Debentures Rs. 75,000Trade Payables Rs. 40,000Outstanding Expenses Rs. 10,000
(Ans:Ans:Ans:Ans:Ans: Debt-Equity Ratio 0.43:1; Total Assets to Debt Ratio 4:1; Proprietary Ratio0.58:1)
20. Cost of Revenue from Operations is Rs. 1,50,000. Operating expenses areRs. 60,000. Revenue from Operations is Rs. 2,50,000. Calculate Operating Ratio.
(Ans: Ans: Ans: Ans: Ans: Operating Ratio 84%)
21. The following is the summerised transactions and Statement of Profit and LossAccount for the year ending March 31, 2007 and the Balance Sheet as on thebasis of following information, calculate:
(i) Gross Profit Ratio (ii) Current Ratio (iii) Acid Test Ratio (iv) Inventory TurnoverRatio (v) Fixed Assets Turnover Ratio
Rs.Gross Profit 50,000Revenue from Operations 1,00,000Inventory 15,000Trade Receivables 27,500Cash and Cash Equivalents 17,500Current Liablilites 40,000Land & Building 50,000
248 Accountancy : Company Accounts and Analysis of Financial Statements
Plant & Machinery 30,000Furniture 20,000
(Ans: Ans: Ans: Ans: Ans: (i) Gross Profit Ratio 50%; (ii) Current Ratio 1.5:1; (iii) Acid Test Ratio1.125:1, Inventory Turnover Ratio 3.33 times; (iv) Fixed Assets Turnover 1:1)
22. From the following information calculate Gross Profit Ratio, Inventory TurnoverRatio and Trade Receivable Turnover Ratio.
Revenue from Operations Rs. 3,00,000Cost of Revenue from Operations Rs. 2,40,000Inventory at the end Rs. 62,000Gross Profit Rs. 60,000Inventory in the beginning Rs. 58,000Trade Receivables Rs. 32,000
(Ans:Ans:Ans:Ans:Ans: Gross Profit Ratio 20%; Inventory Turnover Ratio 4 times; TradeReceivables Turnover Ratio 9.4 times)
Answers to Test your UnderstandingAnswers to Test your UnderstandingAnswers to Test your UnderstandingAnswers to Test your UnderstandingAnswers to Test your Understanding
Test your Understanding – ITest your Understanding – ITest your Understanding – ITest your Understanding – ITest your Understanding – I
(a) F, (b) T, (c) T, (d) F, (e) T, (F) F
Test your Understanding – IITest your Understanding – IITest your Understanding – IITest your Understanding – IITest your Understanding – II
(i) D, (ii) B, (iii) B, (iv) A, (v) B, (vi) D
Test your Understanding – IIITest your Understanding – IIITest your Understanding – IIITest your Understanding – IIITest your Understanding – III
(i) C, (ii) B, (iii) A, (iv) C, (v) C, (vi) C