Embed Size (px)
Citation preview

Chapter 25 “Responsibility Accounting: Segmental Analysis” from Accounting Principles: Managerial Accounting by Hermanson, Edwards, and Ivancevich is available under Creative Commons Attribution-Noncommercial-Share Alike 3.0 license. © Textbook Equity (2011)

25 Responsibility accounting: Segmental analysis
25.1 Learning objectivesAfter studying this chapter, you should be able to:
• Explain responsibility accounting and its use in a business entity.
• Prepare responsibility accounting reports.
• Prepare a segmental income statement using the contribution margin format.
• Calculate return on investment, margin, and turnover for a segment.
• Calculate the residual income of a segment.
• Allocate costs from service departments to operating departments (Appendix).
When a business is small, the owner usually supervises many different activities in the business.
As a business grows, responsibility for some of these activities must be given to other persons.
Obviously, the success of a business depends to a great extent on the persons responsible for these
activities.
In this chapter, you learn about delegating authority to lower level managers for managing various
business activities and holding these lower level managers responsible for the activities under their
control. You also learn how to assess the performance of these managers. A company's activities are
grouped into responsibility centers. The company measures the performance of each center manager
in terms of the items of revenue and expense over which that manager has control.
25.2 Responsibility accountingThe term responsibility accounting refers to an accounting system that collects, summarizes,
and reports accounting data relating to the responsibilities of individual managers. A responsibility
accounting system provides information to evaluate each manager on the revenue and expense items
over which that manager has primary control (authority to influence).
A responsibility accounting report contains those items controllable by the responsible manager.
When both controllable and uncontrollable items are included in the report, accountants should
clearly separate the categories. The identification of controllable items is a fundamental task in
responsibility accounting and reporting.
234

To implement responsibility accounting in a company, the business entity must be organized so
that responsibility is assignable to individual managers. The various company managers and their
lines of authority (and the resulting levels of responsibility) should be fully defined. The organization
chart in Exhibit 53 demonstrates lines of authority and responsibility that could be used as a basis for
responsibility reporting.
Exhibit 53: A corporate functional organization chart including four levels of management
To identify the items over which each manager has control, the lines of authority should follow a
specified path. For example, in Exhibit 53 we show that a department supervisor may report to a
store manager, who reports to the vice president of operations, who reports to the president. The
president is ultimately responsible to stockholders or their elected representatives, the board of
directors. In a sense, the president is responsible for all revenue and expense items of the company,
since at the presidential level all items are controllable over some period. The president often carries
the title, Chief Executive Officer (CEO) and usually delegates authority to lower level managers since
one person cannot keep fully informed of the day-to-day operating details of all areas of the business.
The manager's level in the organization also affects those items over which that manager has
control. The president is usually considered a first-level manager. Managers (usually vice presidents)
who report directly to the president are second-level managers. Notice on the organization chart in
Exhibit 53 that individuals at a specific management level are on a horizontal line across the chart.
235

Not all managers at that level, however, necessarily have equal authority and responsibility. The
degree of a manager's authority varies from company to company.
While the president may delegate much decision-making power, some revenue and expense items
remain exclusively under the president's control. For example, in some companies, large capital
(plant and equipment) expenditures may be approved only by the president. Therefore, depreciation,
property taxes, and other related expenses should not be designated as a store manager's
responsibility since these costs are not primarily under that manager's control.
The controllability criterion is crucial to the content of performance reports for each manager. For
example, at the department supervisor level, perhaps only direct materials and direct labor cost
control are appropriate for measuring performance. A plant manager, however, has the authority to
make decisions regarding many other costs not controllable at the supervisory level, such as the
salaries of department supervisors. These other costs would be included in the performance
evaluation of the store manager, not the supervisor.
A broader perspective:Employee buyouts
Traditional organization lines of responsibility have workers reporting to supervisors
or department managers, who in turn report to higher managers, who report to even
higher managers, and so forth on up the organization. Top management is
accountable to stockholders.
What happens when those stockholders are also employees, as in the case of many
employee buyouts (such as The Chilcote Company –
http://www.chilcotecompany.com)? Now, employees report to managers who are
accountable back to the employees in their role as stockholders. Employees wear two
hats: They own the company and they work for the company. In some sense, this
makes each employee like a proprietor of a business. Presumably, after employees
buy their company, they have greater incentives to make the company successful.
Source: Based on the authors' research.
25.3 Responsibility reportsResponsibility accounting provides reports to different levels of management. The amount of
detail varies depending on the manager's level in the organization. A performance report to a
department manager of a retail store would include actual and budgeted dollar amounts of all
revenue and expense items under that supervisor's control. The report issued to the store manager
236

would show only totals from all the department supervisors' performance reports and any additional
items under the store manager's control, such as the store's administrative expenses. The report to
the company's president includes summary totals of all the stores' performance levels plus any
additional items under the president's control. In effect, the president's report should include all
revenue and expense items in summary form because the president is responsible for controlling the
profitability of the entire company.
Management by exception is the principle that upper level management does not need to
examine operating details at lower levels unless there appears to be a problem. As businesses become
increasingly complex, accountants have found it necessary to filter and condense accounting data so
that these data may be analyzed quickly. Most executives do not have time to study detailed
accounting reports and search for problem areas. Reporting only summary totals highlights any areas
needing attention and makes the most efficient use of the executive's time.
The condensation of data in successive levels of management reports is justified on the basis that
the appropriate manager will take the necessary corrective action. Thus, specific performance details
need not be reported to superiors.
For example, if sales personnel costs have been excessively high in a particular department, that
departmental manager should find and correct the cause of the problem. When the store manager
questions the unfavorable budget variance of the department, the departmental supervisor can
inform the store manager that corrective action was taken. Hence, it is not necessary to report to any
higher authority that a particular department within one of the stores is not operating satisfactorily
because the matter has already been resolved. Alternatively, if a manager's entire store has been
performing poorly, summary totals reported to the vice president of operations discloses this
situation, and an investigation of the store manager's problems may be indicated.
In preparing responsibility accounting reports, companies use two basic methods to handle
revenue or expense items. In the first approach, only those items over which a manager has direct
control are included in the responsibility report for that management level. Any revenue and expense
items that cannot be directly controlled are not included. The second approach is to include all
revenue and expense items that can be traced directly or allocated indirectly to a particular manager,
whether or not they are controllable. This second method represents a full-cost approach, which
means all costs of a given area are disclosed in a single report. When this approach is used, care must
be taken to separate controllable from noncontrollable items to differentiate those items for which a
manager can and should be held responsible.
For accounting reports to be of maximum benefit, they must be timely. That is, accountants
should prepare reports as soon as possible after the end of the performance measurement period.
237

Timely reporting allows prompt corrective action to be taken. When reports are delayed excessively,
they lose their effectiveness as control devices. For example, a report on the previous month's
operations that is not received until the end of the current month is virtually useless for analyzing
poor performance areas and taking corrective action.
Companies also should issue reports regularly so that managers can spot trends. Then,
appropriate management action can be initiated before major problems occur. Regular reporting
allows managers to rely on reports and become familiar with their contents.
Firms should make the format of their responsibility reports relatively simple and easy to read.
Confusing terminology should be avoided. Where appropriate, expressing results in physical units
may be more familiar and understandable to some managers. To assist management in quickly
spotting budget variances, companies can report both budgeted (expected) and actual amounts. A
budget variance is the difference between the budgeted and actual amounts of an item. Because
variances highlight problem areas (exceptions), they are helpful in applying the management-by-
exception principle. To help management evaluate performance to date, responsibility reports often
include both a current period and year-to-date analysis.
25.4 Responsibility reports—An illustrationExhibit 54 on the next page, shows how Macy's Corporation could relate its responsibility
accounting reports. Assume Macy's has four management levels—the president, vice president of
operations, store manager, and department manager. In Exhibit 54 on the next page, we show that a
responsibility report would be prepared for each management level.
Note in Exhibit 55, the detailed information included in the responsibility reports for each
manager. Only the individual manager's controllable expenses are contained in these reports. For
example, the store manager's report includes only totals from the Men's Clothing Department
manager's report. In turn, the report to the vice president includes only totals from the store
manager's report, and so on. Detailed data from the lower levels are summarized or condensed and
reported at the next higher level.
You can see that at each level, more and more costs become controllable. Also, the company
introduces controllable costs not included on lower level reports into the reports for levels 3, 2, and 1.
The only store cost not included at the store manager's level is the store manager's salary because it is
noncontrollable by that store manager. It is, however, controllable by the store manager's supervisor,
the vice president of operations.
Based on an analysis of these reports, the Men's Clothing Department manager probably would
take immediate action to see why supplies and overtime were significantly over budget this month.
238

The store manager may ask the department manager what the problems were and whether they are
now under control. The vice president may ask the same question of the store manager. The president
may ask each vice president why the budget was exceeded this month and what corrective action has
been taken.
Exhibit 54: Organization chart-Macy's corporation
239

25.5 Responsibility centersA segment is a fairly autonomous unit or division of a company defined according to function or
product line. Traditionally, owners have organized their companies along functional lines. The
segments or departments organized along functional lines perform a specified function such as
marketing, finance, purchasing, production, or shipping. Recently, large companies have tended to
organize segments according to product lines such as an electrical products division, shoe
department, or food division.
A responsibility center is a segment of an organization for which a particular executive is
responsible. There are three types of responsibility centers—expense (or cost) centers, profit centers,
and investment centers. In designing a responsibility accounting system, management must examine
the characteristics of each segment and the extent of the responsible manager's authority. Care must
be taken to ensure that the basis for evaluating the performance of an expense center, profit center, or
investment center matches the characteristics of the segment and the authority of the segment's
manager. The following sections of the chapter discuss the characteristics of each of these centers and
the appropriate bases for evaluating the performance of each type.
First LevelMacy's Corporation
PresidentAmount Over or
(Under) Budget
Controllable Expenses
This Month
Year to Date
This Month
Year to Date
President's office expense
$ 11,000 $ 55,000 $ 1,000 $ 2,000
Vice president of operations
128,720 700,000 6,000 8,000
Vice president of marketing
18,700 119,000 4,000 8,000
Vice president of finance
14,000 115,000 8,000 9,000
Vice presidents' salaries
29,000 145,000 -0- -0-
Total $ 201,420 $ 1,134,000 $ 19,000 $ 27,000Second Level
Macy's CorporationVice President of Operations
Amount Over or (Under) Budget
Controllable Expenses
This Month
Year to Date
This Month
Year to Date
240
Vice president's office expense
$ 2,840 $ 9,500 $ (500) $ (8,000)
Store manager 88,800 490,000 2,500 5,000
Purchasing 5,300 32,500 1,000 2,000
Receiving 4,700 33,000 3,000 9,000
Salaries of store managers and heads of purchasing and receiving
27,000 135,000 -0- -0-
Total (include in report for next higher level)
$ 128,720 $ 700,000 $ 6,000 $ 8,000
Fourth LevelMacy's Corporation
Manger, Men's Clothing DepartmentAmount Over or
(Under) Budget
Controllable Expenses
This Month
Year to Date
This Month
Year to Date
Inventory losses $ 2,000 $ 10,000 $ 100 $ 400Supplies 1,800 8,500 800 950Salaries 11,000 53,000 (100) 810Overtime 2,000 14,500 800 140Total (include in report for next higher level)
$ 16,800 $ 86,000 $ 1,600 $ 2,300
Exhibit 55: Responsibility reports for Macy's corporation
An expense center is a responsibility center incurring only expense items and producing no
direct revenue from the sale of goods or services. Examples of expense centers are service centers
(e.g. the maintenance department or accounting department) or intermediate production facilities
that produce parts for assembly into a finished product. Managers of expense centers are held
responsible only for specified expense items.
The appropriate goal of an expense center is the long-run minimization of expenses. Short-run
minimization of expenses may not be appropriate. For example, a production supervisor could
eliminate maintenance costs for a short time, but in the long run, total costs might be higher due to
more frequent machine breakdowns.
A profit center is a responsibility center having both revenues and expenses. Because segmental
earnings equal segmental revenues minus related expenses, the manager must be able to control both
of these categories. The manager must have the authority to control selling price, sales volume, and
all reported expense items. To properly evaluate performance, the manager must have authority over
all of these measured items. Controllable profits of a segment result from deducting the
expenses under a manager's control from revenues under that manager's control.
241

Closely related to the profit center concept is an investment center. An investment center is a
responsibility center having revenues, expenses, and an appropriate investment base. When a firm
evaluates an investment center, it looks at the rate of return it can earn on its investment base.
Accountants compute the return on investment (ROI), also called the rate of return, by dividing
segmental income by the appropriate investment base. For example, a segment that earns USD
500,000 on an investment base of USD 5,000,000 has an ROI of 10 per cent.
Determining the investment base to be used in the ROI calculation is a tricky matter. Normally,
the assets available for use by the division make up its investment base. But accountants disagree on
whether depreciable assets should be included in the ROI calculation at original cost, original cost
less accumulated depreciation, or current replacement cost. Original cost is the price paid to
acquire the assets. Original cost less accumulated depreciation is the book value of the assets—
the amount paid less total depreciation taken. Current replacement cost is the cost of replacing
the present assets with similar assets in the same condition as those now in use. A different rate of
return results from each of these measures. Therefore, management must select and agree on an
appropriate measure of investment base prior to making ROI calculations or interdivision
comparisons.
Even after the investment base is defined, problems may still remain because many segment
managers have limited control over some of the items included in the investment base of their
segment. For instance, top-level management often makes capital expenditure decisions for major
store assets rather than allowing the segment managers to do so. Therefore, the segment manager
may have little control over the store assets used by the segment. Another problem area may be the
company's centralized credit and collection department. The segment manager may have little or no
control over the amount of accounts receivable included as segment assets because the manager
cannot change the credit-granting or collection policies of the company.
Usually these problems are overcome when managers realize that if all segments are treated in the
same manner, the inclusion of noncontrollable items in the investment base may have negligible
effects. Then, comparisons of the ROI for all segments are based on a consistent treatment of items.
To avoid adverse reactions or decreased motivation, segment managers must agree to this treatment.
Companies prefer to evaluate segments as investment centers because the ROI criterion facilitates
performance comparisons between segments. Segments with more resources should produce more
profits than segments with fewer resources, so it is difficult to compare the performance of segments
of different sizes on the basis of profits alone. However, when ROI is a performance measure,
performance comparisons take into account the differences in the sizes of the segments. The segment
with the highest percentage ROI is presumably the most effective in using whatever resources it has.
242
Typical investment centers are large, autonomous segments of large companies. The centers are
often separated from one another by location, types of products, functions, and/or necessary
management skills. Segments such as these often seem to be separate companies to an outside
observer. But the investment center concept can be applied even in relatively small companies in
which the segment managers have control over the revenues, expenses, and assets of their segments.
25.6 Transfer pricesProfit centers and investment centers inside companies often exchange products with each other.
The Pontiac, Buick, and other divisions of General Motors buy and sell automobile parts from each
other, for example. No market exchange takes place, so the company sets transfer prices that
represent revenue to the selling division and costs to the buying division.
A transfer price is an artificial price used when goods or services are transferred from one
segment to another segment within the same company. Accountants record the transfer price as a
revenue of the producing segment and as a cost, or expense, of the receiving segment. Usually no cash
actually changes hands between the segments. Instead, the transfer price is an internal accounting
transaction.
Segments are generally evaluated based on some measure of profitability. The transfer price is
important because it affects the profitability of the buying and selling segments. The higher the
transfer price, the better for the seller. The lower the transfer price, the better for the buyer.
Ideally, a transfer price provides incentives for segment managers to make decisions not only in
their best interests but also in the interests of the entire company. For example, if the selling segment
can sell everything it produces for USD 100 per unit, the buying segment should pay the market price
of USD 100 per unit. A seller with excess capacity, however, should be willing to transfer a product to
the buying segment for any price at or above the differential cost of producing and transferring the
product to the buying segment (typically all variable costs).
In practice, companies mostly base transfer prices on (1) the market price of the product, (2) the
cost of the product, or (3) some amount negotiated by the buying and selling segment managers.
25.7 Use of segmental analysisSo far we have described only the fundamentals of responsibility accounting. In this section we
focus specifically on segmental analysis.
Decentralization is the dispersion of decision-making authority among individuals at lower
levels of the organization. In other words, the extent of decentralization refers to the degree of control
that segment managers have over the revenues, expenses, and assets of their segments. When a
segment manager has control over these elements, the investment center concept can be applied to
243
the segment. Thus, the more decentralized the decision making is in an organization, the more
applicable is the investment center concept to the segments of the company. The more centralized the
decision making is, the more likely responsibility centers are to be established as expense centers.
Some advantages of decentralized decision making are:
• Managing segments trains managers for high-level positions in the company. The added
authority and responsibility also represent job enlargement and often increase job satisfaction
and motivation.
• Top management can be more removed from day-to-day decision making at lower levels of
the company and can manage by exception. When top management is not involved with routine
problem solving, it can devote more time to long-range planning and to the company's most
significant problem areas.
• Decisions can be made at the point where problems arise. It is often difficult for top
managers to make appropriate decisions on a timely basis when they are not intimately involved
with the problem they are trying to solve.
• Since decentralization permits the use of the investment center concept, performance
evaluation criteria such as ROI and residual income (to be explained later) can be used.
25.8 Concepts used in segmental analysisTo understand segmental analysis, you need to know about the concepts of variable cost, fixed
cost, direct cost, indirect cost, net income of a segment, and contribution to indirect expenses. Next,
we describe each concept.
Costs may be either directly or indirectly related to a particular cost object. A cost object is a
segment, product, or other item for which costs may be accumulated. In other words, a cost is not
direct or indirect in and of itself. It is only direct or indirect in relation to a given cost object.
A direct cost (expense) is specifically traceable to a given cost object. An indirect cost
(expense) is not traceable to a given cost object but has been allocated to it. Accountants can
designate a particular cost (expense) as direct or indirect by reference to a given cost object. Thus, a
cost that is direct to one cost object may be indirect to another. For instance, the salary of a segment
manager may be a direct cost of a given manufacturing segment but an indirect cost of one of the
products manufactured by that segment. In this example, the segment and the product are two
distinct cost objects.
Because a direct cost is traceable to a cost object, the cost is likely to be eliminated if the cost
object is eliminated. For instance, if the plastics segment of a business closes down, the salary of the
244

manager of that segment probably is eliminated. Sometimes a direct cost would remain even if the
cost object were eliminated, but this is the exception rather than the rule.
An indirect cost is not traceable to a particular cost object; therefore, it only becomes an expense
of the cost object through an allocation process. For example, consider the depreciation expense on
the company headquarters building that is allocated to each segment of the company. The
depreciation expense is a direct cost for the company headquarters, but it is an indirect cost to each
segment. If a segment of the company is eliminated, the indirect cost for depreciation assigned to that
segment does not disappear; the cost is simply allocated among the remaining segments. In a given
situation, it may be possible to identify an indirect cost that would be eliminated if the cost object
were eliminated, but this would be the exception to the general rule.
Because the direct costs of a segment are clearly identified with that segment, these costs are often
controllable by the segment manager. In contrast, indirect costs become segment costs only through
allocation; therefore, most indirect costs are noncontrollable by the segment manager. Be careful,
however, not to equate direct costs with controllable costs. For example, the salary of a segment
manager may be direct to that segment and yet is noncontrollable by that manager because managers
cannot specify their own salaries.
When preparing internal reports on the performance of segments of a company, management
often finds it is important to classify expenses as fixed or variable and as direct or indirect to the
segment. These classifications may be more useful to management than the traditional classifications
of cost of goods sold, operating expenses, and nonoperating expenses that are used for external
reporting in the company's financial statements. As a result, many companies prepare an income
statement for internal use with the format shown in Exhibit 56(A).
A. All Expenses Allocated to SegmentsSegment A Segment B Total
Sales $ 2,500,000 $ 1,500,000 $ 4,000,000Less: Variable expenses (all of which are direct expenses)
700,000 650,000 1,350,000
Contribution margin $ 1,800,000 $ 850,000 $ 2,650,000Less: Direct fixed expenses 450,000 550,000 1,000,000Contribution to indirect expenses
$ 1,350,000 $ 300,000 $ 1,650,000
Less: Indirect fixed expenses
270,000 330,000 600,000
Net Income $ 1,080,000 $ (30,000) $ 1,050,000B. Indirect Expenses not allocated to Segments
245

Segment A Segment B Total
Sales $ 2,500,000 $ 1,500,000 $ 4,000,000
Less: Variable expenses 700,000 650,000 1,350,000
Contribution margin $ 1,800,000 $ 850,000 $ 2,650,000
Less: Direct fixed expenses
450,000 550,000 1,000,000
Contribution to indirect expenses
$ 1,350,000 $ 300,000 $ 1,650,000
Less: Indirect fixed expenses
600,000
Net income $ 1,050,000
Exhibit 56: Contribution margin format income Statement
This format is called the contribution margin format for an income statement (first
introduced in Chapter 22) because it shows the contribution margin. Contribution margin is
defined as sales revenue less variable expenses. Notice in Exhibit 56(A) that all variable expenses are
direct expenses of the segment. The second subtotal in the contribution margin format income
statement is the segment's contribution to indirect expenses. Contribution to indirect expenses
is defined as sales revenue less all direct expenses of the segment (both variable direct expenses and
fixed direct expenses). The final total in the income statement is segmental net income, defined as
segmental revenues less all expenses (direct expenses and allocated indirect expenses).
Earlier we stated that the performance of a profit center is evaluated on the basis of the segment's
profits. It is tempting to use segmental net income to make this evaluation since total net income is
used to evaluate the performance of the entire company. The problem with using segmental net
income to evaluate performance is that segmental net income includes certain indirect expenses that
have been allocated to the segment but are not directly related to it or its operations. Because
segmental contribution to indirect expenses includes only revenues and expenses directly related to
the segment, this amount is often more appropriate for evaluation purposes.
Given the facts in Exhibit 56(A), if management relied on segmental net income to judge
segmental performance, management might conclude that Segment B should be eliminated because
it shows a loss of USD 30,000. But this action would reduce overall company income by USD
300,000, as shown here:
Reduction in corporate revenues $ 1,500,000Reduction in corporate expenses: Variable expenses $ 650,000 Direct fixed expenses 550,000 1,200,000Reduction in corporate income $ 300,000
Notice that the elimination of Segment B would not eliminate the USD 330,000 of allocated fixed
costs. These costs would need to be allocated to Segment A if Segment B no longer existed.
246

To stress the importance of a segment's contribution to indirect expenses, many companies prefer
the contribution margin income statement format in Exhibit 56(B), over that in Exhibit 56(A). The
difference is that indirect fixed costs are not allocated to individual segments in Exhibit 56(B).
Indirect fixed expenses appear only in the total column for the computation of net income for the
entire company. The computation for each segment stops with the segment's contribution to indirect
expenses; this is the appropriate figure to use for evaluating the earnings performance of a segment.
Only for the company as a whole is net income (revenues minus all expenses) computed; this is, of
course, the appropriate figure to use for evaluating the company as a whole.
Arbitrary allocations of indirect fixed expenses As stated earlier, indirect fixed expenses,
such as depreciation on the corporate administration building or on the computer facility maintained
at company headquarters, can only be allocated to segments on some arbitrary basis. The two basic
guidelines for allocating indirect fixed expenses are by the benefit received and by the responsibility
for the incurrence of the expense.
Accountants can make an allocation on the basis of benefit received for certain indirect expenses.
For instance, assume the entire company used a corporate computer for a total of 10,000 hours. If it
used 4,000 hours, Segment K could be charged (allocated) with 40 per cent of the computer's
depreciation for the period because it received 40 per cent of the total benefits for the period.
For certain other indirect expenses, accountants base allocation on responsibility for incurrence.
For instance, assume that Segment M contracts with a magazine to run an advertisement benefiting
Segment M and various other segments of the company. Some companies would allocate the entire
cost of the advertisement to Segment M because it was responsible for incurring the advertising
expense.
To further illustrate the allocation of indirect expenses based on a measure of benefit or
responsibility for incurrence, assume that Daily Company operates two segments, X and Y. It
allocates the following indirect expenses to its two segments using the designated allocation bases:
Expense Allocation BaseAdministrative office building occupancy expense, $ 50,000
Net sales
Insurance expense, $ 35,000 Cost of segmental plant assets
General administrative expenses, $ 40,000 Number of employees
The following additional data are provided:
Segment X Segment Y TotalNet sales $ 400,000 $ 500,000 $ 900,000Segmental plant assets$ 250,000 $ 400,000 $ 650,000Number of employees 50 80 130
The following expense allocation schedule shows the allocation of indirect expenses:
Segment X Segment Y Total
247
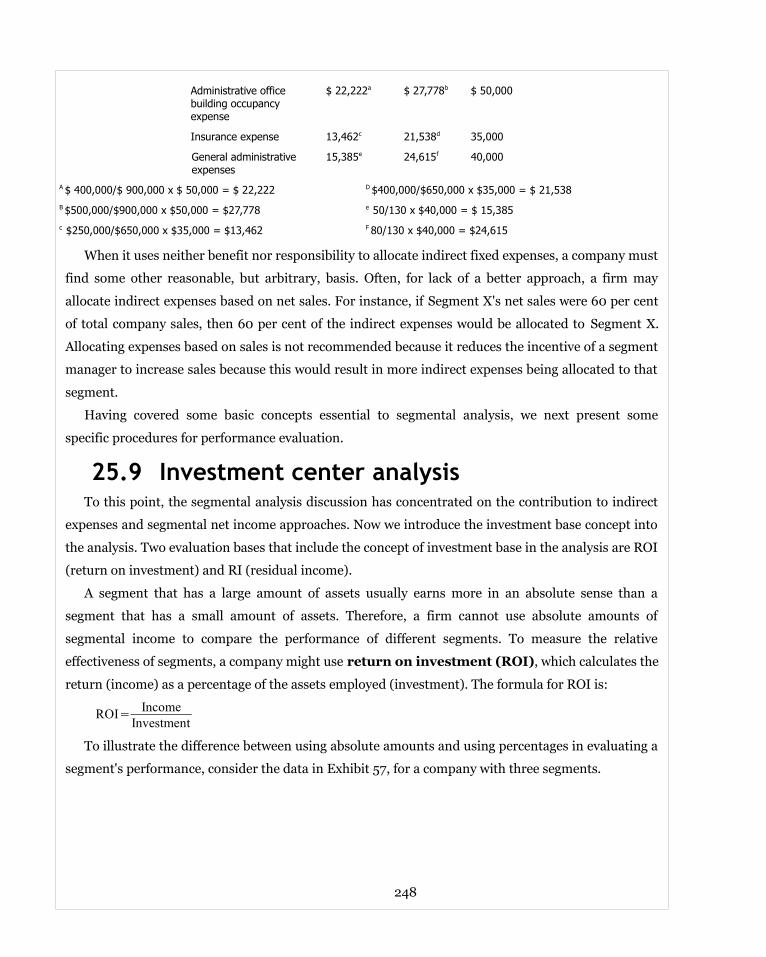
Administrative office building occupancy expense
$ 22,222a $ 27,778b $ 50,000
Insurance expense 13,462c 21,538d 35,000
General administrative expenses
15,385e 24,615f 40,000
A $ 400,000/$ 900,000 x $ 50,000 = $ 22,222 D $400,000/$650,000 x $35,000 = $ 21,538B $500,000/$900,000 x $50,000 = $27,778 e 50/130 x $40,000 = $ 15,385c $250,000/$650,000 x $35,000 = $13,462 F 80/130 x $40,000 = $24,615
When it uses neither benefit nor responsibility to allocate indirect fixed expenses, a company must
find some other reasonable, but arbitrary, basis. Often, for lack of a better approach, a firm may
allocate indirect expenses based on net sales. For instance, if Segment X's net sales were 60 per cent
of total company sales, then 60 per cent of the indirect expenses would be allocated to Segment X.
Allocating expenses based on sales is not recommended because it reduces the incentive of a segment
manager to increase sales because this would result in more indirect expenses being allocated to that
segment.
Having covered some basic concepts essential to segmental analysis, we next present some
specific procedures for performance evaluation.
25.9 Investment center analysisTo this point, the segmental analysis discussion has concentrated on the contribution to indirect
expenses and segmental net income approaches. Now we introduce the investment base concept into
the analysis. Two evaluation bases that include the concept of investment base in the analysis are ROI
(return on investment) and RI (residual income).
A segment that has a large amount of assets usually earns more in an absolute sense than a
segment that has a small amount of assets. Therefore, a firm cannot use absolute amounts of
segmental income to compare the performance of different segments. To measure the relative
effectiveness of segments, a company might use return on investment (ROI), which calculates the
return (income) as a percentage of the assets employed (investment). The formula for ROI is:
ROI= IncomeInvestment
To illustrate the difference between using absolute amounts and using percentages in evaluating a
segment's performance, consider the data in Exhibit 57, for a company with three segments.
248

Segment A Segment B Segment C Total(a) Income $ 250,000 $1,000,000 $ 500,000 $1,750,000(b) Investment 2,500,000 5,000,000 2,000,000 9,500,000Return on investment (a) ÷ (b)
10 per cent 20 per cent 25 per cent 18.42 per cent
Exhibit 57: Computation of return on investment (ROI)
When using absolute dollars of income to evaluate performance, Segment B appears to be doing
twice as well as Segment C. However, using ROI to evaluate the segments indicates that Segment C is
really performing the best (25 per cent), Segment B is next (20 per cent), and Segment A is
performing the worst (10 per cent). Therefore, ROI is a more useful indicator of the relative
performance of segments than absolute income.
Although ROI appears to be a quite simple and straightforward computation, there are several
alternative methods for making the calculation. These alternatives focus on what is meant by income
and investment. Exhibit 58, shows various definitions and applicable situations for each type of
computation.
Situation Definition of Income Definition of Investment1. Evaluation of the earning power of the company. Do not use for segments or segment managers due to inclusion of non controllable expenses.
Net income of the company.* Total assets of the company.†
2. Evaluation of rate of income contribution of segment. Do not use for segment managers due to inclusion of non controllable expenses.
Contribution to indirect expenses. Assets directly used by and identified with the segment.
3. Evaluation of income performance of segment manager.
Controllable income. Begin with contribution to indirect expenses and eliminate any revenues and direct expenses not under the control of the segment manager.
Assets under the control of the segment manager.
* Often net operating income is used; this term is defined as income before interest and taxes.† Operating assets are often used in the calculation. This definition excludes assets not used in normal operations.
Exhibit 58: Possible definitions of income and investment
As discussed earlier in the chapter, alternative valuation bases include cost less accumulated
depreciation, original cost, and current replacement cost. Each of the valuation bases has merits and
drawbacks, as we discuss next. First, cost less accumulated depreciation is probably the most widely
used valuation base and is easily determined. Because of the many types of depreciation methods,
comparisons between segments or companies may be difficult. Also, as book value decreases, a
constant income results in a steadily increasing ROI even though the segment's performance is
unchanged. Second, the use of original cost eliminates the problem of decreasing book value but has
its own drawback. The cost of old assets is much less than an investment in new assets, so a segment
with old assets can earn less than a segment with new assets and realize a higher ROI. Third, current
replacement cost is difficult to use because replacement cost figures often are not available, but this
249

base does eliminate some of the problems caused by the other two methods. Whichever valuation
basis is adopted, all ROI calculations that are to be used for comparative purposes should be made
consistently.
An accounting perspective:
Business insight
Although financial performance measures such as ROI are important for providing
incentives to perform well, so is the company's culture. For example, Johnson &
Johnson has a culture emphasizing high ethical standards. The Johnson & Johnson
Credo, published in its annual report and displayed throughout the company, is a
famous example of this culture. HP is known as a people-oriented company that
emphasizes personal development and long-term employment.
To encourage long-term growth, 3M requires that at least 25 per cent of each
division's sales come from new products. This encourages constant innovation and
new product development. In addition, the company allows employees to spend 15
per cent of their time on innovative projects, encourages sharing of technology
across divisions, and provides "seed" grants for employees to develop new products.
With this corporate culture, 3M has a worldwide reputation for innovation.
Expanded form of ROI computation The ROI formula breaks into two component parts:
ROI= IncomeSales
× SalesInvestment
The first part of the formula, Income/Sales, is called margin or return on sales. The margin refers
to the percentage relationship of income or profits to sales. This percentage shows the number of
cents of profit generated by each dollar of sales. The second part of the formula, Sales/Investment, is
called turnover. Turnover shows the number of dollars of sales generated by each dollar of
investment. Turnover measures how effectively each dollar of assets was used.
A manager can increase ROI in the following three ways. In Exhibit 59, note the possible outcomes
of some of these strategies to increase ROI.
• By concentrating on increasing the profit margin while holding turnover constant: Pursuing
this strategy means keeping selling prices constant and making every effort to increase efficiency
and thereby reduce expenses.
250

• By concentrating on increasing turnover by reducing the investment in assets while holding
income and sales constant: For example, working capital could be decreased, thereby reducing
the investment in assets.
251

Past year's return on investment:
ROI=Margin×Turnover
ROI=IncomeSales
×Sales
Investment
ROI=USD100,000
USD 2,000,000×
USD2,000,000USD1,000,000
ROI=5 per cent×2 time
ROI = 10 per cent
• Increase margin through reducing expenses by USD 40,000; no effect on sales or investment.
ROI=USD 140,000
USD 2,000,000×
USD 2,000,000USD 1,000,000
ROI=7 per cent×2 time
ROI = 14 per cent
• Increase turnover through reducing investment in assets by USD 200,000; no effect on sales or investment.
ROI=USD 100,000
USD 2,000,000×
USD 2,000,000USD 800,000
ROI=5 per cent×2.5time
ROI = 12.5 per cent
• (a) Increase margin and turnover by disposing of nonproductive depreciable assets; income increased by USD 10,000;
investment decreased by USD 200,000; no effect on sales.
ROI=USD 110,000
USD 2,000,000×
USD 2,000,000USD 800,000
ROI=5.5 per cent×2.5 time
ROI = 13.75 per cent
• (b) Increase margin and turnover through increased advertising; sales increased by USD 500,000 and income by USD
50,000; no effect on investment.
ROI=USD 150,000
USD 2,500,000×
USD 2,500,000USD 1,000,000
ROI=6 per cent×2.5time
ROI = 15 per cent
• (c) Increase turnover through increased advertising; sales increased by USD 500,000 and income by USD 12,500; no
effect on investment.
ROI = USD 112,500 X USD 2,500,000USD 2,500,000 USD 1,000,000
ROI = 4.5 % X 2.5 timesROI = 11.25%
Exhibit 59: Strategies for increasing return on investment (ROI)
252

• By taking actions that affect both margin and turnover: For example, disposing of
nonproductive depreciable assets would decrease investment while also increasing income
(through the reduction of depreciation expense). Thus, both margin and turnover would
increase. An advertising campaign would probably increase sales and income. Turnover would
increase, and margin might increase or decrease depending on the relative amounts of the
increases in income and sales.
25.10 Economic value added and residual incomeWhen a company uses ROI to evaluate performance, managers have incentives to focus on the
average returns from their segments' assets. However, the company's best interest is served if
managers also focus on the marginal returns.
To illustrate, assume the manager of Segment 3 in Exhibit 60, has an opportunity to take on a
project involving an investment of USD 100,000 that is estimated to return USD 22,000, or 22 per
cent, on the investment. Since the segment's ROI is currently 25 per cent, or USD 250,000/USD
1,000,000, the manager may decide to reject the project because accepting the project will cause the
segment's ROI to decline. Suppose however, from the company's point of view, all projects earning
greater than a 10 per cent return should be accepted, even if they are lower than a particular
segment's ROI.
Before acceptance of the project by Segment 3, the amounts are as follows:
Segment 1 Segment 2 Segment 3a. Income $ 100,000 $ 500,000 $ 250,000b. Investment 1,000,000 2,500,000 1,000,000c. Cost of capital 10% 10% 10%d. Desired minimum income $ 100,000 $ 250,000 $ 100,000e. Residual Income (RI) -0- 250,000 150,000
With acceptance of the project by Segment 3, the amounts would be as follows:
Segment 1
Segment 2
Segment 3
a. Income $ 100,000 $ 500,000 $ 272,000†b. Investment 1,000,000 2,500,000 1,100,000‡c. Cost of capital 10% 10% 10%d. Desired minimum income$ 100,000 $ 250,000 $ 110,000e. Residual Income (RI) -0- 250,000 162,000† $250,000 + (22% of $100,000).‡ $1,000,000 original investment + $100,000 new investment.
Exhibit 60: Computation of Residual Income (RI)
253

The rejection by a segment manager of a project that exceeds the 10 per cent desired minimum
return is an example of suboptimization. Suboptimization occurs when a segment manager takes
an action that is in the segment's best interest but is not in the best interest of the company as a
whole.
To deal with this type of suboptimization, many companies use the concept of economic value
added which computes the residual income of a business segment. Residual income (RI) is
defined as the amount of income a segment has in excess of the segment's investment base times its
cost of capital percentage. Each company based on debt costs establishes its cost of capital coverage
and desired returns to stockholders. The formula for residual income (RI) is:
RI=Income−Investment×Cost of capital percentage
When a company uses RI to evaluate performance, the segment rated as the best is the segment
with the greatest amount of RI rather than the one with the highest ROI.
Returning to our example, the project opportunity for Segment 3 could earn in excess of the
desired minimum ROI of 10 per cent. In fact, the project generates RI of USD 12,000, calculated as
(USD 22,000 - [10 per cent X USD 100,000]). If RI were applied as the basis for evaluating
segmental performance, the manager of Segment 3 would accept the project because doing so would
improve the segment's performance. That choice would also be beneficial to the entire company.
Critics of the RI method complain that larger segments are likely to have the highest RI. In a given
situation, it may be advisable to look at both ROI and RI in assessing performance or to scale RI for
size.
A manager tends to make choices that improve the segment's performance. The challenge is to
select evaluation bases for segments that result in managers making choices that benefit the entire
company. When performance is evaluated using RI, choices that improve a segment's performance
are more likely also to improve the entire company's performance.
When calculating RI for a segment, the income and investment definitions are contribution to
indirect expenses and assets directly used by and identified with the segment. When calculating RI
for a manager of a segment, the income and investment definitions should be income controllable by
the manager and assets under the control of the segment manager.
In evaluating the performance of a segment or a segment manager, comparisons should be made
with (1) the current budget, (2) other segments or managers within the company, (3) past
performance of that segment or manager, and (4) similar segments or managers in other companies.
Consideration must be given to factors such as general economic conditions and market conditions
for the product being produced. A superior segment in Company A may be considered superior
because it is earning a return of 12 per cent, which is above similar segments in other companies but
254

below other segments in Company A. However, segments in Company A may be more profitable
because of market conditions and the nature of the company's products rather than because of the
performance of the segment managers. Top management must use careful judgment whenever
performance is evaluated.
25.11 Segmental reporting in external financial statementsIn June 1997, the Financial Accounting Standards Board issued Statement of Financial
Accounting Standards No. 131, "Disclosures about Segments of an Enterprise and Related
Information". This statement requires publicly held companies to publish certain segmental
information in their annual and interim financial statements. It also requires that these companies
report certain information about their products and services, the geographic areas in which they
operate, and their major customers. Thus, external users of financial statements of a company can (1)
better understand the company's performance, (2) better assess the prospects for future net cash
flows, and (3) make more informed judgments about the company.
In this chapter you learned about responsibility accounting and segmental analysis. Chapter 26
discusses capital budgeting and long-term planning.
25.12 Understanding the learning objectives• Responsibility accounting refers to an accounting system that collects, summarizes, and
reports accounting data relating to the responsibilities of individual managers.
• Although the amount of detail varies, reports issued under a responsibility accounting system
are interrelated. Totals from the report on one level of management are carried forward in the
report to the management level immediately above.
• The contribution margin format for the income statement shows the contribution margin for
the company.
• Contribution to indirect expenses is defined as sales revenue less all direct expenses of the
segment.
• The final total in the income statement is segmental net income, defined as segmental
revenues less all expenses (direct expenses and allocated indirect expenses).
• Return on investment measures the relative effectiveness of segments. The formula for return
on investment is:
Return on investment= IncomeInvestment
• Alternatively, the formula for return on investment can be broken into two components:
255

Return on investment=IncomeSales
× SalesInvestment
• Margin refers to the percentage relationship of income or profits to sales. This percentage
shows the number of cents of profit generated by each dollar of sales. The formula for margin
can be expressed as:
Margin= IncomeSales
• Turnover shows the number of dollars of sales generated by each dollar of investment.
Turnover measures how effectively each dollar of assets was used. The formula for turnover can
be expressed as:
Turnover= SalesInvestment
• Residual income is defined as the amount of income a segment has in excess of its investment
base times its cost of capital percentage.
• Each company sets its cost of capital based on debt costs and desired returns to stockholders.
• The formula for residual income is:
RI=Income−Investment×Cost of capital percentage
• Two basic methods exist for allocating service department costs: (1) the direct method and
(2) the step method.
25.13 Appendix: Allocation of service department costsThroughout this text, we have emphasized cost allocations only in the operating departments of a
company. These operating departments perform the primary purpose of the company—to produce
goods and services for consumers. Examples of operating departments are the assembly departments
of manufacturing firms and the departments in hotels that take and confirm reservations.
The costs of service departments are allocated to the operating departments because they exist to
support the operating departments. Examples of service departments are maintenance,
administration, cafeterias, laundries, and receiving. Service departments aid multiple production
departments at the same time, and accountants must allocate and account for all of these costs. It is
crucial that these service department costs be allocated to the operating departments so that the costs
of conducting business in the operating departments are clearly and accurately reflected.
Accountants allocate service department costs using some type of base. When the companies'
managers choose bases to use, they consider such criteria as the types of services provided, the
benefits received, and the fairness of the allocation method. Examples of bases used to allocate
256

service department costs are number of employees, machine-hours, direct labor-hours, square
footage, and electricity usage.
Two basic methods exist for allocating service department costs. The first method, the direct
method, is the simplest of the two. The direct method allocates costs of each of the service
departments to each operating department based on each department's share of the allocation base.
Services used by other service departments are ignored. For example, if Service Department A uses
some of Service Department B's services, these services would be ignored in the cost allocation
process. Because these services are not allocated to other service departments, some accountants
believe the direct method is not accurate.
The second method of allocating service department costs is the step method. This method
allocates service costs to the operating departments and other service departments in a sequential
process. The sequence of allocation generally starts with the service department that has incurred the
greatest costs. After this department's costs have been allocated, the service department with the next
highest costs has its costs allocated, and so forth until the service department with the lowest costs
has had its costs allocated. Costs are not allocated back to a department that has already had all of its
costs allocated.
To illustrate the direct method and the step method, we use the following data:
Service Department Operating DepartmentsMaintenance Administration 1 2
Costs $ 8,000 $ 4,000 $ 32,000 $ 36,000Machine-hours used 1,000 2,000 1,500 2,500Number of employees 100 200 250 150
The costs of the maintenance department are allocated based on the machine-hours used. For the
administration department, the cost allocation is based on the number of employees.
Using the preceding data, an example of the direct method follows:
Service Departments Operating Departments
Maintenance Administration 1 2
Costs $ 8,000 $ 4,000 $ 32,000 $ 36,000
Allocation of maintenance department's costs*
(8,000) 3,000 5,000
$ -0-
Allocation of administration department's costs†
(4,000) 2,500 1,500
$ -0- $ 37,500 $ 42,500
* Department 1's 2,500/4,000.
fraction is 1,500/4,000; Department 2's fraction is
† Department 1's fraction is 250/400; Department 2's fraction is
257

150/400.
Using the same data, an example of the step method follows:
Service Departments Operating Departments
Maintenance Administration 1 2
Costs $ 8,000 $ 4,000 $ 32,000 $ 36,000
Allocation of maintenance department's costs*
(8,000) 2,667 2,000 3,333
$ -0-
Allocation of administration department's costs†
(6,667) 4,167 2,500
$ -0- $ 38,167 $ 41,833
* Administration 1's 1,500/6,000;
fraction isDepartment
2,000/6,000;2's fraction:
Department 2,500/6,000.
1's fraction:
† Department 1's 150/400.
fraction: 250/400; Department 2's fraction is
Note in the preceding examples that the maintenance department costs were not allocated to the
administration department under the direct method but were allocated under the step method. Also,
to eliminate the administration department's costs, under the step method those costs allocated to
the administration department from the maintenance department must be allocated to the operating
departments as part of the total administration department's cost.
25.14 Demonstration problemThe results of operations for Alan Company's two segments in 2009 follow:
Segment 1 Segment 2 TotalSales $ 90,000 $ 135,000 $ 225,000Variable expenses 63,000 81,000 144,000Fixed expenses: Direct 9,000 25,200 34,200 Indirect 12,600
The company has total operating assets of USD 315,000; USD 288,000 of these assets are
identified with particular segments as follows:
Segment 1 Segment 2Assets directly used by and identified with the segment
$ 108,000 $ 180,000
a. Prepare a statement showing the contribution margin, contribution to indirect expenses for
each segment, and the total income for Alan Company.
b. Determine the return on investment for each segment and then for the entire company.
c. Comment on the results of (a) and (b).
258

25.15 Solution to demonstration problema. Alan Company
Income statement showing segmental contribution to indirect expensesFor the year ended 2009 December 31
Segment 1 Segment 2 TotalSales $ 90,000 $ 135,000 $ 225,000Less: Variable expenses 63,000 81,000 144,000Contribution margin $ 27,000 $ 54,000 $ 81,000Less: Direct fixed expenses 9,000 25,2000 34,200Contribution to indirect expenses $ 18,000 $ 28,800 $ 46,800Less: Indirect fixed expenses 12,600Net income $ 34,200
b. 1. ROI= Contribution for indirect expensesAssetsdirectly used byalso identified with thesegment
Segment 1 Segment 2ROI = USD 18,000 =16.67% ROI = USD 28,800 = 16%
USD 108,000 USD 180,000
2. ROI= Netoperating incomeOperatingassets =
USD34,200USD315,000
=10.9 per cent
c. In part (a), Segment 2 showed a higher contribution to indirect expenses. But in (b), Segment 1
showed a higher return on investment. The difference between these calculations shows that when a
segment is evaluated as a profit center, the center with the highest investment base usually shows the
best results. But when the segment is evaluated as an investment center, the segment with the highest
investment base does not necessarily show the highest return. The computations in (b) also
demonstrate that the return on investment for the company as a whole will be lower than that of each
segment because of the increased investment base.
25.16 Key terms*Budget variance The difference between the budgeted and actual amounts of an item. Contribution margin Sales revenues less variable expenses. Contribution margin format An income statement format that shows the contribution margin (Sales - Variable expenses) for a segment. Contribution to indirect expenses Sales revenue less all direct expenses of the segment. Controllable profits of a segment Profit of a segment when expenses under a manager's control are deducted from revenues under that manager's control.Cost object A segment, product, or other item for which costs may be accumulated. Current replacement cost The cost of replacing the present assets with similar assets in the same condition as those now in use. Decentralization The dispersion of decision-making authority among individuals at lower levels of the organization. Direct cost (expense) A cost that is specifically traceable to a given cost object. Expense center A responsibility center incurring only expense items and producing no direct revenue from the sale of goods or services. Examples include the accounting department and the maintenance department.
259

Indirect cost (expense) A cost that is not traceable to a given cost object but has been allocated to it. Investment center A responsibility center having revenues, expenses, and an appropriate investment base. Management by exception The principle that upper level management does not need to examine operating details at lower levels unless there appears to be a problem (an exception). Margin (as used in ROI) The percentage relationship of income (or profits) to sales.
Margin= IncomeSales
Original cost The price paid to acquire an asset. Original cost less accumulated depreciation The book value of an asset—the amount paid less total depreciation taken. Profit center A responsibility center having both revenues and expenses. Residual income (RI), Economic Value Added The amount of income a segment has in excess of the investment base times the cost of capital percentage. Residual income is equal to Income - (Investment X Cost of capital percentage). Responsibility accounting Refers to an accounting system that collects, summarizes, and reports accounting data relating to the responsibility of the individual managers. A responsibility accounting system provides information to evaluate each manager on revenue and expense items over which that manager has primary control. Responsibility center A segment of an organization for which a particular executive is responsible. Return on investment (ROI) Calculates the return (income) as a percentage of the assets employed (investment).
Return on investment= IncomeInvestment Or
IncomeSales × Sales
InvestmentSegment A fairly autonomous unit or division of a company defined according to function or product line. Segmental net income The final total in the income statement; segmental revenues less all expenses (direct expenses and allocated indirect expenses). Suboptimization A situation when a segment manager takes an action in the segment's best interest but not in the best interest of the company as a whole. Transfer price An artificial price used when goods or services are transferred from one segment to another segment within the same company. Turnover (as used in ROI) The number of dollars of sales generated by each dollar of investment.
Turnover= SalesInvestment
*Some terms listed in earlier chapters are repeated here for your convenience.
25.17 Self-test 25.17.1 True-false
Indicate whether each of the following statements is true or false.
260

Items that a manager has direct control over are included in responsibility accounting reports for
that management level.
An appropriate goal of an expense center is the long-run minimization of expenses.
The salary of a segment manager would be considered a direct cost as well as an uncontrollable
cost to that segment.
Segmental net income is the most appropriate figure to use when evaluating the performance of a
segment.
When calculating RI for a segment, the income and investment definitions are income controlled
by a manager, and assets directly used by and identified with the segment.
25.17.2 Multiple-choiceSelect the best answer for each of the following questions.
The investment base used when determining the ROI calculation could be which of the following?
a. Current replacement cost.
b. Original cost.
c. Original cost less accumulated depreciation.
d. Any of the above.
Which of the following actions would increase ROI?
a. Reduce operating expenses with no effect on sales or assets.
b. Increase investment in assets, with no change in income.
c. Increase sales with no change in income or assets.
d. None of the above.
Calculate ROI using the expanded form (margin times turnover) from the following data:
Sales $1,000,000Investment 500,000Income 50,000
a. 20 per cent.
b. 10 per cent.
c. 15 per cent.
d. None of the above.
In evaluating the performance of a segment or manager, comparisons should be made with:
a. Other segments and managers within the company and in other companies.
b. Past performance of the segment manager.
c. The current budget.
d. All of the above.
261

Calculate the ROI and RI for each of the following segments and determine if a segment should be
dropped based on RI.
Segment 1
Segment 2 Segment 3
Income $ 180,000 $ 1,000,000 $ 500,000Investment 2,000,000 5,000,000 2,000,000ROI ? ? ?Desired minimum ROI (10%)
200,000 500,000 200,000
RI ? ? ?
a. 9 per cent, 20 per cent, 20 per cent
USD 0, USD 500,000, USD 200,000
Consider dropping Segment 1.
b. 20 per cent, 20 per cent, 20 per cent
USD 200,000, USD 500,000, USD 200,000
Do not drop any segment.
c. 9 per cent, 20 per cent, 25 per cent
USD (20,000), USD 500,000, USD 300,000
Consider dropping Segment 1.
d. 20 per cent, 20 per cent, 25 per cent
USD 200,000, USD 500,000, USD 300,000
Do not drop any segment.
Now turn to “Answers to self-test” at the back of the chapter to check your answers.
25.18 Questions➢ What is the fundamental principle of responsibility accounting?
➢ List five important factors that should be considered in designing reports for a
responsibility accounting system.
➢ How soon should accounting reports be prepared after the end of the performance
measurement period? Explain.
➢ Name and describe three types of responsibility centers.
➢ Describe a segment of a business enterprise that is best treated as an expense center.
List four indirect expenses that may be allocated to such an expense center.
➢ Compare and contrast an expense center and an investment center.
➢ What purpose is served by setting transfer prices?
➢ What is the advantage of using investment centers as a basis for performance
evaluation?
262

➢ Which categories of items must a segment manager have control over for the
investment center concept to be applicable?
➢ What is the connection between the extent of decentralization and the investment
center concept?
➢ Give some of the advantages of decentralization.
➢ Differentiate between a direct cost and an indirect cost of a segment. What happens to
these categories if the segment to which they are related is eliminated?
➢ Is it possible for a cost to be direct to one cost object and indirect to another cost
object? Explain.
➢ Describe some of the methods by which indirect expenses are allocated to a segment.
➢ Give the general formula for return on investment (ROI). What are its two
components?
➢ Give the three sets of definitions for income and investment that can be used in ROI
calculations, and explain when each set is applicable.
➢ Give the various valuation bases that can be used for plant assets in investment center
calculations. Discuss some of the advantages and disadvantages of these methods.
➢ In what way is the use of the residual income (RI) concept superior to the use of ROI?
➢ How is residual income (RI) determined?
➢ If the RI for segment manager A is USD 50,000 while the RI for segment manager B is
USD 100,000, does this necessarily mean that B is a better manager than A? Explain.
➢ Real world question Refer to the annual report of a publicly traded company.
Which of the company's geographic regions performed better? Explain.
➢ (Based on Appendix) Briefly discuss the two methods of allocating service department
costs.
25.19 ExercisesExercise A The following information refers to the inspection department of a chemical
packaging plant for September:
Over orAmount (Under) Budget
Supplies $ 54,000 $ (10,800)Repairs and maintenance 270,000 21,600Overtime paid to inspectors 108,000 10,800Salary of inspection department manager
32,400 (5,400)
Salary of plant manager 43,200 -0-Allocation of company accounting costs
32,400 10,800
Allocation of building depreciation to 21,600 (5,400)
263

the inspection department
Using this information, prepare a responsibility report for the manager of the inspection
department for September. Include those items for which you think the inspection department
manager would be held responsible.
Exercise B Present the following information for the Hardware Division of ABC Computer
Company,
Sales $ 1,400,000Variable selling and administrative expenses
100,000
Fixed direct manufacturing expenses 35,000Fixed indirect manufacturing expenses 56,000Variable manufacturing expenses 400,000Fixed direct selling and administrative expenses
175,000
Fixed indirect selling and administrative expenses
28,000
Exercise C Given the following data, prepare a schedule that shows contribution margin,
contribution to indirect expenses, and net income of the Sharks Division of Hockey, Inc.:
Direct fixed expenses $ 324,000
Indirect fixed expenses 259,200
Sales 2,100,000
Variable expenses 1,500,000
What would be the effect on the company income if the segment were eliminated?
Exercise D Three segments (A, B, and C) of Trump Enterprises have net sales of USD 300,000,
USD 150,000, and USD 50,000, respectively. A decision is made to allocate the pool of USD 25,000
of administrative overhead expenses of the home office to the segments, using net sales as the basis
for allocation.
a. How much of the USD 25,000 should be allocated to each segment?
b. If Segment C is eliminated, how much of the USD 25,000 will be allocated to A and B?
Exercise E Two segments (Mountain Bike and Road Bike) showed the following data for the
most recent year:
Mountain bike
Road bike
Contribution to indirect expenses $ 840,000 $ 504,000Assets directly used by and identified with the segment
2,520,000 2,184,000
Sales 3,360,000 6,720,000
a. Calculate return on investment for each segment in the most direct manner.
b. Calculate return on investment using the margin and turnover components.
Exercise F Calculate the new margin, turnover, and return on investment of the Mountain Bike
segment for each of the following changes. Consider each change independently of the others.
264
a. Direct variable expenses were reduced by USD 33,600. Sales and assets were unaffected.
b. Assets used by the segment were reduced by USD 540,000, while income and sales were
unaffected.
c. An advertising campaign increased sales by USD 336,000 and income by USD 50,000. Assets
directly used by the segment were unaffected.
Exercise G The following data are available for Segment A of ABC Company:
Net income of the segment $ 50,000Contribution to indirect expenses 40,000Controllable income by manager 48,000Assets directly used by the manager 360,000Assets under the control of the segment manager
240,000
Determine the return on investment for evaluating (a) the income performance of the manager of
Segment A and (b) the rate of income contribution of the segment.
Exercise H Travel Company has three segments: Air, Land, and Sea. Data concerning income
and investment follow:
Air Land SeaContribution to indirect expenses $ 43,200 $ 86,400 $ 115,200Assets directly used by and identified with the segment
288,000 576,000 1,296,000
Assuming that the cost of capital on investment is 12 per cent, calculate the residual income of
each of the segments. Do the results indicate that any of the segments should be eliminated?
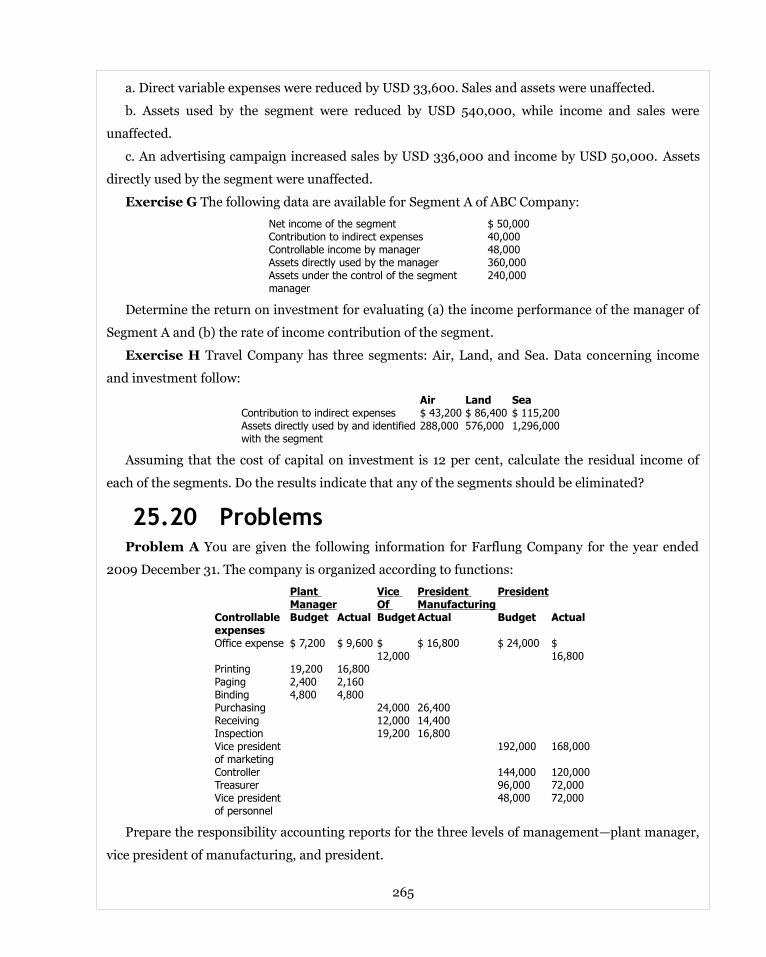
25.20 ProblemsProblem A You are given the following information for Farflung Company for the year ended
2009 December 31. The company is organized according to functions:
Plant Manager
Vice Of
President Manufacturing
President
Controllable expenses
Budget Actual Budget Actual Budget Actual
Office expense $ 7,200 $ 9,600 $ 12,000
$ 16,800 $ 24,000 $ 16,800
Printing 19,200 16,800Paging 2,400 2,160Binding 4,800 4,800Purchasing 24,000 26,400Receiving 12,000 14,400Inspection 19,200 16,800Vice president of marketing
192,000 168,000
Controller 144,000 120,000Treasurer 96,000 72,000Vice president of personnel
48,000 72,000
Prepare the responsibility accounting reports for the three levels of management—plant manager,
vice president of manufacturing, and president.
265

Problem B Joey Bauer Corporation has production plants in Sacramento, Dallas, and Seattle.
Following is a summary of the results for 2009:
Plant Revenues Expenses Investment base (gross assets)
Sacramento $ 450,000 $ 225,000 $ 4,500,000Dallas 450,000 180,000 3,375,000Seattle 675,000 247,500 7,200,000
a. If the plants are treated as profit centers, which plant manager appears to have done the best
job?
b. If the plants are treated as investment centers, which plant manager appears to have done the
best job? (Assume the plant managers are evaluated by return on investment on gross assets.)
c. Do the results of profit center analysis and investment center analysis give different findings? If
so, why?
Problem C Quinn Company allocates all of its home office expenses to its two segments, A and B.
Allocations are based on the following selected expense account balances and additional data:
Expenses (allocation bases)Home office building expense (net sales) $ 76,800Buying expense (net purchases) 67,200Uncollectible accounts (net sales) 8,000Depreciation of home office equipment (net sales) 21,120Advertising expense (indirect, allocated on basis of relative amounts of direct advertising)
86,400
Insurance expense (relative amounts of equipment plus average inventory in department)
23,040
Segment A Segment B Total
Purchases (net) $ 243,200 $ 76,800 $ 320,000
Sales (net) 512,000 128,000 640,000
Equipment (cost) 96,000 64,000 160,000
Advertising (cost) 25,600 12,800 38,400
Average inventory 160,000 64,000 224,000
a. Prepare a schedule showing the amounts of each type of expense allocable to Segments X and Y
using these data and bases of allocation.
b. Evaluate and criticize these allocation bases.
Problem D Allentown, Inc., is a company with two segments, X and Y. Its revenues and expenses
for 2009 follow:
Segment X Segment Y TotalNet sales $ 96,000 $ 144,000 $ 240,000Direct expenses:* Cost of goods sold 45,000 99,000 144,000 Selling 13,680 7,200 20,880 Administrative: Uncollectible accounts 3,000 1,800 4,800 Insurance 2,400 1,200 3,600
266

Interest 480 240 720Indirect expenses (all fixed): Selling 18,000 Administrative 25,200* All the direct expenses are variable except insurance and interest, which are fixed.
a. Prepare a schedule showing the contribution margin, the contribution to indirect expenses of
each segment, and net income for the company as a whole. Do not allocate indirect expenses to the
segments.
b. Assume that indirect selling expenses are to be allocated on the basis of net sales and that
indirect administrative expenses are to be allocated on the basis of direct administrative expenses.
Prepare a statement (starting with the contribution to indirect expenses) that shows the net income
of each segment.
c. Comment on the appropriateness of the income amounts shown in parts (a) and (b) for
determining the income contribution of the segments.
Problem E The following data pertain to the operating revenues and expenses for Golden State
Company for 2009:
Los Angeles (LA) Segment
San Francisco (SF) Segment
Total
Sales $ 180,000 $ 360,000 $ 540,000Variable expenses 96,000 240,000 336,000Direct fixed expenses 24,000 30,000 54,000Indirect fixed expenses 72,000
Regarding the company's total operating assets of USD 900,000, the following facts exist:
Los Angeles Segment
San FranciscoSegment
Assets directly used by and identified with the segment
$ 180,000 $ 360,000
a. Prepare a statement showing the contribution margin of each segment, the contribution to
indirect expenses of each segment, and the total income of Golden State Company.
b. Determine the return on investment for evaluating (1) the earning power of the entire company
and (2) the performance of each segment.
c. Comment on the results of part (b).
Problem F Shaq Company operates with three segments, Louisiana, Orlando, and LA. Data
regarding these segments follow:
Louisiana segment
Orlando segment
LA segment
Contribution to indirect expenses
$ 324,000 $ 180,000 $ 144,000
Assets directly used and 1,800,000 1,440,000 720,000
267
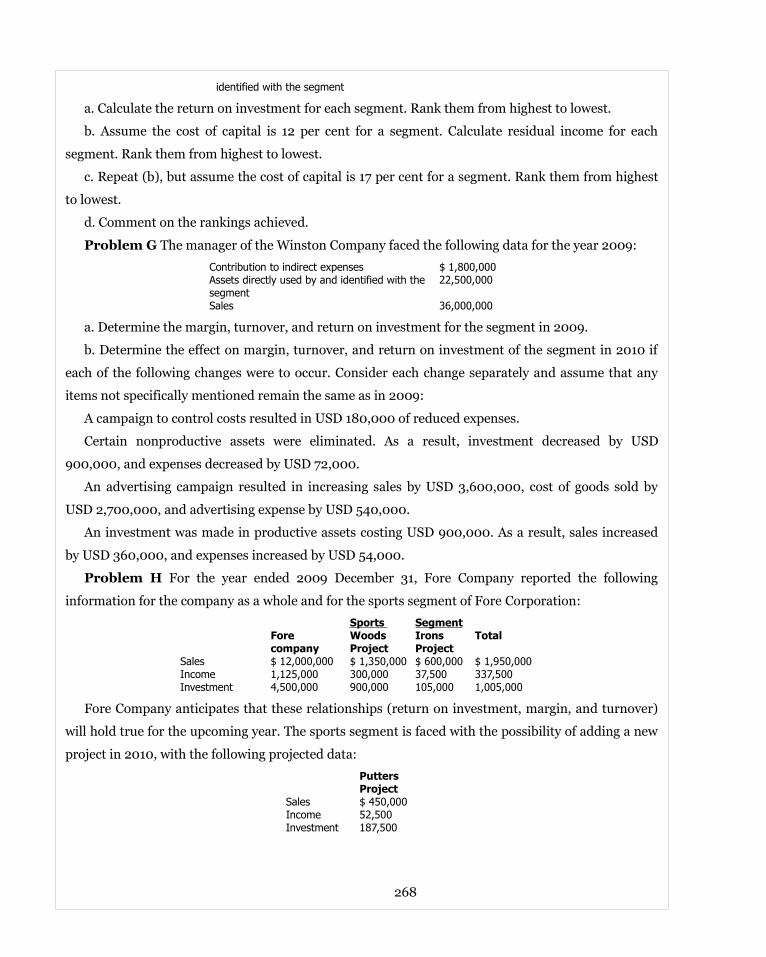
identified with the segment
a. Calculate the return on investment for each segment. Rank them from highest to lowest.
b. Assume the cost of capital is 12 per cent for a segment. Calculate residual income for each
segment. Rank them from highest to lowest.
c. Repeat (b), but assume the cost of capital is 17 per cent for a segment. Rank them from highest
to lowest.
d. Comment on the rankings achieved.
Problem G The manager of the Winston Company faced the following data for the year 2009:
Contribution to indirect expenses $ 1,800,000Assets directly used by and identified with the segment
22,500,000
Sales 36,000,000
a. Determine the margin, turnover, and return on investment for the segment in 2009.
b. Determine the effect on margin, turnover, and return on investment of the segment in 2010 if
each of the following changes were to occur. Consider each change separately and assume that any
items not specifically mentioned remain the same as in 2009:
A campaign to control costs resulted in USD 180,000 of reduced expenses.
Certain nonproductive assets were eliminated. As a result, investment decreased by USD
900,000, and expenses decreased by USD 72,000.
An advertising campaign resulted in increasing sales by USD 3,600,000, cost of goods sold by
USD 2,700,000, and advertising expense by USD 540,000.
An investment was made in productive assets costing USD 900,000. As a result, sales increased
by USD 360,000, and expenses increased by USD 54,000.
Problem H For the year ended 2009 December 31, Fore Company reported the following
information for the company as a whole and for the sports segment of Fore Corporation:
Sports SegmentFore company
Woods Project
IronsProject
Total
Sales $ 12,000,000 $ 1,350,000 $ 600,000 $ 1,950,000Income 1,125,000 300,000 37,500 337,500Investment 4,500,000 900,000 105,000 1,005,000
Fore Company anticipates that these relationships (return on investment, margin, and turnover)
will hold true for the upcoming year. The sports segment is faced with the possibility of adding a new
project in 2010, with the following projected data:
PuttersProject
Sales $ 450,000Income 52,500Investment 187,500
268

a. Determine the return on investment for Fore Company, for the sports segment, and for the
Woods and Irons projects separately for the year ended 2009 December 31.
b. Using this information, determine the effect of adding the Putters project on the sports
segment's return on investment. What problem may be encountered?
Using the data provided in the previous problem, determine the residual income (1) for all three
projects and (2) for the sports segment with and without the Putters project, if the cost of capital is 25
per cent. What is the effect on the sport segment's residual income if the Putter project is added?
How does this result compare with your answer to the previous problem?
25.21 Alternate problemsAlternate problem A Swiss Corporation has three production plants (X, Y, and Z). Following is
a summary of the results for January 2009:
InvestmentPlant Revenues Expenses Base
(gross assets)X $ 720,000 $ 300,000 $ 1,440,000Y 960,000 180,000 1,920,000Z 5,040,000 1,920,000 13,200,000
a. If the plants are treated as profit centers, which plant manager appears to have done the best
job?
b. If the plants are treated as investment centers, which plant manager appears to have done the
best job? (Assume the plant managers are evaluated by return on investment.)
c. Do the results of profit center analysis and investment center analysis give different findings? If
so, why?
Alternate problem B Easy Loans, Inc., allocates expenses and revenues to the two segments
that it operates. Easy Loans extends credit to customers under a revolving charge plan whereby all
account balances not paid within 30 days are charged interest at the rate of 11/2 per cent per month.
Following are selected revenue and expense accounts and some additional data needed to
complete the allocation of the one revenue amount and the expenses.
Revenue and Expenses (allocation bases)Revolving charge service revenue (net sales) $ 600,000Home office building occupancy expense (net sales) 45,000Buying expenses (net purchases) 150,000General administrative expenses (number of employees indepartment)
75,000
Insurance expense (relative average inventory plus costof equipment and fixtures in each department)
18,000
Depreciation expense on home office equipment (net sales)
30,000
High Risk Low Risk Total
269

Segment SegmentNumber of employees 3 7 10Net sales $ 300,000 $ 600,000 $ 900,000Net purchases 240,000 360,000 600,000Averaging inventory 60,000 120,000 180,000Cost of equipment fixtures 90,000 180,000 270,000
a. Prepare a schedule showing allocation of these items to the High and Low Risk segments.
b. Do you think these are good allocation bases? Why or why not?
Alternate problem C Student Painters, Inc., operates two segments, interior and exterior. The
revenue and expense data for 2009 follow:
Interior Exterior TotalNet sales $ 335,700 553,800 $ 889,500Direct expenses:* Cost of goods sold 186,000 282,000 468,000 Selling 31,800 27,000 58,800 Administrative 9,000 6,000 15,000 Uncollectible accounts 2,400 6,600 9,000Indirect expenses (all fixed): Selling 126,000 Administrative 156,000
*All the direct expenses are variable except administrative expense, which is fixed.
a. Prepare a schedule showing the contribution margin, the contribution to indirect expenses of
each segment, and net income for the company as a whole. Do not allocate indirect expenses to the
segments.
b. Assume that indirect selling expenses are to be allocated to segments on the basis of net sales
(round to the nearest per cent) and that indirect administrative expenses are to be allocated on the
basis of direct administrative expenses. Prepare a statement (starting with the contribution to
indirect expenses) which shows the net income of each segment.
c. Comment on the appropriateness of the income amounts shown in parts (a) and (b) for
determining the income contribution of the segments.
Alternate problem D Elliott Corporation has three segments. Following are the results of
operations for 2009:
Segment A Segment B Segment C TotalSales $36,000,000 $ 21,600,000 $ 14,400,000 $ 72,000,000Variable expenses 25,920,000 12,240,000 9,720,000 47,880,000Fixed expenses: Direct 5,040,000 1,800,000 720,000 7,560,000 Indirect 3,600,000
For the company's total operating assets of USD 100,800,000, the following facts exist:
270

Segment A Segment B Segment CAssets directly used by and identified with the segment
$ 50,400,000 $ 28,800,000 $ 14,400,000
a. Prepare a statement (in thousands of dollars) showing the contribution margin, the
contribution to indirect expenses for each segment, and the total income of the Elliott Corporation.
b. Determine the return on investment for evaluating (1) the performance of the entire company
and (2) performance of each segment.
c. Comment on the results of part (a).
Alternative problem E Goodwin Company has three segments, 1,2, and 3. Data regarding these
segments follow:
Segment 1 Segment 2Segment 3Contribution to indirect expenses
$ 432,000 $ 208,800 $ 72,000
Assets directly used by and identifiedwith the segment
3,600,000 1,440,000 360,000
a. Calculate the return on investment for each segment. Rank them from highest to lowest.
b. Assume the cost of capital is 10 per cent for a segment. Calculate the residual income for each
segment. Rank them from highest to lowest.
c. Repeat (b), but assume the desired cost of capital is 14 per cent. Rank the segments from highest
to lowest.
d. Comment on the rankings achieved.
25.22 Beyond the numbers—Critical thinkingBusiness decision case A Texas Company manufactures skateboards. Because the company's
business is seasonal, between August and December skilled manufacturing employees are laid off. To
improve morale, the financial vice president suggested that 10 employees not be laid off in the future.
Instead, she suggested that they work in general labor from August to December but still be paid their
manufacturing wages of USD 10 per hour. General labor personnel earn USD 6.60 per hour. What are
the implications of this plan for the assignment of costs to the various segments of the business?
Business decision case B Piero Company builds new homes. Sarah Richards is in charge of the
construction department. Among other responsibilities, Sarah hires and supervises the carpenters
and other workers who build the homes. Piero Company does not do its own foundation work. The
construction of foundations is done by subcontractors hired by Leslie Larue of the procurement
department.
To start the development of a 500-home community, Larue hired Dire Company to build the
foundations for the homes. On the day construction was to begin, Dire Company went out of
271

business. Consequently, construction was delayed six weeks while Larue hired a new subcontractor.
Which department should be charged with the cost of the delay in construction? Why?
Business decision case C Ken Silva is the supervisor of Department 103 of Laguna Company.
The annual budget for Silva's department is as follows:
Annual budget for Department 103Small tools $ 6,750Set up 7,500Direct labor 8,250Direct materials 15,000Supplies 3,750Supervision 22,500Property taxes 3,750Property insurance 750Depreciation, machinery 1,500Depreciation, building 1,500Total $ 71,250
Silva's salary of USD 15,000 is included in supervision. The remaining USD 7,500 in supervision
is the salary of the assistant supervisor directly responsible to Silva. Identify the budget items that
Silva controls.
Broader perspective – Writing experience D Refer to "A broader perspective: Employee
buyouts". Write a brief report explaining the effects of employee buyouts on employee motivation.
Group project E Macrofast Software, Inc., faces stiff competition in selling its products.
Macrofast's top management feels considerable pressure from the company's stockholders to
increase earnings.
Mac Washington, the vice president of marketing at the company's Production Software Division,
received a memorandum from top management that said, in effect, "Increase your division's earnings
or look for a new job".
Washington could think of only one way to increase earnings by the end of the year. The
Production Software Division had several installations that should be completed early the following
year, probably in February or March. For each of those jobs, he asked the customers to sign a
Completed Installation document stating the job was completed to the customer's satisfaction. He did
this because Macrofast's accounting department would record the revenue from the job when it
received the Completed Installation document.
Several customers signed Completed Installation documents even though the jobs were not
complete because Washington gave them a personally signed letter stating the Completion
Installation document was not legally binding.
The scheme initially worked. Revenues were prematurely recorded for these jobs, sales and
earnings for the year were up, Macrofast's top management was delighted with the results, and
272

Washington was rewarded with a large bonus and a promotion to a vice presidency at corporate
headquarters.
The following June, a staff accountant discovered the scheme when a customer called to complain
that he was being billed for a job that was not yet completed. When the accountant produced the
customer's Completed Installation document, the customer produced Washington's letter saying the
document was not binding. The accountant did some detective work and unearthed the scheme.
When she presented the results to her supervisor, the supervisor said, "This practice is unfortunate
and is against company policy. But what is done is done. Do not worry about last year's financial
statements. Just be sure it does not happen again."
a. In teams of four, discuss what the staff accountant should do.
b. Then, decide how your solution would change if all jobs had been completed to the customers'
satisfaction.
c. As a team, write a memorandum to your instructor describing your solutions. The heading of
the memo should contain the date, to whom it is written, from whom, and the subject matter.
Group project F Bleak Prospects, Inc., found that its market share was slipping. Division
managers were encouraged to maximize ROI and made decisions consistent with that goal.
Nonetheless, there were frequent customer complaints, with resulting loss of business. Moreover,
Bleak depended on an established product line and was unable to find new products for expansion
while its competitors seemed to be able to generate new products almost yearly. What would you
suggest Bleak Prospects' management do to improve the situation? In groups of two or three
students, write a memorandum to your instructor addressing this question. The heading of the
memorandum should contain the date, to whom it is written, from whom, and the subject matter.
Group project G Management of Division A is evaluated based on residual income measures.
The division can either rent or buy a certain asset. Will the performance evaluation technique have an
impact on the rent-or-buy decision? Why or why not? In groups or three students, write a
memorandum to your instructor addressing this question. The heading of the memorandum should
contain the date, to whom it is written, from whom, and the subject matter.
25.23 Using the Internet—A view of the real worldVisit the website for PepsiCo, Incorporated.
http://www.pepsico.com
Go to the company's most recent annual report. Compare the performance of PepsiCo's three
business segments: (1) beverages, (2) snack foods, and (3) restaurants. (You will find business
273
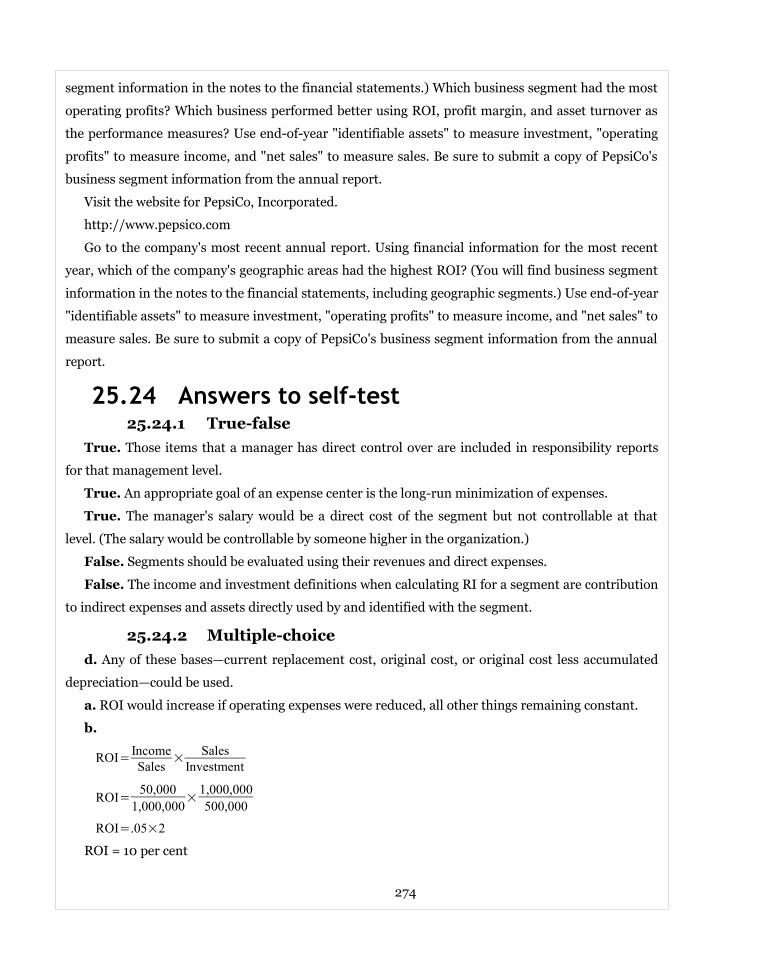
segment information in the notes to the financial statements.) Which business segment had the most
operating profits? Which business performed better using ROI, profit margin, and asset turnover as
the performance measures? Use end-of-year "identifiable assets" to measure investment, "operating
profits" to measure income, and "net sales" to measure sales. Be sure to submit a copy of PepsiCo's
business segment information from the annual report.
Visit the website for PepsiCo, Incorporated.
http://www.pepsico.com
Go to the company's most recent annual report. Using financial information for the most recent
year, which of the company's geographic areas had the highest ROI? (You will find business segment
information in the notes to the financial statements, including geographic segments.) Use end-of-year
"identifiable assets" to measure investment, "operating profits" to measure income, and "net sales" to
measure sales. Be sure to submit a copy of PepsiCo's business segment information from the annual
report.
25.24 Answers to self-test 25.24.1 True-false
True. Those items that a manager has direct control over are included in responsibility reports
for that management level.
True. An appropriate goal of an expense center is the long-run minimization of expenses.
True. The manager's salary would be a direct cost of the segment but not controllable at that
level. (The salary would be controllable by someone higher in the organization.)
False. Segments should be evaluated using their revenues and direct expenses.
False. The income and investment definitions when calculating RI for a segment are contribution
to indirect expenses and assets directly used by and identified with the segment.
25.24.2 Multiple-choiced. Any of these bases—current replacement cost, original cost, or original cost less accumulated
depreciation—could be used.
a. ROI would increase if operating expenses were reduced, all other things remaining constant.
b.
ROI= IncomeSales
× SalesInvestment
ROI= 50,0001,000,000
× 1,000,000500,000
ROI=.05×2
ROI = 10 per cent
274

d. All of these should be used to evaluate managerial performance.
c.Segment 1 Segment 2 Segment 3
Income $ 180,000 $ 1,000,000 $ 500,000Investment 2,000,000 5,000,000 2,000,000ROI 9% 20% 25%Desired minimumROI (10%) 200,000 500,000 200,000RI $ (20,000) $ 500,000 $ 300,000
Consider dropping Segment 1.
275