Embed Size (px)
Citation preview
Accountants Professional Liability Scorecards and Commentary
Mark Cheffers, Audit Analytics, CEO
Robert Kueppers, Deloitte LLP, Senior Partner, Global Regulatory & Public Policy
September 19-20, 2013
ALI CLE - Accountants’ Liability Conference

IVES Group Inc. phone: (508) 476-7007 e-mail: [email protected]
Liability Exposure• Managing Current Case Exposures
– Large Settlements– Historical and Current Cases– Madoff/Ponzi Cases– Credit Crisis/Subprime Cases– Other Federal Class Actions– Financial Restatements– Going Concerns
2

IVES Group Inc. phone: (508) 476-7007 e-mail: [email protected]
Expanding Theories of Auditor Liability• Auditor as……
– Global Firm Guarantor (vicarious liability)– Guarantor in Client Bankruptcy (Trustee
cases)– Third Party Investee Investigator– Predictor of Future Business Failure (going
concern)– Fidelity Bond/Fraud Guarantor– Aider and Abetter in Fraud– Arbiter of the Complexity of Standards
3

IVES Group Inc. phone: (508) 476-7007 e-mail: [email protected] 4
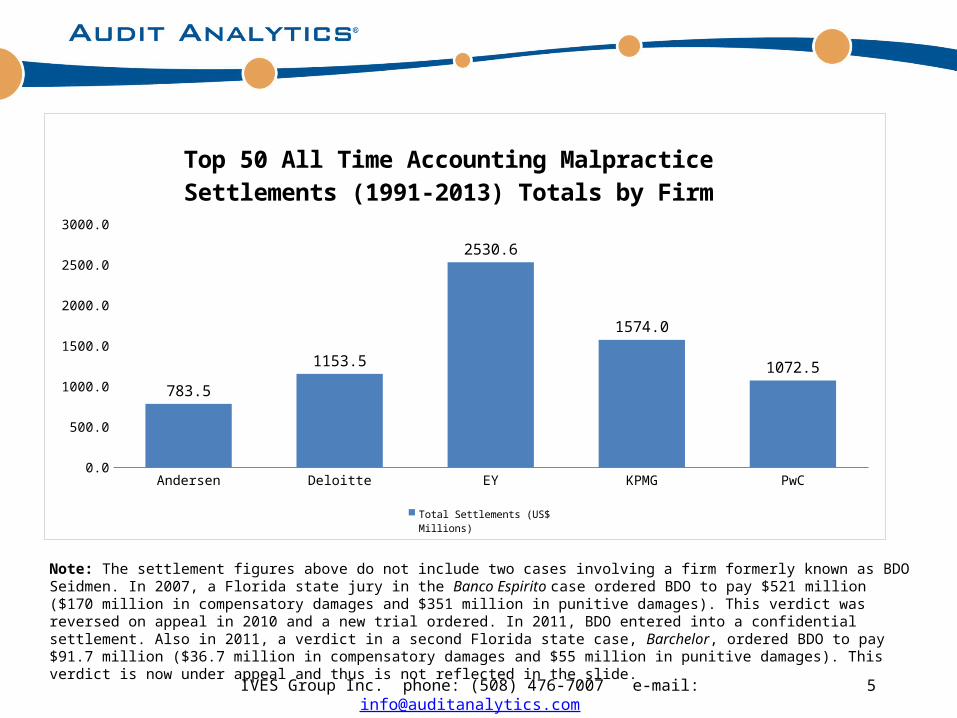
Note: The settlement figures above do not include two cases involving a firm formerly known as BDO Seidmen. In 2007, a Florida state jury in the Banco Espirito case ordered BDO to pay $521 million ($170 million in compensatory damages and $351 million in punitive damages). This verdict was reversed on appeal in 2010 and a new trial ordered. In 2011, BDO entered into a confidential settlement. Also in 2011, a verdict in a second Florida state case, Barchelor, ordered BDO to pay $91.7 million ($36.7 million in compensatory damages and $55 million in punitive damages). This verdict is now under appeal and thus is not reflected in the slide.
19921993
19941995
19961997
19981999
20002001
20022003
20042005
20062007
20082009
20102011
20122013
0
200
400
600
800
1000
1200
495
82
418
11865
193245
628
0
204 217 200
328
1135
393
955
448 422
068
186 200
Top 50 All Time Accounting Malpractice Settlements (1991-2013)Totals by Year
Total Settlements (US$ Millions)
IVES Group Inc. phone: (508) 476-7007 e-mail: [email protected]
Andersen Deloitte EY KPMG PwC0.0
500.0
1000.0
1500.0
2000.0
2500.0
3000.0
783.5
1153.5
2530.6
1574.0
1072.5
Top 50 All Time Accounting Malpractice Settlements (1991-2013) Totals by Firm
Total Settlements (US$ Millions)
5
Note: The settlement figures above do not include two cases involving a firm formerly known as BDO Seidmen. In 2007, a Florida state jury in the Banco Espirito case ordered BDO to pay $521 million ($170 million in compensatory damages and $351 million in punitive damages). This verdict was reversed on appeal in 2010 and a new trial ordered. In 2011, BDO entered into a confidential settlement. Also in 2011, a verdict in a second Florida state case, Barchelor, ordered BDO to pay $91.7 million ($36.7 million in compensatory damages and $55 million in punitive damages). This verdict is now under appeal and thus is not reflected in the slide.

IVES Group Inc. phone: (508) 476-7007 e-mail: [email protected] 6
Top 50 Accounting Malpractice Settlements as of August 2013(in US $ Millions)
Note: The settlement figures above do not include two cases involving a firm formerly known as BDO Seidman. In 2007, a Florida state jury in the Banco Espirito case ordered BDO to pay $521 million ($170 million in compensatory damages and $351 million in punitive damages). This verdict was reversed on appeal in 2010 and a new trial ordered. In 2011, BDO entered into a confidential settlement. Also in 2011, a verdict in a second Florida state case, Barchelor, ordered BDO to pay $91.7 million ($36.7 million in compensatory damages and $55 million in punitive damages). This verdict is now under appeal and thus is not reflected in the slide.
$3,470.9$3,643.2 Public
Non-Public
$2,966.0
$4,148.1Government
Non-Government

IVES Group Inc. phone: (508) 476-7007 e-mail: [email protected]
Notable Exposures - From 2006: Current Status
- Fannie Mae ($76.5M KPMG)
- Delphi Corp ($38.3M DT)
- American Int’l Group ($97.5M PwC)
- Tenet Health Care ($65M KPMG)
- REFCO ($25M GT)
- Dell Co ($0.0M PwC)
- Computer Assoc. ($0.0M KPMG & EY)
- UnitedHealth Group ($0.0M DT)
- AOL Time Warner ($100M EY)
- Parmalat ($157.5 DT & 6.5M GT)
- Tyco International ($225M PwC)
- HealthSouth ($142.5M EY)
- Freddie Mac ($0.0M PwC)
- Royal Dutch Shell ($0.0M KPMG & PwC)
- Dynegy ($1.05M Arthur Andersen)
- PNC Financial ($9.08M EY)
- Sprint ($0.0M EY)
- Nortel Networks (DT $0.0M ± in Ontario)
- Doral Financial ($0.0M PwC)
7
Note: A strike-though indicates that the case was settled. The parenthetical provides auditor settlement amount in millions. Since this slide noted “Exposure,” a settlement value of $0.0 is used even if the auditor was never named in an action.

IVES Group Inc. phone: (508) 476-7007 e-mail: [email protected]
Notable Exposures - 2010 (excl. 2006 list)- E.S. Bankest/Banco Espirito
- Satyam (PwC portion $25.5M)
- Madoff (J. Griesa: feeder fund auditor $0.0)
- New Century Financial (KPMG $44.8M)
- Moody’s (Class Cert. denied; PwC not named)
- UBS (EY not named; 10/26/12 dismissal appealed)
- Royal Bank of Scotland (DT not named)
- Goldman Sachs (PwC not named)
- Blackstone Grp (Remanded, but DT not named)
- Wachovia (KPMG $37M)
- Merrill Lynch (Settled; No DT contribution)
- Citigroup (KPMG dropped in consolidated complaint)
- Bear Stearns (DT $19.9M)
- Bank of America (PwC exposed)
- Wells Fargo (KPMG not named)
- Washington Mutual (D&T $18.5M)
- Sallie Mae (PwC not named)
- Royal Bank of Canada
- Societe Generale (EY and DT)
- State Street Corp (EY motion to dismiss denied)
- Oppenheimer Funds (no auditor named)
- Lehman Brothers (E&Y partial win)
8
Note: a strike-though indicates that the case was settled or otherwise closed.

IVES Group Inc. phone: (508) 476-7007 e-mail: [email protected] 9
Federal Securities Class Action Litigation SummaryBig 4 Auditors
Note: The year displayed represents the year the action was filed with the court. The counts include all cases where an auditor was named as a defendant even if the case was subsequently consolidated. The list of Open Cases refers to the auditor, so if the auditor is terminated as a defendant, the case is listed as closed even if the case is ongoing for other defendants.
Public Accounting Firm
Number of Claims Filed
2000 2001 2002 2003 2004 2005 2006 2007 2008 2009 2010 2011 2012
Deloitte LLP 10 6 9 12 4 4 2 7 10 0 0 2 1
Ernst & Young LLP 8 6 12 16 8 4 20 1 9 14 2 5 1
KPMG LLP 9 4 15 3 8 7 8 4 7 8 4 1 2
PricewaterhouseCoopers LLP 15 5 10 8 15 10 5 5 5 22 2 2 1
Big Four Total 42 21 46 39 35 25 35 17 31 44 8 10 5
Open Cases 0 0 0 0 0 0 0 1 6 7 1 5 4

IVES Group Inc. phone: (508) 476-7007 e-mail: [email protected] 10
Top 14 Securities Class Action Defense Law Firms Representing Audit Firms(by number of cases from 2000 to August 2013)
Notes: 1) Some cases may involve more than one Big 4 defendant. A total of 279 law firms represented audit firms from 2000 to August 2013. For a complete list contact Audit Analytics.2) This list does not include Heller Ehrman LLP, which dissolved.
Defense Law Firm Cases
Mayer Brown LLP 39
Latham & Watkins LLP 32
Sidley Austin LLP 25
Gibson Dunn & Crutcher LLP 24
Davis Polk & Wardwell 23
Kirkland & Ellis LLP 19
King & Spalding LLP 17
Hughes Hubbard & Reed LLP 16
Hogan Lovells US LLP 13
Orrick Herrington & Sutcliffe LLP 13
Cravath Swaine & Moore LLP 12
Willkie Farr & Gallagher LLP 12
Bingham McCutchen LLP 11
WilmerHale LLP 11
IVES Group Inc. phone: (508) 476-7007 e-mail: [email protected]
First Stock Option Backdating Litigation:Symbol Technologies
• Securities class action filed in New York Eastern District Court on 3/5/02
• In related 6/3/04 Accounting & Auditing Enforcement Release No. 2029, the SEC charged an executive, in part, as follows:
“manipulated stock option exercise dates to enable select senior executives, including himself, to profit unfairly at the company's expense. Rather than use the actual exercise date as defined by the option plans, Goldner instituted, without board approval or public disclosure, a practice of using a more advantageous date chosen from a 30-day "look-back" period so as to reduce the cost of the exercise to the executive. To create the false appearance that these exercises occurred on the selected dates, Goldner had his staff backdate transactional documents and use the phony exercise dates in the forms on which the executives reported their acquisitions to the Commission and the public.”
11

IVES Group Inc. phone: (508) 476-7007 e-mail: [email protected]
Stock Option Backdating Cases: An Overview(Federal Court Cases)
- Total Stock Option Backdating Cases: 181 (consolidated from 206 cases)
- Specifically Asserting Backdating: 158
- Cases Resulting in a Financial Restatement Addressing Backdating and/or Deferred Stock-Based Issues: 23
- Subset of the 181 Cases Filed by the SEC: 32 (16 naming only individuals)
- Subset of the 181 Cases Filed as Derivative Actions: 74
- Subset of Cases Naming Auditor as Defendant: 13
- Law Firms Representing Defendant Auditors: 15
12

IVES Group Inc. phone: (508) 476-7007 e-mail: [email protected] 13
Stock Option BackdatingFederal Court Cases Where Auditors were Named as a Defendant
# Cases Filed: 181# Auditors Presently Named: 4 (13 cases)
Accounting Firm Cases
Arthur Andersen LLP 1
Deloitte & Touche LLP 0
Ernst & Young LLP 3
KPMG LLP 6
PricewaterhouseCoopers LLP 4

IVES Group Inc. phone: (508) 476-7007 e-mail: [email protected] 14
Stock Option Backdating CasesTop Accounting Firm Settlements
CaseTotal
SettlementAuditor’s
SettlementAuditor
In Re Louis Grasso v. Vitesse Semiconductor Securities Litigation
$43,274,322 $30,250,000 KPMG LLP
Peregrine Systems Inc. Securities Litigation $56,292,922 $30,000,000 Arthur Andersen LLP
In Re Symbol Technologies Inc. Securities Litigation
$126,000,000 $24,000,000 Deloitte & Touche LLP
In Re Sonam Bakshi v. Henry Samueli et al. $173,500,000 $13,000,000 Ernst & Young LLP
Notes:1) The cases above concerned multiple assertions and the portion of the settlement attributable to the stock option backdating conduct is unknown. The settlements by audit firms for other stock option backdating cases were less than $1,000,000.2) The Arthur Andersen case was filed on May 6, 2002 in the California Southern District Court and was identified as a stock option backdating case by using the Audit Analytics Restatement database3) The prior slide indicates that D&T was not named as a defendant in a stock option backdating case. In an apparent contradiction, D&T is listed above with a settlement. D&T paid the settlement after filing a motion to voluntarily intervene in a stock option backdating case for the limited purpose of objecting to the proposed settlement and thus listed above because of D&T’s connection to the matter as an intervenor, not as a defendant.

IVES Group Inc. phone: (508) 476-7007 e-mail: [email protected] 15
Stock Option Backdating CasesLaw Firms that Represented Defendant Audit Firms
Note: In some cases, auditors were represented by more than one law firm. Although listed above, Howery LLP dissolved effective March 15, 2011.
# Cases Filed: 181# Auditors Named: 4 (13 cases)
Defendant Law Firm Cases
Bingham McCutchen LLP 3
Davis Polk & Wardwell 3
Latham & Watkins LLP 3
Gibson Dunn & Crutcher LLP 2
Howrey LLP 2
Morrison & Foerster LLP 2
Sidley Austin LLP 2
Alschuler Grossman Stein & Kahan LLP 1
Butz Dunn Desantis & Bingham 1
Foley Hoag LLP 1
Heller Ehrman LLP 1
Hill Ward & Henderson PA 1
Powell Goldstein LLP 1
SEC Law Firm 1
Stradling Yocca Carlson & Rauth PC 1

IVES Group Inc. phone: (508) 476-7007 e-mail: [email protected]
The Total Foreign Indefinitely Reinvested Earnings (IRE) Balances Held by the Russell 3000 Increased by 70.3% Over the 5 Years from 2008 to 2012.
16
Growth in Foreign Indefinitely Reinvested Earnings (IRE) Balances
Year
# of Firmswith an
AccumulatedIRE Balance
Total ForeignIndefinitelyReinvestedEarnings(Billions)
Total AssetsFor Firms
with an IRE Balance(Billions)
Total IREAs a % of
Total Assets
2012 1056 $1,943 $23,791 8.17%
2011 1051 $1,684 $22,137 7.61%
2010 972 $1,410 $21,052 6.70%
2009 930 $1,473 $19,211 7.67%
2008 948 $1,141 $19,390 5.88%
Source: Foreign Indefinitely Reinvested Earnings: Balances Held by the Russell 3000: A 5-Year Snapshot, published May 2013 by Audit Analytics.

IVES Group Inc. phone: (508) 476-7007 e-mail: [email protected] 17
Company TickerPeriodEndedDate
EffectiveIncome
Tax Rate
ForeignIRE
(Millions)
Form Type
Total Assets
(Millions)
General Electric Co. GE 12/31/2012 14.00% $108,000 10-K $685,328
Pfizer Inc. PFE 12/31/2012 21.00% $73,000 10-K $185,798
Microsoft Corp. MSFT 6/30/2012 24.00% $60,800 10-K $121,271
Merck & Co. Inc. MRK 12/31/2012 28.00% $53,400 10-K $106,132
Johnson & Johnson JNJ 12/30/2012 24.00% $49,000 10-K $121,347
International Business Machines Corp. IBM 12/31/2012 24.00% $44,400 10-K $119,213
Exxon Mobil Corp. XOM 12/31/2012 44.00% $43,000 10-K $333,795
Citigroup Inc. C 12/31/2012 0.00% $42,600 10-K $1,864,660
Cisco Systems, Inc. CSCO 7/28/2012 21.00% $41,300 10-K $91,759
Apple Inc. AAPL 9/29/2012 25.00% $40,400 10-K $176,064
Abbott Laboratories ABT 12/31/2012 5.00% $40,000 10-K $67,235
Procter & Gamble Co. PG 6/30/2012 27.00% $39,000 10-K $132,244
Hewlett Packard Co. HPQ 10/31/2012 6.00% $33,400 10-K $108,768
Google Inc. GOOG 12/31/2012 19.00% $33,300 10-K $93,798
PepsiCo Inc. PEP 12/29/2012 25.00% $32,200 10-K $74,638
Coca-Cola Co. KO 12/31/2012 23.00% $26,900 10-K $86,174
Chevron Corp. CVX 12/31/2012 43.00% $26,527 10-K $232,982
JPMorgan Chase & Co. JPM 12/31/2012 26.00% $25,100 10-K $2,359,141
Amgen Inc. AMGN 12/31/2012 13.00% $22,200 10-K $54,298
United Technologies Corp. UTX 12/31/2012 25.00% $22,000 10-K $89,409
Top 20 Companies with Foreign Indefinitely Reinvested Earnings (IRE)
Source: Foreign Indefinitely Reinvested Earnings: Balances Held by the Russell 3000: A 5-Year Snapshot, published May 2013 by Audit Analytics.

IVES Group Inc. phone: (508) 476-7007 e-mail: [email protected]
2001 2002 2003 2004 2005 2006 2007 2008 2009 2010 2011 2012
584 641737
852
1389
1550
1091
827
668
765 742 713620
692
794
931
1539
1771
1213
922
715803 820
768
Total Restatements by YearUnique filers Restatements
Quality of Financial Reporting – During the Last Four Years, the Quantity of Total Restatements Appears to have Leveled Off.
18
Source: 2012 Financial Restatements; A Twelve Year Comparison published March 2013 by Audit Analytics.
2012 Restatements
•713 Unique Filers
•768 Restatements

IVES Group Inc. phone: (508) 476-7007 e-mail: [email protected]
2003 2004 2005 2006 2007 2008 2009 2010 2011 2012
209
304
510
453
283
219
153 158202
245
434465
692
865
622
468
397
459
396 386
Restating Registrant by Accelerated Filer StatusUS Accelerated filers US Non-accelerated filers
The Quantity of Restatements from U.S. Accelerated Filers has Increased for the Third Straight Year.
19
Restatement Count From 2009 to 2012
• U.S Accelerated Filers Increased from 153 to 245
• U.S Non-Accelerated Filers Decreased from 397 to 386
Source: 2012 Financial Restatements; A Twelve Year Comparison published March 2013 by Audit Analytics.
IVES Group Inc. phone: (508) 476-7007 e-mail: [email protected]
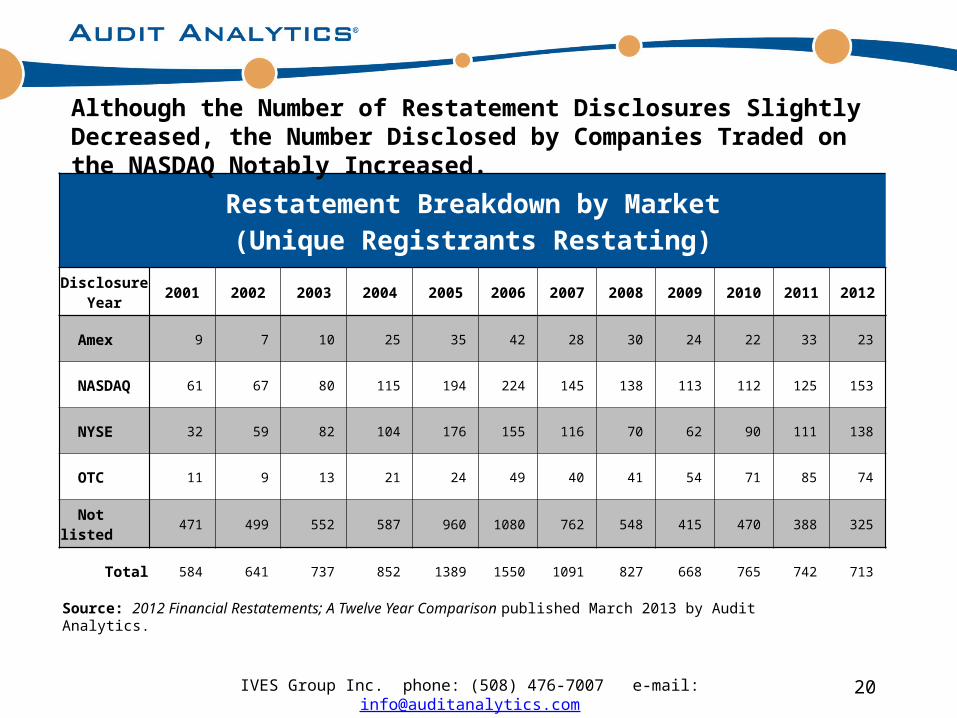
Restatement Breakdown by Market(Unique Registrants Restating)
Disclosure Year 2001 2002 2003 2004 2005 2006 2007 2008 2009 2010 2011 2012
Amex 9 7 10 25 35 42 28 30 24 22 33 23
NASDAQ 61 67 80 115 194 224 145 138 113 112 125 153
NYSE 32 59 82 104 176 155 116 70 62 90 111 138
OTC 11 9 13 21 24 49 40 41 54 71 85 74
Not listed 471 499 552 587 960 1080 762 548 415 470 388 325
Total 584 641 737 852 1389 1550 1091 827 668 765 742 713
20
Source: 2012 Financial Restatements; A Twelve Year Comparison published March 2013 by Audit Analytics.
Although the Number of Restatement Disclosures Slightly Decreased, the Number Disclosed by Companies Traded on the NASDAQ Notably Increased.

IVES Group Inc. phone: (508) 476-7007 e-mail: [email protected]
2002 2003 2004 2005 2006 2007 2008 2009 2010 2011 2012$0
$1,000
$2,000
$3,000
$4,000
$5,000
$6,000
$7,000
$4,513
$3,465
$6,335
$5,193
$2,377
$341
$671
$357
$717
$1,557
$459
Largest Negative Restatements(U.S. $ in Millions)
Largest Negative Restatements
Restatement Analysis Largest Negative Restatement by Year
21
Source: 2012 Financial Restatements; A Twelve Year Comparison published March 2013 by Audit Analytics.

IVES Group Inc. phone: (508) 476-7007 e-mail: [email protected]
Largest Negative Restatements by Year
DisclosureYear Company Market Impact on Net Income
(U.S. Dollars)
2002 Tyco International Ltd. NYSE -4,512,700,000
2003 Healthsouth Corp. NYSE -3,465,294,000
2004 Federal National Mortgage Association (Fannie Mae) NYSE -6,335,000,000
2005 American International Group Inc. NYSE -5,193,000,000
2006 Navistar International Corp. NYSE -2,377,000,000
2007 General Electric Co. NYSE -341,000,000
2008 TMST, Inc. NYSE -670,730,000
2009 UBS AG NYSE -357,210,000
2010 Telecom Italia S.p.A NYSE -716,971,200
2011 China Unicom (Hong Kong) Ltd. NYSE -1,556,743,500
2012 JPMorgan Chase NYSE -459,000,000
22
Source: 2012 Financial Restatements; A Twelve Year Comparison published March 2013 by Audit Analytics.
The Highest Negative Restatement for 2012 Represents the Third Lowest Negative Restatement During the Last Eleven Years.
IVES Group Inc. phone: (508) 476-7007 e-mail: [email protected]
($25,000,000)
($20,000,000)
($15,000,000)
($10,000,000)
($5,000,000)
$0
2005 2006 2007 2008 2009 2010 2011 2012
($21,331,433)
($17,807,709)
($3,640,142)
($6,125,967)($4,624,605)
($5,934,222)
($12,941,142)
($5,831,183)
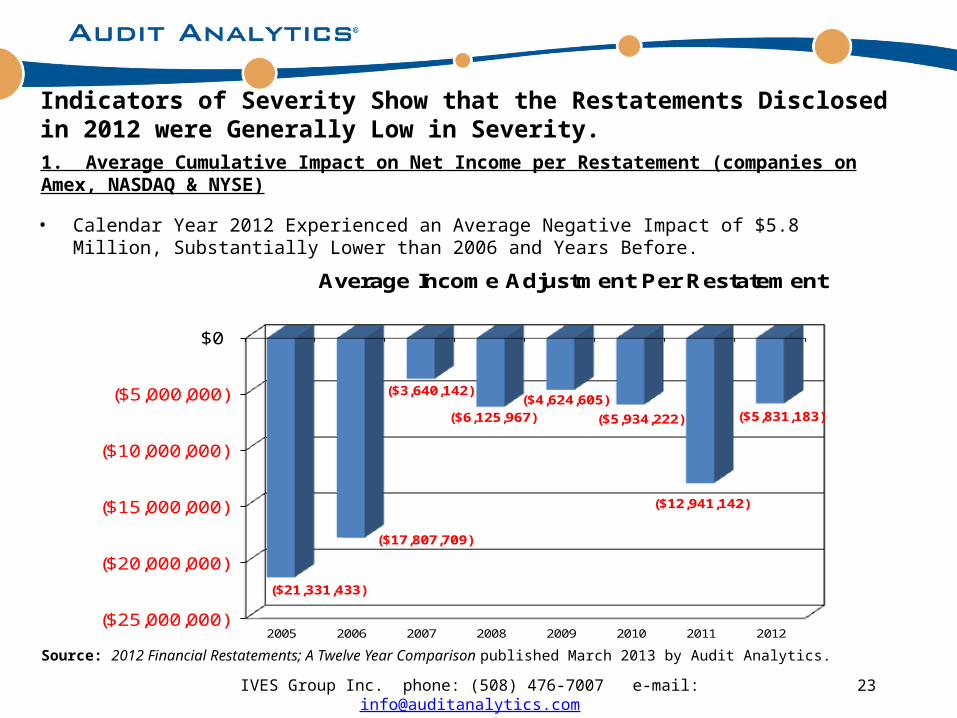
Average Income Adjustment Per Restatement
Indicators of Severity Show that the Restatements Disclosed in 2012 were Generally Low in Severity.1. Average Cumulative Impact on Net Income per Restatement (companies on Amex, NASDAQ & NYSE)
23
• Calendar Year 2012 Experienced an Average Negative Impact of $5.8 Million, Substantially Lower than 2006 and Years Before.
Source: 2012 Financial Restatements; A Twelve Year Comparison published March 2013 by Audit Analytics.

IVES Group Inc. phone: (508) 476-7007 e-mail: [email protected] 24
2. No Impact on Income (Companies Presently on Amex, NASDAQ & NYSE)
Source: 2012 Financial Restatements; A Twelve Year Comparison published March 2013 by Audit Analytics.
• In 2012, a Total of 157 out of 335 Restatements (46.87%) had No Impact on the Income Statement.
Indicators of Severity Show that the Restatements Disclosed in 2012 were Generally Low in Severity (continued).
IVES Group Inc. phone: (508) 476-7007 e-mail: [email protected]
2001 2002 2003 2004 2005 2006 2007 2008 2009 2010 2011 2012
462
551597
633
749 725
644
511 503 519 508 534
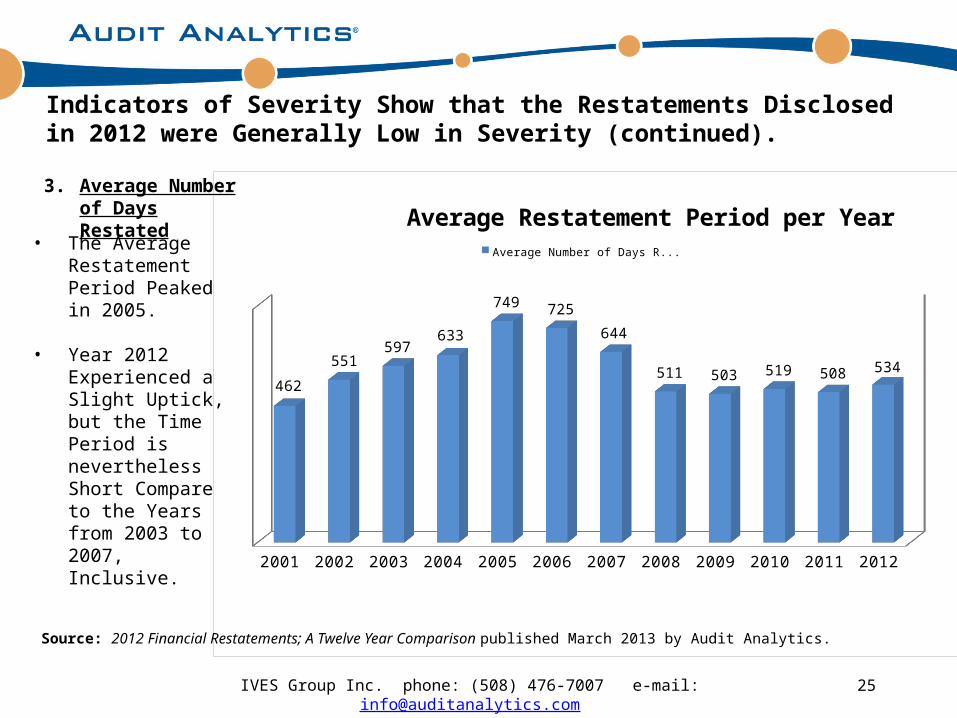
Average Restatement Period per YearAverage Number of Days Restated
Indicators of Severity Show that the Restatements Disclosed in 2012 were Generally Low in Severity (continued).
25
Source: 2012 Financial Restatements; A Twelve Year Comparison published March 2013 by Audit Analytics.
• The Average Restatement Period Peaked in 2005.
• Year 2012 Experienced a Slight Uptick, but the Time Period is nevertheless Short Compare to the Years from 2003 to 2007, Inclusive.
3. Average Number of Days Restated

IVES Group Inc. phone: (508) 476-7007 e-mail: [email protected]
2001 2002 2003 2004 2005 2006 2007 2008 2009 2010 2011 2012
2.002.12 2.18 2.20
2.44
2.011.89
1.661.54 1.52 1.48 1.38
Average Issues per RestatementAverage Number of Issues per Restatement
Indicators of Severity Show that the Restatements Disclosed in 2012 were Generally Low in Severity (continued).
26
Source: 2012 Financial Restatements; A Twelve Year Comparison published March 2013 by Audit Analytics.
• A Taxonomy of Over50 Issues Monitored and Graded
• In 2012, the Average Number of Issues Implicated in a Restatement was only 1.38 Financial Accounting Issues, the lowest during the 12 years under review.
4. Average Number of Issues per Restatement
IVES Group Inc. phone: (508) 476-7007 e-mail: [email protected]
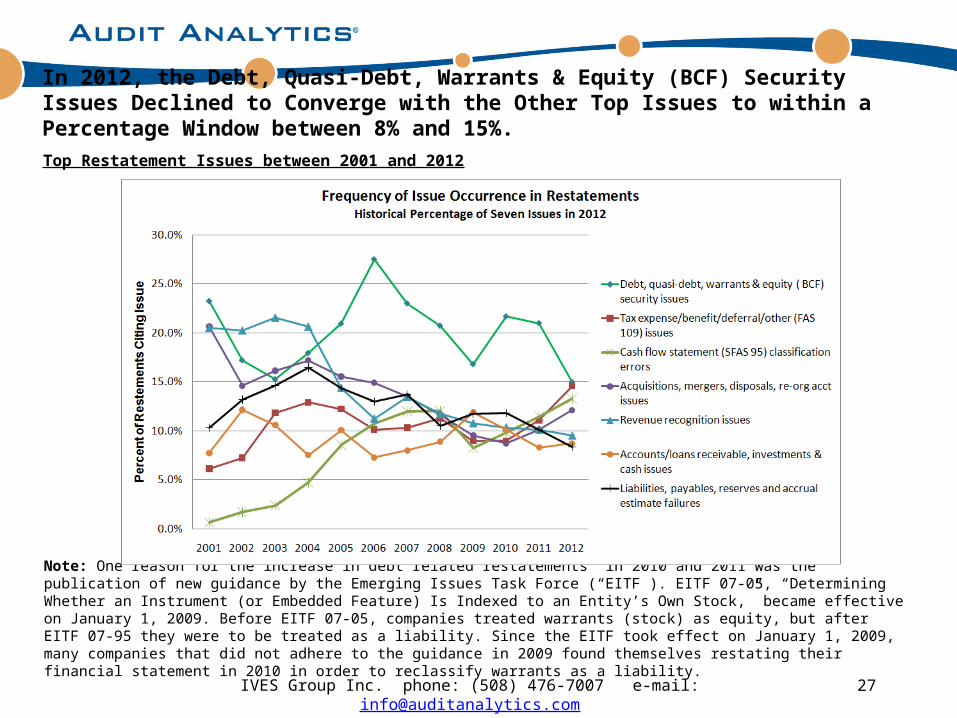
In 2012, the Debt, Quasi-Debt, Warrants & Equity (BCF) Security Issues Declined to Converge with the Other Top Issues to within a Percentage Window between 8% and 15%.Top Restatement Issues between 2001 and 2012
27
Note: One reason for the increase in debt related restatements in 2010 and 2011 was the publication of new guidance by the Emerging Issues Task Force (“EITF”). EITF 07-05, “Determining Whether an Instrument (or Embedded Feature) Is Indexed to an Entity’s Own Stock,” became effective on January 1, 2009. Before EITF 07-05, companies treated warrants (stock) as equity, but after EITF 07-95 they were to be treated as a liability. Since the EITF took effect on January 1, 2009, many companies that did not adhere to the guidance in 2009 found themselves restating their financial statement in 2010 in order to reclassify warrants as a liability.

IVES Group Inc. phone: (508) 476-7007 e-mail: [email protected]
2005 2006 2007 2008 2009 2010 2011 2012
32.80%
42.15% 41.52%
50.18% 48.10%53.65%
57.30%64.69%
Revision RestatementsPercentage Revision
Revision Restatements
The percentage of restatements that were Revision Restatements, restatements revealed in a periodic report without a prior disclosure in Item 4.02 of an 8-K, has trended higher since thedisclosure requirement first came into effect in August of 2004 and reached the value of 64.69% in 2012.
28
Source: 2012 Financial Restatements; A Twelve Year Comparison published March 2013 by Audit Analytics.
Note: A registrant is required, within four business days, to disclose in an 8-K, Item 4.02 when it is determined that a past financial statement should no longer be relied upon.

IVES Group Inc. phone: (508) 476-7007 e-mail: [email protected]
Reissuance Restatements
Although the number of restatements disclosed by U.S. Accelerated Filers increased for the third straight year (see Slide 19), a focus on Reissuance Restatements shows that the number of Reissuance Restatements did not experience the same increase.
29
2005 2006 2007 2008 2009 2010 2011 2012
433
371
217
138
8462 79 65
Reissuance RestatementsDisclosed by U.S. Accelerated Filers
Restatements with a Form 8-K, Item 4.02
Note: A registrant is required, within four business days, to disclose in an 8-K, Item 4.02 when it is determined that a past financial statement should no longer be relied upon.
Source: 2012 Financial Restatements; A Twelve Year Comparison published March 2013 by Audit Analytics.

IVES Group Inc. phone: (508) 476-7007 e-mail: [email protected]
Going Concerns(Percentage of Auditor Opinions Qualified with a Going Concern Assumption)
30
Source: Going Concern Review published September 2013 by Audit Analytics.
Note: The value for 2012 is estimated, based on audit opinions filed with the SEC on or before July 8, 2013 (about 98.5% of the opinions expected and 93.2% of the GCs expected).
2000 2001 2002 2003 2004 2005 2006 2007 2008 2009 2010 2011 2012*0.0%
5.0%
10.0%
15.0%
20.0%
25.0%
14.1%15.9% 16.4%
14.4% 15.2%16.2%
17.4%
19.9%21.1%
19.9%19.0%
17.7% 17.5%
Going Concerns Per YearPercentage of Going Concerns (Year 2012 Estimated)
% of Auditor Opinions with Going Concern Uncertainty
IVES Group Inc. phone: (508) 476-7007 e-mail: [email protected]
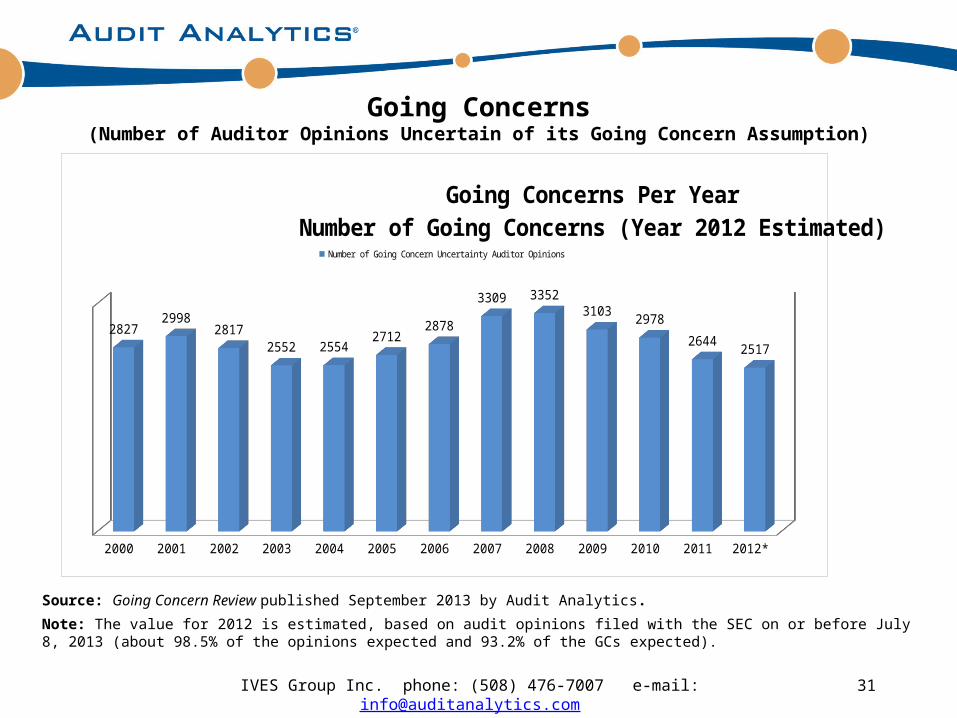
Going Concerns(Number of Auditor Opinions Uncertain of its Going Concern Assumption)
31
Source: Going Concern Review published September 2013 by Audit Analytics.
Note: The value for 2012 is estimated, based on audit opinions filed with the SEC on or before July 8, 2013 (about 98.5% of the opinions expected and 93.2% of the GCs expected).
2000 2001 2002 2003 2004 2005 2006 2007 2008 2009 2010 2011 2012*
28272998
28172552 2554
27122878
3309 33523103
2978
26442517
Going Concerns Per YearNumber of Going Concerns (Year 2012 Estimated)
Number of Going Concern Uncertainty Auditor Opinions

IVES Group Inc. phone: (508) 476-7007 e-mail: [email protected]
Going Concerns Twelve Year Review
32
Source: Going Concern Review published September 2013 by Audit Analytics.
Note: The value for 2012 is estimated, based on audit opinions filed with the SEC on or before July 8, 2012 (about 98.5% of the opinions expected and 93.2% of the GCs expected).
Going Concern Twelve Year Review (Fiscal Year 2012 Estimated)
Fiscal Year 2000 2001 2002 2003 2004 2005 2006 2007 2008 2009 2010 2011 2012
Going Concerns 2827 2998 2817 2552 2554 2712 2878 3309 3352 3103 2978 2644 2517
Total Auditor Opinions 20009 18907 17194 17765 16795 16788 16548 16631 15885 15592 15668 14958 14404
% of All Opinions 14.13% 15.86% 16.38% 14.37% 15.21% 16.15% 17.39% 19.90% 21.10% 19.90% 19.01% 17.68% 17.47%

IVES Group Inc. phone: (508) 476-7007 e-mail: [email protected]
Going Concern Percentages(Breakdown by Market Status)
33
Note: The market designation is based on the company’s status as of 7/8/13. As compared to last year's slide, a number of going concerns shifted from OTCBB to Non-Tickered. This shift, in part, was due to the efforts of the SEC's Microcap Fraud Working Group to suspend the trading of registered shell companies. For example, this working group suspended 379 shells in May 2012 and an additional 61 in June 2013. Not all suspended shells filed a going concern, but this effort would also discourage the creation of new shells.
Source: Going Concern Review published September 2013 by Audit Analytics.
Fiscal Year
TotalGoing
Concerns
NYSE NASDAQ AMEX OTCBB Non-Tickered
GoingConcerns % Going
Concerns % GoingConcerns % Going
Concerns % GoingConcerns %
12 (Partial) 2345 11 0.47% 99 4.22% 24 1.02% 620 26.44% 1591 67.85%
2011 2644 8 0.30% 78 2.95% 21 0.79% 595 22.50% 1942 73.45%
2010 2978 12 0.40% 78 2.62% 28 0.94% 510 17.13% 2350 78.91%
2009 3103 21 0.68% 108 3.48% 31 1.00% 390 12.57% 2553 82.28%
2008 3352 27 0.81% 101 3.01% 41 1.22% 330 9.84% 2853 85.11%
2007 3309 9 0.27% 60 1.81% 29 0.88% 271 8.19% 2940 88.85%
IVES Group Inc. phone: (508) 476-7007 e-mail: [email protected] 34
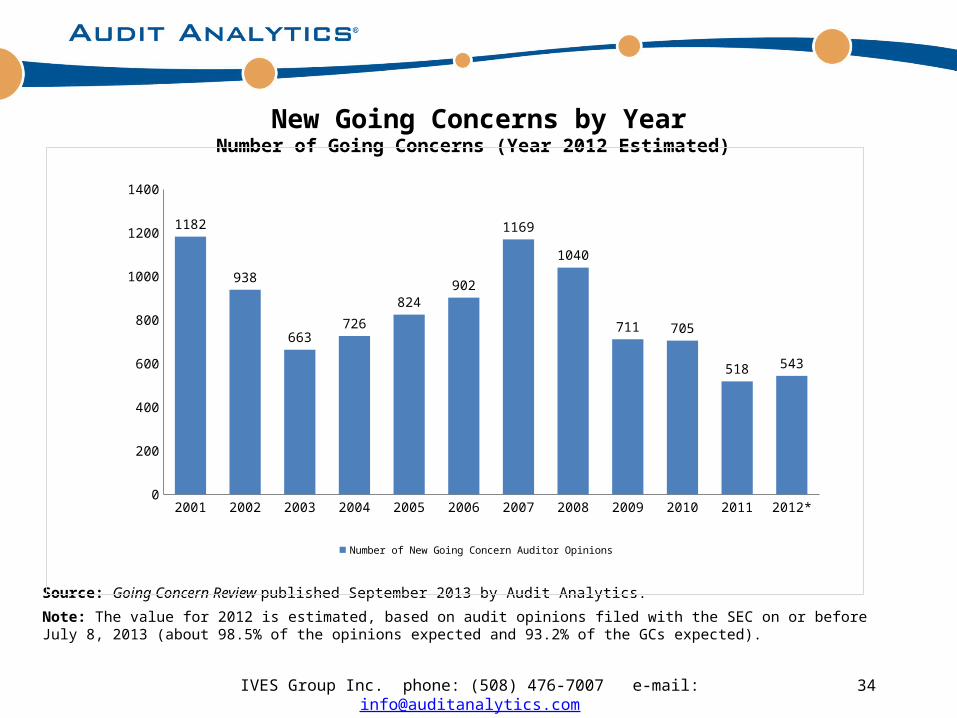
New Going Concerns by YearNumber of Going Concerns (Year 2012 Estimated)
Source: Going Concern Review published September 2013 by Audit Analytics.
Note: The value for 2012 is estimated, based on audit opinions filed with the SEC on or before July 8, 2013 (about 98.5% of the opinions expected and 93.2% of the GCs expected).
2001 2002 2003 2004 2005 2006 2007 2008 2009 2010 2011 2012*0
200
400
600
800
1000
1200
1400
1182
938
663726
824902
1169
1040
711 705
518 543
Number of New Going Concern Auditor Opinions

IVES Group Inc. phone: (508) 476-7007 e-mail: [email protected] 35
Source: Going Concern Review published September 2013 by Audit Analytics.
Note: The value for 2012 is estimated, based on audit opinions filed with the SEC on or before July 8, 2013 (about 98.5% of the opinions expected and 93.2% of the GCs expected).
2001 2002 2003 2004 2005 2006 2007 2008 2009 2010 2011 2012*0
500
1000
1500
2000
2500
3000
3500
4000
1816 1879 1889 1828 1888 1976 2140 2312 2392 2273 2126 1974
1182 938663 726
824902
11691040 711
705
518543
Going Concern History Status BreakdownNew GCs and Repeated GCs (Year 2012 Estimated)
Repeated GC from Year Prior New GC
IVES Group Inc. phone: (508) 476-7007 e-mail: [email protected] 36
Source: Going Concern Review published September 2013 by Audit Analytics.
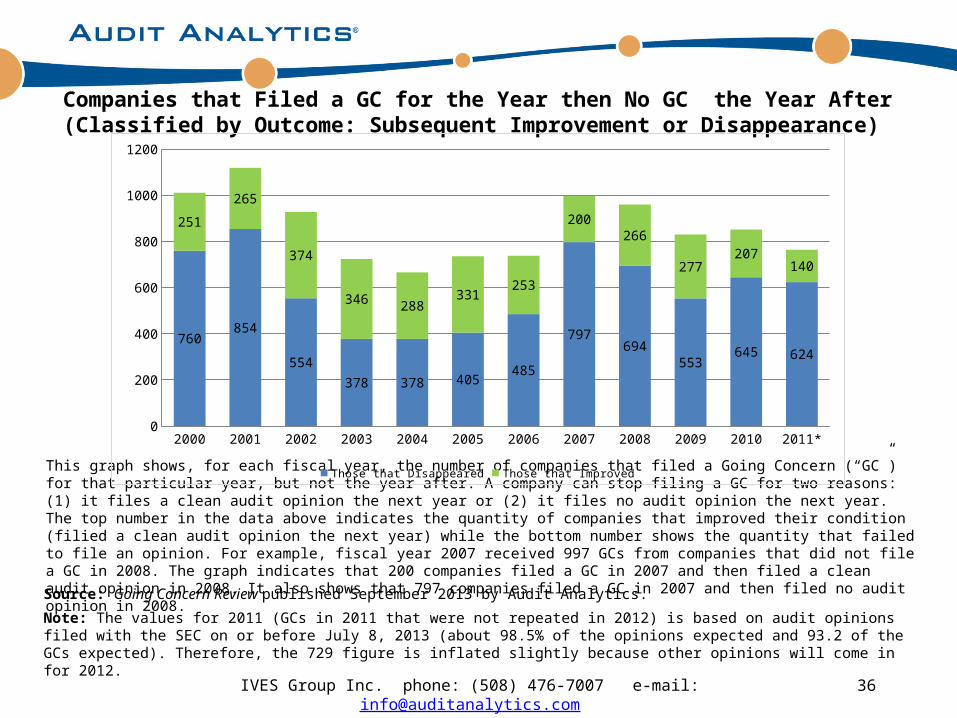
Note: The values for 2011 (GCs in 2011 that were not repeated in 2012) is based on audit opinions filed with the SEC on or before July 8, 2013 (about 98.5% of the opinions expected and 93.2 of the GCs expected). Therefore, the 729 figure is inflated slightly because other opinions will come in for 2012.
This graph shows, for each fiscal year, the number of companies that filed a Going Concern (“GC”) for that particular year, but not the year after. A company can stop filing a GC for two reasons: (1) it files a clean audit opinion the next year or (2) it files no audit opinion the next year. The top number in the data above indicates the quantity of companies that improved their condition (filied a clean audit opinion the next year) while the bottom number shows the quantity that failed to file an opinion. For example, fiscal year 2007 received 997 GCs from companies that did not file a GC in 2008. The graph indicates that 200 companies filed a GC in 2007 and then filed a clean audit opinion in 2008. It also shows that 797 companies filed a GC in 2007 and then filed no audit opinion in 2008.
Companies that Filed a GC for the Year then No GC the Year After(Classified by Outcome: Subsequent Improvement or Disappearance)
2000 2001 2002 2003 2004 2005 2006 2007 2008 2009 2010 2011*0
200
400
600
800
1000
1200
760854
554
378 378 405485
797694
553645 624
251
265
374
346 288331
253
200266
277207
140
Those that Disappeared Those that Improved
IVES Group Inc. phone: (508) 476-7007 e-mail: [email protected]
2002 2003 2004 2005 2006 2007 2008 2009 2010 2011 20120.00%
10.00%
20.00%
30.00%
40.00%
50.00%
60.00%
70.00%
80.00%
90.00%
49.13%
58.55%
72.77%78.55% 79.88% 78.51% 79.32% 79.78% 78.22% 79.33% 77.88%
50.87%
41.45%
27.23%21.45% 20.12% 21.49% 20.68% 20.22% 21.78% 20.67% 22.12%
Audit Fees & Non-Audit Feesas a Percentage of Total Fees
Audit Fees Non-Audit Fees
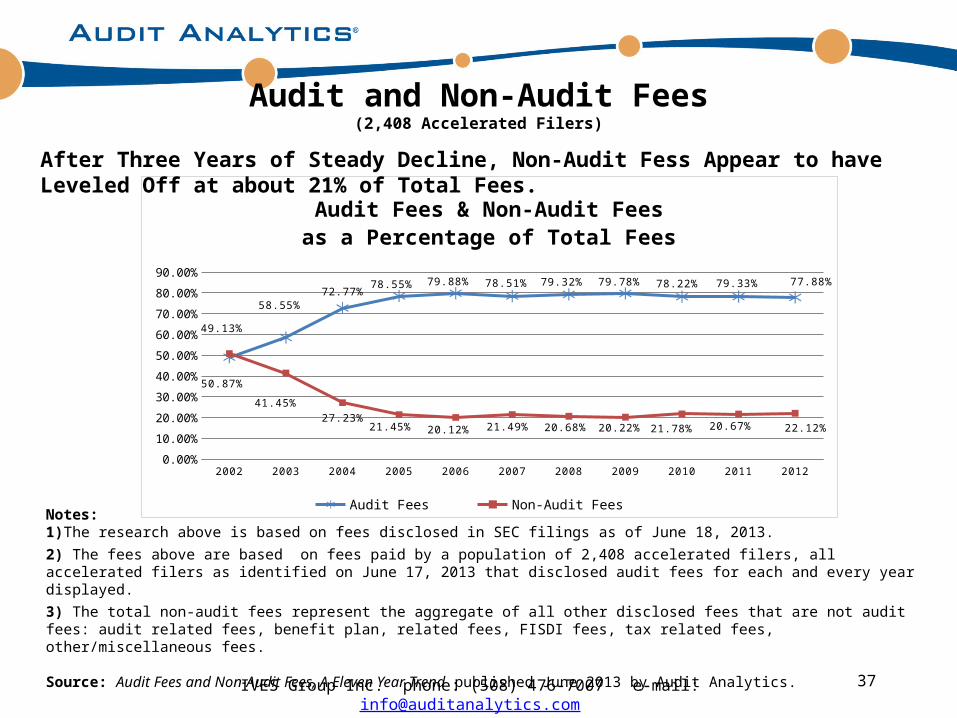
Audit and Non-Audit Fees(2,408 Accelerated Filers)
37
After Three Years of Steady Decline, Non-Audit Fess Appear to have Leveled Off at about 21% of Total Fees.
Notes: 1)The research above is based on fees disclosed in SEC filings as of June 18, 2013.
2) The fees above are based on fees paid by a population of 2,408 accelerated filers, all accelerated filers as identified on June 17, 2013 that disclosed audit fees for each and every year displayed.
3) The total non-audit fees represent the aggregate of all other disclosed fees that are not audit fees: audit related fees, benefit plan, related fees, FISDI fees, tax related fees, other/miscellaneous fees.
Source: Audit Fees and Non-Audit Fees, A Eleven Year Trend published June 2013 by Audit Analytics.

IVES Group Inc. phone: (508) 476-7007 e-mail: [email protected]
2002 2003 2004 2005 2006 2007 2008 2009 2010 2011 20120
50
100
150
200
250
300
350
400
450
387
287
222
162 146 146 138 145 142 132 134
Non-Audit Fees (US $) Per Million Dollars in Revenue
Non-Audit Fees(2,408 Accelerated Filers)
38
During the Eleven Years Under Review, Accelerated Filers Paid the Second Lowest Amount of Non-Audit Fees as a Percentage of Revenue During 2012.
Notes: 1)The research above is based on fees disclosed in SEC filings as of June 18, 2013.
2) The fees above are based on fees paid by a population of 2,408 accelerated filers, all accelerated filers as identified on June 17, 2013 that disclosed audit fees for each and every year displayed.
3) The total non-audit fees represent the aggregate of all other disclosed fees that are not audit fees: audit related fees, benefit plan, related fees, FISDI fees, tax related fees, other/miscellaneous fees.
Source: Audit Fees and Non-Audit Fees, A Eleven Year Trend published June 2013 by Audit Analytics.

IVES Group Inc. phone: (508) 476-7007 e-mail: [email protected]
2002 2003 2004 2005 2006 2007 2008 2009 2010 2011 20120
100
200
300
400
500
600
700
374406
592 592 579533 531
572511
476 472
Audit Fees (US $) Per Million Dollars in Revenue
Audit Fees(2,408 Accelerated Filers)
39
The Cost of Audit Fees as a Percentage of Revenue Experienced a Slight Uptick in 2009 (an Uptick Due to a Decrease in Revenue Rather than an Increase in Fees) Followed by Three Years of Decline.
Notes: 1)The research above is based on fees disclosed in SEC filings as of June 18, 2013.
2) The fees above are based on fees paid by a population of 2,408 accelerated filers, all accelerated filers as identified on June 17, 2013 that disclosed audit fees for each and every year displayed.
3) The total non-audit fees represent the aggregate of all other disclosed fees that are not audit fees: audit related fees, benefit plan, related fees, FISDI fees, tax related fees, other/miscellaneous fees.
Source: Audit Fees and Non-Audit Fees, A Eleven Year Trend published June 2013 by Audit Analytics.
IVES Group Inc. phone: (508) 476-7007 e-mail: [email protected]
2004 2005 2006 2007 2008 2009 2010 2011 20121400
1600
1800
2000
2200
2400
2600
2800
1476
2030
2209
2311 2311 2292 2317 2369 2403
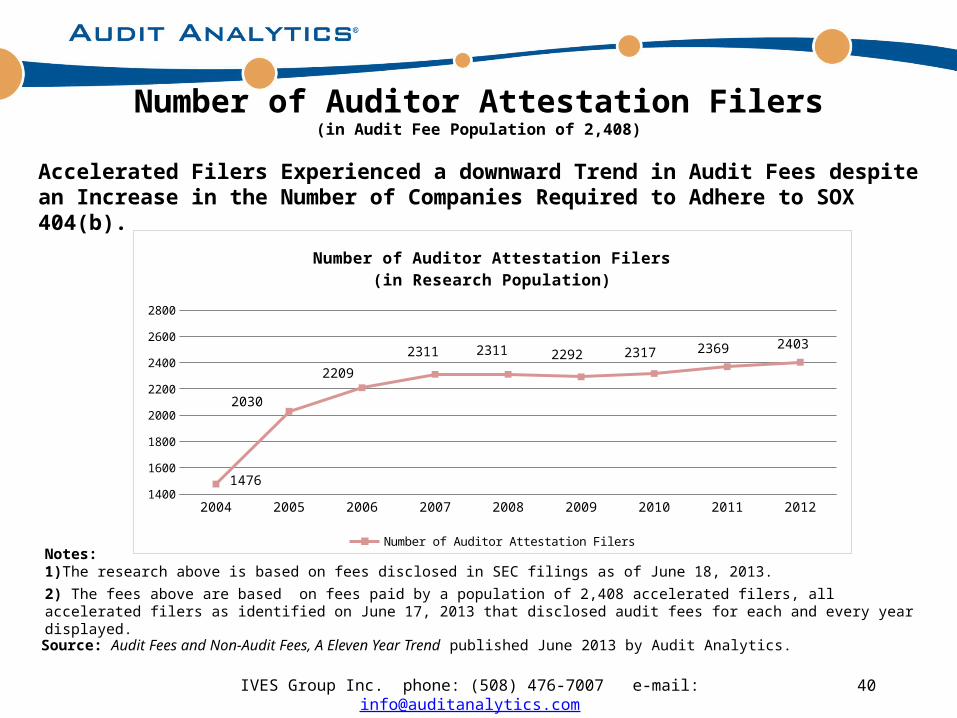
Number of Auditor Attestation Filers(in Research Population)
Number of Auditor Attestation Filers
Number of Auditor Attestation Filers(in Audit Fee Population of 2,408)
40
Notes: 1)The research above is based on fees disclosed in SEC filings as of June 18, 2013.
2) The fees above are based on fees paid by a population of 2,408 accelerated filers, all accelerated filers as identified on June 17, 2013 that disclosed audit fees for each and every year displayed.
Accelerated Filers Experienced a downward Trend in Audit Fees despite an Increase in the Number of Companies Required to Adhere to SOX 404(b).
Source: Audit Fees and Non-Audit Fees, A Eleven Year Trend published June 2013 by Audit Analytics.
IVES Group Inc. phone: (508) 476-7007 e-mail: [email protected]
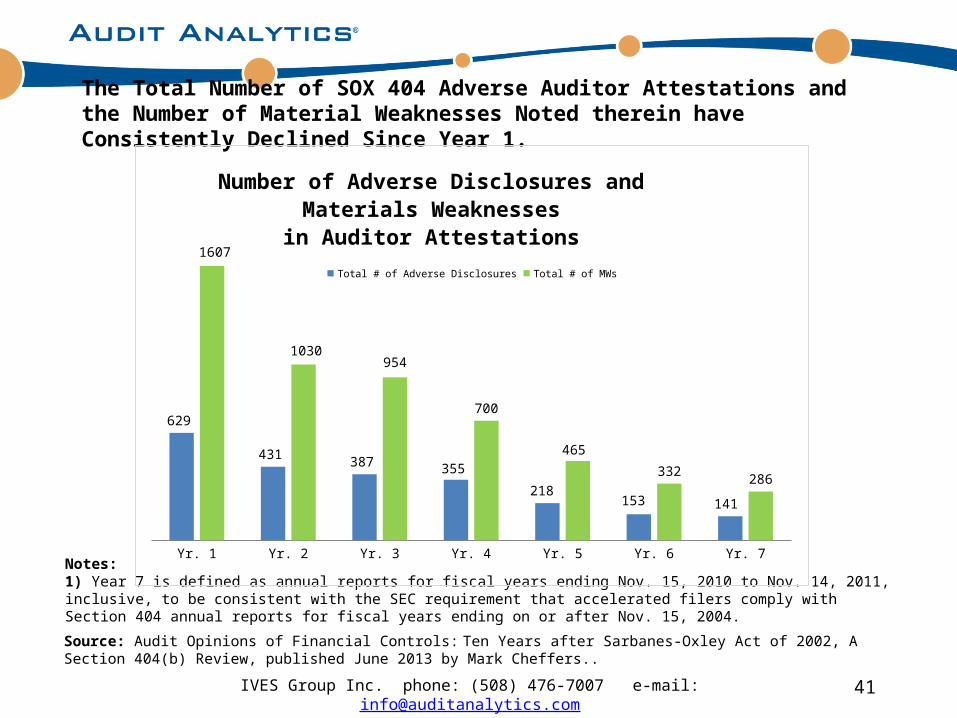
The Total Number of SOX 404 Adverse Auditor Attestations and the Number of Material Weaknesses Noted therein have Consistently Declined Since Year 1.
41
Notes: 1) Year 7 is defined as annual reports for fiscal years ending Nov. 15, 2010 to Nov. 14, 2011, inclusive, to be consistent with the SEC requirement that accelerated filers comply with Section 404 annual reports for fiscal years ending on or after Nov. 15, 2004.
Source: Audit Opinions of Financial Controls: Ten Years after Sarbanes-Oxley Act of 2002, A Section 404(b) Review, published June 2013 by Mark Cheffers..
Yr. 1 Yr. 2 Yr. 3 Yr. 4 Yr. 5 Yr. 6 Yr. 7
629
431 387 355
218153 141
1607
1030954
700
465
332 286
Number of Adverse Disclosures and Materials Weaknessesin Auditor Attestations
Total # of Adverse Disclosures Total # of MWs

IVES Group Inc. phone: (508) 476-7007 e-mail: [email protected] 42
SOX 404Year
SOX 404 Auditor Attestations
TotalAuditor
Attestations
Material Weaknesses (MWs)Noted in Adverse Disclosures
Total # ofAdverse
Disclosures
Total #of MWs
Yr. 1 3789 629 1607
Yr. 2 3916 431 1030
Yr. 3 4316 387 954
Yr. 4 4576 355 700
Yr. 5 4430 218 465
Yr. 6 4275 153 332
Yr. 7 4019 141 286
The Total Number of SOX 404 Adverse Auditor Attestations and the Number of Material Weaknesses Noted therein have Consistently Decline Since Year 1.
Notes: 1) Year 7 is defined as annual reports for fiscal years ending Nov. 15, 2010 to Nov. 14, 2011, inclusive, to be consistent with the SEC requirement that accelerated filers comply with Section 404 annual reports for fiscal years ending on or after Nov. 15, 2004.
Source: Audit Opinions of Financial Controls: Ten Years after Sarbanes-Oxley Act of 2002, A Section 404(b) Review, published June 2013 by Mark Cheffers..
IVES Group Inc. phone: (508) 476-7007 e-mail: [email protected]
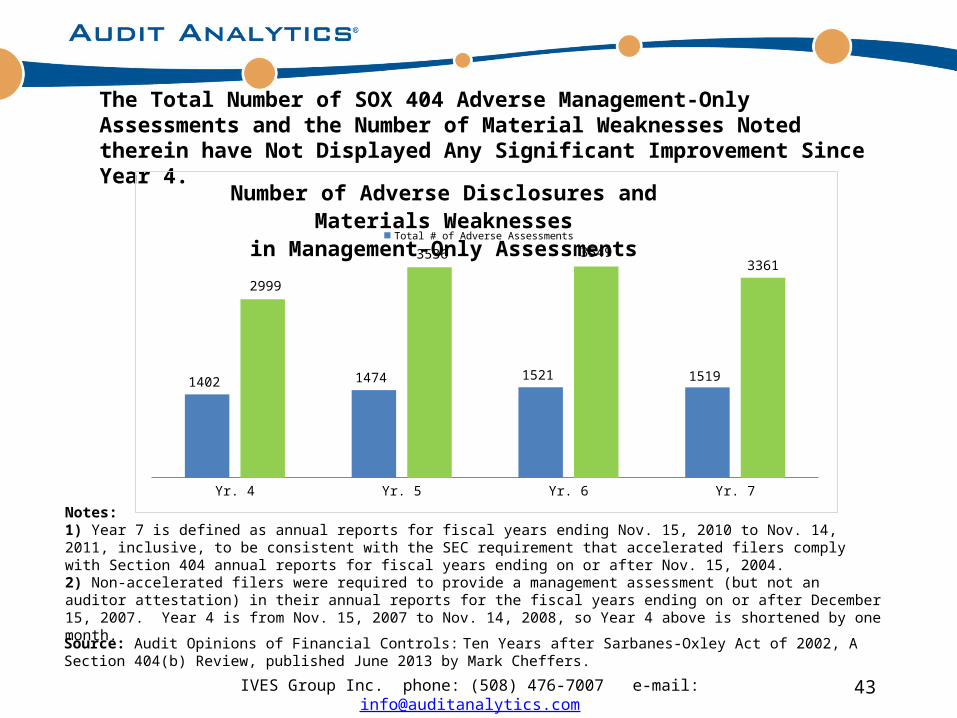
The Total Number of SOX 404 Adverse Management-Only Assessments and the Number of Material Weaknesses Noted therein have Not Displayed Any Significant Improvement Since Year 4.
43
Yr. 4 Yr. 5 Yr. 6 Yr. 7
1402 1474 1521 1519
2999
3536 35493361
Number of Adverse Disclosures and Materials Weaknessesin Management-Only Assessments
Total # of Adverse Assessments Total # of MWs
Notes: 1) Year 7 is defined as annual reports for fiscal years ending Nov. 15, 2010 to Nov. 14, 2011, inclusive, to be consistent with the SEC requirement that accelerated filers comply with Section 404 annual reports for fiscal years ending on or after Nov. 15, 2004. 2) Non-accelerated filers were required to provide a management assessment (but not an auditor attestation) in their annual reports for the fiscal years ending on or after December 15, 2007. Year 4 is from Nov. 15, 2007 to Nov. 14, 2008, so Year 4 above is shortened by one month.
Source: Audit Opinions of Financial Controls: Ten Years after Sarbanes-Oxley Act of 2002, A Section 404(b) Review, published June 2013 by Mark Cheffers.

IVES Group Inc. phone: (508) 476-7007 e-mail: [email protected]
The Total Number of SOX 404 Adverse Management-Only Assessments and the Number of Material Weaknesses Noted therein have Not Displayed Any Significant Improvement Since Year 4.
44
Notes: 1) Year 7 is defined as annual reports for fiscal years ending Nov. 15, 2010 to Nov. 14, 2011, inclusive, to be consistent with the SEC requirement that accelerated filers comply with Section 404 annual reports for fiscal years ending on or after Nov. 15, 2004.
2) Non-accelerated filers were required to provide a management assessment (but not an auditor attestation) in their annual reports for the fiscal years ending on or after December 15, 2007. Year 4 is from Nov. 15, 2007 to Nov. 14, 2008, so Year 4 above is shortened by one month.
Source: Audit Opinions of Financial Controls: Ten Years after Sarbanes-Oxley Act of 2002, A Section 404(b) Review, published June 2013 by Mark Cheffers..
IVES Group Inc. phone: (508) 476-7007 e-mail: [email protected] 45
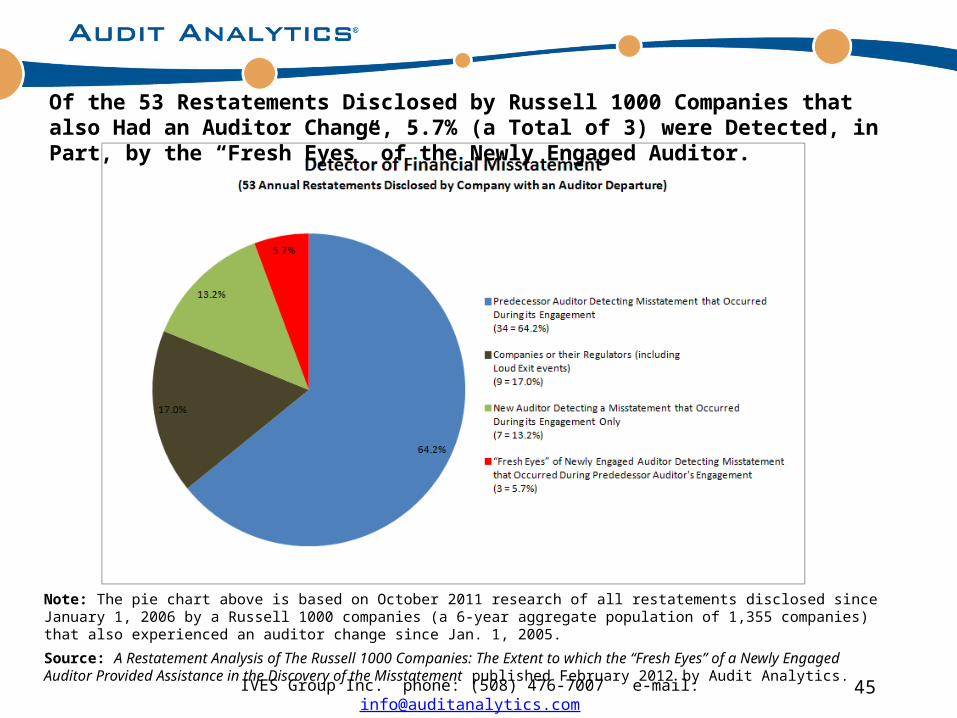
Of the 53 Restatements Disclosed by Russell 1000 Companies that also Had an Auditor Change, 5.7% (a Total of 3) were Detected, in Part, by the “Fresh Eyes” of the Newly Engaged Auditor.
Note: The pie chart above is based on October 2011 research of all restatements disclosed since January 1, 2006 by a Russell 1000 companies (a 6-year aggregate population of 1,355 companies) that also experienced an auditor change since Jan. 1, 2005.
Source: A Restatement Analysis of The Russell 1000 Companies: The Extent to which the “Fresh Eyes” of a Newly Engaged Auditor Provided Assistance in the Discovery of the Misstatement published February 2012 by Audit Analytics.

IVES Group Inc. phone: (508) 476-7007 e-mail: [email protected]
Audit AccountingSystem
RulesPrinciples
Image of three legged stool from the following website: www.clker.com/clipart-three-legged-stool-outline.html
Ethics
Pakaluk, Michael and Mark Cheffers, Accounting Ethics … and the Near Collapse of the World’s Financial System. (Sutton: Allen David Press, 2011)
46
IVES Group Inc. phone: (508) 476-7007 e-mail: [email protected] 47
Audit Analytics provides detailed intelligence research on all public companies and 1,500 accounting firms. Our data includes detailed categorizations of issues and is considered by many professionals to be the best primary data source for tracking and analysis of the following public company disclosures:
Sarbanes-Oxley Disclosures- Track Section 404 internal control disclosures and Section 302 disclosure controls.
Auditor Information- Know who is auditing whom, their fees, auditor changes, auditor opinions and more.
Restatements- Identify company restatements by type, auditor and peer group. Analyze by date, period and specific issue.
Legal Disclosures- Search all federal litigation by auditor, company and litigation type. Know who is representing whom.
Corporate Governance- Track director & officer changes, audit committee members, C-level executives and their biographies.
SEC Comment Letters- An extensive collection of more than 125,000 fully analyzed SEC Comment Letters indexed according to a taxonomy of 2,800 issues
and rules.
Examples of Recent Assignments from Law Firm Clients• Identify all SOX 404 filings where the management assessment disagrees with the auditor attestation.• Discover examples of SOX 302 disclosures that identified and remediated the control weakness in the same reporting period.• List of all Revision Restatements (restatements filed without a prior 8-K, Item 4.02 disclosure) during or after 2007 and identify which
of those restatements were disclosed by a company with an IPO during or after 2007.• Provide the SOX 302 and SOX 404 disclosure text from companies with an IPO during or after 2007 that subsequently filed a Revision
Restatement.• Supply excerpts of SEC Comment Letters that discussed a Fin 48 with the phrase “change in estimate” or “correction of an error.”
• Provide SOX 302 disclosure text from companies that engaged a Big4 auditor and filed a SAB 108 that noted a “change in estimate.”• Identify financial restatements that made adjustments in goodwill that also addressed issues regarding company acquisitions and
accounts payable. Provide stock price history of companies that filed such restatements.