Embed Size (px)
Citation preview

1
Report FIRST National
TB Prevalence Survey 2012, Nigeria
f e d e r a l republic of
nigeria


Report FIRST National
TB Prevalence Survey 2012, Nigeria
f e d e r a l republic of
nigeria

4
Report first national TB prevalence survey 2012, Nigeria
Prior to 2012, there was no national survey to determine the prevalence of tuberculosis
disease (TB) in Nigeria. Estimates of the burden of TB in the country relied on indirect
assessment by the World Health Organization (WHO) based on existing TB surveillance
data. The accuracy of such estimates largely depends on the quality of the routine surveil-
lance information, which in itself is affected by the completeness of TB notification and
instances of TB under-diagnosis. Therefore, it became imperative to conduct a nationwide
prevalence survey of TB to obtain a good direct estimate of the burden of TB in the country.
This nationally representative survey was principally aimed at determining the preva-
lence of bacteriologically-confirmed (sputum smear-positive and/or culture-positive) TB
among the general population aged fifteen years and above. It was designed and conduct-
ed in line with international recommendations developed by the WHO Global Task Force
on TB impact Measurement by a team of seasoned professionals.
The results of the survey highlight the high burden of TB in the country, showing much
higher TB prevalence levels than previously estimated based on routine surveillance data.
It shows the pattern of the distribution of TB in the general population in relation to age,
sex and habitation as well as identifying some key risk factors for TB. In addition, the
survey defines the reach of TB services in the general population and the health seeking
behavior of persons who have symptoms of TB. The survey also provides information on
the possible dynamics of TB transmission in the community as well as challenges to noti-
fication of persons that have TB.
To the extent possible, this first national TB prevalence survey in Nigeria has contributed
to our knowledge about TB as a disease of major public health importance. It has provided
valuable information on the burden and dynamics of TB that will inform strategic inter-
ventions to address the challenges of TB control and strengthen routine TB surveillance
and provide the benchmark for the monitoring of future progress towards TB control in
the country.
Prof. C. O. Onyebuchi Chukwu
Honourable Minister of Health
Federal Republic of Nigeria
Foreword

5
The TB prevalence survey was conducted by the National Tuberculosis Control pro-
gramme of the Federal Ministry of Health in close collaboration with the World Health
Organization (WHO) and the US Centers for Disease Control and Prevention (CDC). It
was coordinated by the Survey Technical Committee made up of Government and several
local and international partners.
Bulge of the funding for the survey came from the Global Fund for AIDS, Tuberculosis and
Malaria and The Federal Government of Nigeria. Other funders were the USAID, WHO
and CDC who provided significant amounts to cover the cost of Technical Assistant and
training.
Technical Assistance was provided throughout the entire process by the WHO and CDC
under the guidance of the WHO Global Task Force on TB Impact Measurement. Three
laboratories were used for processing of sputum specimens namely Nigeria Institute of
Medical Research (NMIR) Lagos, National Tuberculosis and Leprosy Training Centre (NT-
BLTC) Zaria and Zankli Medical Centre Abuja.
Field data collection was carried out amidst very difficult terrain with security challenges
by team headed by WHO National Professional Officers comprising of Medical Officers,
Radiographers, Data clerks, Laboratory Assistants, interviewers and other support staff.
These findings present, for the first time in the history of TB care and control in Nigeria, a
robust nationwide assessment of the actual TB burden in the country for 2012. They also
provide invaluable information for the formulation of policies that will need to be put in
place to address challenges that have been identified. Finally, the findings provide a base-
line level for measuring future progress in the control of TB disease.
Dr. Bridget Okoeguale
HOD, Department of Public Health
Acknowledgements
Acknowledgements

6
Report first national TB prevalence survey 2012, Nigeria
Abbreviations 11
Executive summary 12
1. Introduction, methods and procedures 14
1.1 Background 15
1.2 Justification for the National TB Prevalence survey, Nigeria 2012 17
1.3 Objectives 18
1.4 Survey methods 18
1.4.1 Survey design 19
1.4.2 Survey population 19
1.4.3 Screening method 19
1.4.4 Sample size determination 20
1.4.5 Basic survey elements 22
1.4.6 Case definitions 23
1.5 Survey organization 24
1.5.1 Survey Management Committee 24
1.5.2 Technical Committee 24
1.5.3 Principal Investigator 24
1.5.4 Survey Coordinator 24
1.5.5 Central unit 25
1.5.6 Central laboratory 25
1.5.7 Central chest x-ray unit 25
1.5.8 Central data management unit 25
1.5.9 Field teams 25
1.6 Training requirements 26
1.7 Pilot testing 27
1.8 Survey procedures 27
1.8.1 Procedures before field survey 27
1.8.2 Field survey procedures 28
1.9 Security during field operations 30
1.10 Ethical considerations 31
2. Description of the survey data 32
2.1 Summary of survey data flow 33
2.2 Age-sex distribution of enumerated, eligible and ineligible populations 33
2.3 Survey participation 36
2.4 Overall survey participation 36
2.4.1 Occupation 37
Table of Contents

7
2.4.2 Educational level of survey participants 38
2.4.3 History of TB among participants 38
2.5 Field screening 40
2.5.1 TB-related symptoms 40
2.5.2 Chest x-ray examinations 41
2.6 Field screening summary 42
2.7 Laboratory examinations 42
2.7.1 Sputum collection and availability of results 43
2.7.2 Culture examinations 45
2.8 Health-seeking behaviour 47
3. TB prevalence: analytical methods and key results 49
3.1 Crude TB prevalence rates 50
3.2 Number of TB survey cases broken down by laboratory 50
3.3 Statistical analyses for the estimation of TB prevalence rates 53
3.3.1 Individual level analysis 53
3.3.2 Handling of missing data 54
3.3.3 Imputation models 55
3.4 Estimated TB prevalence rates from survey population 55
3.5 Extrapolating nationwide from survey prevalence 56
3.6 Summary results from the first national TB prevalence survey in Nigeria 57
4. Discussion 60
4.1 Prevalence rate of TB 61
4.2 Considering eligibility criteria 63
4.3 Survey participation 63
4.4 Characteristics of participants 64
4.4.1 TB-related symptoms 64
4.4.2 Geographical variation of TB prevalence 65
4.5 Comparison of routine TB surveillance data with survey report 66
4.6 Strengths and limitations of the survey 66
4.6.1 Strengths 66
4.6.2 Limitations 67
5. Programmatic implications and recommendations 69
5.1 High tuberculosis prevalence to case notification ratio indicates low case
detection 70
5.2 Inappropriate action by symptomatic respondents 70
5.3 Laboratory capacity 70
Table of contents

8
Report first national TB prevalence survey 2012, Nigeria
6. Conclusion 71
References 73
Annexes 74
Annex 1: Survey funding and cost breakdown 74
Annex 2: Technical committee 75
Annex 3: Central medical panel 75
Annex 4: Survey team members 76
Annex 5: List of clusters 77
Annex 6: Survey instruments 80
Annex 7: Cluster summary of participation according to screening methods 97
9
List of Tables
Table 1.1: Fixed Field Team Members 26
Table 1.2: Co-opted local members 26
Table 1.3: Field Operation Schedule 28
Table 2.1: Enumerated, eligible and non-eligible population: overall, and broken
down by sex, age group and geopolitical zone 35
Table 2.2: Participation by screening tool, evaluable participants that
were interviewed 36
Table 2.3: Age and sex distribution of evaluated by chest x-ray 37
Table 2.4: Occupation of participants 38
Table 2.5: Highest education level of survey participants 38
Table 2.6: Participants on treatment for TB at time of survey 39
Table 2.7: Health seeking behaviour of participants on TB treatment 39
Table 2.8: Participants’ previous TB treatment status 40
Table 2.9: Results of screening interview: TB related symptoms 41
Table 2.10: Chest X-ray field screening results 41
Table 2.11: Summary results of screening: reasons of eligibility for sputum
examinations 42
Table 2.12: Summary results of sputum specimen collection from the field 43
Table 2.13: Relationship between spot and morning sputum smear results 43
Table 2.14: elationship between CXR, symptom screening and laboratory
microscopy results 44
Table 2.15: Comparison of smear and culture results between spot and
morning specimen 45
Table 2.16 : Relationship between spot and early morning culture results 45
Table 2.17: Culture examination results 46
Table 2.18: Health care seeking behaviour of symptomatic survey participants
by gender and location 47
Table 2.19: Choice of health service among those who first seek care 48
Table 3.1: Number of TB survey cases broken down by laboratory 50
Table 3.2: Numbers of TB prevalent survey cases and evaluable participants,
and crude rates per 100,000 by detailed symptoms 51
Table 3.3: Numbers of TB prevalent survey cases broken down by categories 52
Table 3.4: Estimated TB prevalence rates per 100,000 using the recommended
analysis combining multiple imputation and inverse probability
weighting 56
Table 3.5: Estimated adult TB prevalence rates per 100,000 based on findings
from the national prevalence survey analysed using the recommended
analytical approach of multiple imputation and inverse probability
weighting 57
Table 3.6: Prevalence to case notification ratio, Nigeria 2012 59
List of tables

10
Report first national TB prevalence survey 2012, Nigeria
List of Figures
Figure 1.1: Time-series of national TB case notification rates per 100,000 in
Nigeria, 1995-2012 16
Figure 1.2: Time series of new TB case notification rates per 100,000 (blue: all
forms, red: smear-positive), by zone, 2010-2012. 17
Figure 1.3: Sampled clusters for Nigeria TB prevalence survey 23
Figure 2.1: Consort diagram of the National TB prevalence survey, Nigeria 2012 34
Figure 2.2: Comparison of age and sex distribution of the census and eligible
survey populations 35
Figure 2.3: Comparison of age and sex distribution of the eligible and
participant survey populations 36
Figure 3.1: Age and sex-specific TB prevalence rates (smear-positive and
bacteriologically-confirmed) per 100,000. 58
Figure 3.2: Zonal and urban/rural-specific TB prevalence rates (smear-positive
and bacteriologically-confirmed) per 100,000. 58
Figure 4.1: Participation rate by cluster (chronological order) 64
Figure 4.2: Participation rate by age group and sex 64
Figure 4.3: Cluster variation in the number of TB cases 65
Figure 4.4: Scatterplot of smear-positive case notification rates (≥15) against
prevalence rates (≥15) by zone. 66

11
ACSM Advocacy, Communication and Social Mobilization
AFB acid-fast bacilli
AIDS acquired immuno-deficiency syndrome
CDC US Centers for Disease Control and Prevention
CI confidence interval
CR computerized radiography
CXR chest x-ray
CIDA Canadian Internal Development Agency
DOTS directly observed treatment, short-course
DR-TB drug-resistant tuberculosis
EA enumeration areas
FMOH Federal Ministry of Health (Nigeria)
ILEP International Federation of Anti-Leprosy Associations
IUATLD International Union Against Tuberculosis and Lung Disease
GFATM Global Fund for AIDS, Tuberculosis and Malaria
LJ Lowenstein Jensen
LGA local government area
MDG Millennium Development Goal
MDR-TB multi-drug resistant tuberculosis
MTB Mycobacterium Tuberculosis
NMIR Nigeria Medical Institute Research
NPC National Population Commission
NTBLCP National Tuberculosis and Leprosy Control Programme
NTBLTC National Tuberculosis and Leprosy Training Centre
NTBLCP National Tuberculosis and Leprosy Control Programme
NTM Non-Tuberculous Mycobacterium
NTP National Tuberculosis Programme
NPC National Population Commission
PHC primary health care
PPM public-private mix
PPS population proportionate sampling
SMC Survey Management Committee
SLR supranational reference laboratory
SOP standard operating procedure
TB tuberculosis
TBLS tuberculosis and leprosy supervisor
WHO World Health Organization
WMA World Medical Association
USAID United States Agency for Internal Development
ZN Ziehl Neelsen
Abbreviations
Abbreviations

12
Report first national TB prevalence survey 2012, Nigeria
Nigeria’s first National Tuberculosis Prevalence survey was concluded in November 2012
by the National TB & Leprosy Control programme. The survey aimed to determine the
prevalence of pulmonary tuberculosis (bacteriologically-confirmed; sputum smear and/
or culture positive) among the general population aged 15 years and above in Nigeria.
A total of 113,247 persons were considered for inclusion; of these, 77,797 (68.7%) were
eligible for the survey in 70 clusters around the country. 44,186 persons (56.8%) partic-
ipated in the survey, and of these 4,688 (10.6%) submitted sputum for examination. The
average number of participants per cluster was 631 (with a range of 279-819). Female
participation was higher (26,008 (59%)) compared to male participation (18,178 (41%)).
Survey design and overall methods followed the international recommendations of
the WHO Global Task Force on TB Impact Measurement. All survey participants were
screened through a symptoms interview and a chest x-ray examination. Participants with
any symptom present suggestive of TB or radiological lesion(s) in the lung submitted two
sputum specimens (one spot and one early-morning) that were examined by microscopy
for acid-fast bacilli (AFB) and culture using solid media in three laboratories – the Nigeria
Institute of Medical Research (NMIR), the National Tuberculosis and Leprosy Training
Centre (NTBLTC), and the Zankli Medical Centre in Abuja.
Out of the total sputum specimens processed, there were 107 smear-positive cases and
37 culture positive cases making a total of 144 bacteriologically-confirmed pulmonary
TB cases. TB prevalence rates per 100,000 population aged 15 years and above were
estimated to be 318 (95% CI of 225-412) for smear-positive, and 524 (95% CI of 378-
670) for bacteriologically-confirmed. Smear-positive TB prevalence among men was 484
(95% CI of 333-635) per 100,000, higher than that among women estimated to be 198
(95% CI 108-289) per 100,000. The same was observed for bacteriologically-confirmed
TB with 751 (CI 538-965) and 359 (CI 213-505) per 100,000 among men and women
respectively. An age differential in TB prevalence was also observed, with groups between
24-54 years carrying the highest burden of disease.
Symptomatic participants with cough of any duration numbered 5,152 (11%), while 2,479
(5.6%) had had a cough for two weeks or more. All of these were requested to submit two
sputum samples. Among the 107 smear-positive TB cases, 80 (75%) reported TB symp-
toms during the screening process and 94 (88%) had a positive chest X-ray. Of the 144
bacteriologically-confirmed cases, 92 (64%) reported TB symptoms during the screening
process and 128 (89%) had a positive chest X-ray. A total of 2,968 (6.8%) respondents
had radiological lesions out of which 38 (1.3%) were smear-positive.
A total of 82 survey participants (0.2%) reported being on TB treatment at the time of
Executive summary

13
the survey (37 males and 45 females, with 39 residing in urban areas). 552 (1.2%) survey
participants reported past history of TB treatment, of whom 281 were males and 271 fe-
males, while 303 were from urban, 212 from rural and 37 from semi-urban settings. The
majority of those reported taking treatment in general hospitals (48.6%), followed by
health centres/PHC (22.4%), teaching hospitals (11.2%), and private hospitals (10.1%).
Only one person reported taking treatment at a chemist.
Despite survey limitations in terms of participation rate (56.8%) and the low culture yield,
the TB burden in the country is estimated as much higher than previously thought (based
on data from the routine surveillance system), with considerable ongoing transmission.
These results suggest that TB should be classified as a significant public health problem
in Nigeria. Despite the fact that DOTS implementation has been ongoing for the last 10
years, DOTS services appear to have not penetrated the community. Future strategies
of the NTLCP need to address decentralization of TB care and control services into the
community.
Executive summary

14
Report first national TB prevalence survey 2012, Nigeria
Introduction, methods and procedures
chapter 1

15
Chapter 1: Introduction, methods and procedures
1.1 Background
Tuberculosis is a major public health problem in Nigeria, a country of 169 million inhab-
itants, with the country currently ranking 10th among the 22 high TB burden countries of
the world and fourth highest in Africa (after South Africa, Ethiopia and DR Congo). In the
2012 Global Tuberculosis Report1, WHO’s disease burden estimates, expressed in rates
per 100,000 population, were 161 (25-420) for prevalence and 108 (50-186) for inci-
dence. Case detection of all forms stood at 51% (29%-110%). The mortality rate for all
forms of TB remains 27 (7-60) per 100,000 population (46,000 deaths per year).
In response to TB as a high priority area of public health concern in Nigeria, the National
TB and Leprosy Control Programme (NTBLCP) was launched in 1991 under the Federal
Ministry of Health (FMOH). The DOTS Strategy was officially adopted in 1993, but na-
tionwide rollout began only in 2003. The number of DOTS Centres rose to 3,459 by the
end of 2009, representing 56% of the targeted 6,261 which will provide a DOTS Centre:
population ratio of 1:25,000. There are DOTS Centres in all 36 states and FCT of the
country, and 100% of the LGAs have at least two DOTS centres. By the end of 2009 there
1,025 facilities contained laboratories with microscopes and had the capacity to run AFB
diagnosis. This represented an AFB lab: population ratio of 1: 149,000, 51% of the targeted
1:80,0002. In 2009, 87% of LGAs had AFB laboratories. The population DOTS coverage in
2012 was 85% (program goal is 100% DOTS population coverage).
Overall case notifications have consistently increased during DOTS expansion (Figure 1.1)
in the country, but these seem to have plateaued since 2008 despite the more intensified
approach to PPM activities NTBLCP has taken recently (24% of 2012 notifications di-
rectly resulted from PPM). Out of 97,853 notified TB cases in 2012, 52,901 (59%) were
confirmed through smear-microscopy, 32,972 (37%) were based on a clinical diagnosis
(smear-negative), and only 4,432 (5%) were extra-pulmonary TB. The overwhelming
number of TB case notifications in 2012 (93%) were among patients who had not been
treated previously.
Some variation was observed in the pattern of TB case notification in the states and the
six geo-political zones of the country (Figure 1.2). Case notifications for all forms of TB
in the North West zone was 47 per 100,000 population; in the North East Zone, 65 per
100,000 population; in the North Central Zone, 80 per 100,000 population; in the South
West Zone, 71 per 100,000 population; in the South South Zone, 52 per 100,000 popula-
tion; and in the South East Zone, 41 per 100,000 population. The relatively higher notifi-
cation rates in the three Northern zones may be due to more extensive DOTS expansion
activities in those areas, compared with the three Southern zones.
1. Global Tuberculosis Report 2013. Geneva: World Health Organization; 2013 (http://www.who.int/tb/publications/global_report/en/, accessed 5 July 2014).
2. National Tuberculosis and Leprosy Control Programme, Annual Report 2008. Abuja: NTBLCP; 2009 (http://www.ntbltc.org/reports/Annual%20Report%202008%20NTBLCP.pdf, accessed 5 July 2014).

16
Report first national TB prevalence survey 2012, Nigeria
Figure 1.1Time-series of national TB case notification rates per 100,000 in Nigeria, 1995-2012Data source: WHO TB database
Panel A. Case notification rates (black: new, all forms; blue: new smear-positive; red: new smear-negative; green: new extra-pulmonary).
Panel B. Case notification rates (black: new, all forms; red: retreated, all forms).
1996 2000 2004 2008 2012
Cas
e no
tifica
tion
rate
s pe
r 100
,000
60
40
20
0
1996 2000 2004 2008 2012
Cas
e no
tifica
tion
rate
per
100
,000
60
40
20
0

17
Chapter 1: Introduction, methods and procedures
Figure 1.2Time series of new TB case notification rates per 100,000 (blue: all forms, red: smear-positive), by zone, 2010-2012. Data source: NTBLCP database
Treatment success of notified TB cases in 2011 reached the international target of 85%. It
is estimated that the proportion of MDR-TB cases is 2.9% among new cases and 14.3%
among previously treated cases3.
TB burden in Nigeria is further compounded by the high prevalence of HIV/AIDS of 4.1%
among the general population4. In 2012, 86% of registered TB patients were tested for
HIV; of these, 23% were found to be HIV-positive (co-infected).
1.2 Justification for the National TB Prevalence survey, Nigeria 2012
The targets of the national TB programme as set out in 20085 are: (1) to detect at least
70% of the estimated smear-positive TB cases; (2) to achieve at least an 85% cure rate of
the smear-positives; (3) to halve by 2015 the prevalence and mortality due to TB relative
to 1990 levels; and (4) to eliminate TB as a public health problem by 2050.
TB still constitutes a serious public health problem in Nigeria, despite the implementation
3. Nigeria National DR-TB Survey Results, 2012.4. Nigerian National HIV Sero-Prevalence Survey, 2010.5. National tuberculosis and leprosy control programme (NTBLCP) : workers manual (5th edition) Abuja: Federal Ministry of Health
Nigeria, 2008.
2010 2010 20102011 2011 20112012 2012 2012
80
60
40
20
80
60
40
20
South East
North Central
South South
North East
South West
North West
Nigeria

18
Report first national TB prevalence survey 2012, Nigeria
of the DOTS strategy since 1993 and subsequent adoption of the WHO Stop TB strategy
in 2006. Despite the availability of DOTS in all the 774 Local Government Areas (LGAs)
in the country and increasing resources from the Government of Nigeria and international
partner agencies (GFATM, USAID, CIDA, IUATLD, WHO and ILEP), targets for case de-
tection and treatment outcome have yet to be met.
To date, information about the TB disease burden in Nigeria has been based upon indirect
WHO estimates based on existing surveillance data; there were no nationally representa-
tive, robust surveys to inform the process. Due to an unknown amount of under-reported
cases from the private sector, under-diagnosed cases not reaching health services, and
other data quality issues (such as incomplete reporting from all states), the routine sur-
veillance data are unable to provide an accurate measure of the disease burden. Trends
over time cannot be monitored in the absence of a reliable baseline.
Accordingly, it was deemed necessary to conduct a prevalence survey in order to obtain a
good estimate of the prevalence of TB in the country; to help strengthen routine disease
surveillance; to guide national policies and guidelines for the control of TB in Nigeria; and
to measure progress towards achievement of global targets for TB control including the
Millennium Development Goals (MDGs).
1.3 Objectives
The main objective of the survey was to determine the prevalence of pulmonary tuber-
culosis (bacteriologically-confirmed; sputum smear and/or culture positive) among the
general population aged 15 years and above in Nigeria
Secondary objectives of the survey were as follows:
• To assess the prevalence of symptoms suggestive of pulmonary TB among the eligi-
ble population;
• To determine the prevalence of smear-positive pulmonary TB;
• To determine the prevalence and the patterns of chest X-ray abnormalities among the
eligible population;
• To assess the prevalence of culture-positive pulmonary TB;
• To assess the health-seeking behaviour of individuals with symptoms suggestive of
TB; and
• To identify some risk factors for prevalent TB, including age, sex, education, smoking,
and urban-rural residence.
1.4 Survey methods
The survey protocol was developed with technical support from and followed internation-
al recommendations developed by the WHO Global Task Force on TB Impact Measure-

19
Chapter 1: Introduction, methods and procedures
ment6 based on the experience from surveys conducted in Asian countries7. This was the
first population-based survey to be conducted in Nigeria.
1.4.1 Survey designThis is a cross-sectional population-based survey carried out between March and No-
vember 2012 in Nigeria.
1.4.2 Survey populationThe survey population was nationally-representative and comprised of all persons (males
and females) aged 15 years of age and older residing in Nigeria. Only members of the
household (permanent residents defined as those having slept in the household for 14
days or more) were invited to participate in survey operations. A household in this case
referred to a domestic unit consisting of members of a family who live together. The
household may include relatives or domestic staff.
Inclusion criteria for survey participants were as follows:
• All those who are permanent residents (slept in the household for 14 days or more)
in the household;
• Non-permanent residents (visitors) who had spent at-least two weeks in the house-
hold by the survey day;
• Aged 15 years and above; and
• Have provided informed consent.
In terms of exclusion criteria, individuals were excluded from the survey if they were aged
less than 15 years of age, institutionalized populations (e.g., prisoners), lived in hard-to-
reach areas or conflict zones, or were unable to provide informed consent or refuse to
participate.
At the time of protocol development, there no geographical zone or state was excluded from
the survey. However, during the field data collection, the two states of Borno and Yobe with
three clusters were not accessible by the survey team due to security challenges. The clus-
ters were replaced with three clusters of similar characteristics (socio-cultural, occupation
and religion) from neighbouring States of Bauchi (two) and Adamawa (one).
1.4.3 Screening methodThis survey adopted the recommended WHO screening strategy8. This method had the
advantage of limiting the number of individuals who were asked to submit sputum for
examination and culture. All eligible survey participants were taken through the following
6. See http://www.who.int/tb/advisory_bodies/impact_measurement_taskforce/en/7. WHO. Tuberculosis Prevalence Surveys: a handbook. Geneva: World Health Organization; 2011.8. WHO. Tuberculosis Prevalence Surveys: a handbook. Geneva: World Health Organization; 2011.

20
Report first national TB prevalence survey 2012, Nigeria
three levels of screening for active TB disease:
Symptomatic Screening:
All eligible persons were interviewed using a standardized questionnaire (See Annex 6) to
identify the presence of symptoms suggestive of pulmonary TB.
Radiological Screening:
Chest x-ray examination was performed on all eligible individuals to identify presence or
absence of radiographic abnormalities. A direct x-ray with computed radiography (CR)
was used, with x-ray images were read on-site by a trained medical officer. Pregnant
women were informed about the risk of radiation carried by a single chest X-ray expo-
sure, and those who agreed to be x-rayed received proper shielding by protective devices.
Any participants, including pregnant women, who declined an X-ray examination were
exempted from CXR but were asked to submit sputum whether symptomatic or not.
Bacteriological Screening:
Two sputum samples (one spot and one morning) were obtained from persons reporting
a cough greater than or equal to two weeks in duration or a chest x-ray examination that
showed any radiographic abnormalities suggestive of TB. The two sputum samples were
sent to one of three reference laboratories assigned to a survey cluster and stained for
AFB microscopy using ZN stain and both specimens were processed and cultured for
mycobacterium tuberculosis. Persons who had no cough ≥ 2 weeks or no radiological ab-
normality did not submit sputum for either AFB microscopy or culture and were assumed
to be free of active TB disease.
All those who declined or were exempted from X-ray examinations were classified as “TB
suspects” and asked to submit sputum samples when they had any symptom related to
TB, regardless of the symptom’s duration. This included, for example, a pregnant woman
declining CXR examination who had a cough for one week, or an elderly handicapped man
who could not afford to come to the CXR site for three days.
1.4.4 Sample size determinationThe survey was designed in 2010. In the absence of previous surveys to inform the sample
size determination, authors used TB burden estimates available from WHO’s Global TB
report 2009, and population estimates from the 2006 Nigeria census.
The estimated 2007 prevalence for smear-positive TB in Nigeria from the 2009 WHO
Global TB Report was 226/100,000. The 2006 Nigeria population census results esti-
mated that 57.8% of the population in Nigeria is aged 15 or above. There was an assump-
tion that the estimated prevalence of TB is expected to decline as a result of ongoing con-
trol programme interventions. Accordingly, authors assumed and applied a 4% reduction
a year according to the consensus (taken from expert committee opinion). By 2010, the
estimated prevalence for smear-positive TB was assumed to be 200/100,000 among the

21
Chapter 1: Introduction, methods and procedures
total population and 200/0.578=346/100,000 among those aged 15 or more.
The survey was designed to estimate TB prevalence with 20% precision within a 95%
confidence interval. Therefore, the calculation to determine the sample size N for the sur-
vey used the formulae presented below (for an individually-sampled survey).
N = z2 / µε2 = 1.962 / µε2
Where smear-positive TB prevalence (expressed as a proportion) was estimated µ =0.00346, its precision was chosen at 20% ε = 0.2, and the type I error of 5% translating
into a z = 1.96.
N = 1.962 / 0.00346 * (0.2)2 = 27,757
Authors therefore accounted for the cluster-sampling approach adopted for this survey,
as well as experience from other national surveys such as the National HIV/AIDS and
Reproductive Health Survey, the Behavioural Surveillance Survey and the integrated bi-
ological and behavioural survey. Authors assumed a design effect of 1.5 and a response
rate of 85%, bringing the sample size to 48,983 (= (27,757*1.5)/0.85). This was rounded
up to 49,000 individuals.
1.4.4.1 Sampling approachThe survey was designed to be nationally-representative including all States in the six
geopolitical zones of Nigeria. The 2006 national population census estimates the total
population as 140 million in 37 states, 774 local government areas, 4,464 districts, and
about 89,280 village areas. On average, a state had a population of 3.8 million, an LGA
about 188,000, 31,262 in a district, and about 1,568 persons in a village.
The Nigerian Population Commission had divided each Local Government Area into Enu-
meration Areas (EAs), each containing approximately equal numbers of people (600).
EAs constituted the building blocks of the survey clusters.
As described earlier, the eligible population for this survey is persons aged 15 and above,
representing about 57.8% of the population. The eligible population within each EA was
approximately 0.578 * 600 = 350 persons. It was agreed in this survey that the sampling
unit would be the Enumeration Areas and two EAs will constitute a cluster. Each cluster
consisted of a total of 700 eligible (49,000/70) individuals. A total of 70 clusters from
across the country were required to reach the target sample size (49,000/700).
In order to ensure that all parts of the country were involved in the survey, a multi-stage
sampling method was used:
• Step 1. The first stage stratified the country into six geopolitical zones, all of which

22
Report first national TB prevalence survey 2012, Nigeria
were included.
• Step 2. The 70 clusters were divided among the six geopolitical zones proportional to
the size of the population. This resulted in 18 clusters in the North West Zone; 10 in
the North Central Zone; nine in the North East Zone; 11 in the South-South Zone; eight
in the South East Zone; and 14 I the South West Zone (See Annex 5).
• Step 3. Direct population proportionate sampling (PPS) of LGAs in each zone was
carried out to ensure nationwide participation, support and at least one cluster in
each state, assuming that the TB situation within a zone is homogenous. The RAN-
DOM command in Excel was used to generate the list of selected LGAs as seen in
Annex 5.
• Step 4. In each LGA selected, the two serially adjoining EAs (e.g. 001 and 002; 003
and 004 etc.) were joined together to make one cluster. As the EA sizes are similar,
simple random sampling was applied to select the cluster EAs using the RANDOM
command in Excel.
• Step 5. The method was then applied at the enumeration area (EA) level.
In each selected EA, all eligible respondents were included in the survey. In a situation
where the population of eligible respondents was less than 650, a part of the next adjoin-
ing EA was included in the survey. In some areas, up to eight EAs constituted one cluster.
There was no situation where the population of eligible population exceeded 750.
Due to an unstable security situation, field operations could not take place in the two
States of Borno and Yobe. The two EAs in Borno were replaced by two additional EAs in
Adamawa and Gombe States that share similar characteristics with Borno, while the only
EA in Yobe was replace by adding one EA in Bauchi State with similar characteristics.
1.4.5 Basic survey elementsData collection took place in the community. In advance of the visit by the survey teams,
the team, in conjunction with the authorities in the community and the local government,
identified areas where the team would work. Preference was given to health facilities;
where this was not available, community halls, school or other buildings provided by the
community were used.

23
Chapter 1: Introduction, methods and procedures
Figure 1.3Sampled clusters for Nigeria TB prevalence survey
1.4.6 Case definitionsFor the purpose of the prevalence survey, a person was defined as a pulmonary TB case
if he or she was:
• Enrolled in the survey;
• Identified as having symptoms suggestive of TB and/or an abnormal chest x-ray; and
• Bacteriologically- confirmed (smear-positive and/or culture positive) as having My-
cobacterium tuberculosis.
Persons who were identified as undergoing TB treatment, but were not identified follow-
ing the algorithm of selection for this survey (do not have cough ≥ 2 weeks OR have a
normal chest x-ray) were not considered TB cases in this survey.
Identified TB cases were further classified according to the NTP definitions as follows:
• New case: patient has never had TB treatment or has taken anti-TB medications for
< 1 month.
• Case on treatment: patient is presently undergoing treatment with anti-TB drugs.
Selected survey clusters for the national TB prevelance survey by zone

24
Report first national TB prevalence survey 2012, Nigeria
• Relapse case: patient who was previously declared cured or who completed treat-
ment but who had a new episode of bacteriologically-confirmed TB.
• Default case: patient who interrupted treatment of ≥ 2 months after ≥ 1 month of
treatment.
• Failure case: patient who was bacteriologically-positive after ≥ 5 months of treatment.
• Undetected (unknown) case: patient who was diagnosed as TB by the survey for the
first time.
The case definitions above are not mutually exclusive. For example, an undetected case
could be a new case or a relapse case.
1.5 Survey organization
The survey included several organizational units: the survey management committee, the
technical committee (which includes five workgroups), the survey coordinator, and the
central and field operations centres. These latter two each consist of the laboratory, chest
x-ray, data management, and logistics/administrative sub-units. Each field unit (zone) has
one team headed by a team leader.
1.5.1 Survey Management Committee The Survey Management Committee (SMC) had the primary role of coordination and
management of the survey. It was chaired by the Director of Public Health in the Federal
Ministry of Health, and consisted of FMOH, WHO, USAID, CDC and partners. It facil-
itated government political support; created the enabling environment for stakeholder
support; coordinated all resources required for effective implementation of the survey at
all levels; and ensured effective monitoring and evaluation of the survey.
1.5.2 Technical CommitteeThe Technical Committee reported to the SMC and had overall responsibility for the tech-
nical component of the survey. This included the development of the protocol; provision of
technical support for field implementation; formulation of standard operating procedures,
trainings, pilot-testing, logistics, ACSM; report preparation; and the dissemination of sur-
vey findings through international conferences and scientific manuscripts.
1.5.3 Principal Investigator The National Co-ordinator NTBLCP was the Principal Investigator, responsible for the
management and leadership of the survey process and also for leading advocacy visits to
state governments and other local stakeholders to secure political support and additional
support for the survey.
1.5.4 Survey CoordinatorThe Survey Coordinator was responsible for facilitating the technical component of the
survey through the technical committee whose activities he reports directly to the SMC.

25
Chapter 1: Introduction, methods and procedures
In addition, he was responsible for contributing to the preparation of SOPs and the field
manual; arranging training and pilot testing; planning of fieldwork; supervising data man-
agement; preparing monitoring reports; ensuring proper budgetary allocation to all survey
activities; and for reporting any problems with the survey to the SMC. The Survey Coor-
dinator operated as the key liaison person between the operating units (central and field)
and the SMC throughout the survey, and was responsible for the day-to-day running of
the survey process.
1.5.5 Central unitAll components of the central unit reported directly to the Survey Coordinator. The com-
ponents were responsible for monitoring field activities through routine visits to the field.
1.5.6 Central laboratoryThree central laboratories (Lagos NMIR, Zaria NTBLTC and Zankli Medical centre) were
responsible for processing and performing smear microscopy and culture on all speci-
mens collected. The central laboratories were also responsible for maintaining internal
quality controls (quality and quantity of specimen, labelling, storage, processing, reading
and grading of results) and external quality assurance was provided by a supranational
reference laboratory (SRL) based in Milan.
1.5.7 Central chest x-ray unit The central chest x-ray unit was responsible for detailed interpretation of all X-ray imag-
es and classification of abnormalities as mentioned in the SOPs. It was also responsible
for assessing quality assurance, on-site training, retrospective interpretation and for con-
ducting field supervision to ensure adherence to SOPs.
1.5.8 Central data management unitThe Central Data Management Unit, based in the survey secretariat in the national TB
programme office, served as the central warehouse for all data collected from the survey.
The central data manager was responsible for preparing information systems to capture
the data; for the validation of double-entered data files; and for the routine checking of
validated data files for systematic errors (cleaning).
1.5.9 Field teams The components of the central unit described above were also reflected in the field unit,
responsible for implementation of field activities as stipulated in the survey protocol.
There were six teams trained for field data collection.
The composition of the field teams was (see Table 1.1 and Table 1.2):

26
Report first national TB prevalence survey 2012, Nigeria
Table 1.1
Fixed field team members
Table 1.2
Co-opted local members
1.6 Training requirements
All the central team members were trained prior to commencement of the field data col-
lection. The following trainings were carried out:
• A five day training of all survey teams covered protocol and SOP issues, including
introduction and testing of the survey instruments;
• A five day training and field testing of the radiology sub-group (Radiographers and
Medical Officers) on the use of digital x-ray and reading; two days were dedicated to
field testing in two communities;
• Three trainings of five days each in order to acquaint data managers with the survey
instruments, database and recording and reporting procedures;
• Two trainings organized for the laboratory staff on sputum handling, recording and
reporting and processing of sputum samples; and
• As a result of the delay in the start of the survey, refresher training was organized for
each of the groups one month prior to the commencement of the field data collection.
Designation Number Role
Team Leader 1 Overall supervision
Medical Officer 1 Reading of x-ray
Data Manager 1 Field data management
Interviewers 3 Interviewing respondents
Radiographers 2 X-raying respondents
Receptionist 1 Documentation and maintaining order
Laboratory Assistant 1 Sputum sample management
Total 10
Designation Number Role
State TBL Control Officer 1 Advocacy, mobilization, etc.
LGA TBLS 1 Mobilization, registration and follow-up of suspect TB cases, etc.
Local translators 1 Interpretation and translation
Security men 2 Security of equipment and maintaining order
Representatives of local authorities
2 Mobilization
Receptionist 1 Documentation and maintaining order
Laboratory Assistant 1 Sputum sample management
Total 9

27
Chapter 1: Introduction, methods and procedures
1.7 Pilot testing
After finalization of the survey protocol, the SOPs and the training plan for field staff, a
piloting of the entire survey process was carried out in two clusters - one urban, one rural.
One of these was in central Nigeria in a village in Kontagora LGA of Niger State (rural) and
the other in Ondo-South town of Ondo South LGA (urban). The main aim was to check
the clarity of the entire set of tools for data collection; to assess the feasibility of time
allocated for collection of data from each cluster; and to test the logistic arrangements in
the field especially sputum transportation. This experience informed certain adjustments
in the tools and logistic plan.
1.8 Survey procedures
1.8.1 Procedures before field surveyThe survey management committee selected 70 clusters for the survey according to the
protocol. One or two weeks prior to the survey in a particular cluster, the Survey Team
Leader together with the State TB and Leprosy Control Officer (STBLCO), the designated
National Population Commission (NPC) Technical Officer and the Local Government TB
and Leprosy Supervisor (TBLS) visited the LGA where the cluster is located.
Local government officials, local community authorities and religious leaders were ap-
proached to facilitate their support and cooperation in the execution of the survey. With
their input, the eligible areas for the survey were confirmed based upon the population
size of the selected cluster area and operational feasibility, including security situations.
The community and local government level advocacy kits were given to the appropriate
persons.
In a few instances, clusters with security challenges or difficult terrains were replaced,
usually with a new cluster in the same LGA. The decision to replace the cluster was usually
communicated to the survey coordinator before the replacement was done.
Enumeration of the cluster area was carried out by three NPC staff with assistance from the
local government TBLS and four community volunteers. The enumeration process took one
week and was carried out one or two weeks prior to the actual survey in the cluster.
The enumeration team pasted the building number of houses on the gate or wall of the
building. Household numbers were pasted on the doors of individual households.
The survey team leader revisited the enumeration team midway into the enumeration
exercise to ascertain that enumeration is going on smoothly and according to the survey
protocol.

28
Report first national TB prevalence survey 2012, Nigeria
1.8.2 Field survey proceduresField operations in a cluster were completed in one week (see Table 1.3). The field oper-
ations in some clusters lasted well into the night to allow farmers and workers to partic-
ipate in the survey. In some urban clusters, screening of participants was carried out on
Saturdays to enable civil servants to participate.
Table 1.3Field Operation Schedule
1.8.2.1 Census-takingUpon arrival in the survey cluster, the enumeration team handed over the household regis-
ter, interim list of eligible participants and relevant cluster map to the survey team leader.
The enumeration team also conducted the survey team leader round the enumerated areas.
The survey team members then entered the survey number (e.g. XX-###-OO signifies:
cluster number-house hold number-individual number) into the survey number column
of the household register. Every household member, irrespective of the age, was allocated
a survey number.
Invitation letters were written for each eligible participant and given personally to them.
The letters contained the survey number, day, venue and time that participants are to
attend the survey. If an eligible participant was absent, the survey team repeated a visit
to the particular household to deliver the invitation letter. In special circumstances, the
survey team allowed household members to receive an invitation letter by proxy for other
family members. Eligible participants were educated about the survey as they were given
the invitation letters.
During the distribution of invitation letters, newcomers staying more than two weeks
were added to the household register. Household members who were omitted during the
enumeration exercise were also added to the household register. Household members
who would not be available for the survey or who had died were omitted. The survey team
then calculated the total eligible population, omitting those persons less than 15 years
(defined as non-eligible).
Day
1st Sun Arrival and setting up with local collaborators, census taking and distribution of invitation letter.
2nd Mon Screening 1 and distribution of invitation.
3rd Tue Screening 2, distribution of invitation and mop-up of non-attendees
4th Wed Screening 3, distribution of invitation, mop-up of non-attendees and shipment of sputum samples 1.
5th Thu Screening 4, distribution of invitation and mop-up of non-attendees
6th Fri Screening 5, distribution of invitation and mop-up of non-attendees
7th Sat Shipment of sputum samples 2, and movement to next cluster

29
Chapter 1: Introduction, methods and procedures
1.8.2.2 Interview at survey examination siteEligible individuals, with their invitation letters, were welcomed to the survey venue by
the receptionist. The receptionist collected the invitation letters from the participants and
confirmed their eligibility by checking with the cluster household register. If the partic-
ipant’s name was found in the register, the name in the register was ticked and appro-
priate sections of the registers completed. Written consent for participation was read
and explained to the participant in the language that she/he understands or prefers. The
participant signed the consent form if she/he agrees to participate in the survey. Those
who cannot sign were provided with an inkpad to make a thumbprint on the form. After
the consent form had been signed, a member of the survey team took the participant to
any of the available interviewers for interview.
An interviewer then opened an Individual Survey Card for the participant and completed
the card in line with the protocol. Information recorded in the card included: participant’s
survey number, name of participant, date of interview, sex, age, occupation, level of edu-
cation, religion, marital status, past history of TB, TB symptoms, health-seeking behaviour
regarding symptoms of TB, TB treatment history and tobacco smoking history. The inter-
viewer also recorded the height and body weight of the participant. After the interviewer
had finished collecting the required information from the participant, a member of the
survey team takes the participant, along with the survey card, for CXR examination. All
interviewed participants, except those exempted or who refused to participate, undergo
CXR examinations. The findings of the CXR were recorded on the card by the Medical Of-
ficer who reads the CXR. Those identified as TB suspects from the interview and/or CXR
were referred for sputum examination.
Follow-up visits were conducted for eligible subjects who failed to come to the survey
site. They were asked again to attend the screening exercise. The follow-up visits con-
tinued until the end of the survey in the cluster. Those who refused to participate in the
survey were noted in the household register and were not visited again. For the elderly and
physically challenged, transportation was provided to facilitate their participation. When
participants presenting with symptoms could not afford to travel from home, interview
and sputum collection were conducted with their consent inside their homes.
1.8.2.3 Chest x-ray (CXR) examinationChest x-rays were carried out using portable mobile x-ray units (MinXray) provided to
each team. This is a computed radiography system (CR) equipped for digital images. Pow-
er supply was assured by the provision of one mobile power generating set for each team.
After verifying documentation and receiving consent for the procedure, the x-ray tech-
nicians on the team conducted and processed all x-rays using the mobile x-ray unit. The
technicians transferred the processed image on a cartridge to a scanner which is con-
nected to a computer. The scanner scanned the image and projected it to a computer.
The X-ray image on the computer screen is immediately read by a medical officer trained

30
Report first national TB prevalence survey 2012, Nigeria
on radiographic interpretation prior to the commencement of the survey, in order to de-
termine the presence or absence of any abnormalities. All x-rays were backed up onto
CD-ROMs daily.
A CXR shadow eligible for sputum collection was defined as any abnormal shadow in
the lung field and mediastinum, or pleural effusion except pleural thickness or small sin-
gle calcification. Those with serious disease were advised by the team leader to visit an
appropriate medical facility for further follow-up in collaboration with the local health
authority.
All x-ray images (saved on CD ROMs) and documentation were transferred to the cen-
tral x-ray unit for validation (presence/absence of abnormalities), detailed interpretation
and storage. During the survey, regular field level supervision of the radiographic team
was made by the central x-ray team to ensure compliance with the SOPs as mentioned
in a separate document (radiology reference guide). Retrospective analysis in cases of
bacteriological-radiological discrepancy was carried out by the radiologist and the chest
physician. In case of non-consensus, a third opinion from a neutral expert was sought.
1.8.2.4 Sputum collection, storage and shipmentTwo sputum specimens (spot and early morning) were collected from each subject eligi-
ble for sputum based on either symptoms or CXR screening, or from those exempted from
CXR examination irrespective of their symptoms. Submitted specimens were immediate-
ly placed in a cooler, where they were kept until they reached the designated processing
centre. The identification number of the specimen and other necessary information were
recorded in the sputum smear examination forms (Form 08a).
A survey team member and a community volunteer made home visits to trace partici-
pants who submitted a spot sputum specimen but failed to submit a morning sputum
specimen.
The sputum specimens and sputum smear examination forms were shipped to the des-
ignated culture centre on Wednesday and Saturday of each week. The specimens were
shipped by either road or air depending on the distance from the survey site to the culture
centre. A courier company was contracted to ship the specimens.
1.9 Security during field operations
Security during field operations was ensured through the involvement of local govern-
ment and community authorities in the enumeration and screening processes. Communi-
ty members were also co-opted as community volunteers during the processes. In a few
instances, the police were informed of the survey activity in an area and their support so-
licited. Although at the planning stage of the prevalence survey there was no state where
health service and disease control activities were suspended, security challenges in Borno

31
Chapter 1: Introduction, methods and procedures
and Yobe States were high resulting in the cancellation of survey activities in these States.
However, the Survey Management Committee agreed that the survey be carried out in
LGAs in neighbouring States bordering these States.
1.10 Ethical considerations
This survey adhered to the general conduct of ethical biomedical studies as defined by the
World Medical Association (WMA) Declaration of Helsinki 2000 and revised in 2007.
Ethical clearance was obtained from the Nigerian National Research Ethical Review Com-
mittee of the Nigerian Federal Government. To ensure that the survey met all ethical
standards, WHO and CDC were involved in all steps of protocol development and survey
implementation.
During the enrolment of respondents, information was provided to respondents about the
survey’s purpose; implementation strategy; possible side effects (if any); confidentiality;
opportunity of the respondent to ask questions; benefits to the respondent; the commu-
nity and the nation; as well as assurance that the respondent participation was voluntary
and that refusal would not affect any potential benefit accrued to the respondent.
Only respondents who gave informed written consent based on the above information
were enrolled for the survey. For those who were not literate, the content of the consent
form was translated verbally to them in their local dialect. If/and when consent was given,
a thumb print was obtained from the respondent in the presence of a witness.
As the data collected are of a sensitive nature and linked to patients, all data were kept
in a secured and confidential manner. Training related to patient and data confidentiality
was given to all staff during pre-survey training and mid-term review. During aggregated
analysis, patient identifiers (i.e. name) were removed.
Paper records were kept in a secured room in the survey secretariat. Electronic records
were stored in a password-protected database.
During the course of the survey, any person identified as having TB was immediately en-
rolled in the national TB programme for treatment as per national guidelines.
If during the course of the survey respondents showed symptoms of extra-pulmonary
TB or other pulmonary conditions, they were referred to the national TB programme for
appropriate services for diagnosis and management. In addition, respondents with an ur-
gent medical need (e.g., pneumothorax) were immediately referred for emergency med-
ical care.

32
Report first national TB prevalence survey 2012, Nigeria
Description of the survey data
chapter 2

33
Chapter 2: Description of the survey data
2.1 Summary of survey data flow
The field operations for the Nigeria TB prevalence survey ran from February to Novem-
ber 2012, covering 70 clusters. A total of 113,247 persons were enumerated out of which
77,797 (68.7%) persons were eligible to participate in the survey; 44,186 (56.8%) were
screened. Of the 44,186 screened, 43,198 (97.8%) were interviewed and had chest x-rays
taken, while 987 (2.2%) had interviews only. Of the two screening methods, a total of
4,688 (10.6%) individuals were eligible for sputum examinations.
The remaining 33,511 individuals did not participate. Of these, 32,617 were not pres-
ent; 1,528 consented but were not interviewed; and 12 persons had no consent forms.
Non-participants were recorded.
Note: 35,450 (34,947 children and 503 adult non-residents) were ineligible for inclusion
in the survey (see the consort diagram Figure 2.1).
2.2 Age-sex distribution of enumerated, eligible and ineligible populations
The enumerated from survey census, eligible, and ineligible populations overall and bro-
ken down by sex, age group and geopolitical zone are presented in Table 2.1. Looking at the
table, there were more females (51.9%) enumerated than males (48.1%). 70% of females
were eligible, compared to 66.5% of men. The percentages of non-eligible who are age 15
years or less are 30.9% of those enumerated. This is lower than expected when compared
to the national figure (45% of the general population being less than 15 years as reported
in the 2006 National Population figures). Among those enumerated who are above 15
years of age, only 0.4% were ineligible for the survey.
In terms of zonal distribution, the North-West zone had the highest number of enumer-
ated individuals eligible for the survey, while the South-East zone had a lowest. This ap-
pears to reflect the population distribution of the country as indicated in the 2006 census.

34
Report first national TB prevalence survey 2012, Nigeria
Figure 2.1Consort diagram of the National TB prevalence survey, Nigeria 2012
Individuals enumerated in census113,247
Eligible study population77,797 (68.7%)
Eligible for sputum examinations4,688 (10.6%)
Submitted at least one specimen4,558 (97.2%)
Submitted both specimens4,133 (88.1%)
Any smear positive:184
Morning S+ only: 48Spot S+ only: 49
Both S+: 87
Culture result:any MTB+: 75both MOTT+: 3
both Negative: 28Contaminated/MOTT/Not done: 78
S+ case: 107S+ C+ TB case: 75 (definite)S+ C- TB case: 32 (probable)
Not smear positive:3,532
Morning S- & Spot S-: 3,085Morning S- only: 83Spot S- only: 364
Culture result:any MTB+: 49both MOTT+: 8
both Negative: 1119Contaminated/MOTT/Not done: 2356
C+ S- case: 37S- C+ TB case: 35 (definite)S- C+ TB case: 2 (probable)
Participants 44,186 (56.8%)Interview and CXR 43,198 (97.8%)
Interview only 987 (2.2%)
Laboratory results available: 3,716 (79.2% of Eligible)
(2 Smear 2 Culture results: N= 1,747*, 42.0%)*136 spot specimens not collected
*551 morning specimens not collected
Ineligible individuals:34,947 (30.9%) Children
503 (0.4%) Adult due to residential criteria
Symptom + CXR + 746 (15.9%) Symptom + CXR - 1720 (36.7%)Symptom - CXR + 2222 (47.4%)
- 87 people had a sample taken, despite having not been screened as eligible for
sputum examination
Central panel

35
Chapter 2: Description of the survey data
Table 2.1Enumerated, eligible and non-eligible population: overall, and broken down by sex, age group and geopolitical zone
The age and sex distribution of the population from survey census and eligible survey
individuals are very similar (Figure 2.2), suggesting that no sampling bias has been intro-
duced during this step of identifying the eligible survey population.
Figure 2.2Comparison of age and sex distribution of the census and eligible survey populations
Eligible %Non-eligible aged >= 15
%Non-eligible aged < 15
%All
enumerated
Total 77,797 68.7% 503 0.4% 34,947 30.9% 113,247
SexMale 36,176 66.5% 292 0.5% 17,934 33.0% 54,402
Female 41,621 70.7% 211 0.4% 17,013 28.9% 58,845
Age (years)
Unknown (<15) 0
0-4 12,740 100.0% 12,740
5-9 12,774 100.0% 12,774
10-14 9,433 100.0% 9,433
15-24 23,978 99.2% 184 0.8% 24,162
25-34 20,335 99.4% 132 0.6% 20,467
35-44 13,324 99.5% 68 0.5% 13,392
45-54 9,176 99.5% 49 0.5% 9,225
55-64 5,548 99.3% 40 0.7% 5,588
65+ 5,436 99.5% 30 0.5% 5,466
Unknown (>=15) 0 0
Zones
North Central 10,681 65.3% 14 0.1% 5,660 34.6% 16,355
North East 8,699 58.7% 327 2.2% 5,794 39.1% 14,820
North West 21,198 63.3% 38 0.1% 12,232 36.5% 33,468
South East 7,418 73.2% 34 0.3% 2,679 26.4% 10,131
South South 12,559 79.6% 31 0.2% 3,179 20.2% 15,769
South West 17,242 75.9% 59 0.3% 5,403 23.8% 22,704
-20
Census Eligible
-10 0 10 20
Age
gro
up
Percent
Male Female+65
55–64
45–54
35–44
25–34
15–24

36
Report first national TB prevalence survey 2012, Nigeria
2.3 Survey participation
The age and sex distributions of the eligible and survey participant populations show
some differences, particularly in the older female and younger male categories (Figure
2.3). This means that the population of those individuals who participated in the survey
differs from the targeted eligible population. Weighted analyses were necessary to ac-
count for this sampling bias.
Figure 2.3Comparison of age and sex distribution of the eligible and participant survey populations
2.4 Overall survey participation
Although fewer males than females were eligible across all the age groups, Figure 2.3
above shows lower male participation especially in the age groups of 15-54 (active age
group). Participation appears to be narrowing only in the age group 64 and above. This is
further illustrated in the graph below.
Details on the age and sex distribution of participants interviewed are presented in Table 2.2.
Table 2.2Participation by screening tool, evaluable participants that were interviewed
-20
Eligible Participants
-10 0 10 20
Age
gro
up
Percent
Male Female+65
55–64
45–54
35–44
25–34
15–24
Eligible Participants %Non-
Participants% Interviewed %
Total 77,797 44,186 56.8% 33,611 43.2% 43,439 98%
Male
15-24 11,525 5,607 48.7% 5,918 51.3% 5,385 96%
25-34 8,964 4,182 46.7% 4,782 53.3% 3,997 96%
35-44 6,159 2,828 45.9% 3,331 54.1% 2,703 96%
45-54 4,341 2,273 52.4% 2,068 47.6% 2,169 95%
55-64 2,581 1,565 60.6% 1,016 39.4% 1,489 95%
65+ 2,606 1,723 66.1% 883 33.9% 1,677 97%

37
Chapter 2: Description of the survey data
Table 2.3 presents the age and sex distribution of 43,199 (97.8%) survey participants that
had chest x-ray examinations.
Table 2.3Age and sex distribution of individuals evaluated by chest x-ray
Cluster summary of interview and CXR screening is illustrated in Annex 7.
2.4.1 OccupationAll participants in the survey were interviewed using a structured questionnaire that cov-
ered basic demographic data including occupation. The most common occupations of
the participants consisted of husband/housewife (17.6%), traders (17.8%) and students
19%). Least frequent among them were the occupations of health worker (0.9%), con-
struction worker (0.7%) and transport worker (1.1%). Details can be seen in Table 2.4.
Female
15-24 12,453 6,747 54.2% 5,706 45.8% 6,779 100%
25-34 11,371 6,802 59.8% 4,569 40.2% 6,794 100%
35-44 7,165 4,685 65.4% 2,480 34.6% 4,677 100%
45-54 4,835 3,434 71.0% 1,401 29.0% 3,426 100%
55-64 2,967 2,246 75.7% 721 24.3% 2,239 100%
65+ 2,830 2,094 74.0% 736 26.0% 2,104 100%
Eligible Participants %Non-
Participants% Interviewed %
Total 77,797 44,186 56.8% 33,611 43.2% 43,199 97.8%
Male
15-24 11,525 5,607 48.7% 5,918 51.3% 5,516 98.4%
25-34 8,964 4,182 46.7% 4,782 53.3% 4,127 98.7%
35-44 6,159 2,828 45.9% 3,331 54.1% 2,803 99.1%
45-54 4,341 2,273 52.4% 2,068 47.6% 2,257 99.3%
55-64 2,581 1,565 60.6% 1,016 39.4% 1,554 99.3%
65+ 2,606 1,723 66.1% 883 33.9% 1,717 99.7%
Female
15-24 12,453 6,747 54.2% 5,706 45.8% 6,440 95.4%
25-34 11,371 6,802 59.8% 4,569 40.2% 6,488 95.4%
35-44 7,165 4,685 65.4% 2,480 34.6% 4,569 97.5%
45-54 4,835 3,434 71.0% 1,401 29.0% 3,408 99.2%
55-64 2,967 2,246 75.7% 721 24.3% 2,237 99.6%
65+ 2,830 2,094 74.0% 736 26.0% 2,083 99.5%
Table 2.2 - continued

38
Report first national TB prevalence survey 2012, Nigeria
Table 2.4Occupation of participants
2.4.2 Educational level of survey participantsThe participants’ questionnaire also asked about the highest level of education attained
(Table 2.5). This was to see whether this may have any influence on what participants’
responses if they have symptoms suggestive of TB. In this case, 22.9% of participants
had no formal education; 13.5% non-formal/Koranic; 20.5% primary education; 19.5%
completing senior secondary school; 11.8% junior secondary; and 11.8% post-secondary
education. In general, males seemed to have higher levels of education than females.
Table 2.5Highest education level of survey participants
2.4.3 History of TB among participantsThe majority of the participants reported no history of TB. A total of 82 participants
(0.2%) reported to being on TB treatment at the time of survey; out of these, 37 were
males and 45 females. Most of them (39) were from urban areas (Table 2.6).
Male % Female % Total %
Construction worker 287 1.6% 35 0.1% 322 0.7%
Admin worker 1,459 8.0% 960 3.7% 2419 5.5%
Healthcare worker 117 0.6% 279 1.1% 396 0.9%
Transport worker 682 3.8% 32 0.1% 714 1.6%
Business 1,291 7.1% 1,496 5.8% 2787 6.3%
Farmer 4,130 22.7% 2,414 9.3% 6544 14.8%
Trader 1,250 6.9% 6,598 25.4% 7848 17.8%
Housewife/husband 253 1.4% 7,514 28.9% 7767 17.6%
Artisan 2,290 12.6% 1,666 6.4% 3956 9.0%
Student 4,858 26.7% 3,643 14.0% 8501 19.2%
Other 1,561 8.6% 1,371 5.3% 2932 6.6%
Total 18178 26008 44186
Male % Female % Total %
None 2,380 13.1% 7,756 29.8% 10136 22.9%
Non-formal/Koranic 2,238 12.3% 3,708 14.3% 5946 13.5%
Primary 3,783 20.8% 5,285 20.3% 9068 20.5%
JSS 3 completed 2,494 13.7% 2,720 10.5% 5214 11.8%
SSS 3 completed 4,227 23.3% 4,386 16.9% 8613 19.5%
Post-secondary 3,053 16.8% 2,151 8.3% 5204 11.8%
Don't know 3 0.0% 2 0.0% 5 0.0%
Total 18,178 26,008 44,186

39
Chapter 2: Description of the survey data
Table 2.6Participants on treatment for TB at time of survey
In terms of treatment for TB (Table 2.7), the majority of those on treatment received treat-
ment in government health facilities such as health centre/PHC (43.2%) and general hos-
pitals (35.1%). Fewer received treatment in private hospitals (5.4%), university teaching
hospitals (5.4%), traditional healers (5.4%), mission hospitals 2.7%, or others (2.7%).
Table 2.7Health-seeking behaviour of participants on TB treatment
552 (1.2%) of the respondents reported having had TB treatment in the past; out of these
281 were male and 271 female. The majority (303) were from urban areas, with 212 from
rural and 37 from semi-urban areas.
48.6% of the respondents reported seeking treatment in general hospital; 22.4% in health
centres/PHC; 11.2% in teaching hospitals; and 10.1% in private hospitals. Only one indi-
vidual reported seeking treatment at the chemist.
Rural % Semi-urban % Urban %
34 0.2% 9 0.4% 39 0.2%
18,894 99.8% 2,452 99.6% 22,758 99.8%
Total 18,928 2,461 22,797
All % Male % Female %
Yes 82 0.2% 37 0.2% 45 0.2%
No 44,104 99.8% 18,178 99.8% 25,963 99.8%
Total 44,186 18,215 26,008
All % Male % Female % Rural %Semi-urban
% Urban %
Health centre/PHC
22 26.8% 10 31.3% 12 27.9% 5 16.1% 1 14.3% 16 43.2%
Private hospital
8 9.8% 3 9.4% 5 11.6% 6 19.4% 0 0.0% 2 5.4%
Traditional centre
4 4.9% 3 9.4% 1 2.3% 2 6.5% 0 0.0% 2 5.4%
Chemist 0 0.0% 0 0.0% 0 0.0% 0 0.0% 0 0.0% 0 0.0%
General hospital
30 36.6% 12 37.5% 18 41.9% 13 41.9% 4 57.1% 13 35.1%
Teaching hospital
4 4.9% 2 6.3% 2 4.7% 0 0.0% 2 28.6% 2 5.4%
Mission hospital
5 6.1% 2 6.3% 3 7.0% 4 12.9% 0 0.0% 1 2.7%
Other 2 2.4% 0 0.0% 2 4.7% 1 3.2% 0 0.0% 1 2.7%
Missing 7 8.5% 0 0.0% 0 0.0% 0 0.0% 0 0.0% 0 0.0%
Total 82 32 43 31 7 37

40
Report first national TB prevalence survey 2012, Nigeria
Table 2.8Participants’ previous TB treatment status
2.5 Field screening
2.5.1 TB-related symptomsAll eligible participants were interviewed about TB-related symptoms over the past
month (Table 2.9). 11% of respondents reported a cough (cough of 1-13 days 6.1%, 14-30
days 6.1% and >30 days 2.2%). 0.7% of participants had haemoptysis. According to the
protocol, only those who had had a cough for two weeks or more (2,479 participants, or
5.6% were eligible to submit a sputum sample.
Previous Treatment History
All % Male % Female % Rural %Semi-urban
% Urban %
Yes 552 1.2% 281 1.5% 271 1.0% 212 1.1% 37 1.5% 303 1.3%
No 43,634 98.8% 17,897 98.5% 25,737 99.0% 18,716 98.9% 2,424 98.5% 22,494 98.7%
Total 44,186 18,178 26,008 18,928 2,461 22,797
Place of Previous Treatment
All % Male % Female % Rural %Semi-urban
% Urban %
Health centre/PHC
93 17.9% 46 17.4% 47 18.4% 21 10.6% 8 22.9% 64 22.4%
Private hospital
58 11.2% 30 11.4% 28 11.0% 28 14.1% 1 2.9% 29 10.1%
Traditional centre
6 1.2% 2 0.8% 4 1.6% 4 2.0% 0 0.0% 2 0.7%
Chemist 4 0.8% 2 0.8% 2 0.8% 3 1.5% 0 0.0% 1 0.3%
General hospital
257 49.5% 122 46.2% 135 52.9% 94 47.5% 24 68.6% 139 48.6%
Teaching hospital
54 10.4% 37 14.0% 17 6.7% 20 10.1% 2 5.7% 32 11.2%
Mission hospital
36 6.9% 17 6.4% 19 7.5% 21 10.6% 0 0.0% 15 5.2%
Other 11 2.1% 8 3.0% 3 1.2% 7 3.5% 0 0.0% 4 1.4%
Total 519 264 255 198 35 286

41
Chapter 2: Description of the survey data
Table 2.9Results of screening interview: TB-related symptoms
2.5.2 Chest x-ray examinationsA total of 43,186 (98%) of the 43,199 participants had chest x-rays (CXR) examination
(see detail in Table 2.10). Those 987 participants who did not take CXR consisted of preg-
nant women, older people who could not walk to the centres and, in some cases, those
who were unable to participate due to faulty CXR machines. Of those who received CXR,
2,968 (6.9%) were eligible for sputum examination due to abnormal findings. Slightly
more males (7.5%) than females (6.4%) had abnormal findings on CXR. Additionally, the
age groups 55-64 and above 65 showed more abnormalities on CXR than did the younger
age groups.
Table 2.10Chest x-ray field screening results
N %
1. Cough 5152 11.7%
1-13 days 2679 6.1%
14-30 days 1492 3.4%
31 + days 981 2.2%
2. Sputum 3551 8.0%
3. Haemoptysis 288 0.7%
4. Chest pain 6813 15.4%
5. Body weight loss 3553 8.0%
6. Fever 8493 19.2%
Any symptom (1-6) 15812 35.8%
Eligible for sputum exam by interview 2473 5.6%
No symptoms 28374 64.2%
Total 44186
(Normal) (Abnormal)
CXR not taken
CXR taken
Non-eligible for sputum
(%)Eligible for
sputum(%)
Total 987 43,199 40,229 93.1% 2,968 6.9%
Male
204 17,974 16,619 92.5% 1,355 7.5%
15-24 91 5,516 5,422 98.3% 94 1.7%
25-34 55 4,127 3,952 95.8% 175 4.2%
35-44 25 2,803 2,605 92.9% 198 7.1%
45-54 16 2,257 1,982 87.8% 275 12.2%
55-64 11 1,554 1,325 85.3% 229 14.7%
65+ 6 1,717 1,333 77.6% 384 22.4%

42
Report first national TB prevalence survey 2012, Nigeria
2.6 Field screening summary
As indicated in the table below, a total of 4,688 individuals (10.6%) were eligible for spu-
tum examination by either symptoms or CXR. 746 (15.9%) were eligible by both CXR and
interview, while 2222 (47.4%) were eligible by CXR only and 1720 (36.7%) by symptoms
only (Table 2.11).
Table 2.11Summary results of screening: reasons of eligibility for sputum examinations
*eligibility for sputum examination
2.7 Laboratory examinations
In accordance with the survey protocol, the 4,688 participants considered eligible for the
sputum examinations were asked to submit two sputum specimens (spot and early morn-
ing). 4558 participants (97%) submitted at least one sputum specimen, and 4,133 (88%)
submitted both (Table 2.12).
Female
783 25,225 23,610 93.6% 1,613 6.4%
15-24 307 6,440 6,303 97.9% 135 2.1%
25-34 314 6,488 6,269 96.6% 219 3.4%
35-44 116 4,569 4,328 94.7% 241 5.3%
45-54 26 3,408 3,095 90.8% 313 9.2%
55-64 9 2,237 1,946 87.0% 291 13.0%
65+ 11 2,083 1,669 80.1% 414 19.9%
Zone
North Central 37 5,973 5,355 89.7% 618 10.3%
North East 485 6,002 5,741 95.7% 261 4.3%
North West 334 11,454 10,616 92.7% 838 7.3%
South East 38 3,781 3,644 96.4% 137 3.6%
South South 37 6,678 6,271 93.9% 407 6.1%
South West 56 9,311 8,602 92.4% 707 7.6%
INTERvIEw (SyMPToMS)
Eligible Not Eligible Total
CXREligible* 746 2,222 2,968
Not Eligible 1,720 39,498 41,218
Total 2,466 41,720 44,186
Table 2.10 - continued

43
Chapter 2: Description of the survey data
Table 2.12Summary results of sputum specimen collection from the field
2.7.1 Sputum collection and availability of resultsThe table below summarizes the results for smear microscopy. The protocol established
that two samples (spot and early morning) should be collected and examined for each
participant. In practice, some participants had only one sputum result due to issues such
as failing to submit samples, lost specimens due to spillage, or broken slides. Accordingly,
only 3,252 (69.4%) of 4,688 participants eligible for sputum examination had both spot
and morning sputum smear results available. With respect to individual specimen smear
results, 3,629 (77.4% of eligible) spot results were obtained; of these, 3,493 were nega-
tive and 136 smear-positive. For early morning samples, 3,339 (71.2% of eligible) results
were obtained; of these, 3,204 were smear-negative and 135 smear-positive. See Tables
2.13 and 2.14 for the relationship between spot and morning sputum smear results, disag-
gregated by sex and age.
Table 2.13Relationship between spot and morning sputum smear results
“Not available” category includes specimen not collected, smear not carried out, or smear results not available
MoRNINg
Collected Not collected Total
SPoTCollected 4,133 420 4,553
Not collected 5 130 135
Total 4,138 550 4,688
MoRNINg
Negative Scanty 1+ 2+ 3+ NAα Total
SPoT
Negative 3,085 21 16 6 1 364 3,493
Scanty 23 14 11 2 0 3 53
1+ 11 9 15 2 6 8 51
2+ 1 1 4 4 5 1 16
3+ 1 1 1 0 12 1 16
NA 83 2 2 0 0 972 1,059
Total 3,204 48 49 14 24 1,349 4,688

44
Report first national TB prevalence survey 2012, Nigeria
Table 2.14Relationship between CXR, symptom screening and laboratory microscopy results
*NA: Results not available
Spot Sputum Morning Sputum
Requested NA* Negative Scanty 1+ 2+ 3+ NA* Negative Scanty 1+ 2+ 3+
Eligible symptom
only1,720 458 1226 20 14 1 1 585 1099 19 15 1 1
Eligible CXR only
2,222 436 1750 20 13 1 2 573 1611 20 13 3 2
Eligible both
746 165 517 13 24 14 13 191 494 9 21 10 21
Total 4,688 1059 3493 53 51 16 16 1349 3204 48 49 14 24
Male
15-24 264 57 197 3 3 2 2 89 166 3 4 0 2
25-34 316 85 215 5 8 1 2 109 192 1 8 3 3
35-44 304 70 222 2 6 1 3 93 199 4 2 2 4
45-54 389 74 298 6 6 3 2 101 272 4 8 2 2
55-64 298 54 238 0 3 2 1 77 214 0 3 1 3
65+ 501 121 368 9 2 0 1 137 353 5 5 0 1
Total 2072 461 1538 25 28 9 11 606 1396 17 30 8 15
Female
15-24 333 77 241 7 5 3 0 105 217 3 6 0 2
25-34 405 77 319 1 5 1 2 110 284 3 4 2 2
35-44 397 94 291 3 7 1 1 114 270 7 1 1 4
45-54 482 95 372 6 5 2 2 110 358 9 2 2 1
55-64 421 107 311 3 0 0 0 137 278 3 3 0 0
65+ 578 148 421 8 1 0 0 167 401 6 3 1 0
Total 2616 598 1955 28 23 7 5 743 1808 31 19 6 9
Zone
North Central
863 169 683 4 5 2 0 206 646 2 6 1 2
North East
417 111 268 21 12 4 1 117 268 17 11 2 2
North West
1201 203 974 8 9 4 3 325 853 12 5 3 3
South East
356 64 271 10 7 2 2 92 243 10 8 0 3
South South
867 159 691 6 7 3 1 240 612 1 6 4 4
South West
984 353 606 4 11 1 9 369 582 6 13 4 10

45
Chapter 2: Description of the survey data
Table 2.15 contains information about the relationship between smear and culture results of
spot and early morning individual specimens. Overall, more spot specimens than early morn-
ing specimens were examined. Early morning specimens were found to have higher positivity
than spot specimens. It should also be noted that 1,349 participants either did not submit early
morning specimens, or their specimens were misplaced or failed to be processed.
Table 2.15Comparison of smear and culture results between spot and morning specimens
2.7.2 Culture examinationsAll specimens collected in the filed were sent for culture. Of the 4,553 spot specimens
collected, results were obtained for 2,678(59%). Of these, 2,161 were culture negative
(80%), 86 MTB, 378 were contaminated (14%) and 53 NTM. Among the 4,138 early
morning specimens, 2,327 (56%) results were obtained out of which 1,731 culture nega-
tive (74%), 84 MTB, 459 contaminated (19.7%) and 53 NTM.
Table 2.16 Relationship between spot and early morning culture results
SPOTCulture
Negative MTB Contaminated NTM ID unknown NA Total
Smear
Negative 1,812 34 312 47 0 1,288 3,493
Scanty 15 9 8 4 1 16 53
1+ 15 20 6 1 0 9 51
2+ 2 11 0 0 0 3 16
3+ 1 12 0 1 0 2 16
NA 316 0 52 0 0 691 1,059
Total 2,161 86 378 53 1 2,009 4,688
MORNiNgCulture
Negative MTB Contaminated NTM ID unknown NA Total
Smear
Negative 1,410 28 372 45 0 1,349 3,204
Scanty 13 6 7 4 0 18 48
1+ 15 23 4 1 0 6 49
2+ 1 10 1 0 0 2 14
3+ 1 17 2 0 0 4 24
NA 291 0 73 3 0 982 1,349
Total 1,731 84 459 53 0 2,361 4,688
MORNiNg
Negative MTB Contaminated NTM ID unknown NA Total
SPoT
Negative 1,360 25 263 29 0 484 2,161
MTB 10 46 8 2 0 20 86
Contaminated 161 2 137 4 0 74 378
NTM 22 1 9 11 0 10 53
ID unknown 0 0 1 0 0 1,243 1,244
NA 178 10 41 7 0 530 766
Total 1,731 84 459 53 0 2,361 4,688

46
Report first national TB prevalence survey 2012, Nigeria
Table 2.17 Culture examination results
Spot Sputum Morning Sputum
Requested NA Negative MTBCon-tami-nated
NTMID un-known
NA Negative MTBCon-tami-nated
NTMID un-known
Eligible symptom
only1,720 754 812 11 126 17 0 927 606 13 159 15 0
Eligible CXR only
2,222 938 1041 32 189 22 0 1062 874 27 229 30 0
Eligible both
746 317 308 43 63 14 1 372 251 44 71 8 0
Total 4,688 2009 2161 86 378 53 1 2361 1731 84 459 53 0
Male
15-24 264 133 112 3 15 1 0 162 77 5 18 2 0
25-34 316 148 136 10 17 5 0 179 108 10 16 3 0
35-44 304 126 147 9 21 0 1 148 115 13 26 2 0
45-54 389 158 176 12 36 7 0 187 158 6 34 4 0
55-64 298 115 144 8 27 4 0 140 118 6 30 4 0
65+ 501 182 254 6 54 5 0 211 205 3 76 6 0
Total 2072 862 969 48 170 22 1 1027 781 43 200 21 0
Female
15-24 333 159 138 8 26 2 0 192 118 9 12 2 0
25-34 405 185 184 9 26 1 0 210 151 12 30 2 0
35-44 397 185 176 7 25 4 0 221 126 6 42 2 0
45-54 482 206 232 5 33 6 0 229 188 5 52 8 0
55-64 421 190 174 6 45 6 0 221 147 4 40 9 0
65+ 578 222 288 3 53 12 0 261 220 5 83 9 0
Total 2616 1147 1192 38 208 31 0 1334 950 41 259 32 0
Zone
North Central
863 385 418 3 53 4 0 513 288 5 57 0 0
North East
417 210 149 18 34 6 0 221 142 11 39 4 0
North West
1201 512 603 18 51 17 0 593 508 18 62 20 0
South East
356 100 176 6 73 1 0 129 137 5 84 1 0
South South
867 557 263 12 30 5 0 624 198 8 32 5 0
South West
984 245 552 29 137 20 1 281 458 37 185 23 0
Total 4688 2009 2161 86 378 53 1 2361 1731 84 459 53 0

47
Chapter 2: Description of the survey data
2.8 Health-seeking behaviourIn the survey, there were 2,466 symptomatic participants experiencing one or more of
the following: cough, haemoptysis, chest pain, or weight loss. Of these, 1,079 (44%)
were male and 1,387 (56%) were female. Among these, 664 (24%) took no action; 680
(28%) used self-medication; 1142 (46%) consulted health services. Similar patterns of
behaviour were observed among males and females, as shown in Table 2.18.
Among the 1,142 respondents that consulted health services, 419 respondents (37%)
went to general hospitals, and 319 (28%) consulted chemists. Other health services con-
sulted included health centres/PHC clinics (163 (14%)); private clinics (130 (11%)). 4%
of respondents consulted university teaching and mission hospitals, and 2% consulted
traditional healers and “other”. Similar patterns of health-seeking behaviours are seen in
both males and females and across rural and urban areas, as set out in Table 2.19.
Table 2.18Healthcare-seeking behaviour of symptomatic survey participants by gender and lo-cation
What did they do for care?
All % Male % Female % Rural %Semi-urban
% Urban %
No action taken
604 24% 261 43% 343 57% 297 49% 37 6% 270 45%
Self-treated 680 28% 311 46% 369 54% 247 36% 12 2% 421 62%
Consulted health service
1142 46% 488 43% 654 57% 495 43% 60 5% 587 51%
Unknown 40 2% 19 48% 21 53% 19 48% 3 8% 18 45%
Total 2466 100% 1079 44% 1387 56% 1058 43% 112 5% 1296 53%
15-24 % 25-34 % 35-44 % 45-54 % 55-64 % 65+ %
No action taken
123 20% 119 20% 86 14% 105 17% 74 12% 97 16%
Self-treated 126 19% 125 18% 93 14% 95 14% 93 14% 148 22%
Consulted health service
166 15% 187 16% 176 15% 201 18% 146 13% 266 23%
Unknown 8 20% 4 10% 8 20% 3 8% 8 20% 9 23%
Total 423 17% 435 18% 363 15% 404 16% 321 13% 520 21%

48
Report first national TB prevalence survey 2012, Nigeria
Table 2.19Choice of health service among those who first seek care
Where did those that consulted health services first seek care?
All % Male % Female % Rural %Semi-urban
% Urban %
Health centre/PHC
163 14% 61 37% 102 63% 81 50% 8 5% 74 45%
Private hospital
130 11% 56 43% 74 57% 63 48% 4 3% 63 48%
Traditional centre
11 1% 8 73% 3 27% 6 55% 0 0% 5 45%
Chemist 319 28% 146 46% 173 54% 138 43% 5 2% 176 55%
General hospital
419 37% 171 41% 248 59% 158 38% 40 10% 221 53%
Teaching hospital
46 4% 23 50% 23 50% 15 33% 0 0% 31 67%
Mission hospital
42 4% 19 45% 23 55% 30 71% 2 5% 10 24%
Other 9 1% 3 33% 6 67% 2 22% 1 11% 6 67%
Missing 3 0% 1 33% 2 67% 2 67% 0 0% 1 33%
Total 1142 100% 488 43% 654 57% 495 43% 60 5% 587 51%
15-24 % 25-34 % 35-44 % 45-54 % 55-64 % 65+ %
Health centre/PHC
22 13% 28 17% 19 12% 37 23% 13 8% 44 27%
Private hospital
16 12% 25 19% 18 14% 23 18% 18 14% 30 23%
Traditional centre
2 18% 2 18% 0 0% 3 27% 0 0% 4 36%
Chemist 66 21% 55 17% 50 16% 40 13% 38 12% 70 22%
General hospital
50 12% 65 16% 75 18% 74 18% 67 16% 88 21%
Teaching hospital
5 11% 6 13% 8 17% 10 22% 5 11% 12 26%
Mission hospital
3 7% 6 14% 4 10% 11 26% 4 10% 14 33%
Other 1 11% 0 0% 2 22% 2 22% 1 11% 3 33%
Missing 1 33% 0 0% 0 0% 1 33% 0 0% 1 33%
Total 166 15% 187 16% 176 15% 201 18% 146 13% 266 23%

49
Chapter 3: TB prevalence: analytical methods and key results
TB prevalence: analytical methods and key results
chapter 3

50
Report first national TB prevalence survey 2012, Nigeria
3.1 Crude TB prevalence rates
Of the 41,820 evaluable participants, 107 smear-positive cases were found: the crude preva-
lence rate was 256/100,000 population. This finding is based on the assumption that those
who did not submit specimens or did not have decisive laboratory results were negative.
In addition, out of the 107 smear-positive survey cases, 80 (75%) presented with symp-
toms which satisfy the TB screening criteria for sputum examination (cough for two weeks
or more) as stated in the protocol, while 94 (88%) of the cases had typical radiological
findings that were consistent with active TB disease. See Figure 2.1 above.
3.2 Number of TB survey cases broken down by laboratory
A total of 148 bacteriologically-confirmed cases out of 41,363 participants evaluated
gave a crude prevalence of 348/100,000 (not accounting for cluster sampling design and
missing data), as shown in Table 3.1. With the bacteriologically-confirmed survey cases,
92 cases (64%) presented with symptoms which satisfied the case definition, and 128
cases (89%) had typical radiological findings consistent with TB.
Table 3.1Number of TB survey cases broken down by laboratory
Among smear-negative subjects, MTB was isolated from 37 subjects. The risk of
cross-contamination was reviewed with clinical and laboratory data, and all of those 37
were categorized as culture-confirmed survey cases. Accordingly, there were 148 bacte-
riologically-positive cases in this survey. There were 37 smear-negative culture positive
cases, with a crude prevalence rate of 89/100,000.
The majority of smear-positive and bacteriologically-confirmed cases (28% and 31%, re-
spectively) are from the South West zone, followed by the North West zone with 19% and
20% respectively.
As seen in Table 3.2, the majority of the prevalent smear-positive cases were within the
age ranges 25-54 (42%) in males and 15-44 (33%) in females. Among the bacteriolog-
ically-positive, the age group 25-54 accounted for 39% of cases in males, and the age
group 15-44 accounted for 31% of cases in females. As seen in Figure 2.3, ages 15-54
accounted for the majority of the cases.
S+C+ S+CXR+ S-C+ Total
NiMR Lagos 21 9 14 44
Zankli Abuja 14 16 11 41
NTBLTC Zaria 40 7 16 63
Total 75 32 41 148

51
Chapter 3: TB prevalence: analytical methods and key results
Table 3.2Numbers of TB prevalent survey cases and evaluable participants, and crude rates per 100,000 by detailed symptoms
Smear-positive Smear-negative culture-positive Bacteriologically-confirmed
Number of cases
Number of evaluable
participants
Crude rate per 100,000
Number of cases
Number of evaluable
participants
Crude rate per 100,000
Number of cases
Number of evaluable
participants
Crude rate per 100,000
Total 107 41820 256 37 41363 89 144 41363 348
Symptom
Eligible 80 1662 4813 12 1464 820 92 1464 6284
Non-Eligible 27 40158 67 25 39899 63 52 39899 130
1. Cough
No 23 37586 61 22 37361 59 45 37361 120
1-13 days 4 2571 156 3 2537 118 7 2537 276
14-30 days 33 977 3378 7 888 788 40 888 4505
31 + days 47 686 6851 5 577 867 52 577 9012
2. Sputum
Yes 72 2871 2508 14 2678 523 86 2678 3211
No 35 38949 90 23 38685 59 58 38685 150
3. Haemoptysis
Yes 10 223 4484 5 187 2674 15 187 8021
No 97 41597 233 32 41176 78 129 41176 313
4. Chest pain
Yes 49 6235 786 11 6020 183 60 6020 997
No 58 35585 163 26 35343 74 84 35343 238
5. Body weight loss
Yes 45 3240 1389 8 3177 252 53 3177 1668
No 62 38580 161 29 38186 76 91 38186 238
6. Fever
Yes 42 7861 534 15 7644 196 57 7644 746
No 65 33959 191 22 33719 65 87 33719 258
Any symp-tom (1-6)
89 14520 613 22 14197 155 111 14197 782
No symptom
18 27300 66 15 27166 55 33 27166 121

52
Report first national TB prevalence survey 2012, Nigeria
Table 3.3Numbers of TB prevalent survey cases broken down by categories
Smear-positive Bacteriologically-confirmed
Number Percent Number Percent
Total 107 100% 148 100%
Symptom
Eligible 80 75% 92 64%
Non-Eligible 27 25% 52 36%
Field CXR
Eligible 94 88% 128 89%
Non-Eligible 13 12% 16 11%
Male
15-24 6 6% 8 6%
25-34 15 14% 19 13%
35-44 12 11% 17 12%
45-54 18 17% 20 14%
55-64 8 7% 10 7%
65+ 7 7% 12 8%
Female
15-24 10 11% 11 9%
25-34 10 11% 16 13%
35-44 10 11% 13 10%
45-54 7 7% 9 7%
55-64 2 2% 5 4%
65+ 2 2% 4 3%
Zone
North Central 11 10% 13 9%
North East 19 18% 24 17%
North West 20 19% 29 20%
South East 10 9% 10 7%
South South 17 16% 22 15%
South West 30 28% 44 31%
Previously Treated
Yes 19 18% 21 15%
No 88 82% 123 85%
Currently on treatment
Yes 12 11% 12 8%
No 95 89% 132 92%

53
Chapter 3: TB prevalence: analytical methods and key results
3.3 Statistical analysis for the estimation of TB prevalence rates
All analyses described below were conducted separately for each of the two binary survey
outcomes (“yes” or “no”) as described in the survey protocol of smear-positive pulmo-
nary TB and bacteriologically-confirmed pulmonary TB.
In terms of cluster level analysis, the survey prevalence estimate serves as a summary
measure of all cluster-level prevalence estimates. The average of the cluster-level preva-
lence estimates is the point estimate of survey prevalence among all survey participants,
and the standard error was calculated by dividing the standard deviation of the clus-
ter-level prevalence estimates by the square root of the number of clusters.
3.3.1 Individual level analysisIndividual-level analyses of pulmonary TB prevalence were performed using logistic re-
gression, in which the log odds, i.e.log ( ) is modelled where is the probability
of individual i in cluster j being a prevalent pulmonary TB case. The simplest model that
can be fitted is α = log (
), in which case the overall prevalence of pulmonary TB is
then estimated as: p = where p is the observed overall proportion of survey
participants with pulmonary TB. Logistic regression was used because the outcome is
binary: for each individual there is a probability of having pulmonary TB at the time of the
cross-sectional survey (in the generalized linear models framework, the logistic link func-
tion is the “natural link function”). The most crucial characteristic of such analyses is that
they take into account the clustering of individuals. If this is not done, the calculated 95%
confidence interval (CI) for true pulmonary TB prevalence will have less than the nominal
95% coverage due to underestimation of the standard error of the prevalence estimate.
The recommended logistic regression was used for these types of surveys, with robust
standard errors calculated from the observed between-cluster variability. In total, three
recommended models of analysis were used: one does not account for missing data, while
two attempt to correct for bias.
Model one: robust standard errors on complete case dataset
This model does not account for variation in the number of individuals per cluster or cor-
relation among individuals in the same cluster when estimating the point prevalence of
pulmonary TB (logit command with the robust option in Stata). Equal weight is given to
each individual in the sample. However, the model does correct for clustering (by using
the observed between-cluster variation) when estimating the 95% confidence interval,
and can control for the strata that were part of the survey design. This model exactly cor-
responds to the classical analysis of surveys (svy commands with Stata) when one does
not need to adjust for sampling weights. This is the case in the self-weighting survey de-
sign for nationwide TB prevalence surveys. This model is restricted to survey participants.
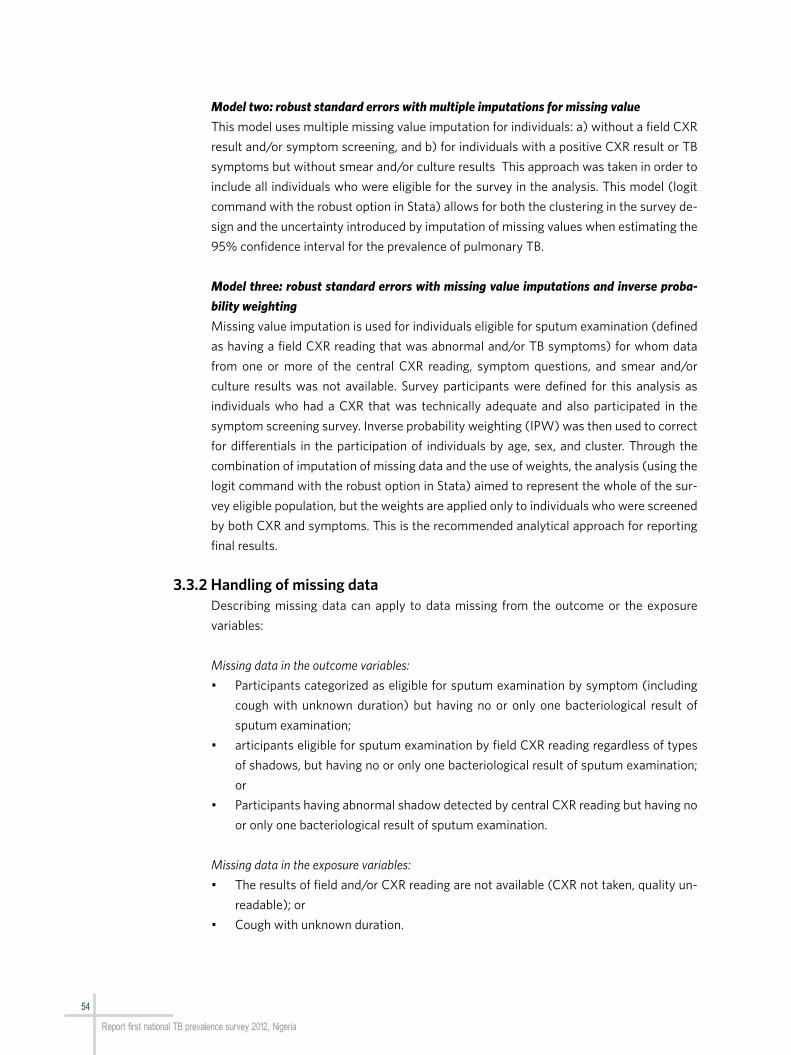
54
Report first national TB prevalence survey 2012, Nigeria
Model two: robust standard errors with multiple imputations for missing value
This model uses multiple missing value imputation for individuals: a) without a field CXR
result and/or symptom screening, and b) for individuals with a positive CXR result or TB
symptoms but without smear and/or culture results This approach was taken in order to
include all individuals who were eligible for the survey in the analysis. This model (logit
command with the robust option in Stata) allows for both the clustering in the survey de-
sign and the uncertainty introduced by imputation of missing values when estimating the
95% confidence interval for the prevalence of pulmonary TB.
Model three: robust standard errors with missing value imputations and inverse proba-
bility weighting
Missing value imputation is used for individuals eligible for sputum examination (defined
as having a field CXR reading that was abnormal and/or TB symptoms) for whom data
from one or more of the central CXR reading, symptom questions, and smear and/or
culture results was not available. Survey participants were defined for this analysis as
individuals who had a CXR that was technically adequate and also participated in the
symptom screening survey. Inverse probability weighting (IPW) was then used to correct
for differentials in the participation of individuals by age, sex, and cluster. Through the
combination of imputation of missing data and the use of weights, the analysis (using the
logit command with the robust option in Stata) aimed to represent the whole of the sur-
vey eligible population, but the weights are applied only to individuals who were screened
by both CXR and symptoms. This is the recommended analytical approach for reporting
final results.
3.3.2 Handling of missing dataDescribing missing data can apply to data missing from the outcome or the exposure
variables:
Missing data in the outcome variables:
• Participants categorized as eligible for sputum examination by symptom (including
cough with unknown duration) but having no or only one bacteriological result of
sputum examination;
• articipants eligible for sputum examination by field CXR reading regardless of types
of shadows, but having no or only one bacteriological result of sputum examination;
or
• Participants having abnormal shadow detected by central CXR reading but having no
or only one bacteriological result of sputum examination.
Missing data in the exposure variables:
• The results of field and/or CXR reading are not available (CXR not taken, quality un-
readable); or
• Cough with unknown duration.

55
Chapter 3: TB prevalence: analytical methods and key results
3.3.3 Imputation modelsAll imputation models were run in STATA 12 using the mi group of command for the impu-
tation of data and calculation of pooled estimates combining all imputed datasets.
Outcomes of smear-positive TB and having a smear-positive result: All variables associated
with being a smear-positive case and missing data were investigated for inclusion in the
imputation model. These include stratum, age group, sex, field CXR result, cough for more
than two weeks, weight loss, fever, blood in sputa, chest pain, and having a history of TB
treatment. The final imputation model included: age group, sex, stratum, cough for more
than two weeks, weight loss, and treatment history. 30 datasets were imputed, after 10
cycles for each saved one. These were combined for the final estimates (the percentage of
missing outcome data was about 30%).The same imputation model was used for imputa-
tion of values among survey participants (Model 2) and eligible for sputum examination
(Model 3).
Outcome of bacteriologically-confirmed TB: All variables which associated with being a
bacteriologically-confirmed case and missing data were investigated for inclusion in the
imputation model. These were stratum, age group, sex, field CXR result, cough for more
than two weeks, weight loss, fever, blood in sputa, chest pain, and having history of TB
treatment. The final imputation model included: age group, sex, stratum, cough for more
than two weeks, blood in sputa, weight loss, and treatment history. 50 datasets were
imputed, after 10 cycles for each saved one, and combined for the final estimates (the
percentage of missing outcome data was about 40%). The same imputation model was
used for imputation of values among survey participants (Model 2) and eligible for spu-
tum examination (Model 3).
3.4 Estimated TB prevalence rates from survey population
The point estimates along with corresponding confidence intervals (CI) of prevalence
rates per 100,000 population using the recommended analytical approach (Model 3) of
combining multiple imputation and inverse probability weighting are summarized in Table
3.4. The prevalence rates of smear-positive and bacteriologically positive are 318 (95%
CI: 225-412) and 524 (95% CI: 378-670) per 100,000 population of those 15 years and
above. Prevalence among men is higher (484 (95% CI: 333-635)) than in females (198
(95% CI: 108-289)). A similar situation was found in the bacteriologically positive cases:
these were 751 per 100,000(95% CI: 538-965)) in males and 359 per 100,000(95% CI:
213-505]) per 100,000 in females. An age differential in TB prevalence rates is also ap-
parent, with highest rates being estimated among the 35-54 age group. Finally, TB preva-
lence is much higher in urban than in rural settings.
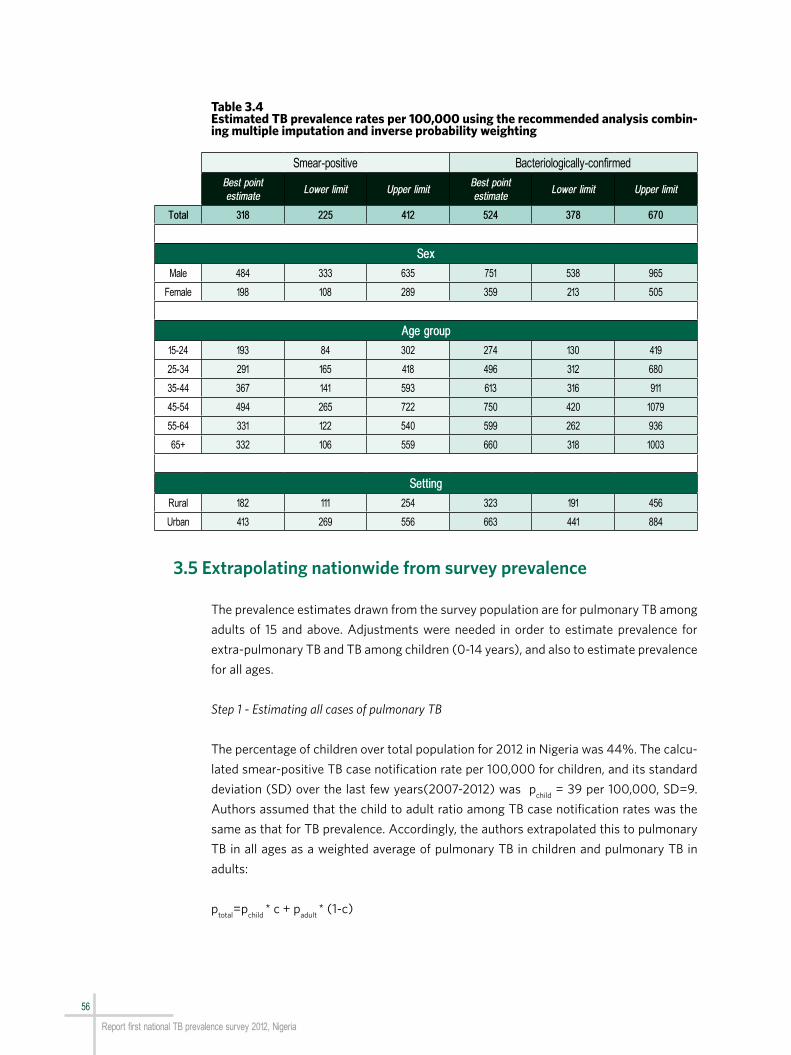
56
Report first national TB prevalence survey 2012, Nigeria
Table 3.4Estimated TB prevalence rates per 100,000 using the recommended analysis combin-ing multiple imputation and inverse probability weighting
3.5 Extrapolating nationwide from survey prevalence
The prevalence estimates drawn from the survey population are for pulmonary TB among
adults of 15 and above. Adjustments were needed in order to estimate prevalence for
extra-pulmonary TB and TB among children (0-14 years), and also to estimate prevalence
for all ages.
Step 1 - Estimating all cases of pulmonary TB
The percentage of children over total population for 2012 in Nigeria was 44%. The calcu-
lated smear-positive TB case notification rate per 100,000 for children, and its standard
deviation (SD) over the last few years(2007-2012) was pchild
= 39 per 100,000, SD=9.
Authors assumed that the child to adult ratio among TB case notification rates was the
same as that for TB prevalence. Accordingly, the authors extrapolated this to pulmonary
TB in all ages as a weighted average of pulmonary TB in children and pulmonary TB in
adults:
ptotal
=pchild
* c + padult
* (1-c)
Smear-positive Bacteriologically-confirmed
Best point estimate
Lower limit Upper limitBest point estimate
Lower limit Upper limit
Total 318 225 412 524 378 670
Sex
Male 484 333 635 751 538 965
Female 198 108 289 359 213 505
Age group
15-24 193 84 302 274 130 419
25-34 291 165 418 496 312 680
35-44 367 141 593 613 316 911
45-54 494 265 722 750 420 1079
55-64 331 122 540 599 262 936
65+ 332 106 559 660 318 1003
Setting
Rural 182 111 254 323 191 456
Urban 413 269 556 663 441 884

57
Chapter 3: TB prevalence: analytical methods and key results
where pchild
is the prevalence among children, padult
the bacteriologically-confirmed preva-
lence among adults drawn from the survey and c the percentage of children in the country.
Step 2 – Estimating all forms of TB
The assumed EP prevalence rate was constant across all ages. Authors calculated the
proportion of EP over total TB case notifications, and its standard deviation over the last
few years (2007-2012) at peo
= 5 per 100,000, SD=0.2. They then inflated the estimate
for pulmonary TB prevalence of all ages by the amount that extra-pulmonary TB contrib-
utes to total TB case notifications. Following the steps described above, the all-forms,
all-ages TB prevalence level in Nigeria for 2012 is estimated at 323 (95% CI :239-406)
per 100,000.
3.6 Summary results from the first national TB prevalence survey in Nigeria
Findings from the TB prevalence survey in Nigeria show much higher TB prevalence levels
than previously estimated based on the routine surveillance data that were available in
the country (Table 3.5).
Table 3.5Estimated adult TB prevalence rates per 100,000 based on findings from the national prevalence survey analysed using the recommended analytical approach of multiple imputation and inverse probability weighting
When disaggregating age and sex, disparities exist in TB disease burden among adults in
Nigeria. The highest prevalence of TB cases appears among males and adults ages 35-54
(Figure 3.1).
Best estimate 95% confidence interval
Smear-positive TB 318 [225-412]
Bacteriologically-confirmed TB 524 [378-670]

58
Report first national TB prevalence survey 2012, Nigeria
Figure 3.1Age and sex-specific TB prevalence rates (smear-positive and bacteriologically-con-firmed) per 100,000. Data source: 1st National TB Prevalence Survey, Nigeria
The geographical disaggregation of disease burden presents higher levels of disease in
urban than rural settings (Figure 3.2).
Figure 3.2Zonal and urban/rural-specific TB prevalence rates (smear-positive and bacteriologi-cally-confirmed) per 100,000. Data source: 1st National TB Prevalence Survey, Nigeria
NC=North Central; NE=North East; NW=North West; SE=South East; SS=South South; SW=South West
15–24 15–2425–34 25–3435–44 35–4445–54 45–5455–64 55–6465+ 65+Male MaleFemale Female
Rat
e pe
r 100
,000
Smear-positive Bacteriologically-confirmed
1000
800
600
400
200
0
1000
800
600
400
200
0
NC NCNE NENW NWSE SESS SSSW SWRural RuralUrban Urban
Rat
e pe
r 100
,000
Smear-positive Bacteriologically-confirmed
1000
500
0
1000
500
0

59
Chapter 3: TB prevalence: analytical methods and key results
Another important investigation combining data from the TB prevalence survey with the
2012 annual smear-positive TB case notification data is the ratio of prevalence to noti-
fication, shown in Table 3.6. This can be used to identify and target those groups of TB
patients whose disease burden is highest in relation to case finding. Males and those aged
45-54 represent the groups with the highest ratios in Nigeria.
Table 3.6Prevalence to case notification ratio, Nigeria 2012
Number of
smear-positive survey cases
Smear-positive survey preva-lence rate per
100,000
Smear-positive case notification rate per 100,000
(15+)
P:N rate ratio
Total 107 318 55 5.78
Sex
Male 66 484 67 7.25
Female 41 198 43 4.63
Age group
15-24 16 193 30 6.39
25-34 25 291 72 4.06
35-44 22 367 73 5.05
45-54 25 494 64 7.69
55-64 10 331 55 6.01
65+ 9 332 55 5.98

60
Report first national TB prevalence survey 2012, Nigeria
Discussion
chapter 4
61
Chapter 4: Discussion
4.1 Prevalence rate of TB
The point estimates of TB prevalence rates and of associated confidence intervals (CI)
of smear-positive and bacteriologically-confirmed cases are 318 (95% CI: 225-412) and
524 (95% CI: 378-670) per 100,000 population (15 years and above) respectively. The
prevalence of smear-positive TB among men is higher (484, 95% CI: 333-635) than in
females (198, 95% CI: 108-289). A similar situation was found in the bacteriological-
ly-positive cases, with 751 (95% CI: 538-965) and 359 (95% CI: 213-505) per 100,000
males and females respectively.
A comparison of the smear-positive prevalence of 318 per 100,000 with the NTP’s noti-
fication rate of 55 per 100,000 in 2012 produces a ratio of 5.78. This is higher than the
numbers suggested by the Ethiopian national survey in 2011, which produced a ratio of
about 1:1 (smear-positive prevalence of 61 per 100,000).
Results from this survey show a burden of TB in the Nigeria which is over double the WHO
estimated burden for 2012.
Among the participants, 107 cases of smear-positive pulmonary TB were detected. Of
these, 73% were new, 14% had been treated for TB in the past and 11% were on treatment
at the time of the survey. This shows that 89% of the detected confirmed smear-positive
TB patients were not on anti-TB treatment during the survey. This may be a result of the
under-coverage of DOTS treatment and microscopy centres, and may also be attributable
to low community awareness about TB services.
37 smear-negative culture-positive pulmonary cases were found, compared with 107
smear-positive pulmonary cases. This finding differs from those of recent surveys; for
instance, smear-negative culture-positive cases accounted for over half of all detected
cases in the Cambodian 2012 survey. This difference may be due to:
• high contamination rate from some clusters; or
• lack of performance of ID test when only a few colonies were growing on agar slants.
Additional efforts to confirm diagnosis by molecular technologies were made in the case
of any observed discrepancy between the smear and the culture results where an aliquot
of the decontaminated sample was still available and frozen in the laboratory. However,
additional efforts to confirm diagnosis by molecular technologies could not be carried out
in the survey despite requests to the medical panel.
The highest prevalence was found among the age group 24-54 years, despite the fact
that this group had the lowest participation rate. This suggests that the reported point
estimate of the survey may have been underestimated. This low participation has been
62
Report first national TB prevalence survey 2012, Nigeria
accounted for, as much as possible, through multiple imputations. This age group con-
stitutes the most productive and mobile individuals in the society, and the TB control
programme will need to increase measures to address TB among this group in order to
reduce transmission in the community.
Health-seeking behaviour
Approximately one-third (35.8%) of the eligible population had at least one of the six
symptoms (cough, sputum, chest pain, haemoptysis, body weight loss and fever). The
majority of symptomatic respondents (52%) took inappropriate action (either self-med-
ication or no action) which could be responsible for the continued transmission of TB in
the community and may explain the low TB case notification in the country.
Among those that sought any form of care, the majority consulted the general hospital
(37%) and chemist (28%), while only 14% sought care from the PHC system which is
supposedly the entry point into the health care system in Nigeria. This is in line with sev-
eral studies that have shown the weakness of the PHC system in Nigeria and the fact that
the chemist shop is the first point of contact for many Nigerians seeking health care ser-
vices. The inherent weakness in the PHC system has led to people seeking care at higher
levels. These results emphasize the urgent need for the government to strengthen the
PHC system and to optimize TB services at all levels.
Most of those identified as “on treatment” during the survey were receiving this treat-
ment in the general hospitals and PHC clinics. DOTS services are primarily available in
these two categories of health facilities. A relatively low percentage of TB patients take
treatment in private facilities because in Nigeria private practitioners will generally charge
for services or immediately refer suspected TB cases to the government-run health in-
stitutions. Of interest is the very low number of those who first consulted the traditional
healers (1%). This may be due to the fact that private chemists and PHC facilities are
available or that individuals have less confidence in traditional healer on issues relating to
chest infections.
Of the 43,199 chest x-rays taken in the field, 2,968 (6.9%) were abnormal. Majority of
these abnormal chest x-rays (22.4% males and 19.9% females) were in the age group 65
years and above. Of the 1,786 respondents who had abnormal chest x-ray results and had
laboratory results, 36 (2%) were sputum-positive.
Although the design of the survey was not primarily to demonstrate regional/zonal or ur-
ban/rural variation, results show a higher prevalence of bacteriologically-confirmed cases
in the urban (663 (95% CI: 441-884)) and compared to rural areas (323 (95% CI: 191-
456)) as seen in Table 3.4. Keeping the imprecision of the zonal level TB prevalence es-
timates in mind, this is useful for the purposes of hypothesizing and investigating further
differences between zones in terms of the relationship between true TB disease burden
and TB case finding. For example, South West has approximately the same level of case

63
Chapter 4: Discussion
notification rate as North Central but a much higher burden of TB prevalence. Lastly, a
wide variation was observed in the TB prevalence among the clusters ranging from 0 to
1,757 per 100 000 population.
In recent years NTP has had an increase in the coverage of the DOTS programme in terms
of facilities expansion, TB/HIV collaborative activities and collaboration with private and
tertiary providers. Although the number of notified cases has increased, the notification
rate still remains low. There are still a lot of TB cases in the communities undiagnosed.
The programme will have to focus on increasing access to basic DOTS especially diag-
nostic services, and also identify and focus more on hotspots like urban slums in order to
improve notification rates.
4.2 Considering eligibility criteria
In the survey, all adults 15 years and above who stayed in selected households for 14 days
or more at the time of the census were eligible for the survey. By chance, none of the
selected clusters felt areas where exclusion was being considered such as the military
barracks, hospitals, diplomatic compounds or hotels. Although there were challenges in
determining eligibility during the census because of some who are only stay during week-
ends and return to their place of work during the week, the survey census was generally
considered to be successful. Although registered as eligible, some individuals were only
available during the weekends. Some were also only at home in the evening after spending
days either at farms or business areas.
4.3 Survey participation
Although the National Population Commission was involved in the census and enumera-
tion, the overall participation was 56.8%. This was a relatively low rate in relation to the
85% which had been planned. This may be due to the fact that the initial community mo-
bilization and planned pre-survey visits to the communities were not strictly adhered to.
In addition, some of the cluster fell into urban areas where there is general apathy towards
what is considered as government programmes or survey. Houses in such urban areas
usually have perimeter fences with gates and sometimes guards who hindered surveyed
staff from entering. The rainy season also resulted in the involvement of community lead-
ers and extension by one additional day in some clusters, but did not drastically alter
participation (Figure 4.1). All possible sensitivity analyses were conducted to investigate
whether lower levels of participation rate biased the results of the survey with reassuring
findings. Final reported estimates of TB prevalence have accounted for missing data due
to non-participation.

64
Report first national TB prevalence survey 2012, Nigeria
Figure 4.1Participation rate (%) by cluster (chronological order)
Younger males were the most difficult to recruit in the survey, a finding consistent with
all recently completed similar surveys in other countries in Africa and Asia (Figure 4.2).
Figure 4.2Participation rate (%) by age group and sex
4.4 Characteristics of participants
4.4.1 TB-related symptomsDuring the survey, all eligible participants were interviewed about TB-related symptoms
within the past one month. 11% of participants had had a cough of some duration (cough
of 1-13 days 6.1%, 14-30 days 6.1% and >30 days 2.2%); 8% had sputum; 15.4% had
experienced chest pain; 0.7% had haemoptysis; and 19% had had fever. 35.8% of the
participants had at least one of the six symptoms, while 64.2% had no symptoms. This
relatively low number of participants who have symptoms compared to other surveys
(such as that in Cambodia) may be due to the fact that in some communities, coughing
especially among smokers, old persons and kola eaters is assumed to be normal so may
1 3 5 7 9 11 13 15 17 19 21 23 25 27 29 31 33 35 37 39 41 43 45 47 49
Parti
cipa
tion
rate
(%)
Cluster number
100
90
80
70
60
50
40
30
20
10
0
15 τto 24 25 to 34 35 to 44 45 to 54 55 to 64 65+
Male
Female
Parti
cipa
tion
rate
(%)
Age Group (Years)
100,0
90,0
80,0
70,0
60,0
50,0
40,0

65
Chapter 4: Discussion
not have presented as a complaint. However, eligibility rates for sputum examination by
interview and CXR were about 11% which seems to correspond to those with symptoms.
4.4.2 Geographical variation of TB prevalenceUsing the routine surveillance data, at the time of when protocol was developed, it was
assumed that TB burden was equally distributed all over the country. However, the result
shows that in the 70 cluster selected, TB cases are not equally distributed. This is demon-
strated in Figure 4.3.
Figure 4.3Cluster variation in the number of TB cases
The y axis shows the number of clusters among 70, and the x axis shows smear-positive
prevalence per 100,000. Around 50% of cluster had 0 or only 1 S+ TB case as expect-
ed, while extremely high prevalence clusters exist (hot spots). Though the mathematical
average was 255 (prevalence of smear-positive)/ 100,000, the median was 168. While
strengthening TB control efforts in general is essential, it is important to discover such
“hot spots” so as to focus special efforts upon them.
Keeping the imprecision of the zonal level TB prevalence estimates in mind, these remain
useful for the purposes of hypothesizing and investigating further differences between
zones in terms of the relationship between true TB disease burden and TB case finding.
For example, the South West has approximately the same level of case notification rate as
North Central but a much higher burden of TB prevalence (Figure 4.4).
0 500 1000
Bacteriologically-confirmed
1500 2000
Num
ber o
f clu
ster
s
Cluster-level prevalence rate per 100,000
20
15
10
5
00 500 1000
Smear-positive
1500 2000
20
15
10
5
0

66
Report first national TB prevalence survey 2012, Nigeria
Figure 4.4Scatterplot of smear-positive case notification rates (≥15) against prevalence rates (≥15) by zone. Data source: NTBLCP database and 1st National TB Prevalence Survey, Nigeria
4.5 Comparison of routine TB surveillance data with survey report
Table 3.6 demonstrates the prevalence to notification ratio in 2012 among smear-positive
TB cases (programme notifies smear-positive cases). While the smear-positive preva-
lence is 318/100,000, the notification is 55/100,000. This gives a ratio of 5.78, the high-
est observed among countries recently completing similar surveys in Africa and Asia. This
ratio is seen to be higher in males as compared to females, and highest in the age group
45-54.
In recent years, NTP has increased in the coverage of the DOTS programme in terms of fa-
cilities expansion, TB/HIV collaborative activities, and involving private and tertiary pro-
viders. Although the programme has demonstrated an increase in the number of notified
cases, the notification rate remains low. There are a significant number of undiagnosed TB
cases in the communities. The programme will have to focus on increasing access to basic
DOTS, especially diagnostic services, and identify and focus more on hotspots especially
urban slums in order to improve notification rates.
4.6 Strengths and Limitations of the Survey
4.6.1 Strengths The survey was designed and implemented in accordance with the National Protocol
250 300 350 400 450
TB c
ase
notifi
catio
n pe
r 100
,000
TB prevalence per 100,000
40
35
30
25
20
North West
North Central
South East
South West
North East
South South

67
Chapter 4: Discussion
which was based on the recommendations of the Global Task Force on TB Prevalence
Survey. All three recommended screening methods were used (symptom screening, chest
x-ray radiography and sputum examinations (microscopy and culture)) in all planned 70
clusters.
The survey was successfully led by a coordinating committee, receiving continuous sup-
port from an active technical committee and implemented by a survey coordinator and
field teams. This led to capacity-building with respect to the planning, coordination and
execution of surveys in the country.
Sustained technical support from WHO, CDC, the supra-national reference laboratory
in Milan and the Global Task Force (from the design, pre-testing, field data collection,
analysis and report writing) contributed not only to the quality of the exercise but also to
capacity-building of personnel in Nigeria.
A wide range of participation from partners (local and international), government at all lev-
els (federal, state and local) and communities ensured country ownership of the exercise.
Funding provided from Nigerian Government, the Global Fund, WHO, CDC (Nigeria and
Atlanta) and USAID ensured effective implementation of the survey.
4.6.2 LimitationsIn the design
The exclusion of children and extra-pulmonary TB cases from the survey might have led,
respectively, to a slight overestimation and underestimation of the TB burden. However,
this limitation was accounted for during statistical analysis. The inclusion of HIV testing
was initially considered by the survey management committee but was dropped due to
concern that participation would be low, thereby affecting the primary objective of the
survey.
Field cluster operation
Generally, the participation rate was low due to several reasons that differ from one part
of the country to the other. These include security concerns, stigma, perception of being
tested for HIV, inability to fully implement community mobilization activities, rainfall and
difficult terrain. Furthermore, in some urban communities, there was generally apathy to-
wards government programmes and many residents could not attend due to obligations
of urban life. In rural areas, some communities were scattered from each other, the exer-
cise clashed with the farming season and several under-aged children were enumerated
as eligible.
There were some technical hitches with the mobile x-ray machines in some clusters which
resulted in delays or inabilities to have chest x-rays performed on all eligible respondents.
Secondly, some chest x-ray films were lost due to poor storage techniques. Thirdly, the
central reading of the CXR was done long after field operations were over, making correc-

68
Report first national TB prevalence survey 2012, Nigeria
tive actions difficult during implementation.
There were some challenges with the logistics of sputum transportation and processing
during the survey which resulted in many samples being rejected and high culture con-
tamination rate as compared with similar surveys in Africa (less than 2% Ethiopia 2012)
and Asia (less than 1% Cambodia 2012).
In addition, there were delays in transmitting the laboratory results to the central data
manager due to administrative and workload challenges in the laboratories.
How could missing data have influenced the analysis?
Missing data from low participation: Authors employed an inverse probability weighting
approach to account for missing data due to the differences between the targeted eligi-
ble and participant populations. This approach in essence forces the survey participant
population to be more similar to the targeted eligible population and uses observed data
weighed accordingly to account for the lower participation in survey population strata
defined by sex, age and urban/rural setting.
Missing data from sputum specimens not collected or not being examined in the laboratory
(smear and culture), or unavailable laboratory results: To address this, authors have em-
ployed multiple imputation of missing data to identify potential bias being introduced
in survey results due to these missing data, as well as inflated the uncertainty of final
prevalence estimates accordingly to account for these unintended gaps in data. This is the
internationally recommended analytical approach used in the analyses of similar surveys
in Africa and Asia.
Lastly, in spite of the above mentioned limitations, the stakeholders consider that the
exercise was a success. Lessons learned will serve as benchmarks for improvement in
subsequent surveys.

69
Chapter 5: Programmatic implications and recommendations
Programmatic implications and recommendations
chapter 5

70
Report first national TB prevalence survey 2012, Nigeria
5.1 High tuberculosis prevalence to case notification ratio indicates low case detection
Recommendations to address low case detection include:
1. Ensure universal access to treatment and microscopic services;
2. Deployment and expansion of new technologies such as GeneXpert;
3. Active case detection targeting high burden areas and high risk groups;
4. Engage all care providers in TB control; and
5. Strengthen routine surveillance to include all points of contacts between patients and
health care services,
5.2 Inappropriate action by symptomatic respondents
A large percentage of symptomatic respondents took inappropriate action, either taking
no action or self-medicating. Recommendations to address this situation include:
1. Massive awareness campaign to create demand at all levels;
2. Community mobilization for participation, ownership and sustainability;
3. Advocacy at all levels of government and community for increased political commit-
ment and resources; and
4. All states and LGAs to buy into the existing national strategic plan, tailoring it to local
situations.
5.3 Laboratory capacity
The survey has identified the following challenges relating to the performance of the TB
reference laboratory services: transportation, storage, sputum processing and data man-
agement. Recommendations to address these challenges include:
1. Strengthen transportation system from peripheral to reference laboratories;
2. Strengthen infrastructural and human capacity of the reference laboratories; and
3. Strengthen the laboratory data management system.

71
Chapter 6: Conclusion
Conclusion
chapter 6

72
Report first national TB prevalence survey 2012, Nigeria
For the first time in the history of the country, this survey has provided a nationwide pop-
ulation-based estimate of the TB burden for Nigeria, unveiling a much higher than previ-
ously thought level of TB prevalence. The exercise also revealed a wide variation in the
burden of TB among the clusters surveyed; this information will be valuable for informing
decisions about resource allocation; for targeting interventions; and for identification of
programme areas that require strengthening. Furthermore, the survey created national
capacity for the planning and implementation of population-based surveys at all levels of
the health programmes and institutions that were involved. The survey’s limitations have
been investigated and accounted for at the analysis stage to the extend possible. Finally,
results and lessons learned from this survey can and should be used in follow-up surveys
that will allow the country to monitor impact of its activities to address the TB epidemic.

73
References
Cambodia Ministry of Health. Report of national TB prevalence survey, 2002. Phnomh Penh: Ministry of Health;
2002.
Cambodia Ministry of Health. National Centre for Tuberculosis and Leprosy Control, 2005. Phnomh Penh: Min-
istry of Health; 2005.
Cambodia Ministry of Health. Second National Tuberculosis Prevalence Survey 2011 Report. Phnomh Penh: Min-
istry of Health; 2011.
Carpenter JR, Kenward MG, Vansteelandt S. A comparison of multiple imputation and double robust estimation
for analysis with missing data. Journal of the Royal Statistical Society, Series A, 2006, 169; 571-584.
Eritrea Ministry of Health. Determining the tuberculosis burden in Eritrea: Report of the tuberculosis prevalence
survey in Eritrea, 2005. Asmara: Ministry of Health; 2005.
Floyd S, Sismanidis C, Yamada N et al. Analysis of tuberculosis prevalence surveys: new guidance on best-prac-
tice methods. Emerging Themes in Epidemiology, 2013, 10;10, doi:10.1186/1742-7622-10-10
Global Tuberculosis Report 2013. Geneva: World Health Organization; 2013
(http://apps.who.int/iris/bitstream/10665/91355/1/9789241564656_eng.pdf?ua=1, accessed 5 July 2014).
Global tuberculosis control: surveillance, planning, financing: WHO Report 2008. Geneva: World Health Or-
ganization; 2009 (WHO/HTM/TB/2008.393; http://www.who.int/tb/publications/global_report/2008/en/,
accessed 5 July 2014).
Myanmar Ministry of Health. Report on National Tuberculosis Prevalence Survey, Myanmar 2009-2010. Yan-
gon: Department of Health; 2010
(http://www.searo.who.int/myanmar/documents/TB_Prevelence_Survey_report.pdf, accessed 5 July 2014).
Nigeria Federal Ministry of Health. Annual Report 2008. Abuja: National Tuberculosis and Leprosy Control Pro-
gramme; 2009 (http://www.ntbltc.org/reports/Annual%20Report%202008%20NTBLCP.pdf, accessed 5 July
2014).
Nigeria Federal Ministry of Health. Strategic Framework for Implementation of TB-HIV activities 2007-2009.
Abuja: Federal Ministry of Health, 2007.
Philippines National Institute of Tuberculosis. Report on a national tuberculosis prevalence survey in the Repub-
lic of Philippines. Manila: National Institute of Tuberculosis; 1984.
WHO. 2007. Anti-TB Drug Resistance in the World: Fourth Global report. Geneva, World Health Organization;
2007 (WHO/HTM/TB/2008.394; http://www.who.int/tb/publications/2008/drs_report4_26feb08.pdf, ac-
cessed 5 July 2014).
WHO. Tuberculosis prevalence surveys: a handbook. Geneva: World Health Organization; 2011
(http://whqlibdoc.who.int/publications/2011/9789241548168_eng.pdf?ua=1, accessed 5 July 2014).
References

74
Report first national TB prevalence survey 2012, Nigeria
Annex 1. Survey funding and cost breakdown
Cost breakdown
Annexes
Funding Source Amount in US$ Description
Ministry of Health (MDG) 1,226,871Field operations, procurement of equipment,
logistics of sputum and communication
Global Fund 1,465,283.39 Equipment, Field Activities, etc.
World Health Organization 375,650Technical Assistance, training including
Human Resources.
Total 3,067,804
Item Cost in US$ Percentage of total Cost
Technical assistance 173,139.39 6%
Capital costs (x-ray equipment, laboratory supplies, etc.)
1,296,709.22 42%
Training 293,686.01 10%
Pre-field visit cost 38,431.90 1%
Field Operation cost 906,678.40 30%
Communication and maintenance 69,315.03 2%
Expenses for sputum transportation 176,573.50 6%
Central data management 103,729.37 3%
Stationary 5,403.27 1%
Others 4,138.30 1%
Total 3,067,804 100%

75
Annexes
Annex 2. Technical Committee
External Technical Consultants
Annex 3. Central Medical Panel
Name Position organization
Prof Emmanuel Idigbe Chairman Nigeria Institute of Medical Research, Lagos
Dr Obasanya Joshua Principal Investigator National TB Programme, Abuja
Dr Patrobas Philip Member World Health Organization, Nigeria
Dr Lovett Lawson Member Zankli Medical Center, Abuja
Prof Ekanem Ekanem Member Lagos University Teaching Hospital
Dr Chukwueme Nkemdilim Survey Coordinator 2 World Health Organization, Nigeria
Dr Temitayo Odusote Member USAID
Dr Ayodele Awe Member World Health Organization, Nigeria
Prof Bandele Member Lagos University Teaching Hospital
Dr Banwat Edmond Member Jos University Teaching Hospital
Dr Babalola Akin Member University of Abuja Teaching Hospital
Dr Ogiri Samuel Member World Health Organization, Nigeria
Dr Adamu Haruna Member World Health Organization, Nigeria
Dr Daniel Olusoji James Member World Health Organization, Nigeria
Dr Chijioke Osakwe Member World Health Organization Nigeria
Mrs Tubi Abiola Member Centre for Disease Control, Nigeria
Mr Mohammed Kassim Member National Population Commission
Dr Osahon Ogbweiwe Survey Coordinator 1
Name Position organization
Dr Ikushi Onozaki Medical Officer WHO Geneva
Dr Charalampos (Babis) Sismanidis Statistician WHO Geneva
Dr Eugene McCray Medical Officer CDC Atlanta
Dr Narayan Pendse Radiologist WHO Geneva
Dr Julia Ershova Data Specialist CDC Atlanta
Dr Cirillo Daniella Lab Consultant SRRL Milano
Name organization
Dr Ikushi Onozaki WHO
Dr Cirrilo Daniela SRRL Milano
Dr Obasanya Olusegun NTP
Dr Babalola Akinola AUTH
Dr Patrobas Philip WHO

76
Report first national TB prevalence survey 2012, Nigeria
Annex 4. Survey team members Team Leaders
Radiology team
Interviewers
Name organization
Dr Samuel Ogiri WHO-NPO North-Central zone
Dr Haruna Adamu WHO-NPO North-East zone
Dr Moses Onoh Medical Advisor TLMN
Dr Osakwe Puis Chijioke WHO-NPO South East zone
Dr Daniel Olusoji James WHO-NPO South West
Dr Jose Micheal Madu WHO-NPO South South
Name
Dr Babalola Akin Abuja University Teaching Hospital
Dr Roland Ogeh Medical Officer
Dr Madaki Yohanna Medical Officer
Dr Ibrahim Umar Radiographer
Alh Sani Ibrahim Radiographer
Dr Isaac Mokuro Medical Officer
Ahmadu Alhaji Ahmadu Radiographer
Mr Dalington Obinna Radiographer
Mr Tijanni Ibrahim Radiographer
Name
Mr John Dadu
Mr Patrick Awuya
Mrs Patience Okpe
Mr Joshua Bobai
Mrs Hadiza Garba
Mr Tijani Mohammed
Mr Shaibu Balanga
Mrs Tanna Mary Usman
Ihedinna Jabor
Clarkson Teknikio

77
Annexes
Data team
Annex 5. List of clusters
Name
Dr Osahon Ogbeiwi Consultant and Coordinator
Mr Gideon Zaphania Central Data manager
Mr Danjuma Udoji North-West data clerk
Mr Peter Ikpe South-East data clerk
Mr Kamal Bello North-Central data clerk
Mr Daniel Olusoji South-West Data clerk
Mr Tijani Usman North-East data clerk
Cluster No
Zone State Selected LgAClusters replaced due to security
concerns
1 NORTH CENTRALBENUE
Gboko
2 NORTH CENTRAL Markudi
3 NORTH CENTRAL FCTMunicipal Area
Council
4 NORTH CENTRALKOGI
Ankpa
5 NORTH CENTRAL Okene
6 NORTH CENTRAL KWARA Ilorin West
7 NORTH CENTRAL NASARAWA Lafia
8 NORTH CENTRALNIGER
Mokwa
9 NORTH CENTRAL Shiroro
10 NORTH CENTRAL PLATEAU Bassa
11 NORTH EASTADAMAWA
Yola North
12 NORTH EAST Fufore
13 NORTH EASTBAUCHI
Bauchi
14 NORTH EAST Ningi
15 NORTH EASTBORNO
Gwoza Gombi in Adamawa
16 NORTH EAST Maiduguri Gombe in Gombe
17 NORTH EAST GOMBE Akko
18 NORTH EAST TARABA Gassol
19 NORTH EAST YOBE Fune Dambam in Bauchi
20 NORTH WESTJIGAWA
Birnin Kudu
21 NORTH WEST Gwaram

78
Report first national TB prevalence survey 2012, Nigeria
22 NORTH WEST
KADUNA
Igabi
23 NORTH WEST Kaduna South
24 NORTH WEST Zaria
25 NORTH WEST
KANO
Dala
26 NORTH WEST Gwale
27 NORTH WEST Kano Municipal
28 NORTH WEST Nasarawa
29 NORTH WEST Ungogo
30 NORTH WEST
KATSINA
Funtua
31 NORTH WEST Kankara
32 NORTH WEST Katsina
33 NORTH WEST KEBBI Birnin Kebbi
34 NORTH WESTSOKOTO
Gada
35 NORTH WEST Sokoto North
36 NORTH WESTZAMFARA
Gusau
37 NORTH WEST Zurmi
38 SOUTH EAST ABIA Aba South
39 SOUTH EASTANAMBRA
Aguata
40 SOUTH EAST Idemili North
41 SOUTH EAST EBONYI Onicha
42 SOUTH EASTENUGU
Enugu East
43 SOUTH EAST Nsukka
44 SOUTH EASTIMO
Isiala Mbano
45 SOUTH EAST Mbatoli
46 SOUTH SOUTHAKWA-IBOM
EssienUdim
47 SOUTH SOUTH Uyo
48 SOUTH SOUTH BAYELSA Yenegoa
49 SOUTH SOUTH CROSS RIVER Akpabuyo
50 SOUTH SOUTHDELTA
Ughelli North
51 SOUTH SOUTH Warri South
52 SOUTH SOUTHEDO
Ikpoba-Okha
53 SOUTH SOUTH Oredo
54 SOUTH SOUTH
RIVERS
Obio/Akpor
55 SOUTH SOUTH Ogo Bolo
56 SOUTH SOUTH Port-Harcourt
List of clusters - continued

79
Annexes
57 SOUTH WEST EKITI Ado-Ekiti
58 SOUTH WEST
LAGOS
Kosofe
59 SOUTH WEST Mushin
60 SOUTH WEST Ajeromi/Ifelodun
61 SOUTH WEST Alimosho
62 SOUTH WESTOGUN
Ado Odo/Ota
63 SOUTH WEST Ifo
64 SOUTH WESTONDO
Akure South
65 SOUTH WEST Ilaje
66 SOUTH WESTOSUN
Ife East
67 SOUTH WEST Iwo
68 SOUTH WEST
OYO
Ibadan South East
69 SOUTH WESTIbadan North
East
70 SOUTH WESTIbadan South
West
List of clusters - continued

80
Report first national TB prevalence survey 2012, Nigeria
Annex 6. Survey instruments (tools)
FORM 01Federal Ministry of HealthNational Tuberculosis and Leprosy Programme
National Tuberculosis Prevalence Survey
HOUSEHOLD REGISTER
Household Number:
Zone: ______________________ State: ______________________
Cluster number: ______________________ Building Number: ______________________
Household address: ____________________________________________
__________________________________________________________________
Household contact Person: ______________________ Phone number: ______________________
Name of interviewer: ______________________ Date: ___ / ___ /___
No Survey № NameSurname first
Age Sex1-Male, 2-Female
occupation*Stayed at least 2
weeks?1 –Yes, 2 – No
Eligible?1 –Yes, 2 – No
Remarks(Reason for Absence)
Attendance1 –Yes, 2 – No
Consent1 –Yes, 2 – No
01 | |
02 | |
03 | |
04 | |
05 | |
06 | |
07 | |
08 | |
09 | |
10 | |
11 | |
81
Annexes
12 | |
13 | |
14 | |
15 | |
16
17
18
18
19
20
21
22
23
24
*Occupation classification:
1 – Constriction worker 2 – Administrative worker (including banking and financing)
3 – Healthcare worker 4 – Transport worker 5 – Business 6 – Farmer 7 – Trader
8 – Hose wife/husband 9 – Artisan (vulcanizer, electrician, cobbler, plumber, carpenter)
10 – Student 11 – Other
Team leader: ______________________ Signature: ______________________ Date: ___ / ___ /___ dd mm yyy
Data manager: _____________________ Signature: _____________________ Date: ___ / ___ /___ dd mm yyy

82
Report first national TB prevalence survey 2012, Nigeria
FORM 02Federal Ministry of HealthNTBLCP/ National Tuberculosis Prevalence Survey
SURvEy HOUSEHOLD NUMBER
Date: ___ / ___ /___ Issued by: ______________________
FORM 03Federal Ministry of HealthNational Tuberculosis and Leprosy Programme
National Tuberculosis Prevalence Survey
SURvEy SCREENING INvITATION CARD
Name: ______________________
Please come for TB Screening on: ______________________
Cluster no household no serial no
You are invited to come to ______________________ to participate
in the on-going National Tuberculosis Prevalence Survey
Appointment day and time: ______________________

83
Annexes
FORM 04Federal Ministry of HealthNational Tuberculosis and Leprosy Programme
National Tuberculosis Prevalence Survey
PARTICIPANT CONSENT FORM
Part I: Information sheet(1) Introduction:
I am from National TB Programme of the Federal Ministry of Health, Nigeria. We are con-
ducting this survey throughout the country. We would like you to give you information
about the survey and invite you to participate in all screening activities. If you have ques-
tions about these activities you can ask me.
This survey has been reviewed and approved by the National Ethical Review Committee of
the Federal Ministry of Health, and the World Health Organisation. The main person and
organisations involved in executing the survey are:
(2) Purpose of the survey:
The aims of this survey is to quantify/know the disease burden/magnitude of active pul-
monary TB (smear-positive and culture positive TB) among people aged 15 years and
above, to know occurrence of TB suggested symptoms, people/patients behaviours
against TB symptoms as well as utilization of TB service in public and private sectors. The
survey findings will be used to revise the current strategies for TB control and will help to
develop a future plan to control TB in Nigeria.
(3) Methods to be used during survey:
To fulfil above aims, community members who have been invited will be screened by;
Individual interview about TB symptoms
Chest X-ray examination, and
Principal investigator National Coordinator, National Tuberculosis Control Programme
Name of organization Federal Ministry of Health, Abuja, Nigeria
Name of organizations funding the survey
Global Fund for TB, Malaria and HIV/AIDS
World Health Organisation
Federal Government of Nigeria
Centre for Disease Control, USA
ILEP

84
Report first national TB prevalence survey 2012, Nigeria
If a participant is suspected of having TB using above two methods, sputum will be col-
lected for examination by microscopy and culture.
The entire screening process in the community would take about 30 minutes.
(4) Voluntary participation
Your participation in this survey is entirely voluntary. It is your choice whether to partici-
pate or not.
(5) Right to refuse or withdraw
If you choose not to participate in this survey there will be no penalty on you (all the ser-
vice you receive from the health centre or any health facility will continue and nothing will
change). You are free to withdraw and discontinue your participation at any time during
the survey without providing any reason.
(6) Procedure
If you decided to participate in this survey, you will be interviewed about your socio de-
mographic information, about TB suggestive symptoms, past or current anti-TB treatment
history and health seeking behaviours related to TB suggestive symptoms. The informa-
tion recorded is confidential (it will not be shared with anybody without permission).
You will be examined for TB by using a Chest X-ray. X-ray machine to be used is a digital
one that will enable you also have a view of your own lungs. If you are suspected of having
TB (after the interview and chest X-ray), you will be asked to bring two sputum samples
for examination. If the result confirms you have active TB, you will be treated according to
the NTP guidelines.
(7) Risks and discomforts
There are no psychological, social and physical hazards except the radiation expo-
sure,which has a very negligible risk. There are no risks or possible hazards to you for
being included in this survey since the average actual effect of the radiation exposure
is 0.05mSv (Sievert). Protection devises will be used and the surrounding will be out of
bound within 3 meters radius.
(8) Benefits
This study will be beneficial to the community as well as TB programme for the improve-
ment of programme management and evaluation of programme impact. The findings of
the survey would provide valuable information express the programme impact and to de-
velop the appropriate plan and strategies for efficient implementation of the National TB
Programme according to the real situation.
(9) Incentives or compensation
No compensation for any risk, but some goods may be provided for participating in this

85
Annexes
survey as a compensation of your time spent for the screening process.
(10) Confidentiality
Your participation in this survey is confidential. We will not be sharing information about
you to anyone outside of the survey teams or the State TB Programme. The information
that we collect from this survey will be kept private.
(11) Publication or sharing the results
The results of this survey will be published and made available to the National TB Pro-
grammes elsewhere. Your confidentiality will be protected as no identifying information
will be included in these publications.
(12) Who to contact
Any question regarding this survey may be directed to Dr. Joshua O. Obasanya, National
Coordinator, National TB Programme, Department of Public Health, FMOH , Abuja , Nige-
ria. Tel: 07043314737, Email: [email protected]
Part 2: Consent Sheet“I have read (or heard it read to me) the information sheet. I fully understand my partici-
pation in the screening is of no risk to my health. I also fully understand that I may with-
draw from the survey at any stage without giving any reason and my withdrawal will not
affect my usual entitlement to care and treatment.
“On these terms, I agree to participate in all screening activities of this survey, including
individual interview, chest X-ray and submission of sputum specimens if required to do so,
Or agree as parent or legal guardian of ______________________ to his / her
full participation in the survey.”
Signed: ______________________ Date: ___ / ___ /___
Print name: ______________________ (State if parent or guardian)
Witnessed by (signed): ______________________ Date: ___ / ___ /___
Print name of witness: ______________________ (a community member)
Signature of the Receptionist: ______________________ (Survey team member)

86
Report first national TB prevalence survey 2012, Nigeria
FORM 05Federal Ministry of HealthNational Tuberculosis and Leprosy Programme
National Tuberculosis Prevalence Survey
INDIvIDUAL SURvEy CARD
Survey Number:
Name of the Respondent: ______________________ Date: ___ / ___ /___
A. Identification1. Sex: 1 - Male 2 - Female
2. Age (in years) as at last birthday: _______
if age unknown, check and estimate age: _______
3. Occupation:
1. Constriction worker
2. Administrative worker (including banking and financing)
3. Healthcare worker
4. Transport worker
5. Business
6. Farmer
7. Trader
8. House wife/husband
9. Artisan (mechanics, vulcanizer, electrician, cobbler, plumber, carpenter)
10. Student
11. Other. Specify ______________________
5. Religion: 6. Marital Status:
1 - Christianity
2 - Islam
3 - Traditional
4 - Others
Specify
_________________
9 - Don’t know
1 - Single
2 - Married
3 - Separated
4 - Divorced
5 - Widowed
9 - Don’t know

87
Annexes
B. Symptoms Participant agreed to symptom screening
7. Do you have any of these symptoms? If Yes, for how long?
Note one week is 7 days, one month is 30 days.
Symptoms Days
7.1 Cough 1 - Yes 2 - No
C. Behaviour regarding symptoms (if yES for TB suspect)
D. TB Treatment History
9. What did you do about your
symptoms?
10. If option 4 is selected in question
9, where did you first seek care?
1 - Not recognized as illness
2 - Ignored
3 - Self-treatment
4 - Consulted Health Service
5 - Other
Specify: _____________________
1 - Single
2 - Married
3 - Separated
4 - Divorced
5 - Widowed
9 - Don’t know
Current TB Treatment Past History of TB Treatment
11. Are you currently taking any anti-TB drugs? 14. Have you been treated for TB in the past?
1 - Yes 2 - No 1 - Yes 2 - No
12. How long?15. If yes what was the year of your last
episode?
(In weeks, 1 month=4 weeks) _____________ _____________
13. Where are you taking the treatment? 16. Where did you receive the treatment?
1 - Health Centre/PHC
2 – Private Hospital
3 – Traditional center
4 – Chemist
5 – General Hospital
6 – Teaching Hospital
7 – Mission Hospital
8 - Other
Specify: _____________________
1 - Health Centre/PHC
2 – Private Hospital
3 – Traditional center
4 – Chemist
5 – General Hospital
6 – Teaching Hospital
7 – Mission Hospital
8 - Other
Specify: _____________________

88
Report first national TB prevalence survey 2012, Nigeria
17. Have you ever smoked tobacco?
1 - Yes 2 - No If yes, how long (in years)? ________
18. Do you currently smoke tobacco?
1 - Yes 2 - No If yes, how long (in years)? ________
19. If it is cigarette, how many sticks/day do you usually smoke?
_______ (Cigarettes)
E. Physical Examination
21. Weight: _______ (kg) Not Available
Interviewer’s name: __________________________________________________
Interviewers Signature: ____________________ Date: ___ / ___ /___
Reviewer’s Name: ____________________________________________________
Reviewers Signature: _____________________ Date: ___ / ___ /___
Interviewers should direct the respondent to the X-ray Section.
Comments __________________________________________________________
F. Chest X-Ray Findings
23. Chest X-Ray done
1 - Yes 2 - No 3 - Decline
24. If No give reason
___________________________________________________________________
G. Sputum Smear Microscopy
26. Sputum examination requested
1 - Yes 2 - No
27. Spot sputum specimen collected from subject
1 - Yes 2 - No If Yes, Date: ___ / ___ /___
Data checked complete and accurate by:
Data Manager’s name: _________________________________________________
Data Manager’s signature: ________________________ Date: ___ / ___ /___

89
Annexes
FORM 06Federal Ministry of HealthNational Tuberculosis and Leprosy Programme
National Tuberculosis Prevalence Survey
CHEST X-RAy DATA SHEET
TO BE FILLED BY RADIOLOGIST AT CENTRAL LEVEL
Date: ___ / ___ /___ Survey Number: ______________________
Zone: ______________________ State: ______________________ LGA: ________________
X-ray quality Assessment:
Good Average Below Average
X-ray Interpretation:
X-ray Second Reading Date: ___ / ___ /___ Read by ______________________
N ADNS ADS-NA ADS-NTB ADS-TB ADS-U

90
Report first national TB prevalence survey 2012, Nigeria
FORM 06bFederal Ministry of HealthNational Tuberculosis and Leprosy Programme
National Tuberculosis Prevalence Survey
CHEST X-RAy REGISTER
Zone: ______________________ State: ______________________ LGA: ________________
Cluster Number: ______________________ Date: ___ / ___ /___
SN Survey No. Name
Age
Result RemarksSputum exam
reqdRead by:
M F
/ / Yes No
/ / Yes No
/ / Yes No
/ / Yes No
/ / Yes No
/ / Yes No
/ / Yes No
/ / Yes No
/ / Yes No
/ / Yes No

91
Annexes
FORM 07Federal Ministry of HealthNational Tuberculosis and Leprosy Programme
National Tuberculosis Prevalence Survey
SPUTUM SAMPLE COLLECTION REGISTER
Zone: ______________________ State: ______________________ LGA: ________________
Date: ___ / ___ /___
Community: ______________________ Cluster Number: ______________________
Lab Serial No.
Code Name
Age Sputum Collection date
RemarksM F Day1 (S) Day2 (H)
/ /
/ /
/ /
/ /
/ /
/ /
/ /
/ /
/ /
/ /

92
Report first national TB prevalence survey 2012, Nigeria
FORM 07bFederal Ministry of HealthNational Tuberculosis and Leprosy Programme
National Tuberculosis Prevalence Survey
SPUTUM SAMPLE BATCH DISPATCH REGISTER
Zone: ______________________ State: ______________________ LGA: ________________
Date of dispatch: ___ / ___ /___
Community: ______________________ Cluster Number: ______________________
Batch Number: ______________________
Packed by: ________________________ Date: ____________________
Delivered by: ________________________ Date: ____________________
Received by: ________________________ Date: ____________________
Lab Serial No.
Survey Code Name
Sputum Collection dateDate Received
at the LabCondition when
receivedDay1 (S) Day2 (H)
/ /
/ /
/ /
/ /
/ /
/ /
/ /
/ /
/ /
/ /

93
Annexes
FORM 08Federal Ministry of HealthNational Tuberculosis and Leprosy Programme
National Tuberculosis Prevalence Survey
SPUTUM SMEAR EXAMINATION FORM
Zone: ______________________ State: ______________________ LGA: ________________
Community: ______________________ Cluster Number: ______________________
Lab. Serial Number: ______________________ Survey Number: _______/_________/______
Sputum Container: Day 1 Date: ___ / ___ /___ Spot specimen
Day 2 Date: ___ / ___ /___ Home specimen
Signature/Name of sputum Collector
Name: ______________________ Date of dispatch: ___ / ___ /___
SPUTUM SMEAR EXAMINATION RESULTS
TO BE FILLED AT REFERENCE LABORATORY
Date specimen received by lab: _______/_________/______
Sputum Smear examination:
Examined by: ______________________ Signature: ______________________
Date: ___ / ___ /___
Reading Date
Specimen Appearance
Results
Negative 1-9 1+ 2+ 3+ Not Available
Day 1(S)
Day 2(H)

94
Report first national TB prevalence survey 2012, Nigeria
FORM 08bFederal Ministry of HealthNational Tuberculosis and Leprosy Programme
National Tuberculosis Prevalence Survey
SPUTUM CULTURE EXAMINATION FORM
Zone: ______________________ State: ______________________ LGA: ________________
Community: ______________________ Cluster Number: ______________________
Lab. Serial Number: ______________________ Survey Number: _______/_________/______
Sputum Container: Day 1 Date: ___ / ___ /___ Spot specimen
Day 2 Date: ___ / ___ /___ Home specimen
Signature/Name of sputum Collector
Name: ______________________ Date of dispatch: ___ / ___ /___
SPUTUM CULTURE EXAMINATION RESULTS
Date specimen received by lab: _______/_________/______
Sputum culture examination:
Examined by: ______________________ Signature: ______________________
Date: ___ / ___ /___
Sputum
Results
Inoculation date
Reading DatePositive Negative
Contami-nated
Positive Not TB
Pos. ID unknown
Not Available
Day 1(S)
Day 2(H)

95
Annexes
FORM 15Federal Ministry of HealthNational Tuberculosis and Leprosy Programme
National Tuberculosis Prevalence Survey
INTERvIEw qUESTIONNAIRE FOR THE TB SMEAR POSITIvE OR CULTURE POSITIvE CASES DIAGNOSED
1. Survey number:
Cluster no household no serial no
2. Name: ___________________________
3. Age: ____________________________
4. Sex: (1. Male 2.Female)
5. Address: ______________________________________________________________
6. Occupation: __________________________ income: _________________________
7. Marital status: (1.Married, living together 2.Married, living separately
3.Divorced 4.Widowed 5.Never married 6.Other (Specify) ____________________
8. How many family members living together including patient?
9. Position in a household:
1.Head of household 2.Spouse of head 3.Parents of the household head
4.Sibling or grandchild of the household head 5. non family member 6.Other
(Specify) ___________________
10. Distance from home to any TB diagnostic centre under NTP ______________ Km

96
Report first national TB prevalence survey 2012, Nigeria
11. Cost for one way transportation to TB diagnostic centre _______________ Naira
12. Time spent for one visit to TB clinic ____________________ hours
13. Are you a native? (1.Yes 2.No)
14. How long have you been living in this address? ___________________
15. Status of bacteriological examination (1.S+ 2.S neg. C+)
16. Type of TB patient (1.New 2.Relapse 3.Treatment after default 4.Failure)
17. Treatment Category put on (1.Cat I 2. Cat II)
18. Did you know you had TB before the Survey (during interview)?
(1.Yes 2.No)
19. If yes, for how long have you known you had TB? ____________ (Months)
20. If yes, why did you delay treatment? State reason: ____________________________

97
Annexes
Annex 7. Cluster summary of participation according to screening methods
Cluster Setting
Census, eligible, participant populationsTreatment
historyInterview screening CXR screening
Positive by
either
Specimens collected
Enumer-ated
EligibleNon-
resident adults
ChildrenPartici-pants
Ever Current PositiveNo
symptomsPositive Done Spot Morning
1 Rural 1461 922 9 530 686 8 7 57 392 19 671 61 61 60
2 Urban 1375 925 2 448 639 13 1 35 446 68 638 83 82 76
3 Urban 1276 1050 1 225 376 4 2 26 221 29 375 48 48 47
4 Rural 1621 955 0 666 720 19 2 33 436 13 718 39 38 34
5 Urban 1494 1062 0 432 738 8 1 39 209 20 738 49 44 43
6 Urban 1820 1082 3 737 407 4 2 11 310 8 406 17 16 13
7 Rural 1941 1078 0 863 711 6 0 34 310 94 696 116 115 97
8Semi-Urban
1378 949 5 428 325 5 2 27 181 80 324 90 87 60
9 Rural 2035 1354 1 681 663 8 1 57 317 175 663 204 203 199
10 Rural 1954 1304 0 650 745 19 0 78 323 112 744 156 155 143
11Semi-Urban
1884 1133 6 751 761 18 2 30 560 44 709 60 60 49
12 Rural 1603 834 66 705 599 4 0 16 492 21 555 30 30 21
13 Rural 1584 964 70 618 621 9 1 26 426 61 562 80 72 65
14 Rural 1837 1032 20 803 819 2 0 42 589 35 721 71 69 64
15Semi-Urban
1559 916 126 522 737 12 4 39 621 37 719 61 60 59
16 Urban 1567 983 2 582 604 1 0 9 549 7 576 15 15 13
17 Rural 1776 884 137 757 779 2 2 13 648 14 735 24 24 18
18 Rural 1405 1078 0 327 802 6 0 23 575 26 708 44 44 43
19 Rural 1605 875 3 729 765 11 1 24 624 16 717 32 32 29
20 Rural 1536 953 19 582 809 1 0 24 639 17 704 37 37 37
21 Rural 1512 896 3 616 766 10 1 31 598 26 703 47 47 45
22Semi-Urban
1907 1132 7 769 638 2 1 16 344 74 635 85 85 81
23 Rural 1895 1093 0 802 713 4 1 57 269 181 712 205 205 205
24 Urban 1384 1035 6 347 363 1 0 11 259 2 331 13 13 13
25 Urban 1538 1461 0 77 727 8 2 18 493 60 713 73 61 60
26 Urban 1918 1457 0 461 710 14 1 32 456 35 657 55 52 50
27 Urban 1864 1298 1 566 661 13 1 36 444 105 661 120 120 109
28 Urban 1788 1215 0 573 531 13 1 34 260 59 525 76 76 70
29 Rural 1811 1246 1 565 713 12 1 32 379 68 708 92 85 78
30 Urban 2104 1249 4 854 731 4 0 23 473 18 730 36 34 21
31 Rural 2011 975 12 1028 729 0 0 25 479 53 726 67 67 66
32 Urban 2549 1441 0 1108 447 1 0 21 350 16 430 32 30 29
33 Urban 1777 951 54 826 721 2 0 46 402 25 718 63 58 52
34 Rural 1897 1087 14 796 731 4 2 27 582 13 714 34 34 24
35 Urban 2143 1525 3 617 731 0 0 79 540 23 723 83 83 72

98
Report first national TB prevalence survey 2012, Nigeria
Cluster Setting
Census, eligible, participant populationsTreatment
historyInterview screening CXR screening
Positive by
either
Specimens collected
Enumer-ated
EligibleNon-
resident adults
ChildrenPartici-pants
Ever Current PositiveNo
symptomsPositive Done Spot Morning
36 Urban 1799 1072 4 725 356 0 1 27 231 22 354 36 34 28
37 Rural 2035 1112 5 920 711 4 1 17 534 41 710 47 38 36
38 Urban 1295 930 0 365 334 5 0 32 218 8 329 34 32 31
39 Rural 1423 1046 6 372 553 8 0 41 382 5 553 44 43 39
40 Urban 1602 1083 4 515 573 4 0 18 388 2 573 19 19 19
41 Rural 1247 849 2 396 532 5 2 40 290 45 524 73 65 53
42 Urban 987 820 6 165 279 7 1 15 201 10 277 22 16 15
43 Urban 1183 845 1 337 475 11 1 33 333 34 473 54 48 44
44 Rural 1120 868 2 251 535 1 1 31 374 15 521 42 39 35
45 Rural 1274 977 19 278 538 7 0 56 236 18 531 68 65 50
46 Rural 1304 968 7 335 526 9 3 45 327 59 522 86 83 66
47 Urban 1527 1142 10 382 464 5 1 24 285 42 463 61 60 60
48 Urban 1510 1271 13 238 726 9 2 23 375 18 711 40 38 25
49 Rural 1685 1085 9 598 615 7 2 64 266 29 611 83 83 64
50 Urban 1527 1229 9 296 706 9 5 111 280 29 702 122 120 107
51 Rural 1380 1277 5 103 723 4 3 48 374 14 720 52 51 46
52 Urban 1534 1358 3 174 672 2 0 56 378 10 672 63 61 52
53 Urban 1326 1274 4 50 741 10 1 77 413 15 739 84 83 65
54 Urban 1112 860 2 252 484 3 0 32 310 59 484 82 78 74
55 Rural 1076 865 6 209 529 12 1 61 232 70 526 109 104 99
56 Urban 1788 1230 56 542 529 4 2 34 316 62 528 85 81 69
57 Urban 1412 1213 7 193 662 7 1 17 495 19 662 32 32 29
58 Urban 1586 1115 0 471 515 6 0 13 306 6 504 18 18 17
59 Urban 1698 1237 1 460 637 12 0 30 343 14 632 39 39 37
60 Urban 1921 1395 2 524 665 23 4 58 375 34 660 69 69 68
61 Urban 1705 1158 4 547 580 4 0 15 381 5 572 19 19 19
62 Rural 1715 1164 30 526 653 11 1 27 423 20 644 39 39 39
63 Urban 1662 1074 5 587 605 13 1 23 458 24 594 37 37 37
64 Urban 1758 1263 5 490 754 11 0 32 514 39 753 62 62 55
65 Rural 1388 1029 9 352 642 19 1 29 414 33 638 50 48 45
66 Urban 1505 1311 1 193 718 8 0 31 518 35 718 58 58 56
67 Urban 1715 1349 2 364 742 21 5 51 506 49 741 78 78 76
68 Urban 1348 1054 3 291 662 13 2 48 515 233 662 248 243 217
69 Urban 1940 1533 6 401 733 13 1 26 632 85 733 95 94 91
70 Urban 1351 1347 0 4 799 17 0 50 555 111 798 140 134 130
TOTAL 113247 77797 823 34947 44186 552 82 2466 28374 2968 43199 4688 4553 4138
Cluster summary of participation - continued


Report FIRST National TB Prevalence Survey 2012, Nigeria
f e d e r a l republic of
nigeria
http://ntblcp.gov.ng
National Tuberculosis and Leprosy Control Programme