Embed Size (px)
Citation preview

8/12/2019 Access to Intl Capital Markets
http://slidepdf.com/reader/full/access-to-intl-capital-markets 1/29
Access to international capital markets:recent developments in Central America
and the Caribbean
Inés Bustillo
Helvia Velloso
ECLAC Washington Office
Washington, D.C., 23 April 2014
U n i t e d N a t i o n s
E c o n o m i c
C o m m i s s i o n f o r
L a t i n A m e r i c a a n d
t h e C a r i b b e a n
ECLAC
WASHINGTON Office
LC/WAS/L.129

8/12/2019 Access to Intl Capital Markets
http://slidepdf.com/reader/full/access-to-intl-capital-markets 2/29
This document was prepared by Inés Bustillo, Director and Helvia Velloso, Economic Affairs Officer, of theEconomic Commission for Latin America and the Caribbean (ECLAC) Washington Office.The views expressedin this document, which has been reproduced without formal editing, are those of the authors and do notnecessarily reflect the views of the Organization.

8/12/2019 Access to Intl Capital Markets
http://slidepdf.com/reader/full/access-to-intl-capital-markets 3/29
1
Contents
List of abbreviations ............................................................................. 3
Abstract ................................................................................................ 5
Overview ............................................................................................... 7
I. Bond markets and debt management ..................................... 11
A.
Sovereign spreads ........................................................................ 12
B.
Bond issuance .............................................................................. 15
II.
Credit ratings evolution ........................................................... 19
Concluding remarks .......................................................................... 25
Bibliography ....................................................................................... 27

8/12/2019 Access to Intl Capital Markets
http://slidepdf.com/reader/full/access-to-intl-capital-markets 4/29
2
Figures
FIGURE 1 CBOE VOLATILITY INDEX AND EMBIG: 2007-2014 YTD ..................................................... 8
FIGURE 2 DEBT ISSUANCE IN LAC AND CAC .......................................................................................... 8
FIGURE 3 MSCI EQUITY PRICE INDEX (USD): 2008-2013 ........................................................................ 9
FIGURE 4 MSCI EQUITY PRICE INDEX (USD): FRONTIER MARKETS ................................................. 9
FIGURE 5 EMBIG SPREADS: CA AND CARIBBEAN VS LATIN AMERICA ..........................................12
FIGURE 6 EMBIG AND LATIN COMPOSITE: CA AND CARIBBEAN COUNTRIES’ SPREADS ..........13 FIGURE 7 ANNUAL LATIN AMERICA AND CARIBBEAN DEBT ISSUANCE: 2000-2013 ...................15
FIGURE 8 CA AND CARIBBEAN SHARE OF TOTAL LAC ISSUANCE: 2000-2013 ..............................16
FIGURE 9 CA AND CARIBBEAN ISSUANCE BY COUNTRY: 2000-2013 ..............................................17
FIGURE 10 CA AND CARIBBEAN ISSUANCE 2000-2013: COUNTRY SHARES ..................................17
FIGURE 11 SOVEREIGN AND CORPORATE CA AND CARIBBEAN ISSUANCE: 2000-2013 ..............18
FIGURE 12 AVERAGE CREDIT RATINGS (S&P AND MOODY’S): 2006-2013 ......................................20

8/12/2019 Access to Intl Capital Markets
http://slidepdf.com/reader/full/access-to-intl-capital-markets 5/29
3
List of abbreviations
CAC Central America and the CaribbeanCRAs Credit rating agenciesEMBIG J.P.Morgan Emerging Market Bond Index GlobalEMTA Emerging Markets Trade Association
LAC Latin America and the CaribbeanMSCI Morgan Stanley Capital International Index

8/12/2019 Access to Intl Capital Markets
http://slidepdf.com/reader/full/access-to-intl-capital-markets 6/29

8/12/2019 Access to Intl Capital Markets
http://slidepdf.com/reader/full/access-to-intl-capital-markets 7/29
5
Abstract
The objective of this report is to analyze the impact of recent globalfinancial trends on the access to private external financing by CentralAmerican and Caribbean (CAC) economies, as well as their performancein international capital markets in recent years. The CAC economies, likemany other countries in the world, were not immune to the negativeconsequences of the global economic and financial crisis of 2008. In fact,their openness, export driven growth and linkages to advanced economies,
particularly to the U.S., as well as size, made them more vulnerable thanother Latin American countries to the negative effects of the crisis. Inaddition, their recovery was hindered by their weak linkages to the largeremerging market countries that drove global growth in the post-crisisrecovery. As China and other emerging market economies begin toslowdown, however, and the U.S. and other adavanced economies showsigns of a strengthening recovery, the linkages to advanced economiesmay once again become a source of strength.

8/12/2019 Access to Intl Capital Markets
http://slidepdf.com/reader/full/access-to-intl-capital-markets 8/29

8/12/2019 Access to Intl Capital Markets
http://slidepdf.com/reader/full/access-to-intl-capital-markets 9/29
7
Overview
Cross-border private capital flows to Latin America and the Caribbean(LAC) have increased sharply in the past decade. However, CentralAmerica and the Caribbean (CAC) face particular challenges in attractingglobal capital. Vulnerability to economic shocks, as well as small size,implying a narrow range of economic activities, limited economies ofscale and constrained competitiveness affect access to internationalcapital. Their access to global capital markets thus tends to be morelimited and costly than that of other countries of Latin America.Vulnerability tends to increase during periods of external shocks andfinancial turbulence. During the 2008 global financial crisis and in itsaftermath, some CAC countries seem to have felt a bigger impact than therest of the LAC region, with larger increases in their sovereign debtspreads and sharper downgrades in their credit risk ratings.
Over the past three years, a number of Caribbean countries haverestructured bond payments, making this period one with the highestnumber of defaults on loan agreements in the Caribbean region.Country risk, as measured by debt spreads, increased as a result. Fromlate 2010 to late 2012 the spread gap between the Caribbean countriesand the EMBIG Latin component widened by almost 700 basis points.
In 2013, however, while LAC sovereign spreads widened by 67 basis points according to the J.P.Morgan EMBIG Latin component, spreadsfor the Caribbean region tightened by 589 basis points, reversing mostof the spread gap (see figure 1).
The main reason for the tightening of the CAC spreads averagein 2013 was the large decline in spreads for Belize, following theexchange offer made on 15 February 2013 for its US$ 547 million2029 “super bond” that reached a participation rate of 86.17%.

8/12/2019 Access to Intl Capital Markets
http://slidepdf.com/reader/full/access-to-intl-capital-markets 10/29
8
0
2,000
4,000
6,000
8,000
10,000
12,000
0
20,000
40,000
60,000
80,000
100,000
120,000
140,000
2000 2001 2002 2003 2004 2005 2006 2007 2008 2009 2010 2011 2012 2013
LAC CA+Caribbean
0
200
400
600
800
1000
1200
0
10
20
30
40
50
60
70
80
90
VIX Close EMBIG LATIN EMBIG AVG CA+CARIBBEAN
FIGURE 1CBOE VOLATILITY INDEX AND EMBIG: 2007-2014 YTD
(VIX Close (left axis), Basis Points (right axis))
Source: J.P. Morgan, "EMBI Monitor" and Chicago Board Options Exchange, www.cboe.com/micro/vix/historical.aspx
Note: VIX values greater than 30 are generally associated with a large amount of volatility, while values below 20 generallycorrespond to less stressful, even complacent, times in the markets.
In terms of debt issuance, the post-crisis recovery in CAC was also lackluster relative to therecovery of the LAC region as a whole. During the crisis, debt issuance fell more in CentralAmerica and the Caribbean than in the rest of the region, and while CAC debt issuance began toreally recover only in 2011, Latin American debt issuance began its recovery in 2009 (see figure 2).
FIGURE 2DEBT ISSUANCE IN LAC AND CAC
(US$ Millions; LAC bond issuance (left axis), CAC bond issuance (right axis))
Source: ECLAC, on the basis of data from LatinFinance, J.P.Morgan and Bank of America/Merrill Lynch.
8/12/2019 Access to Intl Capital Markets
http://slidepdf.com/reader/full/access-to-intl-capital-markets 11/29
9
60
70
80
90
100
110
120
130
140
150
Jun-12 Sep-12 Dec-12 Mar-13 Jun-13 Sep-13 Dec-13
FM (FRONTIER MARKETS) JAMAICA TRINIDAD AND TOBAGO
60
80
100
120
140
160
180
200
220
240
EM LATIN AMERICA G7 JAMAICA TRINIDAD AND TOBAGO
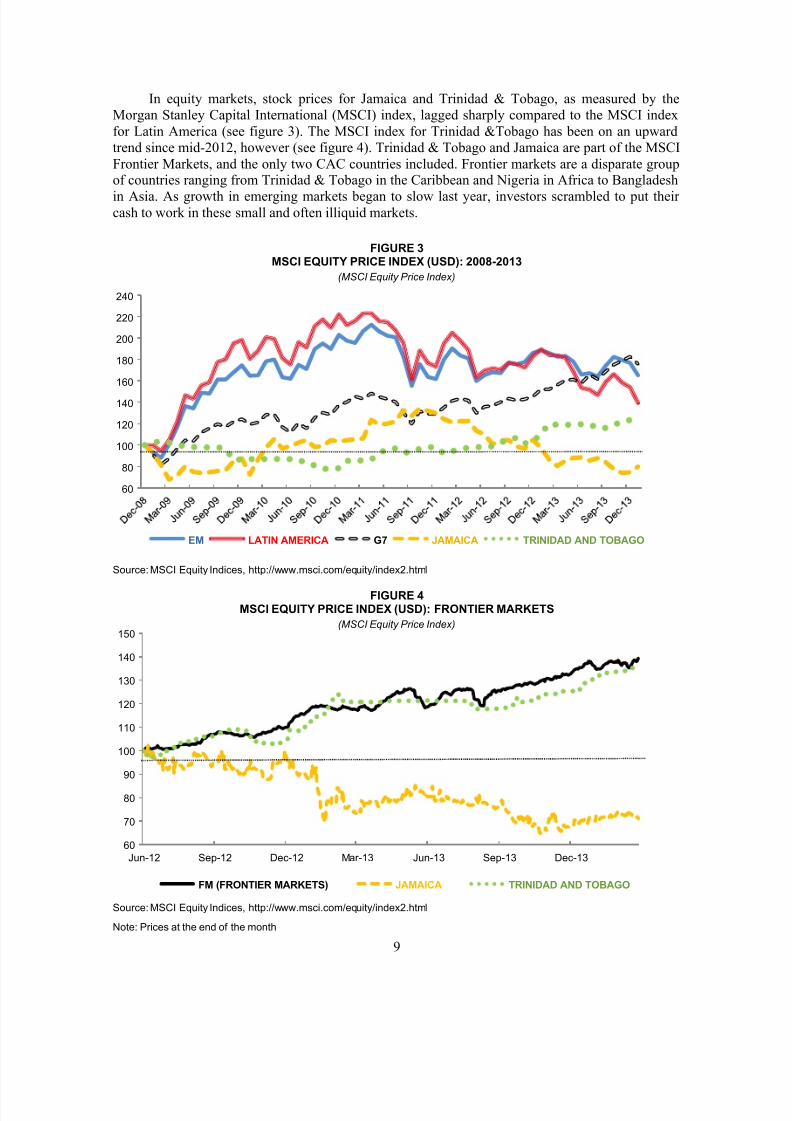
In equity markets, stock prices for Jamaica and Trinidad & Tobago, as measured by theMorgan Stanley Capital International (MSCI) index, lagged sharply compared to the MSCI indexfor Latin America (see figure 3). The MSCI index for Trinidad &Tobago has been on an upwardtrend since mid-2012, however (see figure 4). Trinidad & Tobago and Jamaica are part of the MSCIFrontier Markets, and the only two CAC countries included. Frontier markets are a disparate groupof countries ranging from Trinidad & Tobago in the Caribbean and Nigeria in Africa to Bangladesh
in Asia. As growth in emerging markets began to slow last year, investors scrambled to put theircash to work in these small and often illiquid markets.
FIGURE 3MSCI EQUITY PRICE INDEX (USD): 2008-2013
(MSCI Equity Price Index)
Source: MSCI Equity Indices, http://www.msci.com/equity/index2.html
FIGURE 4MSCI EQUITY PRICE INDEX (USD): FRONTIER MARKETS
(MSCI Equity Price Index)
Source: MSCI Equity Indices, http://www.msci.com/equity/index2.html
Note: Prices at the end of the month
8/12/2019 Access to Intl Capital Markets
http://slidepdf.com/reader/full/access-to-intl-capital-markets 12/29
10
Small countries are heavily dependent on external capital and this dependency makes them particularly exposed to fluctuations in external capital, such as those caused by the 2008 globalfinancial crisis. In what follows, we will analyze access to international capital markets by CACeconomies in the recent period. The report is structured as follows: in the first section, the bondmarkets and debt management by the economies of CAC is analyzed, including the behavior before,during and after the global financial crisis of sovereign debt spreads and new debt issuance. In
parallel with the increase in debt spreads, some CAC countries experienced downgrades in theircredit risk classification during the crisis. However, unlike most countries of the rest of LatinAmerica, very few of these countries were able to regain their previous ratings, thus in the secondsection of the paper the credit ratings evolution is examined. We conclude with some finalreflections on what happened and what lies ahead, keeping in mind that financial stability andintegration is integral to economic growth and development.1
1
The data used in this report to evaluate CAC countries’ access to international capital markets – including debt spreads,new debt issuance, credit ratings and equity prices – are from private market sources. Data is not available for allcountries. For country risk, we use the J.P.Morgan Emerging Bond Markets Index Global (EMBIG), which includesonly seven CAC countries: Belize, Costa Rica, Dominican Republic, Guatemala, Panama, El Salvador and Trinidad &Tobago.
For debt issuance, all CAC issuers – based on information provided by LatinFinance, J.P.Morgan and Bank ofAmerica/Merrill Lynch – are included.
For equity prices and trends in equity flows we use the Morgan Stanley Capital International (MSCI) Latin AmericanIndex, which does not include any CAC country and is used for comparison, and the MSCI Frontier Markets LatinAmerican and Caribbean Index. The latter includes only two CAC countries: Jamaica and Trinidad & Tobago.
Finally, for credit ratings, information from the three main credit rating agencies – Standard and Poor’s, Moody’s andFitch – is used. The three agencies provide ratings for about fifteen CAC countries.

8/12/2019 Access to Intl Capital Markets
http://slidepdf.com/reader/full/access-to-intl-capital-markets 13/29
11
I. Bond markets and debtmanagement
Increasing access to the international bond markets has been an essentialelement of LAC’s external financing since the 1990s. The importance of bond financing as a source of external funding to Latin America rosesubstantially since then, with the number and value of bonds issuedsurging considerably over the course of the past two decades. Bondfinancing is a growing source of external development financing for the
region, being second only to foreign direct investment.
Bonds have become a more significant source of external capitalto some of the countries of CAC over this period, but not to all. Thefollowing sections focus on the trajectory of bond spreads andissuance, as well as credit quality, during the 2008 global financialcrisis, the post-crisis period and beyond. The behavior of bond spreadsand new debt issuance in the period supports the notion that access tointernational bond markets for small, vulnerable economies tends to bemore sporadic and more costly than for larger economies. Countries inCAC were hit harder during the crisis, and have not yet regained their pre-crisis standings.
The trend towards financial openness gained renewed impetus inthe 1990s. It was widespread, although it was less intense in theCaribbean. Using the Chinn-Ito index of financial openness, ECLAC(2012) shows that for the region as a whole, the index had surpassedthe levels seen in the 1970s by the mid-1990s, but financial opennessin the Caribbean did not return to the 1970s levels until the 2000s. Bythe late 2000s the economies of Latin America and the Caribbean hadachieved the highest degree of financial-account openness of alldeveloping economies.

8/12/2019 Access to Intl Capital Markets
http://slidepdf.com/reader/full/access-to-intl-capital-markets 14/29

8/12/2019 Access to Intl Capital Markets
http://slidepdf.com/reader/full/access-to-intl-capital-markets 15/29
13
0
500
1000
1500
2000
2500
3000
Latin EMBIG Belize Costa RicaDominican Rep Guatemala JamaicaPanama El Salvador Trinidad & Tobago
In the second half of 2009, and over the course of 2010, CAC spreads began to tightentowards pre-crisis levels and to close some of the gap with the rest of LAC.
In 2011, however, CAC spreads widened more than the regional average and the gap openedagain and continued to widen in 2012. From late 2010 to late 2012 the spread gap between theCaribbean countries and the EMBIG Latin component widened by almost 700 basis points, as anumber of Caribbean countries restructured bond payments that made this period one with thehighest number of defaults on loan agreements in the Caribbean.
In 2013 the gap began to close again: while LAC sovereign spreads widened by 67 basis points according to the J.P.Morgan EMBIG Latin component, spreads for CAC tightened by 225 basis points, with spreads for the Caribbean region alone tightening by 589 basis points, reversingmost of the spread gap. 3
2013 was a year of investor pessimisim toward emerging markets, characterized by investoroutflows from the asset class prompted by the U.S. Federal Reserve’s warning in May that it wascontemplating “tapering” (or reducing) their quantitative easing (QE) efforts, as well as by rising U.S.Treasury yields and concerns over emerging markets growth. For the most part, this pessimism hit LatinAmerican countries harder than countries in the Central America and the Caribbean.
FIGURE 6EMBIG AND LATIN COMPOSITE: CA AND CARIBBEAN COUNTRIES’ SPREADS
(Basis points)
Source: ECLAC on the basis of data from JPMorgan.
The main reason for the tightening of the CAC spreads average in 2013 was the large declinein spreads for Belize (see figure 6). Belize’s spreads tightened 1,438 basis points in 2013, more thancompensating for the 854 basis points spread widening that took place in 2012.
3 The spread average for CAC based on J.P.Morgan EMBIG spreads include: Belize, Costa Rica, Dominican Republic,Guatemala, Jamaica, Panama, El Salvador and Trinidad & Tobago. Spreads for Costa Rica were added to the EMBIGin July 2012 and for Guatemala in June 2012. Spreads for T&T were available from May 2007 to March 2009 andfrom August to December 2013. The Caribbean average includes Belize, Dominican Republic, Jamaica and T&T.

8/12/2019 Access to Intl Capital Markets
http://slidepdf.com/reader/full/access-to-intl-capital-markets 16/29
14
The reason for Belize’s spread decline was the exchange offer made in February 2013 for itsUS$ 547 million 2029 “super bond” and the government’s announcement in March that holders of86.17% of the country's U.S. dollar bonds due 2029 had decided to participate in the restructuringand exchange their bonds for new U.S. dollar bonds due 2038.
While volatility in the beginning of 2014 led to a widening in emerging market spreads, inthe case of Belize there was no widening, with spreads still at 807 basis points at the end of January2014. Belize’s spreads tightened 83 basis points in the first quarter of 2014.
In January 2014, the EMBIG Latin widened by 86 basis points, but spreads for the Caribbeanregion widened only 4 basis points. While the Caribbean countries for the most part felt a biggerimpact than the rest of the region during periods of higher volatility since the global financial crisis,in this latest bout of volatility in January 2014, the opposite took place. The Caribbean region wasmostly unscathed, while the rest of the region was hit hard. The bout of volatility in January wastriggered by economic turmoil in emerging market countries, compounded by fears of a slowdownin China, which led to concerns amid investors. Given the Caribbean’s weak linkages to theChinese economy and major emerging markets, the impact on these countries was not as strong ason the rest of the LAC region.
With an IMF agreement in place, the Dominican Republic has displayed stronger public finances,received unprecedented FDI flows, and is selling foreign currency bonds at lower yields than in therecent past, while deepening local markets. Although during the global financial crisis DominicanRepublic’s spreads were above the Latin American regional average, in 2013 they widened only by 6 basis points, compared to a widening of 67 basis points for the EMBIG Latin component. In the firstquarter of 2014, Dominican Republic’s spreads tightened 19 basis points, and at 330 basis points at theend of March, are lower than the regional average.
Jamaica’s spreads also tightened in 2013 by 70 basis points. In January 2014 spreadstightened further, by 15 basis points. The tightening in 2013 and in January 2014 was enough tocompensate for the 74 basis points spread widening that took place in 2012. In the first quarter of2014, Jamaican spreads tightened by 110 basis points. The government has renegotiated anagreement with the International Monetary Fund – a 48-month, US$ 932 million Extended
Arrangement – which was approved by the Fund’s Executive Board on 1 May 2013, which is a positive for debt spreads, hence the tightening since then.
However, the uncertainty surrounding Jamaica’s economy – marked by high deficits, a large public debt burden and challenging foreign exchange reserves, while facing a tough global economy – has translated into higher than average spreads, which at 531 basis points at the end of March2014, remained above the regional average. For many years Jamaica’s economy was driven byexports and tourism, but both were hit by the global recession and the economy is still struggling toshake off the effects, while concerns about the social effects of the crisis are rising.
Spreads for Trinidad & Tobago were added to the J.P.Morgan EMBIG index again on 30August 2013 (T&T spreads were previously included in the EMBIG for the period of May 2007 toMarch 2009). During the bout of volatility in January 2014, Trinidad & Tobago’s spreads tightened
14 basis points. At the end of March 2014 spreads were at 199 basis points, around half of theregional average. They tightened 54 basis points in the first quarter of 2014.
The impact of the recent bout of volatility on Central America was also milder than in the rest ofthe region. Spreads for Costa Rica, for example, which was only added to the J.P.Morgan EMBIG indexon 31 July 2012, widened 50 basis points in January 2014, less than the widening in the Latin EMBIG.In 2013, Costa Rica’s spreads widened 48 basis points, also less than the 67 basis points widening for theLatin EMBIG.

8/12/2019 Access to Intl Capital Markets
http://slidepdf.com/reader/full/access-to-intl-capital-markets 17/29
15
Guatemala’s spreads were added to the J.P.Morgan EMBIG index on 29 June 2012. Theytightened 28 basis points in 2013 and eighteen basis points in the first quarter of 2014. At the end ofMarch 2014, Guatemala’s spreads were at 218 basis points, well below the regional average.
El Salvador ’s spreads had been broadly following the regional average, but in 2011 thesovereign was downgraded by S&P and Moody’s, with the agencies citing the high debt-to-GDP ratio,high level of bank non-performing loans, and growing political uncertainty, as reasons for thedowngrades. The sovereign was downgraded again by Moody’s in November 2012 and by Fitch inJuly 2013. Nonetheless, El Salvador’s spreads were at 389 basis points at the end of 2013, comparedto 393 basis points for the Latin EMBIG. El Salvador’s spreads widenined 31 basis points in the firstquarter of 2014, a bigger widening than that of the Latin EMBIG.
Panama, having received an investment grade in 2010, has actually performed better than theLatin American average, with spreads at 188 basis points at the end of March 2014. In the firstquarter of 2014, Panama’s spreads tightened 11 basis points.
B. Bond issuance
The volume of international bond issuance (corporate and sovereign combined) in Latin America
and the Caribbean rose considerably since 2000, from US$ 40 billion to a record US$ 123 billion in2013 (see figure 7).
FIGURE 7ANNUAL LATIN AMERICA AND CARIBBEAN DEBT ISSUANCE: 2000-2013
(US$ Billions)
Source: ECLAC, on the basis of data from LatinFinance, J.P.Morgan and Bank of America/Merrill Lynch.
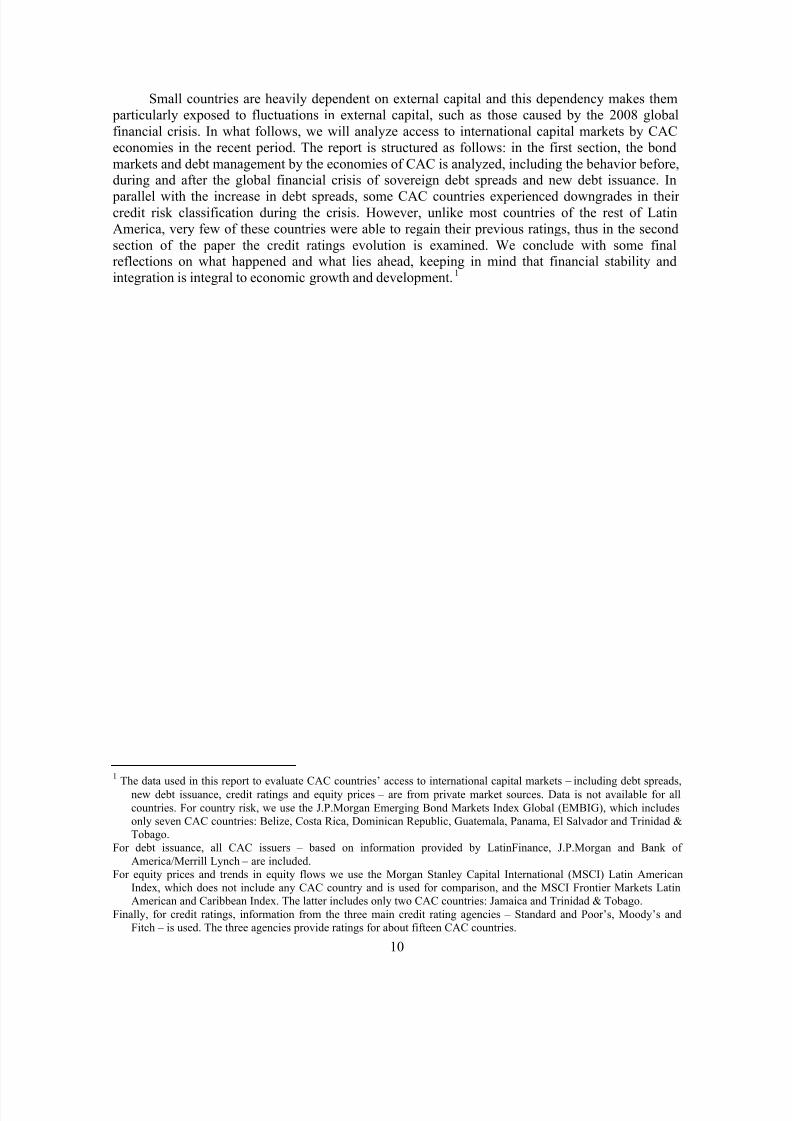
Despite the record amount of issuance in the LAC region since 2009, debt issuance by theCAC as a share of the total LAC issuance has not yet recovered since the global financial crisis.After reaching its lowest level since 2000 in 2010, further evidence that the small economies of theregion have struggled to return to pre-crisis levels, the CAC’s share of total LAC issuance has beengradually increasing, and reached 8.2% in 2013 (see figure 8).
40.14 38.18
19.48
46.20
34.06
45.84 45.2842.11
19.91
65.40
90.18 91.69
114.53
123.33
0
20
40
60
80
100
120
140
Two-period Moving Average
8/12/2019 Access to Intl Capital Markets
http://slidepdf.com/reader/full/access-to-intl-capital-markets 18/29
16
3.54%
9.14%
15.69%
5.27%
8.21%7.72%
11.48% 11.42%
6.15%6.84%
3.27%
3.86%
5.98%
8.20%
0%
2%
4%
6%
8%
10%
12%
14%
16%
18%
Two-period Moving Average
FIGURE 8CENTRAL AMERICA & CARIBBEAN’S SHARE OF TOTAL LAC ISSUANCE: 2000-2013
(Percentage)
Source: ECLAC, on the basis of data from LatinFinance, J.P.Morgan and Bank of America/Merrill Lynch.
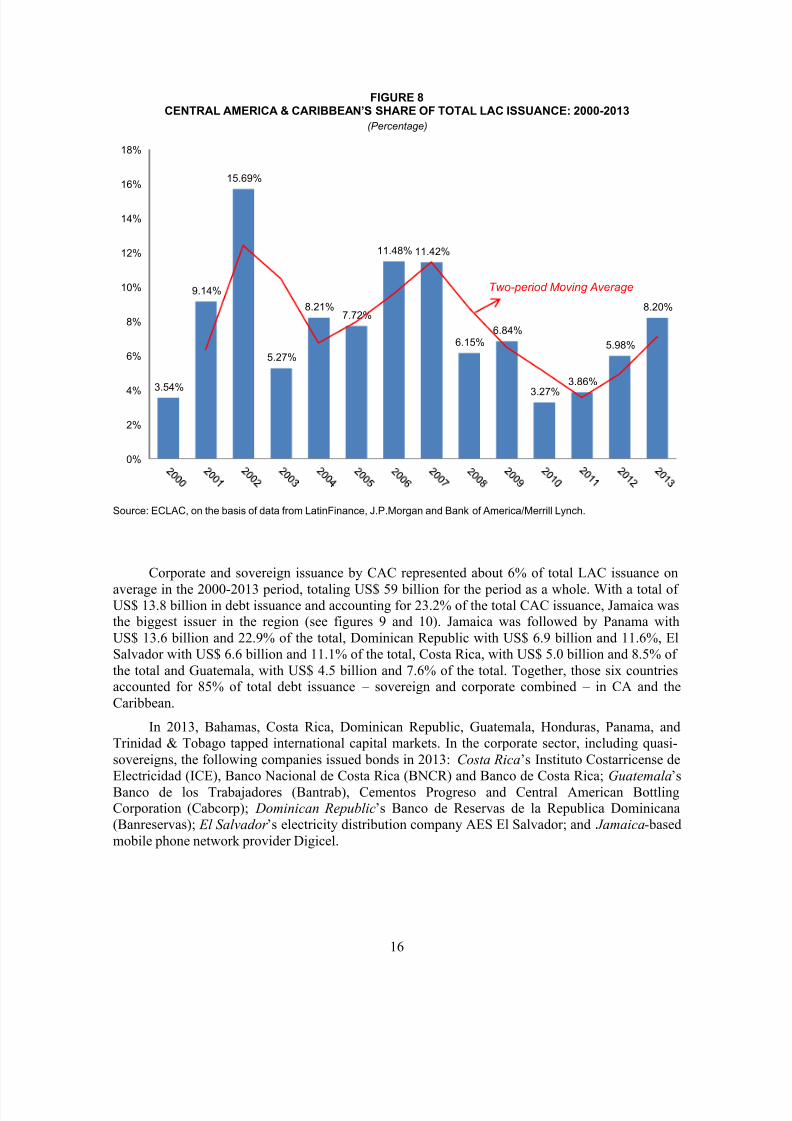
Corporate and sovereign issuance by CAC represented about 6% of total LAC issuance on
average in the 2000-2013 period, totaling US$ 59 billion for the period as a whole. With a total ofUS$ 13.8 billion in debt issuance and accounting for 23.2% of the total CAC issuance, Jamaica wasthe biggest issuer in the region (see figures 9 and 10). Jamaica was followed by Panama withUS$ 13.6 billion and 22.9% of the total, Dominican Republic with US$ 6.9 billion and 11.6%, ElSalvador with US$ 6.6 billion and 11.1% of the total, Costa Rica, with US$ 5.0 billion and 8.5% ofthe total and Guatemala, with US$ 4.5 billion and 7.6% of the total. Together, those six countriesaccounted for 85% of total debt issuance – sovereign and corporate combined – in CA and theCaribbean.
In 2013, Bahamas, Costa Rica, Dominican Republic, Guatemala, Honduras, Panama, andTrinidad & Tobago tapped international capital markets. In the corporate sector, including quasi-sovereigns, the following companies issued bonds in 2013: Costa Rica’s Instituto Costarricense deElectricidad (ICE), Banco Nacional de Costa Rica (BNCR) and Banco de Costa Rica; Guatemala’s Banco de los Trabajadores (Bantrab), Cementos Progreso and Central American BottlingCorporation (Cabcorp); Dominican Republic’s Banco de Reservas de la Republica Dominicana(Banreservas); El Salvador ’s electricity distribution company AES El Salvador; and Jamaica-basedmobile phone network provider Digicel.
8/12/2019 Access to Intl Capital Markets
http://slidepdf.com/reader/full/access-to-intl-capital-markets 19/29
17
13,767 13,563
6,874 6,604
5,0104,485
3,3252,880
1,020 900 772100
-
2,000
4,000
6,000
8,000
10,000
12,000
14,000
16,000
23.22%
22.87%
11.59%
11.14%
8.45%
7.56%
5.61%
4.86%
1.72%
1.52%
1.30%
0.17%
0% 5% 10% 15% 20% 25%
Jamaica
Panama
Dom. Rep.
El Salvador
Costa Rica
Guatemala
T & T
Barbados
Honduras
Bahamas
Belize
Grenada
FIGURE 9CENTRAL AMERICA & CARIBBEAN ISSUANCE BY COUNTRY: 2000-2013
(US$ Millions)
Source: ECLAC, on the basis of data from LatinFinance, J.P.Morgan and Bank of America/Merrill Lynch.
FIGURE 10
CENTRAL AMERICA & CARIBBEAN ISSUANCE 2000-2013: COUNTRY SHARES
(Percentage)
Source: ECLAC, on the basis of data from LatinFinance, J.P.Morgan and Bank of America/Merrill Lynch.

8/12/2019 Access to Intl Capital Markets
http://slidepdf.com/reader/full/access-to-intl-capital-markets 20/29
18
1.42
3.492.89
2.272.85
2.282.92
1.651.14
2.42
0.95
2.31 2.50
5.00
0.00
0.000.17
0.00
0.11 1.26
2.41
3.10
0.03
2.05
2.02
1.26
4.35
5.11
0%
6%
0%4%
36%
45%
65%
46%
68%
35%
64%
51%
0%
10%
20%
30%
40%
50%
60%
70%
80%
0
2
4
6
8
10
12
2000 2001 2002 2003 2004 2005 2006 2007 2008 2009 2010 2011 2012 2013
Sovereign US$ billion (left axis) Corporate US$ billion (left axis) Corporate share %
In the first quarter of 2014, only Bahamas tapped international bond markets in the sovereignsector, issuing a US$ 300 million 5.750% 2024 bond. In the corporate sector, Barbados-basedtelecom provider Columbus International issued a US$ 1.25 billion 7.375% 2021 bond,Guatemala’s Comunicaciones Celulares (Comcel) issued a US$ 800 million 6.875% 2024 bond andJamaica’s Digicel issued a US$ 1 billion 7.125% 2022 bond in international capital markets.
One of the recent trends in LAC’s debt mar ket in the past decade was a shift in externalfunding from sovereigns to corporates/banks. Corporate bonds increased from 7% of the totalamount of tradable bonds in 2004 according to EMTA’s figures to 14% in 2013, while sovereign bonds decreased from 38.6% in 2004 to 19% in 2013. CAC have mirrored this trend, with corporate bond issuance as a share of total issuance increasing after 2004, with the exception of 2008, the yearof the onset of the global financial crisis (see figure 11).
In 2007, corporate issuance in CAC amounted to 65% of total issuance, surpassing sovereignissuance for the first time. This trend was interrupted by the global financial crisis in 2008-2009. In2010 corporate issuance surpassed sovereign issuance once again, accounting for 68% of the total, but in 2011, with the intensification of the euro area fiscal woes, corporate issuers retreated andsovereign issuance accounted for the biggest share again. In 2012 and 2013, CAC corporate debtissuance bounced back, representing 64% and 51% of the total, respectively. In 2012, the amount of
corporate issuance in CAC broke a record, reaching US$ 4.3 billion and finally surpassing the totalamount issued in 2007 (US$ 3.1 billion). In 2013, total corporate issuance in CAC was the highestever, reaching US$ 5.1 billion.
FIGURE 11SOVEREIGN AND CORPORATE CENTRAL AMERICA & CARIBBEAN ISSUANCE: 2000-2013
(Left axis: amount issued in US$ billions; right axis: corporate issuance as a share of the total)
Source: ECLAC, on the basis of data from LatinFinance, J.P.Morgan and Bank of America/Merrill Lynch.

8/12/2019 Access to Intl Capital Markets
http://slidepdf.com/reader/full/access-to-intl-capital-markets 21/29
19
II. Credit ratings evolution
In parallel with the increase in EMBIG spreads, Central America andCaribbean countries experienced downgrades in their credit riskclassification during the crisis and very few of them have regained their previous rating, as they continue to struggle with large government debtsafter the global financial crisis hurt their economies, hitting the export andtourism sector particularly hard.
In the case of Central America and the Caribbean, because ofsmall size and underdeveloped capital markets in many of the
economies of the region, the credit ratings can play an important roleon investors’ decisions towards the region. Together, the three maincredit rating agencies – Standard & Poor’s, Moody’s and Fitch – provide ratings for about fifteen countries in the region, but theanalysis that follows will focus on the twelve countries rated by at leasttwo of the agencies.
Overall, credit ratings for the Caribbean and Central Americancountries have not followed the same trajectory as the rest of the LatinAmerican region. While credit ratings for South America and Mexicosuffered a negative impact during the global financial crisis, they wereon an upward trend soon after that and have not only recovered, but areat a higher level than before the crisis. On the other hand, CentralAmerica – with the exception of Panama – falls entirely in LatinAmerica’s lower ratings bracket, while in the Caribbean, ratings are forthe most part even lower, with the exception of the Bahamas andTrinidad & Tobago. The number of downgrades increased in 2011 and2012, after a number of Caribbean countries restructured bond payments (see figure 12).

8/12/2019 Access to Intl Capital Markets
http://slidepdf.com/reader/full/access-to-intl-capital-markets 22/29
20
Caribbean
BBB-/Baa3
BB+/Ba1
BB/Ba2
BB-/Ba3
B+/B1
B/B2
B-/B3
Central America
South America &Mexico
2006 2007 2008 2009 2010 2011 2012 2013
CA 2007 2013 2007 2013 2007 2013
Costa Rica BB BB Ba1 Baa3 BB BB+
El Salvador BB+ BB- Baa3 Ba3 BB+ BB-
Guatemala BB BB Ba2 Ba1 BB+ BB+
Honduras B+ B B2 B2 n/a n/a
Nicaragua n/a n/a Caa1 B3 n/a n/a
Panama BB BBB Ba1 Baa2 BB+ BBB
Caribbean
Bahamas A- BBB A3 A3 n/a n/a
Barbados BBB+ BB- Baa2 Ba3 n/a n/a
Belize B B- B3 Caa2 n/a n/aDominican
RepublicB+ B+ B2 B1 B B
Jamaica B B- B1 Caa3 B+ CCC
Suriname B+ BB- B1 Ba3 B BB-
Trinidad
&Tobago A- A Baa1 Baa1 n/a n/a
S & P Moody's Fitch
FIGURE 12AVERAGE CREDIT RATINGS (S&P AND MOODY’S): 2006-2013
Source: ECLAC, on the basis of data Source: ECLAC, on the basis of data from Standard & Poor’s and Moody’s.
South America: Argentina, Bolivia, Brazil, Chile, Colombia, Paraguay, Peru, Uruguay and Venezuela.Central America: Costa Rica, El Salvador, Guatemala, Honduras, Nicaragua and Panama.Caribbean: Barbados, Belize, Dominican Republic, Jamaica and Trinidad & Tobago.
A majority of the countries in the Caribbean suffered downgrades following the onset of the2008 financial crisis, and had not recovered their previous standing by the end of 2013. This is thecase of the Bahamas, Barbados, Belize, and Jamaica (see table 1). In the four cases, the downgradesreflected credit weakness and fiscal deterioration, as financial instability brought about by theglobal financial crisis weighed heavily on the countries’ fiscal accounts.
TABLE 1CAC CREDIT RATINGS BEFORE AND AFTER GLOBAL FINANCIAL CRISIS (2007 AND 2013)
Source: ECLAC, on the basis of data from Standard & Poor’s, Moody’s and Fitch.
In red: credit rating in 2013 is lower than in 2007.
In green: credit rating in 2013 is higher than in 2007.

8/12/2019 Access to Intl Capital Markets
http://slidepdf.com/reader/full/access-to-intl-capital-markets 23/29

8/12/2019 Access to Intl Capital Markets
http://slidepdf.com/reader/full/access-to-intl-capital-markets 24/29
22
By Arrangement, which mitigated near-term external liquidity concerns, Jamaica was upgraded byall three agencies.
In February 2013, however, following the government’s announcement of another debtexchange program, Jamaica was downgraded to SD from B- by S&P’s and to RD (restricteddefault) from C by Fitch. In March, it was downgraded by Moody’s to Caa3 from B3, but it wasupgraded to CCC from RD by Fitch and to CCC+ from SD by S&P’s, following the completion ofthe National Debt Exchange (NDX) program. It was upgraded again by S&P’s in September, to B-from CCC+, with the agency citing recent progress in stabilizing the economy, staunching the lossof foreign-exchange reserves, and gaining access to new external funding from official creditors. InFebruary 2014, Fitch upgraded Jamaica to B- from CCC with a stable outlook, citing reducedfinancing risks due to fiscal consolidation and the lengthening of domestic debt repaymentsachieved through the debt exchange in February 2013. Despite the recent improvements, Jamaicahas not yet recovered its previous ratings.
The Dominican Republic held a non-investment grade of B+ by S&P’s and B2 and B byMoody’s and Fitch (one notch lower than S&P’s). The sovereign was downgraded to B by S&P’s inDecember 2008, bringing the rating to par with the other two agencies. Moody’s upgraded therating to B1 in 2010 to reflect a reassessment of the country's overall credit resilience after the
global financial crisis, and S&P’s brought it back to B+ in June 2011, reflecting the country’s progress in gradually improving its debt structure and debt management, advancing structuralreforms, and improving policymaking transparency. Dominican Republic has already recovered its previous ratings, which were stable in 2012 and 2013, and in the case of Moody’s, the current ratingis one-notch higher than before the crisis.
Suriname was actually upgraded from B+ prior to the crisis to BB- in August 2011 by S&P’sand from B to B+ in July 2011 by Fitch. The changes reflected improving macroeconomicfundamentals, good medium-term growth prospects and a low debt position, with net generalgovernment debt at less than 20% of GDP at the end of 2011. In 2012, Suriname was upgradedtwice: to BB- from B by Fitch in July, and to Ba3 from B1 with a positive outlook from Moody’s inAugust. The upgrades reflected prudent fiscal management, as well as robust growth, driven bygold mining, petroleum and construction sectors. They were also supported by the country’s ability
to attract significant foreign investment in the extractive industries and offshore exploration.Finally, in April 2013, S&P raised the outlook on Suriname’s BB- rating to positive, on theexpectation of improved growth. Suriname’s ratings from all three agencies are higher today thanthey were before the global financial crisis.
In Central America, Honduras and El Salvador suffered downgrades and have not yetrecovered their standing, while Costa Rica, Guatemala and Panama saw their ratings improve sincethe 2008 global financial crisis.
Honduras was downgraded to B from B+ in September 2009, but in June 2011, its outlookwas changed to positive by S&P’s. In June 2012, the sovereign was upgraded to B+ by S&P’s, its pre-crisis rating, with the agency citing political stability and fiscal reform. However, in February2013, with the economic situation worsening, Moody’s and S&P’s lowered their outlooks on
Honduras to negative, citing fiscal concerns, external finance issues, and risk of a continueddeterioration in macroeconomic stability. In August 2013, Honduras was downgraded to B from B+ by S&P’s, with the agency saying that diminished fiscal flexibility and a rising debt burden madeHonduras more vulnerable to external shocks or negative political developments. In February 2014,Moody’s downgraded Honduras to B3 from B2, citing a widening fiscal deficit – which reached7.7% in 2013 – and gross financing needs at more than 10% of GDP.
El Salvador was downgraded by Fitch on June 2009 to BB from BB+, to reflect what theagency considered a structural shift in the country’s fiscal and growth trajectory. Moody’sdowngraded the sovereign from an investment-grade prior to the crisis (Baa3) to a non-investment-

8/12/2019 Access to Intl Capital Markets
http://slidepdf.com/reader/full/access-to-intl-capital-markets 25/29
23
grade of Ba1 in November 2009. In March 2011, Moody’s downgraded the sovereign rating o nceagain. Among the factors cited for the downgrade were El Salvador’s high debt-to-GDP ratio, highlevel of bank non-performing loans and weak economic growth, the same issues that have weigheddown many of the CAC countries. In November 2012, Moody’s downgraded the sovereign ratingagain, to Ba3 from Ba2, citing weakening growth trends and debt reduction hurdles. In July 2013,Fitch downgraded El Salvador to BB- from BB and maintained a negative outlook, citing sustained
macroeconomic underperformance relative to peers and protracted high fiscal deficits that haveresulted in a debt-to-GDP ratio of 56.7% in 2012, well above the 39% median in the BB class.
Panama was upgraded by the three agencies to investment grade in 2010 and followed thetrend of the rest of the Latin America. Costa Rica also received an investment grade in 2010 byMoody’s, but S&P’s and Fitch have kept the sovereign as a non -investment grade. Moody’s alsoupgraded Guatemala in 2010, to Ba1 from Ba2 and Guatemala has maintained its rating since then,although Fitch in July 2013 revised Guatemala’s outlook to negative from stable, citing slow progress in addressing long standing structural weaknesses that continue to hinder growth potentialand limit per capita income convergence to similarly rated peers.

8/12/2019 Access to Intl Capital Markets
http://slidepdf.com/reader/full/access-to-intl-capital-markets 26/29

8/12/2019 Access to Intl Capital Markets
http://slidepdf.com/reader/full/access-to-intl-capital-markets 27/29

8/12/2019 Access to Intl Capital Markets
http://slidepdf.com/reader/full/access-to-intl-capital-markets 28/29

8/12/2019 Access to Intl Capital Markets
http://slidepdf.com/reader/full/access-to-intl-capital-markets 29/29
Bibliography
Brunton, P. Desmond and S. Valerie Kelsick (2001), “International financeand Caribbean development”, Serie financiamiento del desarrollo,
No. 113, ECLAC, LC/L.1609-P, ISSN: 1564-4197, Santiago, Chile,October 2001.
ECLAC (Economic Commission for Latin America and the Caribbean)(2014), Washington Office, “Capital Flows to Latin America and theCaribbean: 2013 Overview and recent Developments”, LC/WAS/L.128,Washington, D.C., 7 March 2014.
____ (2012), Structural Change for Equality: An Integrated Approach toDevelopment (LC/G.2524 (SES.34/3)), Santiago, Chile, July 2012. ____ (2011), “Financing for Development and Middle Income-Countries:
New Challenges”, working paper prepared for the Latin American andCaribbean Regional Consultation on Financing for Development,Santiago, Chile, 10-11 August 2011.
Gaillard, Norbert (2009), “Fitch, Moody’s and S&P’s Sovereign Ratings andEMBI Global Spreads: Lessons from 1993-2007”, International Research
Journal of Finance and Economics, ISSN 1450-2887 Issue 26.IDB (Inter-American Development Bank) (2010), “The Aftermath of the
Crisis. Policy Lessons and Challenges Ahead for Latin America and theCaribbean”, Coordinated by Alejandro Izquierdo and Ernesto Talvi,Washington, D.C. March 2010.
____ (2011), “One Region, Two Speeds? Challenges of the New GlobalEconomic Order for Latin America and the Caribbean”, Coordinated byAlejandro Izquierdo and Ernesto Talvi, Washington, D.C. March 2011.
Kouame, Auguste and Maria Ivanova Reyes (2011), “The Caribbean RegionBeyond the 2008-09 Global Financial Crisis”, paper presented at theOptions for the Caribbean after the Global Financial Crisis Conference, Bridgetown, Barbados, 27-28 January 2011.
Kräussi, Roman (2003), “Do Credit Rating Agencies Add to the Dynamics ofEmerging Market Crises?” Center for financial Studies Working Paper No. 2003/18, http://www.ifk-cfs.de