Embed Size (px)
Citation preview

ACCESS TO FRESH FOODS: SOCIO-ECONOMIC CHARACTERISTICS OF ILLINOIS
FARMERS’ MARKETS PARTICIPATING IN GOVERNMENT FUNDED FOOD
ASSISTANCE PROGRAMS
by
Deidra D Davis
B.S. Chicago State University, 2009
A Thesis
Submitted in Partial Fulfillment of the Requirements for the
Master of Science
Department of Geography and Environmental Resources
in the Graduate School
Southern Illinois University Carbondale
May 2012
THESIS APPROVAL
ACCESS TO FRESH FOODS: SOCIO-ECONOMIC CHARACTERISTICS OF ILLINOIS
FARMERS’ MARKETS PARTICIPATING IN GOVERNMENT FUNDED FOOD
ASSISTANCE PROGRAMS
By
Deidra D Davis
A Thesis Submitted in Partial
Fulfillment of the Requirements
for the Degree of
Masters of Science
in the field of Geography and Environmental Resources
Approved by:
Dr. Leslie Duram, Chair- Advisor
Dr. Sylvia Smith
Samuel Adu-Prah
Graduate School
Southern Illinois University Carbondale
April 2, 2012

i
AN ABSTRACT OF THE THESIS OF
Deidra D Davis, for the Master of Science degree in Geography and Environmental
Resources, presented on April 2, 2012, at Southern Illinois University Carbondale.
TITLE: ACCESS TO FRESH FOODS: SOCIO-ECONOMIC CHARACTERISTICS OF
ILLINOIS FARMERS’ MARKETS PARTICIPATING IN GOVERNMENT FUNDED FOOD
ASSISTANCE PROGRAMS
MAJOR PROFESSOR: Dr. Leslie Duram
The USDA’s Supplemental Nutrition Assistance Program's (SNAP) strives to connect
SNAP recipients to local and healthful food sold at farmers’ markets. These efforts are an
attempt to provide families, struggling to make ends meet, access to healthy foods and food
purchasing power via the Federal Food Stamp program. However, of the 288 listed farmers’
markets in Illinois only 25 are listed as SNAP/EBT accepting markets (2010 National Farmers
Market Directory). The first part of this study uses the 61st Street Farmers Market as a case
study, investigating the practical market operations and interpreting their method of EBT
implementation to provide an established model of an existing and thriving farmers’ market.
Next, I will investigate the socio-economic characteristics (population, race, employment,
income, poverty, education, age, and SNAP recipients) of Illinois farmers’ markets accepting
EBT. I will compare this data to other Illinois farmers’ markets that do not accept EBT and
assess which non-accepting market locations would be most suitable for implementing EBT
usage in the future. Finally, based on my case study and statistical analysis, I will discuss
recommendations for farmers’ markets to accept EBT into their markets.
Findings indicate that there is no significant difference between the mean ranks of the
socio-economic characteristics for the EBT and non-EBT accepting farmers’ markets. Of the 8
socio-economic characteristics tested, the populations of SNAP recipients were analogous for
each group: EBT and Non-EBT accepting farmers’ markets.

ii
ACKNOWLEDGMENTS
I would first like to thank my Mother and Father for their unconditional love, support,
encouragement, words of wisdom, and constant “reality checks” throughout my life - Thank you,
I Love You. To my sisters, although younger, thank you both for the ways that you have inspired
me to be better and listening to me when I get a little discouraged. To my grandmother, who
sacrificed the comfort of her life to ensure that her children and their children could achieve their
goals and continue to pave the way for generations to come, just as she did for mine, I love you.
Thanks grandma!
I would like to thank my advisor, Dr. Leslie Duram, for exposing me to the emerging
food revolution, especially involving local sustainable agriculture as well as organic foods. It
was due to her suggestion that I attended the Midwest Food Summit in Evanston, Illinois 2011;
there I gained a greater interest in the food movement which eventually led to the preparation of
this Thesis. Next, I would like to thank Samuel Adu-Prah (GIS) and Dr. Sylvia Smith (Food &
Nutrition) as my committee members, but also for their individual input into this project.
Also to Dr. Marjorie Brooks (SIUC- Zoology), what more can I say- Thank you. I would also
like to thank Dennis Ryan, Market Manager of the 61st Street Farmers’ Market, for taking the
time out of his schedule to talk with me about the markets evolution and its future.
To Dr. Linda McCabe-Smith for her financial support throughout this academic endeavor
to attain my Master’s degree- Thank you.
Last, but not least, to the SIUC Geography Department, Thank you for your kindness and
your aide in my easement into the department. I appreciate it - Thank you!
Deidra Denice Davis

iii
TABLE OF CONTENTS
CHAPTER PAGE
AN ABSTRACT OF THE THESIS.....................................................................................i
ACKNOWLEDGMENTS…….…………………………………………… .........………ii
LIST OF TABLES..............................................................................................................vi
LIST OF FIGURES ..........................................................................................................vii
LIST OF ACRONYMS………………………………………………………….......….viii
CHAPTER 1: INTRODUCTION........................................................................................1
Introduction and Purpose of Study..........................................................................1
Background………………………………………..........…………………………2
Justification…………………………………………..........…………………........4
Study Objective........................................................................................................7
Research Questions………………………………….........………………….........8
CHAPTER 2: LITERATURE REVIEW.............................................................................9
Farmer Markets and Consumers..............................................................................9
Effectively Operating Farmers’ Markets……………………………...................11
Importance of Market Accessibility…………………………………..….............13
Healthy, More Nutritious Foods ...............................…………………................15
CHAPTER 3: RESEARCH METHODOLOGY...............................................................17
Study Approach: Mixed Methods……..................................................................17
Research Question 1 Study design.........................................................................17
Study Area.................................................................................................17

iv
Data Collection……………………………………………………..........19
Research Question 2 Study design.........................................................................20
Study Area………………………………………………………….........20
Data Collection……………………………………………………..........20
Research Question 2 A) Food Desert Locator….....…………..…………............22
Research Question 3..............................................................................................26
Study Area………………………………………………….………........26
Data Collection………………………………………….….……............27
Mann-Whitney U Test……………………………………………….......27
CHAPTER 4: ANALYSIS/ RESULTS.............................................................................29
Research Question 1Findings………………………………...…………......…...29
Research Question 2 Finding..………………………….…………………..........35
Research Question 3 Findings……………………………………………...........41
CHAPTER 5: DISCUSSION AND CONCLUSION.......................................................42
Discussion .............................................................................................................42
Recommendations…………………………..………………………......………..44
Conclusion ............................................................................................................46
REFERENCES………………………………………………………………......……....48
APPENDIX A: INTERVIEW QUESTIONS..........………………………….…...........52
APPENDIX B: 288 ILLINOIS FARMERS’ MARKETS...............................................53
APPENDIX C: ILLINOIS EBT FARMERS’ MARKETS...............………..….............62
APPENDIX D: TEST VARIABLES (DESCRITIONS)..........……….…………...........63

v
APPENDIX E: INTERVIEW CONSENT FORMS…………………............................64
VITA………………..…………………………………………………………................67

vi
LIST OF TABLES
TABLE PAGE
Table 1 Top 10 states with the most Farmers' markets..................................................................11
Table 2 Illinois poverty rates………………………….................................................................20
Table 3 List of 8 sample farmers’ markets....................................................................................26
Table 4 Literature substantiated in Case Study Interview.......……………......….…………..….34
Table 5 Mann-Whitney U Test results…….………………………………….......…………..….41

vii
LIST OF FIGURES
FIGURE PAGE
Figure 1 Farmers’ Markets Growth.................................................................................................6
Figure 2 The 61st Street Experimental Station Farmers Market....................................................18
Figure 3 USDA's Food Desert Locator displaying area 1.............................................................24
Figure 4 USDA's Food Desert Locator displaying Area2.............................................................24
Figure 5 USDA's Food Desert Locator displaying Area 3............................................................24
Figure 6 USDA's Food Desert Locator displaying area 4.............................................................24
Figure 7 USDA's Food Desert Locator displaying area 5.............................................................25
Figure 8 USDA's Food Desert Locator displaying area 6.............................................................25
Figure 9 USDA's Food Desert Locator displaying area 7.............................................................25
Figure 10 USDA's Food Desert Locator displaying area 8...........................................................25
Figure 11 The distribution of farmers’ markets across the state of Illinois………………...........36
Figure 12 List of the 22 EBT accepting markets………………………….……………..............37
Figure 13 Inset map of case study area………………………………………………..................38
Figure 14 Population of farmers’ markets……………………………………………….............39

viii
LIST OF ACRONYMS
AMS Agriculture Marketing Service
BRD Benefits Record Division
CSA Community Supported Agriculture
EBT Electronic Benefits Program
ERS Economic Research Service
FMNP Farmers Market Nutrition Program
FNS Food and Nutrition Service
FSP Food Stamp Program
POS Point of Sales
SNAP Supplemental Nutrition Assistance Program
USDA United States Department of Agriculture
WIC Women Infant and Children

1
CHAPTER 1
INTRODUCTION
Introduction and Purpose of Study
Administered by the United States Department of Agriculture (USDA), the Supplemental
Nutrition Assistance Program (SNAP), previously known as the Food Stamp Program (FSP),
provides families of no or low income with food purchasing power via federal funds (USDA-
FNS/SNAP 2010). In fact, since the first implementation of the food stamp program in 1939,
there has been a continual urge from the Department of Agriculture to bridge the gap between
food surpluses and undernourished societies, despite its many revisions and even during its brief
period of suspension.
The SNAP program provides families of no or low income with food purchasing power
via federal funds. The funds are available in the form of a debit card used for all foods except
alcohol, pet food and prepared/ hot foods. According to the USDA – FNS program, about
1,730,000 people in Illinois received SNAP benefits in November of 2010. Increasing public
awareness to the benefits of healthier food choices along with providing greater access to these
foods, via farmers’ markets, as well as supplying some assistance to purchase these foods, may
provide an economic advantage for the communities and the local growers. It is imperative that
the United States governments’ resources, along with farmers, amalgamate and use their
influences and capabilities to provide the most nutritious foods to all Americans regardless of
their demographic and/or socio-economic status. Allowing SNAP benefits, via EBT, to be used
by farmers’ markets would optimize farmers profit; effectively utilize federal funding while
providing fresh produce to underprivileged communities.
2
Using the 61st Street Farmers Market as a case study, this paper investigates its operation
and noted success within the community, as a result of EBT implementation. Additionally, the
socio-economic characteristics of 4 selected farmers’ markets which accept EBT transactions
and 4 markets that do not will be compared; seeking to find that there is no significant difference
between the socio-economic characteristics of the 2 groups, finding that areas of farmers’
markets not utilizing EBT could potentially benefit from EBT usage.
Background
Beginning in May 16, 1939 the FSP was implemented in response to the Great
Depression, where economic woes fell upon the country, due to widespread unemployment, as
well as a surplus of unmarketable food (USDA- FNS/SNAP 2010). In 1939 the Secretary of
Agriculture, instituted the Food Stamp Program (Congressional Digest 1981). People were
allowed to purchase orange food stamps equal to the funds they normally spend to purchase
food, but for every $1 orange stamp purchased 50 cents worth of blue stamps were received;
whereas, the orange stamps could buy any food item, the blue stamps could only be used to buy
food determined by the Department of Agriculture to be surplus (USDA-FNS/SNAP 2010).
Only after four years from the FSP’s installation, it ended. On February 2, 1961,
President Kennedy’s first executive order was to expand food distribution and re-instate the FSP
(USDA-FNS/SNAP 2010). In 1964, President Johnson requested Congress to pass legislation to
make food stamps permanent (Congressional Digest 2010). In 1977, the modern FSP was
created through major statutory liberizations, the most significant of which was eliminating the
purchase requirement (O’Neil 2004). In other words, the Food Stamp Act of 1977, among other
provisions, eliminates the purchase requirement for food stamps, establishes income eligibility
guidelines at the poverty level and categories of excluded income, and restricts eligibility for
students and aliens (Congressional Digest 2010).

3
The last three decades consummated great strides for the USDA funded FSP which
includes: income adjustments, simplified procedures, establishment of penalties for violators and
authorizations of nutrition education grants. Food stamps were issued as paper coupons until the
Personal Responsibility and Work Opportunity Reconciliation Act of 1996 which required all
States to issue food stamp benefits via Electronic Benefits Transfer card (EBT). This switch
from coupons to EBT was a step forward in increasing program integrity, reducing fraud, and
eliminating the stigma for using food stamps (Wasserman et al. 2010).
Electronic Benefit Transfer (EBT) is an electronic system that allows a recipient to
authorize transfer of their government benefits from a Federal account to a retailers’ account to
pay for products received; as of July 2004, all 50 States operated state-wide, city-wide, and
territory-wide EBT systems to issue food stamp benefits (USDA-FNS/BDR 2011).
Unfortunately, many smaller businesses, such as farmers’ markets or roadside farmer stands are
unable to utilize SNAP funds via EBT. Free EBT equipment, provided by the USDA, is wired
and requires electrical hook-ups which may be unavailable to certain merchants, such as farmers’
markets. Operating such equipment effectively at a farmers’ market can not only become quite
costly, but there may also be an associated learning curve as the technology can be difficult to
manage and promote at farmers’ markets.
There is no doubt that EBT implementation at farmers’ markets would be a benefit to
farmers as well as consumers. Farmers’ markets located in areas designated as “food deserts”,
areas that lack access to affordable fruits, vegetables, whole grains, low-fat milk, and other foods
that make up the full range of a healthy diet (CDC 2010), could possibly increase their sales by
providing healthy nutritious food to people in underserved areas. According to the USDA 2010
National Farmers’ Market Directory (Nov. 2010), there are 288 farmers’ markets in Illinois, in

4
which Illinois ranks #3 in the top ten U.S states with the most farmers’ markets (Table 2). Of
these, only 25 currently accept SNAP via EBT cards (IDHS). One such market is the 61st Street
Farmers Market located on 61st and Blackstone, Chicago Illinois. This market is one small
enterprise of The Experimental Station, a not-for-profit (501-c-3) incubator of innovative
cultural, educational, and environmental projects and small-scale enterprises (Spreen, 2006).
The 61st Street Farmers markets ability to provide healthy, local, nutritious food in an
underserved community as well as provide tremendous outreach and educational resources, such
as cooking classes and farm field trips for neighborhood kids makes this market well deserving
of the 2010 USDA Farmers’ Markets Promotion Program Grant ($61,000).
Justification
Current literature provides compelling evidence of how some USDA FNS programs
supports, encourages and offers significant benefits to customers as well as farmers. One such
program is the Women, Infant and Children. WIC’s mission: “To safeguard the health of low-
income women, infants, and children up to age 5 who are at nutrition risk by providing nutritious
foods to supplement diets, information on healthy eating, and referrals to health care” (USDA-
FNS/WIC 2010). This program also includes a farmers’ market component- Women, Infant and
Children Farmers’ Market Nutrition Program (WIC FMNP) where a variety of fresh, nutritious,
unprepared, locally grown fruits, vegetables and herbs may be purchased with FMNP coupons.
WIC transactions are fairly simple: Eligible WIC participants are issued FMNP coupons
in addition to their regular WIC benefits. Coupons can be used to buy eligible foods from
farmers, farmers' markets or roadside stands that have been approved by the State agency to
accept FMNP coupons (USDA-FNS/WIC 2010). The farmers, farmers’ markets or roadside

5
stands must then submit the coupons to the bank or State agency for reimbursement. A
seemingly simple process was evident in that 2.15 million WIC participants received benefits
during fiscal year 2010 (USDA-WIC/FMNP 2011). During the same year, 18,245 farmers,
3,647 farmers' markets and 2,772 road-side stands were authorized to accept FMNP coupons and
the coupons redeemed through the FMNP resulted in over $15.7million in revenue to farmers
for fiscal year 2010 (USDA-WIC/FMNP 2011).
Has the Supplemental Nutrition Assistance Program (SNAP) gained as much
acknowledgment from vendors and patrons of farmers’ markets as WIC coupons have?
Probably not, and one of the main culprits may be, as Dennis Ryan of the 61st Street Farmers
Market puts it: “if you’re a link user and you were never able to use your LINK card at a
farmers’ markets before, it’s not going to pop in your head that ‘hey, I’ll go use my card at the
market’ ” (Dennis Ryan, interviewed by Deidra Davis, April 2011). Some people are still
unaware that many farmers’ markets even process EBT transactions. However, accepting SNAP
at farmers’ markets is a little more involved than accepting cash and WIC coupons.
Farmers’ markets SNAP acceptability means that market managers, as well as farmers
must be trained with its application. This can pose a threat of increased stress especially when
dealing with other day to day transactions at the market. Along with creating a busier
atmosphere when processing EBT transactions, the cost for a machine and its accompanying fees
can become quite costly. The USDA will provide free EBT equipment, however, these machines
are wired, meaning that an electrical outlet must be available and the USDA has requirements as
to what markets are eligible for free EBT machines (USDA-FNS/SNAP 2010); although markets
can accept SNAP manually, the associated paperwork with this process could become too
cumbersome. Therefore, wireless machines are desirable, but the cost of the machine as well as

6
connectivity charges can be cost productive. Unlike cash, or even WIC coupons, EBT
transactions require specific instructions and even electrical hook-ups for use. Although markets
can accept SNAP manually, the process associated paperwork with this process become too
cumbersome.
At the end of Federal Fiscal Year (FY) 2010, according to the USDA/AMS (Agricultural
Marketing Service), a total of 6,132 farmers’ markets were operating around the United States
(Figure 1). Of this total, 1,611 farmers’ markets and individual farmers were authorized by FNS;
and redeemed a total of $7,547,028 in SNAP benefits in Fiscal Year 2010. Attempting to
continue to increase these numbers, the Supplemental Nutrition Assistance Program's Benefit
Redemption Division (BRD) is making information about requirements associated with SNAP
participation more readily available by utilizing the SNAP retailers website. On this website, is
listed information about how to become an authorized retailer and includes stories of best
practices used from around the country which accessible to the public.
Figure 1. Farmers’ Markets Growth: 1994-2010. (USDA/AMS 2011)

7
One story of best practices comes from the 61st Street Farmers Market. This small, but
powerful enterprise is just one of a few at the Experimental Station, not-for-profit organization
founded by Dan Peterman and Connie Spreen. Not only has this 3 year old market thrived
consistently throughout the years, increasing its sales/profits and tremendous community
outreach endeavors, but it has also gained much recognition from media and government
organizations alike.
The Illinois Farmers’ Markets Association is currently seeking government support to
implement and provide ease for EBT transaction in all farmers’ markets in Illinois. Increasing
the ease of the transition along with added government support, in the form of funding, more
Illinois farmers and farmers’ market managers may be willing and able to accept SNAP at their
location.
Study Objective
This thesis investigated the socio-economic characteristics of farmers’ market that accept
EBT and compared them with other non-EBT accepting farmers’ markets and evaluated which
non-accepting market locations would be most suitable for implementing EBT usage.
This analysis was conducted in two parts: first, an interview with Dennis Ryan, market
manager of the 61st Street Farmers’ Market, to investigate the principals practiced by the 61
st
Street Farmers Market. This provided insight as to what led to its success thus far, as well as its
vision of a promising future. Then, using ArcGIS 10, maps were created which identified
currently operating farmers’ markets within Illinois. Lastly, an analysis of the socio-economic
characteristics of Illinois farmers’ markets that accept EBT were compared to other Illinois
farmers’ markets that do not accept EBT and assessed to find which non-EBT accepting farmers’
market would be most suitable for implementing EBT which in turn would make them

8
candidates for possible EBT operating success. Three research questions were used to guide this
research:
Research Questions
1) Using the 61st Street Farmers Market as a case study, how has the implementation of
EBT encouraged market success?
2) What is the spatial distribution of all Illinois farmers’ markets?
A) Using the USDAs’ Food Desert Locator, what is the spatial relationship of
farmers’ markets and food deserts?
3) How do the socio-economic demographics characteristics compare among farmers’
markets that accept EBT and those that do not accept EBT?

9
CHAPTER 2
LITERATURE REVIEW
Farmers’ Markets and Consumers
For the bulk of the working class across America, weekdays are spent performing
activities which productively generate their income. Therefore, the weekends, for some, are
coveted for time of relaxation or enjoying some carefree excursions. But for the health
conscious, educated and curious population, some Saturday mornings are spent frequenting
neighborhood farmers’ markets. Over the past three decades, farmers’ markets have blossomed
across the United States (Markowitz 2010); these markets are expanding and reaching crowds
who generally are unaware about such operations. The number of farmers’ markets operating in
the United Stated has been published in the National Directory of Farmers Markets since 1994;
in 2010 there were a total of 6,132 (USDA-AMS 2010) (Figure 1). The USDA presumes that
farmers’ markets allow consumers to have access to locally produced, farm-fresh foods and the
opportunities to personally interact with producers and learn about their products; and for the
community, markets are integral in creating robust local economies, thriving neighborhoods and
vibrant civic design plans. Farmers’ markets also provide easier access to fresh, healthful food in
communities where access to fresh, nutritious food may be otherwise limited.
Over the past decade many studies have examined why consumers frequent farmers’
markets or not. For example, Zepeda (2009) examined if there were differences between
shoppers who shopped at farmers’ markets and those who did not; Baker et al. (2009) conducted
consumer surveys to learn about consumer preferences and solicited feedback for vendors; and
Wolf et al. (2005) studied the characteristics of produce sold in farmers’ markets and compared
them to those sold at supermarkets to determine why consumers shopped at farmers’ markets.
The similarities of these studies were that shoppers favored having fresh and local foods as well

10
as the nutritious benefits added from foods purchased at farmers’ markets. Although, the
researchers varied in whether they supported the idea that income, education, gender, or need to
support local foods, concurrently, caused consumers to shop at farmers’ markets, they couldn’t
dismiss that the dissimilarities in shoppers’ demographics must reveal more attention were be
placed to local foods (Vecchio 2010).
Examining an even broader array of farmers’ markets and consumer characteristics was a
study conducted by Zepeda (2009), which focused on the characteristics, as well as motivations
and behaviors of those who shop at farmers’ markets and those who do not. This study tested the
means of a simple random sample of U.S farmers’ market shoppers to examine if there were
differences amongst the shoppers and found shoppers that frequented farmers’ markets were
people who enjoyed and cooked frequently, were female and had another adult in the household;
demographic characteristics, such as age, education, race, religion and income were not found
significant. They found only minor differences in the characteristics of farmers’ market and non-
farmers’ market shoppers. Therefore, limited appeal of farmers’ markets were found in those
who were single persons, single parent households and convenience-oriented shoppers
(significance: the more difficult it was to access a farmers’ market, the less likely a person was
willing to travel to it).
Similarly, Wolf et al. (2005) compared the profile of farmers’ market and non- farmers’
market shoppers in San Luis Obispo County, California (California ranks #1 according to the
USDA of the Top Ten U.S FM growth for 2010) (Table 1). Although their findings revealed the
demographic profiles were more likely to be female and married (similar to Zepeda 2009), they
also found it more likely that shoppers had completed some post graduate work; however, they
found no significant difference in income.

11
Table 1. Top 10 states with the most Farmers' markets
(USDA-AMS 2010).
U.S. States # of Farmers’ markets
California 580
New York 461
Illinois 288
Michigan 271
Iowa 229
Massachusetts 227
Ohio 213
Wisconsin 204
Pennsylvania 203
North Carolina 182
Effectively Operating Farmers’ Market
Funding
There are numerous resources provided by government entities, as well as literature,
which guide individuals and businesses on how to properly establish and manage a farmers’
market in the United States. Funding opportunities for such projects are available and provided
through the USDA, local governments or non-profit organizations as well as federal funding
prospects.
One such funding opportunity is available through a federal grant from the Farmers
Market Promotion Program (FMPP) under the USDA- Agriculture Marketing Service (AMS).
The Farmers Market Promotion Program is a competitive grant program for eligible entities that

12
provide funds to assist with establishing, expanding, and promoting domestic farmers’ markets,
roadside stands, community-supported agriculture programs, and other direct producer-to-
consumer market opportunities (USDA- AMS 2011). In fiscal year 2011, the Agriculture
Marketing Service notified the public of competitive grant opportunities totaling $10 million
through the FMPP. Up to 180 awards were offered with a minimum award per grant of $5,000
and a maximum award per grant of $100,000. The purposes of the awards are to increase
domestic consumption of agricultural commodities by expanding direct producer-to-consumer
market opportunities. Supplying low-income communities’ access to healthier foods, as well as
supporting local farmers, supports the requirement of the FMPP grant that at least 10% of the
funded projects are used for EBT implementation in the market. This is a great initiative since,
for instance, farmers’ markets frequently lack telephone lines and electricity, therefore,
accepting electronic benefits cards has posed many technical challenges that regularly frustrate,
if not infuriate, market organizers (Markowitz 2010). Allowing a portion of the funded projects
to support EBT transactions are important to the success of the market, especially if the markets
are situated in low-income communities where a large percent of the population are at risk and
have low/no transportation and are in close proximity to areas designated as food deserts.
Management
Of great importance to the successful governing of a farmers’ market daily operations is
the employment of a dedicated market manager(s) and staff (mostly voluntary). Managers have
the responsibility to maintain necessary vendor participation, keep records and proper licensure,
if necessary. Summed up, market managers are responsible for the day to day operation of the
farmers market. Although possibly varying from farmers’ market to farmers’ market, Hamilton
(2002) identifies 10 typical market manager responsibilities as follows:

13
1. Selecting and registering both seasonal and daily vendors;
2. Assigning spaces at the market so vendors know where to set up and consumers know
where to find their favorite farmers;
3. Collecting the seasonal and weekly fees for market spaces;
4. Handling day-to-day administrative issues which arise, such as “someone is illegally
parked in my space!”
5. Enforcing market regulations and administering penalties, which may mean imposing
fines on vendors;
6. Answering inquiries and responding to complaints from customers and vendors;
7. Working with local media and promoting the market by advertising what it has to offer;
8. Making sure the market complies with applicable local, state and federal regulations;
9. Administering the financial and business affairs of the market; and
10. Dealing with local officials, other businesses, and the organizers of the market.
Keeping these 10 objectives in mind, along with other duties that may arise, market managers
possess a great deal of responsibility that are undoubtedly a driving force behind the daily
operation of farmers’ markets.
Importance of Market Accessibility (or Willingness to Travel)
Food deserts, a coined term used to illustrate grocery-sparse barrens ruled by fast food
and convenience stores – a place where it's easier to buy beer than milk and hard to find an un-
fried potato chips and soda. No problem- fresh greens, broccoli or grapefruit? Dream on… as
written in an article in the Houston Chronicle (2011). Many studies have examined food access,
lack of fresh foods in communities, and consumers’ willingness to travel (Algert et. Al 2006;
Apparicio et al. 2007; Baker et al. 2009; Berg and Murdoch 2008; Block et al. 2004; Detre et al.
2010; Ploeg 2010). A tool used in the fore mentioned studies was the distance when evaluating
access to foods. Whether a supermarket, medium/small scale grocery store, convenience store or
farmers’ markets, literature indicates consumers’ willingness to travel up 1 mile (Apparicio et al.
2007). According to the Healthy Food Financing Initiative (HFFI) of the Food Desert Locator
http://www.ers.usda.gov/data/fooddesert/about.html, 1 mile is the maximum distance to a
supermarket or large grocery store; anything above that is considered a “low-access community”.

14
Similarly, Berg and Murdoch (2004) also examined neighborhoods according to food access
within 1 mile.
Willingness-to-travel (WTT), vehicle access, price and quality were some factors
reviewed when determining whether, or not, consumers were willing to travel to a farmers’
market or grocery retail stores. Agreeing with this view is the Baker et al. (2009) study which
concluded that perhaps more important than the location of customers' residence was how far
they were willing to travel to get to the farmers’ market. Researchers also study consumers’
willingness to travel distances to supermarkets. Somewhat different from farmers’ markets in
that most grocery stores may not provide fresh, local and a variety of produce that farmers’
market provide.
While Apparicio et al.’s (2007) description of food deserts is similar to that of other
literature; they also provide examples of certain barriers they believe contributes to the lack of
access. These barriers are often linked to spaces of poverty, in part because some people in these
areas have little mobility, whether this be short-term (no access to a car) or long-term mobility
(lack of choice of residence due to lack of means), as well as some non-geographic barriers to
accessing food, such as: social and cultural norms, physical disability, economic assets or
attitude toward and knowledge about food and cooking (Apparicio et al. 2007).
Detre et al. (2010) recognizes that universities and/or colleges provide a captive group of
consumers, students, many of whom are transportation constrained and must rely on retail food
outlets that are in close proximity to their university/college’s campus. A farmers’ markets
ability of being located in an area where a portion of the population has knowledge of the
nutritional value of quality produce of a farmers’ market and consumers who may frequent the
market, as well as a population that is very new to the farmers’ markets, will enable the farmers

15
to have the knowledgeable clientele needed, while also expanding their goods to a newer, less
knowledgeable population.
Healthy, More Nutritious Foods from Farmers’ Markets
Understanding the concept of a food deserts means to fully absorb the fact that these
deserts are commonly found spanning across miles of impoverished, low-income areas.
Ethnicity can be said to not to be a dominant factor in the 21st century as it pertains to low
income and affluent communities, instead communities seem to be built on those who can afford
to live there. Less income sometimes means lower living standard, which could also have an
effect on the availability of fresh, nutritious, healthy foods. Eating healthy is especially difficult
for low-income consumers because healthy food is significantly more expensive than unhealthy
food that offers extra calories per dollar of food expenditure (Berg and Murdoch 2008).
The 21st century opened up with increasing technologies, greater secondary academic
achievements, and an emerging awareness of healthier lifestyles. In an effort to improve health,
individuals realize that they need to change from diets that consist of mostly fast foods to those
rich in fruits and vegetables (Detre et al. 2010).
Jarosz (2000) suggested that the increasing demand for locally grown organic produce
among middle class consumers reveals how concerns for local, small scale organic agriculture,
farmland preservation and open space, and food safety may shape eating preferences. Is it only
the middle class with these concerns? Could there remain evidence that provides reason to
believe that some educated populations have more knowledge about the benefits of healthier
lifestyles and, therefore, such places such as farmers’ markets are frequented by the educated
more than the less? Zepeda (2009) found that their model confirmed that women food shoppers
are significantly more likely to patronize farmers’ markets than male food shoppers, but it
rejected the hypotheses that education, age or income affects the probability of patronizing

16
farmers’ markets. However, while the study revealed that economic variables such as income
and food expenditures had no significant impact on the probability of shopping at farmers’
markets, attitudes about the importance of food cost did.
Therefore, if the cost associated with purchasing foods/ produce drives consumers’
willingness to pay for local, organic, healthier foods, it would seem that providing food
purchasing assistance (i.e. SNAP/EBT), education about local, organic, healthy foods at
neighboring farmers’ markets and neighborhood markets that accept EBT would be
advantageous for all Illinois farmers’ markets. In other words, providing education as to WHY
eating local, organic, healthier foods is beneficial to the consumer, as well as, adopting EBT
point of sales (POS) terminals, markets could increase the likelihood of an unknowledgeable
community to patronize neighborhood farmers’ market.
17
CHAPTER 3
RESEARCH METHODOLOGY
Mixed Method Approach
A mixed methods approach was taken for this project which contains 2 parts: qualitative
and quantitative. The qualitative portion consists of a tape-recorded interview with Dennis
Ryan, market manager of the 61st Street Farmers Market. The interview was allotted a 2-hour
window to conduct. The questions, asked verbatim, are listed in Appendix A (Sylvia Smith
PhD., pers.comm.). Part 2 of the project is the quantitative portion which focuses primarily on
the GIS map production and statistical analysis using Independent-Samples Mann-Whitney U
Test via SPSS 18.
The objective of this project was to provide information on how to bring healthy food
into the community, support local agriculture, support the diversity of a community, and provide
equal access of nutritious foods, as well as to provide learning opportunities in which several
research questions were introduced in its attempt.
Research Question 1- Study Design
1) Using the 61st Street Farmers Market as a case study how has the implementation of
EBT encouraged market success?
Study Area
Standing at an angle off of 61st and Blackstone, Chicago Illinois, a 2-3 story building
whose story blazes with history, stands firmly in the present while establishing itself for the
future – The Experimental Station. The Experimental station is a not-for-profit organization
founded in 2002 by Connie Spreen and Dan Peterman. The Experimental Station as an

18
incubator of innovative cultural, educational, environmental projects and small-scale enterprises;
that draws upon the ecological principle of diversity, recognizing the dynamic treasure of
resources that a diverse and complex environment brings (The Experimental Station 2011).
Some projects of the Experimental Station include: independent publishing, contemporary art,
experimental music, visiting writers, organic gardening, bulk food purchasing, ecological
initiatives, a bicycle shop/youth education program and lastly, the focal point of this study, the
61st Street Farmers Market.
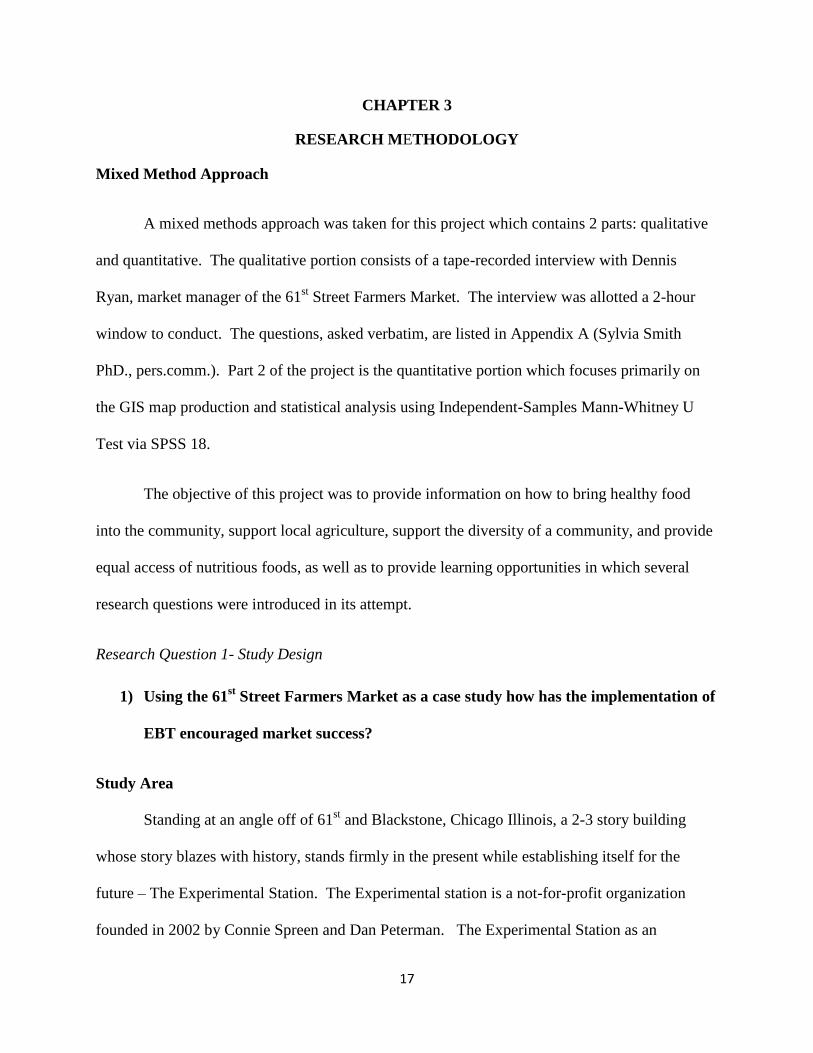
Figure 2. The 61st Street Farmers Market in operation.
The 61st Street Farmers Market has been established in the Woodlawn community. Since
its inception in 2008 the market not only provides farmers with a viable income and an array of
customers, it also provides farm field trips for children in the community, adult/kids cooking
classes and educational outreach sessions at neighboring schools. There are about 20 vendors
actively participating in the markets every Saturday from May through October (outdoors). The
market accepts EBT/SNAP, senior coupons (some vendors) and double value coupon.
In October of 2010, the U.S. Department of Agriculture handed out dozens of Farmers
Market Promotion Program grants to groups across the country, but only two in Illinois.
19
The 61st Street Farmers Market, on the border of Hyde Park and Woodlawn, received a $61,000
USDA grant (Eng 2010). In a letter to the Chicago tribune, Connie Spreen stated: "We are really
delighted! This grant will help the Experimental Station continue to develop innovative
approaches to transforming the local food culture through the 61st Street Farmers Market, and it
will enable us to become a resource for other markets around the state seeking ways to create
access to fresh and healthy foods for all of Illinois' residents" (Eng 2010).
Data Collection
Dennis Ryan, market manager of the 61st Street Farmers Market in Chicago, Illinois,
agreed to my interview to explain the evolution and hopeful future of the 61st Street Farmers
Market. He has been the market manager since its inception in 2008; assigned to this position by
founder of the experimental station, Connie Spreen.
The interview questions were prepared to include two response sections: market
operations and personal inspirations (Appendix A). The purpose of the interview was to
highlight the success of the 61st Street Farmers Market as the case study using the interview
questions to provide the reader with the practical aspect of running a farmers’ market separate
from the physical success of the 61st Street Farmers Market EBT acceptance.
The interview was conducted on site at The Experimental Station building on April 21,
2011. After a brief tour of the facility by Ryan, I was led to a corner angled room in the upstairs
portion of the experimental station, where the interview began. The tape recorded interview
began around 1:00pm and lasted about an hour. As mentioned in the human subject compliance
consent forms, required by the SIUC Office of Research Development and Administration, when
the interview was completed the tape recorded interview was transcribed within 5 days and the
recording discarded.

20
Research Question 2- Study Design
2) What is the spatial distribution of all Illinois Farmers’ Markets?
Study Area
The overall study area of this project is the state of Illinois, which is positioned in the
Midwest portion of the United States of America. Illinois consists of 102 counties. In 2010
Chicago was considered the largest city in Illinois with a population of 2,695,598 and Cook
County was the largest county with a population of 5,194,675 (DNR- Illinois facts 2010). The
poverty rate as well as the number of people in poverty in Illinois has risen significantly since
1999 (table 2). It can be agreed that federal funding programs such as SNAP, TANF and the
child income credit can help to mitigate some of the anxiety to Illinois residents falling on these
difficult economic times.
Table 2. Illinois poverty rates 1999, 2007, 2008, 2009 (*data not included) Year Poverty Rate # People In Poverty
2009 13.2 1,677,093
2008 12.2 1,532,238
2007 12 *
1999 10.7 1,291,958
Data collection
Maps were produced using ArcGIS 10.0 to visually display the distribution of farmers’
markets across Illinois. GIS, Geographic Information Systems, in simplest terms is described as
a computer system for capturing, managing, manipulating, analyzing, and displaying data which
is spatially referenced on earth (Tietenberg 2009). Tietenberg (2009) describes how GIS
technology has become applicable in studies relating to distributional inequalities with respect to
either pollution, hazardous waste and in the scope of this research it can also be applied to show

21
the distribution of farmers’ markets. This study used the applications of GIS to display the
distributions of farmers’ markets in Illinois.
The most recent, November 2010, raw data from the USDA National Farmers Market
Directory was obtained from the USDA web-site. The information within the USDA dataset
contained more than 4,700 United States farmers’ market locations which included addressees as
well as their corresponding geographic coordinates. The information contained within the list
was submitted voluntarily; therefore, this may not be a complete listing of the total amount of
U.S farmers’ markets. Some listed markets did not contain full addresses or latitude and
longitude coordinates. The coordinates are a more useful way to display the most accurate point
locations on a map, it is important that each market provided accurate addresses or latitude and
longitude coordinates.
The Illinois farmers’ markets were selected from the USDA excel file and added to a new
excel sheet. There were 288 Illinois farmers’ markets listed in the USDA National Farmers
Market Directory (Appendix B). Of these 288 farmers’ markets, there were 74 markets with
missing latitude and longitude coordinates. The missing coordinates were located using GPS
Visualizer.com by inserting the markets addresses into the input location the output resulted in
latitude and longitude coordinates for each of the 74 markets. The addresses were geo-coded to
produce latitude and longitude coordinates. The process of geo-coding, transforming a
description of locations, such as: a pair of coordinates, an address, or a name of a place (ESRI
2010) - allows the data to be spatially displayed which then allows for recognizable patterns
within the information to become visually manageable via map (Figure 10).
The next step was to locate the Illinois farmers’ markets that accept SNAP/EBT
transactions. The Illinois Department of Human Services list farmers’ markets that accept SNAP
22
benefits on their website http://www.dhs.state.il.us/page.aspx?item=44172, accessed November
2010. The DHS list contains 25 farmers’ markets. A crosscheck was performed between the
National Farmers’ Markey Directory and the Illinois DHS farmers’ market list of EBT accepting
farmers’ markets. Only 22 of the 25 farmers’ markets on the DHS list were located on the
National Farmers’ Market Directory with confidence (Appendix C).
A. Using the USDA’s Food Desert Locator what is the spatial relationship of Farmers’
Markets and Food Deserts?
Food Desert Locator
Prior to discussing research question 3, the following section explains why the sample
farmers’ markets were chosen to answer research question 3. Using the USDA’s Food Desert
Locator, which shows where each farmer’s market is located in respect to a USDA declared food
desert, farmers’ markets addresses were entered into the Food Desert Locator, consecutively as
they appeared on the list, and selected for this study according to their location within or
proximity to food deserts. Being the case study of this project, the 61st Street Farmers Market
was automatically chosen as an EBT accepting site for the analysis. Next, the remaining EBT
and non-EBT accepting farmers’ markets were located on the Food Desert Locator and those
farmers’ markets of each group found directly in or closest to a USDA declared food desert were
chosen for the analysis.
According to the USDA’s Food Desert Locator, a food desert is defined as a: “low-access
community, at least 500 people and/or at least 33 percent of the census tract's population must
reside more than one mile from a supermarket or large grocery store (for rural census tracts, the
distance is more than 10 miles)”. Using the USDA’s food desert locator,
http://www.ers.usda.gov/data/fooddesert/fooddesert.html, each farmers’ markets address was

23
entered, adjusted to1:36 magnifications and visually inspected to see precisely where within or
near a food desert each market was located (Figures 3-10). Farmers’ markets to analyze were
chosen solely on their location.
.

24
Figure 5 USDA's Food Desert Locator displaying
the location of the Springfield, Illinois Farmers
Market which currently accepts EBT. Illinois
Products Farmers’ Market located at 801 East
Sangamon Ave./ Illinois State Fairgrounds (shown
as red dot) located a few blocks east of a food
desert (pink highlighted area).
Figure 6 USDA's Food Desert Locator displaying
the location of the Bloomington, Illinois Farmers
Market which currently accepts EBT. The
Downtown Bloomington Farmers’ Market is located
at the Intersection of Main and Jefferson (shown as
red dot) located a few blocks east of a food desert
(pink highlighted area).
Figure 3 USDA's Food Desert Locator displaying
the location of the case study: 61st Street Farmers
Market which currently accepts EBT (shown as
red dot) located within a food desert (pink
highlighted area).
Figure 4 USDA's Food Desert Locator displaying
the location of the Urbana, Illinois Farmers Market
which currently accepts EBT. 400 South Vine
(shown as red dot) located a few block south of a
food desert (pink highlighted area).

25
Figure 7 USDA's Food Desert Locator displaying
the location of the Chicago, Illinois Farmers Market
NOT currently accepting EBT transactions.
Gately/Pullman (Chicago) Farmers Market located
at 11141 S. Cottage Grove (shown as red dot)
located within a food desert (pink highlighted area)
Figure 8 USDA's Food Desert Locator displaying
the location of a Normal, Illinois Farmers Market
NOT currently accepting EBT transactions.
Uptown Normal Trailside Farmers Market located
at 100 W. North Street (shown as red dot) located
within a food desert (pink highlighted area)
Figure 9 USDA's Food Desert Locator
displaying the location of a Moline, Illinois
Farmers Market NOT currently accepting EBT
transactions. Trinity 7th St. Moline Farmers
Market located 500 John Deere Road (shown as
red dot) located within a food desert (pink
highlighted area).
Figure 10 USDA's Food Desert Locator
displaying the location of a Steeleville, Illinois
Farmers Market NOT currently accepting EBT
transactions. Steeleville Farmers Market
located 107 West Broadway (shown as red dot)
located within a food desert (pink highlighted
area).

26
Research Question 3- Study Design
3) How do the socio-economic characteristics compare among farmers’ markets that
accept EBT and those that do not accept EBT?
Study Area
Of the listed 288 Illinois farmer’s markets, 8 markets were selected, using the USDA’s
Food Desert Locator, to analyze as a sample of the farmer’s markets population, of which, 4
SNAP/EBT accepting markets and 4 non- EBT accepting markets (Table 3).
Table 3. Farmers’ markets used as analysis sample for Illinois farmers’ markets
4 Illinois farmers’ markets that accept EBT and 4 Illinois farmers’ markets that
do not. * indicates case study: 61st Street Farmers Market.
EBT markets Census tract County
*6100 S. Blackstone Avenue,; Chicago, 60637 4202 Cook
400 S. Vine; Urbana, 81801 55 Champaign
800 E. Sangamon Avenue; Springfield, 62702 4 Sangamon
106 W. Monroe; Bloomington, 61701 16 McLean
Non-EBT markets
11141 S. Cottage Grove Avenue, Chicago, 60602 5003 Cook
100 W. North Street, Normal 1.02 McLean
500 John Deere Road, Moline 202 Rock Island
107 W. Broadway, Steeleville 9511 Randolph

27
Data Collection
Using the U.S Census Bureau’s American Fact Finder database found at
http://factfinder2.census.gov/faces/nav/jsf/pages/index.xhtml, information was collected on the
census tract level for 8 selected Illinois farmers’ markets (Table 3). Necessary for a small
geographic area, such as the census tract, the American Community Survey provides through the
U.S Census Bureau American Fact Finder 5 year estimates based on data collections between
January 2005 and December 2009. The socio-economic demographic characteristic data for the
8 farmers’ markets chosen for the analysis and imported into excel which included: total
population (TP), income, age, ethnicity, poverty level, employment status, food stamp recipients
(SNAP) and educational attainment (Appendix E). The excel files were condensed to include
data necessary for this study and the file was then imported into ArcGIS 10 as a shape-file.
Mann- Whitney U Test
The non-parametric Mann-Whitney U (Ranking) Test is used when the test assumptions
for parametric test are violated. Unlike parametric test, the data of non-parametric test are not
required to be drawn from a normally distributed population nor is an equality of variances
required (Morgan et al. 2007). The Mann-Whitney U Test evaluates whether the mean ranks on
the test variables are found to differ significantly between 2 groups. In other words, it’s used to
determine if a difference exist between 2 groups.
The Mann-Whitney U Test combined all the observations within each test variable into
one group and ranked them from lowest to highest. Each variable contained descriptive
values/categories. For example, the variable population contained values for the number of
people above poverty and below poverty within each area. Full descriptions of the variables’
values/categories are listed in Appendix D. Once the values were ranked, they were placed back
into their respective groups of EBT or non-EBT accepting. SPSS then calculated the mean ranks

28
for each group and computed a test statistics which determined whether there was a significant
difference in the mean ranks for both groups.
In this study the two groups being tested were farmers’ markets that accept EBT and non-
accepting EBT markets. This test produced a p (probability) value or calculated probability used
to estimate whether the null hypothesis (Hₒ) was rejected or retained:
Hₒ (null hypothesis): There is no difference between the socio-economic characteristics
of the EBT and non-EBT accepting farmers’ markets areas;
H1 (alternative hypothesis): There is a difference between the socio-economic characteristics of
the EBT and non-EBT accepting farmers’ markets areas.
This study used the p (probability) value as a means to interpret statistical
significance. Probability (p) values range from 0 (no chance) to 1 (absolute certainty). A p-
value less than the α (alpha) of .05 (p <.05) would suggest that the results from the test are
statistically significant (unlikely to have arisen by chance/ the difference is considered
significant) and therefore the null hypothesis is rejected; if the p-value is greater than alpha (p
>.05) this would suggest that the difference is reasonably a chance finding and the idea that there
is no difference between the EBT accepting and non-EBT accepting farmers’ market areas would
be retained.

29
CHAPTER 4
RESULTS/ FINDINGS
Research Question 1- Case Study Interview Findings
The 61st Farmers Markets accepted EBT on the first day of the markets opening
on May 16, 2008. Although the market chose to initiate EBT acceptance immediately, the
familiarity of farmers’ markets accepting EBT was uncommon to EBT users, because of this,
sales from EBT usage for market season 2008 were not impressive. “So our first year in link we
did about $1100; second year total combined sales were over $6500 and then 2010 things just
went even more crazy more crazy cause we did $10,100 in link and $7300 in double value so
more than a thousand percent increase in link sales in 2010,” (Dennis Ryan, interviewed by
Deidra Davis, April 2011).
However, rather than focusing on their immediate profits or any other aspect of the
markets operation for the first year, EBT acceptance in this market eventually helped to cultivate
its success in the following areas:
1) Market operations: As more and more attention has been brought to the 61st Farmers
Market, via word of mouth, advertisement, news, etc, there is no doubt that EBT has
had a profound impact on the market over the years. The location of this farmers
market allows the market offer access to EBT users, but also to a community of
consumers already familiar with farmers’ markets. Community socio- economic
characteristics are important, especially when a new market is being established into a
community. Typically, patrons of farmers’ markets are “foodies”: those who know of
the benefits of fresh food and vegetables and are concerned with stimulating their
local economy. The 61st Farmers Market provides quality fruits, vegetables, meats
and even baked goods to an affluent community in their surrounding area, in addition

30
to introducing the benefits of the farmers’ market to the unfamiliar and in some cases,
impoverished EBT residents nearby. Having consumers that regularly frequent the
market helps to maintain the economic flow of the market, while it establishes itself
with future market goers, the neighboring EBT users, resulting in a wealth of positive
economic stimulation for the farmers and the market, ultimately creating a successful,
widely known, and patronized farmers’ markets where everyone can have access to
fresh fruits, vegetables and potentially more.
In addition to reporting the results of research question 1, excerpts from the interview are
presented in this section, and in Table 4, and are categorized into the 4 literature topics:
Farmers’ Markets and Consumers
Effectively Operating Farmers’ Markets
Importance of Market Accessibility
Healthy, more nutritious foods
Farmers’ Markets and Consumers
The establishment of relationships and lengthy dialog is somewhat inevitable when it
comes to market vendors and the consumers. Unlike traditional grocery store, vendors and
consumers of farmers’ markets are able to converse over goods and services provided through
direct farmer- consumer interaction. The 61st Street Farmers Markets consisting of about 20
vendors each Saturday, April through November, provides consumers with a wide array goods
and opportunities to engage in conversation with the farmers. In a portion of this interview,
Ryan was asked to describe some community interactions that he felt were the consequences of
the markets acceptance of EBT:
“I think in general, to start, in a farmers market, the typical conversation is like
10 times longer than if you did it at a supermarket. It’s like 10 minutes verses 1

31
minute, so people meet other people and talk. People get to know their neighbors
and relationships are formed. Grandmothers are coming with their grand-kids
introducing them to it [the market]. We only have one picnic table so people are
sitting down and talking to people they may not have talked to and at the demos
[food demonstrations] everyone sits together. It becomes like ‘hey I’m going to
go to the market, why don’t we meet there and have a coffee’ and I think what’s
wonderful is that we have such a diverse community that people start to see that;
because we’re so divided by this big main street people are coming across the
street now and they’re seeing the market and meeting their neighbors and those
relationships form, and we’d hope those relationships turn into even bigger things
like ‘hey you want to start a food business?” (Dennis Ryan, interviewed by Deidra
Davis, April 2011).
Effectively Operating Farmers’ Markets
Dennis Ryan explains how he has implemented strategic practices in the markets daily
operation which has, in effect, led to many accomplishments’ for the market including providing
healthy nutritious foods, dietary education and annual farm tours to children in the community
(Table 4). Below is an excerpt of Ryan discussing why he feels some markets do not perform
well:
“Some [Farmers’ markets] don’t do the research, some don’t ask the questions.
They see a farmers market and don’t realize the work that goes into it. I’m here
[The Experimental Station- home of the farmers market, bike shop and up and
coming vegan café] 6 days a week during the season; I get here at 8 in the
morning and leave at 5; that’s good, (laugh) to be able to get out on time ,because
yeah it takes a ton of work. My day is filled up with the market; all the outreach,
all the education, from everything as simple as making sure the farmers are ready
to start, the logistics, the applications. So I think the success does point to proper
planning and proper organization that gives the farmers confidence. If they know
that you’re organized they’ll have a bit more confidence; they’ve seen enough
farmers’markts and they’ve seen markets fail and succeed and there are certain
factors that will ensure better than others that your market will succeed. So other
markets that haven’t [done well] I will say that some of the reasoning is that
maybe they didn’t take the time they should have, I would say that maybe they
focused on certain things that aren’t as important as opposed to education and
more marketing. Where we see the best marketing tool is the education and
outreach; they spend tons on fliers and ads which don’t really help, I don’t think.
They don’t have a full time market manager, sometimes it’s a volunteer, and it
takes a lot of time to do it and if they can’t do all these things especially if you
want to launch in a place where people don’t have access to healthy foods, money

32
is an issue and time is an issue. So we have to make sure all these things are
happening and you can’t do that if you’re not organized and not staffed.” (Dennis
Ryan, interviewed by Deidra Davis, April 2011).
As far as handling SNAP/EBT transaction, Dennis Ryan states:
“Typically there is one central location, we do it at our information table so that way it
doesn’t stand out, cause with SNAP/LINK users there’s a stigma attached to it and they
have to be treated as every other shopper in this market the shopping is slightly different
but that’s just by the nature of the system.” (Dennis Ryan, interviewed by Deidra Davis,
April 2011)
Importance of Market Accessibility/ Healthy, more nutritious foods
The farmers’ market accessibility to all communities was a point that Ryan expressed
throughout the interview. The Experimental Station, already established in the community, was
a great location to add a farmers’ market. The community, being very familiar with the positive
outreach activities held at 6100 South Blackstone, via the Experimental Stations numerous
entities -one being the bike shop, provided a foundation for the 61st Farmers Market to grow and
thrive in this community. The Woodlawn area (located directly south of the 61st Farmers
Market) is considered a food desert, consumers who would normally have to drive, walk or take
public transportation to obtain fresh fruits and vegetable are now able to stay within their
community and purchase food that are not only healthy and nutritious, but also aids to stimulate
the local economy.
“to the north of us is an affluent university community, where the current President
Barack Obama, prior to his presidency, lived several blocks away; but we have a food
desert immediately to the south of us”( Dennis Ryan, interviewed by Deidra Davis, April
2011).

33
Continuing on with our conversation about the 61st Street Farmers Markets growth in the
community, as well as within, Ryan told a story about a person influenced by the markets
dynamics and desire to contribute their abilities and time to such a cause:
“…so they kept calling, wanting to be a part of the market and I said we have to
be careful of who/what we bring in. So they’re like “let’s do that”, I’m like “we
already have that”, or they say “I can do this” but we have one of those…. I have
three of that. So [this person] kept calling back and then said “well what do you
need”? I said “I need this”, then this person goes “yeah I can do that”. Funny
enough it’s like this person had all the equipment, all the stuff and said “yeah, I
used to do this I have all the equipment I just don’t do it anymore”. So that got
them into the market, they shop at the market buys all organic- a complete health-
nut and all that stuff, understands nutrition everything. So now they’re here at the
market and lives very close, only a few blocks away. So we get to know them
and then they start to know the farmers. So now they get all the ingredients from
the farmers. So that’s building the community! So we want to start adult cooking
classes, they know how to cook; they cook healthy foods, uses local stuff. They
are already at the market people see them. We say hey, do you want to teach our
cooking classes? They agree, and are now teaching cooking classes. We say, we
want to do kids cooking classes? Can you do that? They are incredible teaches, so
and can do that as well. It’s not a ton of money but it’s something-they are
starting their own business and now…. Because we have an incubator space, a
business incubator space below us, which used to be a café but the owner had to
move on so we rent out the space and they are now building that space up as well
as another space to start a healthy raw vegan food business. And you don’t hear
about that in the Wood-lawn neighborhood and they lives here and has clientele,
followers and they’re all going to come down and buy their food and they will
still source from the market. So now their clients become introduced to the
building and they see the bike shop and they see the market and they see the
events and it all just keeps rolling... and it keeps the dollars within the community,
so then the community grows”(Dennis Ryan, interviewed by Deidra Davis, April
2011).

34
Table 4. Interview responses from Dennis Ryan which corroborate with literature topics.
Literature Topics Dennis Ryan’s interview responses
Farmers’ Markets
and Consumers
• “A typical conversation is like 10 times longer than at a
supermarket”
• “Communities learn, farmers get new shoppers”
• Keep vendors as consistent as possible... “If you’re a shopper and you
come to the market one day and you see farmer ‘Bob’ and you love his
stuff and for some reason he didn’t show up next week you’re gonna be
upset, you’re not going to come back again so that hurts the other
farmers”.
Effectively
Operating Farmers’
Markets
• Financial Contributors/ receive grants
• Dedicated market managers/ volunteers
• Relationships w/farmers based on trust
• The markets’ hours of operation must remain consistent; to change
market hours or days of operation “that would be a death, you can’t do
that. Once you start- keep it rolling”.
• Outreach - “The outreach is like the education the fliers, church
activities, the schools, cooking classes... So when we think about what
community we’re reaching and how they get their news, that’s where we
try to access them. Word of mouth is 65% of our clients”.
• “link transactions are highest at the beginning of the month; Although
benefits vary through the month, but on average it’s the first of the
month”
Importance of
Market Accessibility
• Purpose in the community: “rebuild the food culture, do outreach,
[food/nutrition] education and make it affordable to everyone”
Healthy, more
nutritious foods
• “Most of our sales, link sales, goes to fruits and vegetables- over 60 to
70%”,
• “We would not bring food into the community that we
will not eat ourselves”
2) Personal inspirations: As Dennis Ryan expressed within our interview, his personal
goals in the beginning phase of opening the 61st Farmers Market were -”to support the
diversity of our community and to be sure that everyone has access to healthy
food”(Dennis Ryan, interviewed by Deidra Davis, April 2011). Accepting EBT
allowed the market organizers to satisfy their personal business goals by supplying
their [the markets] products to a community where individuals possessing SNAP

35
funding could utilize government assistance for sustenance on fresh fruit and produce
available within their own community.
Research Question 2- Map Production of Illinois Farmers’ markets
ArcGIS 10.0 provided the following output of farmers’ markets in Illinois that were listed
on the USDA National Farmers Market Directory (Appendix B). Figure 11 is a map displaying
288 farmers’ markets in Illinois. Notice the north- eastern portion of Illinois where the farmers’
markets are clustered. This may be correlated to the fact that Chicago is the largest city within
Illinois where Cook, DuPage, Will, Kane, McHenry counties are shown clustered with farmers’
markets (Figure 11).
36
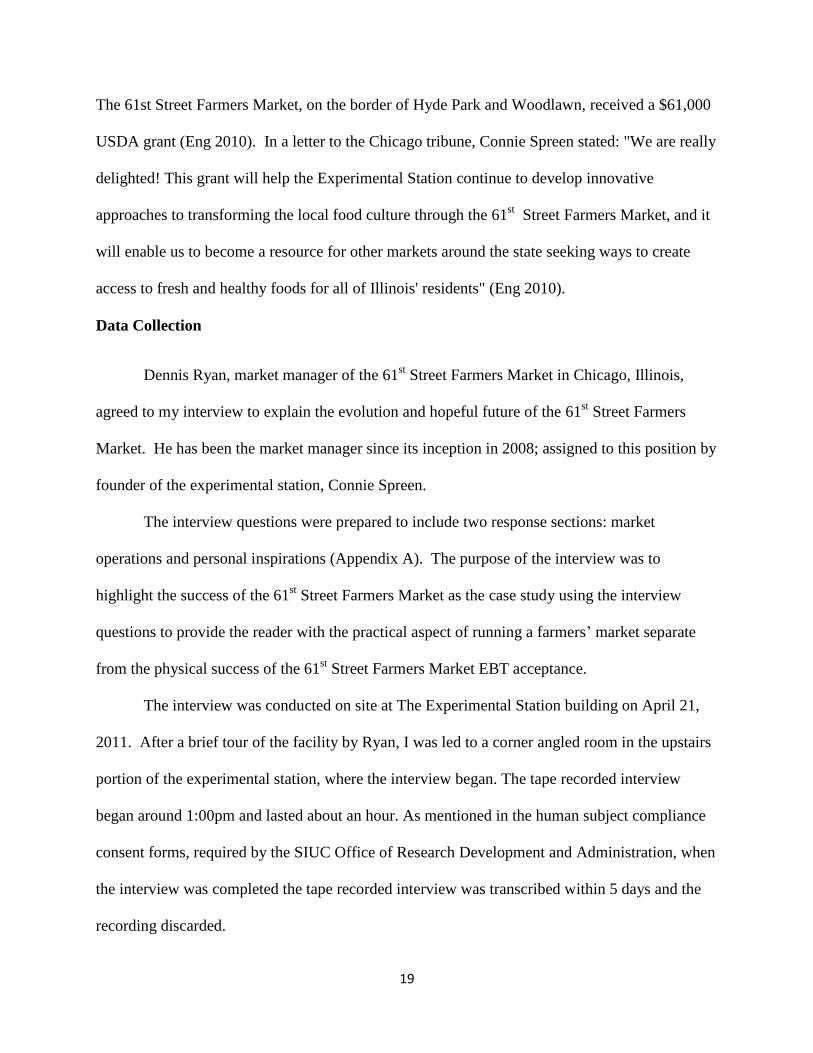
Figure 11. The distribution of farmers’ markets across the state of Illinois.
Figure 12 shows the 22 markets across Illinois that accept EBT. A listing of these
markets is located in appendix C. Note that the largest county in Illinois, by population and area,
has the greatest number of farmers’ markets. The 61st Farmers Market is shown highlighted in
red.

37
Figure 12. The 22 listed Illinois farmers' markets that accept SNAP/EBT
(Illinois Link card). The Experimental Stations 61st Street
Farmers Market, case study, shown in red.
38
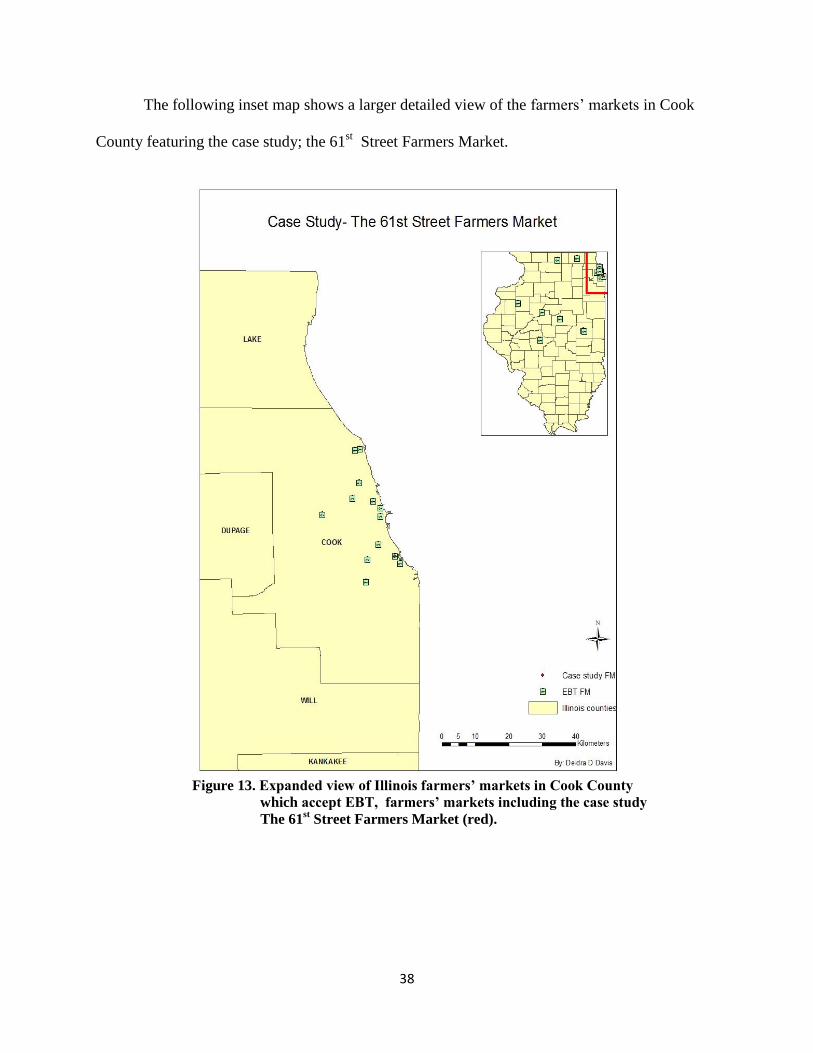
The following inset map shows a larger detailed view of the farmers’ markets in Cook
County featuring the case study; the 61st Street Farmers Market.
Figure 13. Expanded view of Illinois farmers’ markets in Cook County
which accept EBT, farmers’ markets including the case study
The 61st Street Farmers Market (red).

39
The map in figure 14 displays the 8 farmers’ markets used for the analysis of EBT and
non EBT accepting markets. The markets displayed as red dots are the markets that are listed as
currently accepting EBT and the markets displayed as green squares are the markets where EBT
is not accepted.
Figure 14. Distribution of the sample population of Illinois Farmers’
Markets; 4 which accept EBT and 4 non-EBT accepting markets.

40
Food Desert
Of the 22 listed farmers’ markets that accept EBT in Illinois, only 1 farmers market is
located within a USDA declared food desert. The 61st Farmers Market located at 6100 South
Blackstone is located within a food desert (Figure 3), which is also the case study within the
framework of this project. Figures 4-6 shows the other EBT markets that unfortunately are not
within a USDA food desert, but close to a declared food desert:
400 S Vine, Urbana – Champaign County
800 E. Sangamon Avenue; Springfield- Sangamon County
106 W. Monroe, Bloomington- McLean County
Likewise, it is expected that farmers market not currently accepting EBT would not
necessarily be located within a food desert, however, the results shows 3 non-EBT accepting
farmers’ markets located within a USDA declared food desert area (Figure 7, 8 and10):
11141 S. Cottage Grove Avenue, Chicago - Cook County
100 W. North Street, Normal- McLean County
107 W. Broadway, Steeleville – Randolph County
The 4th
non-EBT accepting farmers’ market, 500 John Deer Road, Moline- Rock Island County,
used in this study was not found within a food desert, however, according to the USDA’s food
desert locator, it is surrounded by 3 food desert (Figure 9).

41
Research Question 3- Socio-economic characteristic between EBT and non-EBT markets
Since Mann-Whitney U test ranks data from low to high, the variable EBT (categories:
yes or no) with the highest mean rank had the higher number of observations within that
respective variable under the particular EBT acceptance category. Because the alpha level was
greater than .05 (α) for each variable tested, it can be concluded that there was enough
information to retain the null hypothesis and conclude that there was no significance difference
between the two groups. Both the EBT accepting and non-EBT accepting farmers’ markets did
not differ on either test variables listed in Table 5, therefore we fail to reject the null hypothesis
stating that there is no difference between the socio-economic characteristics of the EBT and
non-EBT accepting farmers’ markets.
Table 5. Test variables along with their respective p value (sig.) (collapsed for
readability).Appendix D contains a full description of collapsed variables.
Variable EBT acceptance Mean rank Sig.
SNAP recipients 1.000
Yes 4.50
No 4.50
Ethnicity .791
Yes 31.91
No 33.09
Income .496
yes 23.12
no 25.88
Employment .456
yes 69.91
No 75.09
Poverty Status .345
Yes 21.88
No 27.12
Educational Attainment .337
Yes 30.27
No 34.73
Population .208
Yes 7.00
No 10.00
Age .204
Yes 10.67
No 14.33

42
CHAPTER 5
DISCUSSION
With all the success of the 61st Street Farmers Market, Dennis Ryan acknowledges what
he believed to be an important business decision:
“why this works and why this street [61st Blackstone] is a key reason to our success- is
because it’s a border street; it’s a street that separates two very diverse neighborhoods-
we’re talking to the north of us is an affluent university community [where President
Barack Obama once lived several blocks away], and we have a food desert immediately
to the south of us and we believe that border location allows us to succeed” (Dennis
Ryan, interviewed by Deidra Davis, April 2011).
With the success of farmers’ markets generally being attributed to the level of
participation from the vendors (Rimal et al. 2010), the 61st Farmers Market is not in short supply
of vendors or of providing space for 20 vendors as well as a continually growing vendor waiting
list. So much so that Ryan has even had to refer vendors to other markets.
Literature expresses the importance of more engaged neighborhoods of farmers’ markets
and their influence on the markets viability, whether direct or indirect. Detre et al.’s (2010)
article explains that a university/college provides a captive group of consumers, students, many
of whom are transportation constrained and must rely on retail food outlets that are in close
proximity to their campus. Likewise, the fact that the 61st Street Farmers Market is situated
between the affluent neighborhood of the University of Chicago (to the north) and the
impoverished Woodlawn community (immediately to the south) is an example of how the
combination of these two areas allows this market to thrive and generate profitable gains while
educating their newer, inexperienced consumer base about the benefits of a farmers’ market.
Findings of research question 1 indicate that the locations of farmers’ markets are an important
factor when deciding whether to accept EBT, as well as, how to secure sufficient market funding.

43
Markets located within food deserts or near them would be expected to have an active
POS terminal(s) available for EBT users because of the lack of fresh foods and vegetables within
a reasonable distance, per USDA’s definition of a foods desert. This situation compels EBT
users to find other means of gathering fresh fruits and vegetables for their households where
supermarkets and grocery chains are unavailable or too tasking to travel. Likewise, where there
are no food deserts, but farmers’ market, it seems these areas would not be expected to readily
become EBT acceptors because there are other resources for fresh food and vegetables within the
area. However, when studying the USDA’s food desert locator, it was found that farmers’
markets that currently accept EBT are not even located within a food desert, except for the case
study. Unfortunately, the farmers’ markets that are not currently accepting EBT are located
within USDA declared food desert regions and have a great population of EBT users who, at the
moment, are unable to use their SNAP funds at their local farmers market.
This leads to findings from the Mann-Whitney U Test which fails to reject the Ho, that
the distribution of the [variables] across farmers’ markets areas that are EBT and non-EBT
accepting are the same for all variables. Population, age, race, income, poverty level,
educational attainment, SNAP and employment are considered to have no significant difference
between the EBT and Non-EBT accepting markets, according to the mean rank and p-value
generated from the Mann Whitney U test. Adding validity to this study is the findings of the
most essential variable - the SNAP recipients. The SNAP recipients mean ranks for EBT and
non-EBT areas are equal leading to a p-value of significance of 1.000. This result is supported by
the raw data for SNAP which expresses a likeness in the populations for EBT and non-EBT
farmers’ market locations for SNAP recipients at 766 and 782, respectively. These results,
especially of the SNAP recipients, add validity to the fact that there is no significant difference

44
between EBT and non- EBT farmer’s market communities and the non-EBT markets could
potentially benefit from accepting SNAP into their farmers’ markets.
Recommendations
Congress should re-authorize the 2012 Farm Bill with stipulations for the USDA to
follow:
1) Trouble-free pilot run (of EBT transactions) to non-EBT accepting markets.
Food desert areas should offer consumers access to fresh foods and vegetables via
farmers’ markets. So what is preventing non-EBT accepting farmers’ markets, located in food
deserts, from accepting EBT? As mentioned previously, starting a farmers market takes a great
deal of organization, time, commitment, competent managers and most importantly- funds. The
wireless POS terminals are expensive to purchase, problematic for outdoor farmers’ markets, and
have a costly operating expense especially for markets that are not largely patronized by SNAP
users. To remedy this, government or state agencies can provide wireless EBT machines to
markets for an introductory trial period, while covering all operating expenses. In addition, to
providing the machines, markets should be supplied with equipment training and immediate
access to personnel when equipment malfunction occurs. After a specified time period, state
agencies should analyze the markets operation using the EBT equipment and if it is feasible to
continue with its operations then the agency should further assist the markets with EBT
operations, until they can operate the terminal independently. This recommendation seems
rather pampered, but we must consider that some markets may not want to take the chance of
risking their profits, if any, on a system that may or may not be of an advantage. Along with
financial assistance to farmers’ markets for the operation of EBT machines, markets should be
presented with practical cases of EBT farmers’ markets that have created a successful market.

45
2) Aid to Farmers’ Market
Farmers’ markets should receive funding to launch their market, specifically those
located within food deserts. The emphasis of the initiating funds should concentrate on
financially supporting the market manager(s), market operating cost (EBT) and food coupon
incentive programs.
Additional funding should be allotted solely for the purpose of farmers’ market
community development and educational outreach programs. For instance, the additional
funding will provide farmers’ markets stands where people can learn how to prepare healthy,
nutritious meals from the foods they purchased from the market; to help improve the effort of
preparing foods the markets can also provide literature, in the form of pamphlets, booklets or
recipe cards, to consumers about their purchase.
3) Farmers
Farmers and local growers should be educated about opportunities to get their goods to
varying communities, via farmers’ markets, and farmers should be exposed to the growing
SNAP/EBT accepting farmers’ markets. Farmers’ should be provided with literature of practical
cases about successful EBT farmers’ markets, and provided with opportunities to interact with
other farmers and farmers’ markets that continue to grow. The farmer should be empowered and
supported by the USDA to seek grants and other financial assistance which would bring financial
stability and an awareness of the necessity for the production of their crops.
4) County Health Departments
As obesity and other health concerns rise, SNAP funds issued by the USDA should
include a purchase requirement. Eligible recipients should be required to purchase a specific
amount, set by the USDA or local government issuing SNAP, of fresh produce, fruit and

46
vegetables. Compelling the SNAP recipient to utilize the government funds to purchase
healthful foods could lead to a decrease in obesity and other health crisis plaguing the low-
income low-access communities.
Limitations
The USDA’s definition and location of food desert were used in this study, but literature
varies in their definition of food desert. Although the basic concept is the same (lack of
availability of quality fresh fruits and vegetables) different distances are used to classify an area
as a food desert. Furthermore, the discrepancy in defining a uniform classification for a food
desert will lead to inconsistencies in whether an area is really considered to be lacking in access
to fresh fruits and vegetables.
CONCLUSION
For a long time advocates have pushed to get government food assistance funds accepted
at more than just conventional, industry style grocery chains. In 2010, there were only 25 listed
SNAP/EBT accepting Illinois farmers’ markets, but that number is growing as EBT/SNAP
acceptance is being recognized by more farmers’ markets as an opportunity which not only
provides healthy nutritious foods to those who may not obtain them elsewhere, but also opens up
a greater opportunity for communities to expand beyond their common neighbor and make
healthier food access choices to ALL. As Baker et al (2009) states, “the creation of close
relationships between farmers and consumers can lead to increased producer incomes as well as
improved consumer access to fresh foods, while communities benefit from boosts to local
economies”.
Overall, the widespread acceptance of EBT at farmers’ markets provides families with
the assistance that they need to supply sustenance for their families, however, the full benefits of
this government funding could be utilized more efficiently if the farmers’ markets in those areas

47
would accept EBT- not only to provide healthier food choices to EBT users, but also to stimulate
their local economy by bring the government funds, via EBT, into their neighborhood farmers’
markets.

48
REFERENCES
2010. Food Stamp Timeline. Congressional Digest 89, no. 10: 297. MAS Ultra - School
Edition
2010. IDPH. Illinois Department of Public Health- Office of Health Protection Division Of Food,
Drugs and Dairies. Sanitation Guidelines for Farmers, Markets and Other Outdoor Food
sales Events. Technical Bulletin/ Food #30.
2011. Editorial: “Food deserts,” Houston Chronicle (TX), February 18. Newspaper Source
Algert, Susan J, Aditya Agrawal, and Douglas S Lewis. 2006. “Disparities in access to fresh
produce in low-income neighborhoods in Los Angeles,” American Journal Of Preventive
Medicine 30, no. 5: 365-370.
Apparicio, Philippe., Marie-Soleil Cloutier, and Richard Shearmur. 2007. “The case of
Montréal's missing food deserts: evaluation of accessibility to food supermarkets,”
International Journal of Health Geographics 6, no. 4.
Baker, Daniel, Kelly Hamshaw, and Jane Kolodinsky. 2009. “Who shops at the market? Using
consumer surveys to grow farmers' markets: findings from a regional market in
northwestern Vermont,” Journal of Extension 47, no. 6: 6FEA2.
Berg, Nathan., and James. Murdoch. 2008. “Access to grocery stores in Dallas,” International
Journal of Behavioural and Healthcare Research 1, no. 1: 22-37.
Block, JP, RA Scribner, KB DeSalvo. 2004. “Fast food, race/ ethnicity, and income: a
Geographic Analysis,” American Journal on Preventive Medicine 27(3):211-7
Bond, Jennifer.K., Dawn Thilmary, and Craig Bond. 2006. “Direct marketing of fresh produce:
Understanding consumer purchasing decisions,” Choices, 21(4), 229-235.
CDC- Centers for Disease Control. Division of Nutrition, Physical Activity and Obesity,
National Center for Chronic Disease Prevention and Health Promotion. Last updates
6/10/2010 http://www.cdc.gov/Features/FoodDeserts/
Detre, Joshua D., Tyler B. Mark, and Benjamin M. Clark. 2010. “Understanding Why College-
Educated Millennials Shop at Farmers’ Markets: An Analysis of Students at Louisiana
State University,” Journal of Food Distribution Research 41, no. 3: 14-24.
Eng, Monica. Hyde Park farmers market gets fruitful USDA award. The STEW- Chicago
Tribune. 15 Oct 2010. http://leisureblogs.chicagotribune.com/thestew/2010/10/hyde-
park-farmers-market-gets-big-usda-award.html
49
ESRI. 2010. “What is Geocoding?”
http://help.arcgis.com/en/arcgisdesktop/10.0/help/index.html#/What_is_geocoding/00250
0000001000000/
GPSVisualizer 2010. http://www.gpsvisualizer.com/geocoder/
Hamilton, Neil D. 2002. “Farmers' markets rules, regulations and opportunities,” National
AgLaw Center publications, Agricola.
IDHS. Illinois Department of Human Services. http://www.dhs.state.il.us/page.aspx?item=44172
Department of Natural resources- Illinois facts. 2010.
http://www.dnr.state.il.us/education/CLASSRM/IllinoisFactsFinal.pdf
Jarosz, Lucy. 2002. Understanding Agri-food networks as social relations. Agriculture and
Human Values17: 279-283
Markowitz, Lisa. 2010. Expanding Access and Alternatives: Building Farmers' Markets in Low-
Income Communities. Food & Foodways: History & Culture of Human Nourishment 18,
no. 1/2: 66-80.
Morgan, George A., Nancy L. Leech, Gene W. Gloeckner and Karen C. Barrett. 2007. SPSS for
Introductory Statistics: Use and Interpretation. Third edition. Mahwah N.J.: Lawrence
Erlbaum, Inc, 2007.
O'Neil, B. 2004. Reflections on the Food Stamp Program. Policy & Practice (19426828), 62(2),
10.
Ploeg, Michele Ver. 2010. "Access to Affordable, Nutritious Food Is Limited in "Food Deserts.."
Amber Waves: The Economics of Food, Farming, Natural Resources, & Rural America
8, no. 1: 20-27.
Rimel, Arbindra, Benjamin Onyango and Jessica Bailey. 2010. “Farmers’ Markets: Market
attributes, Market managers and Other Factors Determining Success,”.Agricultural and
Applied Economics Association.
Ryan, Dennis. Interviewed by Deidra Davis. Tape Recording. Chicago, IL., April 21, 2011.
Spreen, C. 2006. About the Experimental Station. http://www.experimentalstation.org/about
Social IMPACT Research Center 2010. Illinois: Snapshot of Poverty, Income, and Health
Insurance Coverage. Heartland Alliance
Tietenberg, Tom and Lynne Lewis. 2009. Environmental & Natural Resource Economics:
Eighth edition. Pearson Education, Inc.

50
The Experimental Station, accessed July 19, 2011, http://experimentalstation.org
USDA-AMS 2010. Geographic Coordinates Spreadsheet for U.S. Farmers’ markets (XLS)
http://www.ams.usda.gov/AMSv1.0/farmersmarkets
USDA-AMS 2011. Farmers Market and Local Food Marketing.
http://www.ams.usda.gov/AMSv1.0/ams.fetchTemplateData.do?template=TemplateA&n
avID=WholesaleandFarmersMarkets&leftNav=WholesaleandFarmersMarkets&page=W
holesaleAndFarmersMarkets&acct=AMSPW
USDA-FNS/BRD 2011. Supplemental Nutrition Assistance Program's Benefit Redemption
Division (BRD) Annual Report for Fiscal Year 2010.
http://www.fns.usda.gov/snap/retailers/pdfs/2010-annual-report.pdf
USDA- FNS 2010. Supplemental Nutrition Assistance Programs: Nutrition education. Food
and Nutrition Service.
http://www.fns.usda.gov/snap/nutrition_education/default.htm
http://www.fns.usda.gov/fns/ last updated 6//07/2010.
USDA-FNS/SNAP .2010. Supplemental Nutrition Assistance Programs: A Short History of
SNAP.
http://www.fns.usda.gov/snap/rules/Legislation/about.htm Last modified: 6/07/11
USDA-FNS/SFMNP. 2009. Senior Farmers’ Market Nutrition Factsheet.
www.fns.usda.gov/wic/SFMNP-Fact-Sheet.pdf
USDA- FNS/WIC. Women, Infant and Children. Food and Nutrition Service.
http://www.fns.usda.gov/wic/aboutwic/mission.htm
USDA/FNS WIC FMNP. 2011. WIC Farmers’ Market Nutrition Program Factsheet.
www.fns.usda.gov/wic/WIC-FMNP-Fact-Sheet.pdf
USDA/ DOA 2010- Report to Congress: Supplemental Nutrition Assistance Program (SNAP):
Feasibility of Implementing Electronic Benefits Transfer (EBT) Systems in Farmers’
Markets.
Vecchio, R. 2010. "Local food at Italian farmers' markets: three case studies." International
Journal of Sociology of Agriculture and Food 17, no. 2: 122-139.
51
Wasserman,W., D. Tropp, V. Lakins, C. Foley, M. DeNinno, J. Thompson, N. Owens and Kelly
Williams 2010. Supplemental Nutrition Assistance Program (Snap)At Farmers’ markets:
A How-To Handbook. A joint publication by: USDA Agricultural Marketing Service
USDA Food and Nutrition on Service Project for Public Spaces, Inc.
http://www.ams.usda.gov/AMSv1.0/getfile?dDocName=STELPRDC5085298
Wolf, Marianne McGarry, Arianne Spittler, and James Ahern. 2005. "A Profile of Farmers'
Market Consumers and the Perceived Advantages of Produce Sold at Farmers' Markets."
Journal of Food Distribution Research 36, no. 1: 192-201.
Zepeda, Lydia. 2009. "Which little piggy goes to market? Characteristics of US farmers' market
shoppers." International Journal of Consumer Studies 33, no. 3: 250-257

APPENDICES

52
APPENDIX A
INTERVIEW QUESTION *
Market Operations
1 What was the opening date of the 61st street Farmers’ market?
2 What are the markets’ days/hours of operation?
3 On an average market day, how many vendors are selling products at the market?
4 What forms of payment are accepted at your market?
5 When did you begin to accept LINK (at the very beginning of operation or as the market
progressed?
6 During what week of the month are your LINK transactions highest?
7 About how many LINK transactions has your market had in 2008, 2009, 2010?
Respectively, what were the total LINK sales? Daily average?
8 Do all vendors participate in EBT transaction?
9 Are all vendors required to participate in EBT program?
10 How did you introduce the individual farmers to the idea of EBT acceptance?
11 How do you handle LINK transactions?
12 Do you offer any incentives to customers using LINK?
13 What is the method of EBT transactions? Which option do you use? Tokens/ scrips,
receipts or manual vouchers
14 Do you own your EBT machine?
15 What start-up cost did you incur due to the implementation of the LINK/SNAP program?
How did you cover this cost?
16 What is your average monthly cost to operate the LINK/SNAP program? How did you
cover these costs?
17 Do you have any types of outreach programs?
18 Can you describe community interactions that you feel were the consequence e of the
markets acceptance of EBT?
Personal Motivations
1 What was the influence of the placement of the market at 6100 S. Blackstone?
2 Was your business plan well thought out? What was it?
3 What would you credit to the success of your farmers market?
4 Do you have any recommendation to other farmer market coordinators looking interested in
implementing the Illinois LINK/SNAP program?
*Provided by Dr. Sylvia Smith, SIUC Food & Nutrition, 2011.
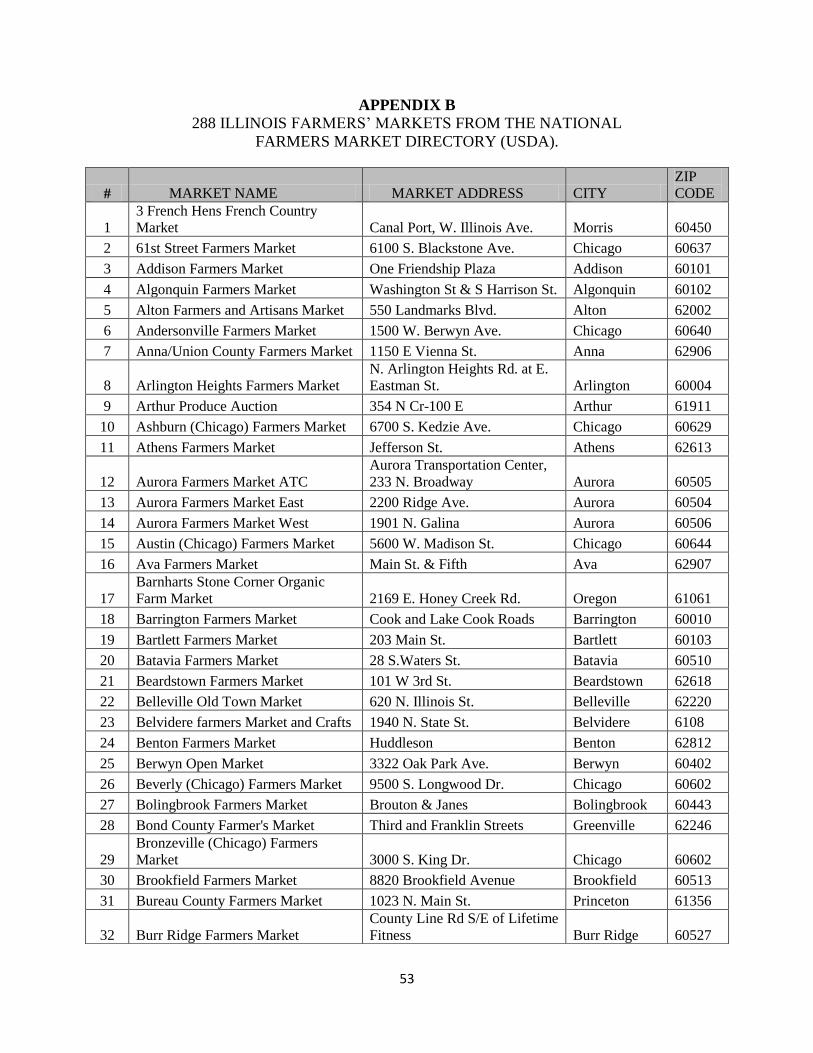
53
APPENDIX B
288 ILLINOIS FARMERS’ MARKETS FROM THE NATIONAL
FARMERS MARKET DIRECTORY (USDA).
# MARKET NAME MARKET ADDRESS CITY
ZIP
CODE
1
3 French Hens French Country
Market Canal Port, W. Illinois Ave. Morris 60450
2 61st Street Farmers Market 6100 S. Blackstone Ave. Chicago 60637
3 Addison Farmers Market One Friendship Plaza Addison 60101
4 Algonquin Farmers Market Washington St & S Harrison St. Algonquin 60102
5 Alton Farmers and Artisans Market 550 Landmarks Blvd. Alton 62002
6 Andersonville Farmers Market 1500 W. Berwyn Ave. Chicago 60640
7 Anna/Union County Farmers Market 1150 E Vienna St. Anna 62906
8 Arlington Heights Farmers Market
N. Arlington Heights Rd. at E.
Eastman St. Arlington 60004
9 Arthur Produce Auction 354 N Cr-100 E Arthur 61911
10 Ashburn (Chicago) Farmers Market 6700 S. Kedzie Ave. Chicago 60629
11 Athens Farmers Market Jefferson St. Athens 62613
12 Aurora Farmers Market ATC
Aurora Transportation Center,
233 N. Broadway Aurora 60505
13 Aurora Farmers Market East 2200 Ridge Ave. Aurora 60504
14 Aurora Farmers Market West 1901 N. Galina Aurora 60506
15 Austin (Chicago) Farmers Market 5600 W. Madison St. Chicago 60644
16 Ava Farmers Market Main St. & Fifth Ava 62907
17
Barnharts Stone Corner Organic
Farm Market 2169 E. Honey Creek Rd. Oregon 61061
18 Barrington Farmers Market Cook and Lake Cook Roads Barrington 60010
19 Bartlett Farmers Market 203 Main St. Bartlett 60103
20 Batavia Farmers Market 28 S.Waters St. Batavia 60510
21 Beardstown Farmers Market 101 W 3rd St. Beardstown 62618
22 Belleville Old Town Market 620 N. Illinois St. Belleville 62220
23 Belvidere farmers Market and Crafts 1940 N. State St. Belvidere 6108
24 Benton Farmers Market Huddleson Benton 62812
25 Berwyn Open Market 3322 Oak Park Ave. Berwyn 60402
26 Beverly (Chicago) Farmers Market 9500 S. Longwood Dr. Chicago 60602
27 Bolingbrook Farmers Market Brouton & Janes Bolingbrook 60443
28 Bond County Farmer's Market Third and Franklin Streets Greenville 62246
29
Bronzeville (Chicago) Farmers
Market 3000 S. King Dr. Chicago 60602
30 Brookfield Farmers Market 8820 Brookfield Avenue Brookfield 60513
31 Bureau County Farmers Market 1023 N. Main St. Princeton 61356
32 Burr Ridge Farmers Market
County Line Rd S/E of Lifetime
Fitness Burr Ridge 60527

54
33 Cambridge Farmers Market 876 County Seat Boulevard Cambridge 61238
34 Canton Farmers Market 90 E. Locust St. Canton 61542
35 Carbondale Farmers Market 2101 W Main St. Carbondale 62901
36
Carbondale Main Street Grower's
Market 200 E. Main St. Carbondale 62901
37
Carlyle Courthouse Square Farmers
Market 8th St. Carlyle 62231
38 Carterville Farmers Market 304 S. Division St. Cartiville 62918
39 Carthage Farmers Market Courthouse Square Carthage 62321
40 Centralia Farmers Market E 2nd St. at S. Locust St. Centralia 62801
41
Champaign County Fair Farmers
Market 229 Mattis Ave. Champaign 61821
42 Charleston Farmers Market 500 7th St. Charleston 61920
43 Chatham (Chicago) Farmers Market E 87th Pl at S Langley Ave Chicago 60619
44 Chicago Nettlehorst French Market
Corner of Broadway & Melrose
in lakeview Chicago 60657
45 Chicago's Green City Market
Between 1750 N. Clark &
Stockton Drive Chicago 60614
46 Chicago's Green City Market 1799 N. Clark St. Chicago 60622
47 City Centre Market 20 N Water St., Ste 370 Decatur 62523
48 City of Cuba 403 E. Jefferson Street Cuba 61427
49 City of Zion Farmers Market Shiloh Blvd & Sheridan Rd Zion 60099
50
Clinton Area Farmers & Artisans
Market 100 S. Center St. Ste 101 Clinton 61727
51 Colonial Village Farmers Market 1240 S. Alpine Rockford 61108
52 Community Winter Market 11 North Fifth Street Geneva 60134
53 Conuco Farmers Market 2800 W. Division St. Chicago 60622
54 Country Club Hills Farmers Market 4200 W. 183rd St.
Country Club
Hills 60478
55 Country Side Farmers Market LaGrange 60525
56 Crete European Market 1321 Main St. Crete 60417
57 Crystal Lake Farmers Market
Depot Park, Woodstock &
Williams Streets Crystal Lake 60014
58 Cuba Farmers Market 403 E. Jefferson St. Cuba 61427
59
Daley Plaza Chicago Farmers
Market 50 W. Washington St. Chicago 60602
60 Danville Farmers Market 100 N. Vermilion St. Danville 61832
61 Deerfield Farmers Market
Deerfield Rd. & Robert York
Ave. Deerfield 60015
62 DeKalb Farmers Market 200 Palmer Ct. DeKalb 60115
63
Discover Sycamore's Farmers
Market 300 W Elm St. Sycamore 60178
64
Division Street Chicago Farmers
Market 1200 N Dearborn Chicago 60610
65 Dixon Farmers Market 317 W. 3rd St. Dixon 61021

55
66 Downers Grove Farmers Market Main Street Metro Station
Downers
Grove 60516
67 Downs Village Market S. Seminary St. Downs 61736
68
Downtown Bloomington Farmers
Market N. Main St. at E. Jefferson St. Bloomington 61701
69 Downtown Downers Grove Market 5001 Main St
Downers
Grove 60515
70 Downtown Elgin Harvest Market 120 E Highland Ave Elgin 60120
71 Du Quion Farmers Market
Keyes Park at Park and
Divisions Du Quoin 62832
72
Dunning-Eli's (Chicago) Farmers
Market 6701 W. Forest Preserve Ave. Chicago 60602
73 Dwight Main Street Farmers Market 132 E Main St Dwight 60420
74 East Dundee Farmers Market 319 N River St East Dundee 60118
75 East Moline Farmers Market 1112 42nd Ave. East Moline 61244
76
Eden Place Community Farmers
Market 4417 S. Stewart Ave. Chicago 60609
77 Edgebrook Farmers Market 1639 N Alpine & Highcrest Rockford 61107
78 Edgewater Green Farmers Market 6034 N. Broadway St. Chicago 60660
79 Edwards County Farmers Market S 4th St. at E. Main St. Albion 62806
80 Elburn Farmers Market 500 Filmore St Elburn 60119
81
Eli's Cheesecake and Wright College
Farmer's Market 6701 W. Forest Preserve Drive Chicago 60634
82 Elizabeth Farmers' Market 411 W. Catlin Elizabeth 61028
83 Elk Grove Village Farmers Market 1000 Wellington Ave.
Elk Grove
Village 60007
84 Elmhurst Farmers Market 105 E. Vallette St. Elmhurst 60126
85 Englewood Farmers Market 6452 S Ashland Ave. Chicago 60637
86 Erie Street Farmers Market 500 W Erie St Chicago 60610
87 Evanston's Farmers Market University at Oak Ave. Evanston 60201
88 Evergreen Park Farmers Market 9001 S Kedzie Ave
Evergreen
Park 60805
89
Farmer Fridays at Uncommon
Ground 1401 West Devon Ave Chicago 60660
90 Farmers Market on Historic N.1st North 1st Street Champaign 61820
91 Farmers Market on the Square 49 S Central Park Pl Jacksonville 62650
92 Farmstand at CHSAS 3857 W 111th St Chicago 60655
93
Federal Plaza (Chicago) Farmers
Market 230 South Dearborn St. Chicago 60602
94 First Market in Mahomet IL-47 & E Main St. Mahomet 61853
95 Flora Farmers Market 122 N. Main St. Flora 62839
96 Flossmoor Farmers Market 1000 Sterling Ave Flossmoor 60422
97 Frankfort Country Farmers Market
Downtown at Breidert Green
Oak & Kansas St. Frankfort 60423
98 Galena Farmers Market 121 E. Commerce St. Galena 61036

56
99 Galena Territory Farmers Market 2000 Territory Drive Galena 61036
100 Galesburg Farmers Market
Parking Lot - see description
below Galesburg 61401
101
Garfield Park (Chicago) Farmers
Market 300 N Central Park Ave. Chicago 60602
102
Gately/Pullman (Chicago) Farmers
Market 11141 S. Cottage Grove Ave. Chicago 60602
103 Geneva French Market South St. at 4th St Geneva 60134
104 Geneva Green Market 75 North River Lane Geneva 60134
105 Geneva Winter Market 11 N 5th St Geneva 60134
106 Gibson City Farmers Market 126 N. Sangamon Gibson City 60936
107 Glen Ellyn Farmers Market 400 Main St. Glen Ellyn 60611
108 Glencoe French Market 355 Park Ave. Glenco 60022
109 Glenview Farmers Market 1510 Wagner Rd. Glenview 60025
110 Glenwood Sunday Market 6900 N. Glenwood Ave. Chicago 60626
111 Golconda Farmers Market 310 E. Main St. Golconda 62938
112 Grayslake Farmers Market 147 Center Street Grayslake 60030
113 Green City Market 1750 N. Clark St. Chicago 60614
114
Greenwood Methodist Church
Market 11474 Ward Rd Valier 62891
115 Gurnee Farmers Market Grand Ave. & Kilbourne Rd. Gurnee 60031
116 Heritage Farmers Market 20235 State Rt. 9 Perkin 61554
117 Herrin Farmers Market Park Ave. Herrin 62948
118
Hines Veterans Hospital Farmers
Market 5th Ave. Hines 60141
119 Hinsdale Farmers Market 19 E. Chicago Ave. Hinsdale 60521
120 Home Grown Market on the Square 321 West 2nd Avenue Milan 61264
121 Homer Glen Farmers Market 159th & Bell Rd. Homer Glen 60491
122 Homewood Farmers Market 18200 Dixie Highway Homewood 60430
123 Huntley Farmers Market 11704 Coral St. Huntley 60142
124
Hyde Park (Chicago) Farmers
Market 5211 S. Harper Ave. Chicago 60602
125 Illinois Products Farmers Market Grandstand Ave. Springfield 62702
126 Immanuel Indoor Farmers Market 616 Lake St. Evanston 60201
127 Independence Park Farmers Market 3945 N Springfield Ave. Chicago 60618
128
Jacksonville Farmers Market at
Lincoln Square 901 W. Morton Ave. Jacksonville 62650
129
Jacksonville Main Street Farmers
Market on the Square 100 Block of West Douglas Jacksonville 62650
130
Jerseyville Farmers and Artisan
Market N State St. & E Exchange St. Jerseyville 62052
131 Joliet City Center Farmers Market
W. Van Buren St. at N. Chicago
Sts. Joliet 60432
132 Kankakee County Farmers Market I 100 E. Merchant St. Kanakee 60901
133 Kankakee County Farmers Market II 805 N. Kennedy Dr. Kankakee 60901

57
134 LaGrange Park Farmers Market I 439 N. LaGrange Rd. LaGrange 60525
135 LaGrange Park Farmers Market II 53 S. LaGrange Rd.
La Grange
Park 60526
136 Lake Bluff Farmers Market 40 E. Center Ave. Lake Bluff 60044
137 Lake Forest Market on the Square Market Square Lake Forest 60045
138 LaSalle Farmers Market 2nd St. & Gooding St. La Salle 61301
139 Lawndale (Chicago) Farmers Market 3555 W. Ogden Ave. Chicago 60623
140 Lawrence County Farmers Market 712 12th St. Lawrenceville 62439
141 Lena Farmers Market Lena 61032
142
Libertyville's Main St. Farmers
Market W Church Street Libertyville 60048
143 Lincoln Farmers Market Pekin St. at N. Kickapoo St. Lincoln 62656
144 Lincoln Mall Farmers Market Rt. 30 Matteson 60443
145
Lincoln Park (Chicago) Farmers
Market
2000 N-700 W lincoln Park
High School Parking lot Chicago 60602
146
Lincoln Square Chicago Farmers
Market
City parking lot adjacent to
Brown Line station Chicago 60602
147 Lincolnwood Farmers Market 4707 W Pratt Ave. Lincolnwood 60712
148 Lisle French Market Downtown Lisle-Burlington Lisle 60532
149 Lockport Farmers Market Rt. 7 by Historic Canal Lockport 60441
150 Logan Square Farmers Market 3107 W Logan Blvd Chicago 60647
151 Lombard Farmers Market Park Ave. N. of St. Charles Rd. Lombard 60148
152 Macomb Farmers Market Court House Square Macomb 61455
153 Main Street Farmers Market 700 block of 15th Avenue East Moline 61244
154
Main Street Farmers Market
Downtown Aledo S. College Ave. Aledo 61231
155 Main Street Paris Farmers Market Southside of Square Paris 60420
156
Main Street Libertyville Farmers
Market 133 E Cook Ave. Libertyville 60048
157 Manhattan Farmers Market Wabash St. Manhattan 60442
158 Manteno Market S.E. Corner of Division & Main Manteno 60950
159 Marengo Friday Farmers Market W Washington St. at S Ann St. Marengo 60152
160 Marion Farmers Market
507 W. Main, Senior Citizens
Parking Lot Marion 62959
161 Marseilles Farmers Market Knudson Park on Lincoln St Marseilles 61341
162 Mattoon Farmers Market 500 Broadway Ave. Mattoon 61938
163 McHenry Farmers Market 3400 Pearl St. McHenry 60050
164 Mendota Farmers Market 700 Main St. Mendota 61342
165 Metamora Farmers Market On the Square in Metamora Metamora 61548
166 Midtown Farmers Market 1132 2nd Ave. Rockford 61104
167 Milan Farmers Market 900 W. 4th St. Milan 61264
168 Mokena French Market Wolf Rd. at Front St. Mokena 60448
169 Moline Farmers Market 135 River Drive Moline 61265
170 Monee Farmers Market 25510 S Governors Hwy Monee 60449

58
171 Monmouth Farmers Market 122 W. Boston Ave. Monmouth 61462
172
Monroe County Farmers Market-
Columbia IL 229 N. Main St. Columbia 62236
173
Monroe County Farmers Market-
Waterloo IL 100 W. Mill St. Waterloo 62298
174
Monticello Main Street Farmers
Market State and Livinston Streets Monticello 61856
175
Morgan Park (Chicago) Farmers
Market
Shiloah M.B. Church lot, 92nd
& Ashland Chicago 60602
176 Morton Farmers Market 210 S Main street Morton 61550
177 Mount Morris Farmers Market 117 Main St Mt. Morris 61054
178 Mt. Carmel Farmers Market 219 N Market St. Mt. Carmel 62863
179 Mt. Carroll Farmers Market 116 E Market Street Mt. Carroll 61053
180 Mt. Morris Farmers Market Mt. Morris Public Library Mt. Morris 60154
181 Mt. Morris Farmers Market 105 S. Mckendrie Ave. Oregan 61061
182 Mt. Prospect Farmers Market Metro Station parking lot
Mount
Prospect 60056
183 Mt. Sterling Farmers Market 200 Pittsfield Rd. Mt. Sterling 62353
184 Murphysboro Farmers Market
City Administration Building at
12th St. Murphysboro 62966
185
Museum of Contemporary Art
Streeterville Chicago Market 220 E Chicago Ave Chicago 60611
186 Naperville Farmers Market 200 E. 5th St. Naperville 60563
187
Nashville Chamber of Commerce
Market South side of Courthouse Nashville 62263
188
Near North (Chicago) Farmers
Market
Old Division & Dearborn
Streets (1200 N-50 W) Chicago 60602
189 Nettelhorst French Market 3252 N Broadway St. Chicago 60657
190 New Lenox Farmers Market 1 Veterans Parkway New Lenox 60451
191 Nokomis Farmers Market 301 E State St. Nokomis 62075
192
North Bloomington Street Farmers
Market
1215 North Bloomington(Route
23) Streator 61364
193
North Center (Chicago) Farmers
Market
Belle Plain/Damien/Lincoln
(4100N - 2000N) Chicago 60602
194
North End Commons Farmers
Market
City lot at Latham and King
Streets Rockford 61103
195 North Riverside Farmers Market 2401 DesPlaines Ave. Riverside 60546
196 Northfield Farmers' market 4 Happ Rd Northfield 60093
197 Oak Lawn Farmers Market
North Parking Lot of Villiage
Hall Oak Lawn 60453
198 Oak Park Farmers' Market 460 Lake Street Oak Park 60302
199 Old Dundee Farmers Market 319 N. River Street East Dundee 60118
200
Olde Schaumburg Centre Farmers
Market
190 S. Roselle Road, Town
Square Schaumburg 60193
201 Olympia Fields Farmers Market 20301 Western Ave.
Olympia
Fields 60461
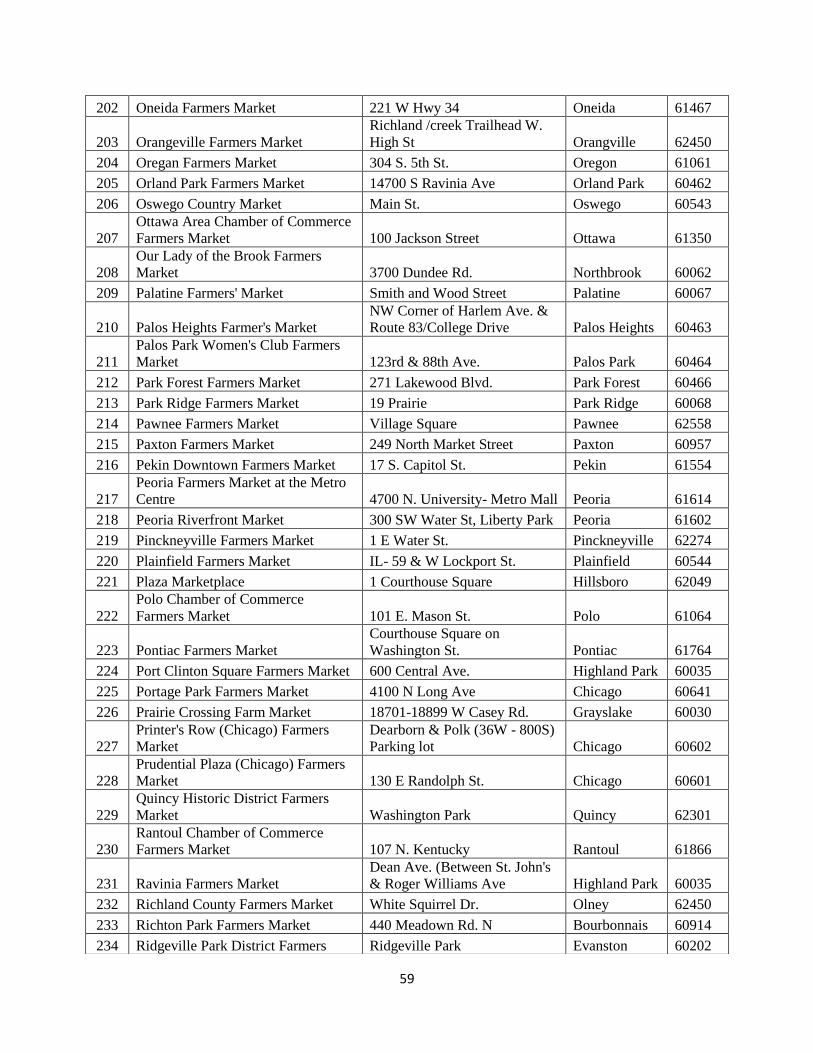
59
202 Oneida Farmers Market 221 W Hwy 34 Oneida 61467
203 Orangeville Farmers Market
Richland /creek Trailhead W.
High St Orangville 62450
204 Oregan Farmers Market 304 S. 5th St. Oregon 61061
205 Orland Park Farmers Market 14700 S Ravinia Ave Orland Park 60462
206 Oswego Country Market Main St. Oswego 60543
207
Ottawa Area Chamber of Commerce
Farmers Market 100 Jackson Street Ottawa 61350
208
Our Lady of the Brook Farmers
Market 3700 Dundee Rd. Northbrook 60062
209 Palatine Farmers' Market Smith and Wood Street Palatine 60067
210 Palos Heights Farmer's Market
NW Corner of Harlem Ave. &
Route 83/College Drive Palos Heights 60463
211
Palos Park Women's Club Farmers
Market 123rd & 88th Ave. Palos Park 60464
212 Park Forest Farmers Market 271 Lakewood Blvd. Park Forest 60466
213 Park Ridge Farmers Market 19 Prairie Park Ridge 60068
214 Pawnee Farmers Market Village Square Pawnee 62558
215 Paxton Farmers Market 249 North Market Street Paxton 60957
216 Pekin Downtown Farmers Market 17 S. Capitol St. Pekin 61554
217
Peoria Farmers Market at the Metro
Centre 4700 N. University- Metro Mall Peoria 61614
218 Peoria Riverfront Market 300 SW Water St, Liberty Park Peoria 61602
219 Pinckneyville Farmers Market 1 E Water St. Pinckneyville 62274
220 Plainfield Farmers Market IL- 59 & W Lockport St. Plainfield 60544
221 Plaza Marketplace 1 Courthouse Square Hillsboro 62049
222
Polo Chamber of Commerce
Farmers Market 101 E. Mason St. Polo 61064
223 Pontiac Farmers Market
Courthouse Square on
Washington St. Pontiac 61764
224 Port Clinton Square Farmers Market 600 Central Ave. Highland Park 60035
225 Portage Park Farmers Market 4100 N Long Ave Chicago 60641
226 Prairie Crossing Farm Market 18701-18899 W Casey Rd. Grayslake 60030
227
Printer's Row (Chicago) Farmers
Market
Dearborn & Polk (36W - 800S)
Parking lot Chicago 60602
228
Prudential Plaza (Chicago) Farmers
Market 130 E Randolph St. Chicago 60601
229
Quincy Historic District Farmers
Market Washington Park Quincy 62301
230
Rantoul Chamber of Commerce
Farmers Market 107 N. Kentucky Rantoul 61866
231 Ravinia Farmers Market
Dean Ave. (Between St. John's
& Roger Williams Ave Highland Park 60035
232 Richland County Farmers Market White Squirrel Dr. Olney 62450
233 Richton Park Farmers Market 440 Meadown Rd. N Bourbonnais 60914
234 Ridgeville Park District Farmers Ridgeville Park Evanston 60202

60
Market
235
Riverview Farmstead Farmer's
Market 111th and Book Road Naperville 60564
236 Robinson Farmers Market Courthouse Square Robison 62454
237 Rochelle Farmers Market Main St. Oregon 61061
238 Rock Falls Farmer marke
400 W 2nd Street between 4th
& 5 Ave Rock falls 61071
239 Rockford City Market North Water Street Rockford 61104
240
Roscoe Main StreetSquare Farmers
Market Hwy 251 and Williams Dr. Roscoe 61937
241 Roselle Farmers Market Main St & Prospect St Roselle 60172
242
Rushville Main Street Farmers
Market 210 N. Congress St. Rushville 62681
243 Saturday Produce Market One College Park Decatur 62521
244 Sears Tower Plaza Farmers Market 233 S Wacker Dr. Chicago 60606
245 Seguin Gardens Market 3100 S Central Ave Cicero 60804
246 Sesser The Tuesday Sale IL-148 Sesser 62884
247
Shore Bank (Chicago) Farmers
Market
Shore Bank Parking lot, 70th &
Jeffery Chicago 60602
248 Skokie Farmers Market 5127 Oakton Street Skokie 60077
249
South Chicago Farmers Market at
Chief Nomo Oasis 2650 E 83rd St Chicago 60617
250
South Shore (Chicago) Farmers
Market 7054 S Jeffery Blvd Chicago 60649
251 Southport Green Market
Southport and Grace at Blaine
School parking lot Chicago 60613
252
Springfield Old Capital Farmers
Market
Adams Street, Between 3rd &
5th Sts. Springfield 62701
253
St. Alphonsus Liguori Farmers
Market 411 n Wheeling Rd
Prospect
Heights 60070
254 St. Charles Farmers Market 307 Cedar Avenue St. Charles 60174
255 Stark County Farmers Market Downtown Wyoming Toulon 61491
256 Steeleville Farmers Market 107 West Broadway Steeleville 62288
257 Stockton Farmers Market II
Downtown Stockton nextto
Caseys on Highway 78 Stockton 61085
258 Stokton Farmers Market I
Off Highway 20 at Stockton
Hight School Stockton 61085
259
Sugar Grove Chamber of Commerce
Farmers Market 10 Municipal Drive Sugar Grove 60554
260 Taylorville Farmer's Market
Downtown Taylorville, East
side of Square Taylorville 62568
261
The Land of Goshen Community
Market
Downtown Edwardsville, on St.
Louis Street Edwardsville 62025
262 The Sunday Market 2301 W. Maypole Chicago 60612
263 Thornton Farmers Market W Margaret St & Hubbard St Thornton 60476
264 Tinley Park Farmers Market
Metra Station 173rd & Oak
Park Ave. Tinley Park 60477

61
265
Trinity 7th St. Moline Farmers
Market 500 John Deere Rd. Moline 61265
266 Twin City Farmers Market Downtown Sterling Sterling 61081
267 Uptown Chicago Farmers Market
1145 W. Wilson (4600n-
1145w) Truman College Chicago 60640
268
Uptown Normal Trailside Farmers
Market 100 W North St Normal 61761
269 Urbana's Market at the Square 400 South Vine Street Urbana 61801
270 Vandalia Country Market 421 W Gallatin St. Vandalia 62471
271 Villa Park French Market E Park Blvd at S Ardmore Ave. Villa Park 60181
272
Village of Lake Bluff Farmers
Market
On East Center Ave. - corner of
Center & Sheridan Lake Bluff 60044
273
Village of Orland Park Farmers
Market Village Center Complex Orland Park 60462
274 Village of Skokie Farmer's Market 5127 Oakton Skokie 60077
275 Warren Farmers Market 110 W Main St. Warren 61087
276 Warrensville Farmers Market 3S260 Warren Ave Warrenville 60555
277 Watseka Farmers Market
First Trust & Savings Bank
parking lot Watseka 60970
278 Wauconda Farmers Market
West side of Main St. in front
of the Village Hall Wauconda 60084
279 Waukegan Farmers Market S Lewis Ave at Belvidere Rd Waukegan 60085
280 Wayne County Farmers Market
Courthouse Square & Walmart
Parking Lot Fairfield 62837
281 West End Market
Church Street and Dodge
Avenue Evanston 60201
282 West Frankfort Farmers Market 1002 E Cleveland St
West
Frankfort 62896
283 Western Springs French Market
Hillgrove Ave between Lawn &
Grand Ave
Western
Springs 60558
284 Wheaton Farmers Market
Westside of Bldg on Boardwal
adj to Cross St Wheaton 60187
285 Wheaton French Market 200 S Main St. Wheaton 60187
286
Wicker Park/Bucktown (Chicago)
Farmers Market Wicker Park & Damen Streets Chicago 60602
287 Winfield Farmers Market
Prairie Trail Center Shopping
Center parking lot Winfield 60190
288 Woodstock Farmers Market Woodstock Town Square Woodstock 60098

62
APPENDIX C
FARMERS’ MARKETS IN ILLINOIS THAT ACCEPT SNAP
BENEFITS. The case study examined within this study is shown bold and italicized (1) in the
list.
# MARKET NAME MARKET ADDRESS
MARKET
CITY
ZIP
CODE
1 61st Street Farmers Market 6100 S. Blackstone Ave. Chicago 60637
2
Beverly (Chicago) Farmers
Market 9500 S. Longwood Dr. Chicago 60602
3
Daley Plaza Chicago Farmers
Market 50 W. Washington St. Chicago 60602
4
Division Street Chicago Farmers
Market 1200 N Dearborn Chicago 60610
5
Downtown Bloomington Farmers
Market N. Main St. at E. Jefferson St. Bloomington 61701
6
Eden Place Community Farmers
Market 4417 S. Stewart Ave. Chicago 60609
7 Englewood Farmers Market 6452 S Ashland Ave. Chicago 60637
8 Evanston's Farmers Market University at Oak Ave. Evanston 60201
9
Farmers Market on Historic
North 1st Street North 1st Street Champaign 61820
10 Galesburg Farmers Market
Seminary St. b/t Simmons St. and
Kellogg St Galesburg 61401
11 Illinois Products Farmers Market Grandstand Ave. Springfield 62702
12 Oak Park Farmers' Market 460 Lake Street Oak Park 60302
13 Peoria Riverfront Market 300 SW Water St, Liberty Park Peoria 61602
14
South Shore (Chicago) Farmers
Market 7054 S Jeffery Blvd Chicago 60649
15 Urbana's Market at the Square 400 South Vine Street Urbana 61801
16 West End Market Church Street and Dodge Avenue Evanston 60201
17 Woodstock Farmers Market Woodstock Town Square Woodstock 60098
18 Chicago's Green City Market
Between 1750 N. Clark & Stockton
Drive Chicago 60614
19
Lincoln Square Chicago Farmers
Market 4700 North Lincoln Avenue Chicago 60602
20 Logan Square Farmers Market 3107 W Logan Blvd Chicago 60647
21 Midtown Farmers Market 1132 2nd Ave. Rockford 61104
22
Lawndale (Chicago) Farmers
Market 3555 W. Ogden Ave. Chicago 60623
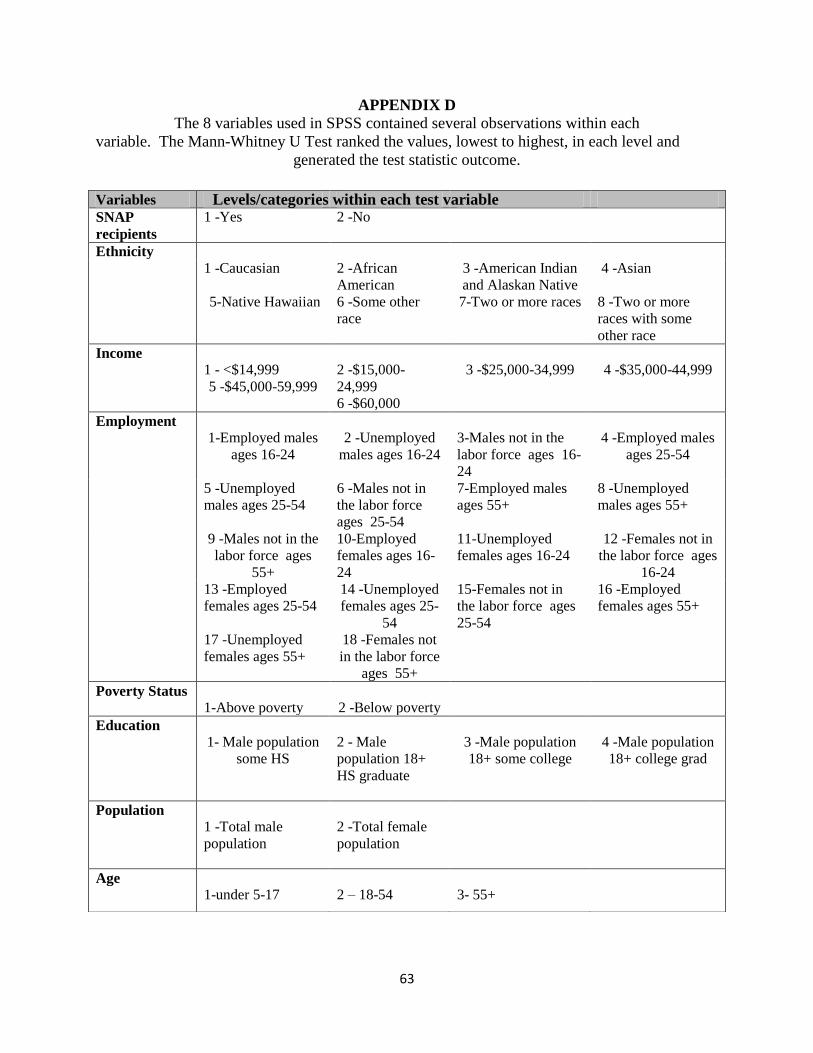
63
APPENDIX D
The 8 variables used in SPSS contained several observations within each
variable. The Mann-Whitney U Test ranked the values, lowest to highest, in each level and
generated the test statistic outcome.
Variables
SNAP
recipients
1 -Yes 2 -No
Ethnicity
1 -Caucasian
5-Native Hawaiian
2 -African
American
6 -Some other
race
3 -American Indian
and Alaskan Native
7-Two or more races
4 -Asian
8 -Two or more
races with some
other race
Income
1 - <$14,999
5 -$45,000-59,999
2 -$15,000-
24,999
6 -$60,000
3 -$25,000-34,999
4 -$35,000-44,999
Employment
1-Employed males
ages 16-24
2 -Unemployed
males ages 16-24
3-Males not in the
labor force ages 16-
24
4 -Employed males
ages 25-54
5 -Unemployed
males ages 25-54
6 -Males not in
the labor force
ages 25-54
7-Employed males
ages 55+
8 -Unemployed
males ages 55+
9 -Males not in the
labor force ages
55+
10-Employed
females ages 16-
24
11-Unemployed
females ages 16-24
12 -Females not in
the labor force ages
16-24
13 -Employed
females ages 25-54
14 -Unemployed
females ages 25-
54
15-Females not in
the labor force ages
25-54
16 -Employed
females ages 55+
17 -Unemployed
females ages 55+
18 -Females not
in the labor force
ages 55+
Poverty Status
1-Above poverty 2 -Below poverty
Education
1- Male population
some HS
2 - Male
population 18+
HS graduate
3 -Male population
18+ some college
4 -Male population
18+ college grad
Population
1 -Total male
population
2 -Total female
population
Age
1-under 5-17 2 – 18-54 3- 55+
Levels/categories within each test variable
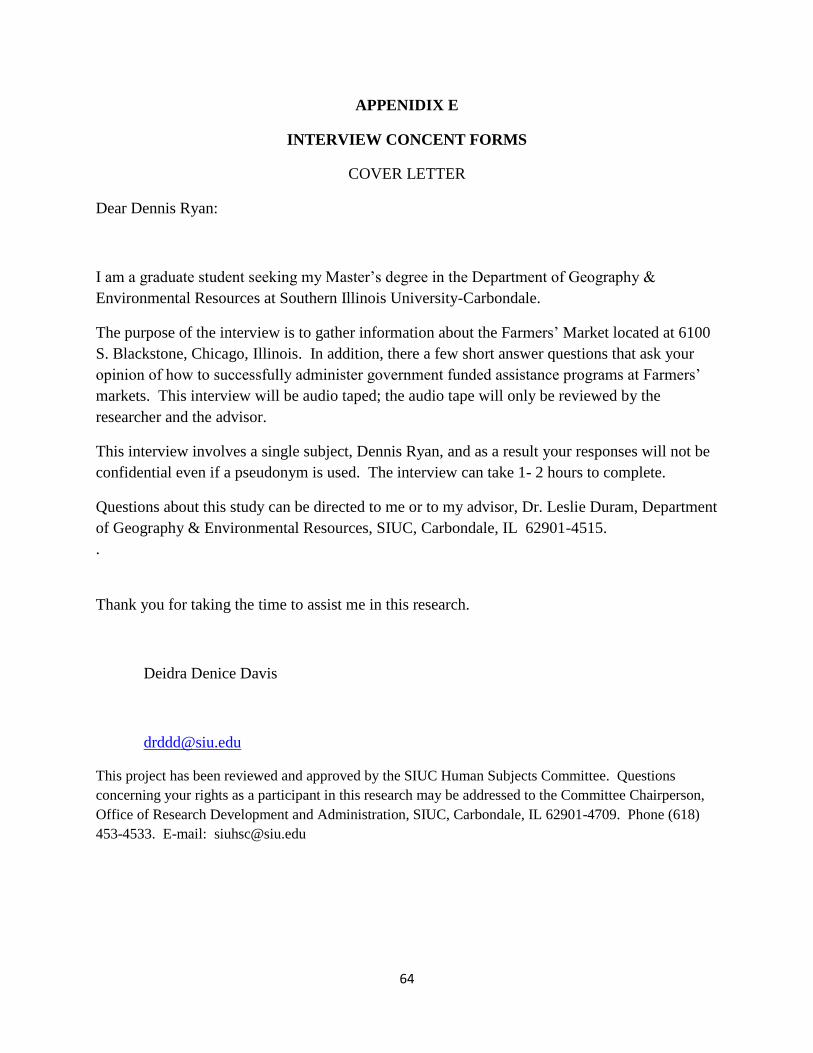
64
APPENIDIX E
INTERVIEW CONCENT FORMS
COVER LETTER
Dear Dennis Ryan:
I am a graduate student seeking my Master’s degree in the Department of Geography &
Environmental Resources at Southern Illinois University-Carbondale.
The purpose of the interview is to gather information about the Farmers’ Market located at 6100
S. Blackstone, Chicago, Illinois. In addition, there a few short answer questions that ask your
opinion of how to successfully administer government funded assistance programs at Farmers’
markets. This interview will be audio taped; the audio tape will only be reviewed by the
researcher and the advisor.
This interview involves a single subject, Dennis Ryan, and as a result your responses will not be
confidential even if a pseudonym is used. The interview can take 1- 2 hours to complete.
Questions about this study can be directed to me or to my advisor, Dr. Leslie Duram, Department
of Geography & Environmental Resources, SIUC, Carbondale, IL 62901-4515.
.
Thank you for taking the time to assist me in this research.
Deidra Denice Davis
This project has been reviewed and approved by the SIUC Human Subjects Committee. Questions
concerning your rights as a participant in this research may be addressed to the Committee Chairperson,
Office of Research Development and Administration, SIUC, Carbondale, IL 62901-4709. Phone (618)
453-4533. E-mail: [email protected]

65
CONSENT FOR AUDIO TAPING
(Signatures of participants required)
Consent to Participate in Research
I ,____________________________, agree to participate in this research project conducted by
Deidra D Davis, graduate student of Southern Illinois University Carbondale; Department of
Geography & Environmental Resources.
I understand the purpose of this study is to investigate a Farmer’s Market, 6100 S. Blackstone
Avenue, which currently participates in the Illinois SNAP program and analyze their accepting
methods and how this has added to the success of the Farmers’ Market and the community.
I understand my participation is strictly voluntary and I may refuse to answer any question
without penalty. I am also informed that my participation will not exceed 2 hours.
I understand that my responses to the questions will be audio taped, reviewed only by the
researcher and advisor, and that these tapes will be transcribed/stored and kept for 5 days in a
locked file cabinet. Afterward, these tapes will be destroyed/ deleted.
I understand questions or concerns about this study are to be directed to Deidra D Davis,
[email protected] or her advisor Dr. Leslie Duram, Geography & Environmental Resources,
I have read the information above and any questions I asked have been answered to my
satisfaction. I agree to participate in this activity and know my responses will be tape recorded. I
understand a copy of this form will be made available to me for the relevant information and
phone numbers.
“I agree _____ I disagree _____to have my responses recorded on audio/video tape.”
“I agree_____ I disagree _____ that (researcher name) may quote me in his/her paper”
Participant signature and date
This project has been reviewed and approved by the SIUC Human Subjects Committee.
Questions concerning your rights as a participant in this research may be addressed to the
Committee Chairperson, Office of Research Development and Administration, SIUC,
Carbondale, IL 62901-4709. Phone (618 453 4533. Email:[email protected].
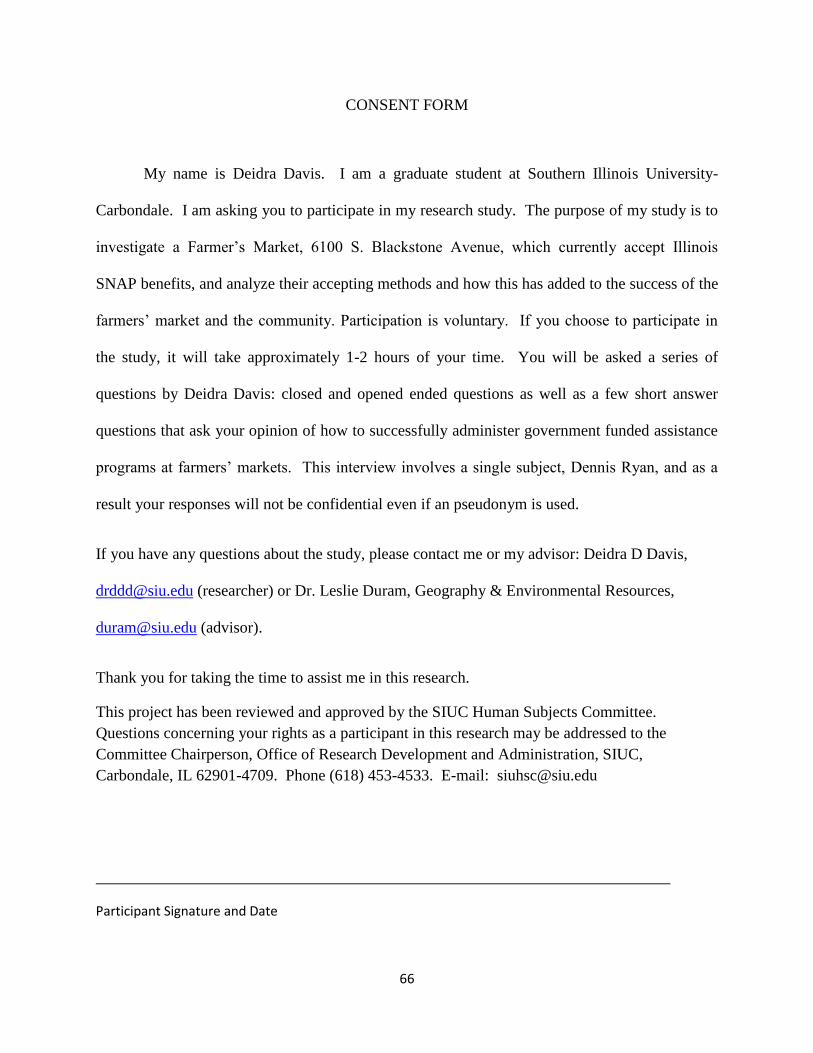
66
CONSENT FORM
My name is Deidra Davis. I am a graduate student at Southern Illinois University-
Carbondale. I am asking you to participate in my research study. The purpose of my study is to
investigate a Farmer’s Market, 6100 S. Blackstone Avenue, which currently accept Illinois
SNAP benefits, and analyze their accepting methods and how this has added to the success of the
farmers’ market and the community. Participation is voluntary. If you choose to participate in
the study, it will take approximately 1-2 hours of your time. You will be asked a series of
questions by Deidra Davis: closed and opened ended questions as well as a few short answer
questions that ask your opinion of how to successfully administer government funded assistance
programs at farmers’ markets. This interview involves a single subject, Dennis Ryan, and as a
result your responses will not be confidential even if an pseudonym is used.
If you have any questions about the study, please contact me or my advisor: Deidra D Davis,
[email protected] (researcher) or Dr. Leslie Duram, Geography & Environmental Resources,
[email protected] (advisor).
Thank you for taking the time to assist me in this research.
This project has been reviewed and approved by the SIUC Human Subjects Committee.
Questions concerning your rights as a participant in this research may be addressed to the
Committee Chairperson, Office of Research Development and Administration, SIUC,
Carbondale, IL 62901-4709. Phone (618) 453-4533. E-mail: [email protected]
Participant Signature and Date