Embed Size (px)
Citation preview
Policy Research Working Paper 7604
Access to Finance and Job Growth
Firm-Level Evidence across Developing Countries
Meghana AyyagariPedro Juarros
Maria Soledad Martinez PeriaSandeep Singh
Development Research GroupFinance and Private Sector Development TeamMarch 2016
WPS7604P
ublic
Dis
clos
ure
Aut
horiz
edP
ublic
Dis
clos
ure
Aut
horiz
edP
ublic
Dis
clos
ure
Aut
horiz
edP
ublic
Dis
clos
ure
Aut
horiz
ed
Produced by the Research Support Team
Abstract
The Policy Research Working Paper Series disseminates the findings of work in progress to encourage the exchange of ideas about development issues. An objective of the series is to get the findings out quickly, even if the presentations are less than fully polished. The papers carry the names of the authors and should be cited accordingly. The findings, interpretations, and conclusions expressed in this paper are entirely those of the authors. They do not necessarily represent the views of the International Bank for Reconstruction and Development/World Bank and its affiliated organizations, or those of the Executive Directors of the World Bank or the governments they represent.
Policy Research Working Paper 7604
This paper is a product of the Finance and Private Sector Development Team, Development Research Group. It is part of a larger effort by the World Bank to provide open access to its research and make a contribution to development policy discussions around the world. Policy Research Working Papers are also posted on the Web at http://econ.worldbank.org. The authors may be contacted at [email protected], [email protected] or [email protected], [email protected], and [email protected].
This paper investigates the effect of access to finance on job growth in 50,000 firms across 70 developing countries. Using the introduction of credit bureaus as an exogenous shock to the supply of credit, the paper finds that increased access to finance results in higher employment growth, espe-cially among micro, small, and medium enterprises. The
results are robust to using firm fixed effects, industry mea-sures of external finance dependence, and propensity score matching in a complementary panel data set of more than four million firms in 29 developing countries. The findings have implications for policy interventions targeted to pro-duce job growth in micro, small, and medium enterprises.
Access to Finance and Job Growth:
Firm-Level Evidence across Developing Countries
Meghana Ayyagari, Pedro Juarros, Maria Soledad Martinez Peria, and Sandeep Singh
JEL: G21, D22, J21
Keywords: access to finance, job growth
Meghana Aayyagari ([email protected]) is an Associate Professor at the School of Business and Elliott School of International Affairs at George Washington University; Pedro Juarros ([email protected]) and Sandeep Singh ([email protected]) are consultants at the World Bank; Maria Soledad Martinez Peria ([email protected]) is Division Chief of the Macro-Financial Division of the IMF Research Department. The paper was written while Maria Soledad was Research Manager at The World Bank. This project was funded by DFID and the SME Finance Forum. The views expressed in this paper are those of the authors and do not represent the views of the IMF, its Executive Board, or its management.

2
I. Introduction
The recent global financial crisis has highlighted the impact of credit markets on the real
economy, in particular on employment. While an extensive literature exists on how finance can
affect corporate investment and overall economic growth,1 comparatively little is known on the
effect of finance on labor market outcomes. Arguably, the relationship between finance and job
growth is more subtle, since it is not clear that increasing access to finance should readily lead to
the hiring of more workers. Firms may grow by increasing investment, and thus output from
greater access to finance without ever increasing labor, a case of “jobless growth”. Or
conversely, financial constraints should not affect labor directly, since unlike capital, labor does
not require financing. On the other hand, the theoretical literature on capital-labor market
linkages2 suggests that labor has a fixed cost component that requires financing to bridge upfront
costs associated with training and hiring and so we should expect to see credit markets affect
firm employment decisions. Garmaise (2008) argues that a firm’s use of labor as an input in
production is affected by its financial resources and thus financially constrained small firms use
relatively more labor than physical capital, because informed workers provide more efficient
financing than uninformed capital suppliers.
Ultimately, the impact of access to finance on employment growth is an empirical
question, and an important one given the concerns on jobless recovery and rising unemployment
following the 2007-09 Great Recession.3 The recent empirical evidence on the link between
access to credit and employment is largely focused on the U.S. experience and we have little
evidence of the impact of credit markets on employment in developing countries where financial
1 See Levine (2005) for an overview of the literature on finance and growth and Beck (2009) for a detailed discussion of the different techniques used to analyze how finance affects aggregate, industry, or firm level growth. 2 See Oi (1962, 1983), Hamermesh (1989), and Benmelech, Bergman, and Seru (2011). 3 For example, see International Labor Organization’s (ILO) Global Employment Trends reports (2009-2014)

3
institutions are less developed. This is also an especially relevant question for micro, small and
medium enterprises (MSMEs), since small firms have been shown to be the most vital job
creators in developing countries,4 as well as the most likely to be credit constrained.5
In this paper, we use comprehensive firm-level data across a large set of developing
countries to analyze the impact of access to finance on job growth and the heterogeneity in this
relationship across firm size. In particular, we study the differential impact of access to finance
on MSMEs’ ability to create jobs relative to that of larger firms.
Establishing a causal effect from access to finance to employment growth is complicated,
since the variables measuring a firm’s access to finance may also reflect its demand for labor.
Moreover, there are potentially many factors that could drive both firm employment growth and
access to finance. We alleviate these identification concerns using a number of empirical
strategies. First, we consider an exogenous shock to the supply of credit in the form of the
introduction of a credit bureau.6 We use a difference-in-difference approach in estimating the
impact of the introduction of credit bureaus on employment growth, by comparing countries
which underwent reforms and countries without reform, and years pre- and post-reform. Second,
we use propensity score matching (PSM) to more closely match the treatment and control group
of countries and re-estimate the difference-in-difference specification. Finally, following Rajan
and Zingales (1998), we identify credit supply effects using industry measures of external
finance dependence interacted with the credit bureau reform variable. If increased access to
4 Ayyagari, Demirguc-Kunt, and Maksimovic (2011) show SMEs to be important job creators. Haltiwanger, Jarmin and Miranda (2013) also find a strong role for SMEs in job creation in the US. 5 See Love and Mylenko (2003), Beck et al. (2005), Galindo and Micco (2005), and IADB (2007). 6 A credit bureau is defined in the World Bank Doing Business database as a private firm or nonprofit organization that maintains a database on the creditworthiness of borrowers (individuals or firms) in the financial system and facilitates the exchange of credit information among creditors. Credit investigative bureaus that do not directly facilitate information exchange among banks and other financial institutions are not considered.

4
finance from the introduction of credit bureaus affects job growth, then we should expect to see
larger effects for firms in industries that are more dependent on external finance.
We use two complementary sources of firm level data: cross-country World Bank
Enterprise Surveys that include information on 52,231 firms operating in 70 developing
countries; and Bureau Van Dijk’s Orbis database on over 1 million firms operating across 29
developing countries. Both databases include large and small, and listed and unlisted firms.
While the Enterprise Surveys provide data across a larger number of countries, the panel
dimension in the Orbis database allows us to control for unobserved heterogeneity at the firm
level, using firm fixed effects.
We find a strong positive relationship between access to finance and job growth. Overall,
firms with access to a loan exhibit employment growth between 1 and 3 percentage points larger
than firms with no access to finance across the two databases. These results are robust to
controlling for firm fixed effects. When identifying the relationship using the introduction of
credit bureaus (CB) as an exogenous shock to the supply of credit, we find that the introduction
of CBs increases employment growth by over 5 percentage points compared to countries where
CBs do not exist, a result that holds when estimated with the matched sample. This effect is
particularly large for firms in industries that are more dependent on external finance.
We also find the association between finance and job growth to be stronger among
MSMEs than among large firms. MSME firms with access to a loan have between a 1 and 4
percentage point larger employment growth than MSMEs without a loan across the two
databases. This difference in job growth among MSMEs with and without access to finance is at
least three times larger than the differential among large firms with and without a loan.7 In our
7 We find similar results in robustness tests using alternative measures of access to finance such as growth of financing and debt ratio. A one standard deviation increase in the growth of financing among MSME’s is associated
5
largest database, the introduction of CBs elicits a job growth response among MSMEs that is
over six times larger than that among large firms. Finally, MSMEs in industries with high
dependence on external finance respond to the introduction of CBs with job growth rates that are
almost two times larger than those of large firms in similar industries.
Our paper contributes to the growing literature on finance and labor. Several papers have
used the 2007-09 Great Recession in the US as a shock to external finance to identify the causal
link between finance and employment. Duygan-Bump, Levkov, and Montoriol-Gariga (2015)
find that workers in small firms in the US were more likely to become unemployed during the
2007-09 financial crisis if they worked in industries with high external financing needs.
Benmelech, Bergman, and Seru (2011) show that local unemployment rates in the U.S. are
affected by the provision of bank credit. Chodorow-Reich (2014) finds that borrowers of banks
affected by disruptions in the syndicated loan market following the collapse of Lehman Brothers
in 2008 faced restrictions in credit supply, which translated into greater cuts in employment at
these firms. Greenstone, Mas, and Nguyen (2012) also show that the 2007-09 lending shocks
accounted for significant but modest declines in overall county-level employment.
However, it is not clear how these finance and labor market linkages in the US8 translate
to firms in poorer economies with completely different financial infrastructures and institutional
with employment growth rates that are over 0.89 percentage points higher. Similarly, an upward movement by 1 standard deviation in the debt ratio of MSME firms is associated with an almost 0.4 percentage point higher employment growth. These are large movements in response to changes in financing when compared to the median annual employment growth rate of just under 1.5 percent. 8 A few studies have used data from other developed countries. Bentolila, Jansen, Jimenez, and Ruano (2013) use matched bank-firm data from the Spanish Credit Register and show that during the Great Recession, firms with credit relationships with weak banks had substantially lower employment levels than firms borrowing from non-affected banks. Popov and Rocholl (2015) use German banks’ heterogeneous exposure to the US subprime mortgage market to show that firms with credit relationships with affected banks experienced significantly larger declines in employment and labor compensation relative to firms whose credit relationships were with healthy banks. Boeri, Garibaldi, and Moen (2012) use data from 11 OECD countries and find that highly leveraged sectors are characterized by higher job destruction rates than low-leveraged sectors during banking crises.

6
environments. Thus, the external validity of these results in the context of developing economies
where access to finance is rapidly evolving is limited. There are few papers that have relied on
cross-country data, either at the firm level (Aterido, Hallward-Driemeier, and Pages (2011); Cull
and Xu (2011)) or at the industry level (Pagano and Pica (2012)). But, with the exception of
Aterido et al. (2011), these papers have looked at the impact of the aggregate level of financial
development as opposed to analyzing the impact of individual firms’ access to finance on
employment as we do in our paper. This distinction is important because access to finance is not
the same as financial development. Financial systems can be considered developed because the
volume of credit to GDP is high but access to finance might still be low if credit is allocated only
among few firms.
Our paper also contributes to the understanding of the differential impact of firm size in
the finance and employment growth relationship. Our finding of a consistently stronger impact of
financing on employment growth for SMEs and MSMEs sheds new light on the heterogeneous
impact by firm size. These results have important policy implications for tailoring interventions
intended to produce job growth in MSMEs through increased availability of financing. Our paper
also advances the literature finding a positive link between reforms in the information sharing
systems and increased access to finance (Galindo and Miller (2001), Love and Mylenko (2003),
Brown, Jappelli, and Pagano (2009), Martinez Peria and Singh (2014)). In contrast to these
papers, we show a direct link between the introduction of these credit information sharing
systems and job growth. In that sense, our paper is aligned with work by Campello and Larrain
(2014) who show that increasing access to credit through expansion in the scope of collateral law
to include movable assets results in employment growth for firms in the country. The
relationship between reforms that increase access to credit and job growth has important

7
implications, since it highlights a policy lever through which policy makers can focus on
increasing employment in developing countries.
The rest of the paper is organized as follows. Section II describes the data we use. Section
III explains the empirical methodology. Section IV presents the empirical results. Section V
concludes.
II. Data and summary statistics
A. Firm-level data
We use two firm-level data sets to analyze the link between access to finance and
employment. First, we use World Bank Enterprise Survey (ES) data to analyze how firms’ access
to finance affects firm level employment growth. The ES uses a common questionnaire and a
uniform sampling methodology to produce survey data on manufacturing and service sector
firms that is comparable across countries.9 Stratification of the sample is on three criteria –
sector, firm size (employees), and geographic location. The stratified random sampling
methodology is used to generate a sample large enough to be representative of the non-
agricultural formal private economy,10 as well as key sectors and firm size classifications. The
ES data set provides firm-level information on employment levels, employment growth rate,
access to a loan by banks, as well as other firm characteristics. We restrict our analysis to
countries with two or more surveys over the course of the period 2002-2014, so that we can
control for country fixed effects. We further exclude firms with fewer than five permanent
9 Most firms in the Enterprise Surveys are single establishment firms (79%). All our results hold if we restrict our analysis to single establishment firms. 10 The Enterprise Surveys do not include firms with 100% state ownership. We control for government ownership in all our regressions.
8
employees to align the data set with the survey’s stated intent of sampling firms with five or
more employees. The final data set contains information on 52,231 firms operating in 70
countries.
Second, we use data from Orbis, a commercial database distributed by Bureau van Dijk
over the period 2004-2011. We focus on those firms that report data on employment. We restrict
our analysis to developing countries that had a minimum of 25 firms and furthermore to firms
that have a median of five or more employees over the period 2004-2011, to be consistent with
the ES sample.11 Overall, the data we use from Orbis includes information for over one million
unique firms operating across 29 developing countries. One advantage of using Orbis is that it
includes large, small, listed and unlisted firms. Since most firms are followed through time, the
data set also introduces a panel dimension to our analysis.
The use of these two data sets in our estimations aids with the analysis because of their
complementary nature. With the ES we get a more comprehensive coverage of developing
countries, and the random survey sample is nationally representative. However, the total number
of firms included in the analysis is just over 50,000. In contrast, the Orbis data set does not cover
as many countries, but provides widespread coverage of both listed and unlisted firms in
countries where data are collected. In all, estimations using the Orbis data set include over 4.3
million observations. In addition, as most firms are followed through time in Orbis, we are also
able to construct a panel data set following over one million unique firms through time. The ES
does include a panel component, but one that is too small for a meaningful cross-country
exploration in the context we wish to analyze. As a survey, the ES does offer more insight into
firm characteristics which allow the use of more control variables in our regressions analysis.
11 We impose the minimum number of firms filter before dropping firms with median number employees less than five over our sample period. Thus two countries Nicaragua and Gabon have less than 25 firms.

9
Using the data sets discussed above, we construct a number of variables. The dependent
variable, Employment growth, is calculated as the annual change in the number of permanent
employees divided by the average value over the two periods.12 In Orbis, we calculate growth
rates year over year, while in the ES sample, employment growth rates are annual changes over a
two year period. To nullify undue effects from outliers, we truncate the top and bottom 5
percentile observations from the employment growth distribution in Orbis. As the distribution of
employment growth is much tighter in the ES sample, we only remove the top and bottom 1
percentile of observations.
In the ES, firms were asked whether they have access to a loan or line of credit from a
financial institution. We use the responses to this survey question to construct a dummy variable
Access to a loan which takes the value 1 for firms with access to a loan or line of credit and 0 for
firms without access. We measure financial access in Orbis using the amount of loans and long
term debt. If any of these amounts are positive, we code the Access to a loan dummy as 1, and 0
if both are 0 or if either loans or long term debt is 0 and the other is missing. Thus, the financial
access measure in Orbis captures access to both short-term and long-term financing. As
alternative measures, we calculate the Growth of finance in Orbis as the annual growth rate13 of
the sum of the loans and long term debt, and Debt ratio as the ratio of this sum to the total assets.
We again truncate the top and bottom 5 percentile of the distribution of these two variables so as
to diminish the influence of outliers.
12 Employment growth rates calculated using the base year or the average value over the periods as the denominator can yield substantially different growth rates, especially for micro and small firms. We are using the latter method because, like log growth rates, it naturally bounds the employment growth rates so that the regression analysis is not skewed by big jumps from micro and small firms. For more discussion on implications of the two definitions, see Haltiwanger et. al. (2013). 13 We calculate the growth rate as before as the difference divided the average value over the two years.
10
We proxy for the size of the firm by the natural log of the number of permanent
employees. In the ES, we are also able to construct a number of variables on firm characteristics
that are described in Table 1. We defer to size classifications provided by the International
Finance Corporation and the European Union to identify MSMEs as those firms that have less
than 250 permanent employees. MSMEs are further divided into micro firms as those with less
than 10 employees and the rest as SMEs.
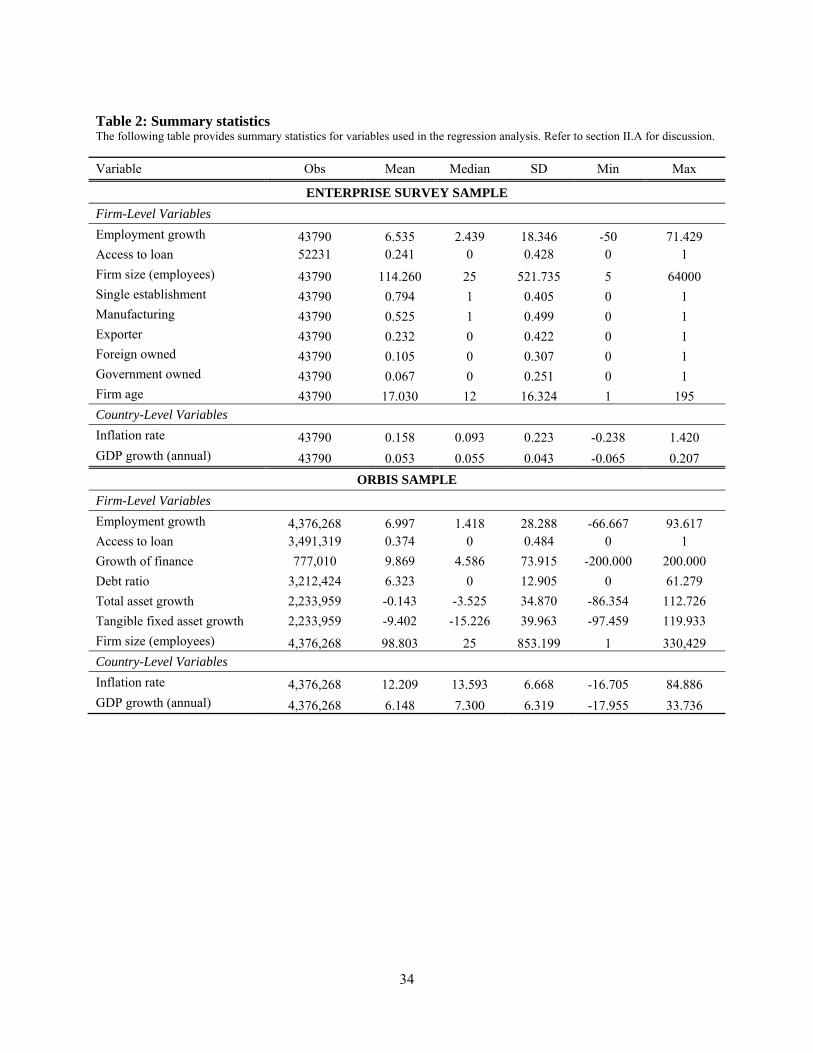
In Table 2, we present summary statistics. In the ES sample, 24% of firms report having
access to a loan. The average number of permanent employees in the sample of firms is 114, and
the average annual growth rate is 6.5%. 53% of firms in the ES sample are in the manufacturing
sector, 6% are government-owned, 10% have foreign ownership, and 23% are exporters.
Furthermore, firms on average have been in business for about 17 years. Of the surveyed firms,
21% report being part of a larger ownership structure. In the Orbis sample of over 4.3 million
observations comprising over 1 million firms in 29 countries, a relatively larger percentage of
firms (37%) report receiving short or long term financing. Firms on average employ just under
100 permanent employees. Firms in the sample grow employment at an average annual rate of
close to 7%.
B. Introduction of credit bureaus
Institutions facilitating the sharing of credit information (such as private credit bureaus
and public credit registries) have been shown to be critical for the development of credit markets
across countries (La Porta et. al. (1998), Jappelli and Pagano (2002), Detragiache, Gupta, and
Tressel (2005), and Djankov, McLiesh, and Shleifer (2007)). Martinez-Peria and Singh (2014) in
particular show that the introduction of private credit bureaus has a stronger effect on firm
11
financing than the introduction of public credit registries. To identify the introduction of credit
bureaus (CBs) across countries, we rely on the World Bank Doing Business database.
Specifically, we identify the countries and the year in which they introduced credit bureaus, as
well as the level of coverage in each year following introduction.
In the ES sample, 20 countries have a survey both before and after the introduction of a
CB. An additional 30 countries that have at least two surveys, but no CBs, are part of the control
group. Fifteen countries in the Orbis data sample introduced CBs during the sample period, while
data from an additional 14 countries that do not have a CB serve as the control group.14
Empirically, we capture CB reform with a dummy variable that takes the value 1 for countries
that introduce CBs in the years after the reform. In the years prior to the introduction of CB for
the reform countries, and for the control group of countries with no CB, the dummy variable is
coded 0. Thus, the CB reform dummy variable can be thought of as the interaction of a dummy
variable that identifies the treatment-control sample with a dummy variable that identifies the
pre-post reform years.15 For countries that introduce a CB, World Bank Doing Business database
also tracks the number of firms and individuals covered by the CB as a proportion of the total
population. We refer to this variable as CB coverage.
C. External finance dependence
We also construct an industry-level measure of the dependence on external finance, EFD
Index following the methodology proposed by Rajan and Zingales (1998). The index is based
on the assumption that the well-developed US financial markets have fewer market
14 Appendix tables A1 and A2 provide the full list of countries in the Orbis and ES datasets, as well as when they are used as treatment or control in the regression using credit bureau reforms. 15 Unlike a standard difference-in-difference specification, the pre and post periods are not defined for the control group in our analysis. The interaction term we refer to as “CB reform”, however, is well defined throughout, and is the variable of interest.
12
imperfections, allowing US firms to achieve their desired financial structure. Thus, assuming that
there are technological reasons why some industries depend more on external finance than
others, the index offers an exogenous way to identify the extent of external dependence of an
industry anywhere in the world.
To construct the index, we use data on US firms in the Compustat data set over the period
2000-2006. We exclude the years coinciding with the financial crisis where the assumption of
unconstrained markets is unlikely to hold. For each firm, we sum the capital expenditure and
cash flow from operations over the 7 year time period and take the ratio of this difference to the
sum of capital expenditures over this period as a measure of a firm’s dependence on external
finance. We then take the industry median for each ISIC 2-digit industry to obtain the industry
dependence on external finance.
Finally, we obtain country level macro data such as the inflation rate and the GDP growth
rate from the World Development Indicators, and data on regulatory quality from the World
Governance Indicators.
III. Empirical methodology
We adopt a two-pronged approach in our empirical strategy. First, we use the ES sample
to present evidence on the access to finance and employment growth relation across a large
number of developing countries, addressing causality issues using country fixed-effects
estimations and a difference-in-difference setup using the introduction of credit bureaus as an
exogenous shock to the supply of credit. Next, we use the Orbis sample that covers fewer
countries but offers several million firm-level observations and allows us to take an even closer

13
look at addressing causality concerns using firm-level panel data, propensity score matching, and
the Rajan and Zingales (1998) methodology.
A. Enterprise Survey sample
We begin our analysis by running firm-level regressions of employment growth on access
to finance across 70 countries in the ES as specified in equation (1) below:
Employment Growthi,j,k,t= αAccess to Financei,j,k,t-1 + βXi,j,k,t + γZ j,t-1 + Cj+Yt+ ηi,j,k,t (1)
Where i identifies firms, j countries, k sectors/industries and t years. Employment Growth refers
to the annual employment growth. Access to Finance is an indicator variable equal to 1 for firms
that have an outstanding loan. X is a matrix of firm level characteristics such as firm size,
ownership (foreign or government owned), exporter status, and age. Z captures country level
variables that can affect employment growth such as inflation and GDP growth. Cj and Yt are a
vector of country and year fixed effects, respectively. With the repeated cross-sections in ES, we
obtain within-country estimates that control for non-time-varying country controls in the
empirical specification. The regressions are estimated using ordinary least squares with standard
errors clustered at the survey level.
We first estimate equation (1) for all firms to understand the overall correlation between
financial access and employment growth. We follow this up with separate estimations over sub-
samples of MSMEs, SMEs and large firms, and test for differences in the impact of financing for
these groups.

14
While equation (1) highlights the correlation between access to finance and job growth it
does not provide a definite causal relationship. Clearly, employment growth could be driving
firms’ access to finance (i.e., financial institutions might be more likely to lend to growing firms
and similarly growing firms are likely to demand more financing to sustain their operations) or
there could be other variables that drive both employment growth and access to finance. In other
words, both reverse causality and omitted variable bias are potential concerns in identifying the
causal effect of finance on employment growth.
To address these concerns, we proceed as follows. First, to partially alleviate the problem
of endogeneity arising from omitted variable bias at the country level, in lieu of separate country
and year fixed effects, we introduce survey (i.e. country-year specific) fixed effects. The
coefficient α in equation (1) now measures the within survey impact of firm financing on job
growth and by design controls for all time-varying country level variables relating to, for
example, policy, institutions, regulatory quality and aggregate growth. We drop country level
controls, inflation and GDP growth in this specification.
Second, to identify a causal link from access to finance to employment growth, instead of
directly analyzing the impact of finance on employment growth, we examine what happens to
employment growth for firms in countries that undertake financial infrastructure reforms that are
intended to increase the supply of credit. In particular, we look at firms in countries that
introduced credit bureaus relative to firms that are in countries that do not introduce such a
reform. There is an extensive literature that studies the link between reforms in the information
sharing systems and increased access to finance and finds a strong positive link. The empirical
analyses has been both at the country level (Jappelli and Pagano (2002); Detragiache, Gupta, and
Tressel (2005), Djankov, McLiesh, and Shleifer (2007)), and more contextually relevant in our
15
case, at the firm level (Galindo and Miller (2001), Love and Mylenko (2003), Brown, Jappelli,
and Pagano (2009), Martinez Peria and Singh (2014)). The approach we take of identifying the
impact of access to finance through institutional reform that shocks the supply of credit is also
tangentially related to work done by Bertrand et al. (2007). While they look at deregulation in the
banking industry within a single country (France), we use a reform that is identifiable and
comparable across countries, since ours is a cross-country analyses.
Specifically, we estimate the following equation:
Employment Growthi,j,k,t= αCB Reformj,t-2 + βXi,j,k,t + γZ j,t-2 + Cj + Yt + ηi,j,k,t (2)
where CB Reform is a dummy variable which equals one for countries that introduced a credit
bureau following the year of introduction. All other variables have been defined above. CB
reform can be thought of as the interaction of a dummy for the set of countries that introduced a
reform during the sample period with a country-specific dummy which identifies the years after
reform. Thus, this empirical methodology is akin to a difference-in-difference approach,
comparing countries which underwent reforms and countries without reform, and years pre- and
post-reform. By replacing a direct measure of access to finance that is endogenous with an
external country-wide shock to the supply of credit that is exogenous, we are better able to
extract a causal relationship between financing and employment growth. As the link between the
increases in credit supply due to credit bureau reform and subsequent job growth works through
an intermediate increase in firm access to finance, to allow the effect to be realized we lag the
CB variable in the equation by a further year.

16
The identifying assumption in equation (2) is that credit bureau reforms are exogenous
shocks to the supply of credit.16 The primary role of credit bureaus is to facilitate exchange of
information among banks and financial institutions and thus it is reasonable to assume that the
effect of CB reform on job growth as estimated in the specification above is exogenous and
operates only through the effect of CB reform on credit markets. This approach takes advantage
of cross-country variation in the supply of credit due to some countries introducing credit
bureaus while others did not. With country fixed effects in the difference-in-difference setting,
we are measuring the within country effect of CB reform. As such, this controls for any omitted
variable bias from time-invarying country level variables. Introducing year fixed effects controls
for macro variations across time periods.
B. Orbis sample
Even with the use of a difference-in-difference estimation strategy for the impact of CB
reform, arguably our analysis may not fully account for the endogeneity in the decision by
countries to introduce CBs. For example, firm-level factors may drive countries to introduce CBs
and also impact job growth. In such a scenario, our specification may suffer from selection bias
due to omitted variables as the effects on job growth from these unobserved factors are attributed
to CB reform. To address these concerns we use panel data from Orbis that allows us to include
firm fixed effects to control for any firm-level unobserved heterogeneity. We also use two
distinct methods to address causality issues that may result from country-level omitted factors or
firm demand for finance. First, we empirically match the treatment and control countries to
produce a more aligned sample of countries. In the specification (2) above, any country without a
CB is placed in the control group. To provide a better counterfactual and to mitigate the selection 16 We relax the assumption of exogeneity in the following section.

17
bias, we match control countries to treatment countries on the following factors –average GDP
per capita over the period 2002-2004, average real GDP growth over the period 2002-2004, and
propensity to reform. We measure propensity to reform using the 3 year change in the World
Governance Indicator (WGI) Regulatory Quality Index over the same period.17 This Index
captures perceptions of the ability of the government to formulate and implement policies and
regulations that promote private sector development. By matching on changes in regulatory
quality, we are matching countries that show similar trends in propensity to reform.18 In addition,
we seek to keep the treatment and control countries similar on the level and rate of overall
development by also matching on GDP per capita and real GDP growth.
We calculate propensity scores for each country using pre-reform values on these
variables, and use nearest neighbor one-to-one propensity score matching (with replacement).19
With a newly matched treatment and control countries, we subsequently estimate the difference-
in-difference specification of equation 2, taking into account the number of times a control
country matches multiple treatment countries with frequency weights.
Second, we introduce within-country variation in dependence on external sources of
finance across industries. This approach compares the impact of CB reform on employment
growth across industries that are more versus less dependent on external sources of finance.
Firms in different industries rely on external financing to a different extent, and we use the
varying response of these industries to credit bureau reform as part of the empirical strategy. It
17 A three year timeframe provides a more stable regulatory direction of a countries policies that is more likely to smooth out annual jumps. 18 Using another measure of regulatory quality, the ICRG Legislative Strength index produces similar matching results. 19 We verified that the choice of matching method is not crucial to the overall results. Using Kernel density based matching, for example, produces similar matching and qualitatively similar regression results.
18
stands to reason that if firms in industries that are more dependent on external financing are able
to secure such financing, they will be able to grow at a faster rate.
This follows the strategy proposed by Rajan and Zingales (1998). However, while they
have used this strategy to assess how country level financial depth affects industry output
growth, in this case we use it to study how the supply shock to credit from introductions of CBs
affects firm employment growth. Essentially, this involves estimating equation (3) below:
Employment Growthi,j,k,t = αCB reformj,t-2 + θCB reformj,t-2*EFD Indexk + βXi,j,k,t + γZ j,t-2
+ F i + Y t + ηi,j,k,t (3)
Where EFD Index is the Rajan and Zingales (1998) external finance dependence index
and the remaining variables have been described above. The identifying assumption in (3) is that
external dependence represents a true technological measure of demand for external financing
independent of supply. As discussed in the previous section, we follow Rajan and Zingales
(1998) in constructing the Index, using data from US firms assuming that capital markets in this
country are relatively frictionless and thus an industry reliance on external finance in that country
is a reliable indication of true technological demand for financing.
While in principle we could undertake propensity matching in the ES sample, we do not
show these as the main results since the one-to-one nearest neighbor matching with replacement
results in a much larger reduction in the number of control countries in the ES data. We are
unable to apply the Rajan and Zingales (1998) methodology to the ES sample since its industry
classification of firms does not correspond to standardized classifications such as ISIC, SIC or
NAICS. Our attempt to match industries by name relies on far too many simplifying

19
assumptions. By contrast, firms in the Orbis data provide 2 digit standardized SIC codes. We are
thus able to match RZ external finance dependence measure calculated from the Compustat data
precisely with firm-level Orbis data.
IV. Results
A. Access to finance and employment growth
We find a strong positive correlation between firm access to finance and the rate of
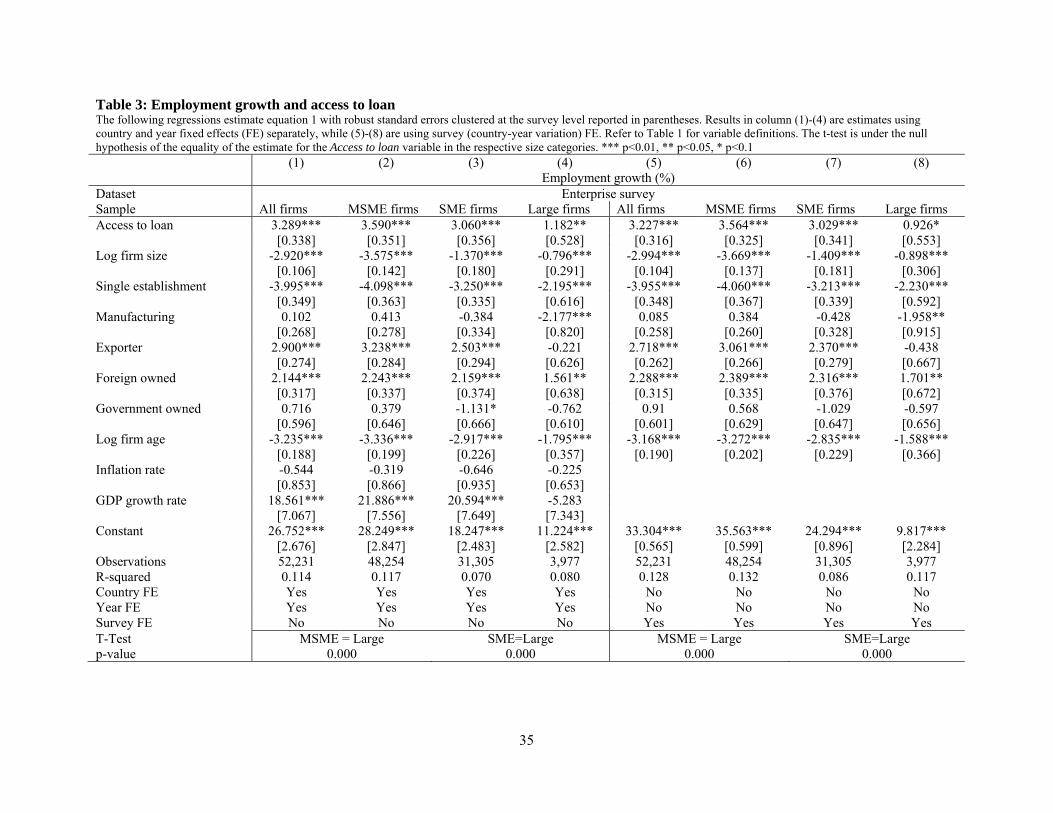
employment growth. Table 3 presents estimates of the association between the firm’s access to a
loan and subsequent employment growth (equation 1) for all the firms in the sample, as well as
over the MSME, SME, and large firm subsamples. The first four columns show estimations
using country and year fixed effects along with time varying country-level controls, while the
next four columns replace the time varying country-level variables with survey (country-year)
fixed effects.
Column 1 shows that firms with access to a loan have an annual employment growth that
is 3.29 percentage points larger than for firms with no access. Columns. (2) to (4) show the
association between access to finance and employment growth to be strongest in the case of
MSMEs and SMEs20 (3.59% and 3.06% respectively) compared to large firms (1.18%) with
point estimates more than three times larger than for large firms. To statistically test how the
estimates for SMEs and MSMEs differ from those of large firms, we estimate the two sub-
samples as Seemingly Unrelated Regressions (SUR) and conduct a t-test for whether the
coefficients are equal. We reject the null hypothesis of their equality resoundingly at the 1%
20 We follow the IFC and EU size categorization and classify MSME as firms with less than 250 employees. We also ran the regressions using different categorization of MSME’s as firms with less than 100 employees suggested by others and find that the results hold.

20
level of statistical significance.21 In columns (5) to (8), we present an alternative specification
that controls for survey fixed effects (which are country-year specific) rather than country and
year fixed effects. These within survey estimates in essence remove country level omitted
variable bias from both time-varying and time-invariant covariates. The qualitative results in
columns (1) to (4), in terms of sign as well as relative magnitude between MSMEs, SMEs and
large firms, carry through in these specifications.
As robustness, in appendix A3 we estimate columns (1) to (4) from Table 3 over the
Orbis sample and obtain qualitatively identical results. 22 In all regressions in this table, we use
OLS regressions with firm and year fixed effects with standard errors clustered at the firm-level.
Overall, firms with access to a loan have an average annual employment growth rate that is 1
percentage point larger than that for firms that lack such financing in the Orbis sample. As
before, we find the association to be strongest in the case of MSMEs with a point estimates more
than four times higher than that of large firms. We confirm with a t-test that it is statistically
higher at the 99% confidence level.
In columns (5) to (12), as robustness, we present results using two additional measures
for the volume of financing – growth of finance and debt ratio. In columns (5) to (8), we find that
a 1 standard deviation increase in the growth of finance correlates to an overall increase in
employment growth by 0.81 percentage points. This relationship appears entirely driven by the
high correlation among MSME firms. A 1 standard deviation increase in the growth of finance is
associated an increase in employment growth by 0.89 percentage points among MSMEs and only
21Micro firms with access to a loan increase employment growth at a rate of almost 5 percentage points larger than that of micro firms without a loan, by far the sub-sample with the highest correlation. 22 All analysis using ORBIS data is done using the full sample of firms available even when data for a particular firm is not available for all years. As robustness check, we repeated all our analysis over a balanced panel that drops firms not available over the entire 2004-2011 timeframe. Although the number of countries and the sample size drops substantially, all results carry through. The regression tables are available on request.

21
0.07 percentage point increase among large firms. Thus, the increase in employment growth
from increase in the growth of finance is 13 times higher for MSME firms. T-tests confirm that
the null hypothesis for the equality of the estimates for MSMEs and SMEs against large firms
can be rejected strongly at the 1 percent significance level.
Columns (9) to (12) show that the overall effect, as well as for MSMEs and SMEs of an
increase in the debt ratio results in a positive impact on job growth. Overall, a 1 percentage point
increase in the debt ratio results in approximately a 0.03 percentage point increase in
employment growth. A similar point estimate is observed within the MSME and SME
subsamples. Here again we find the relation between access to finance and job growth to be
strongest (both economically and statistically) in the case of MSMEs and SMEs compared to
large firms.
Overall, the results from Table 3 and Appendix A3 provide initial suggestive evidence
that access to finance leads to higher employment growth. Further, as MSMEs are more likely to
be credit constrained, we consistently see that they are more inclined to increase employment
given financial access. As discussed above though, econometrically, endogeneity of the finance
variables is a concern that does not allow for a causal interpretation of the effect of financing on
employment growth. We address this in the following sections.
B. Credit bureau reform, access to finance, and employment growth
In this section, we address the endogeneity of the financing variables by using the
introduction of credit bureaus as an exogenous shock to the supply of credit in an economy. We
first establish the association between introduction of CBs and access to finance and then
examine the impact of CB on employment growth.

22
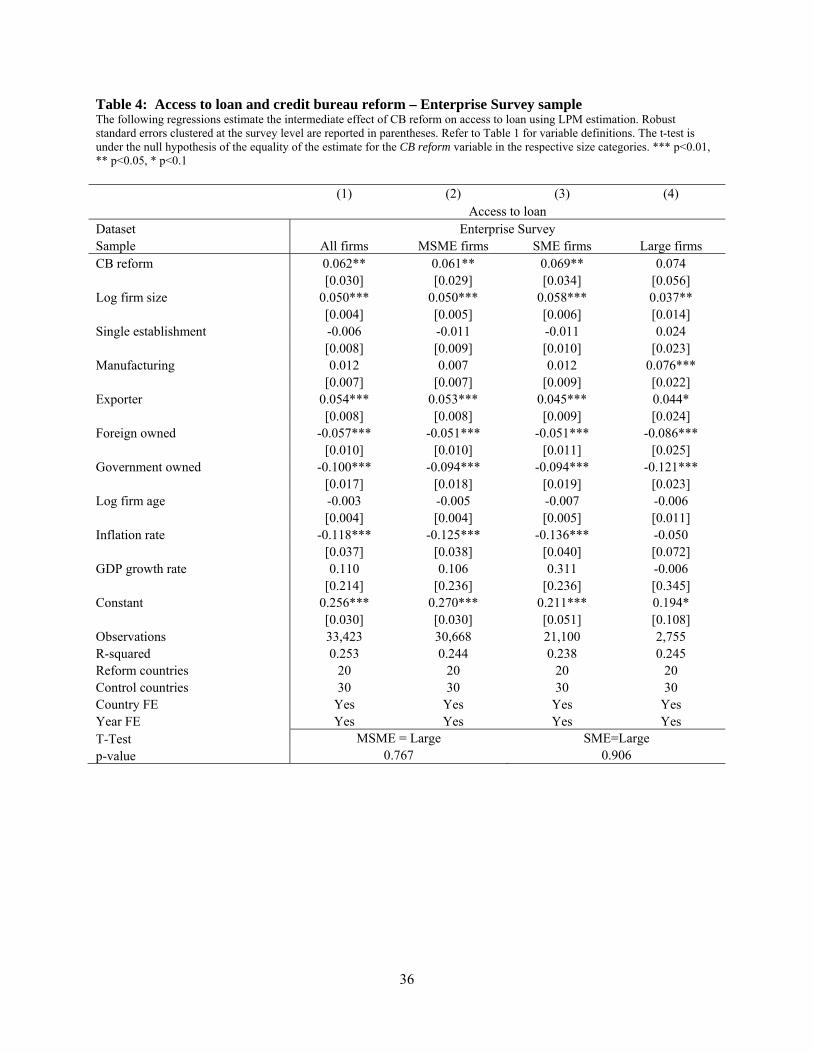
In Table 4 we first regress Access to loan on CB reform and find that the introduction of a
CB is associated with an increase in access to finance. These regressions are estimated using a
linear probability model (LPM) and standard errors are clustered at the survey level. Specifically,
controlling for country and year fixed effects,23 in the years after which a CB is introduced in the
country, there is a 6 percentage point increase in the average firm’s access to a loan in the overall
sample. We find similar point estimates in the MSME and SME sample. The association between
CB reform and access to finance is not statistically significant in the large firm sample as seen in
column 4 of Table 4. While we expect MSMEs and SMEs, which are potentially the most
financially constrained firms in an economy, to benefit the most from reforms that improve the
credit information environment in the country, we are not able to reject the null hypothesis for
the equality of the estimates for MSMEs and SMEs against large firms.
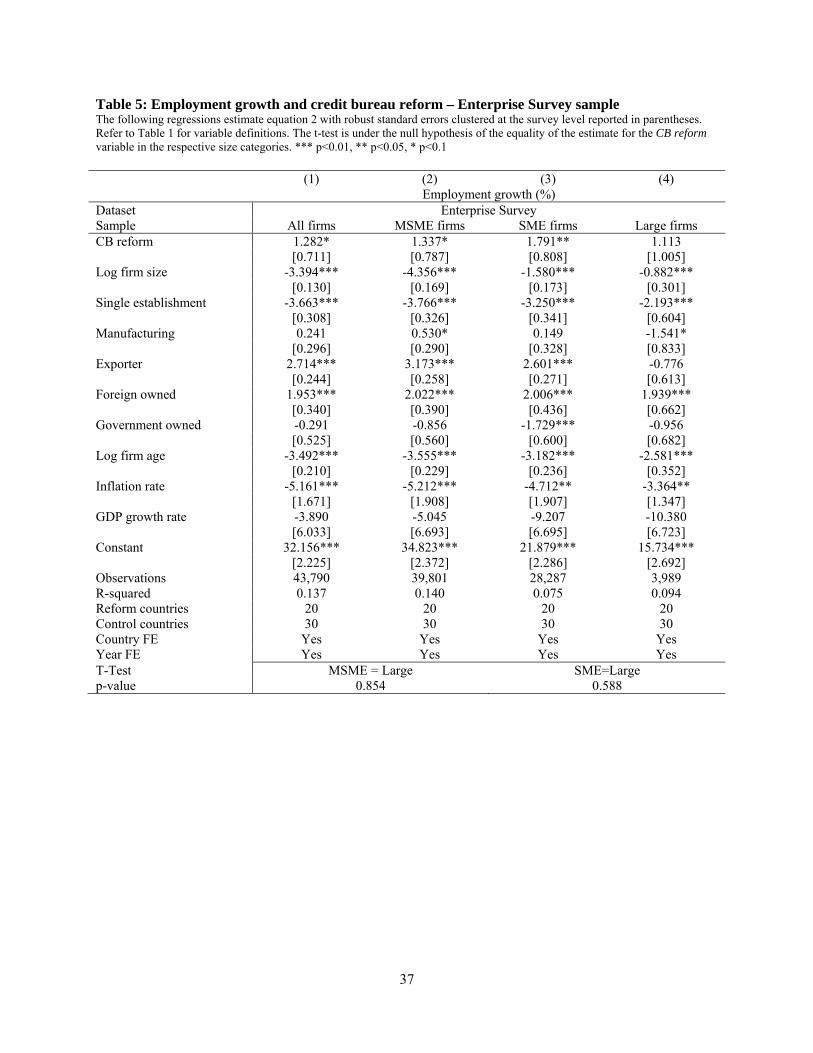
Having established the effect of CB reform on access to finance, we next re-estimate
equation (2) but replace Access to loan with the more exogenous CB reform. Using the
Enterprise Survey data, Table 5 shows that the introduction of CBs leads to 1.28 percentage
point increase in employment growth for the overall sample. MSMEs and SMEs again respond
more to the supply shock (1.34% and 1.79% increase in employment growth respectively), while
the larger firms have a lower increase in employment growth (1.11%) that is not statistically
significant. Statistically, we confirm using t-tests that the estimates for MSMEs and SMEs are
higher than those for large firms at the 99% confidence level.
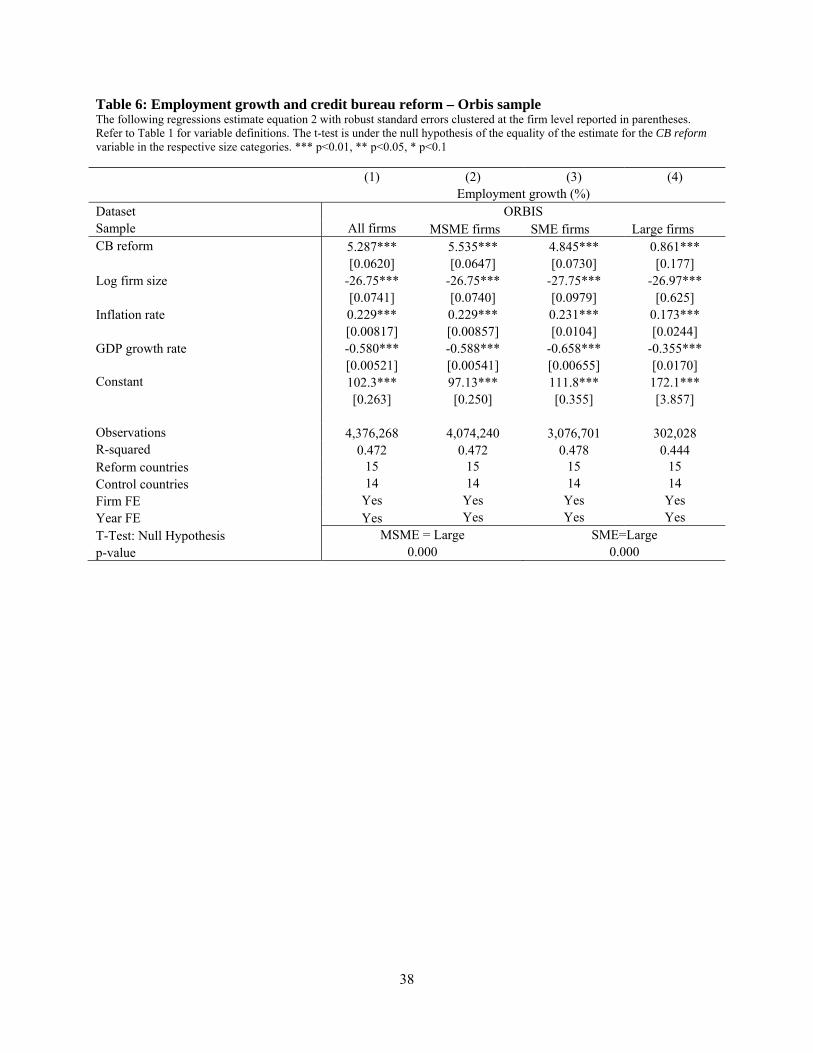
In Table 6, we confirm the impact of CB reform on employment growth using the ORBIS
sample but the magnitudes we find are larger. Introduction of CBs leads to an over 5 percentage
point increase in employment growth both for the overall sample (5.29%) and for MSMEs
23 We are unable to use survey (country-year variation) fixed effects as in Table 3, because CB reform is a country-year variable.
23
(5.54%) and is only slightly smaller in the case of SMEs (4.85%). By contrast, the increase in
employment growth is just under 1 percentage point for larger firms. Thus, introduction of CBs
results in an increase in employment growth that is over 6 times larger among MSMEs than large
firms. Statistically, we confirm using t-tests that the estimates for MSMEs and SMEs are higher
than those for large firm at the 99% confidence level.
In addition to the year of introduction of CB’s, the World Bank Doing Business reports24
also gather information on the coverage of the CBs as a percentage of total population. The
estimation of equation (2) using CB reform above switches from 0 to 1 with their introduction,
thus treating all CBs in the same manner. It is reasonable to assume that if CBs are introduced
with varying degrees of coverage, the subsequent shock to credit supply will be proportionally
varying. As a robustness check, we introduce this information into equation 2 by replacing CB
reform variable with the interaction of CB reform and CB coverage.25 Results provided in the
Appendix Table A4 show that increases in coverage do appear to have varying degrees of impact
on job creation due to a differential effect on credit supply. Countries that introduce CB reform
with a 1 percentage point higher coverage, on average, grow employment at a 0.05 percentage
point higher rate in the Enterprise Survey sample and a 0.16 percentage point higher rate in the
Orbis sample. To put these estimates in context, consider a change in coverage from the 25th
percentile to the 75th percentile of countries, which corresponds to 37.4 percent increase in
coverage. Such an increase in coverage, according to the estimates in Table A4, would lead to
an additional 2 percentage point increase in the growth of employment in the ES sample and 6
percentage point increase in job growth in the Orbis sample. The gulf in employment growth
between MSMEs and large firms is still evident in these regressions and t-tests confirm that
24 http://www.doingbusiness.org/data/exploretopics/getting-credit 25 We do not introduce CB reform and CB coverage individually due to issues of multi-collinearity.

24
differences between MSMEs and large firm are statistically significant at the 1 percent
significance level.
Overall, the CB results reported so far suggest that the relationship between access to
finance and job growth is causal rather than merely correlated. Furthermore, CB introductions,
especially with higher coverage, and the subsequent increase in access to finance appear to be
better utilized by MSMEs who grow employment at a much faster rate than larger firms.
As an interesting aside, we delve deeper into the effects of CB introductions on corporate
decision making. If firms have greater access to finance from the introduction of CBs, it is not
hard to envision that this should manifest in the growth of the firm in other dimensions besides
employment. An obvious effect would be on investment as firms finance lump-sum increases in
capital. In Appendix Table A5, we present results replacing employment growth with total asset
growth and tangible fixed assets growth, respectively, as the dependent variable in the
specification of equation (2). These variables are only available for the Orbis sample and for a
smaller sample of countries. We find that CB reform leads to increases in the growth rate of total
assets and tangible fixed assets. In the disaggregated size categories, we get estimates that are in
line with the pattern of results thus far – an effect among MSMEs and SMEs from financing (CB
reform) that is much higher than large firms. These results suggest an obvious avenue for growth
in employment among firms. It is conceivable that the increase in job growth from financing is
working through an intermediate increase in capital. As firms finance capital accumulation, labor
is hired to “work the machines” and maintain optimal capital-labor ratios.

25
C. Additional robustness tests
In this section, we present results from two additional strategies aimed at countering
concerns of endogeneity from the selection of treatment and control countries that undertake CB
reform – propensity score matching and the RZ methodology.
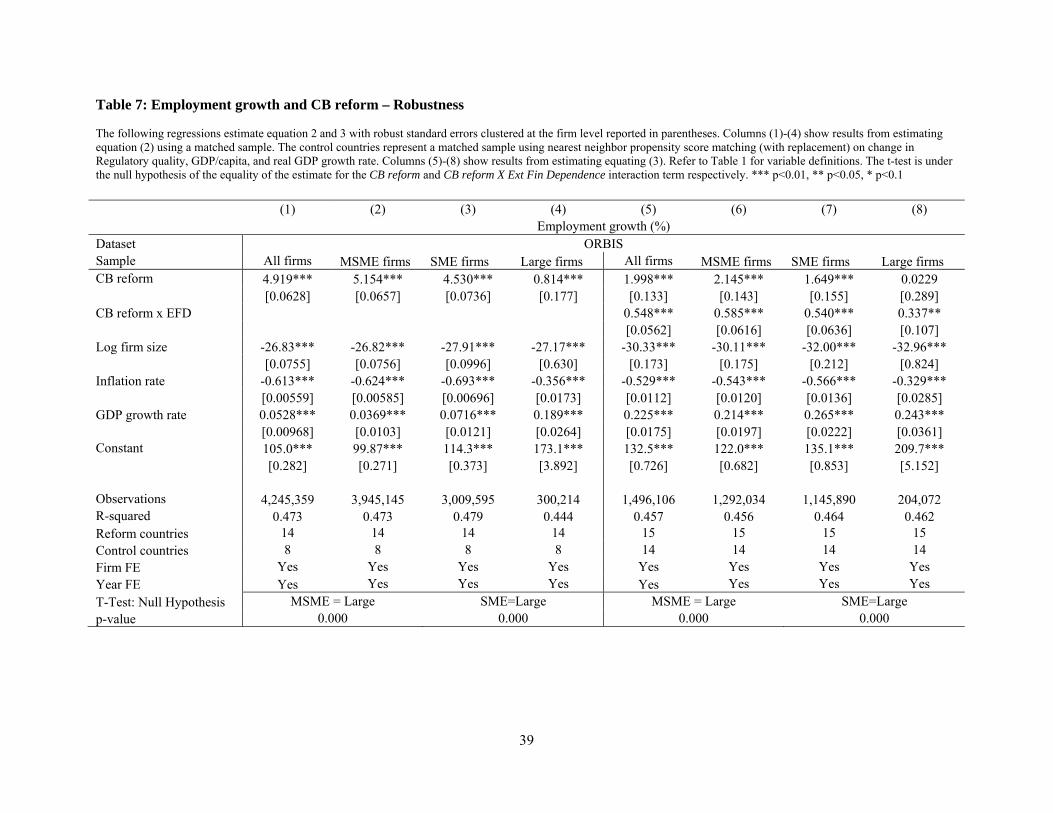
First, in columns (1) to (4) of Table 7, we present results from estimating the same
specification as before (equation 2), but modifying the sample of control countries as a result of
matching. The one-to-one nearest neighbor matching with replacement reduces the number of
control countries used from 14 to 8 in the Orbis data. The regressions make use of frequency
weights to produce an overall sample that is analogous to having an equal number of treatment
and control countries. A test of the balancing property shows that the balancing property of the
estimated propensity score is satisfied, i.e., countries with the same propensity score have the
same distribution of observable (and unobservable) characteristics independently of whether or
not they undertake CB reform.26 In estimating the propensity score, we impose the Common
Support condition, which ensures that matching is only conducted over the overlapping region of
the distributions of propensity score in the treated and untreated groups, thus ensuring that
conditional on observed characteristics, the probability of undertaking a CB reform or not is non-
zero.
The regressions results with matching are qualitatively identical to the unmatched results
in Table 6 above. Columns (1) to (4) of Table 7 show that the point estimates for the overall
effect of the introduction of CB on job growth are slighter lower than earlier, as are the effects
among SMEs and MSMEs. Increased access to finance resulting from the introduction of CBs
26 Rosenbaum and Rubin (1983) show that to ensure a bias reduction the propensity score should satisfy two important properties: Balancing Property which ensures that given the propensity score, the treatment and observables are independent and the Unconfoundedness Property which ensures that given the propensity score the treatment and the potential outcomes are independent. We use the Stata routine psmatch2 to estimate the propensity score and test the balancing property. Note that the unconfoundedness property cannot be tested.

26
leads to a growth in employment of approximately 5 percentage points in the overall sample, as
well as for SMEs and MSMEs. We test that this is statistically higher at the 1% confidence
interval than the estimate for subsample of large firms.
Overall, the results from the matched sample provide more substantive evidence for the
positive effect of CB reform on employment growth. More closely aligning the treatment and
control countries in their propensity to undertake regulatory reform and the overall level and
growth of income produces a smaller grouping of control countries. However, the estimates for
the overall sample as well as the relative size of the impact for the subsamples continue to hold.
Our second strategy to strengthen the causal impact from firm financing to employment
growth relies on supplementing the credit bureau reform analysis presented above with
exogenous cross-industry variation in dependence on external financing. As set out in equation
(3), following Rajan and Zingales (1998), this involves estimating the effect of the interaction
between the CB reform dummy and the industry level index of external finance dependence.
This variable varies at the country level depending on if and when CBs were set up in a country,
and further breaks down firms in reform countries by the level of external finance dependence in
the sector the firm operates.
Since the external finance dependence index is only calculated for firms in the
manufacturing sector, we first repeat the estimation in equation (2) (Table 6) over this sub-
sample to confirm that the underlying effect still exists (Appendix Table A6).
In columns (5) to (8) of Table 7, we regress Employment growth on CB Reform x EFD
and find strong evidence that the effect of CB reform does appear to vary by industry. The
interaction between CB reform and the external finance dependence variable is positive and
significant for the overall sample as well as for all three sub-samples. That the effect of CB

27
reform on employment growth varies by an exogenously constructed technological measure for
the industry’s demand for external financing provides further evidence that a causal link between
financing and subsequent economic growth exists. The relative magnitude of the effect appears
much larger among MSMEs and SMEs than the large firms. A t-test for the null hypothesis that
the interaction term for the MSME/SME subgroup is equal to the large subgroup is rejected at
the 1 percent significance level.
V. Conclusion
There is an extensive literature in corporate finance establishing the link between finance
and growth at the macro level (country economic growth and industry growth) and micro level
(firm sales growth). However little is known about the link between finance and labor markets.
Firms may grow by increasing investment, productivity, and thus output from greater access to
finance without ever increasing labor, a case of “jobless growth” that is of particular concern
after the global financial crisis of 2008.
Our paper is the first to establish that increased access to finance results in increased job
growth in developing countries. We use two complementary data sets – a cross-sectional micro-
level data set covering over 50,000 firms across 70 developing countries and a panel micro-level
data set covering fewer developing countries but over 4.3 million observations – that allow us to
conduct an array of tests to address endogeneity concerns. We find that the link between access
to finance and employment growth is robust to using firm fixed effects to control for
unobservable firm-level heterogeneity, using the introduction of credit bureaus as an external
exogenous shock to the supply of credit in the country, and using propensity score matching to
better match the countries that undertake credit bureau reform and those that do not. The effect

28
of access to finance on employment growth is also shown to be particularly large for firms in
industries that are more dependent on external finance. These effects are all economically large
as well as statistically significant.
We also find the association between finance and job growth to be stronger among micro,
small, and medium firms (MSMEs) than among large firms. In particular, we find that MSMEs
and SMEs, which are potentially more financially constrained than large firms given their limited
information environment, exhibit higher employment growth with the introduction of credit
bureaus than large firms.

29
References
Aterido, R., Hallward-Driemeier, M., Pages, C., 2011. Big constraints to small firms’ growth?
Business environment and employment growth across firms. Economic Development and
Cultural Change 59(3), 609 - 647.
Ayyagari, M., Demirguc-Kunt, A., Maksimovic, V., 2011. Small vs. young firms across the
world: Contribution to employment, job creation, and growth. World Bank Policy Research
Working Paper No. 5631
Beck, T., Levine, R., Loayza, N., 2000a. Financial intermediation and growth: causality and
causes. Journal of Monetary Economics 46(1), 31-77.
Beck, T., Levine, R., Loayza, N., 2000b. Finance and the sources of growth. Journal of
Financial Economics 58(1-2), 261-300.
Beck, T., 2009. The econometrics of finance and growth. In Palgrave Handbook of
Econometrics, vol. 2, ed. Terence Mills and Kerry Patterson, 1180–1211.
Benmelech, E., Bergman, N. , Seru, A., 2011. Financing labor. NBER Working Papers 17144.
Bentolila, S., Jansen, M., Jimenez, G., Ruano, S., 2013. When credit dries up: Job losses in the
Great Recession. CEPR Discussion Paper 9776.
Boeri, T., Garibaldi, P., Moen, E., 2012. The labor market consequences of adverse financial
shocks. IZA Discussion Paper 6826.
Brown, M., Jappelli, T., Pagano, M., 2009. Information sharing and credit: firm-level evidence
from transition countries. Journal of Financial Intermediation 18, 151–172.
Campello, M., Larrain, M., 2014. Enlarging the contracting space: Collateral menus, access to
credit, and economic activity. NBER Working Paper No. 21690.
30
Chodorow-Reich, G., 2014. The employment effects of credit market disruptions: Firm-level
evidence from the 2008–9 financial crisis. Quarterly Journal of Economics 129(1), 1-59.
Compustat, 2015. http://www.spcapitaliq.com. Standard & Poor’s.
Cull, R., Xu, L. C, 2013. Job growth and finance: Are some financial institutions better suited to
the early stages of development than others? World Bank Economic Review 27(3), 542-572.
Demirguc-Kunt, A., Maksimovic, V., 1998. Law, finance, and firm growth. Journal of Finance
53(6), 2107-2137.
Detragiache, E., Gupta, P., Tressel, T., 2005. Finance in lower-income countries: An empirical
exploration. International Monetary Fund Working Paper 05/167.
Djankov, S., McLiesh, C., Shleifer, A., 2007. Private credit in 129 countries. Journal of
Financial Economics 84(2), 299-329.
Doing Business Report, 2015. http://www.doingbusiness.org/data. The World Bank.
Duygan-Bump, B., Levkov, A., Montoriol-Garriga, J, 2015. Financing constraints and
unemployment: Evidence from the Great Recession. Journal of Monetary Economics 75, 89-105.
Enterprise Surveys, 2015. http://www.enterprisesurveys.org. The World Bank.
Galindo, A., Micco, A., 2005. Bank credit to small and medium-sized enterprises: The role of
creditor protection. IDB Working Paper No. 438.
Galindo, A., Miller, M., 2001. Can credit registries reduce credit constraints? Empirical evidence
on the role of credit registries in firm investment decisions. IDB-IIC 42nd Annual Meeting.
Santiago, Chile.
Garmaise, Mark J., 2009. Production in entrepreneurial firms: The effects of financial constraints
on labor and capital. Review of Financial Studies 21, 543-577.
31
Greenstone, M., Mas, A., Nguyen, H., 2012. Do credit market shocks affect the real economy?
Quasi-experimental evidence from the Great Recession and "normal" economic times. NBER
Working Paper No. 20704.
Guiso, L., Sapienza, P., Zingales, L.,2004. Does local financial development matter? Quarterly
Journal of Economics 119(3), 929-969.
Haltiwanger J., Jarmin, R., Miranda, J., 2013. Who creates jobs? Small vs. large vs. young.
Review of Economics and Statistics 95(2), 347-361.
Hamermesh, D., 1989. Labor demand and the structure of adjustment costs. American Economic
Review 79, 674-689.
International Country Risk Guide (ICRG), 2015. http://epub.prsgroup.com/products/icrg. PRS
Group.
Jappelli, T., Pagano, M., 2002. Information sharing, lending and defaults: Cross-country
evidence. Journal of Banking and Finance 26(10), 2017-2045.
Jappelli, T., Pagano, M., 2003. Public credit information: A European Perspective. In Credit
Reporting Systems and the International Economy, by Margaret J. Miller, 81-114. Cambridge,
MA: The MIT Press.
Jayaratne, J., Strahan, P.E., 1996. The finance-growth nexus: Evidence from bank branch
deregulation. Quarterly Journal of Economics 111(3), 639-670.
King, R., Levine, R., 1993. Finance and growth: Schumpeter might be right. Quarterly Journal
of Economics 108(3), 717-37.
La Porta, R., López-de-Silanes, F., Shleifer, A.,Vishny, R., 1998, Law and Finance, Journal of
Political Economy 106(6), 1113-1155.
32
Levine, R., Zervos, S., 1998. Stock markets, banks and economic growth. American Economic
Review 88(3), 537-58.
Levine, R., 2005. Finance and growth: Theory and evidence. in Handbook of Economic Growth,
Eds:Philippe Aghion and Steven Durlauf, The Netherlands: Elsevier Science, 2005.
Love, I., Mylenko, N., 2003. Credit reporting and financing constraints, World Bank Policy
Research Working Paper 3142.
Martinez Peria, M. S., Singh, S., 2014. The impact of credit information sharing reforms on firm
financing? World Bank Policy Research Working Paper No. 7013.
Oi, W., 1962. Labor as a quasi-fixed Factor. Journal of Political Economy 70(6), 538-555.
Oi, W., 1983. Heterogeneous firms and the organization of production. Economic Inquiry 21(2),
147–71. Orbis, 2015. http://www.bvdinfo.com/en-gb/home. Bureau van Dijk.
Pagano, M., Pica, G., 2012. Finance and employment. Economic Policy 27(1), 5-55.
Popov, A., Rocholl, J., 2015. Financing constraints, employment, and labor compensation:
evidence from the subprime mortgage crisis. ECB Working paper Series No. 1821.
Rajan, R., Zingales, L., 1998. Financial dependence and growth. American Economic Review,
88(3), 559-86.
Rosenbaum, P.R., Rubin, D.B., 1983. The central role of the propensity score in observational
studies for causal effects. Biometrika 70(1), 41-55.
World Development Indicators, 2015. http://data.worldbank.org/products/wdi. The World Bank.
World Governance Indicators, 2015. http://info.worldbank.org/governance/wgi/index.asp. The
World Bank.
33
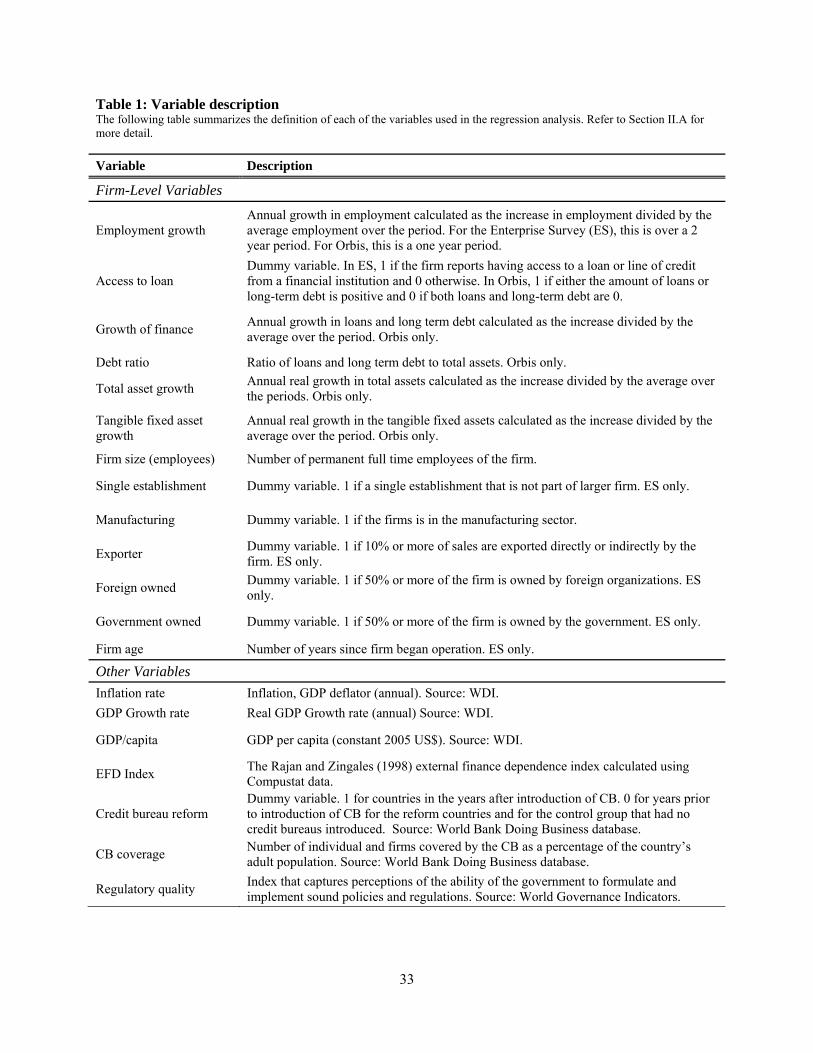
Table 1: Variable description The following table summarizes the definition of each of the variables used in the regression analysis. Refer to Section II.A for more detail.
Variable Description
Firm-Level Variables
Employment growth Annual growth in employment calculated as the increase in employment divided by the average employment over the period. For the Enterprise Survey (ES), this is over a 2 year period. For Orbis, this is a one year period.
Access to loan Dummy variable. In ES, 1 if the firm reports having access to a loan or line of credit from a financial institution and 0 otherwise. In Orbis, 1 if either the amount of loans or long-term debt is positive and 0 if both loans and long-term debt are 0.
Growth of finance Annual growth in loans and long term debt calculated as the increase divided by the average over the period. Orbis only.
Debt ratio Ratio of loans and long term debt to total assets. Orbis only.
Total asset growth Annual real growth in total assets calculated as the increase divided by the average over the periods. Orbis only.
Tangible fixed asset growth
Annual real growth in the tangible fixed assets calculated as the increase divided by the average over the period. Orbis only.
Firm size (employees) Number of permanent full time employees of the firm.
Single establishment Dummy variable. 1 if a single establishment that is not part of larger firm. ES only.
Manufacturing Dummy variable. 1 if the firms is in the manufacturing sector.
Exporter Dummy variable. 1 if 10% or more of sales are exported directly or indirectly by the firm. ES only.
Foreign owned Dummy variable. 1 if 50% or more of the firm is owned by foreign organizations. ES only.
Government owned Dummy variable. 1 if 50% or more of the firm is owned by the government. ES only.
Firm age Number of years since firm began operation. ES only.
Other Variables
Inflation rate Inflation, GDP deflator (annual). Source: WDI.
GDP Growth rate Real GDP Growth rate (annual) Source: WDI.
GDP/capita GDP per capita (constant 2005 US$). Source: WDI.
EFD Index The Rajan and Zingales (1998) external finance dependence index calculated using Compustat data.
Credit bureau reform Dummy variable. 1 for countries in the years after introduction of CB. 0 for years prior to introduction of CB for the reform countries and for the control group that had no credit bureaus introduced. Source: World Bank Doing Business database.
CB coverage Number of individual and firms covered by the CB as a percentage of the country’s adult population. Source: World Bank Doing Business database.
Regulatory quality Index that captures perceptions of the ability of the government to formulate and implement sound policies and regulations. Source: World Governance Indicators.
34
Table 2: Summary statistics The following table provides summary statistics for variables used in the regression analysis. Refer to section II.A for discussion.
Variable Obs Mean Median SD Min Max
ENTERPRISE SURVEY SAMPLE
Firm-Level Variables
Employment growth 43790 6.535 2.439 18.346 -50 71.429 Access to loan 52231 0.241 0 0.428 0 1
Firm size (employees) 43790 114.260 25 521.735 5 64000 Single establishment 43790 0.794 1 0.405 0 1 Manufacturing 43790 0.525 1 0.499 0 1 Exporter 43790 0.232 0 0.422 0 1 Foreign owned 43790 0.105 0 0.307 0 1 Government owned 43790 0.067 0 0.251 0 1 Firm age 43790 17.030 12 16.324 1 195 Country-Level Variables
Inflation rate 43790 0.158 0.093 0.223 -0.238 1.420 GDP growth (annual) 43790 0.053 0.055 0.043 -0.065 0.207
ORBIS SAMPLE
Firm-Level Variables
Employment growth 4,376,268 6.997 1.418 28.288 -66.667 93.617 Access to loan 3,491,319 0.374 0 0.484 0 1
Growth of finance 777,010 9.869 4.586 73.915 -200.000 200.000
Debt ratio 3,212,424 6.323 0 12.905 0 61.279
Total asset growth 2,233,959 -0.143 -3.525 34.870 -86.354 112.726
Tangible fixed asset growth 2,233,959 -9.402 -15.226 39.963 -97.459 119.933
Firm size (employees) 4,376,268 98.803 25 853.199 1 330,429 Country-Level Variables
Inflation rate 4,376,268 12.209 13.593 6.668 -16.705 84.886 GDP growth (annual) 4,376,268 6.148 7.300 6.319 -17.955 33.736
35
Table 3: Employment growth and access to loan The following regressions estimate equation 1 with robust standard errors clustered at the survey level reported in parentheses. Results in column (1)-(4) are estimates using country and year fixed effects (FE) separately, while (5)-(8) are using survey (country-year variation) FE. Refer to Table 1 for variable definitions. The t-test is under the null hypothesis of the equality of the estimate for the Access to loan variable in the respective size categories. *** p<0.01, ** p<0.05, * p<0.1 (1) (2) (3) (4) (5) (6) (7) (8) Employment growth (%) Dataset Enterprise survey Sample All firms MSME firms SME firms Large firms All firms MSME firms SME firms Large firms Access to loan 3.289*** 3.590*** 3.060*** 1.182** 3.227*** 3.564*** 3.029*** 0.926*
[0.338] [0.351] [0.356] [0.528] [0.316] [0.325] [0.341] [0.553] Log firm size -2.920*** -3.575*** -1.370*** -0.796*** -2.994*** -3.669*** -1.409*** -0.898***
[0.106] [0.142] [0.180] [0.291] [0.104] [0.137] [0.181] [0.306] Single establishment -3.995*** -4.098*** -3.250*** -2.195*** -3.955*** -4.060*** -3.213*** -2.230***
[0.349] [0.363] [0.335] [0.616] [0.348] [0.367] [0.339] [0.592] Manufacturing 0.102 0.413 -0.384 -2.177*** 0.085 0.384 -0.428 -1.958**
[0.268] [0.278] [0.334] [0.820] [0.258] [0.260] [0.328] [0.915] Exporter 2.900*** 3.238*** 2.503*** -0.221 2.718*** 3.061*** 2.370*** -0.438
[0.274] [0.284] [0.294] [0.626] [0.262] [0.266] [0.279] [0.667] Foreign owned 2.144*** 2.243*** 2.159*** 1.561** 2.288*** 2.389*** 2.316*** 1.701**
[0.317] [0.337] [0.374] [0.638] [0.315] [0.335] [0.376] [0.672] Government owned 0.716 0.379 -1.131* -0.762 0.91 0.568 -1.029 -0.597
[0.596] [0.646] [0.666] [0.610] [0.601] [0.629] [0.647] [0.656] Log firm age -3.235*** -3.336*** -2.917*** -1.795*** -3.168*** -3.272*** -2.835*** -1.588***
[0.188] [0.199] [0.226] [0.357] [0.190] [0.202] [0.229] [0.366] Inflation rate -0.544 -0.319 -0.646 -0.225
[0.853] [0.866] [0.935] [0.653] GDP growth rate 18.561*** 21.886*** 20.594*** -5.283
[7.067] [7.556] [7.649] [7.343] Constant 26.752*** 28.249*** 18.247*** 11.224*** 33.304*** 35.563*** 24.294*** 9.817***
[2.676] [2.847] [2.483] [2.582] [0.565] [0.599] [0.896] [2.284] Observations 52,231 48,254 31,305 3,977 52,231 48,254 31,305 3,977 R-squared 0.114 0.117 0.070 0.080 0.128 0.132 0.086 0.117 Country FE Yes Yes Yes Yes No No No No Year FE Yes Yes Yes Yes No No No No Survey FE No No No No Yes Yes Yes Yes T-Test MSME = Large SME=Large MSME = Large SME=Large p-value 0.000 0.000 0.000 0.000
36
Table 4: Access to loan and credit bureau reform – Enterprise Survey sample The following regressions estimate the intermediate effect of CB reform on access to loan using LPM estimation. Robust standard errors clustered at the survey level are reported in parentheses. Refer to Table 1 for variable definitions. The t-test is under the null hypothesis of the equality of the estimate for the CB reform variable in the respective size categories. *** p<0.01, ** p<0.05, * p<0.1 (1) (2) (3) (4) Access to loan Dataset Enterprise Survey Sample All firms MSME firms SME firms Large firms CB reform 0.062** 0.061** 0.069** 0.074
[0.030] [0.029] [0.034] [0.056] Log firm size 0.050*** 0.050*** 0.058*** 0.037**
[0.004] [0.005] [0.006] [0.014] Single establishment -0.006 -0.011 -0.011 0.024
[0.008] [0.009] [0.010] [0.023] Manufacturing 0.012 0.007 0.012 0.076***
[0.007] [0.007] [0.009] [0.022] Exporter 0.054*** 0.053*** 0.045*** 0.044*
[0.008] [0.008] [0.009] [0.024] Foreign owned -0.057*** -0.051*** -0.051*** -0.086***
[0.010] [0.010] [0.011] [0.025] Government owned -0.100*** -0.094*** -0.094*** -0.121***
[0.017] [0.018] [0.019] [0.023] Log firm age -0.003 -0.005 -0.007 -0.006
[0.004] [0.004] [0.005] [0.011] Inflation rate -0.118*** -0.125*** -0.136*** -0.050
[0.037] [0.038] [0.040] [0.072] GDP growth rate 0.110 0.106 0.311 -0.006
[0.214] [0.236] [0.236] [0.345] Constant 0.256*** 0.270*** 0.211*** 0.194*
[0.030] [0.030] [0.051] [0.108] Observations 33,423 30,668 21,100 2,755 R-squared 0.253 0.244 0.238 0.245 Reform countries 20 20 20 20 Control countries 30 30 30 30 Country FE Yes Yes Yes Yes Year FE Yes Yes Yes Yes T-Test MSME = Large SME=Large p-value 0.767 0.906
37
Table 5: Employment growth and credit bureau reform – Enterprise Survey sample The following regressions estimate equation 2 with robust standard errors clustered at the survey level reported in parentheses. Refer to Table 1 for variable definitions. The t-test is under the null hypothesis of the equality of the estimate for the CB reform variable in the respective size categories. *** p<0.01, ** p<0.05, * p<0.1 (1) (2) (3) (4) Employment growth (%) Dataset Enterprise Survey Sample All firms MSME firms SME firms Large firms CB reform 1.282* 1.337* 1.791** 1.113
[0.711] [0.787] [0.808] [1.005] Log firm size -3.394*** -4.356*** -1.580*** -0.882***
[0.130] [0.169] [0.173] [0.301] Single establishment -3.663*** -3.766*** -3.250*** -2.193***
[0.308] [0.326] [0.341] [0.604] Manufacturing 0.241 0.530* 0.149 -1.541*
[0.296] [0.290] [0.328] [0.833] Exporter 2.714*** 3.173*** 2.601*** -0.776
[0.244] [0.258] [0.271] [0.613] Foreign owned 1.953*** 2.022*** 2.006*** 1.939***
[0.340] [0.390] [0.436] [0.662] Government owned -0.291 -0.856 -1.729*** -0.956
[0.525] [0.560] [0.600] [0.682] Log firm age -3.492*** -3.555*** -3.182*** -2.581***
[0.210] [0.229] [0.236] [0.352] Inflation rate -5.161*** -5.212*** -4.712** -3.364**
[1.671] [1.908] [1.907] [1.347] GDP growth rate -3.890 -5.045 -9.207 -10.380
[6.033] [6.693] [6.695] [6.723] Constant 32.156*** 34.823*** 21.879*** 15.734***
[2.225] [2.372] [2.286] [2.692] Observations 43,790 39,801 28,287 3,989 R-squared 0.137 0.140 0.075 0.094 Reform countries 20 20 20 20 Control countries 30 30 30 30 Country FE Yes Yes Yes Yes Year FE Yes Yes Yes Yes T-Test MSME = Large SME=Large p-value 0.854 0.588
38
Table 6: Employment growth and credit bureau reform – Orbis sample The following regressions estimate equation 2 with robust standard errors clustered at the firm level reported in parentheses. Refer to Table 1 for variable definitions. The t-test is under the null hypothesis of the equality of the estimate for the CB reform variable in the respective size categories. *** p<0.01, ** p<0.05, * p<0.1 (1) (2) (3) (4) Employment growth (%) Dataset ORBIS Sample All firms MSME firms SME firms Large firms CB reform 5.287*** 5.535*** 4.845*** 0.861***
[0.0620] [0.0647] [0.0730] [0.177] Log firm size -26.75*** -26.75*** -27.75*** -26.97*** [0.0741] [0.0740] [0.0979] [0.625] Inflation rate 0.229*** 0.229*** 0.231*** 0.173*** [0.00817] [0.00857] [0.0104] [0.0244] GDP growth rate -0.580*** -0.588*** -0.658*** -0.355***
[0.00521] [0.00541] [0.00655] [0.0170] Constant 102.3*** 97.13*** 111.8*** 172.1***
[0.263] [0.250] [0.355] [3.857]
Observations 4,376,268 4,074,240 3,076,701 302,028 R-squared 0.472 0.472 0.478 0.444 Reform countries 15 15 15 15 Control countries 14 14 14 14 Firm FE Yes Yes Yes Yes Year FE Yes Yes Yes Yes T-Test: Null Hypothesis MSME = Large SME=Large p-value 0.000 0.000
39
Table 7: Employment growth and CB reform – Robustness The following regressions estimate equation 2 and 3 with robust standard errors clustered at the firm level reported in parentheses. Columns (1)-(4) show results from estimating equation (2) using a matched sample. The control countries represent a matched sample using nearest neighbor propensity score matching (with replacement) on change in Regulatory quality, GDP/capita, and real GDP growth rate. Columns (5)-(8) show results from estimating equating (3). Refer to Table 1 for variable definitions. The t-test is under the null hypothesis of the equality of the estimate for the CB reform and CB reform X Ext Fin Dependence interaction term respectively. *** p<0.01, ** p<0.05, * p<0.1 (1) (2) (3) (4) (5) (6) (7) (8) Employment growth (%) Dataset ORBIS Sample All firms MSME firms SME firms Large firms All firms MSME firms SME firms Large firms CB reform 4.919*** 5.154*** 4.530*** 0.814*** 1.998*** 2.145*** 1.649*** 0.0229
[0.0628] [0.0657] [0.0736] [0.177] [0.133] [0.143] [0.155] [0.289] CB reform x EFD 0.548*** 0.585*** 0.540*** 0.337**
[0.0562] [0.0616] [0.0636] [0.107] Log firm size -26.83*** -26.82*** -27.91*** -27.17*** -30.33*** -30.11*** -32.00*** -32.96*** [0.0755] [0.0756] [0.0996] [0.630] [0.173] [0.175] [0.212] [0.824] Inflation rate -0.613*** -0.624*** -0.693*** -0.356*** -0.529*** -0.543*** -0.566*** -0.329*** [0.00559] [0.00585] [0.00696] [0.0173] [0.0112] [0.0120] [0.0136] [0.0285] GDP growth rate 0.0528*** 0.0369*** 0.0716*** 0.189*** 0.225*** 0.214*** 0.265*** 0.243***
[0.00968] [0.0103] [0.0121] [0.0264] [0.0175] [0.0197] [0.0222] [0.0361] Constant 105.0*** 99.87*** 114.3*** 173.1*** 132.5*** 122.0*** 135.1*** 209.7***
[0.282] [0.271] [0.373] [3.892] [0.726] [0.682] [0.853] [5.152]
Observations 4,245,359 3,945,145 3,009,595 300,214 1,496,106 1,292,034 1,145,890 204,072 R-squared 0.473 0.473 0.479 0.444 0.457 0.456 0.464 0.462 Reform countries 14 14 14 14 15 15 15 15 Control countries 8 8 8 8 14 14 14 14 Firm FE Yes Yes Yes Yes Yes Yes Yes Yes Year FE Yes Yes Yes Yes Yes Yes Yes Yes T-Test: Null Hypothesis MSME = Large SME=Large MSME = Large SME=Large p-value 0.000 0.000 0.000 0.000
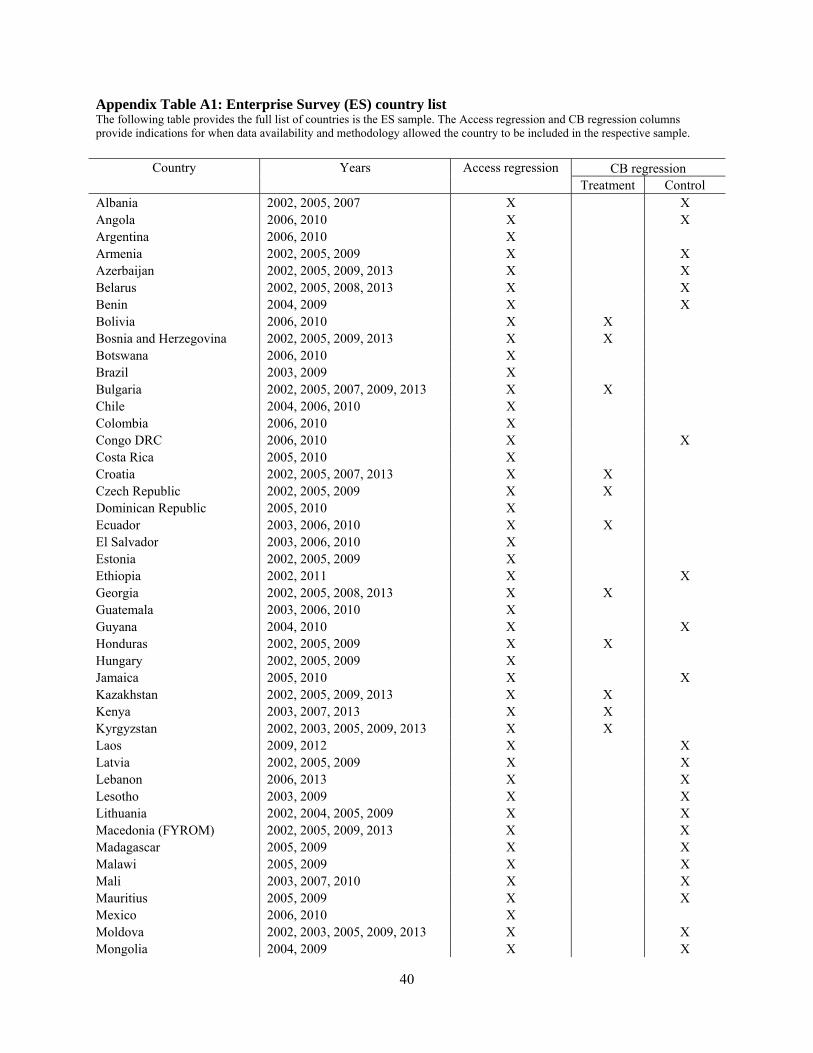
40
Appendix Table A1: Enterprise Survey (ES) country list The following table provides the full list of countries is the ES sample. The Access regression and CB regression columns provide indications for when data availability and methodology allowed the country to be included in the respective sample.
Country Years Access regression CB regression Treatment Control
Albania 2002, 2005, 2007 X X Angola 2006, 2010 X X Argentina 2006, 2010 X Armenia 2002, 2005, 2009 X X Azerbaijan 2002, 2005, 2009, 2013 X X Belarus 2002, 2005, 2008, 2013 X X Benin 2004, 2009 X X Bolivia 2006, 2010 X X Bosnia and Herzegovina 2002, 2005, 2009, 2013 X X Botswana 2006, 2010 X Brazil 2003, 2009 X Bulgaria 2002, 2005, 2007, 2009, 2013 X X Chile 2004, 2006, 2010 X Colombia 2006, 2010 X Congo DRC 2006, 2010 X X Costa Rica 2005, 2010 X Croatia 2002, 2005, 2007, 2013 X X Czech Republic 2002, 2005, 2009 X X Dominican Republic 2005, 2010 X Ecuador 2003, 2006, 2010 X X El Salvador 2003, 2006, 2010 X Estonia 2002, 2005, 2009 X Ethiopia 2002, 2011 X X Georgia 2002, 2005, 2008, 2013 X X Guatemala 2003, 2006, 2010 X Guyana 2004, 2010 X X Honduras 2002, 2005, 2009 X X Hungary 2002, 2005, 2009 X Jamaica 2005, 2010 X X Kazakhstan 2002, 2005, 2009, 2013 X X Kenya 2003, 2007, 2013 X X Kyrgyzstan 2002, 2003, 2005, 2009, 2013 X X Laos 2009, 2012 X X Latvia 2002, 2005, 2009 X X Lebanon 2006, 2013 X X Lesotho 2003, 2009 X X Lithuania 2002, 2004, 2005, 2009 X X Macedonia (FYROM) 2002, 2005, 2009, 2013 X X Madagascar 2005, 2009 X X Malawi 2005, 2009 X X Mali 2003, 2007, 2010 X X Mauritius 2005, 2009 X X Mexico 2006, 2010 X Moldova 2002, 2003, 2005, 2009, 2013 X X Mongolia 2004, 2009 X X

41
Country Years Access regression CB regression Treatment Control
Nepal 2009, 2013 X Nicaragua 2003, 2006, 2010 X X Panama 2006, 2010 X Paraguay 2006, 2010 X Peru 2002, 006, 2010 X Philippines 2003, 2009 X Poland 2002, 2003, 2005, 2009 X X Romania 2002, 2005, 2009 X X Russian Federation 2002, 2005, 2009 X X Rwanda 2006, 2011 X X Senegal 2003, 2007 X X Serbia and Montenegro 2002, 2005, 2009, 2013 X X Slovakia 2002, 2005, 2009 X X Slovenia 2002, 2005, 2009, 2013 X X South Africa 2003, 2007 X Sri Lanka 2004, 2011 X Tajikistan 2002, 2003, 2005, 2008 X X Tanzania 2003, 2006, 2013 X X Turkey 2002, 2004, 2005, 2008 X X Uganda 2003, 2006, 2013 X X Ukraine 2002, 2005, 2008, 2013 X X Uruguay 2006, 2010 X Uzbekistan 2002, 2003, 2005, 2008 X X Vietnam 2005, 2009 X X Zambia 2002, 2007 X X
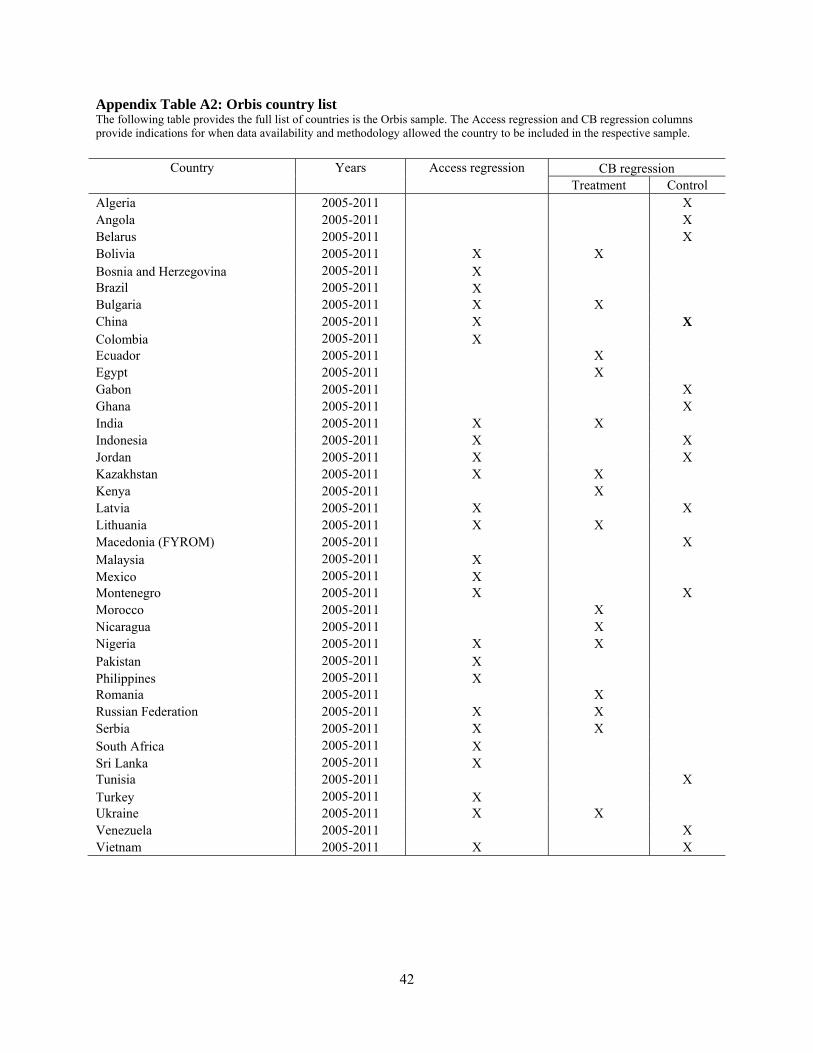
42
Appendix Table A2: Orbis country list The following table provides the full list of countries is the Orbis sample. The Access regression and CB regression columns provide indications for when data availability and methodology allowed the country to be included in the respective sample.
Country Years Access regression CB regression Treatment Control
Algeria 2005-2011 X Angola 2005-2011 X Belarus 2005-2011 X Bolivia 2005-2011 X X Bosnia and Herzegovina 2005-2011 X Brazil 2005-2011 X Bulgaria 2005-2011 X X China 2005-2011 X X Colombia 2005-2011 X Ecuador 2005-2011 X Egypt 2005-2011 X Gabon 2005-2011 X Ghana 2005-2011 X India 2005-2011 X X Indonesia 2005-2011 X X Jordan 2005-2011 X X Kazakhstan 2005-2011 X X Kenya 2005-2011 X Latvia 2005-2011 X X Lithuania 2005-2011 X X Macedonia (FYROM) 2005-2011 X Malaysia 2005-2011 X Mexico 2005-2011 X Montenegro 2005-2011 X X Morocco 2005-2011 X Nicaragua 2005-2011 X Nigeria 2005-2011 X X Pakistan 2005-2011 X Philippines 2005-2011 X Romania 2005-2011 X Russian Federation 2005-2011 X X Serbia 2005-2011 X X South Africa 2005-2011 X Sri Lanka 2005-2011 X Tunisia 2005-2011 X Turkey 2005-2011 X Ukraine 2005-2011 X X Venezuela 2005-2011 X Vietnam 2005-2011 X X
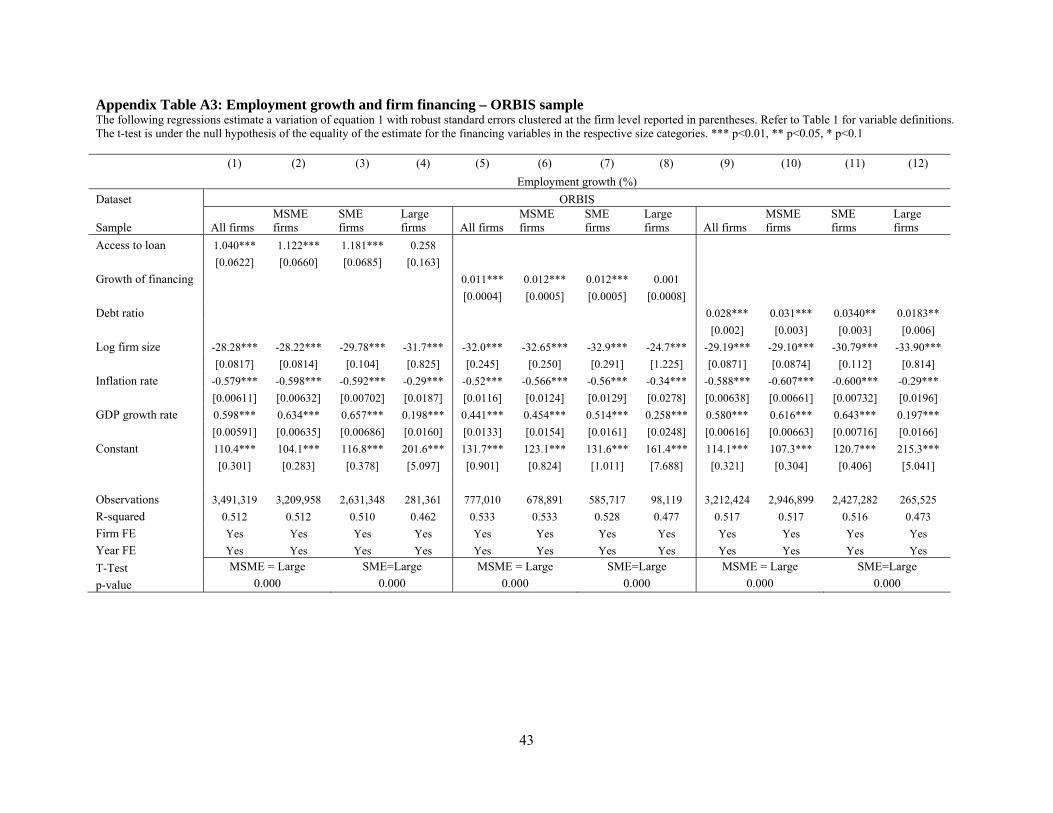
43
Appendix Table A3: Employment growth and firm financing – ORBIS sample The following regressions estimate a variation of equation 1 with robust standard errors clustered at the firm level reported in parentheses. Refer to Table 1 for variable definitions. The t-test is under the null hypothesis of the equality of the estimate for the financing variables in the respective size categories. *** p<0.01, ** p<0.05, * p<0.1
(1) (2) (3) (4) (5) (6) (7) (8) (9) (10) (11) (12)
Employment growth (%)
Dataset ORBIS
Sample All firms MSME firms
SME firms
Large firms All firms
MSME firms
SME firms
Large firms All firms
MSME firms
SME firms
Large firms
Access to loan 1.040*** 1.122*** 1.181*** 0.258
[0.0622] [0.0660] [0.0685] [0.163]
Growth of financing 0.011*** 0.012*** 0.012*** 0.001
[0.0004] [0.0005] [0.0005] [0.0008]
Debt ratio 0.028*** 0.031*** 0.0340** 0.0183**
[0.002] [0.003] [0.003] [0.006]
Log firm size -28.28*** -28.22*** -29.78*** -31.7*** -32.0*** -32.65*** -32.9*** -24.7*** -29.19*** -29.10*** -30.79*** -33.90***
[0.0817] [0.0814] [0.104] [0.825] [0.245] [0.250] [0.291] [1.225] [0.0871] [0.0874] [0.112] [0.814]
Inflation rate -0.579*** -0.598*** -0.592*** -0.29*** -0.52*** -0.566*** -0.56*** -0.34*** -0.588*** -0.607*** -0.600*** -0.29***
[0.00611] [0.00632] [0.00702] [0.0187] [0.0116] [0.0124] [0.0129] [0.0278] [0.00638] [0.00661] [0.00732] [0.0196]
GDP growth rate 0.598*** 0.634*** 0.657*** 0.198*** 0.441*** 0.454*** 0.514*** 0.258*** 0.580*** 0.616*** 0.643*** 0.197***
[0.00591] [0.00635] [0.00686] [0.0160] [0.0133] [0.0154] [0.0161] [0.0248] [0.00616] [0.00663] [0.00716] [0.0166]
Constant 110.4*** 104.1*** 116.8*** 201.6*** 131.7*** 123.1*** 131.6*** 161.4*** 114.1*** 107.3*** 120.7*** 215.3***
[0.301] [0.283] [0.378] [5.097] [0.901] [0.824] [1.011] [7.688] [0.321] [0.304] [0.406] [5.041]
Observations 3,491,319 3,209,958 2,631,348 281,361 777,010 678,891 585,717 98,119 3,212,424 2,946,899 2,427,282 265,525
R-squared 0.512 0.512 0.510 0.462 0.533 0.533 0.528 0.477 0.517 0.517 0.516 0.473
Firm FE Yes Yes Yes Yes Yes Yes Yes Yes Yes Yes Yes Yes
Year FE Yes Yes Yes Yes Yes Yes Yes Yes Yes Yes Yes Yes
T-Test MSME = Large SME=Large MSME = Large SME=Large MSME = Large SME=Large
p-value 0.000 0.000 0.000 0.000 0.000 0.000
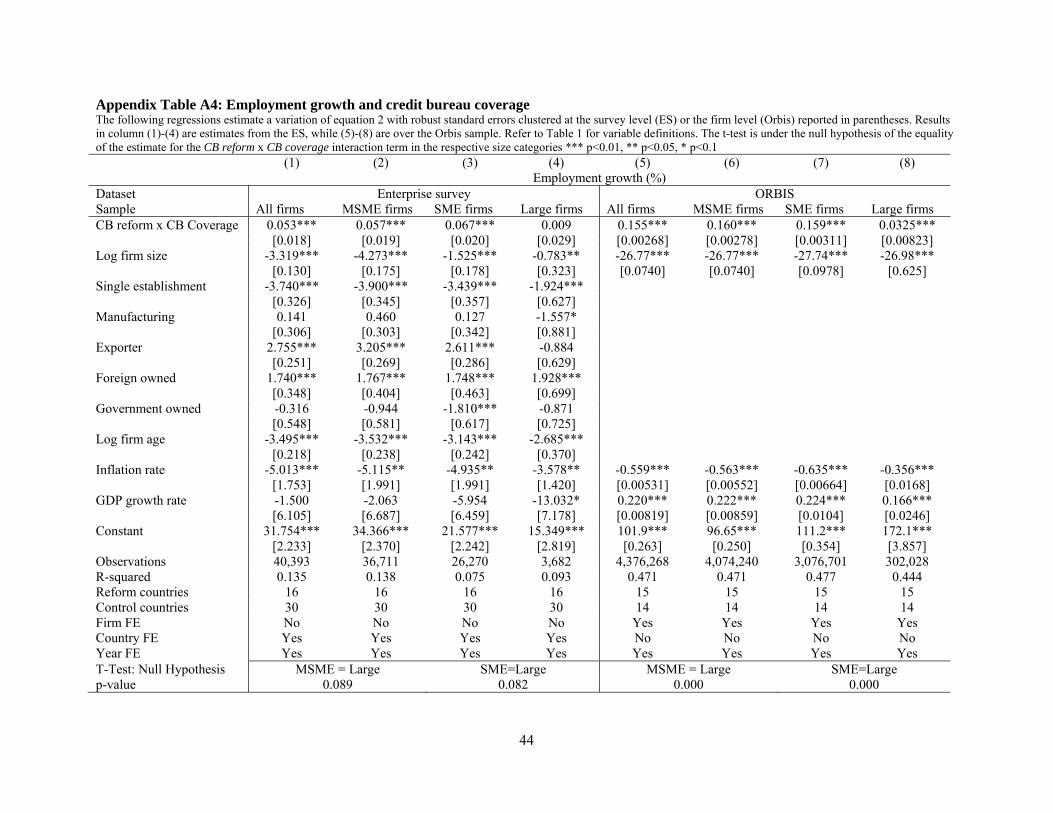
44
Appendix Table A4: Employment growth and credit bureau coverage The following regressions estimate a variation of equation 2 with robust standard errors clustered at the survey level (ES) or the firm level (Orbis) reported in parentheses. Results in column (1)-(4) are estimates from the ES, while (5)-(8) are over the Orbis sample. Refer to Table 1 for variable definitions. The t-test is under the null hypothesis of the equality of the estimate for the CB reform x CB coverage interaction term in the respective size categories *** p<0.01, ** p<0.05, * p<0.1 (1) (2) (3) (4) (5) (6) (7) (8) Employment growth (%) Dataset Enterprise survey ORBIS Sample All firms MSME firms SME firms Large firms All firms MSME firms SME firms Large firms CB reform x CB Coverage 0.053*** 0.057*** 0.067*** 0.009 0.155*** 0.160*** 0.159*** 0.0325***
[0.018] [0.019] [0.020] [0.029] [0.00268] [0.00278] [0.00311] [0.00823] Log firm size -3.319*** -4.273*** -1.525*** -0.783** -26.77*** -26.77*** -27.74*** -26.98***
[0.130] [0.175] [0.178] [0.323] [0.0740] [0.0740] [0.0978] [0.625] Single establishment -3.740*** -3.900*** -3.439*** -1.924***
[0.326] [0.345] [0.357] [0.627] Manufacturing 0.141 0.460 0.127 -1.557*
[0.306] [0.303] [0.342] [0.881] Exporter 2.755*** 3.205*** 2.611*** -0.884
[0.251] [0.269] [0.286] [0.629] Foreign owned 1.740*** 1.767*** 1.748*** 1.928***
[0.348] [0.404] [0.463] [0.699] Government owned -0.316 -0.944 -1.810*** -0.871
[0.548] [0.581] [0.617] [0.725] Log firm age -3.495*** -3.532*** -3.143*** -2.685***
[0.218] [0.238] [0.242] [0.370] Inflation rate -5.013*** -5.115** -4.935** -3.578** -0.559*** -0.563*** -0.635*** -0.356***
[1.753] [1.991] [1.991] [1.420] [0.00531] [0.00552] [0.00664] [0.0168] GDP growth rate -1.500 -2.063 -5.954 -13.032* 0.220*** 0.222*** 0.224*** 0.166***
[6.105] [6.687] [6.459] [7.178] [0.00819] [0.00859] [0.0104] [0.0246] Constant 31.754*** 34.366*** 21.577*** 15.349*** 101.9*** 96.65*** 111.2*** 172.1***
[2.233] [2.370] [2.242] [2.819] [0.263] [0.250] [0.354] [3.857] Observations 40,393 36,711 26,270 3,682 4,376,268 4,074,240 3,076,701 302,028 R-squared 0.135 0.138 0.075 0.093 0.471 0.471 0.477 0.444 Reform countries 16 16 16 16 15 15 15 15 Control countries 30 30 30 30 14 14 14 14 Firm FE No No No No Yes Yes Yes Yes Country FE Yes Yes Yes Yes No No No No Year FE Yes Yes Yes Yes Yes Yes Yes Yes T-Test: Null Hypothesis MSME = Large SME=Large MSME = Large SME=Large p-value 0.089 0.082 0.000 0.000
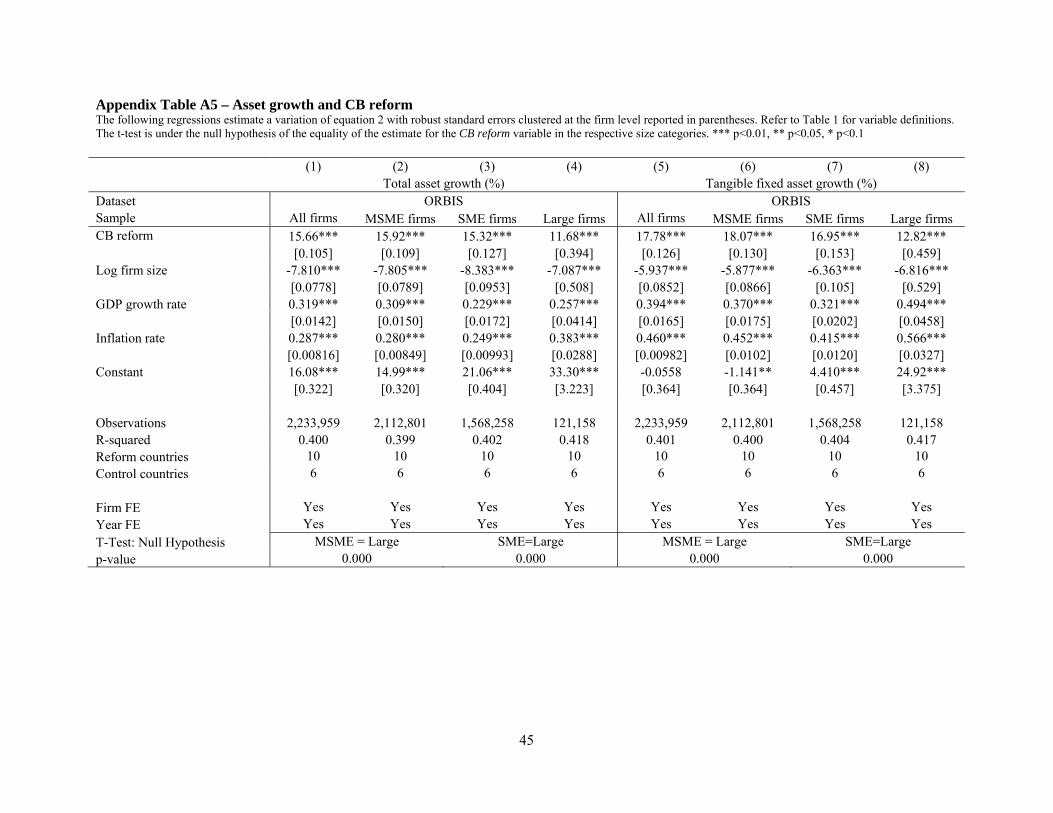
45
Appendix Table A5 – Asset growth and CB reform The following regressions estimate a variation of equation 2 with robust standard errors clustered at the firm level reported in parentheses. Refer to Table 1 for variable definitions. The t-test is under the null hypothesis of the equality of the estimate for the CB reform variable in the respective size categories. *** p<0.01, ** p<0.05, * p<0.1 (1) (2) (3) (4) (5) (6) (7) (8)
Total asset growth (%) Tangible fixed asset growth (%) Dataset ORBIS ORBIS Sample All firms MSME firms SME firms Large firms All firms MSME firms SME firms Large firms CB reform 15.66*** 15.92*** 15.32*** 11.68*** 17.78*** 18.07*** 16.95*** 12.82*** [0.105] [0.109] [0.127] [0.394] [0.126] [0.130] [0.153] [0.459] Log firm size -7.810*** -7.805*** -8.383*** -7.087*** -5.937*** -5.877*** -6.363*** -6.816*** [0.0778] [0.0789] [0.0953] [0.508] [0.0852] [0.0866] [0.105] [0.529] GDP growth rate 0.319*** 0.309*** 0.229*** 0.257*** 0.394*** 0.370*** 0.321*** 0.494*** [0.0142] [0.0150] [0.0172] [0.0414] [0.0165] [0.0175] [0.0202] [0.0458] Inflation rate 0.287*** 0.280*** 0.249*** 0.383*** 0.460*** 0.452*** 0.415*** 0.566*** [0.00816] [0.00849] [0.00993] [0.0288] [0.00982] [0.0102] [0.0120] [0.0327] Constant 16.08*** 14.99*** 21.06*** 33.30*** -0.0558 -1.141** 4.410*** 24.92*** [0.322] [0.320] [0.404] [3.223] [0.364] [0.364] [0.457] [3.375] Observations 2,233,959 2,112,801 1,568,258 121,158 2,233,959 2,112,801 1,568,258 121,158 R-squared 0.400 0.399 0.402 0.418 0.401 0.400 0.404 0.417 Reform countries 10 10 10 10 10 10 10 10 Control countries 6 6 6 6 6 6 6 6
Firm FE Yes Yes Yes Yes Yes Yes Yes Yes Year FE Yes Yes Yes Yes Yes Yes Yes Yes T-Test: Null Hypothesis MSME = Large SME=Large MSME = Large SME=Large p-value 0.000 0.000 0.000 0.000

46
Appendix Table A6: Employment growth and credit bureau reform – manufacturing firms only The following regressions estimate equation 2 with robust standard errors clustered at the firm level reported in parentheses. Refer to Table 1 for variable definitions. The t-test is under the null hypothesis of the equality of the estimate for the CB reform variable in the respective size categories *** p<0.01, ** p<0.05, * p<0.1 (1) (2) (3) (4)
Employment growth (%) Dataset ORBIS Sample All firms MSME firms SME firms Large firms CB reform 1.973*** 2.102*** 1.622*** 0.109
[0.133] [0.143] [0.155] [0.287] Log firm size -30.32*** -30.09*** -31.99*** -32.96*** [0.173] [0.175] [0.212] [0.824] Inflation rate -0.528*** -0.542*** -0.566*** -0.327*** [0.0112] [0.0120] [0.0136] [0.0285] GDP growth rate 0.224*** 0.213*** 0.264*** 0.245***
[0.0175] [0.0197] [0.0222] [0.0361] Constant 132.5*** 122.0*** 135.1*** 209.7***
[0.726] [0.682] [0.853] [5.153]
Observations 1,496,106 1,292,034 1,145,890 204,072 R-squared 0.457 0.456 0.464 0.462
Firm FE Yes Yes Yes Yes Year FE Yes Yes Yes Yes T-Test: Null Hypothesis MSME = Large SME=Large p-value 0.000 0.000