Embed Size (px)
Citation preview

Victorian Auditor-General’s Report October 2010 2010-11:13
Access to Ambulance Services
Access to A
mbulance S
ervices2010
-11:13O
ctob
er 2010
Level 2435 Collins StreetMelbourne Vic. 3000
Telephone 61 3 8601 7000Facsimile 61 3 8601 7010www.audit.vic.gov.au


V I C T O R I A
Victorian Auditor-General
Access to Ambulance Services
Ordered to be printed
VICTORIAN GOVERNMENT PRINTER
October 2010
PP No 384, Session 2006–10

ISBN 978 1 921650 59 8
This report has been produced to ISO14001 environmental standards. It is printed on FSC credited Novatech Satin & Media Print Silk paper. The print supplier, Blue Star PRINT has initiated an EMS promoting minimisation of environmental impact through the deployment of efficient technology, rigorous quality management procedures and a philosophy of reduce, re-use and recycle.

Victorian Auditor-General’s Report Access to Ambulance Services iii
The Hon. Robert Smith MLC The Hon. Jenny Lindell MP President Speaker Legislative Council Legislative Assembly Parliament House Parliament House Melbourne Melbourne
Dear Presiding Officers
Under the provisions of section 16AB of the Audit Act 1994, I transmit my performance report on Access to Ambulance Services.
Yours faithfully
D D R PEARSON Auditor-General
6 October 2010


Victorian Auditor-General’s Report Access to Ambulance Services v
Contents
Audit summary............................................................................................vii Conclusions ............................................................................................................ vii
Findings ................................................................................................................. viii
Recommendations....................................................................................................x
Submissions and comments received ......................................................................x
1. Background ............................................................................................1 1.1 Introduction...................................................................................................... 1
1.2 Ambulance Victoria ......................................................................................... 1
1.3 Other agencies................................................................................................ 5
1.4 Response times and performance measures ................................................. 6
1.5 Audit objectives and scope ............................................................................. 7
1.6 Audit cost......................................................................................................... 7
1.6 Report structure............................................................................................... 7
2. Responsiveness of ambulance services...................................................9 2.1 Introduction.................................................................................................... 10
2.2 Conclusions................................................................................................... 10
2.3 Emergency response time trends.................................................................. 11
2.4 Service demand trends ................................................................................. 16
2.5 Ambulance staff trends.................................................................................. 18
2.6 Case times and handover time at hospitals .................................................. 20
Contents
vi Access to Ambulance Services Victorian Auditor-General’s Report
3. Resource management .........................................................................23
3.1 Introduction.................................................................................................... 24
3.2 Conclusions................................................................................................... 24
3.3 Strategic allocation of ambulance staff.......................................................... 25
3.4 Operational allocation of ambulance staff ..................................................... 28
3.5 Financial resources ....................................................................................... 35
3.6 Ambulance Victoria’s demand management strategy................................... 36
3.7 Organisational culture and practice............................................................... 36
4. Performance measurement framework...................................................41 4.1 Introduction.................................................................................................... 42
4.2 Ambulance services performance indicators................................................. 42
4.3 Conclusions................................................................................................... 44
4.4 Relevance ..................................................................................................... 44
4.5 Appropriateness ............................................................................................ 47
4.6 Reliability of reported performance ............................................................... 53
Appendix A. Ambulance response times, by responding branch ................57
Appendix B. Ambulance response times, by local government area...........69
Appendix C. Ambulance response times for urban centres/localities ..........73
Appendix D. Audit Act 1994 section 16—submissions and comments.......83

Victorian Auditor-General’s Report Access to Ambulance Services vii
Audit summary Ambulance services are an integral part of the health system. While quality of care provided by paramedics is paramount, the outcome for a patient may also be affected by the time taken to respond to an emergency.
Recently there has been concern from some quarters in the community that ambulance response times have been increasing. There is also a view that this perceived deterioration is linked to the amalgamation of metropolitan and rural ambulance services on 1 July 2008.
This audit focuses on ambulance responsiveness, particularly response times to Code 1 incidents, potentially time critical emergencies where ambulance lights and sirens are used to reduce travel time. The audit looked at data for the last six years as well as the circumstances in which Ambulance Victoria (AV) operates, in order to understand the service’s performance. It also examined whether the information the community is getting about ambulance response times is reliable and presented so as to be clear and meaningful.
Conclusions As with any merger, the amalgamation of metropolitan and rural ambulance services into AV posed risks. For example, expected new synergies might not occur and the different businesses might not be able to work together because systems are incompatible, for cultural or structural reasons, or simply because people resist change.
While AV has achieved much since amalgamation—including moving towards ‘state-of-the-art’ call taking and dispatch for the whole state, and greatly improving strategic planning for rural regions—a number of challenges exist that have yet to be resolved.
The time between the announcement of the merger and its implementation was short and only limited funds were provided to systematically deal with any cultural issues.
Some expected efficiencies have not been realised and the trend of deteriorating ambulance response times evident prior to amalgamation has not been arrested. Ambulances are taking longer to respond to Code 1 emergencies, with the worst performance since 2004–05 recorded in 2009–10. Response times have worsened more in rural regions than in the metropolitan area, and increased funding of $185.7 million over four years from 2008–09 has so far not led to demonstrable improvement.

Audit summary
viii Access to Ambulance Services Victorian Auditor-General’s Report
It is likely the significant increase in demand for emergency services in the past six years has caused most of the increase in response time. To the extent that amalgamation and extra operational funding was intended to avoid this, this has not succeeded.
This points to unfinished work from the amalgamation, particularly addressing cultural issues that have persisted from Rural Ambulance Victoria, and in bedding down more sophisticated resource allocation in regional and rural areas. New funding provided by the Department of Health (DH) also needs to be better aligned with AV operational priorities.
Greater transparency in reporting response time performance and disclosing area-specific targets that take account of geography and branch staffing is needed to better inform the public about the level of service it can realistically expect. The present reporting of state-wide measures omits the level of detail necessary to give this understanding.
Findings
Response time performance Performance data shows that ambulance response times have worsened in both metropolitan and regional areas over the last six years. Despite these trends the standard of responsiveness compares favourably with other states. Benchmark data shows that Victoria performs slightly better than New South Wales, its most closely comparable jurisdiction. Notably, no other jurisdiction reports higher quality care to patients.
Metropolitan areas continue to get a more timely service than rural regions. In metropolitan areas, the average response time has risen from just under 10 to almost 11 minutes. In rural regions the average response time increase is greater, shifting from 13 minutes in 2004–05 to 15 minutes in 2009–10. Although small, these rises can make an important difference in those urgent cases where hospital care is vital to recovery.
Response time performance declines as population density reduces and travel distances for paramedics increase. Performance for population centres with fewer than 7 500 people is significantly worse than for larger communities.
There is no credible evidence that the merger of metropolitan and rural services adversely affected performance, as there was a pattern of longer Code 1 response times well before amalgamation. However, it is clear that amalgamation has not yielded the expected improvements in service response times.
Audit summary
Victorian Auditor-General’s Report Access to Ambulance Services ix
The task of providing a timely service throughout the state is challenging, given the travel distances, the unpredictability of when and where emergencies occur and the numbers of paramedic staff available in smaller communities. AV cannot realistically offer similar response times across the state, but it does strive for equity by working to give a similar level of response to communities of similar size. Nevertheless, it struggles to achieve this goal, with disparities in average response time evident in similar populations.
Impacts on performance Many factors affect AV’s responsiveness, only some of which are within its control. It now has sound techniques to strategically deploy its paramedic staff and fleet resources. This is a major improvement on past methods of allocating rural and regional resources, which depended on relatively unsophisticated tools, compared with the metropolitan area.
This deficiency is now being remedied, and rural and regional areas will both benefit from a more highly developed strategic resource allocation model, as well as new technology that will dispatch ambulances as efficiently as in the metropolitan area.
However, AV is not funded to add the staff needed to improve performance. Although it raises funds directly through fees and membership levies, 59.5 per cent of its revenue is from DH.
DH’s most recent new funding commitment of $55.5 million included $30.6 million for additional paramedics and directed where they should be located. However, this direction did not align with AV’s strategic and operational priorities for where new staff were needed and the type of staff needed. Demand and staffing are not adequately balanced, particularly in rural regions where growth in paramedic numbers has not kept pace with growth in caseload.
AV is also facing increasing demands from higher caseload numbers. The ageing population and the increase in chronic disease are factors driving demand, with Code 1 incidents rising by around 9 per cent across the state in the past three years.
Average case times are also increasing across the state, often as a result of longer time spent in hospital emergency departments. The combination of more cases and longer case times means paramedics are less available to take on new calls and this flows on to extend response times.
AV needs to address its organisational culture where problems with morale exist and where staff feel disconnected from decision-making. These issues are affecting performance in some locations. Many of these issues existed in the former Rural Ambulance Victoria, and have not been resolved by the amalgamation.

Audit summary
x Access to Ambulance Services Victorian Auditor-General’s Report
Reporting performance to the community Although AV's performance indicators are relevant, the timeliness measures do not fairly represent the geographical variations in actual performance. The public would better understand the expected ambulance response times in their district if AV published more detailed data, in line with its internal measures and targets.
Consolidated reporting of total case times by DH, and of each component of case time would help clarify accountability and highlight systemic issues that are not evident in the current suite of health service performance measures.
Recommendations Number Recommendation Page
1. That the Department of Health reconciles new funding with Ambulance Victoria’s strategic priorities, to identify and quantify any unmet resource needs.
39
2. That Ambulance Victoria further develops its system-wide approach to better integrate both metropolitan and rural regions’ needs in its strategic planning.
39
3. That Ambulance Victoria continues to review rosters and staffing levels in rural regions to minimise recall of paramedics.
39
4. That Ambulance Victoria implements a comprehensive strategy to drive its work on improving organisational culture.
39
5. That Ambulance Victoria publicly reports a comprehensive suite of response time indicators, including: • national measures of response times at the 50th and 90th
percentiles • a breakdown of performance by region/locality.
56
6. That the Department of Health reports on performance for total case time, broken down by the elements attributable to the Emergency Services Telecommunications Authority, Ambulance Victoria, and hospitals.
56
Submissions and comments received In addition to progressive engagement during the course of the audit, in accordance with section 16(3) of the Audit Act 1994 a copy of this report, or relevant extracts from the report, was provided to the Department of Health, Emergency Services Telecommunications Authority and Ambulance Victoria with a request for submissions or comments.
Agency views have been considered in reaching our audit conclusions and are represented to the extent they are relevant and warranted in preparing this report. Their full section 16(3) submissions and comments are included in Appendix D.

Victorian Auditor-General’s Report Access to Ambulance Services 1
1 Background
1.1 Introduction Ambulance services are an integral part of the health system. They provide initial care and emergency transport of ill or injured persons to hospital and non-emergency transport to help people access health services. They manage and respond to major incidents and also offer community education.
The effectiveness of emergency ambulance services directly relates to patient outcomes. The timeliness and quality of clinical care administered by paramedics, and the speed with which a patient reaches hospital can affect a patient’s chances of recovery. Accordingly, ambulance service performance is measured by response times, by how well paramedics follow clinical protocols, and the results for patients. Good performance requires resources, such as paramedics and vehicles, allocated according to need.
This audit focuses on emergency ambulance services, examining response time performance, and how resources are used to support performance.
1.2 Ambulance Victoria Ambulance Victoria (AV) is the sole provider of emergency ambulance services in Victoria. In 2009–10, AV responded to 459 631 emergency incidents, an average of 1 259 each day. Around 72 per cent occurred in the metropolitan area and 28 per cent in the rural regions. In 2009–10, AV received $333.3 million in government funds, $103.9 million in revenue from transport fees, and $90.2 million from membership fees. Total revenue from operating activities was $503.7 million.
There is increasing demand for emergency ambulance services due to a range of factors, including the ageing population and higher rates of chronic disease. Since 1999-2000, emergency incidents have risen more than 50 per cent.
As well as providing emergency response, AV is responsible for non-urgent patient transport, such as when a patient needs to be moved from one hospital to another. In metropolitan areas, all non-urgent patient transfer work that requires a stretcher is contracted out. In rural regions, these transports are principally undertaken by either contracted providers or AV emergency resources.

Background
2 Access to Ambulance Services Victorian Auditor-General’s Report
Amalgamation AV was created by the amalgamation of the Metropolitan Ambulance Service, Rural Ambulance Victoria and the Alexandra District Ambulance Service from July 2008. The amalgamation aimed for a single, integrated organisation to improve service. Work to merge the three organisations has involved more than 40 separate projects, including: • creation of a new organisational structure and management group • cultural realignment to merge the previous metropolitan and rural organisations • implementing single systems for areas such as payroll and information
management • establishing consistent procedures, such as dispatch protocols.
Major achievements since amalgamation have included commencing transition of rural regions to the state-of-the-art call taking and dispatch system used in Melbourne, developing strong strategic planning for rural and regional Victoria and the tendering of non-emergency patient transfer services in rural regions.
Work to complete and consolidate the amalgamation is ongoing.
Response locations At 30 June 2010, AV had 250 ambulance branches in the state. Figures 1A and 1B show the locations by rural regions and the metropolitan area respectively.
Figure 1A Ambulance Victoria rural branches
Source: Ambulance Victoria.

Background
Victorian Auditor-General’s Report Access to Ambulance Services 3
As Figure 1B shows in the metropolitan area AV had: • 58 branches with 24-hour emergency ambulance teams, many with additional
units during periods of peak ambulance demand • 15 branches that only operate during periods of peak ambulance demand • 4 branches on the urban fringe providing 24-hour coverage, but operating on call
overnight • 16 Mobile Intensive Care Ambulance (MICA) branches and four single
responders that can provide patient assessment and care but cannot transfer patients.
Figure 1B Ambulance Victoria metropolitan branches
Source: Ambulance Victoria.
Background
4 Access to Ambulance Services Victorian Auditor-General’s Report
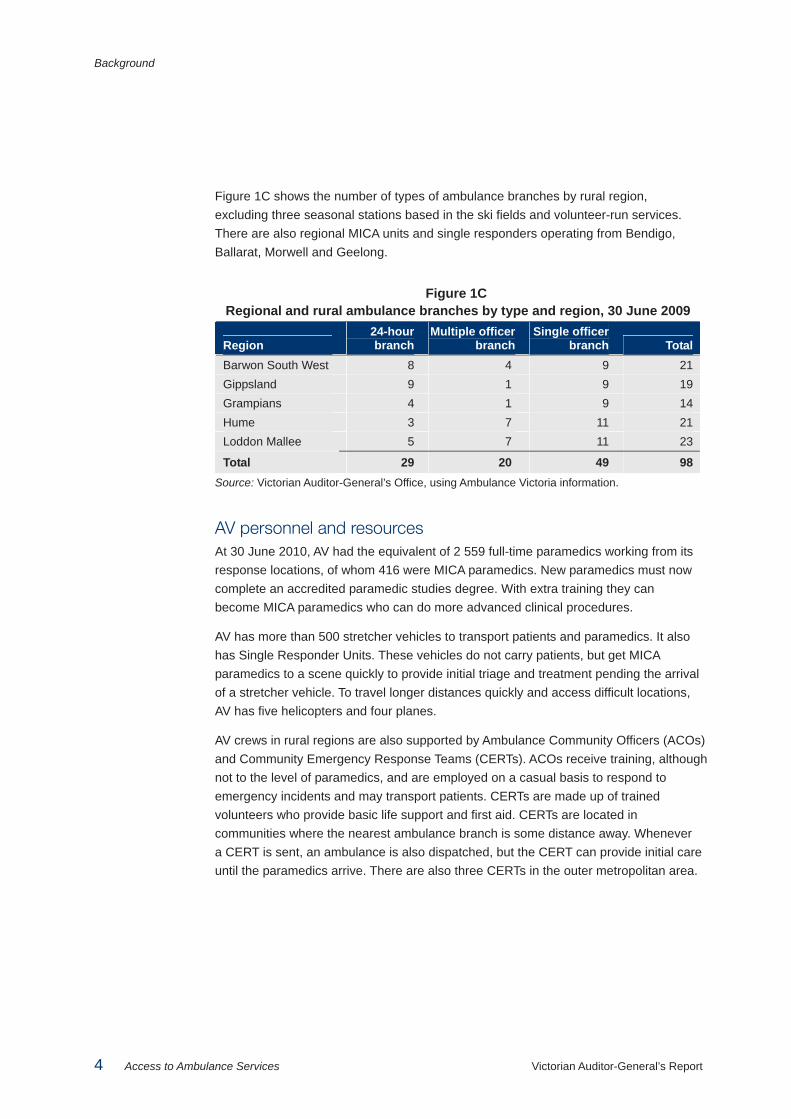
Figure 1C shows the number of types of ambulance branches by rural region, excluding three seasonal stations based in the ski fields and volunteer-run services. There are also regional MICA units and single responders operating from Bendigo, Ballarat, Morwell and Geelong.
Figure 1C Regional and rural ambulance branches by type and region, 30 June 2009
Region 24-hour branch
Multiple officer branch
Single officer branch Total
Barwon South West 8 4 9 21 Gippsland 9 1 9 19 Grampians 4 1 9 14 Hume 3 7 11 21 Loddon Mallee 5 7 11 23
Total 29 20 49 98 Source: Victorian Auditor-General’s Office, using Ambulance Victoria information.
AV personnel and resources At 30 June 2010, AV had the equivalent of 2 559 full-time paramedics working from its response locations, of whom 416 were MICA paramedics. New paramedics must now complete an accredited paramedic studies degree. With extra training they can become MICA paramedics who can do more advanced clinical procedures.
AV has more than 500 stretcher vehicles to transport patients and paramedics. It also has Single Responder Units. These vehicles do not carry patients, but get MICA paramedics to a scene quickly to provide initial triage and treatment pending the arrival of a stretcher vehicle. To travel longer distances quickly and access difficult locations, AV has five helicopters and four planes.
AV crews in rural regions are also supported by Ambulance Community Officers (ACOs) and Community Emergency Response Teams (CERTs). ACOs receive training, although not to the level of paramedics, and are employed on a casual basis to respond to emergency incidents and may transport patients. CERTs are made up of trained volunteers who provide basic life support and first aid. CERTs are located in communities where the nearest ambulance branch is some distance away. Whenever a CERT is sent, an ambulance is also dispatched, but the CERT can provide initial care until the paramedics arrive. There are also three CERTs in the outer metropolitan area.

Background
Victorian Auditor-General’s Report Access to Ambulance Services 5
1.3 Other agencies In addition to AV, the Department of Health (DH) and the Emergency Services Telecommunications Authority (ESTA) play key roles in supporting ambulance services.
1.3.1 Department of Health DH is responsible for setting policy direction for ambulance services, allocating funding and monitoring performance. This is set out in the department’s Ambulance Services Policy and funding guidelines. This annual document describes policy objectives for the ambulance services program, funding for service delivery, capital and equipment, and a performance and accountability framework.
The Minister for Health and AV agree on the Statement of Priorities for each year. This describes how AV is accountable for compliance with the policy and funding guidelines. The 2009–10 Statement of Priorities also sets out strategic priorities and deliverables with performance indicators that have benchmarks and targets focusing on: • financial performance • timely responses • service volumes • quality and safety.
1.3.2 Emergency Services Telecommunications Authority ESTA receives emergency calls from the national Triple Zero (000) service then sends out the emergency service required, which may be police, fire services, ambulance or a combination. ESTA dispatches ambulances in the metropolitan area and has recently started ambulance call taking and dispatch services for the Hume and Gippsland rural regions. By the end of June 2011, ESTA is expected to take ambulance calls and dispatch services for the whole state.
Until the remaining call taking and dispatch services transfer to ESTA, two AV operation centres will continue to undertake emergency call taking and dispatch services for the state’s three other rural regions.
Call takers use protocols specified by AV to determine the need and the urgency for an ambulance. The urgency is reflected in the dispatch code: • Code 1—a time critical case with a ‘lights and sirens’ response, such as a cardiac
arrest or serious traffic accident • Code 2—an acute but non time critical response without lights and sirens, such
as a broken leg • Code 3—a non-urgent routine case, such as a person with ongoing back pain but
no recent injury, and non-emergency patient transports.
The Office of the Emergency Services Commissioner, in the Department of Justice, monitors the performance of ESTA.
Background
6 Access to Ambulance Services Victorian Auditor-General’s Report
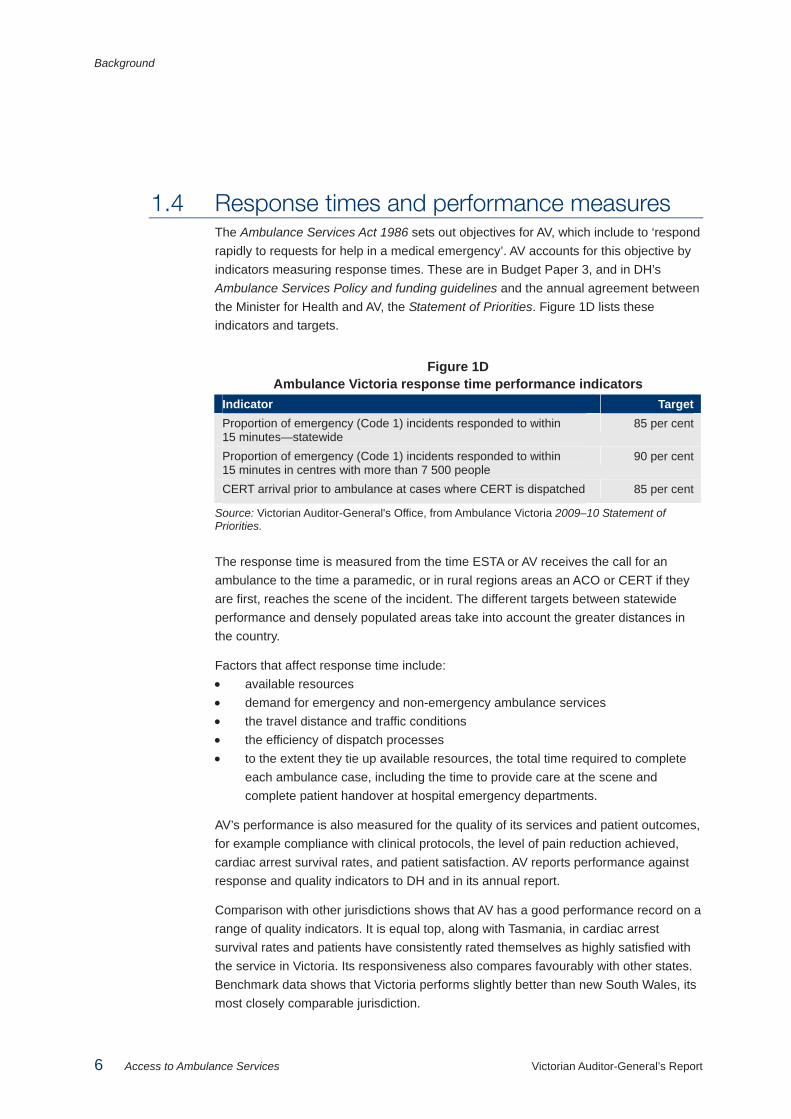
1.4 Response times and performance measures The Ambulance Services Act 1986 sets out objectives for AV, which include to ‘respond rapidly to requests for help in a medical emergency’. AV accounts for this objective by indicators measuring response times. These are in Budget Paper 3, and in DH’s Ambulance Services Policy and funding guidelines and the annual agreement between the Minister for Health and AV, the Statement of Priorities. Figure 1D lists these indicators and targets.
Figure 1D Ambulance Victoria response time performance indicators
Indicator Target Proportion of emergency (Code 1) incidents responded to within 15 minutes—statewide
85 per cent
Proportion of emergency (Code 1) incidents responded to within 15 minutes in centres with more than 7 500 people
90 per cent
CERT arrival prior to ambulance at cases where CERT is dispatched 85 per cent
Source: Victorian Auditor-General's Office, from Ambulance Victoria 2009–10 Statement of Priorities.
The response time is measured from the time ESTA or AV receives the call for an ambulance to the time a paramedic, or in rural regions areas an ACO or CERT if they are first, reaches the scene of the incident. The different targets between statewide performance and densely populated areas take into account the greater distances in the country.
Factors that affect response time include: • available resources • demand for emergency and non-emergency ambulance services • the travel distance and traffic conditions • the efficiency of dispatch processes • to the extent they tie up available resources, the total time required to complete
each ambulance case, including the time to provide care at the scene and complete patient handover at hospital emergency departments.
AV’s performance is also measured for the quality of its services and patient outcomes, for example compliance with clinical protocols, the level of pain reduction achieved, cardiac arrest survival rates, and patient satisfaction. AV reports performance against response and quality indicators to DH and in its annual report.
Comparison with other jurisdictions shows that AV has a good performance record on a range of quality indicators. It is equal top, along with Tasmania, in cardiac arrest survival rates and patients have consistently rated themselves as highly satisfied with the service in Victoria. Its responsiveness also compares favourably with other states. Benchmark data shows that Victoria performs slightly better than new South Wales, its most closely comparable jurisdiction.

Background
Victorian Auditor-General’s Report Access to Ambulance Services 7
1.5 Audit objectives and scope The audit objective was to determine whether ambulance services are sufficiently accessible and appropriately responsive, focusing on: • indicator data and assessment of performance trends in response times • distribution of resources and impact on service responsiveness.
The sub-objectives were: • to determine Ambulance Victoria’s performance in response times, considering
the reliability of performance data and relevance of indicators and targets • to determine whether resource use offers equitable access and optimal
responsiveness.
The audit scope included: • Ambulance Victoria, including its rural offices and branches • the Department of Health • the Emergency Services Telecommunications Authority.
Part of the evidence gathering process included consultations with AV staff in Loddon Mallee, Grampians and Gippsland regions. Submissions were also received from the public.
The audit was performed in accordance with Australian Auditing and Assurance Standards.
The cooperation of AV staff with the audit process was commendable and appreciated, particularly their timely response to information requests.
1.6 Audit cost The cost of the audit was $370 000.
1.7 Report structure The rest of this report is structured as follows: • Part 2—Responsiveness of ambulance services—this part analyses the
performance of Victorian ambulance services before and after the July 2008 amalgamation.
• Part 3—Resource management—this part analyses how well AV manages the strategic and operational use of its resources to meet its objectives.
• Part 4—Performance measurement framework—this part analyses whether AV uses and reports relevant and appropriate performance measures that fairly represent actual performance.


Victorian Auditor-General’s Report Access to Ambulance Services 9
2 Responsiveness of ambulance services
At a glance Background Ambulance Victoria (AV) has a mandate to respond rapidly to requests for help in a medical emergency. The time that an ambulance takes to attend the scene of an emergency can make a major difference to a patient’s chances of recovery.
Conclusions Responsiveness to Code 1 incidents has declined over the past six years. While performance continues to be better in the metropolitan area than rural and regional areas, response times have increased for both.
The amalgamation between the Metropolitan Ambulance Service, Rural Ambulance Victoria, and Alexandra District Ambulance Service on 1 July 2008 has had no obvious effect, in either improving or worsening the trends.
Findings • Over the past six years in both metropolitan and regional areas the average time
taken to respond to a Code 1 incident has risen. Over the past three years the difference in average response times between the two has widened, with regional responses now more than four minutes longer on average.
• AV is not meeting its publicly reported responsiveness targets, with 2009–10 performance the worst since 2004–05.
• In 2009–10, AV responded to 87 per cent of Code 1 incidents within 15 minutes in population centres of more than 7 500 people, compared with 51 per cent within 15 minutes, in areas with populations under 7 500.
• There is a clear correlation between the decline in service responsiveness and increased demand for services, as measured by case load.
• Growth in paramedic numbers has not kept pace with demand in regional areas. • The average time to finalise a case has also increased over the period, due
largely to increased handover times at hospital emergency departments.

Responsiveness of ambulance services
10 Access to Ambulance Services Victorian Auditor-General’s Report
2.1 Introduction The amalgamation of the Metropolitan Ambulance Service, Rural Ambulance Victoria and Alexandra District Ambulance Service on 1 July 2008 to form Ambulance Victoria (AV) was intended to improve performance across the state. On top of AV’s $494.4 million annual budget, additional funding of $185.7 million over four years was provided at the time of the amalgamation for new response resources, primarily for the metropolitan area.
Recently there has been public comment that since the merger, the responsiveness of ambulance services in regional Victoria has declined. Public debate and several case studies have focused on the responsiveness of the service, particularly in country areas.
In this chapter we examine AV’s responsiveness over the past six years, comparing both pre- and post-amalgamation trends. In considering this data, it is important to note that the data source for metropolitan reporting changed in July 2007, and performance from 2007–08 onwards is not strictly comparable with earlier performance. However, the overall picture is clear.
To determine whether, and to what extent, there has been a decline in performance, we analysed trends in ambulance performance since 2004–05 using the two publicly reported targets: • statewide—respond to 85 per cent of Code 1 incidents within 15 minutes • population centres with more than 7 500 people—respond to 90 per cent of
Code 1 incidents within 15 minutes.
To better understand performance AV’s Code 1 response time performance is represented using: • the average time to respond to all Code 1 incidents • the 50th percentile, which refers to the longest response time for 50 per cent of
Code 1 incidents • the 90th percentile, which refers to the longest response time for 90 per cent of
Code 1 incidents.
Response times for each ambulance branch for 2009–10 are listed in Appendix A.
2.2 Conclusions Performance in responding to Code 1 incidents has declined over the past six years, notwithstanding a small improvement in 2008–09 following funding for additional response resources. Performance is better in metropolitan areas than in regional areas but both show negative trends, with performance in 2009–10 the worst.

Responsiveness of ambulance services
Victorian Auditor-General’s Report Access to Ambulance Services 11
There has been no sustained change in this trend since the amalgamation. Decline was evident from 2005–06 and has continued since amalgamation. It is also evident during this period that demand for emergency services has grown rapidly, and that average case times have increased.
The rate of growth in paramedic numbers, relative to demand, has been greater in metropolitan than regional Victoria, both before and after amalgamation, reflecting relative funding priorities.
To the extent that the amalgamation was intended to address the decline in response time performance this aim has yet to be achieved.
2.3 Emergency response time trends
2.3.1 Statewide trends The average time AV takes to respond to a Code 1 incident across the state has risen over the past six years as shown in Figure 2A. In 2009–10, AV’s average response time was 12.1 minutes, 1.5 minutes higher than the 2004–05 average.
Figure 2A Statewide average response time for Code 1 incidents
Source: Victorian Auditor-General's Office.
0
2
4
6
8
10
12
14
2004–05 2005–06 2006–07 2007–08 2008–09 2009–10Year
Minutes
Responsiveness of ambulance services
12 Access to Ambulance Services Victorian Auditor-General’s Report
Averages alone cannot provide a complete picture of performance. The spread, or range, of response times is also important, particularly given the time criticality of most emergency responses. The spread of response times can be understood in terms of the proportion of cases that fall above and below a target ‘percentile’. The stated response time for the 85th percentile for example, tells the reader that 85 per cent of all response times were at or below this figure.
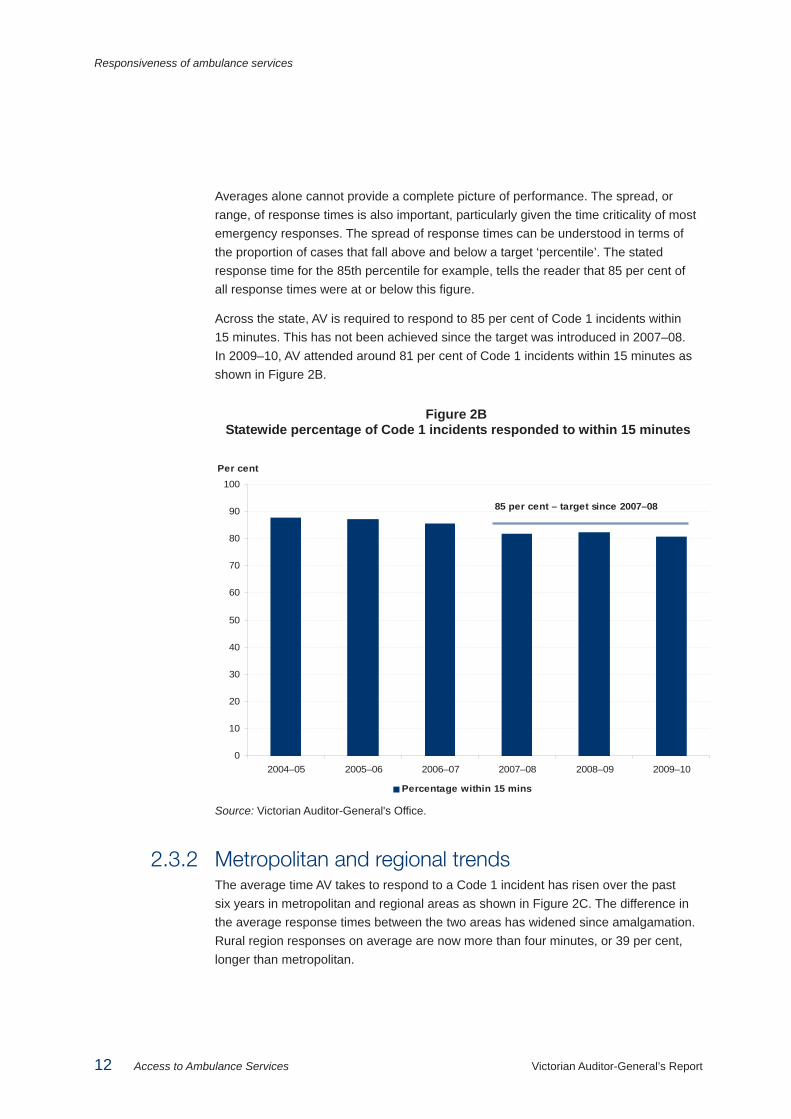
Across the state, AV is required to respond to 85 per cent of Code 1 incidents within 15 minutes. This has not been achieved since the target was introduced in 2007–08. In 2009–10, AV attended around 81 per cent of Code 1 incidents within 15 minutes as shown in Figure 2B.
Figure 2B Statewide percentage of Code 1 incidents responded to within 15 minutes
Source: Victorian Auditor-General's Office.
2.3.2 Metropolitan and regional trends The average time AV takes to respond to a Code 1 incident has risen over the past six years in metropolitan and regional areas as shown in Figure 2C. The difference in the average response times between the two areas has widened since amalgamation. Rural region responses on average are now more than four minutes, or 39 per cent, longer than metropolitan.
0
10
20
30
40
50
60
70
80
90
100
2004–05 2005–06 2006–07 2007–08 2008–09 2009–10
Per cent
Percentage within 15 mins
85 per cent – target since 2007–08

Responsiveness of ambulance services
Victorian Auditor-General’s Report Access to Ambulance Services 13
Figure 2C Metropolitan and rural regions average response times (minutes)
2004–05 2005–06 2006–07 2007–08 2008–09 2009–10 Metropolitan 9.88 9.86 10.26 10.86 10.50 10.88 Rural regions 13.01 13.91 14.03 14.58 14.68 15.07 Difference 3.13 4.05 3.77 3.72 4.18 4.19
Source: Victorian Auditor-General's Office.
Response times to Code 1 incidents also differ significantly for the following two population groups: • population centres with more than 7 500 people (82 per cent of the population) • population centres with 7 500 people or fewer (18 per cent of the population).
AV’s target is to respond to 90 per cent of Code 1 incidents within 15 minutes in population centres with more than 7 500 people. However, performance has steadily declined from just over 90 per cent in 2004–05 to 87 per cent in 2009–10.
While AV has not met the benchmark, its performance for this population group is far better than for population centres with fewer than 7 500 people. Performance in these areas has also steadily declined since 2004–05 and in 2009–10, AV responded to less than 51 per cent of Code 1 incidents within 15 minutes, as shown in Figure 2D.
Figure 2D Percentage of Code 1 incidents responded to within 15 minutes
Source: Victorian Auditor-General's Office.
While not publicly reported, AV has an internal benchmark to respond to 75 per cent of Code 1 incidents in rural regions within 15 minutes. This has not been achieved in any of these regions for the five years from 2005–06.
0
10
20
30
40
50
60
70
80
90
100
2004–05 2005–06 2006–07 2007–08 2008–09 2009–10
Per cent
Centres with more than 7 500 people Centres with 7 500 people or less

Responsiveness of ambulance services
14 Access to Ambulance Services Victorian Auditor-General’s Report
In the last six years, response times have increased in each of the regions. While the performance in Hume has improved in the last three years, it has the lowest proportion of Code 1 incidents responded to within 15 minutes, at 65 per cent in 2009–10.
Performance in the metropolitan area shows a similar overall decline. Performance for all regions is shown in Figure 2E.
Figure 2E Percentage of regional Code 1 responses within 15 minutes,
metropolitan area and rural regions
0
10
20
30
40
50
60
70
80
90
100
Metropolitan Barwon SouthWest
Gippsland Grampians Hume Loddon Mallee
Per cent
2004–05 2005–06 2006–07 2007–08 2008–09 2009–10
Source: Victorian Auditor-General's Office.
2.3.3 Percentile analysis Across the state, AV’s response times at the 50th percentile increased slightly, with 50 per cent of cases responded to within 10 minutes in 2009–10, compared with 9 minutes in 2004–05.
However, time taken at the 90th percentile over this period has increased at a faster rate. In 2009–10, AV responded to 90 per cent of Code 1 incidents within 20 minutes, compared with 17 minutes in 2004–05, as shown in Figure 2F. The clear inference is that more cases are taking longer to respond to now, than in 2004–05, and that this has worsened for the 50 per cent of cases that take 10 minutes or more to respond to.

Responsiveness of ambulance services
Victorian Auditor-General’s Report Access to Ambulance Services 15
Figure 2F Statewide response times (minutes) at the 50th and 90th percentiles
Source: Victorian Auditor-General's Office.
Figure 2G shows metropolitan and rural region response times. Response times in the metropolitan area are similar to the statewide trend, with 50 per cent of cases responded to within 9 to 10 minutes. Performance at the 90th percentile is better, with 90 per cent of Code 1 incidents in 2009–10 responded to in 16.6 minutes.
In contrast, AV responded to 90 per cent of Code 1 incidents in rural regions within 26 minutes in 2009–10.
Figure 2G Metropolitan area and rural regions response times (minutes)
at the 50th and 90th percentiles 2004–05 2005–06 2006–07 2007–08 2008–09 2009–10 Metropolitan 50th percentile 9.00 9.00 9.00 9.58 9.33 9.62 90th percentile 15.00 15.00 15.00 16.50 15.85 16.55 Rural regions 50th percentile 10.00 11.00 11.00 12.00 12.00 12.00 90th percentile 24.00 25.00 25.00 26.00 26.00 26.00
Note: Ambulance Victoria changed its basis of measurement in 2007–08 and estimates that this increased the reported 90th percentile result in the metropolitan area from 16.0 to 16.55 minutes, meaning that the results to 2006–07 are not directly comparable with the later results. Source: Victorian Auditor-General's Office.
0
5
10
15
20
25
2004–05 2005–06 2006–07 2007–08 2008–09 2009–10
Minutes
50th percentile 90th percentile

Responsiveness of ambulance services
16 Access to Ambulance Services Victorian Auditor-General’s Report
In comparison to average response times, there is no obvious pattern, or trend, in the differences between the metropolitan and regional results. The gap has been reasonably constant from 2005–06 for both the 50th and 90th percentile. In 2009–10, it narrowed slightly, after widening during 2008–09.
2.4 Service demand trends The decline in responsiveness, reflected in increasing response times, has coincided with increases in overall demand for AV services, as measured by its caseload.
Underlying demand for services is principally driven by factors such as population growth, the ageing population, increases in chronic disease, and changes to the composition of households, with more people living alone. Other contributing factors identified through consultation and public submissions are: • high levels of stress on other aspects of the health system, including general
practitioners, hospitals and allied health services, leading to increased calls to Triple Zero (000) for assistance
• increased transport of non-emergency patients by AV, for example to meet doctor’s requests to deliver patients for surgery
• health promotion campaigns leading to spikes in calls for assistance.
As a consequence, the number of cases AV dealt with has increased by around 25 per cent since 2004–05. This pattern is evident in both metropolitan and regional areas, as shown in Figures 2H and 2I, respectively. The rate of increase in caseload has greatly exceeded that which can be attributed to population growth over the period.
2.4.1 Metropolitan areas In the metropolitan area, there has been a 10 per cent increase in the number of Code 1 incidents over the past three years, while Code 2 incidents increased by only 3 per cent.
It should also be noted that as this data reports the number of emergency incidents rather than the number vehicles that responded to each incident, it does not capture additional workload arising when multiple vehicles are required to respond. This is more likely to be the case in the metropolitan area.

Responsiveness of ambulance services
Victorian Auditor-General’s Report Access to Ambulance Services 17
Figure 2H Metropolitan caseload for Code 1 and 2 incidents
0
20 000
40 000
60 000
80 000
100 000
120 000
140 000
160 000
180 000
200 000
2004–05 2005–06 2006–07 2007–08 2008–09 2009–10
Code 1 incidents Code 2 incidents
Number of incidents
Source: Victorian Auditor-General’s Office.
2.4.2 Rural regions Over the past three years, rural regions have experienced a 9 per cent increase in the combined number of Code 1 and Code 2 incidents. The introduction of structured call taking processes in rural regions from 2008–09 resulted in more incidents being categorised as Code 1, accounting for some of the shift between the two categories shown in Figure 2I. There has been a 27 per cent increase in the number of Code 1 incidents over the past three years, while Code 2 incidents decreased by 11 per cent.
Figure 2I Rural regions caseload for Code 1 and 2 incidents
0
10 000
20 000
30 000
40 000
50 000
60 000
70 000
80 000
90 000
2004–05 2005–06 2006–07 2007–08 2008–09 2009–10
Code 1 incidents Code 2 incidents
Number of incidents
Source: Victorian Auditor-General’s Office.
Responsiveness of ambulance services
18 Access to Ambulance Services Victorian Auditor-General’s Report
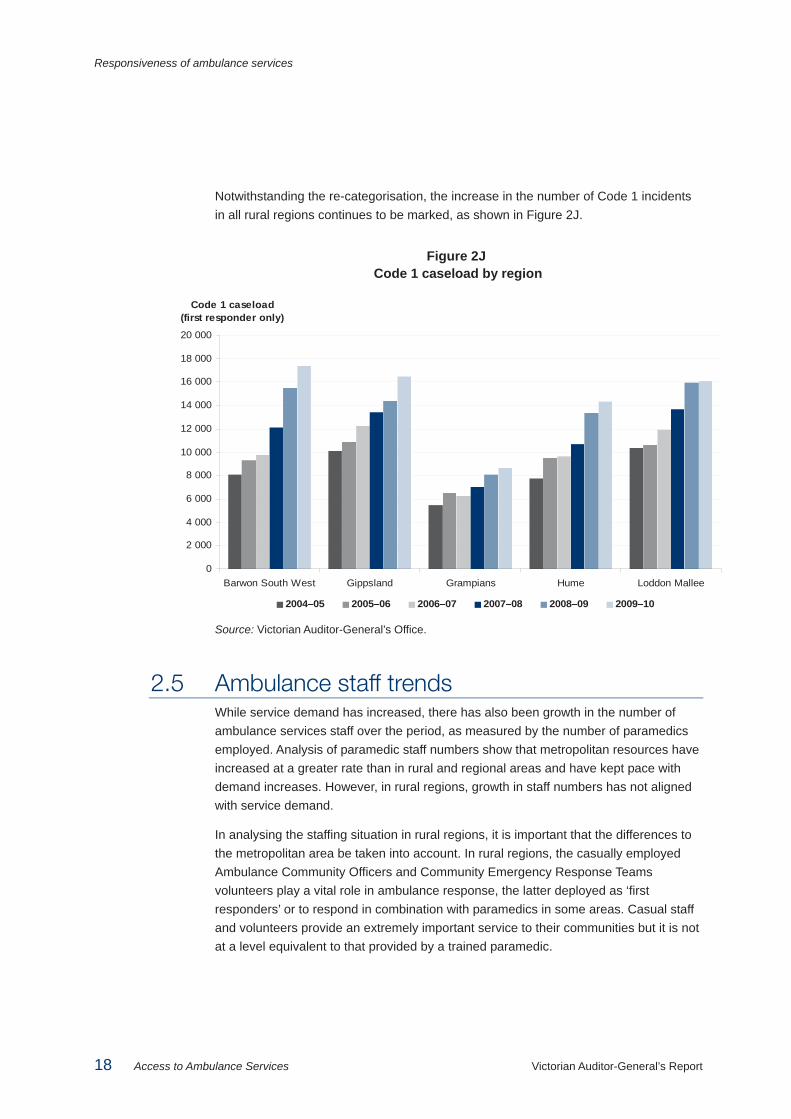
Notwithstanding the re-categorisation, the increase in the number of Code 1 incidents in all rural regions continues to be marked, as shown in Figure 2J.
Figure 2J Code 1 caseload by region
Source: Victorian Auditor-General’s Office.
2.5 Ambulance staff trends While service demand has increased, there has also been growth in the number of ambulance services staff over the period, as measured by the number of paramedics employed. Analysis of paramedic staff numbers show that metropolitan resources have increased at a greater rate than in rural and regional areas and have kept pace with demand increases. However, in rural regions, growth in staff numbers has not aligned with service demand.
In analysing the staffing situation in rural regions, it is important that the differences to the metropolitan area be taken into account. In rural regions, the casually employed Ambulance Community Officers and Community Emergency Response Teams volunteers play a vital role in ambulance response, the latter deployed as ‘first responders’ or to respond in combination with paramedics in some areas. Casual staff and volunteers provide an extremely important service to their communities but it is not at a level equivalent to that provided by a trained paramedic.
0
2 000
4 000
6 000
8 000
10 000
12 000
14 000
16 000
18 000
20 000
Barwon South West Gippsland Grampians Hume Loddon Mallee
Code 1 caseload (first responder only)
2004–05 2005–06 2006–07 2007–08 2008–09 2009–10
Responsiveness of ambulance services
Victorian Auditor-General’s Report Access to Ambulance Services 19
In analysing staff trends it is also important to note that AV uses overtime as part of its response to service needs. It can do this as an interim strategy until a position is filled permanently or supplement existing staff resources in periods of high demand. As overtime uses existing staff to work more hours, it masks the number of hours actually worked, if only effective full-time staff numbers are considered.
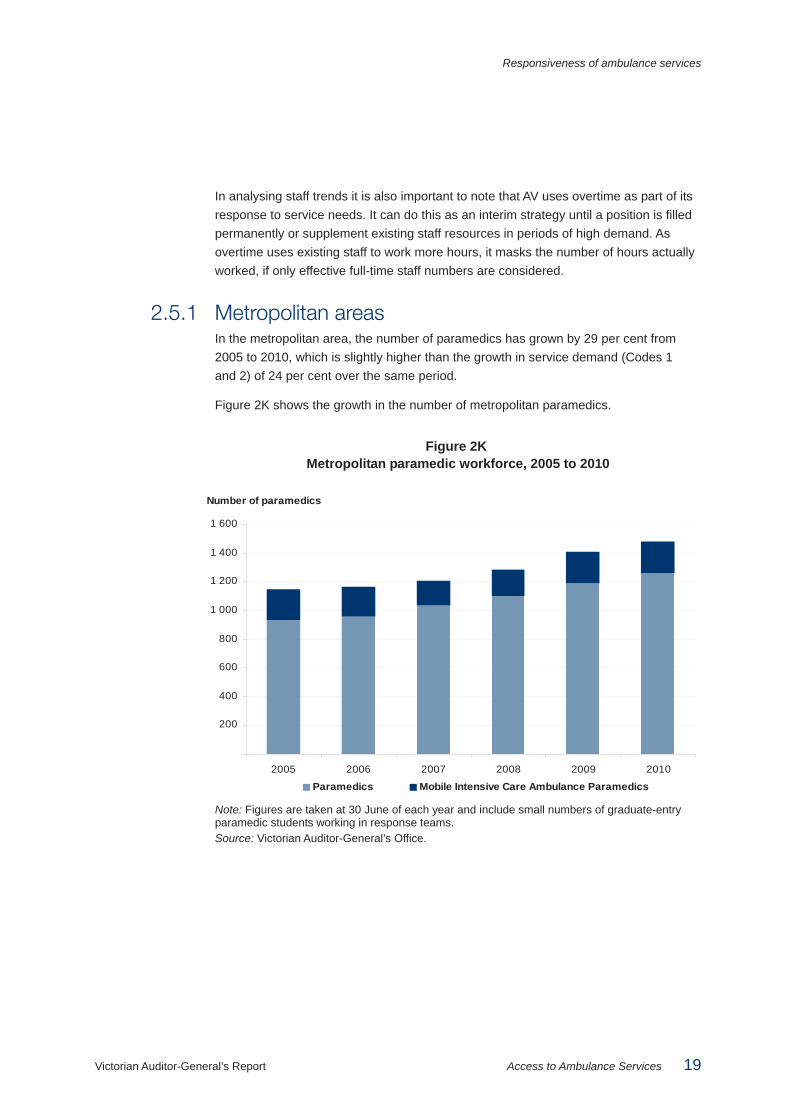
2.5.1 Metropolitan areas In the metropolitan area, the number of paramedics has grown by 29 per cent from 2005 to 2010, which is slightly higher than the growth in service demand (Codes 1 and 2) of 24 per cent over the same period.
Figure 2K shows the growth in the number of metropolitan paramedics.
Figure 2K Metropolitan paramedic workforce, 2005 to 2010
Note: Figures are taken at 30 June of each year and include small numbers of graduate-entry paramedic students working in response teams. Source: Victorian Auditor-General’s Office.
200
400
600
800
1 000
1 200
1 400
1 600
2005 2006 2007 2008 2009 2010
Paramedics Mobile Intensive Care Ambulance Paramedics
Number of paramedics

Responsiveness of ambulance services
20 Access to Ambulance Services Victorian Auditor-General’s Report
2.5.2 Rural regions Figure 2L shows the number of paramedics in rural regions for the past six years. The 18 per cent growth in the number of paramedics has not kept pace with emergency case load growth, which rose by 31 per cent over the six years, from 98 500 cases in 2004–05 to 129 000 cases in 2009–10. In contrast to the metropolitan area, ambulance services in rural regions undertake a significant proportion of non-emergency patient transfers. In 2009–10, these transfers represented more than 20 per cent of the total ambulance workload in rural regions.
Figure 2L Rural regions paramedic workforce, 2004–05 to 2009–10
Source: Victorian Auditor-General’s Office.
There also has been no major or sustained increase in the casual and volunteer workforce over the last six years.
2.6 Case times and handover time at hospitals Publicly reported response time assesses the critical time period between receipt of an emergency call and arrival at the scene of an incident. It does not measure the complete time for ambulance service provision, which includes provision of clinical care at the scene, transportation to hospital and handover of the patient at the hospital. During this total case time, paramedics are not able to respond to any other incidents. This can impact on response times.
0
20
40
60
80
100
120
140
160
180
200
Barwon South West Gippsland Grampians Hume Loddon Mallee
2004–05 2005–06 2006–07 2007–08 2008–09 2009–10
Number of paramedics
Responsiveness of ambulance services
Victorian Auditor-General’s Report Access to Ambulance Services 21
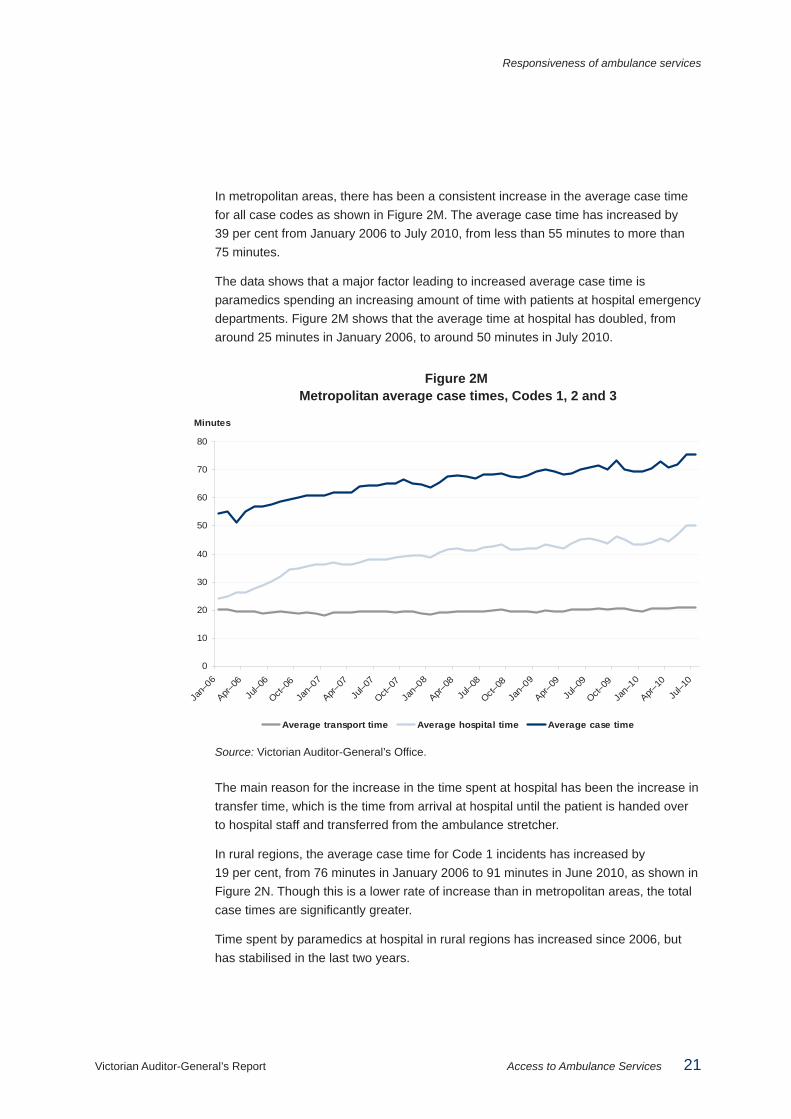
In metropolitan areas, there has been a consistent increase in the average case time for all case codes as shown in Figure 2M. The average case time has increased by 39 per cent from January 2006 to July 2010, from less than 55 minutes to more than 75 minutes.
The data shows that a major factor leading to increased average case time is paramedics spending an increasing amount of time with patients at hospital emergency departments. Figure 2M shows that the average time at hospital has doubled, from around 25 minutes in January 2006, to around 50 minutes in July 2010.
Figure 2M Metropolitan average case times, Codes 1, 2 and 3
Source: Victorian Auditor-General’s Office.
The main reason for the increase in the time spent at hospital has been the increase in transfer time, which is the time from arrival at hospital until the patient is handed over to hospital staff and transferred from the ambulance stretcher.
In rural regions, the average case time for Code 1 incidents has increased by 19 per cent, from 76 minutes in January 2006 to 91 minutes in June 2010, as shown in Figure 2N. Though this is a lower rate of increase than in metropolitan areas, the total case times are significantly greater.
Time spent by paramedics at hospital in rural regions has increased since 2006, but has stabilised in the last two years.
0
10
20
30
40
50
60
70
80
Jan–
06
Apr–06
Jul–0
6
Oct–06
Jan–
07
Apr–07
Jul–0
7
Oct–07
Jan–
08
Apr–08
Jul–0
8
Oct–08
Jan–
09
Apr–09
Jul–0
9
Oct–09
Jan–
10
Apr–10
Jul–1
0
Minutes
Average transport time Average hospital time Average case time

Responsiveness of ambulance services
22 Access to Ambulance Services Victorian Auditor-General’s Report
Figure 2N Average rural and regional case times for Code 1 incidents
Source: Victorian Auditor-General’s Office.
0
10
20
30
40
50
60
70
80
90
100
Jan–
06
Apr–06
Jul–0
6
Oct–06
Jan–
07
Apr–07
Jul–0
7
Oct–07
Jan–
08
Apr–08
Jul–0
8
Oct–08
Jan–
09
Apr–09
Jul–0
9
Oct–09
Jan–
10
Apr–10
Minutes
Average transport time Average hospital time Average case time

Victorian Auditor-General’s Report Access to Ambulance Services 23
3 Resource management
At a glance Background Ambulance Victoria (AV) uses a strategic planning approach to make decisions on the allocation of staff and fleet across the state. It also makes tactical decisions about how to deploy these resources as emergencies arise. Its overall budget is largely determined by the Department of Health (DH), which contributes 59.5 per cent of AV revenue.
Conclusions AV now has a sound approach to strategic planning for metropolitan and rural regions. However, the objective of equity in ambulance response times is yet to be achieved, as comparable communities do not receive similar response times.
Amalgamation has not resolved organisational culture issues that are acknowledged as impacting on performance in some locations.
Findings • Strategic resource allocation is sophisticated in the metropolitan area and has
recently been improved for rural regions • DH has significant control over the AV budget and where new resources go, but
its allocation of new funds is only partially aligned with AV strategic priorities. • A range of organisational culture issues have persisted in AV and remain to be
resolved.
Recommendations • That the Department of Health reconciles new funding with Ambulance Victoria’s
strategic priorities, to identify and quantify any unmet resource needs. • That Ambulance Victoria further develops its system-wide approach to better
integrate both metropolitan and rural regions’ needs in its strategic planning. • That Ambulance Victoria continues to review rosters and staffing levels in rural
regions to minimise recall of paramedics. • That Ambulance Victoria implements a comprehensive strategy to drive its work
on improving organisational culture.

Resource management
24 Access to Ambulance Services Victorian Auditor-General’s Report
3.1 Introduction This chapter considers the most significant resource management issues that are within Ambulance Victoria’s (AV) control; how it deploys staff, and the major current human resource issue of organisational culture. Funding arrangements, which are largely beyond AV’s control, are also considered.
AV’s approach to both the strategic and operational allocation of its available paramedic resources fundamentally affects its ability to respond to incidents. Strategic allocation refers to the deployment of staff and fleet across the state. Operational allocation refers to the deployment of resources in real time, as emergencies arise, and guides decisions about which vehicle and crew type to dispatch for any given incident. These decisions underpin AV’s efforts to achieve equity in service coverage and responsiveness across the state.
3.2 Conclusions Ambulance response times are not equitable across the state, as communities of similar size do not receive a similar standard of service response.
Performance data on ambulance response times for the 2009–10 year shows a wide variation of results indicating that in different areas there is varying capacity to meet the local community’s needs.
Strategic planning of paramedic resource allocation in metropolitan areas is sophisticated but, in rural and regional areas, was not well developed before amalgamation. A new strategic planning model recently developed for rural resource allocation will enable better allocation of resources.
AV relies heavily on grant income to fund its operations. In this regard it is noted that increased funding of $185.7 million over four years from 2008–09 has not led to sustained improvements in response times. Recently announced funding of $30.6 million for additional paramedics in rural regions only, partially aligned with AV’s strategic priorities.
Our analysis of the rate of utilisation of existing resources found that it is not simply a matter of applying more resources, as branches with low paramedic utilisation rates do not guarantee timely response. Smarter resource allocation, as promised in rural regions by the new strategic planning approach, can improve this situation by better identifying where new resources can be of greatest benefit.
The amalgamation has yet to resolve a range of organisational culture issues that continue to have a negative impact on performance.

Resource management
Victorian Auditor-General’s Report Access to Ambulance Services 25
3.3 Strategic allocation of ambulance staff AV plans its resource allocation separately for metropolitan and rural and regional areas. This is because the resource planning model for the high activity and use in the metropolitan area differs from the lower activity, low use in rural regions, where travel distances are much greater.
AV’s Emergency Operations Plan 2011–12 to 2014–15 brings these separate planning approaches together. The current plan emphasises equitable allocation of resources as a priority, and focuses on the resources needed to deal with demand growth, underperformance of Code 1 response times, and variances in service standards. AV’s planning frameworks emphasise achieving equity between communities of similar size.
Decisions about where to allocate resources are complex, and must balance a number of goals: • achieving equity between communities of similar size • achieving equity across the whole population • looking after staff wellbeing and preventing staff fatigue.
3.3.1 Metropolitan area planning model AV’s metropolitan service planning uses sophisticated computer simulations to help determine where best to position its paramedic and fleet resources. Figure 3A gives more detail.
Figure 3A Planning for future resource requirements—metropolitan area
AV plans for its resources for the metropolitan area using a computer model, OPTIMA Predict, designed for emergency ambulance services. It has a detailed representation of the road network based on the recently updated road map used in call taking and dispatch, and it can simulate demand, taking into account AV’s resources and operational practices. The model simulates various scenarios based on call volumes for several years in advance, allowing AV to develop resource allocation strategies. It helps determine how best to position resources for the best possible response times based on forecast demand. AV recently updated the data in the model to improve its reliability.
Source: Victorian Auditor-General’s Office.
AV’s forecasts, based on expected population growth and settlement patterns, assume annual growth of 4.2 per cent in the metropolitan population. The model provides a high degree of confidence in decisions about how many resources are needed and where.

Resource management
26 Access to Ambulance Services Victorian Auditor-General’s Report
3.3.2 Rural region planning model Planning for rural regions needs to deal with a wider range of issues than for the metropolitan area. There is a wide variation in ambulance service coverage due to distance and topography, and also significant differences in the types of ambulance branches servicing different communities.
For example, the local service could be: • staffed 24 hours by a team of two paramedics • a multiple officer branch, staffed by two paramedics during the day, with an
on-call arrangement at night • a single officer branch, staffed during the day shift with an on-call arrangement at
night, usually supported by trained Ambulance Community Officers (ACO) employed casually and paid when called out to incidents
• an ACO branch • a Community Emergency Response Team (CERT) location, staffed by trained
volunteers only.
Before amalgamation resource allocation for rural regions was relatively simple compared to the metropolitan approach. Rural Ambulance Victoria, and later AV, employed a methodology using historic data on use, response times, demography, and hospital trends within each catchment.
The model’s limits meant that decisions about adding resources focused on locations in isolation, rather than in a more holistic service-wide framework. When demand in one branch reached a certain threshold, it got more resources.
Further, the model assumed that the existing allocation was reasonable and a good basis on which to build. It did not address inequities in resource allocation, much of which were historical.
AV recognised the limits with the methodology and commenced development of a new approach to resource planning early in 2009. Figure 3B outlines the new approach, which was finalised in February 2010.

Resource management
Victorian Auditor-General’s Report Access to Ambulance Services 27
Figure 3B New approach for resource planning in rural regions
During 2009, AV analysed a wide range of ambulance and population data to quantify current services, project future demand and assess which staff types and numbers were wanted by 2014–15 in which locations. In consultation with the Department of Health and health sector representatives, AV developed planning criteria focused on population coverage and response times. Consultants engaged by AV then designed two planning models to identify gaps and inequities in service delivery. 1. The Population Coverage Model This is a ‘static’ model, fed mainly by travel times and population levels by Census Collection Districts. It calculates coverage of urban and rural populations for emergency response and patient transport. The model’s main function is to generate options for new branch locations and upgrades of existing branches. 2. The Incident Response Model This is a ‘simulation’ model that tracks incident responses and journeys to hospital on a 24/7 basis. The main data are travel times (‘lights and sirens’ and normal travel speed), resource deployments, demand (geographical and temporal distributions) and parameters, such as activation time and time at the scene. The model mainly tests the impact of a change in deployment on response time performance. It can be used to simulate resources of different types responding to incidents and transporting patients to hospital.
Source: Victorian Auditor-General’s Office.
AV has based its new model for resource planning in rural regions on three objectives: • achieving appropriate response time performance • providing an appropriate standard of service across the rural regions • ensuring appropriate use of on-call rosters to reduce staff fatigue and improve
performance.
Our review of the analysis and forecasting documents on workforce and workload changes confirms the new planning approach is sound. However, the results of the model have not yet been tested in practice.
3.3.3 Strategic resource allocation and equity The effectiveness of strategic resource allocation largely determines whether AV can meet its equity objectives. Atypical and unforeseen patterns of demand and staff shortages from illness or recruiting problems will also play a part to a lesser extent.
AV is aiming for equity by responding similarly to communities of similar size wherever they are in the state. AV has committed to strive for similar response times for the following cohorts: • areas with populations of more than 50 000 • areas with populations between 7 500 and 50 000 • areas with populations below 7 500.
Resource management
28 Access to Ambulance Services Victorian Auditor-General’s Report
Appendix C shows response times during 2009–10 for urban centres grouped according to the above cohorts. It shows a wide variation in response times among communities of similar size that AV aims to service to a similar standard.
The difference in response time performance between like locations means that strategic decisions are required to use new funds to create a better balance in response capacity across the state. AV has received a funding commitment from the Department of Health (DH) for upgrades of services in 10 areas in the rural regions, using $30.6 million in new funds committed over four years from 2011–12. However, the areas funded by DH do not align with the priorities in AV’s Emergency Operations Plan 2011–12 to 2014–15. AV’s plan sets out 69 ranked priorities for additional resources. The new budget from DH funded six of these 69, but not the top priorities proposed by AV, and a further four staff upgrades which were not identified by AV as priorities. It is not clear on what basis the locations for staff upgrades were chosen by DH. Each of the upgrades DH funded was for additional Mobile Intensive Care Ambulance (MICA) single response units. DH’s rationale for this decision is not evident.
Although AV’s decisions to plan separately for metropolitan and rural regions is sound because of the differences between the two, it is important that these two planning tasks be brought together into an integrated statewide approach. The two sets of regions do not operate independently, as paramedics from one will at times service the other and as patient transfers occur across metropolitan and rural boundaries. An integrated statewide approach will prevent further disparities developing between the metropolitan and rural regions and will help AV in its objective of building a more equitable system across the state.
3.4 Operational allocation of ambulance staff Strategic planning to determine what type and where to locate resources is only one part of the task of achieving the best possible responsiveness. There are a range of operational considerations that determine how well AV meets the needs placed on it. These include how it configures rosters of its available staff, including its use of casual staff and volunteers to supplement the paramedic workforce; and how it organises dispatch of ambulances to emergencies.
AV is transitioning its current responsibility for call taking and dispatch functions in rural regions to the Emergency Services Telecommunications Authority (ESTA). The ESTA computer aided dispatch (CAD) system is a more sophisticated CAD than previously used in rural regions. AV will soon have realised the full benefits of the new technology. Rostering and staffing levels, however, remain an issue, particularly in rural regions where AV is dependent on the use of on-call rosters and recall of off-duty staff, as well as deployment of casuals and volunteers to provide service coverage.

Resource management
Victorian Auditor-General’s Report Access to Ambulance Services 29
Utilisation rates, that is the proportion of time paramedics are engaged on cases, are typically low in rural and regional areas. The unpredictability of when emergencies occur, and the long time taken to deal with a case because of travel times, means that even where branch utilisation levels are low, paramedics are still not necessarily available for all incidents.
3.4.1 Staff availability and rosters Staff profiles of AV branches affect the quality and timeliness of the service. Figure 3C summarises the staffing arrangements for each type of branch, which are based on different roster configurations and staffing levels.
Figure 3C Ambulance branch types
Branch type Where used Response description MICA branch Metro and regional Provides two MICA paramedics in an
ambulance 24 hours, 7 days MICA single responder
Metro and regional Response unit without patient transport, crewed by a MICA paramedic and backed up by an emergency transport ambulance
24-hour branch Metro and regional Provides two paramedics in an ambulance 24 hours, 7 days
Peak period unit Metro and regional Regularly runs only during peak demand–usually 10 or 12 hours a day
Multi-officer branch Metro and regional Provides two paramedics in an ambulance, 24 hour, 7 days with overnight response on call
Single officer branch Regional Provides one paramedic in an ambulance 24 hours, 7 day with overnight response on call. At most single officer branches the paramedic is required to link with an ACO for a two-person response
ACO branch Regional Transport capable response unit crewed by two ACOs, providing on-call response
CERT volunteer unit Predominantly regional
Unit without transport crewed by trained volunteers, available for higher priority incidents. CERTs are first responders and are backed up by a paramedic
Source: Victorian Auditor-General’s Office.
We analysed the pattern of response times by region, time of day and day of the week. This analysis found overall that response times in most regions fell into a typical pattern of variation around the norm.
Resource management
30 Access to Ambulance Services Victorian Auditor-General’s Report
However, the patterns also showed that response times increase in excess of normal variation at night and, in the metropolitan area and three rural regions, on the weekend. These results warrant further examination to determine whether extra capability through roster changes is possible to smooth response times, or if increased resources are required.
When consulted, paramedics in rural and regional areas routinely cited rosters as key to improving response times. Each branch’s roster, covering on-call periods, scheduled breaks and non-recall periods, as specified in AV’s enterprise bargaining agreement, affects staff availability.
There is significant reliance on on-call paramedics in small branches in rural regions and both CERTs and ACOs also respond on call. Because those on call are usually not at the ambulance station at the time, the time it takes to respond to the call-out is typically longer. This leads to longer times reaching the emergency. Paramedics must take a minimum rest break after a call-out, which means they may not be available during their next rostered shift. While call-outs allow a response to the immediate emergency, their use can compromise coverage in later roster periods.
When a local branch is unavailable to respond, either because it is responding to an incident or on a rest break associated with on-call arrangements, AV may recall paramedics to duty where they are not currently rostered to respond. This may be for a response to an incident, or to provide coverage in the area (recall for cover). The practice of ‘recall for cover’, was affecting staff morale. Among other things, staff cited a flow-on effect on family members, as well as fatigue, and a feeling that AV was too reliant on the goodwill of staff and community volunteers to fill roster gaps. Excessive recall may require staff to work long periods or have interrupted breaks, which may also compromise their safety.
We received a number of submissions commenting on staff workload and fatigue arising from challenging rosters and the use of call-out or recall after rostered shifts. Paramedics in some areas were at times refusing recalls as they had been regularly ‘called out’ despite being rostered as unavailable. AV is working to address this through its fatigue prevention strategy.
We found resources in some rural regions are regularly under pressure, particularly in remote areas or in those subject to seasonal surges such as at holiday times. In some areas with few 24-hour or MICA branches, a number of branches in adjacent areas sometimes had no ambulance cover. Others were staffed by paramedics recalled to provide coverage in case there were multiple call-outs at the same time.
However, the use of recall is a financial as well as strategic decision. In the context of AV’s tight budget situation, recall is a cost-effective way of meeting demand, as staff are recalled only if required rather than paid to be on duty or paid an on-call allowance in the event that they are required for an emergency.
Resource management
Victorian Auditor-General’s Report Access to Ambulance Services 31
These issues indicate that branch staff profiles are not aligned with demand in certain areas in rural regions. This is likely to be at least partly due to the less sophisticated resource allocation model used in these areas in the past which in turn constrained tactical deployment as emergencies arose. As noted above, AV has a new rural planning model which more objectively points to resource requirements than past methods. However, as the planning model identifies roster upgrades and additional resources, implementation is dependent on additional resources being made available. In the short term, AV is planning to recruit additional staff during 2010–11 to upgrade rosters at a number of branches with the aim of reducing staff fatigue.
3.4.2 Use of volunteers, casual staff and other emergency services AV uses other staff as ‘first responders’ to incidents when all paramedics are assigned to other cases.
In rural regions AV uses volunteers, casual staff and partner organisations as an important part of its service delivery to the community.
Although CERTs and ACOs are not as highly trained as paramedics and only respond on-call, they allow increased coverage in rural regions. Because of the lower cost of using casuals and volunteers, CERTs and ACOs are also relatively cost-effective, compared with branches staffed by paramedics. Use of CERTs and ACOs also helps AV provide coverage in rural areas where paramedics may be less willing to be assigned.
AV partners with the Metropolitan Fire Brigade (MFB) in their response area, and is piloting similar arrangements with the Country Fire Authority (CFA) in some outer-metropolitan areas. Under the partnership, MFB or CFA members are simultaneously dispatched with AV to suspected cardiac arrest cases to provide critical initial care, such as CPR and defibrillation, if they can reach the scene faster than an ambulance. AV is currently discussing a regional pilot with the CFA.
AV also has arrangements with Remote Area Nurses (RANs) to provide a first response in a number of more remote locations.
ACOs, CERTs, RANs and arrangements with other emergency services improve the speed of a first response and are important to a timely response. However, they are not a substitute for a qualified paramedic attendance and one will follow in most cases. The community may not appreciate the different level of service that can be provided by these non-paramedic first responders, and this potentially puts pressure on these staff. This represents a particular risk to retaining CERT staff, who receive no pay but may still be subject to occupational stresses.

Resource management
32 Access to Ambulance Services Victorian Auditor-General’s Report
Those we consulted and who made submissions felt that AV was expecting volunteers to increase the hours they were available. In some areas, they said, ambulances seemed to be sent out over wider areas to cover for branches where the rostered crews were on call-outs. They were concerned about the extent to which AV was asking community volunteers to work in such circumstances, rather than helping in their own communities. They considered these incidents as risks to people being willing to continue volunteering, and thus as risks to service coverage in rural regions.
3.4.3 Dispatch Dispatch refers to the allocation of ambulance staff to an incident. Dispatch time is included in the overall response time. Efficient dispatch is therefore a key element of timely response.
The approach to dispatch in the metropolitan area has been more technologically advanced than in rural regions, but the roll out of the ESTA CAD system across all rural regions has commenced.
Metropolitan areas The ESTA emergency dispatchers located at the State Emergency Communications Centre use the CAD system to determine the most appropriate vehicle to dispatch for an incident. AV Duty Team Managers, based in the metropolitan area, use a computer-based resource management tool, OPTIMA Live to monitor the ambulance fleet and available resources for the metropolitan area. They assess and adjust distribution of resources based upon the modelling of OPTIMA Live. OPTIMA Live is used in comparable cities internationally.
Using mathematical algorithms, it projects the maximum likely available resources 30 minutes ahead. It is designed to increase fleet mobility, improve resource efficiency, and maximise service responsiveness.
AV uses OPTIMA Live between 7.00am and 6.30pm and in other evening peak times when needed. Coverage aligns with the standard daily peak load for ambulance services, which is about 7am to midnight. AV could run OPTIMA Live all the time, leading to better fleet use, but this would require it to reprioritise how it uses its available resources.

Resource management
Victorian Auditor-General’s Report Access to Ambulance Services 33
Figure 3D Real time ambulance use in the metropolitan area
OPTIMA Live shows a map of all incidents over the past three years, which highlights the main incident areas. Another screen shows all incidents on the current day for the past three years, to show any spikes in activity linked to particular events. OPTIMA Live tracks real-time updates from the CAD system, based on information sent from each ambulance. This draws a picture of ambulance availability at any time on the metropolitan network. The tool covers an area of 9 000 km2. OPTIMA Live continues to develop, with work-in-progress to increase its effectiveness. AV plans to evaluate it late in 2010.
Source: Victorian Auditor-General’s Office.
Rural regions As AV rural regions transfer to ESTA for call taking and dispatch, they will use the systems used in the metropolitan area. By the time all branches in rural regions transfer by mid 2011, an AV duty manager in the ESTA call centre will be responsible for monitoring the available fleet and making resourcing decisions.
Until then the dispatchers in remaining AV rural region operation centres are responsible for monitoring the availability of vehicles for dispatch in their regions. The present approach to dispatch in rural regions is less rigorous than in the metropolitan area.
Non-ESTA rural region dispatchers have a map showing the current location of all vehicles and a list of the vehicles closest to the incident is available. However, where dispatch is to a location more than 10 kilometres away, the system only calculates distances ‘as the crow flies’. As a result, rather than sending the vehicle likely to arrive the fastest, it focuses on dispatching the closest available vehicle, not taking into account the layout of the road network, mountains or other factors, such as uncrossable waterways.
After the transition to the ESTA CAD system, OPTIMA Live will also be able to be used outside metropolitan areas. However, the tool may be less effective in rural regions, which have smaller fleet numbers and cover larger land areas than Melbourne. As a result, there are fewer opportunities to redeploy vehicles or identify multiple options for responding to single incidents.
3.4.4 Utilisation rate Utilisation rate refers to the proportion of time that AV paramedic staff are engaged in operational duties, as opposed to down time, when they are waiting for a call-out.
Data show that AV utilisation rates are more consistent in the metropolitan area averaging about 49 per cent. By contrast, there is greater variation in rural regions, as shown in Figure 3E.

Resource management
34 Access to Ambulance Services Victorian Auditor-General’s Report
Figure 3E Lowest utilisation rates, branches in rural regions
Branch
Utilisation rate
(per cent)
Mean response time
(minutes)
Response at 50th percentile
(minutes)
Response at 90th percentile
(minutes) Branches with lowest utilisation Apollo Bay 4.3 14.2 12 26 Lorne 5.6 14.1 11 29 Timboon 5.8 21.7 21 35 Anglesea 6.5 17.1 15 27 Edenhope 7.2 22.5 19 41
Branches with highest utilisation Bendigo 59.2 14.5 11 24 Morwell 52.6 15.3 13 24 Belmont 50.4 13.8 12 23 Ballarat 49.6 14.0 11 22 Norlane 48.1 13.6 12 21
Source: Victorian Auditor-General’s Office.
The relationship between utilisation and response times shows the complexity of the allocation task in rural regions. It is not necessarily the case that low utilisation implies either that there are too many resources in a branch, or that response times will be faster.
We analysed the relationship between response times and utilisation rates using data from all rural branches from 2009–10 and found only a weak correlation with faster response times at individual branches.
In rural regions in particular, low utilisation does not always correlate with lower response times because factors, such as the timing of events, distances to be covered and rosters, come into play. Low utilisation rates also do not directly indicate that a branch is wrongly located. Again distances to be covered, as well as the proximity of other services in adjacent areas need to be considered before making a judgement.
These examples demonstrate the challenges to achieving equity in responsiveness, and indicate that reducing utilisation rates will not necessarily address the decline in timeliness.

Resource management
Victorian Auditor-General’s Report Access to Ambulance Services 35
3.5 Financial resources AV has limited control over its total income. Income from its own sources—patient transport and membership fees and interest, accounted for $197.6 million in 2009–10, which was 36.5 per cent of total income of $541.1 million. The balance of $343.5 million comprised operating and capital funds from DH of $321.9 million, and grants and donations from other sources. The funds from DH represent 59.5 per cent of AV’s total revenue.
Recent additional operating funding allocations from DH included: • $185.7 million from DH over four years to 2011–12, announced before
amalgamation in April 2008 • A one-off allocation of $9 million from DH in late 2009–10 to help with certain
costs of amalgamation including human resources and finance system change, technology integration and organisational change
• $55.5 million over four years to 2014–15 (principally from DH but including $11.2 million revenue from the AV membership scheme).
These allocations were to provide additional ambulance crews in specified areas. The additional funding has been built into DH’s base grant to AV.
AV’s recurring state funding is based on an annually indexed ‘block’ grant rather than on ambulance activity, such as the number of emergency responses. In addition, it is DH not AV that has the authority to approve increases in emergency patient transfer fees. This means that funding does not change as workloads and service demands increase.
In 2009–10 revenue fell short of expenditure by $2.9 million. According to the 2009–10 financial statements the net result for the year, taking into account non-operational income and factors, such as depreciation, was a $5.9 million loss.
The working capital position of AV is also not healthy and the cash reserves of the former Metropolitan Ambulance Service, (MAS) have fallen since amalgamation. The amalgamation process wasn’t funded until late 2009–10. Until then transitional costs were met from reserves and operational budgets.
Budget can affect decisions about use of emergency resources for non-emergency patient transfer in rural areas and have flow on effects for response times. It is more cost-effective to use emergency staff rather than external contractors for these transfers, but the risk is in reduced responsiveness if an emergency event does occur.
Under the current funding model, to cover the rising cost of more services, AV needs either to become more efficient, improve productivity for its fee-paying services, or increase ambulance subscriptions.

Resource management
36 Access to Ambulance Services Victorian Auditor-General’s Report
The externally determined limitations on AV’s budget position have a subsequent impact on overall staff numbers and performance. We note that advice commissioned for AV and DH in 2009 raised the potential for activity-based output funding to offer more certainty and transparency.
3.6 Ambulance Victoria’s demand management strategy AV cannot control demand increases caused by longer time needed to deal with emergency cases but it has some capacity to influence overall demand for its services.
In 2003, the then MAS introduced a referral service in metropolitan areas, known as RefCom, which transfers low-priority calls, unlikely to require an ambulance transport, to a clinical adviser rather than triggering an immediate ambulance call-out.
RefCom is a sound demand management strategy. AV estimates that of the 39 000 calls handled by RefCom in 2009–10, 29 000, or 8 per cent of total Triple Zero (000) ambulance calls, were referred to other health services or received telephone advice as an alternative to an emergency ambulance dispatch.
AV is expanding the RefCom service into regional and rural areas once all regions have transitioned to the ESTA CAD system. Funding of $7.3 million over four years was recently announced by DH as part of its broader package of $55.5 million. This will provide access to this demand management service across the state.
3.7 Organisational culture and practice Organisational culture influences performance strongly. This is particularly so when AV depends on the goodwill of paramedics to cover unattended branches or to respond to call-outs when not rostered on. The cultural issues now affecting the organisation arise from the recent history of AV.
The amalgamation of Rural Ambulance Victoria (RAV) and MAS on 1 July 2008 had a lead time of only two months. AV still experiences a number of negative cultural and practice issues that were known to be present in the former RAV.
The State Services Authority review of RAV in 2006 highlighted cultural and practice issues. The review found that RAV was not working as a unified organisation and that the organisation had cultural and communication problems, including: • a command and control leadership style • staff feeling disempowered and not valued • a ‘them and us’ culture between management and staff on the ground • strategic directions which were not well understood or embraced by staff • limited avenues for staff and management to communicate and consult about
proposed organisational changes, emerging issues or problems.

Resource management
Victorian Auditor-General’s Report Access to Ambulance Services 37
It is not clear how far RAV had addressed the review’s findings by the time it was amalgamated with MAS. An analysis of grievances aired through this audit’s consultations and submissions revealed that some staff see the same problems in AV, suggesting that many or all of these issues were carried into the amalgamated body, or that unfounded perceptions have not been addressed.
A staff survey from March 2009, to help AV leadership understand the organisation’s culture and how to strengthen and improve it, also showed the issues had persisted after amalgamation.
The survey identified areas and behaviours that were detracting from the performance of the organisation. Results revealed staff lacked engagement, did not support the organisation’s goals and did not feel loyal. Many of the issues typified the former RAV, including employees feeling they were not involved in shaping the organisation and a perceived communication gulf between those working on the ground and management. However, these issues are now seen as symptomatic of AV rather than as a carryover from RAV.
In addition to the short lead time for the amalgamation, DH did not fully fund the organisational change apart from the $9 million in late 2009–10 for human resource and finance system change, technology integration and organisational change. In addition to the need to create linked IT and other systems, AV needed to deal with pay and work condition disparities, which were later the subject of a new Enterprise Bargaining Agreement for operational staff. Similar issues are currently being addressed through the Enterprise Agreement negotiations for administrative staff.
The issue of organisational culture and its relationship to responsiveness has been raised, both directly and indirectly through submissions and consultation with paramedics. AV has not addressed all of the cultural issues. This is demonstrated in the inconsistent documentation and disparate practices throughout the organisation.
Better practice suggests five areas for effectively managing change, which generally takes five to six years. Figure 3F measures AV’s experience against these areas.

Resource management
38 Access to Ambulance Services Victorian Auditor-General’s Report
Figure 3F Better practice change management strategy, and AV approach
Change area Best practice strategies AV approach Planning Developing and documenting the
objectives of change and the means to achieve it.
Little lead time to plan before amalgamation but later employed a change management consultant. Culture Improvement Strategy drafted with responsibilities and time frames designated for the period 2010–13.
Defined governance
Establishing appropriate organisational structures, roles, and responsibilities for the change processes that engage stakeholders.
Clearly defined governance arrangements to engage stakeholders and support the change effort. Responsibilities communicated to senior operations staff.
Committed leadership
Ongoing commitment at the top to guide organisational behaviour and lead by example.
Executive communicates messages about the benefits and changes of the new structure to staff.
Informed stakeholders
Open and consultative communication.
Communication plan developed. Frequently asked questions fact sheet for senior managers to assist with staff concerns. Staff meetings and information sessions to keep employees informed about the changes, including benefits, impacts and key milestones. Employee workshops aimed at managing the change. Information regularly communicated to staff though email, bulletins.
Aligned workforce
Developing plans to align the workforce to support the changing organisation.
Organisational Development Unit set up to support alignment and performance and the need for the integration of policies and tools. Organisational development plan outlining immediate priorities and long-term objectives and strategies.
Source: Victorian Auditor-General’s Office.
AV’s organisational change activities, when considered against better practice, were not comprehensive. Insufficient budget and short lead times were constraints on what could be achieved. We note that although AV had organisational development plans, such as an AV Leadership and Management Development Strategy 2010–2013 and a People Strategy 2009–2012, they were not well-established and followed through, due to lack of funding.

Resource management
Victorian Auditor-General’s Report Access to Ambulance Services 39
An internal planning forum in 2010 found that issues about people were affecting the Regional Services Division’s ability to improve performance and maximise resources. They included lack of staff engagement, general issues about performance, absenteeism, inappropriate behaviour, a high level of WorkCover claims and grievances.
This strongly indicates that change management activities to date have not been effective in addressing organisational health and wellbeing issues. Consultations and submissions revealed some quarters of rural regions were hostile to what is seen as Melbourne-centric management.
Senior AV management is familiar with these issues. The executive has endorsed strategies to address staff issues including improving communication and collaboration within the organisation as well as developing a stronger performance focus.
Recommendations 1. That the Department of Health reconciles new funding with Ambulance Victoria’s
strategic priorities, to identify and quantify any unmet resource needs.
2. That Ambulance Victoria further develops its system-wide approach to better integrate both metropolitan and rural regions’ needs in its strategic planning.
3. That Ambulance Victoria continues to review rosters and staffing levels in rural regions to minimise recall of paramedics.
4. That Ambulance Victoria implements a comprehensive strategy to drive its work on improving organisational culture.


Victorian Auditor-General’s Report Access to Ambulance Services 41
4 Performance measurement framework
At a glance Background Accountability for performance is a cornerstone of public sector management and reporting. In addition to discharging public accountability, performance information is needed by management to improve services, and by the community so they know what standard of ambulance service they can expect.
Conclusions The response time performance measures that Ambulance Victoria (AV) publicly reports are relevant, but there are limitations to their appropriateness, and they do not fairly represent the geographic variations in actual performance. The community would better understand the response times they can expect in their area if AV published a more comprehensive suite of measures, that are better aligned with internal measures.
Findings • AV’s emergency response indicators relate directly to the achievement of its
objectives. However, the timeliness measures are not entirely within its control. Both hospitals and the Emergency Services Telecommunications Authority play a role in ambulance availability and responsiveness, which blurs accountability.
• The 15-minute time standard has not been based on analysis of available resources, service demand, or distances travelled.
• Internal management targets show the different expectations for rural regions and the metropolitan area, with a target of responding to 75 per cent of cases in 15 minutes for rural regions, compared with 90 per cent for metropolitan.
Recommendations • That Ambulance Victoria publicly reports a comprehensive suite of response time
indicators, including: • national measures of response times at the 50th and 90th percentiles • a breakdown of performance by region/locality.
• That the Department of Health reports on performance for total case time, broken down by the elements attributable to the Emergency Services Telecommunications Authority, Ambulance Victoria, and hospitals.

Performance measurement framework
42 Access to Ambulance Services Victorian Auditor-General’s Report
4.1 Introduction Accountability for performance is a cornerstone of public sector management and reporting. Measuring and assessing performance goes beyond meeting financial goals. Information about non-financial performance is also needed to satisfactorily acquit the stewardship of public resources.
This is recognised and reflected in the current Government Performance Management and Reporting Framework (the Framework) first introduced in 1999. Agencies are required to develop performance indicators to provide information about the achievement of objectives and performance measures, to provide information about the delivery of services, referred to as ‘outputs’.
The government holds agencies to account for their delivery of outputs and their achievement of annual output targets. Results of output performance measures are reported in both the Budget Papers and agency annual reports.
The Public Finance and Accountability Bill before Parliament has proposed stronger performance reporting, including linking agency expenditure more closely to the achievement of outcomes.
In addition to discharging public accountability, agency management needs performance information to improve services. Managers use it to decide about: • inputs—such as how many and what resources are needed, and where they
should be deployed • processes—how to deliver services • outputs—the time, cost, quality and quantities of services.
Tracking these many dimensions of performance gives management a balanced perspective. This reduces the potential for perverse incentives and unintended consequences that can arise from concentrating on only a few indicators, and/or focusing on only one dimension.
4.2 Ambulance services performance indicators Ambulance Victoria (AV) reports on a small number of output measures for emergency services in its annual report, consistent with the measures in Budget Paper 3. Figure 4A summarises them. Additional quantity and quality measures, for example cardiac arrest survival rates, are included in AV’s annual Statement of Priorities.

Performance measurement framework
Victorian Auditor-General’s Report Access to Ambulance Services 43
Figure 4A Budget Paper 3 Output performance measures: emergency services
Dimension Measure Breakdown Quantity Number of cases By road for metropolitan and
rural; by air; and for pensioner/concession cardholders
Quality Cases meeting clinical standards Statewide and Community Emergency Response Team (CERT)
Significant pain reduction achieved For cardiac and traumatic pain
Patient satisfaction Those satisfied and very satisfied
Timeliness CERT arrival prior to ambulance None Emergency responses within 15 minutes Statewide and for population
centres above 7 500 Cost Dollars Total only
Note: CERT – Community Emergency Response Team consists of volunteer first aiders. Source: Victorian Auditor-General's Office, based on 2010–11 ‘Service Delivery’, Budget Paper 3, Department of Treasury and Finance
Victoria also reports nationally agreed emergency service indicators in the Report on Government Services 2010 (ROGS) published annually by the Productivity Commission. Figure 4B summarises the measurement framework adopted and the indicators reported.
Figure 4B ROGS output performance indicators for ambulance events
Element Dimension Measure Breakdown Equity Access Response locations per
100 000 people Paid staff, paid and volunteer, volunteer only locations
Availability of ambulance officers—full-time equivalent officers per 100 000 people
Qualified officers and student/base level officers
Urban centre Code 1 response times
50th and 90th percentiles
Effectiveness Access Statewide Code 1 response times
50th and 90th percentiles
Sustainability Workforce by age group 10-year age bands Staff attrition Total only Efficiency Ambulance services
expenditure per person Total expenditure, government-sourced expenditure (grants)
Note: Code 1—emergency response requiring lights and sirens. Source: Victorian Auditor-General's Office, using data from Report on Government Services, 2010, Productivity Commission.

Performance measurement framework
44 Access to Ambulance Services Victorian Auditor-General’s Report
Of the above ROGS indicators, only response times relate specifically to emergency ambulance services. The rest are for emergency and non-emergency activities of AV, and do not directly compare with the emergency service output indicators in Figure 4A.
Features of performance information To be useful, performance information needs to be: • relevant—it is logically linked to the objective or service it purports to measure,
and the reported results are due to the agency’s activities, as determined by its ability to control or directly influence the outcome
• appropriate—there is enough information and context to understand the extent of achievement.
Performance information should be reported in a way that fairly represents actual performance. It should be transparent, meaningful and consistent, to assist informed decision-making.
This part of the report examines whether AV’s emergency response indicators are relevant, appropriate and reliably represent the agency’s performance.
4.3 Conclusions AV reports relevant performance measures and reliable data, but its response time measures are limited in their appropriateness, and geographic variations in actual performance are not publicly reported.
More detailed measures are needed that align with those that AV management uses, and include national measures, so they can be compared. The measures need to be broken down into more detail so the public can understand what quality of ambulance service they can expect where they live. The Your Hospitals report and My School website use this approach.
The measures reported also need to adequately reflect the patient’s experience from the time of the emergency call to the time they enter the emergency department of a hospital. There is no measure that reports this publicly. To this end, a new measure of the key components of total elapsed case time, dissected into the parts each agency—the Emergency Services Telecommunications Authority (ESTA), AV and the hospital system—controls, would aid transparency and help to identify systemic issues.
4.4 Relevance AV’s indicators of emergency response relate directly to one of its objectives, from section 15 of the Ambulance Services Act 1986, to ‘respond rapidly to requests for help in a medical emergency’ and thus are relevant. AV directly influences ESTA’s performance by setting the process for call taking and dispatch. However, reported response time measures are not entirely within its control. This blurs accountability.

Performance measurement framework
Victorian Auditor-General’s Report Access to Ambulance Services 45
Emergency response timeliness The Code 1 response time is the time from the call for an emergency ambulance to the ambulance’s arrival at the scene. It can be divided into: • activation time—the time for the communications centre to handle the call and
determine which ambulance to dispatch • reflex time—the time it takes for the first ambulance to arrive at the scene after
dispatch.
ESTA is responsible for the activation time. It answers emergency calls forwarded to its call centres by the national Triple Zero (000) service, establishes the nature and priority of the event, and it dispatches ambulances. In those areas serviced by ESTA, the response time starts when the ESTA call operator opens the computer screen to record the call details.
The Emergency Services Commissioner, in consultation with ESTA and the emergency service agencies, determines the standards for ESTA’s performance of the emergency telecommunications and other communications services. The standard for Code 1 emergency dispatch in the metropolitan area is 90 per cent within 150 seconds (2.5 minutes). Of AV’s 15-minute benchmark, notionally this leaves 12.5 minutes to arrive at the incident address in order to meet its responsiveness target.
ESTA did not report on performance for this standard in its 2008–09 Annual Report. It would be appropriate for AV and ESTA to report on this component of the response time for greater transparency, and to clarify responsibility and accountability for performance.
ESTA has handled the metropolitan area of AV, and dispatch for the former Metropolitan Ambulance Service (MAS), since it commenced operations on 1 July 2005. In June 2010, the Hume region moved across to ESTA’s Ballarat operations centre to provide call taking and dispatch services, and the Gippsland region followed in August 2010. Later this financial year the remaining three regions, now serviced by two local operations centres will transition to ESTA. ESTA will then be responsible for emergency ambulance call taking and dispatch services for all of Victoria. This makes the case for ESTA reporting performance on ambulance dispatch more compelling.
The patient’s view Whether what is reported is relevant can be matched against what the patient’s view of the waiting time is. Figure 4C shows the waiting time for the patient, compared with the time that is recorded, and the total case time.

Performance measurement framework
46 Access to Ambulance Services Victorian Auditor-General’s Report
Figure 4C Emergency response case time
Note: Elapsed times shown are not to scale. Activation time target is 90 per cent within 2 minutes and 30 seconds. Statewide response time target is 85 per cent within 15 minutes.
Source: Victorian Auditor-General’s Office, based on Ambulance Victoria material.
The time taken by ESTA, plus the time taken by AV to respond closely represents actual patient waiting time up to arrival at the scene and is therefore an important measure for public reporting.
The difference between the measured and reported response time, and the actual patient waiting time is likely to be small.
The national Triple Zero (000) service usually takes no more than 10 seconds to pass a call to ESTA. For ESTA-serviced areas the time between an operator taking the call and creating an ‘event’ in the computer system is only a few seconds.
The time between the ambulance arriving at the scene and paramedics reaching the patient can be more variable. Factors that can affect this time include: • whether the paramedics can safely reach the patient. Other emergency services
may have to make the site safe first • how close the ambulance can physically get to where the patient is • the size of the property and where the patient is located • the quality of the information given to ESTA and the paramedics about the
address or patient’s location.
000
ESTA receives call
Dispatch
Turn out Travel to medical care
Response time (Target 15 min)
Total case time
Within 10 seconds Target: 2 min 30 sec
Return to base
Treatment at sceneActivate
Mobilise
Travel to scene
Arrive Depart Arrive
Hospital turn around
Performance measurement framework
Victorian Auditor-General’s Report Access to Ambulance Services 47
Generally, the time between arriving at the address and reaching the patient is minimal. Once at the patient’s side, a paramedic may have difficulty recording times accurately because: • the priority at this point is providing patient care • the paramedic is away from computer system in the vehicle that automates time
data recording.
For these reasons it is reasonable that the reported response time is up to when the ambulance arrives at the scene.
Total case time Average total case times in the city and regional areas have risen significantly and continue to rise. For metropolitan services, average case times are currently 75 minutes, up from around 55 minutes in 2006. For rural regions average case times are now 91 minutes, up from 76 minutes four years ago.
Within the total case time, average waiting times at hospital emergency departments have risen, while times, up to arrival at hospital, have fallen.
AV should also report total average case times, and separate them into the components that it, ESTA, and hospitals have control over. This would give a complete picture of the patient experience and could help manage community expectations about ambulance response times and transport to hospital in an emergency. It would also highlight parts of the system that AV cannot address and for which other agencies must take responsibility.
4.5 Appropriateness An appropriate performance measure gives enough context for the reader to understand the results.
The context of a performance measure means using preset targets, goals or outcomes based on reasonable, preferably evidence-based standards. Agencies should be able to achieve targets, but not so easily that they always exceed them and therefore have no incentive to improve.
It is preferable if measures and results can be compared with the performance of similar organisations, which is known as external benchmarking. In addition, if the agency compares its results over years this encourages it to keep the same measures and to calculate the results consistently.
AV’s reported measures, and in particular its responsiveness measures, only partly meet these tests. Public understanding of ambulance response times would improve greatly if AV was to set and report on targets for a range of times, and their relative likelihood of being achieved. AV uses this approach internally so public reporting on it would not cost significantly more.

Performance measurement framework
48 Access to Ambulance Services Victorian Auditor-General’s Report
4.5.1 Choosing the appropriate measure AV reports timeliness as the percentage of Code 1 incidents responded to within 15 minutes. The positive attributes of this measure are that it consists of a clearly expressed, unambiguous standard, 15 minutes. It also has easily measurable targets, 85 per cent statewide and 90 per cent for centres with more than 7 500 people.
However, the evidentiary basis for the standard of 15 minutes and for the percentage targets is not obvious. Also as it was introduced only three years ago, the public can no longer compare long-term trends.
Prior to 2007–08, Victorian ambulance response times were reported against the 50th and 90th ‘percentiles’. These are the maximum times taken to respond to half of all cases—also referred to as the median time—and the maximum time taken to respond to 90 per cent of all cases, respectively.
Percentiles indicate the chance that an ambulance will arrive across a range of times. For example, if the 50th percentile were 8 minutes and the 90th percentile 18 minutes, it would be reasonable to expect an ambulance to arrive within 8 minutes about half the time, and within 18 minutes most times.
Measures and targets used in other jurisdictions in Australia and overseas, some of which are percentile measures, are set out in Figure 4D.
Figure 4D Response time indicators and targets in selected jurisdictions
Jurisdiction Indicator Area Target
(minutes) Australian states and territories
50 per cent of the first responding ambulance resource arrives—Code 1 situation
All 8.0 Australian Capital Territory (ACT)
90 per cent of the first responding ambulance resource arrives—Code 1 situation
All 12.5
New South Wales (a) 50th percentile response time for potentially life-threatening cases
All Metro
n/a n/a
Queensland 50 per cent of the first responding ambulance resource arrives—Code 1 situation
All 8.2
90 per cent of the first responding ambulance resource arrives – Code 1 situation
16.8
Respond to 50 per cent of emergency incidents
All 9.1 South Australia
Respond to 90 per cent of emergency incidents
All 16.5
Western Australia Respond to 90 per cent of emergency calls Metro 15.0
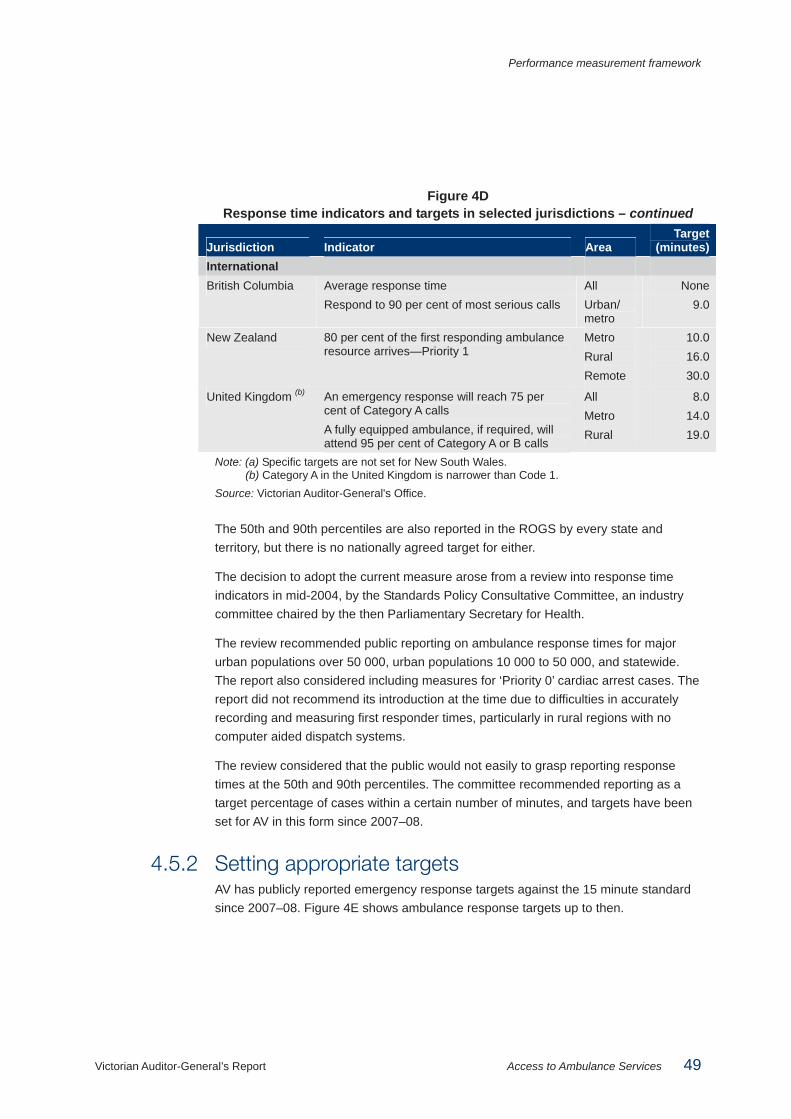
Performance measurement framework
Victorian Auditor-General’s Report Access to Ambulance Services 49
Figure 4D Response time indicators and targets in selected jurisdictions – continued
Jurisdiction Indicator Area Target
(minutes) International
Average response time All None British Columbia Respond to 90 per cent of most serious calls Urban/
metro 9.0
New Zealand 80 per cent of the first responding ambulance resource arrives—Priority 1
Metro Rural Remote
10.0 16.0 30.0
United Kingdom (b) An emergency response will reach 75 per cent of Category A calls A fully equipped ambulance, if required, will attend 95 per cent of Category A or B calls
All Metro Rural
8.0 14.0 19.0
Note: (a) Specific targets are not set for New South Wales. (b) Category A in the United Kingdom is narrower than Code 1.
Source: Victorian Auditor-General's Office.
The 50th and 90th percentiles are also reported in the ROGS by every state and territory, but there is no nationally agreed target for either.
The decision to adopt the current measure arose from a review into response time indicators in mid-2004, by the Standards Policy Consultative Committee, an industry committee chaired by the then Parliamentary Secretary for Health.
The review recommended public reporting on ambulance response times for major urban populations over 50 000, urban populations 10 000 to 50 000, and statewide. The report also considered including measures for ‘Priority 0’ cardiac arrest cases. The report did not recommend its introduction at the time due to difficulties in accurately recording and measuring first responder times, particularly in rural regions with no computer aided dispatch systems.
The review considered that the public would not easily to grasp reporting response times at the 50th and 90th percentiles. The committee recommended reporting as a target percentage of cases within a certain number of minutes, and targets have been set for AV in this form since 2007–08.
4.5.2 Setting appropriate targets AV has publicly reported emergency response targets against the 15 minute standard since 2007–08. Figure 4E shows ambulance response targets up to then.

Performance measurement framework
50 Access to Ambulance Services Victorian Auditor-General’s Report
Figure 4E Ambulance service response targets
Period Indicator Target
(minutes) Emergency response time (Code 1) in 50 per cent of cases—metro
8 2002–03 to 2006–07
Emergency response time (Code 1) in 90 per cent of cases—metro
13
Emergency response time (Code 1) in 50 per cent of cases—statewide
9 2003–04 to 2006–07
Emergency response time (Code 1) in 90 per cent of cases—statewide
15
Source: Victorian Auditor-General’s Office.
This shows that the statewide standard for 90 per cent of responses was 15 minutes, and the metropolitan standard was 13 minutes, before the new regime.
Considerations in setting standards and targets The approach to determining the number of minutes to set as part of a target should be evidence-based, using clinical research into the relationship between ambulance times and patient outcomes. Most research in this area concerns cardiac arrests. Research has found that in such cases shorter ambulance response times are associated with better patient survival rates. Despite this, research has not produced universally accepted response times for ambulance services to guide indicator targets.
Without definitive research to help set target response times, it is instructive to compare the Victorian indicators with other jurisdictions, shown in Figure 4D. This shows that the AV targets are comparable with those of other jurisdictions. Time targets under 15 minutes in Canada and New Zealand are for metropolitan and urban areas only, and the shorter time target for the ACT probably reflects its smaller geographical area. The Victorian practice of setting a shorter response time for more populous areas is also consistent with most jurisdictions, recognising that it takes longer to cover the greater distances in rural regions.
While the use of a 15-minute time standard compares with other jurisdictions, it is an arbitrary figure not based on analysis of available resources, service demand, or distances travelled.
Setting standard response targets is difficult because they are affected by the population and traffic density, topography, and road/transport infrastructure. It is unlikely that actual response times in different jurisdictions either across Australia, internationally or within one state can be compared directly.
4.5.3 Fair presentation The way performance data is presented determines how it is interpreted, or can be interpreted.

Performance measurement framework
Victorian Auditor-General’s Report Access to Ambulance Services 51
The highly aggregated response data reported masks variances in expected and actual performance across the state. This is particularly so for small rural regions.
Internal targets AV monitors performance in more detail in internal reports, in addition to the performance measures and targets set out in the annual Budget Papers and reported in its annual report and ROGS. At its monthly board meetings, a more comprehensive set of data is tabled, including the response time performance measures shown in Figure 4F.
Figure 4F Internal response time measures and targets
Performance measure Target 90th percentile response time (Priority 0) Response time of 13 minutes (metro only) 90th percentile response time (Code 1) Response time of 15 minutes (metro)
Response time of 25 minutes (rural regions) Emergency Medical Response 90th percentile (Priority 0)
Response time of 11 minutes (metro only)
Proportion of Code 1 incidents responded to in 15 minutes
90 per cent (metro) 75 per cent (rural regions) 85 per cent (statewide)
Proportion of Code 1 incidents responded to in 15 minutes in urban centres with population >7 500
90 per cent (metro, rural regions and statewide)
Source: Ambulance Victoria’s performance indicator report, June 2010.
The targets show management’s different expectations for rural regions and metropolitan areas, with a target of 75 per cent of cases responded to in 15 minutes for rural regions, compared with 90 per cent for metropolitan.
An Activity Report for the Operations Group is also tabled at each meeting showing varying regional targets for timeliness, as set out in Figure 4G.
Figure 4G Rural region targets in AV’s Activity Report for the Operations Group
Region
Target50th percentile
(minutes)
Target90th percentile
(minutes) Hume 13 29 Gippsland 12 25 Loddon Mallee 11 23 Grampians 12 26 Barwon South West 12 23 All rural regions 12 25 Source: Ambulance Victoria’s Activity Report for the Operations Group, May 2010.

Performance measurement framework
52 Access to Ambulance Services Victorian Auditor-General’s Report
AV’s Emergency Operations Plan 2011–12 to 2014–15 is its main planning document that drives resource planning advice to its minister. AV’s resource allocation model is aimed at achievement of targets detailed in Figure 4H.
Figure 4H Targets in AV’s Emergency Operations Plan 2011–12 to 2014–15
Area type Target Urban centre localities with population > 50 000
90 per cent Code 1 within 15 minutes (in each centre)
Urban centre localities with population < 50 000 and > 7 500
90 per cent Code 1 within 15 minutes (aggregated by region)
Urban centre localities with population < 7 500
65 per cent Code 1 within 15 minutes (aggregated by region)
Outside a urban centre locality boundary 42.7 per cent Code 1 within 15 minutes (aggregated by region)
Source: Ambulance Victoria’s Emergency Operations Plan 2011–12 to 2014–15.
Aggregation AV monitors performance in much greater detail than is publicly reported, and it sets targets for rural regions that reflect practical realities.
The issue with aggregated data is recognised in ROGS, published annually by the Productivity Commission, which notes that statewide response times represent responses to urban, rural and remote areas. It notes that they include responses from volunteer stations where turnout times are generally longer because volunteers are on call rather than on duty.
The Standards Policy Consultative Committee review into the reporting of response time indicators in 2004 also acknowledged: • reporting targets (statewide and metropolitan only) were not comprehensive and
consistent across the state • reporting was highly aggregated and therefore obscured significant differences in
performance in different places • high levels of aggregation were consistent with response times being outside the
target for a large number of cases.
The AV 2008–09 Annual Report section on performance shows the practical effect of reporting aggregated data. AV was able to report accurately that:
‘Our statewide road response times improved compared with the previous year. We responded to Code 1 calls (lights and sirens) within 15 minutes in 82.5 per cent of cases. While this was an improvement on the previous year’s 81.9 per cent, it was short of our statewide target of 85 per cent of cases.
Performance measurement framework
Victorian Auditor-General’s Report Access to Ambulance Services 53
Overall, in areas with a population of more than 7,500, our response was 88.2 per cent within 15 minutes, an improvement on the previous year’s 87.5 per cent. Our target response time is 90 per cent of calls within 15 minutes.’
However, within this overall achievement, responsiveness in the Barwon South West and Loddon Mallee regions for the same period fell to around 71 per cent each; and responsiveness for population centres under 7 500, fell from 52.3 per cent to 51.1 per cent. This is not clear from the publicly reported data.
The publicly reported data would have also been more transparent had it acknowledged that the internal target for rural regions is 75 per cent, not 85 per cent, as a reader with access only to AV’s publicly reported performance measures might suppose. The lower target appears in AV’s monthly performance indicator report, an internal management report.
If AV were to openly report such targets and its performance to the public in the rural regions it would promote local accountability. Information specific to where people live, is of interest to them, and would also help the public to understand what a realistic level of service is for their location.
In this respect, aggregated reporting on ambulance responsiveness differs from other areas of the health system. For example, reporting on emergency department and elective surgery waiting times, allows the public to compare hospitals across the state and determine what their likely waiting time will be.
4.6 Reliability of reported performance For proper accountability, publicly reported ambulance response times should be accurate and reliable. Response time data reported by AV is generally reliable.
4.6.1 Integrity of data Reporting on performance is only useful if the data reported is reliable. It does not need to be 100 per cent accurate: this would cost too much and be difficult to achieve in practice. However, errors in capturing, aggregating, analysing and compiling data should be minimised.
The concept of ‘materiality’ applies to performance data. The test is whether, if data later found to be inaccurate had been accurate at the time, the decision made would have been different.

Performance measurement framework
54 Access to Ambulance Services Victorian Auditor-General’s Report
Data collection AV’s current data collection methods and quality controls over data are sufficient and appropriate to produce materially correct information. Although rural region data, has been less reliable, this will largely be overcome once the transfer to ESTA is completed this financial year.
Until then, methods for collecting response time data vary between metropolitan and rural regions. As an example, Figure 4I shows the two ways for recording the start and arrival times for emergency ambulance responses depending on whether or not the ambulance is located within the ESTA serviced area.
Figure 4I Different ways of recording response times,
metropolitan area and rural regions Time Metropolitan Rural regions
In the Hume and Gippsland regions the method is the same as in the metropolitan area.
Start time ESTA call taker ‘creates an event’. The time is automatically captured in the ESTA Computer Aided Dispatch (CAD) system.
In other regions the time is automatically captured in the Rural AV CAD (RAVCAD) system when the call taker starts to enter data.
Stop time The paramedic pushes the relevant hard-button time stamp (labelled ‘arrival at-scene’) on the mobile data terminal (MDT) on the ambulance’s dashboard upon arrival at the address. (a) The MDT automatically provides the data to the Mobile Data Network.
1. The paramedic records the time of arrival in the electronic Patient Care Record (PCR) in the Victorian Ambulance Clinical Information System (VACIS). Occasionally, if there are system problems the paramedic may write down the time to record later. 2. If an Ambulance Community Officer or CERT arrives first the arrival time is entered on a paper PCR. Where paper PCRs are used, the data is entered manually into the PCR system by data entry staff in AV’s finance department.
Note: (a) There are six hard-button time stamps on the MDT: ‘acknowledge dispatch’, ‘en route’, ‘arrival at-scene’, ‘patient loaded’, ‘at destination’ and ‘ambulance clear’. Source: Victorian Auditor-General's Office.
The process used for recording start times is highly accurate, as it automatically occurs in line with workflows, removing the chance of human error. Opportunities for error exist in the recording of stop times.
In both metropolitan and regional areas, paramedics can acknowledge or record time stamps at different times. For example, a paramedic may record the arrival time when turning into the patient’s street, thereby reducing the reported time by a small amount. Or, a paramedic may forget to record the time and return to the vehicle to do this, thereby extending the recorded time. Staff training can reduce these errors but not eliminate them.

Performance measurement framework
Victorian Auditor-General’s Report Access to Ambulance Services 55
The regional areas without automated systems are more prone to errors. For example, where staff cannot use the radio network they will manually record times and later transfer them into the computer. This allows room for recording and transcription mistakes.
AV is cutting out manual time recording in rural regions by building new radio towers in ‘black spots’. AV estimates that more than 97 per cent of the state is covered now. It has contracted for construction of five new radio towers in the few remaining coverage ‘black spots’ so the network will cover virtually all populated areas of the state. This will help improve data integrity.
AV estimates that it will transfer to statewide CAD reporting from 1 July 2011 after which it will no longer use the Victorian Ambulance Clinical Information System (VACIS) for response time reporting.
Data storage, aggregation, analysis and reporting Data from metropolitan areas, which is most of AV’s data, is likely to be of better quality and more reliable than the rural region data.
As those areas transition to ESTA this should improve, but the technical challenges of operating in rural and remote settings means their data will always be more vulnerable to error.
There have been audits of VACIS and Patient Clinical Record data that examined the reliability of the data in the AV information technology systems. AV management has actively monitored and raised issues of data quality with ESTA and in its own operations.
In 2007, MAS management analysed its datasets and assessed the likely effect of errors on reported response times. The assessment was thorough, and showed that after removing obvious errors, data inconsistencies did not substantially affect the reported results. Our analysis of the dataset for 2009–10 confirmed this.
This gives reasonable assurance over the integrity of data.
However, AV recognises it needs to do more work on data security. On formation of AV the need for system integration was prioritised above security. Now integration is achieved and the move to a single domain is under way, it is appropriate for AV to focus on statewide integrated security architecture.
The recently convened AV Security Working Group, which first met in August 2010, noted that ‘Historically, after the merger security has not been seen as a high-priority focus. It was managed ad hoc without overarching policy/framework. We need to put security back to the top of the work agenda and quickly move from a reactive mode to a proactive mode’.

Performance measurement framework
56 Access to Ambulance Services Victorian Auditor-General’s Report
AV has recently updated its security policies and guidance and changed its data governance. Figure 4J outlines AV’s approach to addressing information systems issues.
Figure 4J Addressing information security challenges
AV faces a significant task in combining the operations of the rural and metropolitan ambulance services. It has to combine two legacy information technology (IT) systems with different operating procedures and practices. The technology challenges alone are complex. All of this could affect the integrity of the data collected, stored, analysed and reported. AV is aware of the complexity and is determined to meet the challenges. The Information Technology Strategy: 2009–2014, developed in October 2009, is a thorough assessment of AV’s IT infrastructure using a sound and rigorous process. The assessment identified 124 applications and tools within the IT system from the former Rural Ambulance Victoria and Metropolitan Ambulance Service and the new agency. Participants in the assessment were particularly revealing about the problems and complexities that affect their work. The strategy describes many challenges to:
• ensuring data integrity–completeness and accuracy
• efficient collation of information for decision making and reporting
• providing information systems that meet staff needs in the field and in operational centres, and management, to remove the need for workarounds.
Source: Victorian Auditor-General’s Office.
Recommendations 5. That Ambulance Victoria publicly reports a comprehensive suite of response time
indicators, including:
• national measures of response times at the 50th and 90th percentiles
• a breakdown of performance by region/locality.
6. That the Department of Health reports on performance for total case time, broken down by the elements attributable to the Emergency Services Telecommunications Authority, Ambulance Victoria, and hospitals.

Victorian Auditor-General’s Report Access to Ambulance Services 57
Appendix A.
Ambulance response times, by responding branch Figures A1 and A2 provide Code 1 incident response times for each ambulance branch, by metropolitan and rural areas, respectively. The data relate to the incidents where the ambulance branch was the first responding unit.
It is important to note that ambulances may respond to incidents that are outside of their immediate areas. For example, an ambulance from the Maffra branch may be the first responding unit to a Code 1 incident in Traralgon. The response time for this incident would contribute to the performance results detailed below for the Maffra branch.
The darker shaded cells indicate branches that have not met Ambulance Victoria’s (AV) statewide performance target of responding to 85 per cent of Code 1 incidents within 15 minutes.
Figure A1 Code 1 response times by metropolitan responding branch, 2009–10
Response time (minutes)
Responding branch
Code 1 incidents (number) Average
50thpercentile
90th percentile
Within 15 minute target
(per cent) Abbotsford 596 9.3 8.4 13.7 92.6 Air MICA 142 11.0 10.3 14.8 91.5 Altona 1 615 10.7 9.7 16.0 87.6 Bacchus Marsh 879 12.9 12.1 19.4 69.2 Baxter 781 11.7 10.2 18.6 79.1 Bayside 1 754 10.1 9.0 14.3 91.7 Beaconsfield 1 233 12.7 11.2 20.5 76.5 Belgrave 540 12.6 10.9 19.6 76.7 Berwick 1 499 11.0 9.8 17.0 85.7 Boronia 858 10.5 9.3 16.0 87.8 Box Hill 1 671 10.7 9.7 15.1 89.6

Appendix A. Ambulance response times, by responding branch
58 Access to Ambulance Services Victorian Auditor-General’s Report
Figure A1 Code 1 response times by metropolitan responding branch, 2009–10
– continued Response time (minutes)
Responding branch
Code 1 incidents (number) Average
50thpercentile
90th percentile
Within 15 minute target
(per cent) Braybrook 888 11.0 9.9 16.3 85.1 Brighton 1 942 9.6 8.8 13.4 93.7 Brimbank 1 853 10.9 9.6 17.0 86.7 Broadmeadows 1 670 10.8 9.6 15.8 88.0 Burwood 707 9.1 8.5 13.1 94.5 Camberwell 1 457 10.3 9.1 15.0 90.2 Carnegie 791 10.0 9.2 14.7 91.5 Caulfield 1 868 10.1 9.1 14.6 91.1 Central 1 858 9.3 8.3 13.5 93.4 Chelsea 1 454 10.5 9.2 16.6 87.0 Cheltenham 776 9.6 8.9 13.6 93.7 City 1 989 9.4 8.3 14.3 91.0 Clyde 641 11.1 9.7 17.2 83.6 Coburg 727 9.7 8.8 14.3 91.9 Craigieburn 682 11.6 9.7 17.9 84.5 Cranbourne 1 465 11.2 9.5 17.5 83.5 Croydon 880 11.0 10.0 16.4 85.8 Clinical Support Officers 757 10.5 9.5 16.1 86.1 Dallas 1 560 11.4 10.5 16.6 83.9 Dandenong 1 781 10.7 9.6 15.8 88.4 Darley 401 12.4 11.0 19.1 70.8 Diamond Creek 605 12.3 11.2 19.1 78.5 Docklands 959 9.2 8.0 14.0 93.4 Doncaster 757 10.0 9.3 14.3 91.3 Doveton 896 11.7 10.6 16.7 83.7 Eltham 1 670 11.6 10.5 17.5 81.8 Emerald 626 17.2 15.8 28.8 45.2 Epping 1 677 11.7 10.0 18.8 81.2 Essendon 1 682 10.9 9.8 15.8 88.1 Ferntree Gully 1 726 10.3 9.3 15.2 89.6 Footscray 1 736 10.6 9.2 15.7 88.5

Appendix A. Ambulance response times, by responding branch
Victorian Auditor-General’s Report Access to Ambulance Services 59
Figure A1 Code 1 response times by metropolitan responding branch, 2009–10
– continued Response time (minutes)
Responding branch
Code 1 incidents (number) Average
50thpercentile
90th percentile
Within 15 minute target
(per cent) Frankston 1 674 10.8 9.4 16.3 85.4 Glen Iris 681 10.4 9.6 15.2 89.3 Glenroy 838 11.1 9.9 15.6 87.7 Greensborough 1 671 10.3 9.1 15.1 89.9 Greenvale 689 10.2 9.3 14.6 91.9 Hadfield 1 569 11.2 10.1 16.6 85.0 Hampton Park 795 10.8 9.7 15.8 86.8 Hartwell 1 505 10.5 9.5 15.7 88.3 Hastings 1 151 12.2 10.8 19.9 78.6 Hawthorn 688 11.0 9.5 16.4 86.5 Healesville 617 16.3 13.0 29.9 60.1 Heatherton 1 686 10.8 9.7 15.7 87.7 Highett 909 10.4 9.2 15.5 88.3 Hillside 1 528 12.5 10.7 21.0 76.2 Hoppers Crossing 891 10.5 9.4 15.4 88.9 Ivanhoe 726 10.6 9.5 15.5 88.8 Jackson's Creek 483 10.9 9.4 18.4 84.3 Karingal 1 297 12.7 11.4 20.5 75.9 Kealba 845 10.7 9.4 16.0 87.8 Kensington 633 10.3 9.5 15.2 88.9 Kew 665 9.6 8.6 14.5 91.6 Keysborough 899 10.9 9.7 15.9 87.7 Kinglake 150 19.5 16.3 38.7 42.7 Kingsbury 574 9.9 9.1 14.1 93.0 Knox 1 722 10.5 9.4 15.5 89.2 Kooyong 900 10.6 9.6 15.4 89.2 Langwarrin 597 11.9 10.6 19.2 79.1 Laverton 1 288 12.6 11.3 18.9 76.5 Lilydale 1 637 11.3 9.9 17.7 84.2 Lyndhurst 715 11.1 9.7 16.9 84.9 Melton 1 361 10.7 8.9 17.8 84.4

Appendix A. Ambulance response times, by responding branch
60 Access to Ambulance Services Victorian Auditor-General’s Report
Figure A1 Code 1 response times by metropolitan responding branch, 2009–10 –
continued Response time (minutes)
Responding branch
Code 1 incidents (number) Average
50thpercentile
90th percentile
Within 15 minute target
(per cent) MICA 1 1 858 10.3 9.5 15.1 89.9 MICA 2 1 720 10.1 9.1 14.9 90.2 MICA 3 1 674 10.6 9.8 15.5 88.4 MICA 4 1 647 10.6 9.7 15.6 88.7 MICA 5 1 792 10.4 9.7 14.9 90.3 MICA 6 1 623 11.1 10.2 16.8 84.9 MICA 7 1 546 10.7 9.8 15.7 87.9 MICA 8 1 697 10.4 9.6 15.5 88.0 MICA 9 1 205 12.4 11.1 18.6 78.8 MICA 10 1 885 11.3 10.4 15.9 87.3 MICA 11 1 940 11.2 10.4 16.0 87.0 MICA 12 1 165 13.4 12.2 21.4 66.8 MICA 13 1 500 11.2 10.0 17.5 84.6 MICA 14 1 875 12.5 11.7 17.3 80.4 MICA 15 1 750 11.2 10.4 16.6 84.7 MICA 16 1 768 11.4 10.7 16.3 84.6 Millgrove 432 13.7 11.5 23.4 68.8 Mitcham 824 10.5 9.5 14.8 90.8 Montrose 1 586 11.6 10.1 17.9 83.5 Moonee Ponds 1 912 9.5 8.6 13.7 93.1 Mooroolbark 1 652 11.5 10.2 17.8 83.1 Mordialloc 1 457 10.9 9.7 15.9 87.4 Moreland 777 10.4 9.3 14.9 90.2 Mornington 1 384 11.6 9.3 20.7 78.3 MR300 752 9.2 8.6 12.6 95.7 MR301 931 8.7 8.0 13.0 95.3 MR302 846 8.8 8.1 12.9 95.7 Narre Warren 630 12.7 11.3 19.5 75.6 Newport 770 10.6 9.5 16.4 86.9 Noble Park 762 9.8 9.1 14.1 93.2 Northcote 1 471 10.1 8.7 14.4 91.3 Northland 654 9.6 8.9 14.1 92.4

Appendix A. Ambulance response times, by responding branch
Victorian Auditor-General’s Report Access to Ambulance Services 61
Figure A1 Code 1 response times by metropolitan responding branch, 2009–10
–continued Response time (minutes)
Responding branch
Code 1 incidents (number) Average
50thpercentile
90th percentile
Within 15 minute target
(per cent) Nunawading 1 844 10.7 9.6 15.1 89.9 Oak Park 1 551 10.9 10.0 16.1 87.1 Officer 649 12.6 10.1 23.4 72.3 Ormond 876 10.4 9.2 15.3 88.8 Pakenham 1 249 13.4 10.5 24.4 67.8 Patterson Lakes 800 11.4 10.2 16.2 86.3 Point Cook 1 393 11.7 10.8 17.7 79.5 Port Melbourne 655 10.7 8.9 16.1 87.5 Prahran 774 10.3 8.9 16.3 87.1 Preston 1 667 10.0 9.0 14.5 90.5 Regent 814 9.7 8.7 14.2 91.6 Research 700 10.1 9.5 14.6 91.4 Reservoir 1 468 11.0 9.8 16.4 86.7 Richmond 1 445 9.7 8.8 14.7 90.6 Ringwood 1 726 10.9 9.6 16.3 86.2 Rockbank 619 10.3 8.8 16.8 86.6 Rosebud 1 244 11.7 10.0 18.7 81.0 Rowville 1 553 10.9 10.0 15.4 89.1 Seaford 1 530 11.3 10.2 16.1 85.8 Skye 742 11.6 10.6 16.8 84.1 Somerville 734 11.0 9.1 20.1 81.1 Sorrento 719 14.3 12.7 22.1 65.4 South Morang 858 10.5 9.3 15.9 88.1 Southbank 736 10.0 8.8 14.9 90.1 Springvale 1 691 10.4 9.3 15.7 88.0 St Albans 1 693 10.9 9.6 15.9 88.1 Sth Melbourne 1 671 9.9 8.5 14.6 90.7 Sunbury 1 178 12.1 9.9 22.2 81.1 Sunshine 1 620 10.7 9.5 15.9 87.6 Syndal 854 10.2 8.9 14.6 91.1 Templestowe 709 11.6 10.6 16.8 84.5 Thomastown 1 816 10.9 9.7 16.0 87.4

Appendix A. Ambulance response times, by responding branch
62 Access to Ambulance Services Victorian Auditor-General’s Report
Figure A1 Code 1 response times by metropolitan responding branch, 2009–10 –
continued Response time (minutes)
Responding branch
Code 1 incidents (number) Average
50thpercentile
90th percentile
Within 15 minute target
(per cent) Thornbury 1 249 9.4 8.4 14.1 91.9 Tullamarine 897 9.7 8.6 14.8 90.0 Vermont South 1 789 10.1 9.0 14.4 91.5 Waverley 1 718 9.9 8.9 14.6 91.0 Werribee 1 833 10.5 9.6 15.5 88.6 West Melbourne 732 9.0 8.0 13.8 92.6 Wheelers Hill 1 509 11.1 10.0 16.3 86.3 Whittlesea 687 14.9 13.1 25.1 61.7 Windsor 2 060 9.2 8.2 13.5 93.6 Yarra Junction 629 14.6 12.9 22.2 63.8
Total/average 176 811 10.9 9.6 16.6 86.2 Notes: Data included in Figure A1 are from AV’s metropolitan database, sourced from the Emergency Services Telecommunications Authority computer aided dispatch system.
The following have been removed from the table but contribute to the overall metropolitan results: (i) 194 incidents responded to by event cars, bicycle response unit, the MICA meal break unit, and field, group and team managers (ii) 1 018 incidents responded to by 10 reserve branches.
Minor differences exist in the metropolitan totals in this figure and in Part 2 of this report due to the above exclusions.
Source: Victorian Auditor-General’s Office, using Ambulance Victoria data.
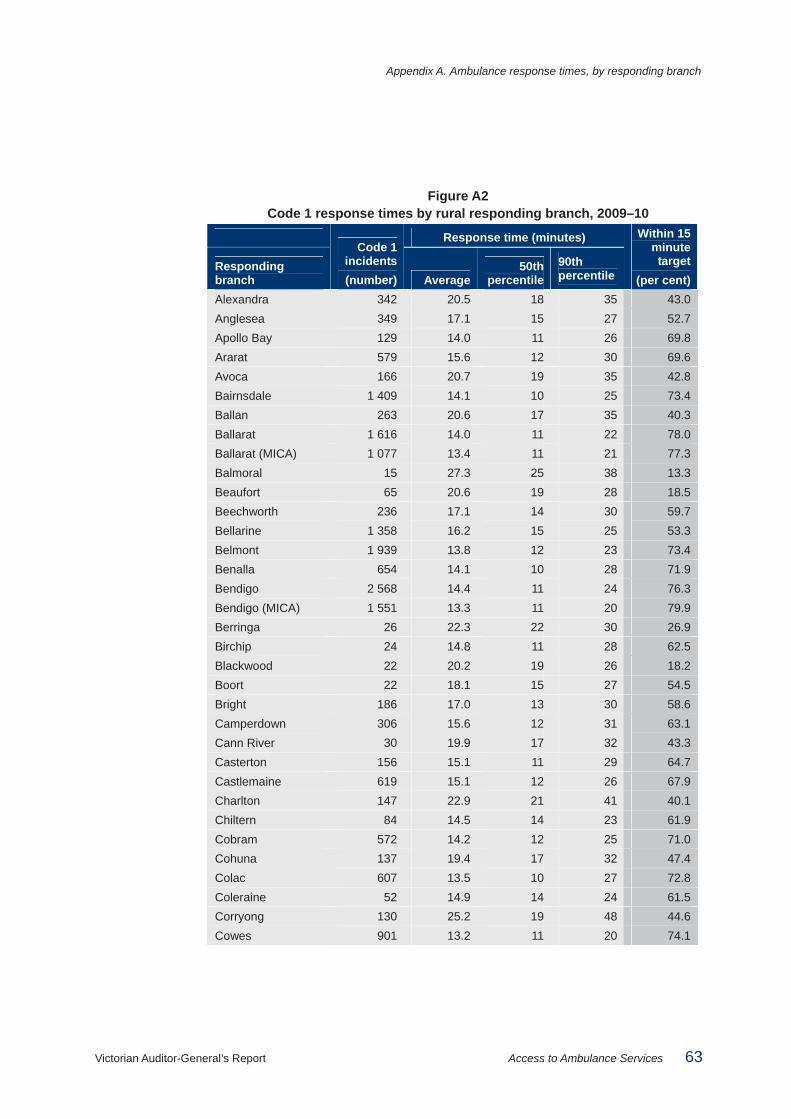
Appendix A. Ambulance response times, by responding branch
Victorian Auditor-General’s Report Access to Ambulance Services 63
Figure A2 Code 1 response times by rural responding branch, 2009–10
Response time (minutes)
Responding branch
Code 1 incidents (number) Average
50thpercentile
90th percentile
Within 15 minute target
(per cent) Alexandra 342 20.5 18 35 43.0 Anglesea 349 17.1 15 27 52.7 Apollo Bay 129 14.0 11 26 69.8 Ararat 579 15.6 12 30 69.6 Avoca 166 20.7 19 35 42.8 Bairnsdale 1 409 14.1 10 25 73.4 Ballan 263 20.6 17 35 40.3 Ballarat 1 616 14.0 11 22 78.0 Ballarat (MICA) 1 077 13.4 11 21 77.3 Balmoral 15 27.3 25 38 13.3 Beaufort 65 20.6 19 28 18.5 Beechworth 236 17.1 14 30 59.7 Bellarine 1 358 16.2 15 25 53.3 Belmont 1 939 13.8 12 23 73.4 Benalla 654 14.1 10 28 71.9 Bendigo 2 568 14.4 11 24 76.3 Bendigo (MICA) 1 551 13.3 11 20 79.9 Berringa 26 22.3 22 30 26.9 Birchip 24 14.8 11 28 62.5 Blackwood 22 20.2 19 26 18.2 Boort 22 18.1 15 27 54.5 Bright 186 17.0 13 30 58.6 Camperdown 306 15.6 12 31 63.1 Cann River 30 19.9 17 32 43.3 Casterton 156 15.1 11 29 64.7 Castlemaine 619 15.1 12 26 67.9 Charlton 147 22.9 21 41 40.1 Chiltern 84 14.5 14 23 61.9 Cobram 572 14.2 12 25 71.0 Cohuna 137 19.4 17 32 47.4 Colac 607 13.5 10 27 72.8 Coleraine 52 14.9 14 24 61.5 Corryong 130 25.2 19 48 44.6 Cowes 901 13.2 11 20 74.1

Appendix A. Ambulance response times, by responding branch
64 Access to Ambulance Services Victorian Auditor-General’s Report
Figure A2 Code 1 response times by rural responding branch, 2009–10 – continued
Response time (minutes)
Responding branch
Code 1 incidents (number) Average
50thpercentile
90th percentile
Within 15 minute target
(per cent) Daylesford 261 19.9 17 33 39.8 Dimboola 161 24.4 20 48 43.5 Donald 64 19.8 17 34 43.8 Dunmunkle 75 17.2 18 27 37.3 Echuca 1 342 14.3 12 25 70.3 Edenhope 84 22.5 19 41 42.9 Eildon 45 21.7 19 30 28.9 Euroa 341 16.9 13 30 61.0 Falls Creek 16 26.8 10 55 68.8 Foster 220 20.8 18 37 40.9 Geelong 465 14.7 12 22 70.8 Geelong (MICA) 2 693 13.7 12 22 72.6 Gisborne 536 16.0 14 25 56.3 Glenthompson 34 24.7 27 35 20.6 Goroke 29 17.3 14 29 51.7 Grantville 136 18.0 18 25 30.1 Halls Gap 25 19.0 17 26 36.0 Hamilton 622 14.5 10 28 72.0 Hawkesdale 22 20.9 21 33 27.3 Heathcote 299 17.5 16 27 46.2 Heyfield 104 19.5 15 28 50.0 Heywood 152 17.0 15 30 52.6 Hopetoun 13 23.1 20 33 15.4 Horsham 1 083 11.9 9 21 82.4 Inglewood 188 23.7 21 40 33.5 Irymple 806 13.2 12 19 78.2 Jeparit 16 11.8 8 20 68.8 Kangaroo Flat 897 14.6 11 24 71.9 Kaniva 32 15.0 13 26 65.6 Kerang 237 17.5 12 32 62.9 Kilmore 1 144 18.1 17 28 41.7 Korumburra 340 15.0 12 26 58.5 Kyabram 475 16.9 15 30 55.8 Kyneton 451 16.1 14 28 56.8

Appendix A. Ambulance response times, by responding branch
Victorian Auditor-General’s Report Access to Ambulance Services 65
Figure A2 Code 1 response times by rural responding branch, 2009–10 – continued
Response time (minutes)
Responding branch
Code 1 incidents (number) Average
50thpercentile
90th percentile
Within 15 minute target
(per cent) Lakes Entrance 904 13.8 10 26 73.1 Lara 1 051 15.6 14 24 61.2 Lavers Hill 24 21.4 20 36 37.5 Leigh Catchment 18 19.2 20 26 27.8 Leongatha 584 17.7 14 34 55.5 Lismore 28 18.2 17 24 32.1 Loch Sport 83 17.9 16 27 48.2 Lorne 121 14.1 11 29 67.8 Maffra 509 17.5 16 28 47.5 Maldon 79 15.1 15 22 58.2 Mallacoota 92 19.3 16 37 45.7 Manangatang 9 27.9 22 35 0.0 Mansfield 369 22.3 16 42 49.3 Maryborough 721 13.5 10 26 73.0 Marysville 21 24.4 21 35 19.0 Meredith 36 19.6 18 31 36.1 Mildura 2 314 11.1 9 18 85.4 Mirboo North 164 19.0 15 32 51.8 Mitta Mitta 29 25.3 26 36 20.7 Moe 1 779 13.6 11 25 74.4 Moira West 86 15.7 14 24 58.1 Mooroopna 605 14.5 13 26 65.6 Mortlake 125 20.0 15 39 49.6 Morwell 1 390 15.3 13 24 63.9 Morwell (MICA) 1 178 14.9 13 24 62.1 Mount Beauty 127 17.9 14 37 59.1 Mount Buller 52 12.0 7 25 80.8 Mount Hotham 17 23.4 18 29 41.2 Murchison 259 20.8 20 32 34.0 Murrayville 13 15.1 13 29 76.9 Myrtleford 236 17.4 13 26 57.6 Nagambie 146 12.2 11 17 80.8 Nangiloc 17 19.3 14 32 47.1 Neerim South 40 24.8 18 39 32.5

Appendix A. Ambulance response times, by responding branch
66 Access to Ambulance Services Victorian Auditor-General’s Report
Figure A2 Code 1 response times by rural responding branch, 2009–10 – continued
Response time (minutes)
Responding branch
Code 1 incidents (number) Average
50thpercentile
90th percentile
Within 15 minute target
(per cent) Nhill 137 17.9 13 37 67.2 Norlane 1 980 13.6 12 21 74.0 Nullawarre 24 18.3 18 25 25.0 Numurkah 434 18.4 16 30 44.0 Nyah West 151 18.3 15 36 52.3 Ocean Grove 1 197 16.6 14 26 56.4 Omeo 43 31.9 32 55 16.3 Orbost 199 16.8 12 37 61.8 Ouyen 114 17.6 12 38 65.8 Paynesville 345 13.9 12 23 69.3 Penshurst 35 16.4 15 27 57.1 Port Campbell 22 22.5 22 35 27.3 Port Fairy 213 13.2 10 22 70.9 Portland 431 12.2 11 19 79.6 Pyramid Hill 45 20.4 18 27 31.1 Rainbow 13 19.1 15 29 46.2 Robinvale 169 16.8 13 29 62.1 Rochester 278 19.2 17 34 44.6 Romsey 279 19.3 17 34 41.2 Sale 1 199 14.5 10 26 71.7 Sea Lake 113 20.1 15 36 51.3 Sebastopol 983 12.6 10 20 78.4 Seymour 710 16.4 13 29 59.0 Shepparton 2 722 13.7 12 23 76.3 Skipton 47 21.4 19 33 38.3 Snake Valley 46 15.8 15 23 50.0 St Arnaud 141 22.0 16 44 44.0 Stawell 443 15.1 11 29 69.8 Swan Hill 803 13.1 9 23 80.9 Tallangatta 205 21.2 18 40 43.9 Tambo Valley 34 26.6 24 43 5.9 Terang 226 14.0 11 25 64.6 Timboon 129 21.7 21 35 31.0 Tongala 55 12.0 11 21 83.6
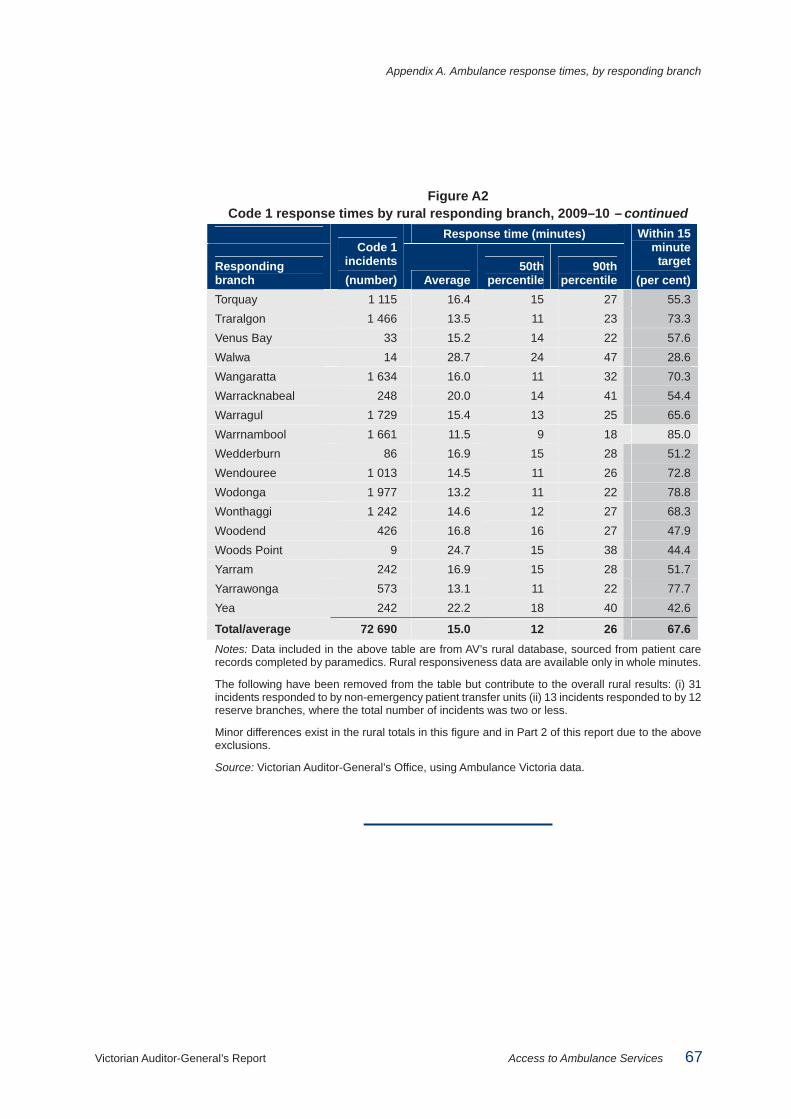
Appendix A. Ambulance response times, by responding branch
Victorian Auditor-General’s Report Access to Ambulance Services 67
Figure A2 Code 1 response times by rural responding branch, 2009–10 – continued
Response time (minutes)
Responding branch
Code 1 incidents (number) Average
50thpercentile
90th percentile
Within 15 minute target
(per cent) Torquay 1 115 16.4 15 27 55.3 Traralgon 1 466 13.5 11 23 73.3 Venus Bay 33 15.2 14 22 57.6 Walwa 14 28.7 24 47 28.6 Wangaratta 1 634 16.0 11 32 70.3 Warracknabeal 248 20.0 14 41 54.4 Warragul 1 729 15.4 13 25 65.6 Warrnambool 1 661 11.5 9 18 85.0 Wedderburn 86 16.9 15 28 51.2 Wendouree 1 013 14.5 11 26 72.8 Wodonga 1 977 13.2 11 22 78.8 Wonthaggi 1 242 14.6 12 27 68.3 Woodend 426 16.8 16 27 47.9 Woods Point 9 24.7 15 38 44.4 Yarram 242 16.9 15 28 51.7 Yarrawonga 573 13.1 11 22 77.7 Yea 242 22.2 18 40 42.6
Total/average 72 690 15.0 12 26 67.6 Notes: Data included in the above table are from AV’s rural database, sourced from patient care records completed by paramedics. Rural responsiveness data are available only in whole minutes.
The following have been removed from the table but contribute to the overall rural results: (i) 31 incidents responded to by non-emergency patient transfer units (ii) 13 incidents responded to by 12 reserve branches, where the total number of incidents was two or less.
Minor differences exist in the rural totals in this figure and in Part 2 of this report due to the above exclusions.
Source: Victorian Auditor-General’s Office, using Ambulance Victoria data.

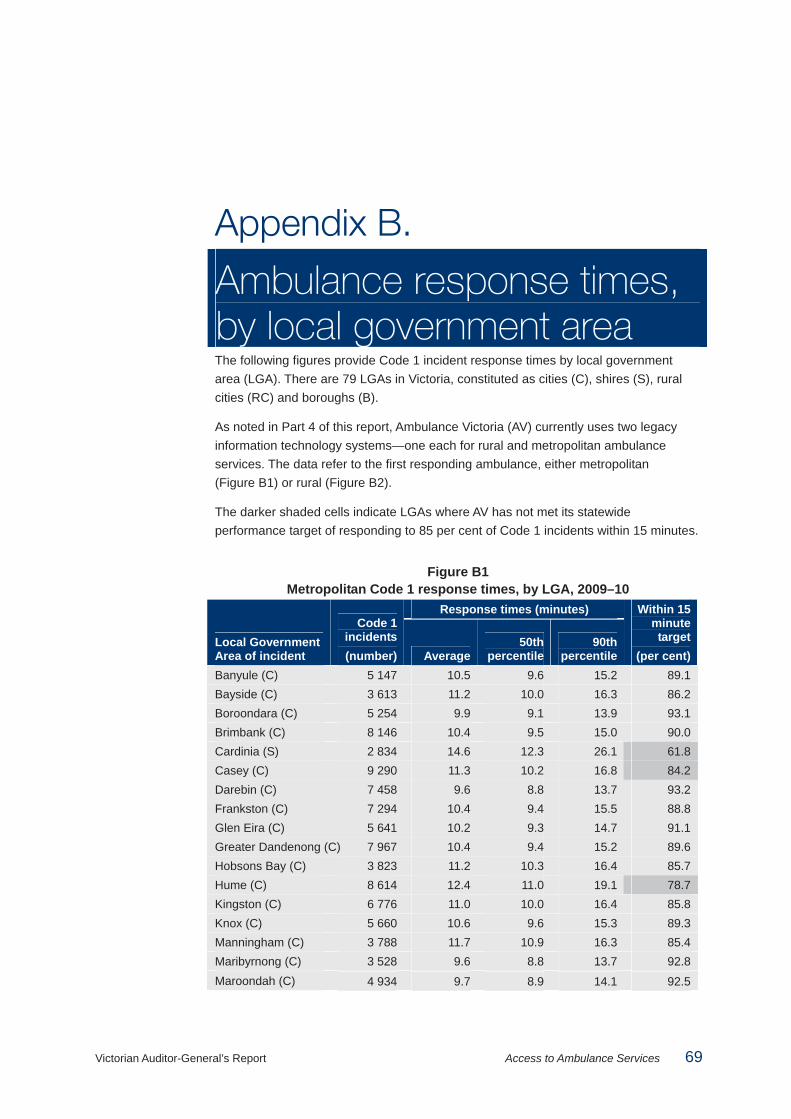
Victorian Auditor-General’s Report Access to Ambulance Services 69
Appendix B.
Ambulance response times, by local government area The following figures provide Code 1 incident response times by local government area (LGA). There are 79 LGAs in Victoria, constituted as cities (C), shires (S), rural cities (RC) and boroughs (B).
As noted in Part 4 of this report, Ambulance Victoria (AV) currently uses two legacy information technology systems—one each for rural and metropolitan ambulance services. The data refer to the first responding ambulance, either metropolitan (Figure B1) or rural (Figure B2).
The darker shaded cells indicate LGAs where AV has not met its statewide performance target of responding to 85 per cent of Code 1 incidents within 15 minutes.
Figure B1 Metropolitan Code 1 response times, by LGA, 2009–10
Response times (minutes)
Local Government Area of incident
Code 1 incidents (number) Average
50thpercentile
90th percentile
Within 15 minute target
(per cent) Banyule (C) 5 147 10.5 9.6 15.2 89.1 Bayside (C) 3 613 11.2 10.0 16.3 86.2 Boroondara (C) 5 254 9.9 9.1 13.9 93.1 Brimbank (C) 8 146 10.4 9.5 15.0 90.0 Cardinia (S) 2 834 14.6 12.3 26.1 61.8 Casey (C) 9 290 11.3 10.2 16.8 84.2 Darebin (C) 7 458 9.6 8.8 13.7 93.2 Frankston (C) 7 294 10.4 9.4 15.5 88.8 Glen Eira (C) 5 641 10.2 9.3 14.7 91.1 Greater Dandenong (C) 7 967 10.4 9.4 15.2 89.6 Hobsons Bay (C) 3 823 11.2 10.3 16.4 85.7 Hume (C) 8 614 12.4 11.0 19.1 78.7 Kingston (C) 6 776 11.0 10.0 16.4 85.8 Knox (C) 5 660 10.6 9.6 15.3 89.3 Manningham (C) 3 788 11.7 10.9 16.3 85.4 Maribyrnong (C) 3 528 9.6 8.8 13.7 92.8 Maroondah (C) 4 934 9.7 8.9 14.1 92.5

Appendix B. Ambulance response times, by local government area
70 Access to Ambulance Services Victorian Auditor-General’s Report
Figure B1 Metropolitan Code 1 response times, by LGA, 2009–10 – continued
Response times (minutes)
Local Government Area of incident
Code 1 incidents (number) Average
50thpercentile
90th percentile
Within 15 minute target
(per cent) Melbourne (C) 7 156 9.0 7.9 13.6 92.8 Melton (S) 3 912 12.4 10.9 19.7 74.9 Monash (C) 6 690 10.4 9.5 14.8 90.6 Moonee Valley (C) 5 354 10.3 9.4 14.6 91.2 Moorabool (S) 702 13.5 9.7 26.1 72.4 Moreland (C) 8 128 10.0 9.3 14.2 92.0 Mornington Peninsula (S)
7 928 13.0 11.3 21.6 71.7
Nillumbik (S) 1 684 14.7 13.4 23.4 60.8 Port Phillip (C) 4 440 9.7 8.8 14.2 91.8 Stonnington (C) 3 624 9.7 8.6 14.2 91.8 Whitehorse (C) 6 400 9.8 9.1 14.0 92.7 Whittlesea (C) 5 784 11.3 10.1 16.8 84.5 Wyndham (C) 4 743 12.2 10.8 19.2 77.0 Yarra (C) 4 074 8.8 7.9 12.6 94.5 Yarra Ranges (S) 6 091 13.8 11.9 22.6 68.7
Total/average 176 811 10.9 9.6 16.6 86.2
Note: Total includes 52 incidents with unknown LGAs and 282 incidents that occurred in rural region LGAs.
Source: Victorian Auditor-General’s Office, using Ambulance Victoria data.

Appendix B. Ambulance response times, by local government area
Victorian Auditor-General’s Report Access to Ambulance Services 71
Figure B2 Rural regions Code 1 response times, by LGA, 2009–10
Response times (minutes)
Local Government Area of incident
Code 1 incidents (number) Average
50thpercentile
90th percentile
Within 15 minute target
(per cent) Alpine (S) 644 20.2 14 40 53.3 Ararat (RC) 668 18.5 13 35 61.2 Ballarat (C) 4 064 11.8 10 17 86.2 Bass Coast (S) 2 342 14.8 12 25 66.7 Baw Baw (S) 2 099 16.9 14 30 60.5 Buloke (S) 330 21.7 17 42 47.3 Campaspe (S) 1 945 16.4 13 30 60.6 Central Goldfields (S) 747 14.9 11 30 70.1 Colac-Otway (S) 812 15.5 11 30 68.1 Corangamite (S) 679 16.8 13 31 56.8 Delatite (S) 1 124 16.7 11 33 63.8 East Gippsland (S) 3 051 14.7 11 27 69.6 Gannawarra (S) 354 19.7 13 34 58.2 Glenelg (S) 736 13.7 11 25 71.5 Golden Plains (S) 488 23.2 22 33 17.8 Greater Bendigo (C) 5 187 13.6 11 22 76.7 Greater Geelong (C) 10 704 14.2 13 22 69.1 Greater Shepparton (C) 3 355 13.3 12 21 76.3 Hepburn (S) 597 22.8 21 34 24.6 Hindmarsh (S) 286 19.6 14 47 60.1 Horsham (RC) 1 073 11.8 9 20 83.7 Indigo (S) 488 19.8 18 32 41.4 Latrobe (C) 5 391 13.3 11 22 72.3 Loddon (S) 468 24.6 23 42 29.9 Macedon Ranges (S) 1 632 16.5 15 27 53.1 Mansfield (S) 6 100.3 95 104 0.0 Mildura (RC) 3 070 11.3 10 17 85.5 Mitchell (S) 1 788 17.2 16 28 49.8 Moira (S) 1 630 16.5 13 29 60.0 Mount Alexander (S) 790 16.6 13 29 60.8 Moyne (S) 618 17.5 16 29 45.6 Murrindindi (S) 662 21.3 19 37 40.5 Northern Grampians (S) 565 15.6 12 30 68.0 Pyrenees (S) 305 21.4 21 34 32.1 Queenscliffe (B) 219 19.6 18 29 36.5 South Gippsland (S) 1 279 17.1 14 30 55.2

Appendix B. Ambulance response times, by local government area
72 Access to Ambulance Services Victorian Auditor-General’s Report
Figure B2 Rural regions Code 1 response times, by LGA, 2009–10 – continued
Response times (minutes)
Local Government Area of incident
Code 1 incidents (number) Average
50thpercentile
90th percentile
Within 15 minute target
(per cent) Southern Grampians (S) 702 14.3 11 26 71.2 Strathbogie (S) 612 18.1 14 33 54.9 Surf Coast (S) 1 089 16.8 14 29 54.6 Swan Hill (RC) 1 019 13.0 10 22 79.5 Towong (S) 359 22.8 19 43 44.3 Wangaratta (RC) 1 400 13.6 11 24 77.2 Warrnambool (C) 1 487 10.4 9 14 92.5 Wellington (S) 2 200 16.3 13 28 59.7 West Wimmera (S) 164 22.6 18 40 43.3 Wodonga (RC) 1 819 11.9 11 17 85.0 Wyndham (C) 18 28.5 19 33 33.3 Yarriambiack (S) 375 19.9 18 36 44.0
Total/average 72 690 15.0 12 26 67.6 Notes: Total includes one incident with an unknown LGA, 400 incidents that occurred in metropolitan LGAs and 782 incidents that occurred interstate.
Delatite (S) consists of Benalla (RC) and Mansfield (S).
Source: Victorian Auditor-General’s Office, using Ambulance Victoria data.
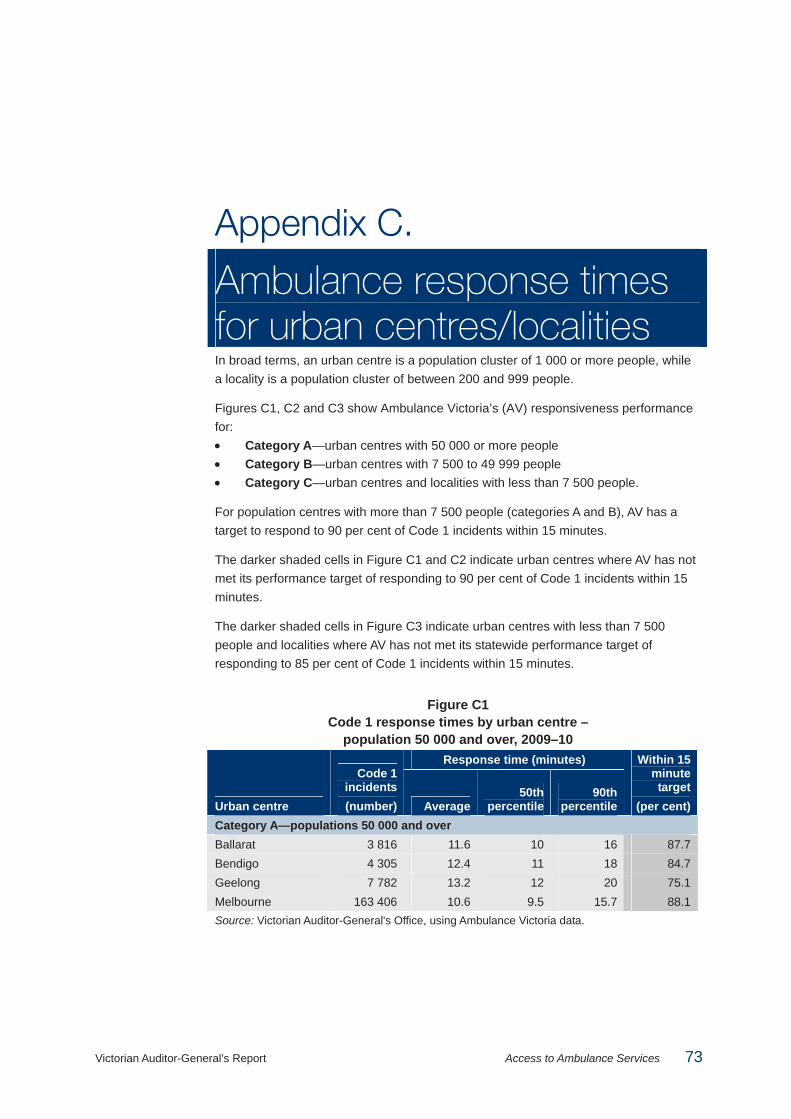
Victorian Auditor-General’s Report Access to Ambulance Services 73
Appendix C.
Ambulance response times for urban centres/localities In broad terms, an urban centre is a population cluster of 1 000 or more people, while a locality is a population cluster of between 200 and 999 people.
Figures C1, C2 and C3 show Ambulance Victoria’s (AV) responsiveness performance for: • Category A—urban centres with 50 000 or more people • Category B—urban centres with 7 500 to 49 999 people • Category C—urban centres and localities with less than 7 500 people.
For population centres with more than 7 500 people (categories A and B), AV has a target to respond to 90 per cent of Code 1 incidents within 15 minutes.
The darker shaded cells in Figure C1 and C2 indicate urban centres where AV has not met its performance target of responding to 90 per cent of Code 1 incidents within 15 minutes.
The darker shaded cells in Figure C3 indicate urban centres with less than 7 500 people and localities where AV has not met its statewide performance target of responding to 85 per cent of Code 1 incidents within 15 minutes.
Figure C1 Code 1 response times by urban centre –
population 50 000 and over, 2009–10 Response time (minutes)
Urban centre
Code 1 incidents (number) Average
50thpercentile
90th percentile
Within 15 minute target
(per cent) Category A—populations 50 000 and over Ballarat 3 816 11.6 10 16 87.7 Bendigo 4 305 12.4 11 18 84.7 Geelong 7 782 13.2 12 20 75.1 Melbourne 163 406 10.6 9.5 15.7 88.1 Source: Victorian Auditor-General's Office, using Ambulance Victoria data.

Appendix C. Ambulance response times for urban centres/localities
74 Access to Ambulance Services Victorian Auditor-General’s Report
Figure C2 Code 1 response times by urban centre –
population 7 500 to 49 999, 2009–10 Response time (minutes)
Urban centre
Code 1 incidents(number) Average
50thpercentile
90th percentile
Within 15 minute target
(per cent) Category B—populations 7 500 to 49 999 Metropolitan Melton 2 130 11.8 9.4 19.9 75.9 Pakenham 1 380 11.4 9.5 18.9 82.8 Sunbury 1 396 12.6 9.7 24.2 74.6 Bacchus Marsh 561 12.7 9.1 25.3 76.5 Rural and regional: Barwon South West Colac 466 13.0 9 21 84.8 Hamilton 463 10.9 9 16 88.8 Lara 359 14.4 12 24 63.8 Leopold 253 14.9 14 21 62.5 Ocean Grove-Barwon Heads
615 15.6 13 25 60.5
Portland 401 12.1 11 18 82.0 Torquay 376 14.6 12 25 63.0 Warrnambool 1 417 10.2 9 14 94.1 Rural and regional: Gippsland Bairnsdale 988 11.3 9 16 89.6 Moe-Yallourn 1 518 12.3 10 21 76.9 Morwell 1 463 11.5 10 18 84.4 Sale 809 10.6 9 16 89.2 Traralgon 1 437 12.1 11 19 78.0 Warragul 749 12.2 9 18 86.8 Rural and regional: Grampians Horsham 928 10.2 8 14 91.2 Rural and regional: Hume Benalla 540 12.2 9 27 81.7 Shepparton-Mooroopna
2 320 11.5 10 16 88.4
Wangaratta 1 008 10.5 10 14 93.8 Wodonga 1 609 11.3 10 16 88.9 Rural and regional: Loddon Mallee Echuca 766 11.8 9 18 85.5 Maryborough 552 12.5 9 24 82.2 Mildura 2 145 9.7 9 14 93.8 Swan Hill 622 10.2 8 13 94.2 Source: Victorian Auditor-General's Office, using Ambulance Victoria data.
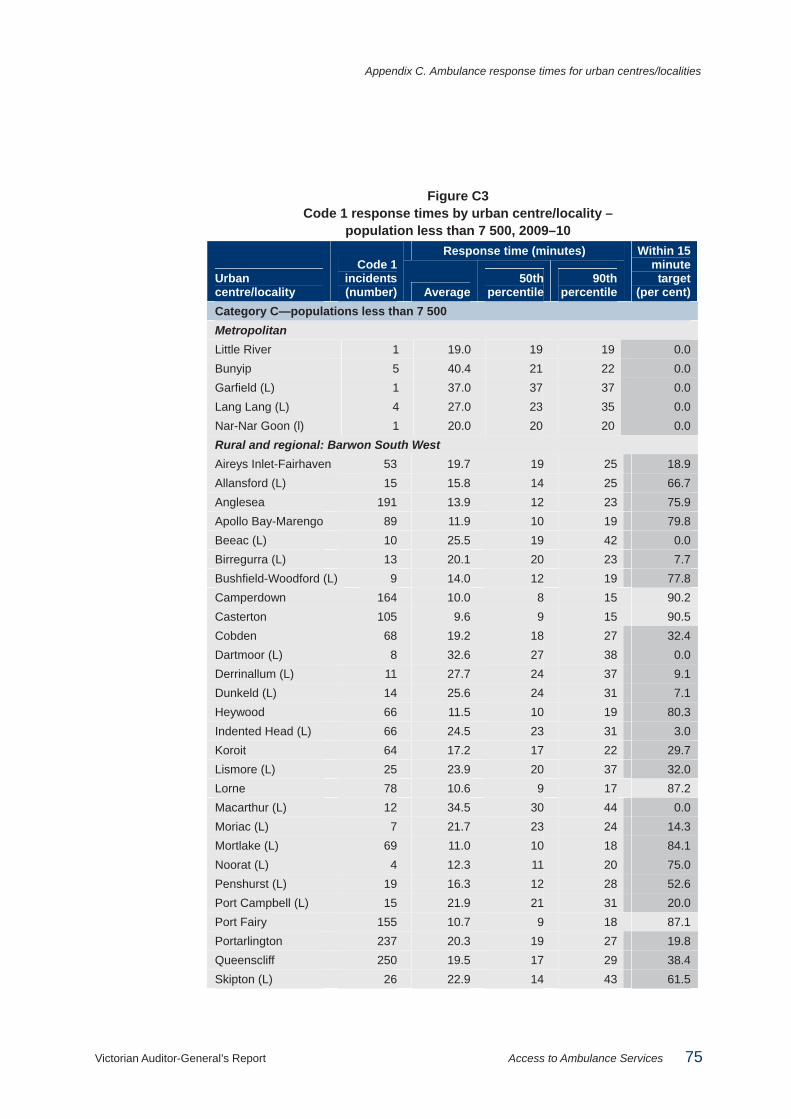
Appendix C. Ambulance response times for urban centres/localities
Victorian Auditor-General’s Report Access to Ambulance Services 75
Figure C3 Code 1 response times by urban centre/locality –
population less than 7 500, 2009–10 Response time (minutes)
Urban centre/locality
Code 1 incidents(number) Average
50thpercentile
90th percentile
Within 15 minute target
(per cent) Category C—populations less than 7 500 Metropolitan Little River 1 19.0 19 19 0.0 Bunyip 5 40.4 21 22 0.0 Garfield (L) 1 37.0 37 37 0.0 Lang Lang (L) 4 27.0 23 35 0.0 Nar-Nar Goon (l) 1 20.0 20 20 0.0 Rural and regional: Barwon South West Aireys Inlet-Fairhaven 53 19.7 19 25 18.9 Allansford (L) 15 15.8 14 25 66.7 Anglesea 191 13.9 12 23 75.9 Apollo Bay-Marengo 89 11.9 10 19 79.8 Beeac (L) 10 25.5 19 42 0.0 Birregurra (L) 13 20.1 20 23 7.7 Bushfield-Woodford (L) 9 14.0 12 19 77.8 Camperdown 164 10.0 8 15 90.2 Casterton 105 9.6 9 15 90.5 Cobden 68 19.2 18 27 32.4 Dartmoor (L) 8 32.6 27 38 0.0 Derrinallum (L) 11 27.7 24 37 9.1 Dunkeld (L) 14 25.6 24 31 7.1 Heywood 66 11.5 10 19 80.3 Indented Head (L) 66 24.5 23 31 3.0 Koroit 64 17.2 17 22 29.7 Lismore (L) 25 23.9 20 37 32.0 Lorne 78 10.6 9 17 87.2 Macarthur (L) 12 34.5 30 44 0.0 Moriac (L) 7 21.7 23 24 14.3 Mortlake (L) 69 11.0 10 18 84.1 Noorat (L) 4 12.3 11 20 75.0 Penshurst (L) 19 16.3 12 28 52.6 Port Campbell (L) 15 21.9 21 31 20.0 Port Fairy 155 10.7 9 18 87.1 Portarlington 237 20.3 19 27 19.8 Queenscliff 250 19.5 17 29 38.4 Skipton (L) 26 22.9 14 43 61.5

Appendix C. Ambulance response times for urban centres/localities
76 Access to Ambulance Services Victorian Auditor-General’s Report
Figure C3 Code 1 response times by urban centre/locality – population less than 7 500, 2009–10 – continued
Response time (minutes)
Urban centre/locality
Code 1 incidents(number) Average
50thpercentile
90th percentile
Within 15 minute target
(per cent) Rural and regional: Barwon South West – continued St Leonards 111 23.4 22 33 8.1 Terang 116 11.1 9 20 82.8 Timboon (L) 38 13.8 11 22 71.1 Winchelsea 78 29.3 29 35 3.8 Rural and regional: Gippsland Boolarra (L) 18 26.6 25 34 5.6 Briagolong (L) 27 24.0 23 29 7.4 Bruthen (L) 24 25.1 22 38 0.0 Cann River (L) 23 21.6 15 45 56.5 Cape Paterson (L) 42 15.7 13 26 64.3 Churchill 330 17.2 16 24 41.5 Corinella (L) 29 19.7 17 30 37.9 Coronet Bay (L) 61 21.6 21 33 31.1 Cowes 538 11.9 9 20 85.9 Darnum (L) 5 12.4 11 14 100.0 Dinner Plain (L) 434 14.9 14 20 68.0 Drouin 34 14.3 14 19 61.8 Eagle Point (L) 13 24.5 19 38 30.8 Glengarry (L) 57 22.0 19 34 14.0 Grantville (L) 114 18.9 17 29 44.7 Heyfield 287 16.2 15 22 54.7 Inverloch 16 14.1 13 18 68.8 Kilcunda (L) 206 11.0 9 17 87.4 Korumburra 21 14.4 14 20 71.4 Lake Tyers Beach (L) 672 11.3 9 21 87.1 Lakes Entrance 241 9.7 8 13 92.5 Lang Lang (L) 18 20.3 19 28 22.2 Leongatha 76 19.1 16 30 47.4 Lindenow (L) 46 21.3 20 26 6.5 Loch Sport (L) 274 13.0 11 20 73.7 Longwarry (L) 21 19.6 19 25 14.3 Maffra 17 20.6 18 25 29.4 Marlo (L) 39 23.3 23 27 12.8 Meeniyan (L) 85 14.5 11 28 68.2

Appendix C. Ambulance response times for urban centres/localities
Victorian Auditor-General’s Report Access to Ambulance Services 77
Figure C3 Code 1 response times by urban centre/locality – population less than 7 500, 2009–10 – continued
Response time (minutes)
Urban centre/locality
Code 1 incidents(number) Average
50thpercentile
90th percentile
Within 15 minute target
(per cent) Rural and regional: Gippsland – continued Metung (L) 30 19.3 18 25 23.3 Mirboo North 70 17.4 16 23 45.7 Neerim South (L) 21 20.3 18 25 9.5 Newhaven 21 24.2 22 31 9.5 Newlands Arm (L) 11 28.5 20 41 36.4 Nyora (L) 118 10.3 9 16 88.1 Omeo (L) 289 12.9 12 20 75.4 Orbost 16 25.3 22 31 0.0 Paynesville 21 20.4 18 27 23.8 Poowong (L) 25 34.8 34 40 0.0 Port Albert (L) 25 12.6 12 18 76.0 Rawson (L) 85 21.8 22 26 8.2 Rhyll (L) 112 17.2 17 22 29.5 Rosedale 25 13.8 12 17 72.0 San Remo (L) 57 18.5 16 25 43.9 Smiths Beach (L) 23 13.3 13 19 69.6 Stratford 33 15.2 13 24 72.7 Sunset Strip (L) 18 21.6 21 27 16.7 Surf Beach-Sunderland Bay (L)
19 14.6 14 18 78.9
Toongabbie (L) 152 15.4 15 21 59.2 Toora (L) 2 18.5 16 21 0.0 Trafalgar 50 23.5 24 34 34.0 Tyers (L) 21 12.6 11 14 90.5 Venus Bay (L) 655 12.5 9 21 86.1 Wimbledon Heights (L) 38 18.2 17 23 31.6 Wonthaggi 40 14.7 14 17 75.0 Yallourn North 119 13.8 10 24 73.9 Yarragon (L) 40 22.0 20 30 7.5 Yarram 18 26.6 25 34 5.6 Yinnar (L) 27 24.0 23 29 7.4 Rural and regional: Grampians Ararat 492 14.6 11 24 79.3 Avoca (L) 74 13.4 11 24 73.0 Ballan 107 14.7 12 25 64.5

Appendix C. Ambulance response times for urban centres/localities
78 Access to Ambulance Services Victorian Auditor-General’s Report
Figure C3 Code 1 response times by urban centre/locality – population less than 7 500, 2009–10 – continued
Response time (minutes)
Urban centre/locality
Code 1 incidents(number) Average
50thpercentile
90th percentile
Within 15 minute target
(per cent) Rural and regional: Grampians – continued Bannockburn 72 22.3 22 30 6.9 Beulah (L) 16 30.3 30 32 0.0 Blackwood (L) 10 23.8 19 39 20.0 Clunes 58 28.0 28 37 5.2 Creswick 119 20.3 19 27 18.5 Daylesford 174 18.3 15 33 51.1 Dimboola 78 13.8 11 26 74.4 Edenhope (L) 38 12.0 10 17 81.6 Enfield (L) 11 20.5 20 26 18.2 Gordon (L) 16 23.5 22 30 12.5 Goroke (L) 24 22.3 14 39 50.0 Halls Gap (L) 14 18.5 15 29 50.0 Hopetoun (L) 19 34.1 38 46 10.5 Inverleigh (L) 19 29.2 26 38 10.5 Jeparit (L) 43 26.3 28 47 30.2 Kaniva (L) 31 19.7 13 37 58.1 Learmonth (L) 11 19.6 22 23 27.3 Lethbridge (L) 6 25.8 25 31 0.0 Linton (L) 19 18.5 20 25 26.3 Meredith (L) 10 22.3 17 41 30.0 Minyip (L) 39 24.3 24 35 12.8 Murtoa (L) 49 21.1 21 28 16.3 Natimuk (L) 33 20.7 19 24 0.0 Nhill 98 14.0 12 20 83.7 Rainbow (L) 31 39.0 48 55 22.6 Rupanyup (L) 23 18.6 14 36 52.2 Smythesdale (L) 7 19.9 21 22 0.0 Snake Valley (L) 9 16.0 14 23 44.4 St Arnaud 110 19.3 14 39 58.2 Stawell 334 11.5 9 19 85.9 Trentham (L) 26 30.0 24 38 3.8 Warracknabeal 157 13.8 11 28 80.9 Willaura (L) 27 27.6 28 34 0.0 Woomelang (L) 13 26.2 24 31 7.7

Appendix C. Ambulance response times for urban centres/localities
Victorian Auditor-General’s Report Access to Ambulance Services 79
Figure C3 Code 1 response times by urban centre/locality – population less than 7 500, 2009–10 – continued
Response time (minutes)
Urban centre/locality
Code 1 incidents(number) Average
50thpercentile
90th percentile
Within 15 minute target
(per cent) Rural and regional: Hume Alexandra 164 13.8 12 23 72.0 Arcadia Downs (L) 2 18.0 18 18 0.0 Avenel (L) 22 24.7 22 46 4.5 Barnawartha (L) 10 19.8 17 28 20.0 Beechworth 159 15.1 11 31 74.2 Bellbridge (L) 11 23.4 24 30 18.2 Bright 120 16.8 12 32 64.2 Broadford 211 20.5 19 27 18.5 Bundalong (L) 10 18.7 19 20 0.0 Buxton (L) 10 24.6 22 36 20.0 Chiltern 58 15.9 14 27 62.1 Cobram 389 12.3 10 19 83.3 Corryong 60 10.7 10 15 90.0 Dookie (L) 7 37.9 44 50 0.0 Eildon (L) 6 23.8 23 25 0.0 Euroa 82 27.7 27 40 18.3 Glenrowan (L) 226 14.0 11 31 79.6 Hazeldene (L) 23 15.6 16 21 39.1 Katamatite (L) 17 32.8 32 36 0.0 Kilmore 20 24.1 24 31 10.0 Mansfield 361 13.7 11 25 78.7 Marysville (L) 183 13.2 10 21 79.8 Merrigum (L) 9 25.3 18 43 33.3 Mount Beauty 10 25.3 21 36 10.0 Moyhu (L) 89 15.8 11 28 73.0 Murchison (L) 6 27.8 26 33 0.0 Myrtleford 64 13.5 12 23 81.3 Nagambie 195 17.0 12 35 62.1 Nathalia 111 12.1 10 20 82.0 Numurkah 79 15.7 14 26 59.5 Oxley (L) 314 16.9 15 27 55.1 Porepunkah (L) 8 16.6 17 18 25.0 Pyalong (L) 17 18.1 17 21 35.3 Rutherglen 5 25.0 21 25 0.0

Appendix C. Ambulance response times for urban centres/localities
80 Access to Ambulance Services Victorian Auditor-General’s Report
Figure C3 Code 1 response times by urban centre/locality – population less than 7 500, 2009–10 – continued
Response time (minutes)
Urban centre/locality
Code 1 incidents(number) Average
50thpercentile
90th percentile
Within 15 minute target
(per cent) Rural and regional: Hume – continued Seymour 1 32.0 32 32 0.0 Strathmerton (L) 447 13.0 10 19 81.4 Tallangatta (L) 15 21.6 22 27 20.0 Tallarook (L) 104 15.6 10 33 70.2 Tallygaroopna (L) 17 22.5 20 29 11.8 Tangambalanga (L) 1 19.0 19 19 0.0 Tatura 14 23.6 21 30 0.0 Tawonga (L) 205 20.3 20 27 19.5 Tungamah (L) 10 17.1 16 19 30.0 Violet Town (L) 18 27.2 26 32 0.0 Wallan 40 21.6 21 28 10.0 Wandong-Heathcote Junction
209 18.8 18 25 25.4
Waterford Park (L) 41 21.8 18 32 24.4 Wunghnu (L) 12 23.7 21 31 0.0 Yackandandah (L) 17 19.1 18 23 29.4 Yarrawonga-Mulwala (Yarrawonga Part)
34 27.8 27 32 0.0
Rural and regional: Loddon Mallee Barham-Koondrook (Koondrook Part)
3 23.7 25 26 0.0
Birchip (L) 24 21.5 11 44 58.3 Boort (L) 42 29.3 27 50 33.3 Bridgewater (L) 29 17.5 15 28 55.2 Cabarita (L) 3 13.7 12 19 66.7 Campbells Creek 37 14.1 12 19 81.1 Carisbrook (L) 23 14.3 13 22 69.6 Castlemaine 426 14.5 10 28 77.5 Charlton 69 16.4 10 37 68.1 Chewton (L) 24 14.2 11 24 79.2 Cohuna 72 19.9 11 43 66.7 Donald 65 21.7 17 40 43.1 Dunolly (L) 30 24.7 23 31 6.7 Elmore (L) 57 24.4 22 37 17.5 Gisborne 204 13.3 10 25 70.1

Appendix C. Ambulance response times for urban centres/localities
Victorian Auditor-General’s Report Access to Ambulance Services 81
Figure C3 Code 1 response times by urban centre/locality – population less than 7 500, 2009–10 – continued
Response time (minutes)
Urban centre/locality
Code 1 incidents(number) Average
50thpercentile
90th percentile
Within 15 minute target
(per cent) Rural and regional: Loddon Mallee – continued Goornong (L) 7 22.0 20 27 0.0 Gunbower (L) 11 21.1 21 24 9.1 Harcourt (L) 11 15.9 15 21 54.5 Heathcote 164 16.9 13 35 64.0 Inglewood (L) 63 20.2 14 42 54.0 Kerang 181 16.3 11 26 79.6 Kyabram 335 15.1 12 27 71.0 Kyneton 298 14.3 11 24 69.1 Lake Boga (L) 28 17.1 16 21 39.3 Lancefield 71 18.4 17 29 40.8 Leitchville (L) 4 18.0 17 22 25.0 Lockington (L) 31 27.8 27 34 0.0 Macedon 29 16.6 15 23 51.7 Maldon 64 15.5 15 23 53.1 Malmsbury (L) 27 18.6 17 25 40.7 Manangatang (L) 13 33.8 34 48 0.0 Marong (L) 12 18.6 18 22 25.0 Merbein 146 16.1 15 21 55.5 Mount Macedon 35 19.6 18 28 22.9 Murrayville (L) 6 10.8 12 13 100.0 Newstead (L) 18 23.4 21 33 5.6 Nyah (L) 14 14.4 12 23 71.4 Nyah West (L) 45 15.1 12 23 68.9 Ouyen 77 12.7 10 16 87.0 Pyramid Hill (L) 46 23.9 20 43 30.4 Quambatook (L) 16 33.5 33 42 0.0 Red Cliffs 170 14.0 13 19 71.2 Riddells Creek 86 18.4 17 25 37.2 Robinvale 111 15.4 11 22 78.4 Rochester 153 14.8 12 25 69.3 Romsey 150 17.7 17 29 43.3 Rushworth 92 24.8 23 38 8.7 Sea Lake (L) 54 13.7 8 23 85.2 Stanhope (L) 24 26.8 26 34 4.2

Appendix C. Ambulance response times for urban centres/localities
82 Access to Ambulance Services Victorian Auditor-General’s Report
Figure C3 Code 1 response times by urban centre/locality – population less than 7 500, 2009–10 – continued
Response time (minutes)
Urban centre/locality
Code 1 incidents(number) Average
50thpercentile
90th percentile
Within 15 minute target
(per cent) Rural and regional: Loddon Mallee – continued Talbot (L) 22 19.8 18 26 18.2 Tongala 64 16.3 16 26 48.4 Tylden (L) 11 18.7 19 25 9.1 Underbool (L) 4 37.8 37 51 0.0 Wedderburn (L) 75 17.8 15 30 50.7 Woodend 218 13.3 11 21 73.4 Woorinen (L) 12 14.7 14 17 66.7 Wycheproof (L) 26 31.1 26 51 7.7 Source: Victorian Auditor-General's Office, using Ambulance Victoria data.

Victorian Auditor-General’s Report Access to Ambulance Services 83
Appendix D. Audit Act 1994 section 16—submissions and comments
Introduction In accordance with section 16(3) of the Audit Act 1994 a copy of this report was provided to the Department of Health, Emergency Services Telecommunications Authority and Ambulance Victoria with a request for submissions or comments.
Responses were received as follows: • Department of Health........................................................................................84 • Emergency Services Telecommunications Authority ........................................86 • Ambulance Victoria...........................................................................................87
The submissions and comments provided are not subject to audit nor the evidentiary standards required to reach an audit conclusion. Responsibility for the accuracy, fairness and balance of those comments rests solely with the agency head.
Appendix D. Audit Act 1994 section 16—submissions and comments
84 Access to Ambulance Services Victorian Auditor-General’s Report
Submissions and comments received
RESPONSE provided by the Secretary, Department of Health

Appendix D. Audit Act 1994 section 16—submissions and comments
Victorian Auditor-General’s Report Access to Ambulance Services 85
RESPONSE provided by the Secretary, Department of Health – continued

Appendix D. Audit Act 1994 section 16—submissions and comments
86 Access to Ambulance Services Victorian Auditor-General’s Report
RESPONSE provided by the Acting Chief Executive Officer, Emergency Services Telecommunications Authority

Appendix D. Audit Act 1994 section 16—submissions and comments
Victorian Auditor-General’s Report Access to Ambulance Services 87
RESPONSE provided by the Acting Chief Executive Office, Ambulance Victoria

Appendix D. Audit Act 1994 section 16—submissions and comments
88 Access to Ambulance Services Victorian Auditor-General’s Report
RESPONSE provided by the Acting Chief Executive Office, Ambulance Victoria – continued

Appendix D. Audit Act 1994 section 16—submissions and comments
Victorian Auditor-General’s Report Access to Ambulance Services 89
RESPONSE provided by the Acting Chief Executive Office, Ambulance Victoria – continued

Appendix D. Audit Act 1994 section 16—submissions and comments
90 Access to Ambulance Services Victorian Auditor-General’s Report
RESPONSE provided by the Acting Chief Executive Office, Ambulance Victoria – continued

Auditor-General’s reports
Reports tabled during 2010–11
Report title Date tabled
Portfolio Departments: Interim Results of the 2009–10 Audits (2010–11:1) July 2010
Taking Action on Problem Gambling (2010–11:2) July 2010
Local Government: Interim Results of the 2009–10 Audits (2010–11:3) August 2010
Water Entities: Interim Results of the 2009–10 Audits (2010–11:4) August 2010
Public Hospitals: Interim Results of the 2009–10 Audits (2010–11:5) September 2010
Business Continuity Management in Local Government (2010–11:6) September 2010
Sustainable Farm Families Program (2010–11:7) September 2010
Delivery of NURSE-ON-CALL (2010–11:8) September 2010
Management of Prison Accommodation Using Public Private Partnerships (2010–11:9)
September 2010
Soil Health Management (2010–11:10) October 2010
Sustainable Management of Victoria's Groundwater Resources (2010–11:11) October 2010
The Department of Human Services’ Role in Emergency Recovery (2010–11:12)
October 2010
VAGO’s website at <www.audit.vic.gov.au> contains a comprehensive list of all reports issued by VAGO. The full text of the reports issued is available at the website.

Availability of reports Copies of all reports issued by the Victorian Auditor-General's Office are available from:
• Information Victoria Bookshop 505 Little Collins Street Melbourne Vic. 3000 AUSTRALIA
Phone: 1300 366 356 (local call cost) Fax: +61 3 9603 9920 Email: <[email protected]>
• Victorian Auditor-General's Office Level 24, 35 Collins Street Melbourne Vic. 3000 AUSTRALIA
Phone: +61 3 8601 7000 Fax: +61 3 8601 7010 Email: <[email protected]> Website: <www.audit.vic.gov.au>