Embed Size (px)
Citation preview

Access Bank Plc
Consolidated and separate financial statements for the year ended
31 December 2016

ACCESS BANK PLCIndex to the consolidated financial statementsFor the year ended 31 December 2016
Note Page Note Page
i Corporate information 3 13 Other operating income 169
ii Directors' report 4 14 Personnel expenses 169
iii Corporate Governance report 8 15 Other operating expenses 171
iv Statement of Directors' responsibilities 25 16 Income tax expense recognized in the profit or loss 172
v Report of the Statutory Audit Committee 26 17 Basic earnings per share 173
vi Risk management framework 28 18 Cash and balances with banks 173
vii Independent auditors report 43 19 Investment under management 174
viii Consolidated statement of comprehensive income 51 20 Non pledged trading assets 174
ix Consolidated statement of financial position 52 21 Derivative financial instruments 175
x Consolidated statement of changes in equity 53 22 Loans and advances to banks 175
xi Consolidated statement of cashflows 55 23 Loans and advances to customers 175
xii Notes to the financial statements 56 24 Pledged assets 178
1 General information 56 25 Investment securities 178
2
Statement of compliance with international financial
reporting standards. 56 26 Other assets 179
3 Summary of significant accounting policies 56 27 Investment in subsidiary 182
3.1 Basis of preparation 56 28 Property and equipment 183
3.2 Changes in accounting policy and disclosures 57 29 Intangible assets 185
3.3 Basis of consolidation 60 30 Deferred tax assets and liabilities 190
3.4Segment reporting
61
31
Non-current assets and non-current
liabilities held for sale 191
3.5 Foreign currency translation 61 32 Deposits from financial institutions 191
3.6 Operating income 62 33 Deposits from customers 191
3.7 Lease payments 63 34 Other liabilities 191
3.8 Income tax expense 63 35 Debt securities issued 192
3.9 Financial assets and liabilities 64 36 Interest bearingborrowings 193
3.10 Investment properties 71 37 Retirement benefit obligations 195
3.11 Property and equipment 71 38 Capital and reserves 197
3.12 Intangible assets 72 39 Contingencies 200
3.13 Leases 72 40 Cash and cash equivalents for cashflow purposes 200
3.14 Impairment of non-financial assets 73 41
Contraventions of the Banks and Other
Financial Institutions Act of Nigeria and
CBN circulars 202
3.15 Discontinued operation 73
3.16 Non-current asset (or disposal groups) held for sale 74 42 Events after the reporting date 202
3.17 Provisions 74 43 Related parties 202
3.18 Financial guarantee 74 44 Director-related exposures 205
3.19 Employee benefit 75 45 Non-audit services 206
3.20 Share capital and reserves 76 Other national disclosures:
4 Use of estimates and jugdements 77 Value added statement 207
5 Financial risk management 91 Five-year financial summary 209
6 Capital management 161
7 Operating segment 162
8 Net interest income 168
9 Charge on financial and non-financial assets 168
10 Fee and commission income 168
11
Net gains on financial instruments classified as held for
trading
168
12 Foreign exchange income 169

Access Bank Plc
Consolidated financial statements
For the year ended 31 December 2016
Directors, officers and professional advisors
Directors
Mosun Belo-Olusoga Chairman/Non-Executive Director
Herbert Onyewumbu Wigwe GMD/Executive Director
Obinna David Nwosu GDMD/Executive Director
Ernest Chukwuka Ndukwe Independent Non-Executive Director
Oritsedere Samuel Otubu* Non-Executive Director
Anthonia Olufeyikemi Ogunmefun Non-Executive Director
Paul Usoro, SAN Non-Executive Director
Emmanuel Chiejina Non-Executive Director
Abba Mamman Tor Habib** Non-Executive Director
Ajoritsedere Josephine Awosika Independent Non-Executive Director
Victor Okenyenbunor Etuokwu Executive Director
Roosevelt Michael Ogbonna Executive Director
Ojinika Nkechinyelu Olaghere Executive Director
Elias Igbinakenzua*** Executive Director
Titi Osuntoki Executive Director
* Retired effective September 1, 2016
** Appointed effective January 28, 2016
** Resigned effective December 31, 2016
Company Secretary
Mr Sunday Ekwochi
Corporate Head Office
Access Bank Plc
Plot 999c, Danmole Street,
Victoria Island, Lagos.
Telephone: +234 (01) 4619264 - 9
+234 (01) 2773399-99
Email: [email protected]
Website: www.accessbankplc.com
Company Registration Number: RC125 384
FRC Number: FRC/2012/0000000000271
Independent Auditors
PricewaterhouseCoopers
Landmark Towers, 5b Water Corporation way, Oniru
Victoria Island, Lagos
Telephone: (01) 271 1700
Website: www.ng.pwc.com
Actuaries
Alexander Forbes Consulting Actuaries Nig. Ltd
Rio Plaza, 2nd Floor , Plor 235, Muri Okunola Street
Victoria Island, Lagos
Telephone: (01) 271 1081
FRC Number: FRC/2012/0000000000504
Registrars
United Securities Limited
10 Amodu Ojikutu Street
Victoria Island, Lagos
Telephone: +234 01 730898
+234 01 730891
This is the list of Directors who served in the entity during the year and up to the date of this report
3

Access Bank Plc
Consolidated financial statements
For the year ended 31 December 2016
Group Group Bank Bank
Dec-16 Dec-15 Dec-16 Dec-15
In thousands of Naira
Gross earnings 381,320,783 337,404,230 331,000,972 302,061,975
Profit before income tax 90,339,456 75,038,117 80,579,576 65,177,914
Income tax expense (18,900,109) (9,169,344) (16,553,441) (6,253,169)
Profit for the period 71,439,347 65,868,773 64,026,135 58,924,745
Other comprehensive (loss)/gain 32,060,674 338,704 12,653,178 2,396,344
Total comprehensive income for the period 103,500,021 66,207,477 76,679,313 61,321,090
Non-controlling interest 2,258,752 408,813 - - 101,241,270 65,798,664 76,679,313 61,321,090
Group Group Bank Bank
Dec-16 Dec-15 Dec-16 Dec-15
In thousands of Naira
Earnings per share - Basic (k) 250 265 221 237
Dividend (paid):
Interim dividend paid 7,231,993 7,231,993 7,231,993 7,231,993
Final dividend declared in 2015 and paid in 2016 - 8,678,391 - 8,678,391
Proposed final dividend declared in 2016 to be paid in 2017 11,571,189 - 11,571,189 -
Group Group Bank Bank
In thousands of Naira Dec-16 Dec-15 Dec-16 Dec-15
454,494,580 367,801,467 421,678,620 360,428,904
Total impaired loans and advances 39,438,630 24,416,535 31,546,928 19,996,906
2.10% 1.70% 1.80% 1.50%
Interim dividend
Proposed dividend
Directors and their interests
Number of Ordinary Shares of 50k each held as at
Direct Indirect Direct Indirect
M. Belo-Olusoga- Chairman 3,604,838 - 3,604,838 -
H. O. Wigwe - GMD/CEO 206,231,713 2,480,582,395 206,231,713 2,376,459,113
O. D Nwosu - GDMD 30,004,585 - 30,004,585 -
O. S. Otubu* 14,201,166 13,217,098 26,226,262 26,985,212
E. Chiejina 9,441,005 - 9,441,005 -
K. Ogunmefun - 1,309,763 - 991,333
V.O. Etuokwu 13,579,889 - 13,579,889 -
R. C. Ogbonna - ED 28,000,558 - 28,000,558 -
O.N. Olaghere - ED 19,451,332 - 19,451,332 -
E. Igbinakenzua - ED** 18,145,477 - 18,145,477 -
T. Osuntoki - ED 28,728,854 - 28,728,854 -
P. Usoro 1,209,634 - 1,209,634 -
A. Awosika - - - -
E. Ndukwe 700,000 - 700,000 -
A. Mamman Tor Habib*** - - - -
* Retired effective September 1, 2016
** Resigned effective December 31, 2016
*** Appointed effective January 28, 2016
The Board of Directors proposed and paid an Interim Dividend of 25 Kobo per ordinary share (HY2015: 25K) each payable to shareholders on register of shareholding at the closure date.
Withholding Tax was deducted at the time of payment.
The Board of Directors proposed a Final Dividend of 40 kobo (FY 2015: 30 kobo) each payable to shareholders on register of shareholding at the closure date. Withholding tax will be deducted at
the time of payment.
The Directors who served during the period, together with their direct and indirect interests in the issued share capital of the Bank as recorded in the Register of Directors' Shareholding and as
notified by the Directors for the purposes of Sections 275 and 276 of the Companies and Allied Matters Act and listing requirements of the Nigerian Stock Exchange is noted below:
31-Dec-16 31-Dec-15
Highlights of the Group’s operating results for the period are as follows:
Profit attributable to equity holders of the Bank
Total equity
Total impaired loans and advances to gross risk assets (%)
The Bank's principal activities incude the provision of money market products and services, retail banking, granting of loans and advances, equipment leasing, corporate finance and foreign
exchange operations.
The Bank has the following international banking subsidiaries: Access Bank (Gambia) Limited, Access Bank (Sierra Leone) Limited, Access Bank (Zambia) Limited, The Access Bank (UK) Limited,
Access Bank (Ghana) Plc, Access Bank Rwanda, Access Bank (D.R. Congo). The Bank also has Access Finance BV, an offshore Special Purpose Vehicle for the issuance of the U.S.$350,000,000,
7.25 Per Cent Guaranteed Notes Due 2017 guaranteed by the Bank (There are only USD237,003,000 outstanding as at period end due to an exchange of USD 112,997,000 in Oct. 2016: see note 35).
The Bank also operates a Representative office in China, UAE and Lebanon.
In furtherance of the objective of bringing the Bank's activities in compliance with the provisions of the Central Bank of Nigeria's Regulation on Scope of Banking Activities and Other Ancilliary
Matters, on the permitted activities for Commercial Banks with International Authorisation, the Bank is currently at the final stage of winding-up of Intercontinental Bureau de Change Limited, a
subsidiary inherited from the defunct Intercontinental Bank Plc.
The financial results of all operating subsidiaries have been consolidated in these financial statements.
Operating results
Directors’ Report
For the year ended 31 December, 2016
The Directors have pleasure in presenting their report on the affairs of Access Bank Plc (the “Bank”) together with its subsidiaries (the “Group”), the Group and the Bank Audited Financial
Statements with Auditor’s Report for the Year ended 31 December 2016.
Legal form and principal activity
The Bank was incorporated as a private limited liability company on 8 February 1989 and commenced business on 11 May 1989. The Bank was converted to a public limited liability company on 24
March 1998 and its shares were listed on the Nigerian Stock Exchange on 18 November 1998. The Bank was issued a universal banking license by the Central Bank of Nigeria on 5 February 2001.
4

Access Bank Plc
Consolidated financial statements
For the year ended 31 December 2016
Directors’ interest in contracts
Related director Interest in entity Name of company Services to the Bank
Mrs. Mosun Belo- Olusoga Director/Shareholder The KRC Ltd. Training services
Mr. Oritsedere Otubu Shareholder Staco Insurance Plc Insurance Services
Mr. Oritsedere Otubu Director Senforce Insurance Brokers Ltd Insurance brokerage servicesMr. Oritsedere Otubu Director Eko Electricity Distribution Coy. Ltd. Electricity ServicesMr. Paul Usoro Director Airtel Nigeria Ltd Mobile telephone Mr. Paul Usoro Shareholder Paul Usoro & Co Legal Advisory ServiceMr. Herbert Wigwe Shareholder Coronation Securities Ltd. Brokerage servicesMr. Herbert Wigwe Shareholder Wapic Insurance Plc Insurance Services
Mr. Emmanuel Chiejina Director Sumeru Nigeria Limited Tele-marketing
Mrs. Ojinika Olaghere Shareholder Wapic Insurance Plc Insurance Services
Analysis of shareholding:
The shareholding pattern of the Bank as at 31 December 2016 was as stated below:
31 December 2016
Range Number of
Shareholders
% of Shareholders Number of shares held % of Shareholders
Domestic Shareholders
1-5,000 660,001 80.65 617,782,180 2.14
5,001-10,000 65,876 8.05 450,728,829 1.56
10,001-50,000 70,694 8.65 1,419,116,782 4.91
50,001- 100,000 10,665 1.30 770,033,755 2.66
100,001-1,000,000 8,976 1.10 2,299,389,401 7.95
1,000,001-10,000,000 935 0.11 2,391,401,418 8.27
10,000,001 and above 176 0.02 17,539,853,849 60.63
817,323 99.88 25,488,306,214 88.11
Foreign Shareholders
1-1,000,000 978 0.12 21,437,386 0.07
1,000,001-10,000,000 4 0.00 9,647,715 0.03
10,000,001 and above 13 0.00 3,408,580,316 11.78
995 0.12 3,439,665,417 11.89
Total 818,318 100.00 28,927,971,631 100.00
The shareholding pattern of the Bank as at 31 December 2015 is as stated below:
31 December 2015
Range Number of
Shareholders
% of Shareholders Number of shares held % of Shareholders
Domestic Shareholders
1-5,000 661,151 80.53% 619,731,295 2.14%
5,001-10,000 66,302 8.08% 454,352,983 1.57%
10,001-50,000 71,310 8.69% 1,438,351,292 4.97%
50,001- 100,000 10,841 1.32% 786,936,166 2.72%
100,001-1,000,000 9,192 1.12% 2,367,118,184 8.18%
1,000,001-10,000,000 997 0.12% 2,653,702,191 9.17%
10,000,001 and above 193 0.02% 18,759,861,886 64.85%
819,986 99.88% 27,080,053,997 93.61%
Foreign Shareholders
1-1,000,000 965 0.12% 23,176,074 0.08%
1,000,001-10,000,000 5 0.00% 15,376,828 0.05%
10,000,001 and above 8 0.00% 1,809,364,732 6.25%
978 0.12% 1,847,917,634 6.39%
Total 820,964 100% 28,927,971,631 100%
Substantial interest in shares
Number of shares
held % of shareholding Number of shares held % of shareholding
Stanbic Nominees Nigeria Limited* 4,622,161,946 16.00% 4,283,583,626 14.79%
1,969,087,968 6.80% 1,763,244,933 6.08%
In accordance with the provisions of Section 277 (1) and (3) of the Companies and Allied Matters Act of Nigeria, the Board has received a declaration of Interest from the under-listed Directors in
respect of the companies (vendors to the Bank) set against their respective names.
According to the register of members at 31 December 2016, the following shareholders held more than 5% of the issued share capital of the Bank as follows:
31 December 2016 31 December 2015
Blakeney GP
*Stanbic Nominees held the shares as custodian for various investors. Stanbic Nominees does not exercise any right over the underlying shares. All the rights resides with the various investors on
behalf of whom Stanbic Nominees carries out the custodian services.
5

Access Bank Plc
Consolidated financial statements
For the year ended 31 December 2016
Donations and charitable gifts
S/N Beneficiary Purpose Amount
1 Malaria To Zero Initiative Support towards eliminating malaria in Nigeria through malaria to zero initiative platform 55,000,000
2 Global Business Coalition Health Contribution to the GBC health 39,375,000
3 Institute Of Human Virology Nigeria Support for construction of the Institute of Human Virology Nigeria Research Center 38,823,650
4 Health And Environmental Development Agency Support for HEDA on project safe water initiative 21,750,000
5 National Youth Service Corps Support for national youth service corps programmes 11,913,890
6 Ikota Educational Project Support for Ikota educational foundation project 10,000,000
7 Hacey Health Initiative Support for code for impact initiative 10,000,000
8 Center For Youth Studies Support for center for youth studies 9,450,000
9 Run For A Cure Africa Support for world cancer day 9,340,265
10 Hacey Health Initiative Support of the world AIDS day 9,000,000
11 Nigerian Stock Exchange Sponsorship for 2016 NSE competition 7,531,500
12 United Nations Population Fund Support for 2016 women deliver conference 7,500,000
13 UN Women Sponsorship of UN women empowerment principles meeting 8,250,000
14 University Of Nigeria, Nsukka Payment for ICT building renovation/UNN 6,064,848
15 Glo Initiative for Economic Empowerment (GIEE) Support for GIEE on world environment day 5,000,000
16 Dreamland Foundation Support for the Dreamland Foundation 5,000,000
17 Financial Nigeria International Partnering with Financial Nigeria International 4,250,000
18 Light House Global Support for life blood donation initiative 4,000,000
19 Nirvana Initiative Support of the world sickle cell day initiative 4,000,000
20 HACEY's Health Initiative Support towards world malaria day 3,500,000
21 Boys Brigade Nigeria Support for boy's brigade Nigeria vocational training 3,000,000
22 Green Impact International Support for green impact international initiative 3,000,000
23 Nigeria Business Coalition Against Aids (NiBUCAA) Support for NiUBAA round table meeting 2,090,000
24 Run For A Cure Africa Support towards breast cancer awareness campaign organized by run for a cure Africa 2,000,000
25 Care Trust International Ltd. Support to stop child labor initiative 2,000,000
26 Centre for youths studies Support towards Centre for Youth Studies 1,500,000
27 Kebbi State Government Support for mass literacy for less privileged in Kebbi State 1,000,000
28 Medicaid Cancer Foundation Sponsorship of fundraising event for medic aid cancer foundation 1,000,000
285,339,153
Property and equipment
Human resources
(i) Report on Diversity in employment
(a) Composition of employees by gender
(b) Board Composition By Gender
( c) Top Management (Executive Director To CEO) Compositon By Gender
2
7
(d) Top Management (AGM To GM) Compositon By Gender
The Bank operates a non-discriminatory policy in the consideration of applications for employment. The Bank’s policy is that the most qualified and experienced persons are recruited for
appropriate job levels, irrespective of an applicant’s state of origin, ethnicity, religion, gender or physical condition.
We believe diversity and inclusiveness are powerful drivers of competitive advantage in developing and understanding of our customers' needs and creatively adressing them.
Total number of women in Executive Management position
Total number of persons in Executive Management position
Information relating to changes in property and equipment is given in Note 28 to the financial statements. In the Directors’ opinion, the fair value of the Group’s property and equipment is not less
than the carrying value in the financial statements.
The Bank identifies with the aspirations of the community and the environment in which it operates. The Bank made contributions to charitable and non-charitable organisations amounting to
N285,339,153 (December 2015: N346,628,505) during the period, as listed below:
13
41
female male
female, 1,288male, 1,670
5
10
female male
6

Access Bank Plc
Consolidated financial statements
For the year ended 31 December 2016
(ii) Employment of disabled persons
(iii) Health, safety and welfare of employees
(iv) Employee involvement and training
(v) Statement of commitment to maintain positive work environment
Credit Ratings
Long Term Local Credit Ratings
Long Term Date
Standard & Poor's BBB Oct-16
FitchRatings A Jun-16
Agusto & Co A+ Jun-16
Global Credit Ratings Co. (GCR) A+ Jul-16
Moody's Aa2 Nov-16
Long Term Counterparty Credit Ratings
Long Term
Standard & Poor's B Oct-16
FitchRatings B Jun-16
Moody's B1 May-16
More information on the rating reports can be obtained at https://www.accessbankplc.com/credit-rating
Audit committee
1 *Mr. Henry Omatshola Aragho Omatsola Aragho - Shareholder Chairman
2 Mr Emmanuel Olutoyin Eleoramo - Shareholder Member
3 Mr Idaere Gogo Ogan - Shareholder Member
4 **Mr Oritsedere Otubu - Director Member
5 Dr. Ernest Ndukwe - Independent Director Member
6 Dr. (Mrs.) Ajoritsedere Awosika - Director Member
* Appointed Chairman of the Committee effective July 27, 2016.
** Resigned from the Committee effective September 1, 2016 following his retirement from the Board. He was replaced by Mr. Abba Mamman Tor Habib, a Non-Executive Director
BY ORDER OF THE BOARD
Plot 999c, Danmole Street,
Victoria Island, Lagos.
Lagos Sunday Ekwochi
Company Secretary
FRC/2013/NBA/00000005528
The auditors, PricewaterhouseCoopers have indicated their interest to continue in office and will do so pursuant to section 357(2) of the Companies and Allied Matters Act
The Bank encourages participation of employees in arriving at decisions in respect of matters affecting their wellbeing. Towards this end, the Bank provides opportunities where employees
deliberate on issues affecting the Bank and its employees' interests, with a view to making inputs to decisions thereon. The Bank places a high premium on the development of its manpower.
Consequently, the Bank sponsors its employees for various training courses, both locally and overseas.
The Bank shall strive to maintain a positive work environment that is consistent with best practice to ensure that business is conducted in a positive and professional manner and to ensure that
equal opportunity is given to all qualified members of the Group's operating environment.
The revised prudential guidelines, as released by the CBN, requires that banks should have themselves credit rated by a credit rating agency on a regular basis. It is also required that the credit
rating be updated on a continuous basis from year to year.
Below are the credit ratings that Access Bank has been assigned by the various credit rating agencies that have rated the Bank, in no particular order:
Pursuant to Section 359(3) of the Companies and Allied Matters Act of Nigeria, the Bank has an Audit Committee comprising three Directors and three shareholders as follows:
The functions of the Audit Committee are as provided in Section 359(6) of the Companies and Allied Matters Act of Nigeria.
The Bank operates a Group Personal Accident and the Workmen’s Compensation Insurance covers for the benefit of its employees. It also operates a contributory pension plan in line with the
Pension Reform Act 2004 as Amended and other benefit schemes for its employees.
In the event of any employee becoming disabled in the course of employment, the Bank will endeavour to arrange appropriate training to ensure the continuous employment of such a person
without subjecting the employee to any disadvantage in career development.
The Bank maintains business premises designed with a view to guaranteeing the safety and healthy living conditions of its employees and customers alike. Employees are adequately insured
against occupational and other hazards. In addition, the Bank retains top-class hospitals where medical facilities are provided for its employees and their immediate families at its expense.
Fire prevention and fire-fighting equipment are installed in strategic locations within the Bank’s premises.
7

Access Bank Plc Consolidated financial statements For the year ended 31 December 2016 CORPORATE GOVERNANCE REPORT
8
CORPORATE GOVERNANCE REPORT FOR YEAR ENDED DECEMBER 31, 2016
To take tomorrow, you first have to be inspired by where you are starting from today. Or to put it another way, when you embark on a great journey together, you need to trust those who are in the driving seat.
Fortunately, Access Bank has an excellent track record when it comes to corporate governance. We have always been committed to best practice in this, as in all areas. From strict performance monitoring to the careful appointment and supervision of experienced, capable Directors, not to mention the complementary role of overseeing committees, we will always be in the leading rank.
We are also transparent in all that we do, maintaining high ethical standards. And if we should ever fall short, we have a formal whistle-blowing procedure to ensure we stay on the right course.
In all of this we adhere to and strive to exceed the regulatory requirements.
That way you can be sure that a better tomorrow awaits, not just because of our vision, resources and capabilities, but because of the way we believe in getting there.
The Bank and its subsidiaries (the Group) are governed under a framework that enables the Board to discharge its oversight functions while providing strategic direction to the Bank in balance with its responsibility to ensure regulatory compliance. The subsidiaries comply with the statutory and regulatory requirements of their host countries and also align their governance framework to the Bank’s governance framework.
This report documents the Group’s corporate governance practices that were in place during the Financial Year Ended December 31, 2016.
The Board is responsible for embedding high standards of corporate governance across the Group, which is essential for the sustainability of the brand. Our governance framework is designed to ensure on-going compliance with the Code of Corporate Governance issued by the Central Bank of Nigeria’s Code of Corporate Governance for Banks and Discount Houses in Nigeria (‘the CBN Code’) and the Securities and Exchange Commission’s Code of Corporate Governance (‘the SEC Code’) as well as the Post-Listing Requirements of the Nigeria Stock Exchange. These, in addition to the Board Charter and the Bank’s Memorandum and Articles of Association, collectively provide the foundation for sound corporate governance. Our core values of excellence, innovation, leadership, passion for customers, professionalism and empowered employees continue to define our corporate behaviour.
Performance Monitoring and Evaluation
The Board in the discharge of its oversight function continuously engages Management in the planning, definition and execution of strategy. Management’s report on the execution of defined strategic objectives is a regular feature of the Board’s agenda, thus providing the Board with the opportunity to evaluate and constructively challenge management in the execution of strategy.
The Bank’s performance on Corporate Governance is continuously being monitored and reported. We carry out quarterly and semi-annual reviews of our compliance with the CBN Code and the SEC Code respectively, and render reports to the regulators. It is important to periodically obtain an independent perspective on the effectiveness of the Board and so for 2016, Accenture Limited was engaged to carry out an Independent Board Evaluation the independent consultant does not have any connection with the Group or any of its directors. The Board believes that the use of an independent consultant not only encourages directors to be more candid in their evaluation of the Board performance, but also enhances the objectivity and transparency of the evaluation process.
The result of the Board performance evaluation was presented by the independent consultant during the Board Meeting held on January 26, 2017 and is contained in the Annual Report. The evaluation was a 360

Access Bank Plc Consolidated financial statements For the year ended 31 December 2016 CORPORATE GOVERNANCE REPORT
9
degree on-line survey covering directors’ self-assessment, peer assessment and evaluation of the Board and the Committees. The effectiveness of the Independent Directors vis-à-vis the CBN’s Guidelines on Independent Directors of Banks was also evaluated. The result confirmed that the individual directors and the Board continue to operate at a very high level of effectiveness and efficiency. We are glad to report that the review revealed that the Board is operating effectively, although there are some areas that could be enhanced.
In compliance with the CBN Code, the Annual Board Performance Evaluation Report for the year 2015 was presented to shareholders at the Annual General Meeting of the Bank held on April 27, 2016.
Appointment, Retirement and Re-election of Directors
The Board has put in place a formal process for the selection of new directors to ensure the transparency of the nomination process. The process is documented in the Fit and Proper Person Policy and is led by the Board Governance and Nomination Committee. The Committee identifies candidates for appointment as director in consultation with the Chairman, the Group Managing Director and/or any other director, or through the use of search firms or such other methods as the Committee deems necessary to identify candidates. Once candidates have been identified, the Committee shall confirm that the candidates meet the qualifications for director nominees set forth in the policy, and relevant statutes and regulations. The Committee may gather information about the candidates through interviews, questionnaires, enhance due diligence checks, or any other means that the Committee deems helpful in the evaluation process. The Committee meets to discuss and evaluate the qualities and skills of each candidate, taking into account the overall composition and needs of the Board. Based on the results of the evaluation process, the Committee recommends candidates to the Board for appointment as director subject to the approval of shareholders and the Central Bank Nigeria.
In accordance with the Bank’s Articles of Association, Mr. Emmanuel Chiejina, Mrs Anthonia Kemi Ogunmefun and Dr. (Mrs) Ajoritsedere Awosika retired at the Bank’s 27th Annual General Meeting held on April 17, 2016 and being eligible were duly re-elected by shareholders. The shareholder also elected Mr. Abba Mamman Tor Habib as a Non-Executive Director who was earlier appointed by the Board. The Board confirmed that following a formal evaluation, these four Directors continued in 2016 to demonstrate strong commitment to their role as Non-Executive Directors.
In the course of the year, Mr. Oritsedere Samuel Otubu retired from the Board effective September 1, 2016, following his successful completion of the maximum 12 years term limit prescribed by the CBN Code for Non-Executive Directors of banks. Until his retirement, he was the Chairman of the Board Credit and Finance Committee and member of three other Board Committees. In the course of the year, Mr. Elias Igbinakenzua also resigned his position as director to pursue his entrepreneurial ambition. Until his resignation, he was the Executive Director, Corporate and Institutional Banking Division. The Board commends Messrs Otubu and Igbinakenzua for their outstanding contribution to the progress of the Bank and wishes them good success in their future endeavours.
The Board in recognition of the increasing size, complexity and risk associated with the Bank’s products and service on October 28, 2016 appointed Dr. Gregory Ovie Jobome as Executive Director, Risk Management upon the recommendation of the Governance and Nomination Committee.
The Board also upon the recommendation of the Governance and Nomination Committee appointed two Independent Non-Executive Directors on December 16, 2016 and one Non-Executive Director on January 26, 2017. The appointments have been submitted to the CBN for approval
Mrs Belo-Olusoga joined the Board of Access Bank in November 2007. Until her recent appointment, she was the Chairperson of the Board Credit and Finance Committee and member of four other Board Committees as well as the Statutory Audit Committee. She is a thorough –bred banking professional with deep knowledge of the industry and the Bank’s governance process. She had an illustrious banking career spanning nearly 3 decades. She retired from Guaranty Trust Bank in 2006 as Executive Director,

Access Bank Plc Consolidated financial statements For the year ended 31 December 2016 CORPORATE GOVERNANCE REPORT
10
Investment Banking and was at various times responsible for risk management, transaction services and settlement banking. Mrs Belo-Olusoga graduated from University of Ibadan in 1979 with a second class upper degree in Economics. She qualified as a Chartered Accountant in 1983 and is a fellow of the Institute of Chartered Accountants of Nigeria and Chartered Institute of Bankers of Nigeria.
Dr. Mahmoud Isa-Dutse resigned from the Board effective November 16, 2016 following his appointment
as the Permanent Secretary, Federal Ministry of Finance. Until his resignation, he was the Chairman of
the Board Risk Management Committee and member of two other Board Committees.
The Board commends Mr Oyebode and Dr. Isa-Dutse for their outstanding contribution to the progress of
the Bank and wishes them good success in their future endeavours.
In accordance with the Bank’s Articles of Association, one third of all Non-Executive Directors (rounded
down) are offered for re-election every year (depending on their tenure on the Board) together with
directors appointed by the Board since the last Annual General Meeting. In keeping with this requirement,
Mrs Mosun Belo-Olusoga and Mr. Paul Usoro, SAN will retire at this Annual General Meeting and being
eligible for re-election will submit themselves for re-election. The Board confirms that following a formal
evaluation, these two directors continue to demonstrate commitment to their role as Non-Executive
Directors. Also in line with the provisions of the Bank’s Articles of Association and following Central Bank
of Nigeria approval the newly appointed directors will submit themselves for election at the Annual
General Meeting. The Board confirms its conviction that the directors standing for election or re-election
will continue to add value to the Bank. The Board recommends that they should be elected to maintain the
required balance of skill, knowledge and experience on the Board. The biographical details of the directors
standing for election or re-election are set contained in the Annual Report.
Shareholders Engagement
The Board recognizes the importance of ensuring the flow of complete, adequate and timely information to shareholders to enable them make informed decisions. The Group is committed to maintaining high standards of corporate disclosure. Our comprehensive investor engagement strategy helps us to understand shareholders views about us, which are communicated regularly to the Board.
Shareholders meetings are convened and held in an open manner in line with the Bank’s Articles of Association and existing statutory and regulatory regimes, for the purpose of deliberating on issues affecting the Bank’s strategic direction. The Annual General Meeting is a medium for promoting interaction between the Board, management and shareholders. Attendance at the Annual General Meeting is open to shareholders or their proxies, while proceedings at such meetings are usually monitored by members of the press, representatives of the Nigerian Stock Exchange, the Central Bank of Nigeria and the Securities and Exchange Commission. The Board ensures that shareholders are provided with adequate notice of meetings. An Extraordinary General Meeting may also be convened at the request of the Board or shareholders holding not less than 10% of the Bank’s Paid-Up Capital.
The Group has a dedicated Investors Relations Unit which focuses on facilitating communication with shareholders and analysts on a regular basis and addressing their queries and concerns. Investors and stakeholders are frequently provided with information about the Bank through various channels, including Quarterly Investors Conference Calls, the General Meeting, the website, the Annual Report and Accounts, Non-Deal Road Shows and the Investors Forum at the Stock Exchange. The Bank has a robust Investors Communication and Disclosure Policy. As provided in the policy, the Board and management ensure that communication with the investing public about the Bank and its subsidiaries is timely, factual, broadly disseminated and accurate in accordance with all applicable legal and regulatory requirements. The Bank’s reports and communication to shareholders and other

Access Bank Plc Consolidated financial statements For the year ended 31 December 2016 CORPORATE GOVERNANCE REPORT
11
stakeholders are in plain, readable and understandable format. The Bank’s website www.accessbankplc.com is regularly updated with both financial and non-financial information. The details of the Investors’ Communication and Disclosure Policy are available at the Investor Portal on the Bank’s website.
The Board ensures that shareholders’ statutory and general rights are protected at all times, particularly their right to vote at general meetings. The Board also ensures that all shareholders are treated equally regardless of the size of their shareholding and social conditions. Our shareholders are encouraged to share in the responsibility of sustaining the Bank’s corporate values by exercising their rights as protected by law.
Access to Information and Resources
Management recognises the importance of ensuring the flow of complete, adequate and timely information to the directors on an ongoing basis to enable them make informed decisions in discharge of their responsibilities. There is ongoing engagement between Executive Management and the Board, and the Heads of Strategic Business Units are invited Board meetings to make presentations. The Bank’s External Auditors attend the Group Board Audit Committee and the Group Shareholders Audit Committee Meetings to make presentation on the audit of the Group’s Financial Statements. Directors have unrestricted access to Group management and company information in addition to access to external professional advice at the Bank’s expense as provided by the Board and Committees’ charters.
The Board
The primary function of the Board is to provide effective leadership and direction to enhance the long-term value of the Group to its shareholders and other stakeholders. It has the overall responsibility for reviewing the strategic plans and performance objective, financial plans and annual budget, key operational initiatives, major funding and investment proposals, financial performance review and corporate governance practices. The Board is the Group’s highest decision-making body responsible for governance. It operates on the understanding that sound governance practices are fundamental to earning the trust of stakeholders, which is critical to sustainable growth.
Composition and Role
Up till September 1, 2016 the Board consisted of 15 members made up of 8 Non-Executive Directors and 7 Executive Directors as set out below. Two of the Non-Executive Directors are Independents and meet the criteria set by the CBN’s Guidelines on Independent Directors of Banks in Nigeria.
S/n Name GENDER Designation
1 Mrs Mosun Belo-Olusoga Female Non-Executive Director 2 *Mr Oritsedere Samuel Otubu Male Non-Executive Director
3 Mr Emmanuel Chiejina Male Non-Executive Director
4 Mrs Anthonia Kemi Ogunmefun Female Non-Executive Director
5 Mr Paul Usoro, SAN Male Non-Executive Director
6 Dr Ernest Ndukwe Male Independent Non-Executive Director
7 Dr (Mrs) Ajoritsedere Awosika Female Independent Non-Executive Director
8 Mr. Abba Mamman Tor Habib Male Non-Executive Director
9 Mr Herbert Wigwe Male Group Managing Director/Chief Executive Officer
10 Mr Obinna Nwosu Male Group Deputy Managing Director
11 Mr Victor Etuokwu Male Executive Director
12 Mrs Ojini Olaghere Female Executive Director
13 **Mr Elias Igbinakenzua Male Executive Director

Access Bank Plc Consolidated financial statements For the year ended 31 December 2016 CORPORATE GOVERNANCE REPORT
12
14 Mr Roosevelt Ogbonna Male Executive Director
15 Mrs Titi Osuntoki Female Executive Director
*Retired September 1, 2016
** Resigned December 31, 2016
In line with best practice, the Chairman and Chief Executive Officer roles are assumed by different individuals, this ensures the balance of power and authority. The Board is able to reach impartial decisions as its Non-Executive Directors are a blend of Independent and Non-Independent Directors with no shadows or Alternate Directors which ensures that independent thought is brought to bear on decisions of the Board. The effectiveness of the Board drives from the diverse range of skills and competencies of the Executive and Non-Executive Directors who have exceptional degrees banking, financial and broader entrepreneurial experiences.
With the retirement of Mr. Oritsedere Otubu in September 2016, the Bank had 14 directors comprising equal number of Executive and Non-Executive Directors. The Board has identifying right candidates to fill the resultant vacancies whom will be presented to the shareholders for approval during the Meeting.
In line with best practice, the Chairman and Chief Executive Officer’s roles in the Bank are assumed by different individuals to ensure the balance of power and authority. The Board is able to reach impartial decisions as its Non-Executive Directors are a blend of independent and non-independent directors with no shadow or Alternate Directors, which ensures that independent thought is brought to bear on decisions of the Board. The effectiveness of the Board derives from the diverse range of skills and competencies of the Executive and Non-Executive Directors who have exceptional degrees of banking, financial and broader entrepreneurial experiences.
In carrying out its oversight functions, matters reserved for the Board include but are not limited to:
Defining the Bank’s business strategy and objectives.
Formulating risk policies.
Approval of quarterly, half yearly and full year financial statements.
Approval of significant changes in accounting policies and practices.
Appointment and removal of Directors and the Company Secretary.
Approval of major acquisitions, divestments of operating companies, disposal of capital assets or capital expenditure.
Approval of charter and membership of Board Committees.
Setting of annual Board objectives and goals.
Approval of allotment of shares.
Appointment and removal of Chief Audit Executive.
Approval of the framework for determining the policy and specific remuneration of Executive Directors.
Monitoring delivery of the strategy and performance against plan.
Reviewing and monitoring the performance of the Group Managing Director and the executive team.
Ensuring the maintenance of ethical standard and compliance with relevant laws.
Performance appraisal and compensation of Board members and Senior Executives.
Ensuring effective communication with shareholders.
Ensuring the integrity of financial reports by promoting disclosure and transparency.
Succession planning for key positions.

Access Bank Plc Consolidated financial statements For the year ended 31 December 2016 CORPORATE GOVERNANCE REPORT
13
Appointment Process, Induction and Training of Board Members
The Group’s Fit and Proper Person Policy is designed to ensure that the Bank and its subsidiary entities are managed and overseen by competent, capable and trustworthy individuals. In making Board appointments, the Board takes cognisance of the knowledge, skill and experience of a potential Director as well as other attributes considered necessary for the role. The Board also considers the need for appropriate demographic and gender representation. Candidates are subjected to enhance due diligence enquiries as required by regulations.
The Governance and Nomination Committee is responsible for both Executive and Non-Executive Directors succession planning and recommends new appointments to the Board. The Committee takes cognisance of the existing range of skills, experience, background and diversity on the Board in the context of the strategic direction of the Bank before articulating the specifications for the candidate sought. We are comfortable that the Board is sufficiently diversified to optimise its performance.
The Board ensures the regular training and education of Board members on issues pertaining to their oversight functions. Regarding new directors, there is a personalised induction programme which includes one-on-one meetings with Executive Directors and Senior Executives responsible for the Bank’s key business areas. Such sessions focus on the challenges, opportunities and risks facing the business areas. The induction programme covers an overview of the strategic business units as well as Board processes and policies. A new Director receives an induction pack which includes charters of the various Board Committees, significant reports, important legislation and policies, minutes of previous Board Meetings and a Calendar of Board Activities.
The Board believes that a robust induction and continuing professional development will improve Directors’ performance. It ensures that Directors have appropriate knowledge of the Bank and access to its operations. Directors are therefore required to participate in periodic, relevant continuing professional development programmes to update their knowledge. The table below provides the details of director continuing education programmes undertaken in 2016.
S/N
NAME OF DIRECTOR TRAINING ORGANIZER LOCATION DATE
Duration in Days
1 Mr. Emmanuel Chiejina
Blue Ocean Strategy Insead,
France May 30, June 2, 2016 4
2 Mr. Oritsedere Otubu
International Directors Programme Insead,
France
May 30, June 2, 2016 4
3 Dr. Ajoritsedere Awosika
Business Innovation Havard,
USA June 22-June 25,2016 4
4 Mrs. Mosun Belo-Olusoga
Corporate Strategy
Chicago Booth,
USA October 3-7, 2016 5
5 Mrs. Anthonia Kemi Ogunmefun
Corporate Strategy
Chicago Booth
USA October 3-7, 2017 5
6 Mr. Roosevelt Ogbonna
IMD-CKGSB-Executive MBA IMD
Switzerland June 22-July 1,2016 10

Access Bank Plc Consolidated financial statements For the year ended 31 December 2016 CORPORATE GOVERNANCE REPORT
14
In addition to the above training, the Board also held a two-day Risk Master Class on October 26-27, 2016
at Federal Palace Hotel, Lagos which was attended by all the directors.
Delegation of Authority
The ultimate responsibility for the Bank’s operations rests with the Board. The Board retains effective control through a well-developed Committee structure that provides in-depth focus on the Board’s responsibilities. Each Board Committee has a written terms of reference and presents regular report to the Board on its activities. The Board delegates authority to the Group Managing Director to manage the affairs of the Group within the parameters established by the Board from time to time.
Board Meetings
The Board meets quarterly and emergency meetings are convened as may be required. The Annual Calendar of Board and Committee meetings is approved in advance during the last quarter of the preceding year. Material decisions may be taken between meetings through written resolutions in accordance with the Bank’s Articles of Association. The Annual Calendar of Board Activities includes a Board Retreat at an offsite location to consider strategic matters and review the opportunities and challenges facing the institution.
All Directors are provided with notices, agenda and meeting papers in advance of each meeting to enable prepare adequately for meeting. Where a Director is unable to attend a meeting he/she is still provided with the relevant papers for the meeting. Such a Director also reserves the right to discuss with the Chairman any matter he/she may wish to raise at the meeting. Directors are also provided with regular updates on developments in the regulatory and business environment.
The Board met 10 times in 2016. The Board also held its 8th Annual Board Retreats on February 26-27 2016 at Accra, Ghana to discuss strategic issues affecting the Bank. The Board operates a secure electronic portal, Diligent Boardbook for the circulation of board papers to members. This underscores the Board commitment to embrace environment sustainability by reducing paper usage.
Board Committees
The Board carries out its oversight function through its standing committees, each of which has a charter that clearly defines its purpose, composition, structure, frequency of meetings, duties, tenure and reporting lines to the Board. In line with best practice, the Chairman of the Board does not sit on any committees. The Board has five standing committees, namely: the Risk Management Committee, the Audit Committee, the Governance and Nomination Committee, the Remuneration Committee and the Credit and Finance Committee. The Board accepts that while the Board Committees have the authority to examine a particular issue and report to the Board with their decisions and/or recommendations, the ultimate responsibilities on all matters lies with the Board. The composition and responsibilities of the committees are set out below:

Access Bank Plc Consolidated financial statements For the year ended 31 December 2016 CORPORATE GOVERNANCE REPORT
15
Name
BAC BRMC BCFC BGNC BRC
Mosun Belo-Olusoga1 - - - - - -
Oritsedere Otubu1 M - M M C
Emmanuel Chiejina1 - C M C M
Anthonia Kemi Ogunmefun1 - M M M R
Paul Usoro1 M M M M M
Ernest Ndukwe3 C M M M M
Ajoritsedere Awosika3 M - C M M
Abba Mamman Tor Habib1 M M M
Herbert Wigwe2 - M M M -
Obinna Nwosu 2 - M M - -
Victor Etuokwu2 - - M - -
Ojinika Olaghere2 - M - - -
Elias Igbinakenzua2 - - M - -
Roosevelt Ogbonna2 - - M - -
Titi Osuntoki2 - - M - -
C Chairman of Committee
M Member
- Not a member 1 Non- Executive
2 Executive
3 Independent
BAC – Board Audit Committee
BRMC – Board Risk Management Committee
BCFC – Board Credit and Finance Committee
BGNC –Board Governance and Nomination
BRM – Board Remuneration Committee

Access Bank Plc Consolidated financial statements For the year ended 31 December 2016 CORPORATE GOVERNANCE REPORT
16
Credit and Finance Committee
The Committee considers and approves loan applications above certain limits (as defined by the Board from time to time) which have been recommended by the Management Credit Committee. It also acts as a catalyst for credit policy change and oversees the administration and effectiveness of the Bank’s credit policies. The Committee met 16 times during the 2016 financial year.
The Committee’s key activities during the period included review and approval of credit facilities, review of the Credit Portfolio and the collateral for same, monitoring the implementation of credit risk management policies.
Dr. Mrs Ajoritsedere Awosika succeeded Mr. Oritsedere Otubu as the Chairman of the Committee following the latter’s completion of term limit on September 1, 2016.
Dr. Awosika is an accomplished administrator with over 3 decades experience in public sector governance. She was at various times the Permanent Secretary in the Federal Ministry of Internal Affairs, Federal Ministry of Science & Technology and Federal Ministry of Power. She is a fellow of the Pharmaceutical Society of Nigeria and the West African Postgraduate College of Pharmacy. She sits on the boards of Capital Express Assurance Ltd and Chams Plc. Dr. Awosika holds a doctorate degree in pharmaceutical technology from University of Bradford. United Kingdom. She was appointed to the Board in April 2013 and serves as the Vice Chairman of the Board Audit Committee.
Governance and Nomination Committee
The Committee advises the Board on its oversight responsibilities in relation to all matters on corporate governance, sustainability and nominations affecting the Bank, the Directors and employees. It is responsible for determining and executing the processes for Board appointments, nominations and removal of non-performing Directors.
The key decisions of the Committee in the reporting period included approval of the amendment to the Staff Handbook, approval of the 2016 Non-Executive Directors Training Plan and budget, recommendation of directors appointment; recommendation of policy on Group Grade Structure ; amendment of Staff Disciplinary Code and Staff Handbook; approval of the Bank Succession Plan and recommendation of Senior Management employees for subsidiaries boards appointment. The Committee met 6 times during the period.
Mr. Emmanuel Chiejina chaired the Committee. Mr. Chiejina is the Chairman and CEO of Ashbard Energy Company Ltd . He retired as Deputy Managing Director of Elf Petroleum (Total E&P) in 2007. He obtained a law degree from University of Lagos in 1975 and was called to the Nigerian Bar in 1976. Mr. Chiejina has attended Professional Development Programmes at Columbia University, Cranfield Institute of Technology, European Institute of Business Administration (INSEAD). University of London, London Business School and Harvard Business School. Mr Chiejina joined the Board of Access Bank Plc in June 2005. Risk Management Committee
The Committee assists the Board in fulfilling its oversight responsibility relating to establishment of policies, standards and guidelines for risk management, and compliance with legal and regulatory requirements. In addition, it oversees the establishment of a formal written policy on the overall risk management system. The Committee also ensures compliance with established policies through periodic review of management’s reports and ensures the appointment of qualified officers to manage the risk function. It evaluates the Bank’s risk policies on a periodic basis to accommodate major changes in internal or external environment.
During the period under review the Committee considered and recommended some policies to the Board
for approval. The Committee also received reports from all the risk areas and recommend the Banks’

Access Bank Plc Consolidated financial statements For the year ended 31 December 2016 CORPORATE GOVERNANCE REPORT
17
Internal Capital Adequacy Assessment Programme and Internal Liquidity Adequacy Assessment
Programme and Conduct and Compliance Group Plan for 2017 for the Board’s approval. The Committee
met 4 times during the period
The Committee is chaired by Mr. Emmanuel Chiejina.
Audit Committee
The Committee supports the Board in meeting its oversight responsibility relating to the integrity of the Bank’s Financial Statements and the financial reporting process; the independence and performance of the Bank’s Internal and External Auditors. It oversees the Bank’s system of internal control and the mechanism for receiving complaints regarding the Bank’s accounting and operating procedures. The Bank’s Chief Internal Auditor and Chief Compliance Officer have access to the Committee and make quarterly presentations to the Committee.
The key issues considered by the Committee during the period included the review and recommendation of Audited Full Year and Interim Financial Statements, the Internal and Statutory Audit Plans, reports of the Group Internal Auditor and Internal Audit Consultants. The Committee also reviewed the whistle-blowing reports. The Committee met 7 times during the reporting period.
The Committee is chaired by Dr. Ernest Ndukwe, an Independent Director. He graduated from the University of Ife in 1975 and is an alumnus of Lagos Business School. He is a fellow of the Nigerian Society of Engineers, the Nigerian Institute of Management and the Nigerian Academy of Engineering. Dr. Ndukwe heads the Centre for Infrastructure Policy and Regulation of the Lagos Business School. Other members of the Committee have relevant financial management and accounting backgrounds, as required by the CBN Code.
Remuneration Committee
The Committee advises the Board on its oversight responsibilities in relation to remuneration of the Bank’s Directors and employees. It is responsible for determining and executing the processes for recommending appropriate remuneration for directors and employees. In carrying out its function, the Committee will benchmark the salary and benefit structure to similar-sized banks. It also advises the Board on employee benefit plans such as pension, share ownership and other retirement plans, and material amendments thereto.
The key issues considered by the Committee during the period included the review and recommendation of the amendment to the International Posting Policy to the Board for approval and consideration of Remuneration Survey reports for the Group Office and the subsidiary entities. The Committee once times during the reporting period.
Mrs. Anthonia Kemi Ogunmefun succeeded Mr. Oritsedere Otubu as the Chairman of the Remuneration Committee. She is the Managing Partner of Kemi Ogunmefun Law Office, a Canadian based private legal practice specializing in Immigration Law, Family Law, Real Estate and Corporate Law. She served as the Chairperson of Governance Committee of the Kinark Child and Family Services, a major Canadian Childcare Trust. Mrs. Ogunmefun obtained a Bachelor of Law degree from University of Lagos in 1974 and was called to Nigerian Bar in 1975 and the Law Society of Upper Canada in 2004. She was appointed to the Board in April 2011.

Access Bank Plc Consolidated financial statements For the year ended 31 December 2016 CORPORATE GOVERNANCE REPORT
18
Attendance at Board and Board Committees meetings
The table below shows the attendance of directors to meetings during the reporting period.
NAMES OF DIRECTORS Meeting
GM BoD BRMC BCFC BGNC BRC BAC
Number of Meetings Held 1 10 4 16 6 1 7
Attendance:
1 Mosun Belo-Olusoga 1 10 N/A N/A N/A N/A N/A
2 *Oritsedere Samuel Otubu 1 7 N/A 11 3 1 5
3 Emmanuel Chiejina 1 10 4 15 6 1 N/A
4 Anthonia Kemi Ogunmefun 1 10 4 16 6 1 N/A
5 Paul Usoro 1 10 4 15 6 1 6
6 Ernest Ndukwe 1 10 4 15 6 1 7
7 Ajoritsedere Awosika 1 10 NA 14 6 1 7
8 **Abba M.T Habib 1 8 2 10 N/A N/A 4
9 Herbert Wigwe 1 10 4 15 6 N/A N/A
10 Obinna Nwosu 1 7 4 8 N/A N/A N/A
11 Victor Etuokwu 1 10 N/A 13 N/A N/A N/A
12 Ojini Olaghere 1 9 4 N/A N/A N/A N/A
13 Elias Igbinakenzua 1 9 N/A 13 N/A N/A N/A
14 Titi Osuntoki 1 9 N/A 13 N/A N/A N/A
15 Roosevelt Ogbonna 0 8 N/A 14 N/A N/A N/A
*- Mr. Oritsedere Otubu retired as Director effective September 1, 2016
** Mr Abba M.T Habib was appointed to the Board on January 28, 2016
GM – General Meeting
BoD – Board of Directors
BRMC – Board Risk Management Committee
BCFC – Board Credit and Finance Committee

Access Bank Plc Consolidated financial statements For the year ended 31 December 2016 CORPORATE GOVERNANCE REPORT
19
BGNC – Board Governance and Nomination Committee
BAC – Board Audit Committee
BRC – Board Remuneration Committee
Executive Committee
The Executive Committee (EXCO) is made up of the Group Managing Director as Chairman, the Group Deputy Managing Director and all Executive Directors. The Committee is primarily responsible for the implementation of strategies approved by the Board and ensuring the efficient deployment of the Bank’s resources.
Management Committees
These are standing committees made up of the Bank’s Executive and Senior Management staff. The Committees are set up to identify, analyse and make recommendations on risks pertaining to the Bank’s day to day activities. They ensure that risk limits set by the Board and the regulatory bodies are complied with and also provide input to the various Board Committees in addition to ensuring the effective implementation of risk polices. These Committees meet as frequently as risk issues occur and take actions and decisions within the ambit of their powers.
The Management Committees include Management Credit Committee, Asset and Liabilities Committee, Enterprise Risk Management Committee, the Operational Risk Management Committee, the Criticised Assets Committee and the IT Steering Committee.
Statutory Audit Committee
In compliance with Section 359 of the Companies and Allied Matters Act 1990, the Bank constituted a Standing Shareholders Audit Committee made up of three Non-Executive directors and three shareholders. The composition of the Committee is as set out below
1. Mr Henry Omatsola Aragho (Shareholder) Chairman
2. Mr Emmanuel Olutoyin Eleoramo (Shareholder) Member
2. Mr Idaere Gogo Ogan (Shareholder) Member
4. Dr (Mrs) Ajoritsedere Awosika (Independent Director) Member
5. Dr Ernest Ndukwe (Independent Director) Member
6. *Mr. Oritsedere Otubu (Director) Member
* Resigned from the Committee on September 1, 2016 following his retirement from the Board. He was succeeded by Mr. Abba M.T Habib, Non-Executive Director.
The Committee is constituted to ensure its independence, which is fundamental to upholding stakeholders’ confidence in the reliability of the Committee’s report and the Group’s Financial Statements. There is no Executive Director sitting on the Committee. The Chairman of the Committee is an ordinary shareholder, while the shareholders representatives are independent and answerable to the shareholders. The two Directors who are members of the Committee are independent of the management of the Bank, while the last of them is an Independent Director.

Access Bank Plc Consolidated financial statements For the year ended 31 December 2016 CORPORATE GOVERNANCE REPORT
20
The duties of the Committee are as enshrined in Section 359(3) and (4) of CAMA. The Committee is responsible for ensuring that the company’s financials comply with applicable financial reporting standards.
The profiles of the shareholders’ representatives in the Committee are presented below:
1. Mr Henry Omatsola Aragho received his Higher National Diploma (Accounting) from Federal Polytechnic Auchi in 1981. He also has a Master’s Degree in Business Administration (MBA) from Ogun State University (1999) and qualified as a Chartered Accountant with the Institute of Chartered Accountants of Nigeria (ICAN) in 1985. He was admitted as an Associate Member of Institute of Chartered Accountants of Nigeria in March 1986 and subsequently qualified as fellow of the Institute.
He joined the Nigerian Ports Authority in 1982 and retired as General Manager Audit in 2005. He is presently the Managing Consultant of Henrose Consulting Limited and Managing Director Henrose Global Resources Limited.
He was appointed the Chairman of the Committee on July 27, 2016.
2. Mr Emmanuel O. Eleoramo holds a First Class Degree in Insurance and a Master’s Degree in Business Administration (MBA), both from the University of Lagos. He is also an Associate of the Chartered Insurance Institute of London and a Fellow of the Chartered Insurance Institute of Nigeria. He has had over 36 years of varied experience in General Insurance Marketing, Underwriting and Employee Benefits Consultancy.
He is a key player in the Nigerian Insurance industry and a past President of the Chartered Insurance Institute of Nigeria. He was the Managing Director/Chief Executive Officer of Nigerian French Insurance Company Ltd and later Whispering Hope Insurance Company Ltd (now Sterling Assurance Nigeria Ltd) before his appointment as the Managing Director/Chief Executive Officer of Nigerian Life and Pensions Consultants Limited (now Nigerian Life and Provident Company Limited).
3. Mr Idaere Gogo Ogan is a 1987 graduate of Economic from the University of Port Harcourt and holds a Master’s Degree in International Finance from Middlesex University, London. He joined the Corporate Bank Department of Guaranty Trust Bank in 1996. He left Guaranty Trust Bank to found D’ Group, incorporating Becca Petroleum Limited and Valuestream and Cordero Engineering Ltd. He sits on the Audit Committee of Standard Insurance Company Plc.
Record of Attendance at Statutory Audit Committee Meetings
Name January 27, 2016 July 27, 2016
Emmanuel O. Eleoramo
Idaere Gogo Ogan
Henry Omatsola Aragho
*Oritsedere Otubu

Access Bank Plc Consolidated financial statements For the year ended 31 December 2016 CORPORATE GOVERNANCE REPORT
21
Ajoritsedere Awosika
Ernest Ndukwe
* Retired from the Committee with effect from September 1, 2016 following his retirement from the Board and was succeeded by Mr. Abba M.T Habib
Going Concern
The Directors confirm that after making appropriate enquiries, they have reasonable expectation that the Group has adequate resources to continue in operational existence for the foreseeable future. Accordingly, they continue to adopt going concern basis in preparing the financial statements.
Succession planning
The Board has a robust policy which is aligned to the Bank’s performance management process. The policy identifies key positions, including Country Managing Director positions for all the Group’s operating entities in respect of which there will be formal succession planning. The policy provides that potential candidates for positions shall be identified at the beginning of each financial year.
Code of Ethics
The Bank’s Code of Conduct specifies expected behaviours for its employees and Directors. The code is designed to empower employees and Directors and enable effective decision making at all levels of the business according to defined ethical principles. New employees are required to read and sign an attestation that they understood the content. In addition, there is an annual re-affirmation exercise for all employees. There is a Compliance Manual that provides guidelines for addressing violations/breaches and ensuring enforcement of discipline amongst staff. The Bank also has a Disciplinary Guide which provides sample offences/violations and prescribes disciplinary measures to be adopted in various cases. The Head Group Human Resources is responsible for the design and implementation of the “Code of Conduct”, while the Chief Conduct and Compliance Officer is responsible for monitoring compliance.
The Chief Conduct and Compliance Officer issues at the beginning of the year an Ethics and Compliance message to all employees. The message reiterates the Bank’s policy of total compliance with all applicable laws, regulations, corporate ethical standards and policies in the conduct of the Bank’s business. It enjoins staff to promote the franchise and advance its growth in a sustainable manner while ensuring compliance with relevant policies, laws and regulations.
Dealing in Company Securities
The Bank implements a Securities Trading Policy that prohibits Directors, members of the Audit Committee, employees and all other insiders from abusing, or placing themselves under the suspicion of abusing price sensitive information in relation to the Bank’s securities. In line with the policy, affected persons are prohibited from trading on the company’s security during a closed period which is usually announced by the Company Secretary. The Bank has put in place a mechanism for monitoring compliance with the policy.
Remuneration Policy
The Group has established a remuneration policy that seeks to attract and retain the best talent in countries that it operates. To achieve this, the Group seeks to position itself among the best performing

Access Bank Plc Consolidated financial statements For the year ended 31 December 2016 CORPORATE GOVERNANCE REPORT
22
and best employee rewarding companies in its industry in every market that it operates. This principle will act as a general guide for the determination of compensation in each country. The objective of the policy is to ensure that salary structures, including short and long term incentives, motivate sustained high performance and are linked to corporate performance. It is also designed to ensure that stakeholders are able to make reasonable assessment of the Bank’s reward practices. The Group complies with all local tax policies in the countries of operation.
Operating within the guidelines set by the principles above, compensation for country staff is based on the conditions in the local economic environment as well as the requirements of local labour laws. The Group Office usually commissions independent annual compensation surveys in the subsidiaries to obtain independent statistics on the local pay markets to arrive at specific compensation structures for each country. Compensation will be determined annually at the end of the financial year. All structural changes to compensation must be approved by the Group Office.
Total compensation provided to employees will typically include guaranteed and variable portions. The specific proportion of each will be defined at the country level. Guaranteed pay will include base pay and other guaranteed portions while variable pay may be both performance-based and discretionary.
The Bank has put in place a performance bonus scheme which seeks to attract and retain high-performing employees. Awards to individuals are based on the job level, business unit performance and individual performance. Other determinants of the size of individual award amounts include pay levels for each skill set which may be influenced by the relative dearth of skills in a particular area.
The Bank complies with the Pension Reform Act on the provision of retirement benefit to employees at all levels. The Bank also operates an Employee Performance Share Plan for the award of units of the Bank’s shares to its employees, subject to terms and conditions determined by the Board of Directors.
The Bank’s long term incentive programme rewards Executive Officers for loyal service to the Bank for a period up to 10 years. This is to ensure that they share in the Bank’s success and focus on its long term sustainability. The justification for a long term incentive plan for senior and executive management is very compelling given recent industry developments. The stability, loyalty and commitment of senior and executive management need to be strengthened by a long term retirement benefit.
Whistle-Blowing Procedure
The Bank expects all its employees and Directors to observe the highest level of probity in their dealings with the Bank and its stakeholders. Our Whistle-Blowing Policy covers internal and external whistle-blowers and extends to the conduct of the stakeholders including employees, vendors, and customers. It provides the framework for reporting suspected breaches of the Bank’s internal policies and laws and regulations. The Bank has retained KPMG Professional Services to provide consulting assistance in the implementation of the policy. The policy provides that suspected wrongdoing by an employee, vendor, supplier or consultant may be reported through the Bank’s or KPMG’s Ethics lines or emails, details of which are provided below.
Telephone
Internal: +234-1-2712065
External: KPMG Toll free lines: 0703-000-0026; 0703-000-0027; 0808-822-8888;
Internal: [email protected]

Access Bank Plc Consolidated financial statements For the year ended 31 December 2016 CORPORATE GOVERNANCE REPORT
23
External: [email protected]
The Bank’s website also provides an avenue for lodging whistle-blower’s reports. Individuals interested in whistle-blowing may click on the Customer Service link on the Bank’s website, scroll down to the whistle-blower column, and then register, anonymously or otherwise, any allegations they want the Bank to investigate.
The Bank’s Chief Audit Executive is responsible for monitoring and reporting on whistle-blowing. Quarterly reports are rendered to the Board Audit Committee.
In addition to the foregoing, stakeholders may also report unethical practices to the Central Bank of Nigeria via [email protected].
The Company Secretary
Directors have separate and independent access to the Company Secretary. The Company Secretary is responsible for, among other things, ensuring that Board procedures are observed and that the Company’s Memorandum and Articles of Association, plus relevant rules and regulations are complied with. He also assists the Chairman and the Board in implementing and strengthening corporate governance practices and processes, with a view to enhancing long-term shareholder value.
The Company Secretary assists the Chairman in ensuring good information flow within the Board and its committees and between management and Non-Executive Directors. The Company Secretary also facilitates the orientation of new Directors and coordinates the professional development of directors.
As primary compliance officer for Group’s compliance with the listing rules of the Nigerian Stock Exchange, the Company Secretary is responsible for designing and implementing a framework for the Bank’s compliance with the listing rules, including advising management on prompt disclosure of material information.
The Company Secretary attends and prepares the minutes for all Board meetings. As secretary for all board committees, he assists in ensuring coordination and liaison between the Board, the Board Committees and management. The Company Secretary also assists in the development of the agendas for the various Board and Board Committee meetings.
The appointment and the removal of the Company Secretary are subject to the Board’s approval.
Customer Complaints and Resolution
The Bank complied with the provision of CBN Circular FPR/DIR/CIR/GEN/01/020 dated 16 August 2011 on handling consumer complaints. The Bank complied with the provision of CBN Circular FPR/DIR/C IR/GEN/01/020 dated 16 August 2011 on handling consumer complaints. The Bank also in line with the rules of the Securities and Exchange Commissions has implemented Investors Enquiries and Complaints Management Policy. The Policy is available in the Investor portal on the Bank’s website and is also contained in the Annual Report.

Access Bank Plc Consolidated financial statements For the year ended 31 December 2016 CORPORATE GOVERNANCE REPORT
24
Statement of Compliance
The Bank during the 2016 Financial Year complied with the relevant provisions of the SEC and the CBN Codes of Corporate Governance, except for the provision of CBN Code requiring banks to have an Executive Director in charge of Risk Management. The Bank has however on January 17, 2017 received CBN’s approval for the appointment of Dr. Gregory Jobome as Executive Director, Risk Management who has since assumed duty.
In the event of any conflict between the provisions of the two codes regarding any matter, the Bank will defer to the provisions of the CBN Code as its primary regulator.

Access Bank Plc
Consolidated financial statements
For the year ended 31 December 2016
I.
II.
III.
-
-
-
-
-
-
SIGNED ON BEHALF OF THE BOARD OF DIRECTORS BY:
Statement of Directors’ Responsibilities in relation to the Consolidated Financial Statements for the year ended 31
December 2016
The Companies and Allied Matters Act and the Banks and Other Financial Institutions Act, require the directors to prepare financial
statements for each financial year that gives a true and fair view of the state of financial affairs of the Company and Group at the end of
the year and of its profit or loss. The responsibilities include ensuring that the Company and Group;
Keep proper accounting records that disclose, with reasonable accuracy, the financial position of the Company and Group and
comply with the requirements of the Companies and Allied Matters Act and the Banks and Other Financial Institutions Act;
Establish adequate internal controls to safeguard its assets and to prevent and detect fraud and other irregularities; and
Prepare financial statements using suitable accounting policies supported by reasonable and prudent judgments and
estimates that are consistently applied.
International Financial Reporting Standards
Prudential Guidelines for Licensed Banks in Nigeria;
Relevant circulars issued by the Central Bank of Nigeria;
The requirements of the Banks and Other Financial Institutions Act and
The requirements of the Companies and Allied Matters Act; and
The directors accept responsibility for the annual financial statements, which have been prepared using appropriate accounting policies supported
by reasonable and prudent judgements and estimates, in conformity with,
The Financial Reporting Council of Nigeria Act
The directors are of the opinion that the consolidated financial statements give a true and fair view of the state of the financial affairs of
the Company and Group and of the financial performance and cash-flows for the year. The directors further accept responsibility for the
maintenance of accounting records that may be relied upon in the preparation of financial statements, as well as adequate systems of
internal financial control.
Nothing has come to the directors to indicate that the Company and Group will not remain a going concern for at least twelve months
from the date of this statement.
Group Managing DirectorHerbert Wigwe
FRC/2013/ICAN/00000001998Group Deputy Managing DirectorObinna Nwosu
FRC/2016/IODN/00000014028
25

Access Bank Plc
Consolidated financial statements
For the year ended 31 December 2016
To the members of Access Bank Plc:
Mr. Henry Omatsola Aragho
Chairman, Audit Committee
26 January 2017
Members of the Audit Committee are:
1 *Mr. Henry Omatsola Aragho Shareholder Chairman
2 Mr Oluwatoyin Eleoramo Shareholder Member
3 Mr Idaere Gogo Ogan Shareholder Member
4 **Mr Oritsedere Otubu Director Member
5 Dr. Ernest Ndukwe Director Member
6 Dr. (Mrs.) Ajoritsedere Awosika Director Member
* Appointed Chairman of the Committee effective July 27, 2016.
Landmark towers, 5b water corporation way, OniruIn attendance:
Sunday Ekwochi – Company Secretary
** Resigned from the Committee effective September 1, 2016 following his retirement from the Board. He was replaced by
Mr. Abba Mamman Tor Habib a Non-Executive Director
We have deliberated on the findings of the external auditors who have confirmed that necessary cooperation was received
from management in the course of their audit and we are satisfied with management’s responses thereon and with the
effectiveness of the Bank’s system of accounting and internal control.
Report of the statutory audit committee
In accordance with the provisions of Section 359(6) of the Companies and Allied Matters Act of Nigeria, the members of the Audit
Committee of Access Bank Plc hereby report on the annual financial statements for the year 31 December 2016 as follows:
We have exercised our statutory functions under section 359(6) of the Companies and Allied Matters Act of Nigeria and
acknowledge the co-operation of management and staff in the conduct of these responsibilities.
We are of the opinion that the accounting and reporting policies of the Bank and Group are in agreement with legal
requirements and agreed ethical practices and that the scope and planning of both the external and internal audits for the
year ended 31 December 2016 were satisfactory and reinforce the Group’s internal control systems.
We are satisfied that the Bank has complied with the provisions of Central Bank of Nigeria Circular BSD/1/2004 dated 18
February 2004 on “Disclosure of insider related credits in the financial statements of banks”. We hereby confirm that an
aggregate amount of N2,693,131,022 (December 2015: N2,319,798,428) was outstanding as at 31 December 2016 which
was performing as at 31 December 2016 (see note 44)
26

Access Bank Plc
Consolidated financial statements
For the year ended 31 December 2016
NAIRA
S/N DESCRIPTION
2016 2015 2016 2015 2016 2015
1 Pending compliants B/F 132,396 1,152 623,867,921 - - -
2 Received Complaints 204,773 234,188 31,382,190,881 3,363,924,012 - -
3 Resolved complaints 328,511 102,944 30,772,621,392 2,740,056,091 3,058,341,677 534,897,186
4 Unresolved Complaints escalated to CBN for intervention - - - - - -
5 Unresolved complaints pending with the bank C/F 8,658 132,396 1,233,437,410 623,867,921 - -
USD
S/N DESCRIPTION
2016 2015 2016 2015 2016 2015
1 Pending compliants B/F 116 14 - - - -
2 Received Complaints 1618 959 69,878,941 1,594,251 - -
3 Resolved complaints 1656 857 68,184,828 873,196 118,688 155,747
4 Unresolved Complaints escalated to CBN for intervention - - - - -
5 Unresolved complaints pending with the bank C/F 78 116 1,694,114 721,055 - -
GBP
S/N DESCRIPTION
2016 2015 2016 2015 2016 2015
1 Pending compliants B/F 6 2 7,000 - - -
2 Received Complaints 93 28 786,508 7,000 - -
3 Resolved complaints 96 24 793,508 - 5,024 -
4 Unresolved Complaints escalated to CBN for intervention - - - - - -
5 Unresolved complaints pending with the bank C/F 3 6 - 7,000 - -
EUR
S/N DESCRIPTION
2016 2015 2016 2015 2016 2015
1 Pending compliants B/F 2 0 - - N/A -
2 Received Complaints 61 32 1,528,345 - N/A -
3 Resolved complaints 60 30 1,528,345 - 1,720 -
4 Unresolved Complaints escalated to CBN for intervention 0 0 - 0.00 N/A -
5 Unresolved complaints pending with the bank C/F 3 2 - - N/A -
Solicited Customer Feedback
Deliberate efforts are made to solicit feedback from customers and staff on the services and products
of the bank through the following:
- Questionnaires
- Customer interviews
- Customers forum
- Quest for Excellence Sessions (for staff)
- Voice of Customer Surveys
The various feedback efforts are coordinated by our Service and innovation Group
The feedback obtained from customers are reviewed and lessons learnt are used for staff training and
service improvement across the bank.
NUMBER AMOUNT CLAIMED (GBP) AMOUNT REFUNDED (GBP)
NUMBER AMOUNT CLAIMED (EUR) AMOUNT REFUNDED (EUR)
NUMBER AMOUNT CLAIMED (USD) AMOUNT REFUNDED (USD)
CUSTOMER COMPLAINTS AND FEEDBACK
Access Bank is fully committed to its core value of ‘passion for customers. The Bank prides itself on providing exceptional services to customers at all times. At the same time, given the number
and complexity of financial transactions that take place every day, the Bank recognizes that there will inevitably be occasions when mistakes and misunderstandings occur. In these situations,
Access bank encourages customers to bring their concerns to the attention of the bank for prompt resolution. In addition, deliberate efforts are made to solicit customers’ feedback on its
products and services.
Complaints Channels
In order to facilitate seamless complaint and feedback process, the bank has provided various channels for customers. These include:
- 24 hour contact centre with feedback through emails, telephone, SMS, Livechat, Social Media etc.
- Feedback portal on the Bank's website
- Customer service desks in over 300 branches and toll-free telephone lines to the office of the Group Managing Director in the banking halls of key branches.
- Correspondence from customers
- The Voice of Customer Solution
- The Ombudsman desk
Complaints Handling
We handle customer complaints with sensitivity and in due regard for the needs and understanding of each complainant. Efforts are made to resolve customer’s complaints at first level. Where
this cannot be done, they are immediately referred to the appropriate persons for resolution. All complaints are logged and tracked for resolution and feedback is provided to the customer.
Resolve or Refer command Centre
The ‘Resolve or Refer’ command centre serves to encourage timely service delivery and First Time Resolution (FTR) of customer issues. The ‘Resolve or Refer Command Centre’ which is being
run by a senior management staff has the mandate to ensure that most customer issues are resolved same day. The command centre provides support to all our departments and branches on
issue resolution.
Complaints Tracking and Reporting
We diligently track complaint information for continuous improvement of our processes and services. An independent review of the root cause of complaints made is carried out and lessons
learnt are fed back to the relevant business units to avoid future repetition. Customer complaint metrics are analysed and reports presented to Executive Management and the Operational Risk
Management committee. Reports on customer complaints are also sent to the Central bank as required.
ACCESS BANK PLC CUSTOMER'S COMPLAINTS FOR THE YEAR ENDED DECEMBER 31, 2016
NUMBER AMOUNT CLAIMED (NAIRA) AMOUNT REFUNDED (NAIRA)
27

Access Bank Plc Consolidated financial statements For the year ended 31 December 2016 RISK MANAGEMENT FRAMEWORK
28
OTHER RISKS MANAGEMENT
Risk management in 2016 could be described as a kaleidoscope of opportunities hidden within an intricate
web of uncertainties. The macroeconomic headwinds continued to create multiplicity of known and
unknown risks, causing the average Nigerian risk manager to delicately navigate the risk minefields like a
bomb detonating expert. The carryover of the sharp downward spiral in oil prices (on the back of a global
glut spurred by weakened demand and expanded supply) continued to impact the national economy in an
unprecedented ways. This negatively impacted foreign reserves and prompted the devaluation of the naira
– with a threat of potential further devaluation. These developments have opened up a challenge for the
current administration: how to conserve foreign reserves, curb rising inflation and unemployment and
shore up productive capacity as the import-content of manufacturing and general commerce instigates drop
in production and rising cost of production. For many firms, survival depended on their capacity to access
dollars and transfer the costs to the ultimate consumers – who already faced a diminished purchasing
power. In addition, many states had to be bailed out as they could no longer pay staff salaries.
In summary, the country’s political risk was once again significantly elevated, as various foreign investors
and foreign bank became more circumspect and wary in transacting with Nigeria. Various policy responses
were adopted to curb dollar demand and slow down the rate of Naira depreciation especially in the parallel
market. Given the current difference between the official and parallel foreign exchange markets, it is
difficult to infer that these measures the monetary authorities have employed in stabilizing the Naira have
worked.
What did all of these mean for banking and risk management 2016? It has been a year in which the expected
credit risk (asset quality concerns) was compounded by heightened market risks, currency risk and liquidity
risk. A period in which compliance risk also took front seat as regulators stepped up enforcement actions
and political exposure received closer attention.
For Access Bank, our analytical and reporting processes had anticipated many of these issues to varying
degrees, and had taken proactive steps to mitigate them. Beyond taking pre-emptive mitigating steps, the
outlook was viewed as an opportunity to further optimize our risk and governance processes and position
the Bank to benefit from market and regulatory developments. In summary, it has been a very engaging
year of risk management. Various risk management initiatives came to fruition during the period which
added to the range of risk management tools/processes that assisted the bank in managing risk over the
period. Some of these include:
Implementation of our risk-based SBU monthly performance management system, which fostered
robust alignment between risk-taking, financial performance and remuneration.
Kick-off of our trail-blazing risk culture assessment process - a first for the banking industry, and
the launch of the first formal Risk Culture Statement – a signal of the bank’s expressed risk values
and attitudes in support of our moderate Risk Appetite.
Full automation of our operational risk workflow and risk/capital measurement, which is part of
our Governance, Risk and Compliance implementation journey.

Access Bank Plc Consolidated financial statements For the year ended 31 December 2016 RISK MANAGEMENT FRAMEWORK
29
Automation of capital computation under Basle II principles.
Automation of our Environmental and Social Risk reviews and reporting process, including
automation of our Nigerian Sustainable Banking Principles reporting system.
Introduction of our automated document management system.
Revamp of our stress testing menu to incorporate subsectors, industry margins and
product/service elasticities.
The above remain pivotal in supporting the Bank’s risk optimization in the course of the first half of the
year, as well as being critical strategic investments in the Bank’s medium and long-term sustainability.
Further details on some of the above, and other key developments are provided in what follows below.
Compliance Risk Management
The Bank organizes its compliance function and set priorities for the management of its compliance risk in a way that is consistent with its own risk management strategy and structures. The implementation of our compliance function transformation which we commenced in 2015 has reached an advanced stage. A new governance structure designed to enhance our competitiveness has been established and the re-designation and migration of some activities/functions has begun. We are happy to note that the Central bank of Nigeria has approved our Cluster Branch Compliance structure which has significantly impacted on the way the compliance monitoring activities are carried out in the Bank. The compliance function has redefined its approach from its traditional inspectorate function into an advisory role with intense focus on regulatory intelligence gathering and closer cooperation with business units within the Bank, and the group acting as a contact point within the bank for compliance queries from staff members Furthermore, activities such as the gradual empowerment of the first line of defence, joint visitation calls & AML/CFT evaluation of our FI customers and the realignment of the Compliance function to incorporate conduct risk has been carried out. The strategy of the Conduct and Compliance group is to align the bank’s processes with best practice; promote ‘Positive Culture’; and closely provide regular advisory services to business units in order to achieve the business objectives of the bank without exposing the bank or any of its stakeholders to any regulatory or reputational risks.
Measurement, monitoring and management of compliance risk In Access Bank, compliance risk is: • measured by reference to identified metrics, incident assessments (whether affecting Access Bank or the wider industry), regulatory feedback and the judgment of our external assessors as it relates to AML/CFT and other compliance vulnerabilities;

Access Bank Plc Consolidated financial statements For the year ended 31 December 2016 RISK MANAGEMENT FRAMEWORK
30
• monitored against our compliance risk assessments and metrics, the results of the continuous monitoring and reporting activities of the compliance function and the results of internal and external audits and regulatory inspections; and • managed by establishing and communicating appropriate policies and procedures, training employees on them, and monitoring activity to assure their observance. The bank recognizes its accountability to all its stakeholders under the legal and regulatory requirements applicable to its business. The Conduct & Compliance function, including all staff of Access Bank Plc and its subsidiaries are committed to high standards of integrity and fair dealing in the conduct of business. The bank’s compliance risk management philosophy is deepened in the effective convergence risk management through the ‘Three Lines of Defence’ model. Effective compliance risk management of Access Bank Plc and its subsidiaries is coordinated in the following manner:
i. Where a business unit is subject to regulatory requirements, it will comply with those requirements. The business unit will furthermore establish and maintain systems of internal control to monitor and report the extent of compliance with those requirements with the support of Conduct & Compliance function.
ii. In the absence of regulatory requirements for all or part of a business unit, certain
minimum standards of conduct is established and maintained by that business unit to the extent required as determined by the management of that business unit.
iii. Accountability for ensuring compliance with regulatory requirements and minimum
standards rests with the Group Managing Director and the Board of Access Bank Group, whilst the enforcement thereof is the responsibility of the respective Group Heads (1st line of defence).
iv. To assist in the discharge of this obligation, Access Bank Plc maintains an independent
Conduct & Compliance Function. The Conduct & Compliance function develop systems of control that are required to ensure there is adequate protection of the bank, empower the first line of defence and ensure timely and reporting of breaches and other regulatory non-compliances to the Board and Executive Management of the Access Bank Group.
v. For independent assurance, Conduct & Compliance Function together with other Risk
Management functions and Group Internal Audit work cordially to ensure that the necessary synergies are achieved in the management of the bank’s compliance risk.
Our Compliance Risk Appetite
Access Bank Plc aims to be compliant with all applicable laws and regulations, internal company rules
and policies governing its operations and established good business practices. Access Bank Plc ensures that
this requirement is embedded in the culture of its business operations. Enhanced global AML and
sanctions policies, incorporating the bank’s risk appetite, were approved by the Board in January 2014. The
policies adopt and seek to enforce the highest or most effective standards globally, including a globally
consistent approach to knowing our customers.
With respect to Compliance risk, the bank’s appetite for Compliance Risk is defined as follows;

Access Bank Plc Consolidated financial statements For the year ended 31 December 2016 RISK MANAGEMENT FRAMEWORK
31
Zero tolerance for payment of fines and other penalties associated with regulatory infractions and non-compliance with laws, standards and rules. The primary compliance objective is to be among top three (3) most compliant banks in all jurisdictions we have our business operations. The Bank shall continuously aim to minimize the following compliance risk indicators:
i. Reported exceptions by auditors, regulators and external rating agencies;
ii. Frequent litigations;
iii. Payment of fines and other regulatory penalties; and
iv. Unresolved customer complaints.
The Bank shall not compromise its reputation through unethical, illegal and unprofessional conduct
in the market place. The Bank shall also maintain a zero appetite for association with disreputable
persons and/or entities.
Our AML Program
Access Bank Plc has a Board approved and established an AML/CFT program. This is contained in the bank’s compliance manual which is reviewed and updated at least on an annual basis. Our compliance manual contains the policies approved by the board. Some of these are the Politically Exposed Persons (PEP) Policy; Compliance Risk Management Policy, Compliance Charter etc.
Board members and all levels of staff are trained at least once every financial year on AML/CFT/KYC as stated in the bank's policy. New employees also undergo KYC/AML/CFT training as an induction course. The Bank organizes and ensures that staff attend webinars, conferences, workshop, trainings etc as part of its bankwide AML/CFT/KYC awareness program. Tests are conducted during such trainings to ensure employees understand the content and scope of the trainings.
All Access Bank staff sign the Annual Compliance attestation message to affirm that they have read and understood the policies and procedures of the bank relating to ethics, code of conduct, AML/CFT, Anti-bribery and corruption etc.
The Bank has designated a non-executive director who is responsible for the Access Bank Plc Anti Money Laundering / Combating Financing of Terrorism (AML/CFT) program. With the escalation protocol for compliance risk in place, the Enterprise Risk Management Committee (ERMC) and the Board via the Board Risk Management Committee (BRMC) serves as a medium for reporting compliance risk.
Anti-Bribery & Corruption Implementation
Access Bank adopts a zero-tolerance approach to bribery and corruption. The Bank conducts business affairs in a manner that shuns the use of corrupt practices or acts of bribery to obtain unfair advantage in our dealings within the markets and the communities we operate. The Bank and all its Subsidiaries have a Board approved policy which sets out the general rules and principles we adhere to and also communicate to all employees, directors, business associates as well as

Access Bank Plc Consolidated financial statements For the year ended 31 December 2016 RISK MANAGEMENT FRAMEWORK
32
relevant partners, suppliers, vendors and other stakeholders the need to maintain high ethical and professional conduct in the course of doing the Bank’s business. In 2015, the Bank commenced and completed the Anti-bribery risk assessment of selected high risk areas within the Group office. The bank becomes one of the first banks in the country to successfully achieve this. The bank has also begun the second phase of the ABC risk assessment with three (3) groups assessed for Anti-Bribery & Corruption vulnerabilities in the first half of 2016.
Conduct Risk Implementation
Conduct Risk: Detriment caused to our customers, clients, counterparties, or the Bank and its employees through inappropriate judgment in execution of business activities. We have reviewed and improved how conduct risk is assessed and reported throughout our business. The Bank is committed to putting customers’ at the heart of the decisions, treating customers’ fairly and resolving customer complaints within the shortest possible time. The Conduct Risk Framework is being embedded throughout the bank with focus on delivering positive customer and client outcomes. The roll-out of the conduct risk management framework has seen the adoption of Conduct Risk parameters as part of the formal KPIs for all staff of the Bank.
Strategic Alliance & Partnership
As part of our contribution towards the enhancement of the financial industry’s existing framework and initiatives to combat financial crimes and terrorist financing, the Conduct and Compliance Group during the first half of 2016 collaborated with the Financial Institutions Training Centre (FITC) to organize a training session on compliance risk management where compliance issues such as emerging risk regulations and standards, new International and regulatory landscape where discussed. The Association of Certified Compliance Professionals in Africa (ACCPA) which is a continental network of experienced and certified Anti-Money Laundering (AML) and Anti-Terrorist Financing (ATF) professionals working on the ground in Sub-Saharan Africa recently conferred the award for Africa AML Professional of the year on the Chief Conduct and Compliance Officer, Mr. Pattison Boleigha. The Bank was also invited to contribute to ‘The Leaders’ Anti-Corruption Manifesto’, a collection of high-level statements against corruption which will be published online, printed in hard copy, and launched at the Tackling Corruption Together conference. The conference which preceded the Global Anti-Corruption summit was hosted by the former Prime Minister of the UK Mr. David Cameron was held on May 11, 2016 in the United Kingdom.
Operational Risk Management
Operational risk is the risk of loss resulting from inadequate or failed internal processes, people, or systems,
or from external events. Our definition of operational risk excludes regulatory risks, strategic risks and
potential losses related solely to judgments with regard to taking credit, market, interest rate, liquidity, or
insurance risks.

Access Bank Plc Consolidated financial statements For the year ended 31 December 2016 RISK MANAGEMENT FRAMEWORK
33
It also includes the reputation and franchise risk associated with business practices or market conduct in
which the Bank is involved. Operational risk is inherent in Access Bank’s global business activities and, as
with other risk types, is managed through an overall framework designed to balance strong corporate
oversight with well-defined independent risk management.
This framework includes:
recognized ownership of the risk by the businesses;
oversight by independent risk management; and
independent review by Corporate Audit.
We seek to minimise exposure to operational risk, subject to cost trade-offs. Operational risk exposures are
managed through a consistent set of management processes that drive risk identification, assessment,
control and monitoring.
The goal is to keep operational risk at appropriate levels relative to the characteristics of our businesses and
the markets in which we operate, our capital and liquidity, and the competitive, economic and regulatory
environment. Notwithstanding these controls, Access Bank incurs operational losses.
Our operational risk strategy seeks to minimise the impact that operational risk can have on shareholders’
value. The Bank’s strategy is to:
Reduce the likelihood of occurrence of expected events and related cost by managing the
risk factors and implementing loss prevention or reduction techniques to reduce variation
to earnings;
Minimise the impact of unexpected and catastrophic events and related costs through risk
financing strategies that will support the Bank’s long term growth, cash flow management
and balance sheet protection;
Eliminate bureaucracy, improve productivity, reduce capital requirements and improve
overall performance through the institution of well designed and implemented internal
controls.
In order to create and promote a culture that emphasizes effective operational management and adherence
to operating controls, there are three distinct levels of operational risk governance structure in Access Bank
Plc.
Level 1 refers to the oversight function carried out by the Board of Directors, Board risk committee and the
executive management. Responsibilities at this level include ensuring effective management of operational
risk and adherence to the approved operational risk policies.
Level 2 refers to the management function carried out by operational risk management group. It has direct
responsibility for formulating and implementing the Bank’s operational risk management framework
including methodologies, policies and procedures approved by the Board.
`

Access Bank Plc Consolidated financial statements For the year ended 31 December 2016 RISK MANAGEMENT FRAMEWORK
34
Level 3 refers to the operational function carried out by all business units and support functions in the
Bank. These units/functions are fully responsible and accountable for the management of operational risk
in their units. They work in liaison with operational risk management to define and review controls to
mitigate identified risks. Internal audit provides independent assessment and evaluation of the Bank’s
operational risk management framework. This periodic confirmation of the existence and utilisation of
controls in compliance with approved policies and procedures, provide assurance as to the effectiveness of
the Bank’s operational risk management framework. Some of the tools being used to assess, measure and
monitor operational risks in the bank include; a loss database of operational risk events; an effective risk
and control self-assessment process that helps to analyse business activities and identify operational risks
that could affect the achievement of business objectives; and key risk indicators which are used to monitor
operational risks on an ongoing basis.
The Group’s operational risk framework
The Group’s current operational risk framework was implemented in 2007 to meet internal and regulatory
requirements. There has been significant investment in the implementation of improved measurement and
management approaches for operational risk to strengthen control, improve customer service, improve
process efficiencies and minimise operating losses. The Group recognises the fact that It is neither cost-
effective nor possible to attempt to eliminate all operational risks. Events of small significance are thus
expected to occur and are accepted as inevitable with relevant budgeting for these losses where
appropriate. Events of material significance are limited and the Group seeks to reduce the risk from these
extreme events in a framework consistent with its agreed risk appetite. Processes are in place to monitor
the management and future mitigation of such events.
The role of the Operational Risk function is to establish, implement and maintain the operational risk
framework for the modelling and managing of the Group’s operational risk, while reinforcing and enabling
operational risk management culture throughout the Group. The aim is to integrate, based on international
norms and best practices, all operational risk activities and to compile a reliable operational risk profile
contributing to the Group’s risk- reward profile. The key advantage of this framework is the financial
quantification and modelling of operational risks. This functionality has significantly improved the Group’s
operational risk measurement and management capabilities.
Management and control responsibilities
The first line of governance for managing operational risk rests with business and operational risk
management forms part of the day-to-day responsibilities of all business unit management. Business unit
staff report any identified breakdowns in control and any risk events that may result in financial loss and/or
reputation damage. Amongst others, business management are responsible to ensure that processes for
identifying and addressing ineffective controls and the mitigating of risk events are implemented and
executed. Operational Risk teams form the secondary line of governance by ensuring that processes to
identify weaknesses are effective and identified weaknesses are acted upon. The Group operational risk
profile is presented to the Board quarterly. Control effectiveness is monitored at the ERMC and at the
Board; and the multi-layered system of defences ensures pro-active operational risk management.

Access Bank Plc Consolidated financial statements For the year ended 31 December 2016 RISK MANAGEMENT FRAMEWORK
35
Measuring and managing operational risk
The Group recognizes the significance of operational risk and is committed to enhancing the measurement
and management thereof. Within the Group’s operational risk framework, qualitative and quantitative
methodologies and tools are applied (Group-wide) to identify and assess operational risks and to provide
management information for determining appropriate mitigating measures.
Risk event data collection and reporting
A standard process is used Group-wide for the recognition, capture, assessment, analysis and reporting of
risk events. This process is used to help identify where process and control requirements are needed to
reduce the recurrence of risk events. Risk events are loaded onto a central database and reported monthly
to the ERMC. The Group also uses a database of external public risk events and is part of a consortium of
international banks that share loss data information anonymously to assist in risk identification,
assessment, modelling and benchmarking.
Risk and control self-assessments (RCSA)
In order to pro-actively identify and actively mitigate risks, the operational risk framework utilises RCSAs.
RCSA is used at a granular level to identify relevant material risks and key controls mitigating these risks.
The risks and controls are assessed on a quarterly basis and relevant action plans are put in place to treat,
tolerate, terminate or transfer the risks, taking into account the relevant business risk appetites. The RCSA
programme is extensive and covers the entire Group. The Internal Audit further tests the effectiveness of
the RCSAs within the normal course of auditing and relevant metrics are monitored and actioned where
relevant.
Key risk indicators (KRIs)
A comprehensive set of KRIs are in place across the Group, with relevant and agreed thresholds set by the
business. KRIs are monitored on a Group as well as business unit level, based on significance. Threshold
breaches are managed in accordance with an agreed process across the Group.
Reporting
Business units are required to report on both a regular and an event-driven basis. The reports include a
profile of the key risks to their business objectives, RCSA and KRI results, and operational risk events. Risk
reports are presented to executive management and risk committees.
Allocating Capital to Business Units
An allocation methodology is applied for allocating capital to business units. For each business units, the
allocation takes into consideration not only the size of the business unit, but also measures the business
unit’s control environment, namely open audit findings, RCSA results, and loss experience. This translates
Access Bank Plc Consolidated financial statements For the year ended 31 December 2016 RISK MANAGEMENT FRAMEWORK
36
to a risk-sensitive allocation with the opportunity afforded to business to identify actions to positively
impact on their respective allocated operational risk capital.
Insurance mitigation
Insurance policies are used as a way to mitigate operational risks. These policies are current and remain
applicable in the Group operating environment. Insurance coverage is purchased at Group or cluster level
to discharge statutory and regulatory duties, or to meet counterparty commitments and stakeholder
expectations. The primary insurance policies managed by the Group are:
comprehensive crime and electronic crime;
directors’ and officers’ liability; and
professional indemnity.
In terms of the AMA, the Group may adjust its operational risk exposure result by no more than 20% to
reflect the impact of operational risk mitigants. Globally, the use of insurance and other risk transfer
mechanisms for operational risk is in a state of rapid development and pioneering work is being done across
the industry. While the Group has developed a methodology for the modelling of insurance, the Group will
not apply risk mitigation in the calculation of its operational risk exposure until such time as insurance
policies are compliant to regulatory minimum requirements.
Information Security and Continuity of Business
Information security and the protection of confidential and sensitive customer data are a priority of Access
Bank. The Bank has developed and implemented an Information Security Risk Management framework
that is in line with best practice. The framework is reviewed and enhanced regularly to address emerging
threats to customers’ information.
The Bank mitigates business continuity risks by reviewing and testing recovery procedures. In 2014, the
Bank obtained ISO certification in Business Continuity. Regular bank wide awareness campaigns are also
used to drive information security and business continuity culture in the bank.
Strategic Risk Management
In Access Bank, we define Strategic Risk as the process for identifying, assessing and managing risks and
uncertainties, affected by internal and external events or scenarios that could inhibit the bank’s ability to
achieve its strategy and strategic objectives with the ultimate goal of creating and protecting shareholder
and stakeholder value. It is a primary component and necessary foundation of our Enterprise Risk
Management.
Strategic risk management, therefore, is defined as current or prospective risk to earnings and capital
arising from adverse business decisions, improper implementation of decisions or lack of responsiveness
to changes in the business environment. It can also be defined as the risk associated with future business

Access Bank Plc Consolidated financial statements For the year ended 31 December 2016 RISK MANAGEMENT FRAMEWORK
37
plans and strategies, including plans for entering new business lines, expanding existing services through
mergers and acquisitions, and enhancing infrastructure.
A well-defined structure for managing strategic risk exists in Access Bank. It provides a process for the Bank
to identify and assess potential risks posed by its strategic plan, and consider whether they have adequate
capacity to withstand the risks. Strategic risk management involves various organizational functions within
the Bank. The following principles govern the Bank’s strategic risk management:
The Board and Senior management are responsible for Strategic risk management and oversees the
effective functioning of the strategic risk management framework; The functional units (i.e. the units which
carry out business or operational functions) assists the Board and Senior management in formulating an
implementing strategies, and in providing input to the strategic planning and management processes; and
as well as implementing the strategic risk management framework.
The strategic risk management functions support the Board and senior management in managing strategic
risk and other related processes in the Bank.
Access Bank, in compliance with the Basel II principles, uses Internal Capital Adequacy Assessment Process
in assessing its Strategic Risk. To this end, it sees Strategic Risk as material risk that could result when the
bank fails to meet its performance targets, sufficient cashflow to maintain its operations that may result in
a negative impact on the bank’s operating result and financial condition.
This strategic risk could stem from adverse global economy, regulatory actions, improper analysis that can
impact the implementation of decisions, lack of responsiveness to industry changes, inability to respond
promptly to business opportunities, ineffective change management and communication process as well as
the nature and activities of competitors.
Based on the foregoing, the bank estimates a capital charge figure in relationship to its actual gross earnings
to cover its strategic risk exposure, in line with its tolerance level.
The measures and controls it has put in place include the following
Strategic plans are approved and monitored by the board. Regular environmental scan, business strategy
sessions and workshops are set up to discuss business decisions, close monitoring to ensure that strategic
plans are properly aligned with the business model, regular performance review by EXCO, business plans
are approved by the board. The bank also maintains a well-defined succession plan, proper monitoring and
well defined structures to align its activities to international best practices.

Access Bank Plc Consolidated financial statements For the year ended 31 December 2016 RISK MANAGEMENT FRAMEWORK
38
Reputational Risk Management
Reputational risk arises when the bank’s reputation is damaged by one or more reputational events from
negative publicity about the organization’s business practices, conduct or financial condition. The Bank’s
Strategic and Reputational Risk Management is mandated to protect the Bank from potential threats to its
reputation. The team continuously uses proactive means in minimizing the effects of reputational events,
thereby averting the likelihood of major reputational crises with the view of ultimately ensuring the survival
of the organization. The Bank has put in place a framework to properly articulate, analyze and manage
reputational risk factors.
Access Bank takes the management of reputational risks seriously because of their far-reaching implications
which are buttressed by the fact that the Bank operates under:
A highly regulated financial services industry with high visibility and vulnerability to regulatory
actions that may adversely impact its reputation. (e.g. corporate governance crises);
Keen competition and largely homogeneous products and services have led customers not to
perceive significant differences between financial service providers; and
Given the financing nature of products and services they provide, Banks are not only exposed to
their own reputation, but also to the reputation of their clients.
With banks operating and competing in a global environment, risks emerging from a host of different
sources and locations is difficult to keep up with and to know how best to respond if they occur. The effects
of the occurrence of a reputational risk event include but are not limited to the following:
Loss of current or future customers;
Loss of public confidence;
Loss of employees leading to an increase in hiring costs, or staff downtime;
Reduction in current or future business partners;
Increased costs of capitalization via credit or equity markets;
Regulatory sanctions;
Increased costs due to government regulations, fines, or other penalties; and
Loss of banking license.
It is Group policy that, at all times, the protection of the Group’s reputation should take priority over all
other activities, including revenue generation. Reputational risk will arise from the failure to effectively
mitigate one or more of country, credit, liquidity, market, regulatory and operational risk. It may also arise
from the failure to comply with social, environmental and ethical standards. All employees are responsible
for day-to-day identification and management of reputational risk.
The desired risk appetite for reputation is low risk (1). The bank will ensure that highest ethical standards
are followed at all times and the code of conduct policy will be strictly implemented.
During the year under review, the leadership of Strategic and Reputational Risk Management Unit was
strengthened with the recruitment of a senior management staff to fully drive the implementation of the
policies and strategies of the Bank with regards to its strategic and reputational risks.
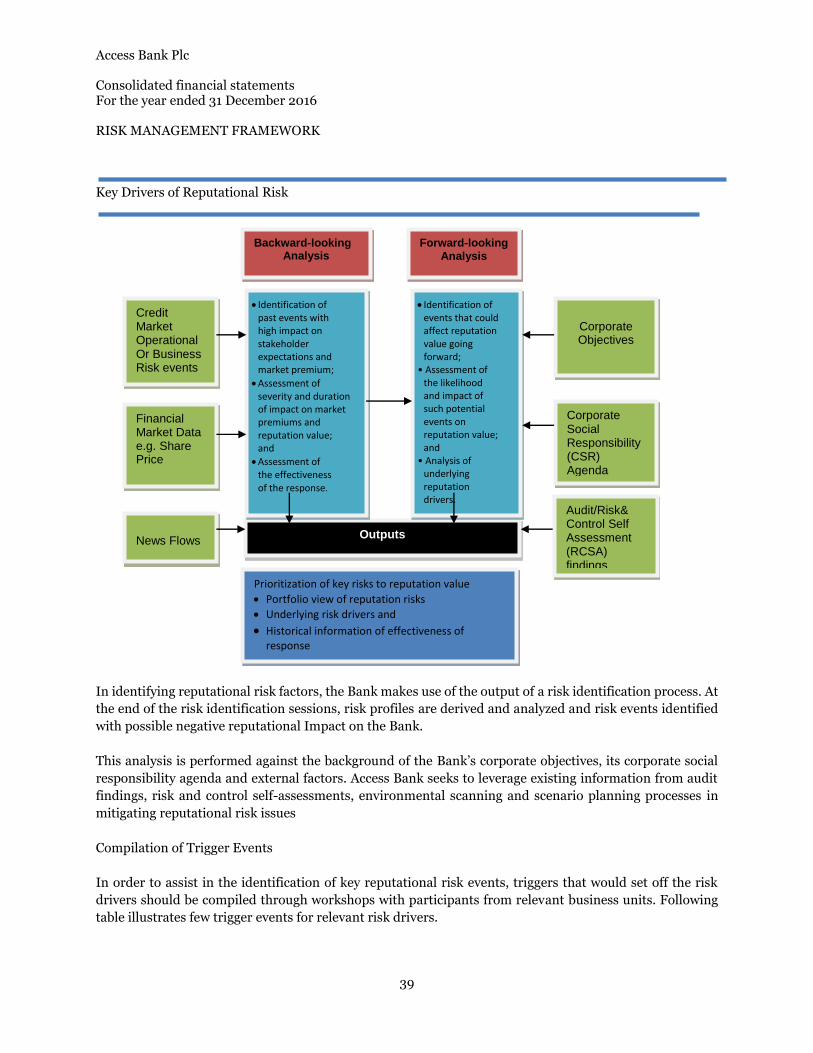
Access Bank Plc Consolidated financial statements For the year ended 31 December 2016 RISK MANAGEMENT FRAMEWORK
39
Key Drivers of Reputational Risk
In identifying reputational risk factors, the Bank makes use of the output of a risk identification process. At
the end of the risk identification sessions, risk profiles are derived and analyzed and risk events identified
with possible negative reputational Impact on the Bank.
This analysis is performed against the background of the Bank’s corporate objectives, its corporate social
responsibility agenda and external factors. Access Bank seeks to leverage existing information from audit
findings, risk and control self-assessments, environmental scanning and scenario planning processes in
mitigating reputational risk issues
Compilation of Trigger Events
In order to assist in the identification of key reputational risk events, triggers that would set off the risk
drivers should be compiled through workshops with participants from relevant business units. Following
table illustrates few trigger events for relevant risk drivers.
Backward-looking Analysis
Forward-looking Analysis
Credit Market Operational Or Business Risk events
Financial Market Data e.g. Share Price
News Flows
Audit/Risk& Control Self Assessment (RCSA) findings
Corporate Social Responsibility (CSR) Agenda analysis
Corporate Objectives
Prioritization of key risks to reputation value
Portfolio view of reputation risks
Underlying risk drivers and
Historical information of effectiveness of response
Outputs
Identification of past events with high impact on stakeholder expectations and market premium;
Assessment of severity and duration of impact on market premiums and reputation value; and
Assessment of the effectiveness of the response.
Identification of events that could affect reputation value going forward;
• Assessment of the likelihood and impact of such potential events on reputation value; and
• Analysis of underlying reputation drivers.

Access Bank Plc Consolidated financial statements For the year ended 31 December 2016 RISK MANAGEMENT FRAMEWORK
40
Risk Drivers Trigger Events
Corporate governance and
leadership
• Corporate frauds and scandals;
• Association with dishonest and disreputable
characters as directors, management
• Association with politically exposed persons
• Incidence of shareholders conflict and Board
Instability.
Regulatory Compliance • Non - Compliance with laws and regulation;
• Non submission of Regulatory returns
Delivering customer promise
• Security Failure
• Shortfall in quality of service/fair treatment;
• Bad behavior by employees
Workplace talent and culture
• Unfair employment practices
• Not addressing employee grievances
• Uncompetitive remuneration
Corporate social responsibility • Lack of community development initiatives
Corporate Culture
• Lack of appropriate culture to support the
achievement of business objective.
• Ineffective risk management practices.
• Unethical behaviors on the part of staff and
management.
• Lack of appropriate structure for employees
to voice their concerns
Risk Management and
Control Environment
• Inadequate Risk Management and Control
environment
• Continuous violations of existing policies and
Procedures
Financial Soundness and
Business viability
• Consistent poor financial performance
• Substantial losses from unsuccessful
Investment
Crisis Management
• Inadequate response to a crisis or even a
minor incident

Access Bank Plc Consolidated financial statements For the year ended 31 December 2016 RISK MANAGEMENT FRAMEWORK
41
Events data analysis
Events data analysis is conducted to assess the gap between performance of the bank and the expectation
of stakeholders. The nature of the gap and the reasons for the gap is analyzed for ensuing corrective action.
Example of events data analyzed is furnished below:
Evaluating types of marketing efforts and implications for Reputational Risk;
Analysis of number of accounts opened vs. closed;
Calling effort analysis;
Complaint log analysis; and
Error resolution review.
Approach to managing reputation events
The Bank’s approach to managing reputation events, including any relevant strategy and policies, is
approved by the Board or its delegated committee and subject to periodic review and update by senior
management to ensure that it remains appropriate over time. In addition, the approach is well documented
and communicated to all relevant personnel.
Post reputation event reviews
After a reputation event, the post-event review will be conducted by Internal Audit and Risk Management
Division to identify any lessons learnt, or problems and weaknesses revealed, from the event. Such reviews
will be useful for providing feedback and recommendations for enhancing the Bank’s reputation risk
management process, and should at least be conducted on any major event affecting Access Bank. The
Board and senior management will be promptly informed of the results of any such review conducted so
that they can take appropriate actions to improve its approach to managing reputation risk.
Capital Risk Management
Capital risk is the risk that the Bank’s total capital base is not properly managed in a prudent manner.
Capital management objectives:
The Group has a number of capital management objectives:
o to meet the capital ratios required by its regulators and the Group’s Board;
o to maintain an adequate level of available capital resources as cover for the economic
capital (EC) requirements calculated at a 99.95% confidence level;
o to generate sufficient capital to support asset growth;
o to maintain an investment grade credit rating; and
o to achieve a return above the cost of equity.

Access Bank Plc Consolidated financial statements For the year ended 31 December 2016 RISK MANAGEMENT FRAMEWORK
42
Capital management strategy:
The Group’s capital management strategy is focused on maximizing shareholder value by optimizing the
level and mix of capital resources. Decisions on the allocation of capital resources are based on a number of
factors including return on economic capital (EC) and on regulatory capital (RC), and are part of the internal
capital adequacy assessment process (ICAAP).
Capital management process
Importance of capital management
Capital is managed as a Board level priority in the Group which reflects the importance of capital planning.
The Board is responsible for assessing and approving the Group’s capital management policy, capital target
levels and capital strategy.
A capital management framework provides effective capital planning, capital issuance, Basel II alignment,
EC utilisation and economic profit (EP) performance measurement criteria. The above diagram illustrates
the process the Group follows to ensure end-to-end integration of the Group’s strategy, risk management
and financial processes into the capital management process. The purpose is to ensure that capital
consumption in the business divisions has an impact on performance measurement, which in turn
translates into management performance assessment and product pricing requirements and achievement
of the overall strategy within risk appetite.
Financial Forecast
Group Strategy
Performance Measurement
Risk Apetite
Capital transactions Retained profit
Assess capital supply alternatives given market demand
Equity and other capital transactions issuance, including refinancing of existing capital transactions
Securitisation transactions
Share buybacks/dividends
Dividends from subsidiaries composition
Medium Term Plans
Annual forecast
Regulatory capital Calculation of Pillar 1 capital
requirements
Review and challenge of Pillar 1 requirements
Economic capital Review and challenge
business units’ demand for economic capital
Calculation of Group economic capital - Assess adequacy of Pillar 1
risks - Calculate additional risks
Stressed capital
requirement
Stress capital supply given market Stressed capital
requirement
demand/profit and loss
Stress and scenario testing
Ca
pit
al
su
pp
ly
Cap
ital
de
ma
nd
Capital management


Access Bank Plc
Consolidated financial statements
For the year ended 31 December 2016
Consolidated statement of comprehensive income
In thousands of Naira Group Group Bank Bank
Notes December 2016 December 2015 December 2016 December 2015
Interest income 8 247,286,635 207,802,768 210,794,456 184,047,834
Interest expense 8 (108,138,875) (102,421,118) (94,777,050) (94,001,878)
Net interest income 139,147,760 105,381,650 116,017,406 90,045,956
Net impairment charge 9 (21,952,819) (14,224,715) (17,641,127) (13,287,613)
Net interest income after impairment charges 117,194,941 91,156,935 98,376,279 76,758,343
Fee and commission income 10 55,440,500 33,463,887 45,992,484 25,892,284
Fee and commission expense (576,697) (151,118) - -
Net fee and commission income 54,863,803 33,312,769 45,992,484 25,892,284
Net gains on investment securities 11a,b 55,051,078 62,738,014 54,968,917 62,699,600
Net foreign exchange income/(loss) 12 3,597,591 26,501,682 (94,434) 23,205,265
Other operating income 13 19,944,978 6,897,879 19,339,549 6,216,992
Personnel expenses 14 (51,795,538) (42,346,952) (42,153,587) (35,699,471)
Rent expenses (2,810,090) (1,739,857) (1,632,377) (1,405,715)
Depreciation 28 (9,106,886) (8,615,137) (7,774,591) (7,762,291)
Amortization 29 (2,186,905) (1,483,193) (1,854,437) (1,324,075)
Other operating expenses 15 (94,413,516) (91,384,023) (84,588,227) (83,403,018)
Profit before tax 90,339,456 75,038,117 80,579,576 65,177,914
Income tax 16 (18,900,109) (9,169,344) (16,553,441) (6,253,169)
Profit for the year 71,439,347 65,868,773 64,026,135 58,924,745
Other comprehensive income (OCI) net of income tax :
items that will not be subsequently reclassified to income statement:
Remeasurements of post-employment benefit obligations 2,590,139 (1,061,292) 2,590,139 (1,061,292)
Items that may be subsequently reclassified to the income statement:
Foreign currency translation differences for foreign subsidiaries
- Realised gains during the year - - - -
- Unrealised gains /(losses) during the year 19,458,036 (1,987,684) - -
Net changes in fair value of AFS financial instruments
-Fair value changes during the year 10,012,499 3,387,680 10,063,039 3,457,636
Other comprehensive gain, net of related tax effects: 32,060,674 338,704 12,653,178 2,396,344
Total comprehensive income for the year 103,500,021 66,207,477 76,679,313 61,321,089
Profit attributable to:
Owners of the bank 71,117,025 65,332,540 64,026,135 58,924,745
Non-controlling interest 322,322 536,233 - -
Profit for the year 71,439,347 65,868,773 64,026,135 58,924,745
Total comprehensive income attributable to:
Owners of the bank 101,241,269 65,798,664 76,679,313 61,321,089
Non-controlling interest 2,258,752 408,813 - -
Total comprehensive income for the year 103,500,021 66,207,477 76,679,313 61,321,089
Earnings per share attributable to ordinary shareholders
Basic (kobo) 17 250 265 221 237
Diluted (kobo) 17 246 262 221 237
The notes are an integral part of these consolidated financial statements.
51

Access Bank Plc
Consolidated financial statements
For the year ended 31 December 2016
Consolidated statement of financial position
As at 31 December 2016
Group Group Bank Bank
In thousands of Naira Notes December 2016 December 2015 December 2016 December 2015
Assets
Cash and balances with banks 18 713,889,105 478,409,336 517,997,249 405,998,636
Investment under management 19 14,871,247 10,403,608 14,871,247 10,403,608
Non pledged trading assets 20 44,629,579 52,298,422 44,629,579 52,298,422
Derivative financial assets 21 156,042,984 77,905,020 155,772,662 77,852,349
Loans and advances to banks 22 45,203,002 42,733,910 104,006,574 60,414,721
Loans and advances to customers 23 1,809,459,172 1,365,830,831 1,594,562,345 1,243,215,309
Pledged assets 24 314,947,502 203,715,397 314,947,502 200,464,624
Investment securities 25 229,113,772 186,223,126 161,200,642 155,994,798
Other assets 26 63,255,054 83,014,503 50,594,480 78,623,381
Investment in subsidiaries 27b - - 59,239,252 45,439,246
Property and equipment 28 84,109,052 73,329,927 71,824,472 65,900,384
Intangible assets 29 6,939,555 6,440,616 5,173,784 4,977,908
Deferred tax assets 30 1,264,813 10,845,612 - 10,180,832
3,483,724,837 2,591,150,308 3,094,819,788 2,411,764,218
Asset classified as held for sale 31 140,727 179,843 140,727 179,843
Total assets 3,483,865,564 2,591,330,151 3,094,960,515 2,411,944,061
Liabilities
Deposits from financial institutions 32 167,356,583 72,914,421 95,122,188 63,343,785
Deposits from customers 33 2,089,197,286 1,683,244,320 1,813,042,872 1,528,213,883
Derivative financial liabilities 21 30,444,501 3,077,927 30,275,181 2,416,378
Current tax liabilities 16 5,938,662 7,780,824 5,004,160 6,442,311
Other liabilities 34 113,571,240 69,355,947 107,538,941 64,094,358
Deferred tax liabilities 30 3,699,050 266,644 3,101,753 -
Debt securities issued 35 316,544,502 149,853,640 243,952,418 78,516,655
Interest-bearing borrowings 36 299,543,707 231,467,161 372,179,785 302,919,987
Retirement benefit Obligation 37 3,075,453 5,567,800 3,064,597 5,567,800
3,029,370,984 2,223,528,684 2,673,281,895 2,051,515,157
Total liabilities
Equity
Share capital and share premium 38 212,438,802 212,438,802 212,438,802 212,438,802
Retained earnings 93,614,030 51,730,369 93,329,188 49,459,102
Other components of equity 38 142,194,720 99,732,330 115,910,630 98,531,000
#######Total equity attributable to owners of the
Bank 448,247,552 363,901,501 421,678,620 360,428,904
Non controlling interest 38 6,247,028 3,899,966 - -
Total equity 454,494,580 367,801,467 421,678,620 360,428,904
Total liabilities and equity 3,483,865,564 2,591,330,151 3,094,960,515 2,411,944,061
Signed on behalf of the Board of Directors on 26 January, 2017 by:
GROUP MANAGING DIRECTOR
Herbert Wigwe
FRC/2013/ICAN/00000001998
GROUP DEPUTY MANAGING DIRECTOR
Obinna Nwosu
FRC/2016/IODN/00000014028
CHIEF FINANCIAL OFFICER
Oluseyi Kumapayi
FRC/2013/ICAN/00000000911
52

Access Bank Plc
Consolidated financial statements
For the year ended 31 December 2016
Consolidated statement of changes in equity
In thousands of Naira ForeignGroup Regulatory Other Share currency Non
Share Share risk regulatory scheme Treasury Capital Fair value translation Retained Controlling Totalcapital premium reserve reserves reserve Shares reserve reserve reserve earnings Total interest Equity
Balance at 1 January 2016 14,463,986 197,974,816 39,625,042 50,097,911 554,898 (1,732,771) 3,489,080 13,268,889 (5,570,719) 51,730,369 363,901,501 3,899,966 367,801,467
Total comprehensive income for the year:Profit for the year 71,117,025 71,117,025 322,322 71,439,347
Other comprehensive income, net of taxUnrealised foreign currency translation difference - - - - - - - - 17,562,744 - 17,562,744 1,895,292 19,458,036 Actuarial gain on remeasurement of retirement benefit (net of
tax) - - - - - - - - - 2,590,139 2,590,139 - 2,590,139 Net changes in fair value of AFS financial instruments - - - - - - - 9,971,361 - 9,971,361 41,138 10,012,499
Total other comprehensive gain - - - - - - 9,971,361 17,562,744 2,590,139 30,124,244 1,936,430 32,060,674
Total comprehensive (loss)/income - - - - - - - 9,971,361 17,562,744 73,707,164 101,241,269 2,258,752 103,500,021
Transactions with equity holders, recorded directly in
equity:
Transfers during the year - - 3,307,508 12,517,301 - - - - - (15,824,809) - - - Deemed disposal of subsidiaries - - - - - - - - - (88,310) (88,310) 88,310 - Scheme shares - - - - 1,061,070 (1,553,604) - - - - (492,534) - (492,534) Vested shares - - - - (403,990) - - - - (403,990) - (403,990) Dividend paid to equity holders - - - - - - - - - (15,910,384) (15,910,384) - (15,910,384) Total contributions by and distributions to equity
holders - - 3,307,508 12,517,301 657,080 (1,553,604) - - - (31,823,503) (16,895,218) 88,310 (16,806,908)
Balance at 31 December 2016 14,463,986 197,974,816 42,932,550 62,615,212 1,211,978 (3,286,375) 3,489,080 23,240,250 11,992,025 93,614,030 448,247,552 6,247,028 454,494,580
Consolidated statement of changes in equity
In thousands of Naira ForeignGroup Regulatory Other Share currency Non
Share Share risk regulatory Scheme Treasury Capital Fair value translation Retained Controlling Totalcapital premium reserve reserves reserve Shares reserve reserve reserve earnings Total interest Equity
Balance at 1 January 2015 11,441,460 161,036,211 21,205,031 37,078,604 295,419 (976,127) 3,489,080 9,881,402 (3,710,648) 34,139,453 273,879,885 3,530,843 277,410,728
Total comprehensive income for the year:Profit for the year 65,332,540 65,332,540 536,233 65,868,773
Other comprehensive income, net of taxUnrealised foreign currency translation difference - - - - - - - - (1,860,071) - (1,860,071) (127,613) (1,987,684) Realised foreign currency translation difference - - - - - Actuarial loss on remeasurement of retirement benefit (net fo
tax) - - - - - - - - - (1,061,292) (1,061,292) - (1,061,292) Net changes in fair value of AFS financial instruments - - - - - - - - - - - - - Fair value changes on AFS financial instruments from
associates - - - - - - - 3,387,487 - - 3,387,487 193 3,387,680
Total other comprehensive gain/(loss) - - - - - - - 3,387,487 (1,860,071) (1,061,292) 466,124 (127,420) 338,704
Total comprehensive (loss)/income - - - - - - - 3,387,487 (1,860,071) 64,271,248 65,798,664 408,813 66,207,477
Transactions with equity holders, recorded directly in
equity:
Transfers during the year - - 18,420,011 13,019,307 - - - - - (31,439,318) - - - Additonal shares - - - - - (1,061,058) - - - - (1,061,058) - (1,061,058) Scheme shares - - - - 563,893 - - - - - 563,893 - 563,893 Vested Shares - - - - (304,414) 304,414 - - - - - - - Proceed from right issue 3,022,526 36,938,605 - - - - - - - - 39,961,131 - 39,961,131 Dividend paid to equity holders - - - - - - - - - (15,241,014) (15,241,014) (39,690) (15,280,704) Total contributions by and distributions to equity
holders 3,022,526 36,938,605 18,420,011 13,019,307 259,479 (756,644) - - - (46,680,332) 24,222,952 (39,690) 24,183,262
Balance at 31 December 2015 14,463,986 197,974,816 39,625,042 50,097,911 554,898 (1,732,771) 3,489,080 13,268,889 (5,570,719) 51,730,369 363,901,501 3,899,966 367,801,467
Attributable to owners of the Bank
Attributable to owners of the Bank
53

Access Bank Plc
Consolidated financial statements
For the year ended 31 December 2016
Statement of changes in equity
In thousands of Naira
Regulatory Other Share
Bank Share Share risk regulatory Scheme Capital Fair value Retained Total
capital premium reserve reserves reserve Reserve reserve earnings Equity
Balance at 1 January, 2016 14,463,986 197,974,816 37,826,382 43,397,152 527,331 3,489,081 13,291,054 49,459,102 360,428,904
Total comprehensive income for the year:
Profit for the year - - - - - - - 64,026,135 64,026,135
Other comprehensive income, net of tax
Actuarial gain on remeasurement of retirement benefit - - - - - - - 2,590,139 2,590,139
Net changes in fair value of AFS financial instruments - - - - - - 10,063,039 - 10,063,039
Total other comprehensive income - - - - - - 10,063,039 2,590,139 12,653,178
Total comprehensive (loss)/income - - - - - - 10,063,039 66,616,274 76,679,313
Transactions with equity holders, recorded directly in equity:
Transfers for the year - - (2,768,116) 9,603,920 - - - (6,835,804) -
Dividend paid to equity holders - - - - - - - (15,910,384) (15,910,384)
Scheme shares - - - - 884,777 - - - 884,777
Vested shares - - - - (403,990) - - - (403,990)
Total contributions by and distributions to equity holders - - (2,768,116) 9,603,920 480,787 - - (22,746,188) (15,429,597)
Balance at 31 December 2016 14,463,986 197,974,816 35,058,266 53,001,072 1,008,118 3,489,081 23,354,093 93,329,188 421,678,620
Statement of changes in equity
In thousands of Naira
Bank Regulatory Other Share
Share Share risk regulatory Scheme Capital Fair value Retained Total
capital premium reserve reserves reserve Reserve reserve earnings Equity
Balance at 1 January, 2015 11,441,460 161,036,211 17,001,981 34,558,437 295,419 3,489,081 9,833,418 36,499,779 274,155,786
Total comprehensive income for the year:
Profit for the year - - - - - - - 58,924,745 58,924,745
Other comprehensive income, net of tax
Actuarial loss on remeasurement of retirement benefit - - - - - - - (1,061,292) (1,061,292)
Net changes in fair value of AFS financial instruments - - - - - - 3,457,636 - 3,457,636
Total other comprehensive gain/(loss) - - - - - - 3,457,636 (1,061,292) 2,396,344
Total comprehensive (loss)/income - - - - - - 3,457,636 57,863,453 61,321,089
Transactions with equity holders, recorded directly in equity:
Transfers for the year - - 20,824,401 8,838,715 - - - (29,663,116) -
Dividend paid to equity holders - - - - - - - (15,241,014) (15,241,014)
Proceed from right issue 3,022,526 36,938,605 - - - - - - 39,961,131
Scheme shares - - - - 536,326 - - - 536,326
Vested Shares - - - - (304,414) - - - (304,414)
Total contributions by and distributions to equity holders 3,022,526 36,938,605 20,824,401 8,838,715 231,912 - - (44,904,130) 24,952,029
Balance at 31 December 2015 14,463,986 197,974,816 37,826,382 43,397,152 527,331 3,489,081 13,291,054 49,459,102 360,428,904
54

Access Bank Plc
Consolidated financial statements
For the year ended 31 December 2016
Consolidated statement of cash flows
Group Group Bank Bank
In thousands of Naira December 2016 December 2015 December 2016 December 2015
Cash flows from operating activities
Profit before income tax and discontinued operations 90,339,456 75,038,117 80,579,576 65,177,914
Adjustments for:
Depreciation of property and equipment 9,106,886 8,615,137 7,774,591 7,762,291
Amortization of intangible assets 2,186,905 1,483,193 1,854,437 1,324,075
Gain on disposal of property and equipment (167,340) (151,937) (143,985) (138,975)
Loss/(Gain) on disposal of investment securities (17,894,577) 2,014,413 (17,894,577) 2,014,249
Fair value loss on assets held for sale - 741,360 - 741,357
Impairment on financial assets 22,545,465 14,224,715 17,711,068 13,287,613
Additional gratuity provision (2,492,347) 784,305 (2,503,203) 784,305
Equity share-based payment expense 684,647 536,326 480,787 536,327
Property and equipment written off 807,748 571,196 155,143 58,394
Net interest income (139,269,885) (94,381,272) (114,689,035) (90,045,956)
Unrealised foreign exchange loss on revaluation 5,246,704 4,679,257 5,326,545 16,040,232
Dividend income (860,339) (3,734,392) (860,339) (4,190,824)
(29,766,677) 10,420,418 (22,208,991) 13,351,002
Changes in operating assets
Non-pledged trading assets 7,668,843 (23,886,778) 7,668,843 (23,886,778)
Derivative financial instruments (53,944,907) (51,949,881) (50,061,509) (53,486,956)
Pledged assets (111,232,105) (116,643,250) (114,482,878) (115,281,271)
Restricted deposits (130,490,427) 7,427,992 (129,978,902) 7,211,760
Loans and advances to banks and customers (357,203,559) (279,812,242) (324,042,139) (224,681,237)
Other assets 17,329,372 (14,804,294) 26,706,965 (15,255,636)
Changes in operating liabilities
Deposits from banks 92,591,390 (41,152,364) 32,098,779 (71,650,088)
Deposits from customers 400,384,383 297,556,876 279,424,380 201,866,013
Other liabilities 44,215,294 55,607,305 43,444,582 47,224,229
Interest paid on deposits to banks and customers (77,202,482) (162,225,080) (62,659,950) (76,485,997)
Interest received on loans and advances 176,661,099 148,061,291 161,920,542 133,954,047
(20,989,776) (171,400,007) (152,170,280) (177,120,912)
Income tax paid (8,007,140) (6,259,617) (5,222,302) (4,125,701)
Net cash generated from operating activities (28,996,915) (177,659,624) (157,392,582) (181,246,613)
Cash flows from investing activities
Acquisition of investment securities (514,748,949) (587,338,468) (441,729,917) (572,059,332)
Interest received on investment securities 38,148,395 76,711,827 23,716,900 35,576,603
Investment under management (1,606,644) - (1,606,644) -
Dividend received 860,339 3,734,392 860,339 4,190,824
Acquisition of property and equipment (18,042,759) (13,895,033) (14,703,152) (10,592,121)
Proceeds from the sale of property and equipment 10,905,226 1,194,234 436,417 1,170,354
Acquisition of intangible assets (2,537,024) (2,146,643) (2,050,313) (1,865,169)
Proceeds from matured investment securities 138,685,918 194,615,198 110,725,856 177,242,121
Proceeds from disposal of asset held for sale 39,116 - 39,116 -
Additional investment in subsidiary of subsidiaries - - (13,800,006) (4,572,450)
Proceeds from sale of investment securities 384,844,391 435,616,351 384,844,391 459,439,815
Proceeds from sale of equity investments 16,347,587 - 16,347,587 -
Net cash generated from investing activities 52,895,595 108,491,858 63,080,575 88,530,645
Cash flows from financing activities
Interest paid on borrowings and debt securities issued (25,791,092) (20,522,742) (24,892,489) (14,930,520)
Proceeds from interest bearing borrowings 70,221,956 163,229,774 62,966,264 162,647,155
Repayment of interest bearing borrowings (28,680,497) (15,331,150) (28,680,497) (15,331,150)
Proceeds from right issues - 39,961,131 - 39,961,131
Purchase of own shares (1,581,171) (1,033,492) - (1,033,490)
Dividends paid to owners (15,910,384) (15,280,704) (15,910,384) (15,241,014)
Debt securities issued 86,899,697 - 86,899,697 -
Net cash provided by financing activities 85,158,509 151,022,818 80,382,590 156,072,112
Net increase/(decrease) in cash and cash equivalents 109,057,189 81,855,052 (13,929,416) 63,356,144
Cash and cash equivalents at end of year 343,075,964 234,044,111 149,467,972 163,405,749
Cash and cash equivalents at beginning of year 234,044,111 152,748,398 163,405,749 100,897,058
Effect of exchange rate fluctuations on cash held (25,336) (559,339) (8,360) (847,452)
Net increase/ (decrease) in cash and cash equivalents 109,057,189 81,855,052 (13,929,417) 63,356,144
55

Access Bank Plc
Notes to consolidated financial statements
For the year ended 31 December 2016
1.0 General information
2.0 Statement of compliance with International Financial Reporting Standards
3.0 Basis of preparation
3.1 Summary of significant accounting policies
(a) Functional and presentation currency
(b) Basis of measurement
•
•
•
•
•
• share based payment at fair value or an approximation of fair value allowed by the relevant standard.
(c) Use of estimates and judgments
the liability for defined benefit obligations is recognised as the present value of the defined benefit obligation and
related current service cost
non-current assets held for sale measured at fair value less costs to sell. Investment property classified as non-
current asset held for sale are measured at fair value, gain or loss arising from a change in the fair value of
investment property is recognised in income statement for the period in which it arise.
The preparation of the consolidated financial statements in conformity with IFRSs requires management to make
judgments, estimates and assumptions that affect the application of policies and reported amounts of assets and
liabilities, income and expenses. Actual results may differ from these estimates.
The estimates and underlying assumptions are reviewed on an ongoing basis. Revisions to accounting estimates are
recognised in the period in which the estimate is revised, if the revision affects only that period, or in the period of the
revision and future periods, if the revision affects both current and future periods.
Information about significant areas of estimation uncertainties and critical judgments in applying accounting policies
that have the most significant effect on the amounts recognised in the consolidated and separate financial statements are
described in note 4.
Access Bank Plc (“the Bank”) is a company domiciled in Nigeria. The address of the Bank’s registered office is Plot 999c,
Danmole Street, off Adeola Odeku/Idejo Street, Victoria Island, Lagos (formerly Plot 1665, Oyin Jolayemi, Victoria
Island, Lagos). The consolidated financial statements of the Bank for the period ended 31 December 2016 comprise the
Bank and its subsidiaries (together referred to as “the Group” and separately referred to as “Group entities”). The Group
is primarily involved in investment, corporate, commercial and retail banking and is listed on the Nigerian Stock
Exchange.
The consolidated and separate financial statements of the Group and Bank respectively, have been prepared in
accordance with International Financial Reporting Standards (IFRSs) issued by the International Accounting Standards
Board (IASB). Additional information required by national regulations is included where appropriate.
The principal accounting policies applied in the preparation of these consolidated financial statements are set out below.
These policies have been consistently applied to all the years presented, unless otherwise stated.
This financial statements has been prepared in accordance with International Financial Reporting Standards (IFRSs)
and interpretations issued by the IFRS Interpretations Committee (IFRS IC) applicable to companies reporting under
IFRS. This consolidated financial statement comprise the consolidated statement of comprehensive income, the
consolidated statement of financial position, the consolidated statements of changes in equity, the consolidated cash
flow statement and the notes.
These consolidated financial statements are presented in Naira, which is the Group's presentation currency; except
where indicated, financial information presented in Naira has been rounded to the nearest thousand.
These consolidated and separate financial statements have been prepared on the historical cost basis except for the
following:
derivative financial instruments are measured at fair value.
non-derivative financial instruments at fair value through profit or loss are measured at fair value.
available-for-sale financial assets are measured at fair value.
These financial statements were authorised for issue by the Board of Directors on 26 January 2017. The directors have
the power to amend and reissue the financial statements.
56

Access Bank Plc
Notes to consolidated financial statements
For the year ended 31 December 2016
3.2 Changes in accounting policy and disclosures
(a) New and amended standards adopted by the group
There is no material impact on the accounting policies, financial position or performance of the Group.
(b) New and amended standards and interpretations not yet adopted by the Group
IFRS 9 Financial Instruments: Classification and Measurement (effective 1 January 2018)
As at year end, a number of standards and interpretations, and amendments thereto, had been issued by the IASB which
are not yet effective for these consolidated financial statements. Details are set out below.
IFRS 9 is part of the IASB’s project to replace IAS 39. It addresses classification, measurement and impairment of
financial assets as well as hedge accounting.
IFRS 9 replaces the multiple classification and measurement models in IAS 39 with a single model that has only three
classification categories: amortized cost, fair value through OCI and fair value through profit or loss. It includes the
guidance on accounting for and presentation of financial liabilities and derecognition of financial instruments which was
previously in IAS 39. Furthermore for non-derivative financial liabilities designated at fair value through profit or loss, it
requires that the credit risk component of fair value gains and losses be separated and included in OCI rather than in the
income statement.
IFRS 9 also requires that credit losses expected at the balance sheet date (rather than only losses incurred in the year) on
loans, debt securities and loan commitments not held at fair value through profit or loss be reflected in impairment
allowances. The bank is yet to quantify the impact of this change although it is expected to lead to an increased
impairment charge than recognized under IAS 39.
Furthermore, the IASB has amended IFRS 9 to align hedge accounting more closely with an entity’s risk management.
The revised standard establishes a more principles-based approach to hedge accounting and addresses inconsistencies
and weaknesses in the current model in IAS 39. The bank is yet to quantify the impact of these changes on its financial
statements.
The Bank is currently at the impact assessment phase of the IFRS 9 journey. The focus is on understanding the IFRS 9
financial and operational implications, with outcomes being key inputs to the design and implementation phases. Also,
the phase will help the bank identify any gaps with the implementation of IFRS 9, especially in terms of the people,
processes, technology and controls that will be necessary to drive an effective implementation.
The Bank expects to enter the Design phase by Q1, 2017. This phase will involve obtaining information from current
systems, adjusting the IT systems to capture the additional data requirements and determination of what constitutes a
default and significant credit loss. By Q2 2017, will be ready for a parallel run of the IFRS 9 and IAS 39 standards.
Information about significant areas of estimation uncertainties and critical judgments in applying accounting policies
that have the most significant effect on the amounts recognised in the consolidated and separate financial statements are
described in note 4.
Below are the IFRSs and International Financial Reporting Interpretations Committee (IFRIC) interpretations that are
effective for the first time for the financial year beginning on or after 1 January 2016 that are relevant to the group.
None of these standards were early adopted in the prior period by the Group as early adoption is not permitted by the
Financial Reporting Council of Nigeria (FRC).
(i) Amendments to IFRS 7 - Financial Instruments: Disclosures
Amends IFRS 7 to remove the phrase ‘and interim periods within the annual periods’ from paragraph 44R, clarifying
that offsetting disclosures is not required in the condensed interim financial report. However, if the IFRS 7 disclosures
provide a significant update to the information reported in the most recent annual report, an entity is required to include
the disclosures in the condensed interim financial report.
On servicing contract, it clarifies that a servicing contract that includes a fee can constitute continuing involvement in a
financial asset. An entity must assess the nature of the fee and arrangement against the guidance for continuing
involvement in paragraphs IFRS 7.B30 and IFRS 7.42C in order to assess whether the disclosures are required. This
standard does not have any impact on this financial statement.
(ii) Amendments to IAS 19 - Defined Benefit Plans: Employee Contributions
Amends IAS 19 to clarify that high quality corporate bonds used in estimating the discount rate for post-employment
benefits should be denominated in the same currency as the benefits to be paid (thus, the depth of the market for high
quality corporate bonds should be assessed at currency level).
57

Access Bank Plc
Notes to consolidated financial statements
For the year ended 31 December 2016
IFRS 16 Leases (effective 1 January 2019)
IFRS 15 – Revenue from contracts with customers. (with effective date of 1 January 2018)
IAS 12 – Income Taxes. (with effective date of 1 January 2017)
IAS 7 – Statement of Cash Flows. (with effective date of 1 January 2017)
Other IFRS that are relevant to the group include:
IFRS Effective Date Subject of amendment
The FASB and IASB issued their long awaited converged standard on revenue recognition on 29 May 2014. The Standard
outlines a single comprehensive model for entities to use in accounting for revenue arising from contracts with
customers to improve comparability within industries, across industries, and across capital markets. The revenue
standard contains principles that an entity will apply to determine the measurement of revenue and timing of when it is
recognized. The underlying principle is that an entity will recognize revenue to depict the transfer of goods or services to
customers at an amount that the entity expects to be entitled to in exchange for those goods or services. The group is in
the process of assessing the impact.
Amendments to IFRS 10,
and IAS 28, 'Sale or
contribution of assets
between an investor and its
associate or joint venture'
Annual periods
beginning
on or after 1 January
2016
These amendments address an inconsistency between the
requirements in IFRS 10 and those in IAS 28 in dealing with the
sale or contribution of assets between an investor and its
associate or joint venture. The main consequence of the
amendments is that a full gain or loss is recognized when a
transaction involves a business (whether it is housed in a
subsidiary or not). A partial gain or loss is recognized when a
transaction involves assets that do not constitute a business, even
if these assets are housed in a subsidiary.
IFRS 16 Leases (“IFRS 16”) eliminates the classification of leases as either operating leases or finance leases for a lessee,
and instead introduces a single lessee accounting model. Applying that model, a lessee is required to recognise: (a) assets
and liabilities for all leases with a term of more than 12 months, unless the underlying asset is of low value; and (b)
depreciation of lease assets separately from interest on lease liabilities in the statement of comprehensive income. The
requirements relating to the definition of a lease have been changed from those included in IAS 17. Guidance is provided
on how to determine short term leases as well as leases of low-value assets. The accounting requirements for lessors have
largely remained unchanged. New disclosures regarding leases are also introduced. The effective date of IFRS 16 is 1
January 2019, with an allowance for early adoption, provided the entity applies IFRS 15 Revenue from Contracts with
Customers at the same time. The group is in the process of assessing the impact.
Amends IFRS 12 to clarify accounting treatment for deferred tax assets for unrealized losses on debt instruments
measured at fair value. The amendments clarify that an entity needs to consider whether tax law restricts the sources of
taxable profits against which it may make deductions on the reversal of that deductible temporary difference.
Furthermore, the amendments provide guidance on how an entity should determine future taxable profits and explains
in which circumstances taxable profit may include the recovery of some assets for more than their carrying amount.
Amends IAS 7 to include disclosures that enable users of financial statements to evaluate changes in liabilities arising
from financing activities. The amendment specifies that the following changes arising from financing activities are
disclosed (to the extent necessary): (i) changes from financing cash flows; (ii) changes arising from obtaining or losing
control of subsidiaries or other businesses; (iii) the effect of changes in foreign exchange rates; (iv) changes in fair
values; and (v) other changes.
Annual periods
beginning
on or after 1 January
2016
Allow entities to use the equity method to account for
investments in subsidiaries, joint ventures and associates in their
separate financial statements.
Amendments to IAS 27,
'Equity method in separate
financial statements'
58

Access Bank Plc
Notes to consolidated financial statements
For the year ended 31 December 2016
Amendments
IFRS 5, ‘Non Current Asset
Held for Sale and
Discontinued Operations
Other standards not listed are not considered relevant or would have no impact to the group.
Amendments
IAS 16,'Property, plant and
equipment'
Annual periods
beginning
on or after 1 January
2016
Amends IFRS 5 with specific guidance on changes in disposal
methods, for cases in which an entity reclassifies an asset from
held for sale to held for distribution or vice versa and cases for
which held for distribution accounting is discontinued. The
amendment clarifies that changing from one of these disposal
methods to the other should not be considered to be a new
disposal plan, rather it is a continuation of the original plan. This
standard does not have any impact on this financial statement.
Amendments
IFRS 10, ‘Consolidated
financial statements
Annual periods
beginning
on or after 1 January
2016
These amendments address an inconsistency between the
requirements in IFRS 10 and those in IAS 28 in dealing with the
sale or contribution of assets between an investor and its
associate or joint venture. The main consequence of the
amendments is that a full gain or loss is recognized when a
transaction involves a business (whether it is housed in a
subsidiary or not) A partial gain or loss is recognized when a
transaction involves assets that do not constitute a business, even
if these assets are housed in a subsidiary. This standard does not
have any impact on this financial statement.
Amendments
IAS 38, ‘Intangible assets
Annual periods
beginning
on or after 1 January
2016
Amends IAS 38 to introduce a rebuttable presumption that a
revenue-based amortization method for intangible assets is
inappropriate for the same reasons as stated in amendment to
IAS 16 above. The amendment stated that there are limited
circumstances where the rebuttable presumption can be
overcome. This is when the intangible asset is expressed as a
measure of income and when it can be demonstrated that revenue
and consumption of economic benefits of the intangible asset are
highly correlated although there are no clear details as to the
admissible evidence that is required to overcome the
presumption. Amortization is recognized in profit or loss on a
straight-line basis over the estimated useful life of the Group’s
intangible asset (software), hence the amendment does not
impact the Group.
Amendments
IAS 34, ‘Employee Benefits
Annual periods
beginning
on or after 1 January
2016
The amendment clarifies that the high quality corporate bonds
used in estimating the discount rate for post-employment
benefits should be denominated in the same currency as the
benefits to be paid. The Bank uses interest rate on the Federal
government bond to estimate the post-employment benefits.
Amendments
IAS 34, ‘Interim Financial
Reporting
Annual periods
beginning
on or after 1 January
2016
Amends IAS 34 to clarify that the required interim disclosures
must either be in the interim financial statements or incorporated
by cross reference between the financial statements and wherever
they are included within the greater interim financial report (e.g.
management commentary or risk report). This standard does not
have any impact on this financial statement.
Annual periods
beginning
on or after 1 January
2016
This amendment has clarified that the use of revenue based
methods to calculate the depreciation of an asset is not
appropriate because revenue generated by an activity that
includes the use of an asset generally reflects factors other than
the consumption of the economic benefits embodied in the asset.
The IASB has also clarified that revenue is generally presumed to
be an inappropriate basis for measuring the consumption of the
economic benefits embodied in an intangible asset. This standard
does not have any impact on this financial statement.
Ammendments to IAS 1
'Presentation of Financial
Statements'
Annual periods
beginning
on or after 1 January
2016
IASB issued ammendmentsbto clarify guidance in IAS 1 on
materiality and aggregation, the presentation of subtotals, the
structutre of financial statements and the disclosure of
accounting policies. The ammendments form part of the IASB's
Disclosure Initiative, which explores how financial statements
disclosures can be improved. The impact of the ammendment has
been assessed amd effected.
59

Access Bank Plc
Notes to consolidated financial statements
For the year ended 31 December 2016
3.3 Basis of consolidation
(a) Subsidiaries
[i] power over the investee;
[ii] exposure, or rights, to variable returns from its involvement with the investee; and
[iii] the ability to use its power over the investee to affect the amount of the investor’s returns
[i]
[ii]
[iii]
[iv] potential voting rights
(b) Business combinations
•
•
•
Subsidiaries are all entities (including structured entities) over which the group exercise control.
Control is achieved when the Group can demonstrate it has:
the group’s voting rights (including voting patterns at previous shareholders' meetings)
The Group reassess periodically whether it controls an investee if facts and circumstances indicate that there are changes
to one or more of the three elements of control listed. The existence and effect of potential voting rights are considered
when assessing whether the group controls another entity.
Subsidiaries are measured at cost less impairment in the separate financial statement.
The Group applies IFRS 3 Business Combinations (revised) in accounting for business combinations.
Other standards not listed are not considered relevant or would have no impact to the group.
The Group assesses existence of control where it does not have more than 50% of the voting power i.e when it holds less
than a majority of the voting rights of an investee. A group considers all relevant facts and circumstances in assessing
whether or not it's voting rights are sufficient to give it power, including:
the net recognised amount (generally fair value) of the identifiable assets acquired and liabilities assumed.
When this total is negative, a gain from a bargain purchase is recognised immediately in statement of comprehensive
income.
The consideration transferred does not include amounts related to the settlement of pre-existing relationships. Such
amounts are generally recognised in in the income statement.
Transactions costs related to the acquisition, other than those associated with the issue of debt or equity securities, that
the Group incurs in connection with a business combination are expensed as incurred.
Any contingent consideration payable is measured at fair value at the acquisition date. If the contingent consideration is
classified as equity, then it is not re-measured and settlement is accounted for within equity. Otherwise, subsequent
changes in the fair value of the contingent consideration are recognised in the income statement.
a contractual arrangement between the group and other vote holders
The subsidiaries are fully consolidated from the date on which control is transferred to the Group. They are de-
consolidated from the date that control ceases.
the recognized amount of any non-controlling interests in the acquiree; plus if the business combination is
achieved in stages, the fair value of the pre-existing equity interest in the acquiree; less
When share-based payment awards (replacement awards) are required to be exchanged for awards held by the
acquiree’s employees (acquiree’s awards) and relate to past services, then all or a portion of the amount of the acquirer’s
replacement awards is included in measuring the consideration transferred in the business combination. This
determination is based on the market-based value of the replacement awards compared with the market-based value of
the acquiree’s awards and the extent to which the replacement awards relate to past and/or future service.
Business combinations are accounted for using the acquisition method as at the acquisition date, which is the date on
which control is transferred to the Group. Control is the power to govern the financial and operating policies of an entity
so as to obtain benefits from its activities. In assessing control, the Group takes into consideration potential voting
rights.
The Group measures goodwill at the acquisition date as the total of:
rights arising from other contractual arrangements
the fair value of the consideration transferred; plus
The Group elects on a transaction-by-transaction basis whether to measure non-controlling interest at its fair value, or at
its proportionate share of the recognised amount of the identifiable net assets, at the acquisition date.
60

Access Bank Plc
Notes to consolidated financial statements
For the year ended 31 December 2016
(c) Loss of control
(d) Disposal of subsidiaries
(e) Changes in ownership interests in subsidiaries without change of control
(f) Transactions eliminated on consolidation
3.4 Segment reporting
3.5 Foreign currency translation
(a) Functional and presentation currency
(b) Transactions and balances
When the Group ceases to have control, any retained interest in the entity is remeasured to its fair value at the date when
control is lost, with the change in carrying amount recognised in income statement. The fair value is the initial carrying
amount for the purposes of subsequently accounting for the retained interest as an associate, joint venture or financial
asset. In addition, any amounts previously recognised in other comprehensive income in respect of that entity are
accounted for as if the group had directly disposed of the related assets or liabilities. This may mean that amounts
previously recognised in other comprehensive income are reclassified to the income statement.
The gain/loss arising from disposal of subsidiaries is included in the profit/loss of discontinued operations in the
statement of comprehensive income.
Foreign currency translation differences become realised when the related subsidiary is disposed.
Transactions with non-controlling interests that do not result in loss of control are accounted for as equity transactions –
that is, as transactions with the owners in their capacity as owners. The difference between fair value of any
consideration paid and the relevant share acquired of the carrying value of net assets of the subsidiary is recorded in
equity. Gains or losses on disposals to non-controlling interests are also recorded in equity.
Items included in the financial statements of each of the group’s entities are measured using the currency of the primary
economic environment in which the entity operates (‘the functional currency’). The consolidated financial statements are
presented in Naira’, which is the group’s presentation currency.
The Group in the normal course of business sets up Structured Entries (SEs) for the sole purpose of raising finance in
foreign jurisdictions. The SEs raises finance in the currency of their jurisdictions and passes the proceeds to the group
entity that set them up. All costs and interest on the borrowing are borne by the sponsoring group entity. These SEs are
deemed to be extensions of the sponsoring entity, and hence, their functional currency is the same as that of the
sponsoring entity.
Inter-company transactions, balances, income and expenses on transactions between group companies are eliminated.
Profits and losses resulting from intercompany transactions that are recognised in assets are also eliminated. Accounting
policies of subsidiaries have been changed where necessary to ensure consistency with the policies adopted by the group.
An operating segment is a component of the Group that engages in business activities from which it can earn revenues
and incur expenses, including revenues and expenses that relate to transactions with any of the Group’s other
components, whose operating results are reviewed regularly by the Executive Committee (being the chief operating
decision maker) to make decisions about resources allocated to each segment and assess its performance, and for which
discrete financial information is available.
Foreign currency transactions are translated into the functional currency using the exchange rates prevailing at the dates
of the transactions or valuation where items are re-measured. Foreign exchange gains and losses resulting from the
settlement of such transactions and from the translation at year-end exchange rates of monetary assets and liabilities
denominated in foreign currencies are recognised in the income statement. Changes in the fair value of monetary
securities denominated in foreign currency classified as available for sale are analysed between translation differences
resulting from changes in the amortised cost of the security and other changes in the carrying amount of the security.
Translation differences related to changes in amortised cost are recognised in the income statement, and other changes
in carrying amount are recognised in other comprehensive income.
Upon the loss of control, the Group derecognises the assets and liabilities of the subsidiary, any non-controlling interests
and the other components of equity related to the subsidiary. Any surplus or deficit arising on the loss of control is
recognised in the income statement. If the Group retains any interest in the previous subsidiary, then such interest is
measured at fair value at the date that control is lost. Subsequently it is accounted for as an equity-accounted investee or
in accordance with the Group's accounting policy for financial instruments.
61

Access Bank Plc
Notes to consolidated financial statements
For the year ended 31 December 2016
(c) Group companies
[i]
[ii]
[iii]
3.6 Operating income
(a) Interest income and expense
•
•
(b) Fees and commission
Fee and commission presented in the income statement includes:
•
income and expenses for each income statement are translated at average exchange rates (unless this average is
not a reasonable approximation of the cumulative effect of the rates prevailing on the transaction dates, in which
case income and expenses are translated at the rate on the dates of the transactions); and
Goodwill and fair value adjustments arising on the acquisition of a foreign entity are treated as assets and liabilities of
the foreign entity and translated at the closing rate. Exchange differences arising are recognised in other comprehensive
income.
Interest income and expense for all interest-bearing financial instruments are recognised within "interest income" and
"interest expense" in the consolidated income statement using the effective interest method.
Other fees and commission income, including account servicing fees, investment management and other fiduciary
activity fees, sales commission, placement fees and syndication fees, are recognised as the related services are
performed. When a loan commitment is not expected to result in the draw-down of a loan, loan commitment fees are
recognised on a straight-line basis over the commitment period.
Translation differences on non-monetary financial assets and liabilities such as equities held at fair value through profit
or loss are recognised in the income statement as part of the fair value gain or loss. Translation differences on non-
monetary financial assets, such as equities classified as available for sale, are included in other comprehensive income.
The results and financial position of all the group entities (none of which has the currency of a hyper-inflationary
economy) that have a functional currency different from the presentation currency are translated into the presentation
currency as follows:
interest on financial assets and financial liabilities measured at amortised cost calculated on an effective interest
The effective interest method is a method of calculating the amortised cost of a financial asset or a financial liability and
of allocating the interest income or interest expense over the relevant period. The effective interest rate is the rate that
exactly discounts the estimated future cash payments and receipts through the expected life of the financial asset or
liability (or, where appropriate, a shorter period) to the net carrying amount of the financial asset or liability. When
calculating the effective interest rate, the Group estimates future cash flows considering all contractual terms of the
financial instruments but not future credit losses.
assets and liabilities for each balance sheet presented are translated at the closing rate at the date of that balance
sheet;
all resulting exchange differences are recognised in other comprehensive income.
Credit related fees and commission: These fees are not integral to the loans and are therefore not included in the
EIR calculation. These are recognised as the related services are performed. When a loan commitment is not
expected to result in the draw-down of a loan, loan commitment fees are recognised on a straight-line basis over
the commitment period.
interest on available-for-sale investment securities calculated on an effective interest basis
Interest income and expense presented in the statement of comprehensive income include:
Fees and commission income and expenses that are integral to the effective interest rate on a financial asset or liability
are included in the measurement of the effective interest rate.
The calculation of the effective interest rate includes contractual fees paid or received, transaction costs, and discounts
or premiums that are an integral part of the effective interest rate. Transaction costs are incremental costs that are
directly attributable to the acquisition, issue or disposal of a financial asset or liability.
Foreign currency transactions are translated into the functional currency using the exchange rates prevailing at the dates
of the transactions or valuation where items are re-measured. Foreign exchange gains and losses resulting from the
settlement of such transactions and from the translation at year-end exchange rates of monetary assets and liabilities
denominated in foreign currencies are recognised in the income statement. Changes in the fair value of monetary
securities denominated in foreign currency classified as available for sale are analysed between translation differences
resulting from changes in the amortised cost of the security and other changes in the carrying amount of the security.
Translation differences related to changes in amortised cost are recognised in the income statement, and other changes
in carrying amount are recognised in other comprehensive income.
62

Access Bank Plc
Notes to consolidated financial statements
For the year ended 31 December 2016
•
•
(c) Net gains on investment securities
•
•
(d) Foreign exchange income
(e) Other operating income
•
3.7 Lease payments
3.8 Income tax
(a) Current tax
(b) Deferred tax
Net gains on investment securities comprise of the following:
Foreign exchange income includes foreign exchange gains on revaluation and unrealised foreign exchange gains on
Payments made under operating leases are recognised in the income statement on a straight-line basis over the term of
the lease. Lease incentives received are recognised as an integral part of the total lease expense, over the term of the
lease.
Minimum lease payments made under finance leases are apportioned between the finance expense and the reduction of
the outstanding liability. The finance expense is allocated to each period during the lease term so as to produce a
constant periodic rate of interest on the remaining balance of the liability. Contingent lease payments are accounted for
by revising the minimum lease payments over the remaining term of the lease when the lease adjustment is confirmed.
The tax expense for the year comprises current and deferred tax. Tax is recognised in the income statement, except to
the extent that it relates to items recognised in other comprehensive income or directly in equity. In this case, the tax is
also recognised in other comprehensive income or directly in equity, respectively.
The current income tax charge is calculated on the basis of the tax laws enacted or substantively enacted at the balance
sheet date in the countries where the bank and its subsidiaries operate and generate taxable income. Management
periodically evaluates positions taken in tax returns with respect to situations in which applicable tax regulation is
subject to interpretation. It establishes provisions where appropriate on the basis of amounts expected to be paid to the
tax authorities.
Deferred income tax is recognised, using the liability method, on temporary differences arising between the tax bases of
assets and liabilities and their carrying amounts in the consolidated financial statements. However, deferred tax
liabilities are not recognised if they arise from the initial recognition of goodwill; deferred income tax is not accounted
for if it arises from initial recognition of an asset or liability in a transaction other than a business combination that at
the time of the transaction affects neither accounting nor taxable profit or loss. Deferred income tax is determined using
tax rates (and laws) that have been enacted or substantively enacted by the balance sheet date and are expected to apply
when the related deferred income tax asset is realised or the deferred income tax liability is settled.
Dividend on available for sale equity securities: This is recognised when the right to receive payment is
established. Dividends are reflected as a component of other operating income.
Other operating income includes items such as dividends, gains on disposal of properties, rental income, income
from asset management, brokerage and agency as well as income from other investments.
Other fees and commission income, includes card related commissions, commission on letters of credit, account
servicing fees, investment management and other fiduciary activity fees, sales commission, placement fees and
syndication fees. These fees and commissions are recognised as the related services are performed
Net gains on financial instruments held as available for sale: This relates to gains arising from the disposal of
financial instruments held as available for sale as well as fair value changes reclassified from other comprehensive
income upon disposal.
Net gains/losses on financial instruments classified as held for trading: This includes the gains and losses arising
both on the purchase and sale of trading instruments and from changes in fair value of derivatives instruments.
Credit related fees and commission: These fees are not integral to the loans and are therefore not included in the
EIR calculation. These are recognised as the related services are performed. When a loan commitment is not
expected to result in the draw-down of a loan, loan commitment fees are recognised on a straight-line basis over
the commitment period.
Current account maintenance fees (formerly Commission on Turnover): This fee is charged as N1 on every N1,000
in respect of all customer induced debit transactions. This fee is recognised one-off by the bank.
63

Access Bank Plc
Notes to consolidated financial statements
For the year ended 31 December 2016
3.9 Financial assets and liabilities
The table below reconciles classification of financial instruments to the respective IAS 34/39 category.
Non pledged trading assets
Derivative financial assets
Financial assets
Class (as determined by
the Group)
Cash and balances with banks
Deferred income tax is recognised, using the liability method, on temporary differences arising between the tax bases of
assets and liabilities and their carrying amounts in the consolidated financial statements. However, deferred tax
liabilities are not recognised if they arise from the initial recognition of goodwill; deferred income tax is not accounted
for if it arises from initial recognition of an asset or liability in a transaction other than a business combination that at
the time of the transaction affects neither accounting nor taxable profit or loss. Deferred income tax is determined using
tax rates (and laws) that have been enacted or substantively enacted by the balance sheet date and are expected to apply
when the related deferred income tax asset is realised or the deferred income tax liability is settled.
Loans and receivables
Investment securities - debt
securities (pledged and non
pledged)
Category
(as defined by IAS 39)
Available for sale financial assets
Investment under
management
Deferred income tax assets are recognised only to the extent that it is probable that future taxable profit will be available
against which the temporary differences can be utilised. Deferred income tax is provided on temporary differences
arising on investments in subsidiaries and associates, except for deferred income tax liability where the timing of the
reversal of the temporary difference is controlled by the group and it is probable that the temporary difference will not
reverse in the foreseeable future.
Deferred income tax assets and liabilities are offset when there is a legally enforceable right to offset current tax assets
against current tax liabilities and when the deferred income taxes assets and liabilities relate to income taxes levied by
the same taxation authority on either the same taxable entity or different taxable entities where there is an intention to
settle the balances on a net basis.
In accordance with IAS 39, all financial assets and liabilities (which include derivative financial instruments) have to be
reocognised in the consolidated statement of financial position and measured in accordance with their assigned
category.
Investment securities - equity
securities
Financial assets at fair value through profit or loss
Other assets
Loans and advances to
customers
Investment securities - debt
securities (pledged and non
pledged)
Held to maturity
Loans and advances to banks
64

Access Bank Plc
Notes to consolidated financial statements
For the year ended 31 December 2016
(a) Financial assets
[i] Financial assets at fair value through profit or loss
•
•
•
[ii] Loans and receivables
Financial liabilities at fair value through profit or
loss
The assets or liabilities are managed, evaluated and reported internally on a fair value basis.
Finance lease receivables are reported within loans and receivables where the Group is the lessor in a lease agreement.
Such lease agreement transfers substantially all of the risks and rewards incidental to ownership of an asset to the lessee.
The loans and receivables equal to the net investment in the lease is recognised and presented within loans and
advances.
Financial liabilities
The asset or liability contains an embedded derivative that significantly modifies the cash flows that would
otherwise be required under the contract.
Loans and receivables are non-derivative financial assets with fixed or determinable payments that are not quoted in an
active market and that the Group does not intend to sell immediately or in the near term.
Class
(as determined by the
Group)
Financial liabilities at amortised cost
The Group allocates financial assets to the following IAS 39 categories: financial assets at fair value through profit or
loss; loans and receivables; held-to-maturity investments; and available-for-sale financial assets. Management
determines the classification of its financial instruments at initial recognition.
Debt securities issued
The Group designates certain financial assets upon initial recognition as at fair value through profit or loss (fair value
option). This designation cannot subsequently be changed. According to IAS 39, the fair value option is only applied
when the following conditions are met:
This category comprises two sub-categories: financial assets classified as held for trading and financial assets designated
by the Group as at fair value through profit or loss upon initial recognition.
A financial asset is classified as held for trading if it is acquired or incurred principally for the purpose of selling or
repurchasing it in the near term or if it is part of a portfolio of identified financial instruments that are managed together
and for which there is evidence of a recent actual pattern of short-term profit-taking. Derivatives are also categorised as
held for trading unless they are designated and effective as hedging instruments. Financial assets held for trading consist
of debt instruments, including money-market paper, as well as financial assets with embedded derivatives. They are
recognised in the consolidated statement of financial position as ‘non-pledged trading assets ’.
Other liabilities
The designation eliminates or significantly reduces an accounting mismatch which would otherwise arise.
Financial instruments included in this category are recognised initially at fair value; transaction costs are taken directly
to the consolidated income statement. Gains and losses arising from changes in fair value are included directly in the
consolidated income statement and are reported as Net gains on financial instruments classified as held for trading.
Interest income and expense and dividend income and expenses on financial assets held for trading are included in ‘Net
interest income’ or ‘Dividend income’, respectively. The instruments are derecognised when the rights to receive cash
flows have expired or the Group has transferred substantially all the risks and rewards of ownership and the transfer
qualifies for derecognising.
Derivatives
Deposits from banks
Deposits from customers
Interest bearing borrowings
Category
(as defined by IAS 39)
The purchases and sales of financial assets are accounted for in the Group's books at settlement date.
65

Access Bank Plc
Notes to consolidated financial statements
For the year ended 31 December 2016
[iii] Held-to-maturity
•
•
•
[iv] Available-for-sale
Availabe for sale instruments include investment securities.
[v] Investments under management
Sales or reclassification that are so close to maturity that changes on the market rate of interest would not have a
significant effect on the financial asset’s fair value.
The investment decision made by the Asset management within an agreed portfolio of high quality Nigerian fixed
income and money market instruments which are usually short tenured.
The investments are carried as available-for-sale and accounting policy (3.9) (a) [iv] applies.
These are initially recognised at fair value including direct and incremental transaction costs and measured subsequently
at amortised cost, using the effective interest method. Any sale or reclassification of a significant amount of held-to-
maturity investments not close to their maturity would result in the reclassification of all held-to-maturity investments
as available-for- sale, and prevent the Group from classifying investment securities as held-to-maturity for the current
and the following two financial years. However, sales and reclassifications in any of the following circumstances would
not trigger a reclassification:
Sales or reclassification after the Group has collected substantially all the asset’s original principal.
Sales or reclassification attributable to non-recurring isolated events beyond the Group’s control that could not
have been reasonably anticipated.
Interest on held-to-maturity investments is included in the consolidated income statement and reported as ‘Interest
income’. In the case of an impairment, the impairment loss is been reported as a deduction from the carrying value of
the investment and recognised in the consolidated income statement as ‘net impairment loss on financial assets’. Held-to-
maturity investments include treasury bills and bonds.
Available-for-sale investments are non-derivative investments that are not designated as another category of financial
assets. Unquoted equity securities whose fair value cannot be reliably measured are carried at cost and subjected to
impairment. All other available-for-sale investments are carried at fair value.
Interest income is recognised in the income statement using the effective interest method. Dividend income is
recognised in the income statement when the Group becomes entitled to the dividend. Foreign exchange gains or losses
on available-for-sale debt security investments are recognised in the income statement
When the Group purchases a financial asset and simultaneously enters into an agreement to resell the asset (or a
substantially similar asset) at a fixed price on a future date (“reverse repo or stock borrowing”), the arrangement is
accounted for as a loan or advance, and the underlying asset is not recognised in the Group’s financial statements.
Investment under management are funds entrusted to Asset management firms who acts as agents to the bank for safe
keeping and management for investment purpose with returns on the underlying investments accruable to the Bank,
who is the principal.
Loans and receivables are initially recognised at fair value – which is the price that would be received to sell an asset or
paid to transfer a liability in an orderly transaction between market participants at the measurement date – and
measured subsequently at amortised cost using the effective interest rate method. Loans and receivables are reported in
the consolidated statement of financial position as loans and advances to banks or customers or as investment securities.
Interest on loans is included in the consolidated income statement and is reported as ‘Interest income’. In the case of an
impairment, the impairment loss is reported as a deduction from the carrying value of the loan and recognised in the
consolidated income statement under "net impairment loss on financial assets"
Held-to-maturity investments are non-derivative assets with fixed or determinable payments and fixed maturity that the
Group has the positive intent and ability to hold to maturity, and which are not designated at fair value through profit or
loss, loans and receivables or available-for-sale.
Other fair value changes are recognised directly in other comprehensive income until the investment is sold or impaired
whereupon the cumulative gains and loses previously recognised in other comprehensive income are recognised to the
income statement as a reclassification adjustment.
A non-derivative financial asset may be reclassified from the available-for-sale category to the loans and receivable
category if it otherwise would have met the definition of loans and receivables and if the Group has the intention and
ability to hold that financial asset for the foreseeable future or until maturity.
66

Access Bank Plc
Notes to consolidated financial statements
For the year ended 31 December 2016
(b) Financial liabilities
[i] Financial liabilities at amortised cost
[ii] Financial liabilities at fair value
(c) De-recognition
[i] Financial assets
The investment decision made by the Asset management within an agreed portfolio of high quality Nigerian fixed
income and money market instruments which are usually short tenured.
The investments are carried as available-for-sale and accounting policy (3.9) (a) [iv] applies.
The Group derecognises a financial asset when the contractual rights to the cash flows from the financial asset expire, or
when it transfers the financial asset in a transaction in which substantially all the risks and rewards of ownership of the
financial asset are transferred or in which the Group neither transfers nor retains substantially all the risks and rewards
of ownership and it does not retain control of the financial asset. Any interest in transferred financial assets that is
created or retained by the Group is recognised as a separate asset or liability in the statement of financial position. On
derecognition of a financial asset, the difference between the carrying amount of the asset (or the carrying amount
allocated to the portion of the asset transferred), and the sum of (i) the consideration received ( including any new asset
obtained less any new liability assumed) and (ii) any cumulative gain or loss that had been recognised in other
comprehensive income is recognised in the income statement.
Deposits and debt securities issued are the Group’s sources of debt funding. When the Group sells a financial asset and
simultaneously enters into a “repo” or “stock lending” agreement to repurchase the asset (or a similar asset) at a fixed
price on a future date, the arrangement is accounted for as a deposit, and the underlying asset continues to be recognised
in the Group’s financial statements as pledged assets.
On this statement of financial position, other financial liabilities carried at amortised cost include deposit from banks,
deposit from customers, interest bearing borrowings, debt securities issued and other liabilities
The Group may enter into a variety of derivative financial instruments to manage its exposure to interest rate and
foreign exchange rate risk, including foreign exchange forward contracts, interest rate swaps and foreign currency
options. Further details of derivative financial instruments are disclosed in Note 21 to the financial statements.
Derivatives are initially recognised at fair value at the date a derivative contract is entered into and are subsequently
remeasured to their fair value at each balance sheet date. A derivative with a positive fair value is recognised as a
financial asset whereas a derivative with a negative fair value is recognised as a financial liability. The resulting gain or
loss is recognised in profit or loss immediately unless the derivative is designated and effective as a hedging instrument,
in which event the timing of the recognition in profit or loss depends on the nature of the hedge relationship. Derivatives
are presented as financial assets or financial liabilities.
Derivative assets and liabilities are only offset if the transactions are with the same counterparty, a legal right of offset
exists and the parties intend to settle on a net basis.
The Group enters into transactions whereby it transfers assets recognised on its financial position, but retains either all
or substantially all of the risks and rewards of the transferred assets or a portion of them. If all or substantially all risks
and rewards are retained, then the transferred assets are not derecognised from the financial position. Transfers of
assets with retention of all or substantially all risks and rewards include, for example, securities lending and repurchase
transactions.
Deposits and debt securities issued are initially measured at fair value minus incremental direct transaction costs, and
subsequently measured at their amortised cost using the effective interest method, except where the Group designates
liabilities at fair value through profit or loss.
The Group classifies debt instruments as financial liabilities or equity in accordance with the contractual terms of the
instrument.
The Group classifies its financial liabilities, other than financial guarantees and loan commitments, as measured at
amortised cost or fair value through profit or loss.
Financial liabilities that are not classified as at fair value through profit or loss are measured at amortised cost using the
effective interest method. Interest expense is included in 'Interest expense' in the Statement of comprehensive income.
67

Access Bank Plc
Notes to consolidated financial statements
For the year ended 31 December 2016
[ii] Financial liabilities
(d) Offsetting
(e ) Sale and repurchase agreements
(f) Measurement
[i] Amortised cost measurement
[ii] Fair value measurement
Income and expenses are presented on a net basis only when permitted under IFRSs, or for gains and losses arising from
a group of similar transactions such as in the Group’s trading activity. See note 5.1.5
Fair value is the price that would be received to sell an asset or paid to transfer a liability in an orderly transaction
between market participants at the measurement date
The amortised cost of a financial asset or liability is the amount at which the financial asset or liability is measured at
initial recognition, minus principal repayments, plus or minus the cumulative amortisation using the effective interest
method of any difference between the initial amount recognised and the maturity amount, minus any reduction for
Loans that are either subject to collective impairment assessment or individually significant and whose terms have been
renegotiated are no longer considered to be past due but are treated as new loans. In subsequent years, the asset is
considered to be past due and disclosed only if renegotiated again.
The Group derecognises a financial liability when its contractual obligations are discharged or cancelled or expire.
Financial assets and liabilities are set off and the net amount presented in the statement of financial position when, and
only when, the Group has a legal enforceable right to set off the amounts and intends either to settle on a net basis or to
realise the asset and settle the liability simultaneously.
In transactions in which the Group neither retains nor transfers substantially all the risks and rewards of ownership of a
financial asset and it retains control over the asset, the group continues to recognise the asset to the extent of its
continuing involvement, determined by the extent to which it is exposed to changes in the value of the transferred asset.
Securities sold subject to repurchase agreements (‘repos’) remain on the statement of financial position; the
counterparty liability is included in amounts due to other banks, deposits from banks, other deposits or deposits due to
customers, as appropriate. Securities purchased under agreements to resell (reverse repos’) are recorded as money
market placement. The difference between sale and repurchase price is treated as interest and accrued over the life of the
agreements using the effective interest method.
When assets are sold to a third party with a concurrent total rate of return swap on the transferred assets, the
transaction is accounted for as a secured financing transaction similar to repurchase transactions as the Group retains all
or substantially all the risks and rewards of ownership of such assets.
In certain transactions the Group retains the obligation to service the transferred financial asset for a fee. The
transferred asset is derecognised if it meets the derecognition criteria. An asset or liability is recognised for the servicing
contract, depending on whether the servicing fee is more than adequate (asset) or is less than adequate (liability) for
performing the servicing.
When available, the Group measures the fair value of an instrument using quoted prices in an active market for that
instrument. A market is regarded as active if quoted prices are readily available and represent actual and regularly
occurring market transactions on an arm’s length basis.
If a market for a financial instrument is not active, the Group establishes fair value using valuation techniques. Valuation
techniques include using recent arm’s length transactions between knowledgeable, willing parties (if available),
reference to the current fair value of other instruments that are substantially the same, and discounted cash flow
analysis. The chosen valuation technique makes maximum use of market inputs, relies as little as possible on estimates
specific to the Group, incorporates all factors that market participants would consider in setting a price, and is consistent
with accepted economic methodologies for pricing financial instruments. Inputs to valuation techniques reasonably
represent market expectations and measures of the risk-return factors inherent in the financial instrument. The Group
calibrates valuation techniques and tests them for validity using prices from observable current market transactions in
the same instrument or based on other available observable market data.
Securities lent to counterparties are also retained in the financial statements. Securities borrowed are not recognised in
the financial statements, unless these are sold to third parties, in which case the purchase and sale are recorded with the
gain or loss included in trading income.
68
Access Bank Plc
Notes to consolidated financial statements
For the year ended 31 December 2016
(g ) Identification and measurement of impairment
[i] Loans and receivables
Assets and long positions are measured at a bid price; liabilities and short positions are measured at an asking price.
Where the Group has positions with offsetting risks, mid-market prices are used to measure the offsetting risk positions
and a bid or asking price adjustment is applied only to the net open position as appropriate. Fair values reflect the credit
risk of the instrument and include adjustments to take account of the credit risk of the Group entity and the counterparty
where appropriate. Fair value estimates obtained from models are adjusted for any other factors, such as liquidity risk or
model uncertainties, to the extent that the Group believes a third-party market participant would take them into account
in pricing a transaction.
The Group considers evidence of impairment for loans and advances and held-to-maturity investments at both a specific
and collective level. All individually significant loans and advances and held-to maturity investment securities are
assessed for specific impairment. All individually significant loans and advances and held-to maturity investments found
not to be specifically impaired are then collectively assessed for any impairment that has been incurred but not yet
identified. Loans and advances and held-to-maturity investment securities that are not individually significant are
collectively assessed for impairment by grouping together loans and advances and held-to-maturity investment
securities (held at amortised cost) with similar characteristics.
At each reporting date the Group assesses whether there is objective evidence that financial assets not carried at fair
value through profit or loss are impaired. Financial assets are impaired when objective evidence demonstrates that a loss
event has occurred after the initial recognition of the asset, and that the loss event has an impact on the future cash flows
on the asset that can be estimated reliably.
Objective evidence that financial assets (including equity securities) are impaired can include significant financial
difficulty of the obligor, default or delinquency by a borrower resulting in a breach of contract, restructuring of a loan or
advance by the Group on terms that the Group would not otherwise consider, indications that a borrower or issuer will
enter bankruptcy, the disappearance of an active market for a security, or other observable data relating to a group of
assets such as adverse changes in the payment status of borrowers or issuers in the group, or economic conditions that
correlate with defaults in the group. In addition, for an investment in an equity security, a significant or prolonged
decline in its fair value below cost is objective evidence of impairment.
The best evidence of the fair value of a financial instrument at initial recognition is the transaction price – i.e. the fair
value of the consideration given or received. However, in some cases, the fair value of a financial instrument on initial
recognition may be different to its transaction price. If such fair value is evidenced by comparison with other observable
current market transactions in the same instrument (without modification or repackaging) or based on a valuation
technique whose variables include only data from observable markets, then the difference is recognised in the income
statement on initial recognition of the instrument. In other cases the difference is not recognised in the income
statement immediately but is recognised over the life of the instrument on an appropriate basis or when the instrument
is redeemed, transferred or sold, or the fair value becomes observable.
If a market for a financial instrument is not active, the Group establishes fair value using valuation techniques. Valuation
techniques include using recent arm’s length transactions between knowledgeable, willing parties (if available),
reference to the current fair value of other instruments that are substantially the same, and discounted cash flow
analysis. The chosen valuation technique makes maximum use of market inputs, relies as little as possible on estimates
specific to the Group, incorporates all factors that market participants would consider in setting a price, and is consistent
with accepted economic methodologies for pricing financial instruments. Inputs to valuation techniques reasonably
represent market expectations and measures of the risk-return factors inherent in the financial instrument. The Group
calibrates valuation techniques and tests them for validity using prices from observable current market transactions in
the same instrument or based on other available observable market data.
In assessing collective impairment the Group uses statistical modeling of historical trends of the probability of default,
timing of recoveries and the amount of loss incurred, adjusted for management’s judgment as to whether current
economic and credit conditions are such that the actual losses are likely to be greater or less than suggested by historical
modeling. Default rates, loss rates and the expected timing of future recoveries are regularly benchmarked against actual
outcomes to ensure that they remain appropriate.
Impairment losses on assets carried at amortised cost are measured as the difference between the carrying amount of
the financial assets and the present value of estimated cash flows discounted at the assets’ original effective interest rate.
Losses are recognised in the income statement and reflected in an allowance account against loans and advances.
Interest on the impaired asset continues to be recognised through the unwinding of the discount. When a subsequent
event causes the amount of impairment loss to decrease, the impairment loss is reversed through profit or loss.
69

Access Bank Plc
Notes to consolidated financial statements
For the year ended 31 December 2016
[ii] Available for sale securities
(h) Cash and balances with banks
(i) Repossessed collateral
(j) Derivative financial instruments
(k) Reclassification of financial assets
Impairment losses on available-for-sale investment securities are recognised by transferring the cumulative loss that has
been recognised in other comprehensive income to the income statement as a reclassification adjustment.
For debt securities, the group uses the criteria referred to in (i) above to assess impairment. If any such evidence exists
for available-for-sale financial assets, the cumulative loss – measured as the difference between the acquisition cost and
the current fair value, less any impairment loss on that financial asset previously recognised in profit or loss – is
removed from equity and recognised in the income statement. For equity, a prolonged decline in the fair value of the
security below its cost is also evidence that the asset is impaired. Impairment losses recognised in the consolidated
income statement on equity instruments are not reversed through the consolidated income statement. If, in a
subsequent period, the fair value of an impaired available-for-sale debt security increases and the increase can be related
objectively to an event occurring after the impairment loss was recognised, then the impairment loss is reversed through
the income statement; otherwise, any increase in fair value is recognised through OCI. Any subsequent recovery in the
fair value of an impaired available-for-sale equity security is always recognised in OCI.
In the consolidated statement of cash flows, cash and cash equivalents includes cash in hand, unrestricted balances with
foreign and central banks, money market placements and other short-term highly liquid investments with original
maturities of three months or less.
Derivatives are initially recognised at fair value on the date on which a derivative contract is entered into and are
subsequently remeasured at their fair value. Fair values are obtained from quoted market prices in active markets (for
example, for exchange-traded options), including recent market transactions, and valuation techniques (for example for
swaps and currency transactions), including discounted cash flow models and options pricing models, as appropriate. All
derivatives are carried as assets when fair value is positive and as liabilities when fair value is negative.
The Group mitigates the credit risk of derivatives by holding collateral in the form of cash.
The Bank may choose to reclassify a non-derivative financial asset held for trading out of the held-for-trading category if
the financial asset is no longer held for the purpose of selling it in the near-term. Financial assets other than loans and
receivables are permitted to be reclassified out of the held for trading category only in rare circumstances arising from a
single event that is unusual and highly unlikely to recur in the near-term. In addition, the Bank may choose to reclassify
financial assets that would meet the definition of loans and receivables out of the held-for-trading or available-for-sale
categories if the Bank has the intention and ability to hold these financial assets for the foreseeable future or until
maturity at the date of reclassification.
The Group writes off previously impaired loans and advances (and investment securities) when they are determined not
to be recoverable. The Group writes off loans or investment debt securities that are impaired (either partially or in full
and any related allowance for impairment losses) when the Group credit team determines that there is no realistic
prospect of recovery.
Repossessed collateral are equities, investment properties or other investments repossessed from a customer and used
to settle his outstanding obligation. Such investments are classified in accordance with the intention of the Group in the
asset class which they belong and are also separately disclosed in the financial statement.
Impairment losses on assets carried at amortised cost are measured as the difference between the carrying amount of
the financial assets and the present value of estimated cash flows discounted at the assets’ original effective interest rate.
Losses are recognised in the income statement and reflected in an allowance account against loans and advances.
Interest on the impaired asset continues to be recognised through the unwinding of the discount. When a subsequent
event causes the amount of impairment loss to decrease, the impairment loss is reversed through profit or loss.
Cash and balances with banks include notes and coins on hand, balances held with central banks and highly liquid
financial assets with original maturities of less than three months, which are subject to insignificant risk of changes in
their fair value, and are used by the Group in the management of its short-term commitments.
70

Access Bank Plc
Notes to consolidated financial statements
For the year ended 31 December 2016
(l) Pledged assets
3.10 Investment properties
3.11 Property and equipment
(a) Recognition and measurement
(b) Subsequent costs
(c) Depreciation
Depreciation is recognised in the income statement on a straight-line basis to write down the cost of items of property
and equipment, to their residual values over the estimated useful lives. Leased assets under finance lease are depreciated
over the shorter of the lease term and their useful lives.
An investment property is an investment in land or buildings held primarily for generating income or capital
appreciation and not occupied substantially for use in the operations of the Group. An occupation of more than 15% of
the property is considered substantial. Investment properties is measured initially at cost including transaction cost and
subsequently carried in the statement of financial position at their market value and revalued yearly on a systematic
basis. Investment properties are not subject to periodic charge for depreciation. Gains or losses arising from changes in
the fair value of investment properties are included in the consolidated income statement in the period which it arises
as: "Fair value gain on investment property"
Any gain or loss on disposal of an investment property (calculated as the difference between the net proceeds from
disposal and the carrying amount of the item) is recognised in income statement inside operating income.
When the use of a property changes such that it is reclassified as property and equipment, its fair value at the date of
reclassification becomes its cost for subsequent accounting.
Items of property and equipment are measured at cost less accumulated depreciation and accumulated impairment
losses. Cost includes expenditures that are directly attributable to the acquisition of the asset.
Financial assets transferred to external parties that do not qualify for de-recognition are reclassified in the statement of
financial position from financial assets held for trading or investment securities to assets pledged as collateral, if the
transferee has received the right to sell or re-pledge them in the event of default from agreed terms.
Initial recognition of assets pledged as collateral is at fair value, whilst subsequent measurement is based on the
classification of the financial asset. Assets pledged as collateral are either designated as held for trading,
available for sale or held to maturity. Where the assets pledged as collateral are designated as held for
trading, subsequent measurement is at fair value through profit and loss, whilst assets pledged as collateral
designated as available for sale are measured at fair-value through equity. Assets pledged as collateral
designated as held to maturity are measured at amortized cost.
Subsequent costs are included in the asset's carrying amount or recognized as a separate asset, as appropriate, only when
it is probable that the future economic benefits associated with the item will flow to the Group and its cost can be
measured reliably. The costs of the day-to-day repairs and maintenance of property and equipment are recognised in
Income statement as incurred.
When significant parts of an item of property or equipment have different useful lives, they are accounted for as separate
items (major components) of property and equipment.
Reclassifications are made at fair value as of the reclassification date. Fair value becomes the new cost or amortised cost
as applicable, and no reversals of fair value gains or losses recorded before reclassification date are subsequently made.
Effective interest rates for financial assets reclassified to loans and receivables and held-to-maturity categories are
determined at the reclassification date. Further increases in estimates of cash flows adjust effective interest rates
prospectively.
The gain or loss on disposal of an item of property and equipment is determined by comparing the proceeds from
disposal with the carrying amount of property and equipment, and are recognised net within other income in the Income
statement
71

Access Bank Plc
Notes to consolidated financial statements
For the year ended 31 December 2016
Over the shorter of the useful life of the item or lease term
Over the shorter of the useful life of the item or lease term
50 - 60 years
3 - 4.5 years
3 - 6 years
4-5 years
(d) De-recognition
3.12 Intangible assets
(a) Goodwill
(b) Software
Goodwill that arises upon the acquisition of subsidiaries is included in intangible assets. Subsequent to initial
recognition, goodwill is measured at cost less accumulated impairment losses. Goodwill has an indefinite useful life and
it is tested annually for impairment.
The asset's residual values and useful lives are reviewed, and adjusted if appropriate, at each date of the statement of
financial position. Assets are reviewed for impairment whenever events or changes in circumstances indicate that the
carrying amount may not be recoverable. An asset’s carrying amount is written down immediately to its recoverable
amount if the asset’s carrying amount is greater than its estimated recoverable amount. The recoverable amount is the
higher of the asset’s fair value less costs to sell and value in use.
The estimated useful lives for the current and comparative periods of significant items of property and equipment are as
follows:
Leasehold improvements
Buildings
Computer hardware
Furniture and fittings
Subsequent expenditure on software assets is capitalised only when it increases the future economic benefits embodied
in the specific asset to which it relates. All other expenditure is expensed as incurred.
Amortisation is recognised in the income statement on a straight-line basis over the estimated useful life of the software,
from the date that it is available for use since this most closely reflects the expected pattern of consumption of future
economic benefits embodied in the asset. Software has a finite useful life, the estimated useful life of software is between
three and five years. Amortisation methods, useful lives and residual values are reviewed at each financial year-end and
adjusted if appropriate.
Depreciation begins when an asset is available for use and ceases at the earlier of the date that the asset is derecognised
or classified as held for sale in accordance with IFRS 5. A non-current asset or disposal group is not depreciated while it
is classified as held for sale.
Leasehold Land and Building
Motor vehicles
Capital work in progress is not depreciated. Upon completion it is transferred to the relevant asset category.
Depreciation methods, useful lives and residual values are reassessed at each reporting date and adjusted if appropriate.
An item of property and equipment is derecognised on disposal or when no future economic benefits are expected from
its use or disposal. Any gain or loss arising on de-recognition of the asset (calculated as the difference between the net
disposal proceeds and the carrying amount of the asset) is included in income statement in the year the asset is
derecognised.
Goodwill is allocated to cash-generating units or groups of cash-generating units for the purpose of impairment testing.
The allocation is made to those cash-generating units or groups of cash-generating units that are expected to benefit
from the business combination in which the goodwill arose identified in accordance with IFRS 8.
Goodwill has an indefinite useful life and is tested annually as well as whenever a trigger event has been observed for
impairment by comparing the present value of the expected future cash flows from a cash generating unit with the
carrying value of its net assets, including attributable goodwill and carried at cost less accumulated impairment losses.
Impairment losses on goodwill are not reversed. Gains and losses on the disposal of an entity include the carrying
amount of goodwill relating to the entity sold.
Software acquired by the Group is stated at cost less accumulated amortisation and accumulated impairment losses.
Expenditure on internally developed software is recognised as an asset when the Group is able to demonstrate its
intention and ability to complete the development and use the software in a manner that will generate future economic
benefits, and can reliably measure the costs to complete the development. The capitalised costs of internally developed
software include all costs directly attributable to developing the software, and are amortised over its useful life.
Internally developed software is stated at capitalised cost less accumulated amortisation and impairment.
72

Access Bank Plc
Notes to consolidated financial statements
For the year ended 31 December 2016
3.13 Leases
A group company is the lessee
(a) Operating lease
(b) Finance lease
A group company is the lessor
3.14 Impairment of non-financial assets
3.15 Discontinued operations
Leases of assets where the Group has substantially all the risks and rewards of ownership are classified as finance leases.
Finance leases are capitalised at the lease’s commencement at the lower of the fair value of the leased property and the
present value of the minimum lease payments. Each lease payment is allocated between the liability and finance charges
so as to achieve a constant rate on the finance balance outstanding. The corresponding rental obligations, net of finance
charges, are included in deposits from banks or deposits from customers depending on the counter party. The interest
element of the finance cost is charged to the income statement over the lease period so as to produce a constant periodic
rate of interest on the remaining balance of the liability for each period. The investment properties acquired under
finance leases are measured subsequently at their fair value.
The recoverable amount of goodwill is estimated at each reporting date. An impairment loss is recognised if the carrying
amount of an asset or its cash-generating unit exceeds its recoverable amount. In assessing value in use, the estimated
future cash flows are discounted to their present value using a pre-tax discount rate that reflects current market
assessments of the time value of money and the risks specific to the asset.
For the purpose of impairment testing, assets that cannot be tested individually are grouped together into the smallest
group of assets that generates cash inflows from continuing use that are largely independent of cash inflows of other
assets or groups of assets (the "cash-generating unit" or CGU). Subject to an operating segment ceiling test, for the
purposes of goodwill impairment testing, CGUs to which goodwill has been allocated are aggregated so that the level at
which impairment is tested reflects the lowest level at which goodwill is monitored for internal reporting purposes.
Goodwill acquired in a business combination is allocated to the groups of CGUs that are expected to benefit from the
synergies of the combination.
Amortisation is recognised in the income statement on a straight-line basis over the estimated useful life of the software,
from the date that it is available for use since this most closely reflects the expected pattern of consumption of future
economic benefits embodied in the asset. Software has a finite useful life, the estimated useful life of software is between
three and five years. Amortisation methods, useful lives and residual values are reviewed at each financial year-end and
adjusted if appropriate.
Leases in which a significant portion of the risks and rewards of ownership are retained by another party, the lessor, are
classified as operating leases. Payments, including prepayments, made under operating leases (net of any incentives
received from the lessor) are charged to operating expenses in the income statement on a straight-line basis over the
period of the lease and used as investment property.
An impairment loss in respect of goodwill is not reversed. In respect of other assets, impairment losses recognised in
prior periods are assessed at each reporting date for any indications that the loss has decreased or no longer exists. An
impairment loss is reversed if there has been a change in the estimates used to determine the recoverable amount. An
impairment loss is reversed only to the extent that the asset’s carrying amount does not exceed the carrying amount that
would have been determined, net of depreciation or amortisation, if no impairment loss had been recognised.
The Group presents discontinued operations in a separate line in the consolidated income statement if an entity or a
component of an entity has been disposed of or is classified as held for sale and:
(a) Represents a separate major line of business or geographical area of operations;
(b) Is part of a single co-ordinated plan to dispose of a separate major line of business or geographical area of
operations; or
(c) Is a subsidiary acquired exclusively with a view to resale (for example, certain private equity investments).
Leases are accounted for in accordance with IAS 17 and IFRIC 4. They are divided into finance leases and operating
leases.
When assets are held subject to a finance lease, the present value of the lease payments is recognised as a receivable. The
difference between the gross receivable and the present value of the receivable is recognised as unearned finance
income. Lease income is recognised over the term of the lease using the net investment method (before tax), which
reflects a constant periodic rate of return.
The carrying amounts of the Group’s non-financial assets other than goodwill and deferred tax assets, are reviewed at
each reporting date to determine whether there is any indication of impairment. If any such indication exists then the
asset’s recoverable amount is estimated. For goodwill and intangible assets that have indefinite useful lives or that are
not yet available for use, the recoverable amount is estimated each year at the same time.
73

Access Bank Plc
Notes to consolidated financial statements
For the year ended 31 December 2016
3.16 Non-current assets (or disposal groups) held for sale
3.17 Provisions
(a) Restructuring
3.18 Financial guarantees
Non-current assets (or disposal groups) are classified as assets held for sale when their carrying amount is to be
recovered principally through a sale transaction and a sale is considered highly probable. They are stated at the lower of
carrying amount and fair value less costs to sell.
Investment property classified as non-current asset held for sale are measured at fair value, gain or loss arising from a
change in the fair value of investment property is recognised in income statement for the period in which it arise.
A provision is recognised if, as a result of a past event, the Group has a present legal or constructive obligation that can
be estimated reliably, and it is probable that an outflow of economic benefits will be required to settle the obligation.
Provisions are determined by discounting the expected future cash flows at a pre-tax rate that reflects current market
assessments of the time value of money and, where appropriate, the risks specific to the liability. The increase in the
provision due to passage of time is recognised as interest expenses.
A provision for restructuring is recognised when the Group has approved a detailed and formal restructuring plan, and
the restructuring either has commenced or has been announced publicly. Future operating costs are not provided for.
Impairment losses on initial classification as held for sale or distribution and subsequent gains and losses on re-
measurement are recognised in the income statement. Gains are not recognised in excess of any cumulative impairment
loss.
Once classified as held for sale or distribution, intangible assets and property, plant and equipment are no longer
amortised or depreciated, and any equity-accounted investee is no longer equity accounted.
The Group presents discontinued operations in a separate line in the consolidated income statement if an entity or a
component of an entity has been disposed of or is classified as held for sale and:
(a) Represents a separate major line of business or geographical area of operations;
(b) Is part of a single co-ordinated plan to dispose of a separate major line of business or geographical area of
operations; or
(c) Is a subsidiary acquired exclusively with a view to resale (for example, certain private equity investments).
Net profit from discontinued operations includes the net total of operating profit and loss before tax from operations,
including net gain or loss on sale before tax or measurement to fair value less costs to sell and discontinued operations
tax expense. A component of an entity comprises operations and cash flows that can be clearly distinguished,
operationally and for financial reporting purposes, from the rest of the Group´s operations and cash flows. If an entity or
a component of an entity is classified as a discontinued operation, the Group restates prior periods in the consolidated
income statement.
Non-current assets, or disposal groups comprising assets and liabilities, that are expected to be recovered primarily
through sale or distribution rather than through continuing use, are classified as held for sale or distribution.
Immediately before classification as held for sale or distribution, the assets, or components of a disposal group, are re-
measured in accordance with the Group’s accounting policies. Thereafter generally the assets, or disposal group, are
measured at the lower of their carrying amount and fair value less costs to sell. Any impairment loss on a disposal group
is allocated first to goodwill, and then to the remaining assets and liabilities on pro rata basis, except that no loss is
allocated to inventories, financial assets, deferred tax assets, employee benefit assets, investment property or biological
assets, which continue to be measured in accordance with the Group’s accounting policies.
Financial guarantees which includes Letters of credit are contracts that require the Group to make specified payments to
reimburse the holder for a loss it incurs because a specified debtor fails to make payment when due in accordance with
the terms of a debt instrument. Financial guarantee liabilities are initially recognised at their fair value, and the initial
fair value is amortised over the life of the financial guarantee. The guarantee liability is subsequently carried at the
higher of this amortised amount and the present value of any expected payment (when a payment under the guarantee
has become probable).
Letters of credits which have been guaranteed by Access bank but funded by the customer is included in other liabilities
while those guaranteed and funded by the Bank is included in Deposit from financial institutions.
74

Access Bank Plc
Notes to consolidated financial statements
For the year ended 31 December 2016
3.19 Employee benefits
(a) Defined contribution plans
(b) Termination benefits
(c) Long-term Incentive Plan
(d) Short-term employee benefits
(e) Share-based payment remuneration scheme
The Group applies IFRS 2 Share Based Payments in accounting for employee remuneration in the form of shares.
Employee incentives include awards in the form of shares The cost of the employee services received in respect of the
shares or share granted is recognised in the income statement over the period that employees provide services, generally
the period between the date the award is granted or notified and the vesting date of the shares. The overall cost of the
award is calculated using the number of shares and options expected to vest and the fair value of the shares or options at
the date of grant.
The number of shares expected to vest takes into account the likelihood that performance and service conditions
included in the
terms of the awards will be met. Failure to meet the non-vesting condition is treated as a forfieture, resulting in an
acceleration of recognition of the cost of the employee services.
The fair value of shares is the market price ruling on the grant date, in some cases adjusted to reflect restrictions on
transferability.
Termination benefits are payable when employment is terminated by the group before the normal retirement date, or
whenever an employee accepts voluntary redundancy in exchange for these benefits. The group recognises termination
benefits at the earlier of the following dates: (a) when the group can no longer withdraw the offer of those benefits; and
(b) when the entity recognises costs for a restructuring that is within the scope of IAS 37 and involves the payment of
termination benefits. In the case of an offer made to encourage voluntary redundancy, the termination benefits are
measured based on the number of employees expected to accept the offer. Benefits falling due more than 12 months after
the end of the reporting period are discounted to their present value.
The Bank has a non-contributory, un-funded lump sum defined benefit plan for top executive management of the Bank
from General Manager and above based on the number of years spent in these positions.
Depending on their grade, executive staff of the Bank upon retirement are entitled to certain benefits based on their
length of stay on that grade. The Bank's net obligation in respect of the long term incentive scheme is calculated by
estimating the amount of future benefits that eligible employees have earned in return for service in the current and
prior periods. That benefit is discounted to determine its present value. The rate used to discount the post employment
benefit obligation is determined by reference to the yield on Nigerian Government Bonds, that have maturity dates
approximating the terms of the Bank's obligations.
The calculation is performed annually by a qualified actuary using the projected unit credit method. When the benefits of
a plan are improved, the portion of the increased benefit relating to past service by employees is immediately recognized
in the income statement. The Bank recognizes all actuarial gains or losses and all expenses arising from defined benefit
plan immediately in the balance sheet, with a charge or credit to other comprehensive income (OCI) in the periods in
which they occur. They are not recycled subsequently in the income statement.
Short-term employee benefit obligations are measured on an undiscounted basis and are expensed as the related service
is provided.
A liability is recognised for the amount expected to be paid under short-term cash bonus or profit-sharing plans if the
Group has a present legal or constructive obligation to pay this amount as a result of past service provided by the
employee and the obligation can be estimated reliably.
A defined contribution plan is a post employment benefit plan under which an entity pays fixed contributions into a
separate entity and will have no legal or constructive obliagtion to pay further amounts. Obligations for contributions to
defined contribution pension plans are recognised as an expense in the income statement when they are due in respect
of service rendered before the end of the reporting period. Prepaid contributions are recognised as an asset to the extent
that a cash refund or a reduction in future payments is available. Contributions to a defined contribution plan that are
due more than 12 months after the end of the reporting period in which the employees render the service are discounted
to their present value at the reporting date.
The Bank operates a funded, defined contribution pension scheme for employees. Employees and the Bank contribute
8% and 10% respectively of the qualifying staff salary in line with the provisions of the Pension Reforms Act 2014.
75
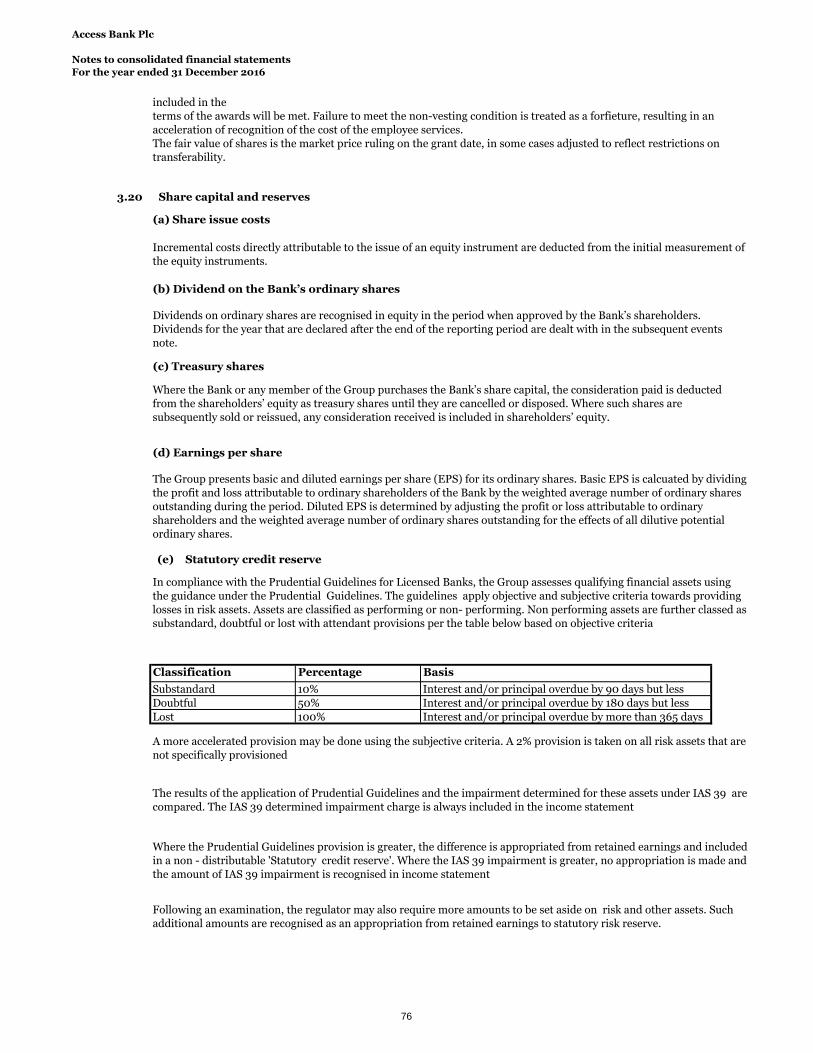
Access Bank Plc
Notes to consolidated financial statements
For the year ended 31 December 2016
3.20 Share capital and reserves
(a) Share issue costs
(b) Dividend on the Bank’s ordinary shares
(c) Treasury shares
(d) Earnings per share
(e) Statutory credit reserve
Percentage
10%
50%
100%Lost
A more accelerated provision may be done using the subjective criteria. A 2% provision is taken on all risk assets that are
not specifically provisioned
Interest and/or principal overdue by 180 days but less
Interest and/or principal overdue by more than 365 days
Interest and/or principal overdue by 90 days but less
Incremental costs directly attributable to the issue of an equity instrument are deducted from the initial measurement of
the equity instruments.
Dividends on ordinary shares are recognised in equity in the period when approved by the Bank’s shareholders.
Dividends for the year that are declared after the end of the reporting period are dealt with in the subsequent events
note.
The Group applies IFRS 2 Share Based Payments in accounting for employee remuneration in the form of shares.
Employee incentives include awards in the form of shares The cost of the employee services received in respect of the
shares or share granted is recognised in the income statement over the period that employees provide services, generally
the period between the date the award is granted or notified and the vesting date of the shares. The overall cost of the
award is calculated using the number of shares and options expected to vest and the fair value of the shares or options at
the date of grant.
The number of shares expected to vest takes into account the likelihood that performance and service conditions
included in the
terms of the awards will be met. Failure to meet the non-vesting condition is treated as a forfieture, resulting in an
acceleration of recognition of the cost of the employee services.
The fair value of shares is the market price ruling on the grant date, in some cases adjusted to reflect restrictions on
transferability.
Where the Bank or any member of the Group purchases the Bank’s share capital, the consideration paid is deducted
from the shareholders’ equity as treasury shares until they are cancelled or disposed. Where such shares are
subsequently sold or reissued, any consideration received is included in shareholders’ equity.
In compliance with the Prudential Guidelines for Licensed Banks, the Group assesses qualifying financial assets using
the guidance under the Prudential Guidelines. The guidelines apply objective and subjective criteria towards providing
losses in risk assets. Assets are classified as performing or non- performing. Non performing assets are further classed as
substandard, doubtful or lost with attendant provisions per the table below based on objective criteria
Basis
Substandard
Doubtful
The Group presents basic and diluted earnings per share (EPS) for its ordinary shares. Basic EPS is calcuated by dividing
the profit and loss attributable to ordinary shareholders of the Bank by the weighted average number of ordinary shares
outstanding during the period. Diluted EPS is determined by adjusting the profit or loss attributable to ordinary
shareholders and the weighted average number of ordinary shares outstanding for the effects of all dilutive potential
ordinary shares.
Classification
Where the Prudential Guidelines provision is greater, the difference is appropriated from retained earnings and included
in a non - distributable 'Statutory credit reserve'. Where the IAS 39 impairment is greater, no appropriation is made and
the amount of IAS 39 impairment is recognised in income statement
Following an examination, the regulator may also require more amounts to be set aside on risk and other assets. Such
additional amounts are recognised as an appropriation from retained earnings to statutory risk reserve.
The results of the application of Prudential Guidelines and the impairment determined for these assets under IAS 39 are
compared. The IAS 39 determined impairment charge is always included in the income statement
76

Access Bank Plc
Notes to consolidated financial statements
For the year ended 31 December 2016
4.0 Use of estimates and judgements
Key sources of estimation uncertainty
(i) Allowances for credit losses
Sensitivity of Exposure at default - Probability of Default (PD) & Loss Given Default (LGD)
Group Group Bank Bank
December 2016 December 2015 December 2016 December 2015
Impact on Profit before tax
20% reduction in expected cashflow and trigger on customer rated 5 (2,204,979) (3,288,201) (2,204,979) (2,421,278)
Increase in LGD and PD by 2% (21,795,115) (18,590,841) (21,129,199) (17,761,796)
Decrease in LGDs and PD by 2% 20,940,405 17,571,970 20,288,377 16,775,437
Increase in LGDs and PD by 10% (23,504,536) (20,746,946) (22,911,741) (19,852,878)
Decrease in LGDs and PD by 10% 19,230,984 15,662,340 18,707,632 14,930,831
These disclosures supplement the commentary on financial risk management (see note 5). Estimates where management has applied judgements are:
(i) Allowances for credit losses
(ii)Valuation of financial instruments
(iii) Determination of fair value of investment property
(iv) Determination of impairment of property and equipment, and intangible assets excluding goodwill
(v) Assessment of impairment of goodwill on acquired subsidiaries
(vi) Defined benefit plan
Loans and advances to banks and customers are accounted for at amortised cost and are evaluated for impairment on a basis described in accounting policy 3.9
The Bank reviews its loan portfolios to assess impairment at least on a half yearly basis. In determining whether an impairment loss should be recorded in the income statement,
the Bank makes judgements as to whether there is any observable data indicating an impairment trigger followed by measurable decrease in the estimated future cash flows from
a portfolio of loans before the decrease can be identified with that portfolio. This evidence may include observable data indicating that there has been an adverse change in the
payment status of borrowers in a bank, or national or local economic conditions that correlate with defaults on assets in the Bank.
The Bank makes use of estimates based on historical loss experience for assets with credit risk characteristics and objective evidence of impairment similar to those in the
portfolio when scheduling future cash flows. The methodology and assumptions used for estimating both the amount and timing of future cash flows are reviewed regularly to
reduce any differences between loss estimates and actual loss experience.
The specific component of the total allowances for impairment applies to financial assets evaluated individually for impairment and is based upon management’s best estimate of
the present value of the cash flows that are expected to be received. In estimating these cash flows, management makes judgements about a debtor’s financial situation and the
net realisable value of any underlying collateral. Each impaired asset is assessed on its merits, and the workout strategy and estimate of cash flows considered recoverable are
independently reviewed by the Credit Risk Management Department (CRMD).
A collective component of the total allowance is established for:
• Groups of homogeneous loans that are not considered individually significant and
• Groups of assets that are individually significant but were not found to be individually impaired
Collective allowance for groups of homogeneous loans is established using statistical modelling of historical trends of the probability of default, timing of recoveries and the
amount of loss incurred, adjusted for management’s judgement as to whether current economic and credit conditions are such that the actual losses are likely to be greater or
less than suggested by historical modelling. Default rates, loss rates and the expected timing of future recoveries are regularly benchmarked against actual outcomes to ensure
that they remain appropriate.
Collective allowance for group of assets that are individually significant but that were not found to be individually impaired cover credit losses inherent in portfolios of loans and
advances and held to maturity investment securities with similar credit characteristics when there is objective evidence to suggest that they contain impaired loans and advances
and held to maturity investment securities, but the individual impaired items cannot yet be identified. In assessing the need for collective loan loss allowances, management
considers factors such as credit quality, portfolio size, concentrations, and economic factors. In order to estimate the required allowance, assumptions are made to define the way
inherent losses are modelled and to determine the required input parameters, based on historical experience and current economic conditions. The accuracy of the allowances
depends on estimates of future cash flows for specific counterparty allowances and the model assumptions and parameters used in determining collective allowances are
estimated.
Had there been a 20% reduction in expected cashflows from all the significant impaired loans, there would have been an additional impairment of N2.2bn in the financial
statements relating to this. In addition, if the PDs and LGDs were increased by 2%, there would have been an additional impairment charge of N21.1bn and if the PDs and LGDs
decreased by 2%, there would have been a write back of impairment of N20.2bn.
Loans and advances to corporatesLoans and advances to individuals
77

Access Bank Plc
Notes to consolidated financial statements
For the year ended 31 December 2016
Statement of prudential adjustments
a)
b)
Statement of prudential adjustments December December
In thousands of Naira 2016 2015
Bank Note
Loans & advances:
Specific impairment allowances on loans to customers
- Loans to Individuals 23(b) 405,200 250,624
- Loans to Corporate 23(b) 9,679,116 8,922,599
Specific impairment allowances on loans to banks 22
Collective impairment allowances on loans to customers
- Loans to Individuals 23(b) 1,039,812 861,632
- Loans to Corporates 23(b) 19,151,386 16,871,228
Collective impairment allowances on loans to banks 22 23,386 9,086
Total impairment allowances on loans per IFRS 30,298,900 26,915,169
Total regulatory impairment based on prudential gudielines 65,357,166 64,741,551
Balance, beginning of the year 37,826,382 17,001,981
Additional transfers to regulatory risk reserve (2,768,116) 20,824,401
Balance, end of the year 35,058,266 37,826,382
4.1 Valuation of financial instruments
4.1.1 Recurring fair value measurements
In thousands of Naira
Group
December 2016
Level 1 Level 2 Level 3 Total
Assets
Investment under management 7,346,795 7,524,452 - 14,871,247
Non pledged trading assets
Treasury bills 34,381,635 - - 34,381,635
Bonds 10,170,293 18,304 - 10,188,597
Equity 59,348 - - 59,348
Derivative financial instrument - 156,042,984 - 156,042,984
Pledged assets
Treasury bills 188,239,521 - - 188,239,521
Bonds 7,516,209 - - 7,516,209
Investment securities
Available for sale
Treasury bills 69,346,601 - - 69,346,601
Bonds 29,252,094 3,431,482 - 32,683,577
Equity 1,147,387 7,451,138 50,069,030 58,667,555
Assets held for sale - - 140,727 140,727
347,459,883 174,468,360 50,209,757 572,138,000
Liabilities
Derivative financial instrument - 30,444,501 - 30,444,501
- 30,444,501 - 30,444,501
• Prudential Provisions is less than IFRS provisions; IFRS determined provision is charged to the statement of comprehensive income. The cumulative balance in the
regulatory risk reserve is thereafter reversed to the general reserve account
Provisions under prudential guidelines are determined using the time based provisioning regime prescribed by the Revised Central Bank of Nigeria (CBN) Prudential Guidelines.
This is at variance with the incurred loss model required by IFRS under IAS 39. As a result of the differences in the methodology/provision regime, there will be variances in the
impairments allowances required under the two methodologies.
Paragraph 12.4 of the revised Prudential Guidelines for Deposit Money Banks in Nigeria stipulates that Banks would be required to make provisions for loans as prescribed in
the relevant IFRS Standards when IFRS is adopted. However, Banks would be required to comply with the following:
Provisions for loans recognised in the profit and loss account should be determined based on the requirements of IFRS. However, the IFRS provision should be compared
with provisions determined under prudential guidelines and the expected impact/changes in general reserves should be treated as follows:
• Prudential Provisions is greater than IFRS provisions; the excess provision resulting should be transferred from the general reserve account to a "regulatory risk reserve".
The non-distributable reserve should be classified under Tier 1 as part of the core capital.
The Bank has complied with the requirements of the guidelines as follows:
The Central Bank of Nigeria (CBN) via its cicrular BSD/DIR/GEN/LAB/08/052 issued on 11 November 2015, directed banks in Nigeria to increase the general provision on
performing loans from 1 percent to 2 percent for prudential review of credit portfolios in order to ensure adequate buffer against unexpected loan losses.
The table below analyses financial and non-financial instruments measured at fair value at the end of the financial year, by the level in the fair value hierarchy into which the fair
value measurement is categorised:
78

Access Bank Plc
Notes to consolidated financial statements
For the year ended 31 December 2016
Group
December 2015
Level 1 Level 2 Level 3 Total
Assets
Investment under management 3,093,403 7,309,287 - 10,402,690
Non pledged trading assets
Treasury bills 31,738,748 18,470,695 - 50,209,443
Bonds 2,025,000 - - 2,025,000
Equity 63,979 - - 63,979
Derivative financial instrument - 77,905,020 - 77,905,020
Pledged assets
Treasury bills 96,614,984 7,069,060 - 103,684,044
Bonds 18,669,957 - - 18,669,957
Investment securities
Available for sale
Treasury bills 28,996,006 - - 28,996,006
Bonds 56,842,367 4,361,847 - 61,204,214
Equity 741,096 8,317,689 35,696,780 44,755,565
Assets held for sale - - 179,843 179,843
238,785,540 123,433,598 35,876,623 398,095,761
Liabilities
Derivative financial instrument - 3,077,927 - 3,077,927
- 3,077,927 - 3,077,927
Bank
December 2016
In thousands of Naira
Level 1 Level 2 Level 3 Total
Assets
Investment under management 7,346,795 7,524,452 - 14,871,247
Non pledged trading assets
Treasury bills 34,381,635 - - 34,381,635
Bonds 10,170,293 18,304 - 10,188,597
Equity 59,348 - - 59,348
Pledged assets
Treasury bills 188,239,521 - - 188,239,521
Bonds 7,516,209 - - 7,516,209
Derivative financial instrument - 155,772,662 - 155,772,662
Investment securities
Available for sale
Treasury bills 40,960,665 - - 40,960,665
Bonds 18,025,037 3,431,482 - 21,456,519
Equity 1,147,387 7,451,138 49,821,881 58,420,406
Asset held for sale - - 140,727 140,727
307,846,890 174,198,037 49,962,608 532,007,535
Liabilities
Derivative financial instrument - 30,275,181 - 30,275,181
- 30,275,181 - 30,275,181
Bank
December 2015
In thousands of Naira
Level 1 Level 2 Level 3 Total
Assets
Investment under management 3,093,403 7,309,287 - 10,402,690
Non pledged trading assets
Treasury bills 31,738,748 18,470,695 - 50,209,443
Bonds 2,025,000 - - 2,025,000
Equity 63,979 - - 63,979
Pledged assets
Treasury bills 96,614,984 7,069,060 - 103,684,044
Bonds 18,669,957 - - 18,669,957
Derivative financial instrument - 77,852,349 - 77,852,349
Investment securities
Available for sale
Treasury bills 10,436,981 - - 10,436,981
Bonds 56,842,367 3,853,736 - 60,696,103
Equity 741,096 8,317,689 35,696,780 44,755,565
Asset held for sale - - 179,843 179,843
220,226,515 122,872,816 35,876,623 378,975,954
Liabilities
Derivative financial instrument 2,416,378 2,416,378
- 2,416,378 - 2,416,378
There were no transfers between levels 1 and 2 during the year.
79

Access Bank Plc
Notes to consolidated financial statements
For the year ended 31 December 2016
4.1.2 Financial instruments not measured at fair value
Group
December 2016
In thousands of Naira
Level 1 Level 2 Level 3 Total
Assets
Cash and balances with banks - 714,858,231 - 714,858,231
Investment under management - - - -
Loans and advances to banks - 45,847,527 - 45,847,527
- - 1,771,419,816 1,771,419,816
Pledged assets
Treasury bills - - - -
Bonds 79,336,927 - - 79,336,927
Investment securities
Held to Maturity
Treasury bills 27,347,558 - - 27,347,558
Bonds 30,729,231 - - 30,729,231
Other assets - - 41,796,068 41,796,068
137,413,716 760,705,758 1,813,215,884 2,711,335,359
Liabilities
Deposits from financial institutions - 167,356,583 - 167,356,583
Deposits from customers - 2,101,625,991 - 2,101,625,991
Other liabilities - - 111,117,648 111,117,648
Debt securities issued 97,513,653 - - 97,513,653
Interest-bearing borrowings 72,895,869 303,178,641 - 376,074,510
170,409,522 2,572,161,215 111,117,648 2,853,688,386
Group
December 2015
In thousands of Naira
Level 1 Level 2 Level 3 Total
Assets
Cash and balances with banks - 478,409,336 - 478,409,336
Investment under management 918 - - 918
Loans and advances to banks - 43,117,434 - 43,117,434
- - 1,364,822,146 1,364,822,146
Pledged assets
Treasury bills - - - -
Bonds 58,349,639 - - 58,349,639
Investment securities
Held to Maturity
Treasury bills 7,665,767 - 7,665,767
Bonds 58,349,638 5,559,182 - 63,908,820
Other assets - - 72,160,739 72,160,739
124,365,962 527,085,952 1,436,982,885 2,088,434,799
Level 1 Level 2 Level 3 Total
Liabilities
Deposits from financial institutions - 72,910,858 - 72,910,858
Deposits from customers - 1,682,766,276 - 1,682,766,276
Other liabilities - 65,277,321 - 65,277,321
Debt securities issued 137,841,311 - - 137,841,311
Interest-bearing borrowings - 236,648,640 - 236,648,640
137,841,311 2,057,603,095 - 2,195,444,406
Bank
December 2016
In thousands of Naira
Level 1 Level 2 Level 3 Total
Assets
Cash and balances with banks - 517,997,249 - 517,997,249
Investment under management - - - -
Loans and advances to banks - 45,847,527 - 45,847,527
- - 1,584,350,701 1,584,350,701
Pledged assets
Treasury bills - - - -
Bonds 79,336,927 - - 79,336,927
Investment securities
Held to maturity
Treasury bills - - - -
Bonds 30,729,231 - - 30,729,231
Other Assets - - 33,265,072 33,265,072
110,066,158 563,844,776 1,617,615,772 2,291,526,707
Liabilities
Deposits from financial institutions - 95,107,837 - 95,107,837
Deposits from customers - 1,825,471,578 - 1,825,471,578
Other liabilities - - 105,287,724 105,287,724
Debt securities issued 227,210,069 - - 227,210,069
Interest-bearing borrowings 72,895,869 303,178,641 - 376,074,510
300,105,938 2,223,758,056 105,287,724 2,629,151,718
Loans and advances to customers
Loans and advances to customers
Loans and advances to customers
80

Access Bank Plc
Notes to consolidated financial statements
For the year ended 31 December 2016
Bank
December 2015
In thousands of Naira
Level 1 Level 2 Level 3 Total
Assets
Cash and balances with banks - 405,998,636 - 405,998,636
Investment under management 918 - - 918
Loans and advances to banks - 60,276,940 - 60,276,940
- - 1,242,206,624 1,242,206,624
Pledged assets
Treasury bills - - - -
Bonds 58,573,185 - - 58,573,185
Investment securities
Held to maturity
Treasury bills - - - -
Bonds 35,949,492 2,750,701 - 38,700,193
Other Assets - - 69,509,746 69,509,746
94,523,595 469,026,277 1,311,716,370 1,875,266,242
Liabilities
Deposits from financial institutions - 63,342,003 - 63,342,003
Deposits from customers - 1,527,735,839 - 1,527,735,839
Other liabilities - 62,871,485 - 62,871,485
Debt securities issued 69,591,973 - - 69,591,973
Interest-bearing borrowings 68,249,338 236,066,022 - 304,315,360
137,841,311 1,890,015,349 - 2,027,856,660
Financial instrument measured at fair value
(a) Financial instruments in level 1
(b) Financial instruments in level 2
(c) Financial instruments in level 3
The fair value of financial instruments traded in active markets is based on quoted market prices at the balance sheet date. A market is regarded as active if quoted prices are
readily and regularly available from an exchange, dealer, broker, industry group, pricing service, or regulatory agency, and those prices represent actual and regularly occurring
market transactions on an arm’s length basis. The quoted market price used for financial assets held by the group is the current bid price. These instruments are included in
Level 1. Instruments included in Level 1 comprise primarily government bonds, corporate bonds, treasury bills and equity investments classified as trading securities or available
for sale investments.
The fair value of financial instruments that are not traded in an active market are determined by using valuation techniques. These valuation techniques maximise the use of
observable market data where it is available and rely as little as possible on entity specific estimates. If all significant inputs required to fair value an instrument are observable,
the instrument is included in level 2.
If one or more of the significant inputs is not based on observable market data, the instrument is included in Level 3. Specific valuation techniques used to value financial
instruments include:
(i) Quoted market prices or dealer quotes for similar instruments;
(ii) The fair value of forward foreign exchange contracts is determined using forward exchange rates at the balance sheet date, with the resulting value discounted back to present
value;
(iii) Other techniques, such as discounted cash flow analysis, are used to determine fair value for the remaining financial instruments.
Loans and advances to customers
The Group uses widely recognised valuation models for determining the fair value of its financial assets. Valuation techniques include net present value and discounted cash
flow models, comparison with similar instruments for which market observable prices exist and other valuation models. Assumptions and inputs used in valuation techniques
include risk-free and benchmark interest rates, credit spreads and other premia used in estimating discount rates, bond and equity prices, foreign currency exchange rates,
equity and equity index prices and expected price volatilities and correlations. The objective of valuation techniques is to arrive at a fair value measurement that reflects the price
that would be received to sell the asset or paid to transfer the liability in an orderly transaction between market participants at the measurement date.
For more complex instruments, the Group uses proprietary valuation models, which are usually developed from recognised valuation models. Some or all of the significant
inputs into these models may not be observable in the market, and are derived from market prices or rates or are estimated based on assumptions. Examples of instruments
involving significant unobservable inputs include certain Investment securities for which there is no active market. Valuation models that employ significant unobservable
inputs require a higher degree of management judgement and estimation in the determination of fair value. Management judgement and estimation are usually required for
selection of the appropriate valuation model to be used, determination of expected future cash flows on the financial instrument being valued, determination of the probability of
counterparty default and prepayments and selection of appropriate discount rates. Fair value estimates obtained from models are adjusted for any other factors, such as liquidity
risk or model uncertainties, to the extent that the Group believes that a third party market participant would take them into account in pricing a transaction. Fair values reflect
the credit risk of the instrument and include adjustments to take account of the credit risk of the Group entity and the counterparty where appropriate.
For level 2 assets, fair value was obtained using a recent market transaction during the year under review. Fair values of unquoted debt securities were derived by interpolating
prices of quoted debt secuirties with similar maturity profile and characteristics. There were no transfer between levels 1 and 2 during the year.
81
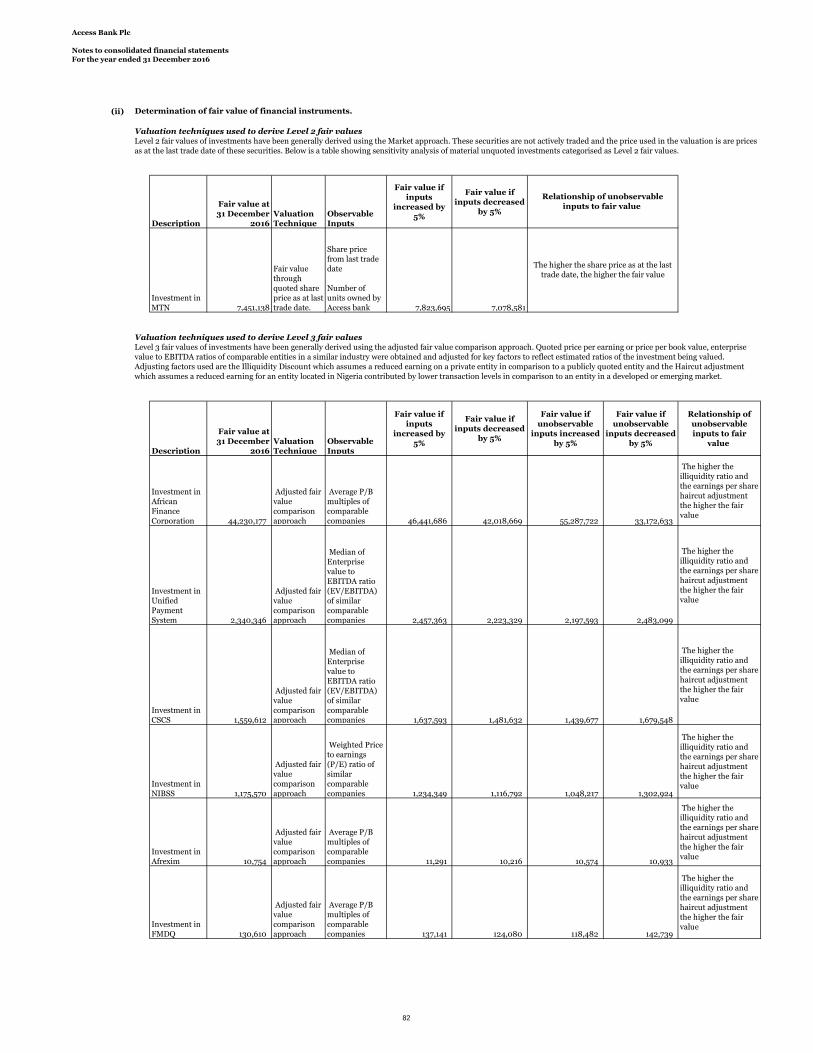
Access Bank Plc
Notes to consolidated financial statements
For the year ended 31 December 2016
(ii) Determination of fair value of financial instruments.
Valuation techniques used to derive Level 2 fair values
Description
Fair value at
31 December
2016
Valuation
Technique
Observable
Inputs
Fair value if
inputs
increased by
5%
Fair value if
inputs decreased
by 5%
Investment in
MTN 7,451,138
Fair value
through
quoted share
price as at last
trade date.
Share price
from last trade
date
Number of
units owned by
Access bank 7,823,695 7,078,581
Valuation techniques used to derive Level 3 fair values
Description
Fair value at
31 December
2016
Valuation
Technique
Observable
Inputs
Fair value if
inputs
increased by
5%
Fair value if
inputs decreased
by 5%
Fair value if
unobservable
inputs increased
by 5%
Fair value if
unobservable
inputs decreased
by 5%
Relationship of
unobservable
inputs to fair
value
Investment in
African
Finance
Corporation 44,230,177
Adjusted fair
value
comparison
approach
Average P/B
multiples of
comparable
companies 46,441,686 42,018,669 55,287,722 33,172,633
The higher the
illiquidity ratio and
the earnings per share
haircut adjustment
the higher the fair
value
Investment in
Unified
Payment
System 2,340,346
Adjusted fair
value
comparison
approach
Median of
Enterprise
value to
EBITDA ratio
(EV/EBITDA)
of similar
comparable
companies 2,457,363 2,223,329 2,197,593 2,483,099
The higher the
illiquidity ratio and
the earnings per share
haircut adjustment
the higher the fair
value
Investment in
CSCS 1,559,612
Adjusted fair
value
comparison
approach
Median of
Enterprise
value to
EBITDA ratio
(EV/EBITDA)
of similar
comparable
companies 1,637,593 1,481,632 1,439,677 1,679,548
The higher the
illiquidity ratio and
the earnings per share
haircut adjustment
the higher the fair
value
Investment in
NIBSS 1,175,570
Adjusted fair
value
comparison
approach
Weighted Price
to earnings
(P/E) ratio of
similar
comparable
companies 1,234,349 1,116,792 1,048,217 1,302,924
The higher the
illiquidity ratio and
the earnings per share
haircut adjustment
the higher the fair
value
Investment in
Afrexim 10,754
Adjusted fair
value
comparison
approach
Average P/B
multiples of
comparable
companies 11,291 10,216 10,574 10,933
The higher the
illiquidity ratio and
the earnings per share
haircut adjustment
the higher the fair
value
Investment in
FMDQ 130,610
Adjusted fair
value
comparison
approach
Average P/B
multiples of
comparable
companies 137,141 124,080 118,482 142,739
The higher the
illiquidity ratio and
the earnings per share
haircut adjustment
the higher the fair
value
Level 2 fair values of investments have been generally derived using the Market approach. These securities are not actively traded and the price used in the valuation is are prices
as at the last trade date of these securities. Below is a table showing sensitivity analysis of material unquoted investments categorised as Level 2 fair values.
Level 3 fair values of investments have been generally derived using the adjusted fair value comparison approach. Quoted price per earning or price per book value, enterprise
value to EBITDA ratios of comparable entities in a similar industry were obtained and adjusted for key factors to reflect estimated ratios of the investment being valued.
Adjusting factors used are the Illiquidity Discount which assumes a reduced earning on a private entity in comparison to a publicly quoted entity and the Haircut adjustment
which assumes a reduced earning for an entity located in Nigeria contributed by lower transaction levels in comparison to an entity in a developed or emerging market.
Relationship of unobservable
inputs to fair value
The higher the share price as at the last
trade date, the higher the fair value
82

Access Bank Plc
Notes to consolidated financial statements
For the year ended 31 December 2016
Investment in
CRC 281,626
Adjusted fair
value
comparison
approach
Average P/B
multiples of
comparable
companies 295,708 267,545 261,588 301,662
The higher the
illiquidity ratio and
the earnings per share
haircut adjustment
the higher the fair
value
Nigerian
Mortage
Refinance
Company 93,186
Adjusted fair
value
comparison
approach
Average P/B
multiples of
comparable
companies 97,845 88,526 89,858 96,514
The higher the
illiquidity ratio and
the earnings per share
haircut adjustment
the higher the fair
value
Reconciliation of Level 3 Items
The following tables presents the changes in Level 3 instruments for the year 31 December 2016
Equity Securities - Available for Sale Group Group Bank Bank
December 2016 December 2015 December 2016 December 2015
Opening balance 37,159,966 35,523,466 35,516,671 34,035,133
Total unrealised gains or (losses) in OCI 15,449,958 1,528,754 15,449,958 1,373,792
Reclassification to profit or loss (2,540,893) 107,746 (1,144,748) 107,746
Balance, year end 50,069,031 37,159,966 49,821,881 35,516,671
Assets Held for Sale Group Group Bank Bank
December 2016 December 2015 December 2016 December 2015
Opening balance 179,843 23,438,484 179,843 23,438,484
Cost of Asset Additions/ (Disposal) (39,116) (23,258,641) (39,116) (23,258,641)
Balance, year end 140,727 179,843 140,727 179,843
Varying valuation techniques were applied in the valuation of assets classified as Level 3
Disclosure Requirements for Level 3 Financial Instruments
Valuation Technique Unquoted Equity:
Description of Valuation Methodology and inputs:
Step 1:Identify quoted companies with similar line of business ,structure and size
Step 2: Obtain the EV/EBITDA or the P/B or P/E ratios of these quoted companies identified from Bloomberg,Reuters or Nigeria Stock Exchange
Step 3: Derive the average or median of EV/EBITDA or the P/B or P/E ratios of these identified quoted companies
Step 6: Multipy the Adjusted Equity value by the present exchange rate for foreign currency investment
Step 7: Compare theAdjusted Equity value with the carrying value of the investment company to arrive at a net gain or loss
The investment valuation policy (IVP) of the Group provides the framework for accounting for the Group’s investment in unquoted equity securities, investment properties and
assets held for sale while also providing a broad valuation guideline to be adopted in valuing them. Furthermore, the IVP details how the group decides its valuation policies and
procedures and analysis changes in fair value measurements from year to year.
The Adjusted fair value comparison approach of EV/EBITDA, P/E ratios and P/Bv ratios was adopted in valuing each of these equity investments taken into cognizance the
suitability of the model to each equity investment and the availability of financial information while minimizing the use of unobservable data.
The fair value of the other unquoted equity securities were derived using the Adjusted fair value comparison technique. Adjusted fair value comparison approach of
EV/EBITDA, P/E ratios and P/B ratios are used as input data .
The steps involved in estimating the fair value of the Group’s investment in each of the investees (i.e. unquoted equity securities) are as follows:
Step 4: Apply the lower of average (mean) or median of the identified quoted companies ratios on the EV/EBITDA or Book Value or Earnings of the investment company to
get the value of the investment company
Step 5: Discount the derived value of the investment company by Illiuidity discount of 25% and EPS Haircut Adjustment of 40% to obtian the Adjusted Equity Value
In accordance with IFRS 13 Fair Value Measurement, which outlines three approaches for valuing unquoted equity instruments; market approach, the income approach and the
cost approach. The Group estimated the fair value of its investment in each of the unquoted equity securities at the end of the financial year using the Market approach.
83

Access Bank Plc
Notes to consolidated financial statements
For the year ended 31 December 2016
a. Enterprise Value (EV):
b. Earnings Before Interest ,Tax Depreciation and Tax (EBITDA ):
EBITDA = Operating Profit + Depreciation Expense + Amortization Expense
c. Price to Book (P/B Ratio):
d. Price to Earning (P/E Ratio):
The price-earnings ratio (P/E Ratio) values a company using the current share price relative to its per-share earnings.
The sources of the observable inputs used for comparable technique were gotten from Reuters ,Bloomberg and the Nigeria Stock Exchnage
Valuation Assumptions :
i. Illiuidity discount of 25% are used to discount the value of the investment being that they are not tradable
Valuation Technique Asset Held for Sale:
Basis of valuation:
Method of Valuation
(iii)
(iv)
The present value of the long term incentive plan depends on a number of factors that are determined in an actuarial basis using a number of assumptions. Any changes in these
assumptions will impact the carrying amount of obligations. The assumptions used in determining the net cost (income) for pensions include the discount rate. The Group
determines the appropriate discount rate at the end of the year. In determining the appropriate discount rate, reference is made to the yield on Nigerian Government Bonds that
have maturity dates approximating the terms of the related pension liability. Other key assumptions for pension obligations are based in part on current market conditions. See
note 37 for the sensitivity analysis.
Assessment of impairment of goodwill on acquired subsidiaries
Goodwill on acquired subsidiaries was tested for impairment using discounted cash flow valuation method. Projected cash flows were discounted to present value using a
discount rate of 19.50% (Dec. 2015: 19.1%) and a cash flow growth rate of 6.62% (Dec. 2015: 7.96%) over a period of four years. The Group determined the appropriate discount
rate at the end of the year. See note 29b for further details.
Enterprise value measures the value of the ongoing operations of a company.It is calculated as the market capitalization plus debt, minority interest and preferred shares, minus
total cash and cash equivalents of the company .
EBITDA is earnings before interest, taxes, depreciation and amortization. EBITDA is one of the indicator's of a company's financial performance and is used as a proxy for the
earning potential of a business.
The price-to-book ratio (P/B Ratio) is used to compare a stock's market value to its book value. It is calculated by dividing the current closing price of the stock by the latest
company book value per share or by dividing the company's market capitalization by the company's total book value from its balance sheet.
ii. EPS Hair cut "emerging market" discount of 40% to take care of inflation and exchange rate impact being that the comparable companies are in foreign countries
The Group policy on valuation of Asset Held for Sale is to appoint a professional expert valuer to value tangible asset held for sale. The professional expert used must be qualified
and a member of the Nigeria Institute of Estate Surveyors and Valuers (NIESV) or International Institute of Valuers.
Defined benefit plan
The assets is being valued on a fair open market value approach. This implies that the value is based on the conservative estimates of the reasonable price that can be obtained if
and when the subject asset is offered for sale under the present market conditions.
The comparative method of valuation in the valuation of the asset. This method involves the analysis of recent transaction in such asset within the same asset type and the size of
the subject asset after due allowance have been made for preculiar attributes of the various asset concerned.
The key elements of the control framework for the valuation of financial instruments include model validation and independent price verification. These functions are carried
out by an appropriately skilled Finance team, independent of the business area responsible for the products. The result of the valuation are reviewed quarterly by senior
management.
84

Access Bank Plc
Notes to consolidated financial statements
For the year ended 31 December 2016
4.3 Financial assets and liabilities
Fair value measurement
Accounting classification measurement basis and fair values
The table below sets out the classification of each class of financial assets and liabilities, and their fair values.
Group Held-to- Available- Total carrying
In thousands of Naira Trading maturity for-sale amount Fair value
31 December 2016
Cash and balances with banks - - - 713,889,105 - - - 713,889,105 714,858,231
Investment under management - - - - - 14,871,247 - 14,871,247 14,871,247
Non pledged trading assets
Treasury bills 34,381,635 - - - - - - 34,381,635 34,381,635
Bonds 10,188,597 - - - - - - 10,188,597 10,188,597
Equity 59,348 - - - - - - 59,348 59,348
Derivative financial instruments - 156,042,984 - - - - - 156,042,984 156,042,984
Loans and advances to banks - - - 45,203,002 - - - 45,203,002 45,847,527
Loans and advances to customers - - - 1,809,459,172 - - - 1,809,459,172 1,771,419,816
Pledged assets
Treasury bills 105,841,302 - - - 82,398,218 - - 188,239,520 188,239,521
Bonds - - 119,191,773 - 7,516,209 - - 126,707,982 86,853,136
Investment securities
- Available for sale
Treasury bills - - - - 69,346,601 - - 69,346,601 69,346,601
Bonds - - - - 32,648,488 - - 32,648,488 32,683,577
Equity - - - - 58,667,555 - - 58,667,555 58,667,555
- Held to Maturity
Treasury bills - - 27,350,114 - - - - 27,350,114 27,347,558
Bonds - 41,101,014 - - - - 41,101,014 30,729,231
Other assets - - - 41,796,068 - - - 41,796,068 41,796,068
150,470,882 156,042,984 187,642,901 2,610,347,347 250,577,071 14,871,247 - 3,369,952,432 3,283,332,632
Deposits from financial institutions - - - - - - 167,356,583 167,356,583 167,356,583
Deposits from customers - - - - - - 2,089,197,286 2,089,197,286 2,101,625,991
Other liabilities - - - - - - 111,117,648 111,117,648 111,117,648
Derivative financial instruments - 30,444,501 - - - - 30,444,501 30,444,501
Debt securities issued - - - - - - 316,544,502 316,544,502 97,513,653
Interest bearing borrowings - - - - - - 299,543,707 299,543,707 376,074,510
- 30,444,501 - - - - 2,983,759,726 3,014,204,227 2,884,132,886
Derivatives held
for trading
Loans and
receivables at
amortized cost
Fair value
through
profit or loss
Financial Liabilities
measured at
amortized cost
85

Access Bank Plc
Notes to consolidated financial statements
For the year ended 31 December 2016
Group Held-to- Available- Total carrying
In thousands of Naira Trading maturity for-sale amount Fair value
31 December 2015
Cash and balances with banks - - - 478,409,336 - - - 478,409,336 478,409,336
Investment under management - - 918 - - 10,402,690 - 10,403,608 10,406,579
Non pledged trading assets
Treasury bills 50,209,443 - - - - - - 50,209,443 50,209,443
Bonds 2,025,000 - - - - - - 2,025,000 2,025,000
Equity 63,979 - - - - - - 63,979 63,979
Derivative financial instruments - 77,905,020 - - - - - 77,905,020 77,905,020
Loans and advances to banks - - - 42,733,910 - - - 42,733,910 43,117,434
Loans and advances to customers - - - 1,365,830,831 - - - 1,365,830,831 1,364,822,146
Pledged assets
Treasury bills - 3,250,773 - 103,684,044 - - 106,934,817 106,934,817
Bonds - - 78,110,623 18,669,957 - - 96,780,580 77,019,596
Investment securities
- Available for sale
Treasury bills - - - - 28,996,006 - - 28,996,006 28,996,006
Bonds - - - - 61,204,214 - - 61,204,214 61,204,214
Equity - - - - 44,592,330 - - 44,592,330 44,592,330
- Held to Maturity
Treasury bills - - 7,687,281 - - - - 7,687,281 7,665,767
Bonds - 43,743,295 - - - - 43,743,295 44,320,781
Other assets - - - 72,160,739 - - - 72,160,739 72,160,739
52,298,422 77,905,020 132,792,890 1,959,134,816 257,146,551 10,402,690 - 2,489,680,389 2,469,853,187
Deposits from financial institutions - - - - - - 72,914,421 72,914,421 72,910,858
Deposits from customers - - - - - - 1,683,244,320 1,683,244,320 1,682,766,276
Other liabilities - - - - - - 65,277,321 65,277,321 65,277,321
Derivative financial instruments - 3,077,927 - - - - 3,077,927 3,077,927
Debt securities issued - - - - - - 149,853,640 149,853,640 137,841,311
Interest bearing borrowings - - - - - - 231,467,161 231,467,161 236,648,640
- 3,077,927 - - - - 2,202,756,863 2,205,834,790 2,198,522,333
Financial Liabilities
measured at
amortized cost
Derivatives held
for trading
Loans and
receivables at
amortized cost
Fair value
through
profit or loss
86

Access Bank Plc
Notes to consolidated financial statements
For the year ended 31 December 2016
Bank
In thousands of Naira
31 December 2016
Cash and balances with banks - - - 517,997,249 - - - 517,997,249 517,997,249
Investment under management - - - - - 14,871,247 - 14,871,247 14,871,247
Non pledged trading assets
Treasury bills 34,381,635 - - - - - - 34,381,635 34,381,635
Bonds 10,188,597 - - - - - - 10,188,597 10,188,597
Equity 59,348 59,348 59,348
Derivative financial instruments - 155,772,662 - - - - - 155,772,662 155,772,662
Loans and advances to banks - - - 104,006,574 - - - 104,006,574 45,847,527
Loans and advances to customers - - - 1,594,562,345 - - - 1,594,562,345 1,584,350,701
Pledged assets
Treasury bills 105,841,302 - - - 82,398,218 - - 188,239,520 188,239,521
Bonds - - 119,191,773 - 7,516,209 - - 126,707,982 86,853,136
Investment securities
Available for sale
Treasury bills - - - - 40,960,665 - - 40,960,665 40,960,665
Bonds - - - - 21,456,519 - - 21,456,519 21,456,519
Equity - - - - 58,420,406 - - 58,420,406 58,420,406
Held to maturity
Treasury bills - - - - - - - - -
Bonds - - 40,363,051 - - - - 40,363,051 30,729,231
Other assets - - - 36,232,930 - - - 36,232,930 36,232,930
150,470,882 155,772,662 159,554,824 2,252,799,099 210,752,017 14,871,247 - 2,944,220,730 2,826,361,373
Deposits from financial institutions - - - - - - 95,122,188 95,122,188 95,107,837
Deposits from customers - - - - - - 1,813,042,872 1,813,042,872 1,825,471,578
Derivative financial instruments - 30,275,181 - - - - - 30,275,181 30,275,181
Other liabilities - - - - - - 105,287,724 105,287,724 105,287,724
Debt securities issued - 243,952,418 243,952,418 227,210,069
Interest bearing borrowings - - - - - - 372,179,785 372,179,785 376,074,510
- 30,275,181 - - - - 2,629,584,987 2,659,860,168 2,659,426,899
TradingDerivatives held
for trading
Held-to-
maturity
Loans and
receivables at
amortised cost Financial Liabilities
measured at
amortized cost
Available-for-
sale
Total carrying
amountFair value
through
profit or loss
Fair value
87

Access Bank Plc
Notes to consolidated financial statements
For the year ended 31 December 2016
Bank
In thousands of Naira
31 December 2015
Cash and balances with banks - - - 405,998,636 - - - 405,998,636 405,998,636
Investment under management - - 918 - - 10,402,690 - 10,403,608 10,406,579
Non pledged trading assets
Treasury bills 50,209,443 - - - - - - 50,209,443 50,209,443
Bonds 2,025,000 - - - - - - 2,025,000 2,025,000
Equity 63,979 63,979 63,979
Derivative financial instruments - 77,852,349 - - - - - 77,852,349 77,852,349
Loans and advances to banks - - - 60,414,721 - - - 60,414,721 60,276,940
Loans and advances to customers - - - 1,243,215,309 - - - 1,243,215,309 1,242,206,624
Pledged assets
Treasury bills - - - - 103,684,044 - - 103,684,044 103,684,044
Bonds - - 78,110,623 - 18,669,957 - - 96,780,580 77,243,142
Investment securities
Available for sale
Treasury bills - - - - 10,436,981 - - 10,436,981 10,436,981
Bonds - - - - 60,696,103 - - 60,696,103 60,696,103
Equity - - - - 44,575,185 - - 44,755,565
Held to maturity
Treasury bills - - - - - - - - -
Bonds - 825,225,321 40,286,529 - - - - 865,511,850 38,700,193
Other assets - - - 69,509,746 - - - 69,509,746 69,509,746
52,298,422 903,077,670 118,398,070 1,779,138,412 238,062,270 10,402,690 - 3,056,802,349 2,254,065,324
Deposits from financial institutions - - - - - - 63,343,785 63,343,785 63,342,003
Deposits from customers - - - - - - 1,528,213,883 1,528,213,883 1,527,735,839
Derivative financial instruments - 2,416,378 - - - - - 2,416,378 2,416,378
Other liabilities - - - - - - 62,871,485 62,871,485 62,871,485
Debt securities issued - - - - - - 78,516,655 78,516,655 69,591,973
Interest bearing borrowings - - - - - - 302,919,987 302,919,987 304,315,360
- 2,416,378 - - - - 2,035,865,795 2,038,282,173 2,030,273,038
Financial Liabilities
measured at
amortized cost
Trading Derivatives held
for trading
Held-to-
maturity
Loans and
receivables at
amortised cost
Available-for-
saleFair value
through
profit or loss
Total carrying
amount Fair value
88

Access Bank Plc
Notes to consolidated financial statements
For the year ended 31 December 2016
4.3 (b) Fair value of financial assets and liabilities not carried at fair value
(i) Cash
(ii) Loans and advances to banks and customers
(iii) Investment securities, Pledged and Non-Pledged trading assets
(iv) Other assets
(v) Deposits from banks and customers
(vi) Other liabilities
(vii) Interest bearing borrowings
The estimated fair value of deposits with no stated maturity, which includes non-interest bearing deposits, is the amount
repayable on demand. The estimated fair value of fixed interest-bearing deposits not quoted in an active market is based on
discounted cash flows using interest rates for new debts with similar remaining maturity.
The estimated fair value of fixed interest-bearing borrowings not quoted in an active market is based on the market rates for
similar instruments for these debts over their remaining maturity.
The fair value for financial assets and liabilities that are not carried at fair value were determined respectively as follows:
The carrying amount of Cash and balances with banks is a reasonable approximation of fair value.
Loans and advances are net of charges for impairment. The estimated fair value of loans and advances represents the
discounted amount of estimated future cash flows expected to be received. Expected cash flows are discounted at current
market rates to determine fair value.
The fair value for investment securities is based on market prices from financial market dealer price quotations. Where this
information is not available, fair value is estimated using quoted market prices for securities with similar credit, maturity and
yield characteristics.
Investment securities (available for sale) disclosed in the table above comprise only those equity securities held at cost less
impairment. The fair value for these assets is based on estimations using market prices and earning multiples of quoted
securities with similar characteristics. All other available for sale assets are already measured and carried at fair value.
The bulk of these financial assets have short maturities with their amounts of financial assets in is a reasonable approximation
of fair value.
The carrying amount of financial liabilities in other liabilities is a reasonable approximation of fair value. They comprise of
short term liabilities which are available on demand to creditors with no contractual rates attached to them.
89

Access Bank Plc
Notes to consolidated financial statements
For the year ended 31 December 2016
5.1 Credit risk management
5.1.1 Maximum exposure to credit risk before collateral held or other credit enhancements
Credit risk exposures relating to financial assets are as follows:
Group Group Bank Bank
In thousands of Naira December 2016 December 2015 December 2016 December 2015
Cash and balances with banks
- Current balances with banks outside Nigeria 115,380,195 85,299,149 106,594,205 57,546,509
- Unrestricted balances with central banks 139,954,922 90,721,388 33,160,736 74,158,434
- Restricted balances with central banks 250,831,529 249,954,817 248,547,664 248,182,477
- Money market placements 119,826,012 52,433,982 41,798,197 26,111,216
- Other deposits with central banks 87,896,447 - 87,896,447 -
Investment under management 14,871,247 10,403,608 14,871,247 10,403,608
Non pledged trading assets
Treasury bills 34,381,635 50,209,443 34,381,635 50,209,443
Bonds 10,188,597 2,025,000 10,188,597 2,025,000
Derivative financial instruments 156,042,984 77,905,020 155,772,662 77,852,349
Loans and advances to banks 45,203,002 42,733,910 104,006,574 60,414,721
Loans and advances to customers 1,809,459,172 1,365,830,831 1,594,562,345 1,243,215,309
Pledged assets
Treasury bills 188,239,520 106,934,817 188,239,520 103,684,044
Bonds 126,707,982 96,780,580 126,707,982 96,780,580
Investment securities
Available for sale
Treasury bills 69,346,601 28,996,006 40,960,665 10,436,981
Bonds 231,874,433 61,204,214 163,961,303 60,696,103
Held to Maturity
Treasury bills 27,350,114 7,687,281 - -
Bonds 41,101,014 43,743,295 40,363,051 40,286,529
Other assets 41,796,068 72,160,739 33,265,072 69,509,746
Total 3,510,451,474 2,445,024,080 3,025,277,903 2,231,513,049
Off balance sheet exposuresTransaction related bonds and guarantees 186,251,718 221,127,530 136,163,848 218,067,025
Guaranteed facilities 99,582,709 94,135,927 85,513,821 91,640,933
Clean line facilities for letters of credit and other commitments 261,208,243 188,826,683 158,994,793 160,094,292
Future, swap and forward contracts 933,073,893 468,759,809 900,436,358 440,800,900
Total 1,480,116,563 972,849,949 1,281,108,820 910,603,150
5.1.2
Group Group Bank Bank
December 2016 December 2015 December 2016 December 2015
In thousands of Naira
Agriculture 22,746,128 19,176,019 16,358,431 15,937,248
Construction 136,719,717 87,879,130 107,339,808 76,829,699
Education 2,866,466 2,113,599 1,411,646 2,016,754
Finance and insurance 24,432,492 21,037,838 21,309,881 18,642,306
General 65,759,892 53,774,970 58,753,541 52,277,961
General commerce 192,758,058 159,870,596 139,729,100 133,869,178
Government 265,754,095 169,073,246 265,300,462 168,626,536
Information And communication 118,887,314 121,177,114 114,360,925 118,922,511
Other Manufacturing (Industries) 98,361,843 72,850,211 77,233,498 57,301,618
Basic Metal Products 2,978,984 2,682,493 2,978,984 2,682,493
Cement 26,141,390 26,147,216 26,141,390 26,147,216
Conglomerate 31,074,505 14,766,577 31,074,505 14,766,577
Steel Rolling Mills 65,431,551 53,920,584 65,431,551 53,920,584
Flourmills And Bakeries 5,045,937 13,642 5,045,937 13,642
Food Manufacturing 29,921,021 15,094,847 22,140,950 14,642,665
Oil And Gas - Downstream 155,875,311 137,651,684 130,605,016 115,343,768
Oil And Gas - Services 204,208,802 117,106,760 201,268,821 115,659,696
Oil And Gas - Upstream 105,211,512 61,020,646 105,211,512 61,020,646
Crude oil refining 33,386,262 28,860,271 33,386,262 28,860,271
Real estate activities 134,617,760 104,749,765 128,653,753 100,157,931
Transportation and storage 64,919,122 74,287,655 52,966,761 70,899,610
Power and energy 21,406,071 15,955,628 9,465,028 8,099,644
Professional, scientific and technical activities 3,229,824 7,474,460 1,913,153 6,727,525
Others 33,431,407 27,836,688 6,756,944 6,755,313
1,845,165,464 1,394,521,639 1,624,837,859 1,270,121,392
Balances included in Other Assets above are those subject to credit risks. The table above shows a worst-case scenario of credit risk exposure to the Group as at 31 December
2016 and 31 December 2015, without taking account of any collateral held or other credit enhancements attached.
The Directors are confident in their ability to continue to control exposure to credit risk which can result from both its Loans and Advances portfolio and debt securities.
Gross loans and advances to customers per sector is as analysed follows:
For on-balance-sheet assets, the exposures set out above are based on net amounts reported in the statements of financial position.
90

Access Bank Plc Consolidated financial statements For the year ended 31 December 2016 RISK MANAGEMENT FRAMEWORK
91
FINANCIAL RISK MANAGEMENT
Our Enterprise Risk Management Remains Custom-made
Helping our stakeholders achieve their ambitions lies at the heart of our processes as we apply bespoke
risk management framework in identifying, assessing, monitoring, controlling and reporting the inherent
and residual risks associated with the pursuit of these ambitions and ensuring they are achieved the right
way. We help in connecting our customers to opportunities through our avowed promise of speed, security
and service.
The Bank’s overall risk tolerance is established in the context of our earning power, capital and diversified
business model. The Bank’s organisational structure and business strategy is aligned with its risk
management philosophy.
As we navigate through new frontiers in a growth market in the ever-changing risk universe, proactive
Enterprise Risk Management Framework becomes even more critical. We continue to push the frontiers
of our overall risk profile whilst remaining responsive to the ever-changing risk universe.
Access Bank views and treats risks as an intrinsic part of business and maintains a disciplined approach
to its management of risk. Its Group Risk functions remain dynamic and responsive to the needs of
stakeholders as it improves its focus on the inter-relationships between risk types. It uses periodic reviews
of risk exposure limits and risk control to position itself against adverse scenarios. This is an invaluable
tool with which the bank predicted and successfully managed the headwinds – local and global – which
continued to impact the macroeconomy in the first half of 2016. Market volatility and economic
uncertainty, as witnessed in 2008, are typically contained because the Group regularly subjects its
exposures to a range of stress tests across a wide variety of products, currencies, portfolios and customer
segments.
The Bank’s risk management architecture, as designed, continued to balance corporate oversight with
well-defined risk management functions which fall into one of three categories where risk must be
managed: lines of business, governance and control, and corporate audit. The Board of Directors and
management of the Bank are committed to constantly establishing, implementing and sustaining tested
practices in risk management to match those of leading international banks. We are convinced that the
long-term sustainability of our Group depends critically on the proper governance and effective
management of our business. As such, risk management occupies a significant position of relevance and
importance in the Bank.
Risk strategies and policies are set by the Board of Directors of Access Bank. These policies, which define
acceptable levels of risk for day-to-day operations as well as the willingness of Access Bank to assume risk,
weighed against the expected rewards are detailed in the Enterprise Risk Management (ERM) Framework,
which is a structured approach to identifying opportunities, assessing the risk inherent in these
opportunities and actively managing these risks in a cost-effective manner. Specific policies are also in
place for managing risks in the different core risk areas of credit, market and operational risks as well as
for other key risks such as liquidity, strategic and reputational risks.

Access Bank Plc Consolidated financial statements For the year ended 31 December 2016 RISK MANAGEMENT FRAMEWORK
92
The role of the Group Chief Risk Officer in Access Bank remains pivotal as he has the primary responsibility
for the overall risk management and effective ERM Framework of both the Bank and its subsidiaries. He
provides robust challenge to the management teams based on quantitative and qualitative metrics. Though
amendments to the Bank’s ERM Framework require Board approval, the risk management division is
responsible for the enforcement of the Bank’s risk policy by constantly monitoring risk, with the aim of
identifying and quantifying significant risk exposures and acting upon such exposures as necessary.
Risk Management in Access Bank Plc. has become a culture and everyone, from the most junior officer to
the Executive Management has cultivated the risk culture. The bank officers approach every banking
transaction with care, taking into consideration the bank’s acceptable risk appetite.
To some institutions, risk is viewed as a threat or uncertainty, but to us, it goes beyond that. Risk to us,
presents potential opportunities to grow and develop our business within the context of our clearly
articulated and Board-driven risk appetite. Hence our approach to risk management is not limited to
considering downside impacts or risk avoidance; it also encompasses taking risk knowingly for competitive
advantage. Access Bank approaches risk, capital and value management robustly and we believe that our
initiatives to date have positioned the Group at the leading edge of risk management.
Risk Management Framework
All activities and processes of Access Bank, involve the identification, measurement, evaluation,
acceptance and management of risk or combinations of risks. The Board, advised by the various Board
and Management Risk Committees, requires and encourages a strong risk governance culture which
shapes the Group’s attitude to risk. We believe that risk management encompasses the insights delivered
by information which facilitate appropriate actions. Access Bank benefits from having enhanced its Group
risk management framework, which gives full Group-wide coverage of a variety of risks. Our annual risk
cycle is designed to give management relevant, up-to-date information from which trends can be observed
and assessed. The governance structure supporting our risk cycle is designed to deliver the right
information, at the right time, to the right people.
Here in Access Bank, we have a holistic view of all major risks facing the bank. We remain vigilant with
regard to both known and emerging risks and ensure that we are strong enough to withstand any
exogenous shocks. Our Board-level risk committees play a critical role in providing oversight of risk
management and ensuring that our risk appetite, risk culture and risk profile are consistent with and
support our strategy to deliver long-term, sustainable success in achieving our strategic vision of being the
world’s most respected African Bank.
Risk, by definition, is dynamic in nature. The management of risk, consequently, must be evolving,
necessitating regular review of the effectiveness of each enterprise risk management component. It is in
the light of this that Access Bank’s ERM Framework is subject to continuous review to ensure effective and
cutting-edge risk management. The review is done in both of the following ways: via continuous self-
evaluation and monitoring by the risk management and compliance functions in conjunction with internal
audit; and through independent evaluation by external auditors, examiners and consultants.

Access Bank Plc Consolidated financial statements For the year ended 31 December 2016 RISK MANAGEMENT FRAMEWORK
93
We are running an automated and workflow-driven approach to managing, communicating, and
implementing Governance, Risk Management and Compliance (GRC) policies and procedures across the
Bank. This provides an integrated and flexible platform for documenting and analysing risks, developing
mitigation plans, defining controls, and managing ongoing risk assessments. It provides clear visibility on
key risk indicators, assessment results, and compliance initiatives with integrated reporting of self-
assessments, independent assessments, and automated controls.
We believe that understanding and managing our risks and continuously improving our controls are
central to the delivery of our strategic objectives. The Board’s risk committees play an active role in
ensuring that we undertake well-measured, profitable risk-taking activities that support long-term
sustainable growth.
Balancing Risk and Return
Balancing risk and return and taking cognisance of the capital required demands rigorous analysis. The
ultimate aim is to optimize the upside and minimize the downside with a view to adding value to our
shareholders, and providing security to our other capital providers and clients, as well as ensuring overall
sustainability in our business activities.
Every business activity in our Group requires us to put capital at risk in exchange for the prospect of
earning a return. In some activities, the level of return is quite predictable, whereas in other activities the
level of return can vary over a very wide spectrum, ranging from a loss to a profit. Accordingly, over the
past year we have expended substantial energy on improving our risk and capital management framework,
to focus on taking risks where we:
Understand the nature of the risks we are taking, and what the range of outcomes could be under
various scenarios, for taking these risks;
Understand the capital required in order to assume these risks;
Understand the range of returns that we can earn on the capital required to back these risks; and
Attempt to optimize the risk-adjusted rate of return we can earn, by reducing the range of
outcomes and capital required arising from these risks, and increasing the certainty of earning an
acceptable return.
Our objective of balancing risk, return and capital has led us to enhance substantially our risk management
methodologies, in order to be able to identify threats, uncertainties and opportunities and in turn develop
mitigation and management strategies to achieve an optimal outcome.
Value is added for shareholders if our process allows us to demonstrate sustainable risk-adjusted returns
in excess of our cost of capital. The process provides security to our capital providers and clients by
assuring them that we are not taking on incremental risks which adversely affect the outcomes we have
contracted to deliver to them.

Access Bank Plc Consolidated financial statements For the year ended 31 December 2016 RISK MANAGEMENT FRAMEWORK
94
Enterprise-wide Scenario and Stress Testing
We use robust and appropriate scenario stress testing to assess the potential impact on the Group’s capital
adequacy and strategic plans. Our stress testing and scenario analysis programme is central to the
monitoring of strategic and potential risks. It highlights the vulnerabilities of our business and capital
plans to the adverse effects of extreme but plausible events. As a part of our core risk management
practices, the Bank conducts enterprise-wide stress tests on a periodic basis to better understand earnings,
capital and liquidity sensitivities to certain economic scenarios, including economic conditions that are
more severe than anticipated. The outcome of the testing and analysis is also used to assess the potential
impact of the relevant scenarios on the demand for regulatory capital compared with its supply. These
enterprise-wide stress tests provide an understanding of the potential impacts on our risk profile, capital
and liquidity. It generates and considers pertinent and plausible scenarios that have the potential to
adversely affect our business.
Stress testing and scenario analysis are used to assess the financial and management capability of Access
Bank to continue operating effectively under extreme but plausible trading conditions. Such conditions
may arise from economic, legal, political, environmental and social factors. Scenarios are carefully selected
by a group drawn from senior line of business, risk and finance executives. Impacts on each line of business
from each scenario are then analyzed and determined, primarily leveraging the models and processes
utilized in everyday management routines.
Impacts are assessed along with potential mitigating actions that may be taken in each scenario. Analysis
from such stress scenarios is compiled for and reviewed through our Group ALCO, and the Enterprise Risk
Management Committee and serves to inform and be incorporated, along with other core business
processes, into decision making by management and the Board. The Bank would continue to invest in and
improve stress testing capabilities as a core business process.
Risk Analytics and Reporting
The Bank’s Risk Analytics and Reporting Group continues to champion the development and entrenchment
of integrated data architecture to enhance risk analytics and reporting within the enterprise-wide risk
management (ERM) space in Access Bank. The Group has aligned its governance and functions to that of
leading global financial institutions and also considered all contents as seen in most jurisdictions where
risk management is best practised.
The group gives Risk management space a critical depth and dimension in its risk management activities
as it relates to data management and integration. The group is responsible for enhancing all core risk
analytical and reporting functions that previously resided in the respective risk areas within our Enterprise-
wide Risk Management (ERM), while the Bank’s pre-defined governance structures in respect of the above-
mentioned functions is retained by the respective risk groups.
The group remains the key driver in ensuring that Access Bank fully implements Basel II/III to the most
advance levels in alignment with the Central Bank of Nigeria (CBN) prudential guidelines. The team is also

Access Bank Plc Consolidated financial statements For the year ended 31 December 2016 RISK MANAGEMENT FRAMEWORK
95
responsible for the Internal Capital Adequacy Assessment Process (ICAAP), stress testing, Liquidity Risk
measurement and other risk measurement activities. The group aligns its reporting with the Bank’s
predefined government structure such as BRMC, BCC and ERMC.
The functional set up of the Risk Analytics and Reporting group is as follows:
Data management and integration
Integrated Risk Analytics
Integrated Risk Reporting
Data Management and Integration.
This unit is responsible for the development and maintenance of the enterprise Risk data architecture with
a roadmap geared to promoting data integrity, data quality and ensuring integration with risk analytics and
reporting.
The group has a data governance structure which enforces risk data governance and discipline across the
Bank as well as data quality measurement metrics to reduce the Bank’s risk exposure due to data quality
issues.
An efficient structure has been put in place to ensure auto-reconciliation of data across risk and finance
silos to improve timeliness and consistency of risk reporting. The group is in the process of developing a
data structure model which will support the risk analytics and reporting activities, thus driving
improvements.
Integrated Risk Analytics
The group guides the analytical input into the implementation of various risk software and their on-going
implementation in Credit risk, Market risk, Operational risk and other risk areas. The unit also drives the
development as well as implementation of the internal and regulatory risk measurement methodology and
models for the core risk elements; examples of the model are Rating models, Scoring models, Probability of
Default (PD), Loss Given Default (LGD) and Exposure At Default (EAD) ,etc.
The unit designs stress test models and implements the same on the Bank’s portfolios and risk profile as
well as comprehensive risk analyses to provide insight into all current Strategic Business Unit (SBU) risk
profiles. The group also drives the full implementation of Basel II/III and manages the Internal Adequacy
Assessment Process (ICAAP).
In 2015, the group deepened the Risk Embedded Performance Management Frame work as part of the
process of maintaining and aligning behaviours with the Bank’s moderate risk appetite. Business
performance will subsequently be monitored with a focus on financial performance and risk exposures
being aligned with the Bank’s risk appetite. The 2016 Budget was built with risk appetite as an integral part
of the financial target determination. Varieties of triggers were employed and an automated process was
created to efficiently track compliance and apply a risk charge to the various SBUs where there are
deviations.

Access Bank Plc Consolidated financial statements For the year ended 31 December 2016 RISK MANAGEMENT FRAMEWORK
96
Stress Testing Forum
Integrated Risk Reporting.
The group strives to improve all in-house analytical reporting of risk management in the bank and stimulate
a culture of data-driven analytical insights for every decision impacting all risk touch points in the risk
management process.
The quality of risk reporting was also enhanced in 2015 by implementing an automated risk reporting
system known as the Risk Management Report Portal and the subsequent inclusion of the Subsidiary Risk
Management portal. This has led to easy and timely access to risk reports, provided early warning signals,
better limit monitoring and better decision making for all units across risk management.
Stress testing framework
Our stress testing framework is designed to:
• contribute to the setting and monitoring of risk appetite
• identify key risks to our strategy, financial position, and reputation
• examine the nature and dynamics of the risk profile and assess the impact of stresses on our
profitability and business plans
• ensure effective governance, processes and systems are in place to co-ordinate and integrate stress
testing
• inform senior management
• ensure adherence to regulatory requirements
Country Stress
Testing
Business
Stress
Testing
Risk Type Stress
Testing
Scenario
Selection
Analysis and
Impact
Assessment
Management
Action

Access Bank Plc Consolidated financial statements For the year ended 31 December 2016 RISK MANAGEMENT FRAMEWORK
97
Risk Management Philosophy, Culture, Appetite and Objectives
Access Bank’s Risk Culture Statement:
At Access Bank, we embrace a moderate risk appetite, whilst delivering strategic objectives. We anticipate
the risks in our activities. We reward behaviour that aligns with our core values, controls and regulations.
Challenges are discussed in an open environment of partnership and shared responsibility.
Access Bank’s Risk management philosophy and culture remain fundamental to the delivery of our
strategic objectives. Risk management is at the core of the operating structure of the group. We seek to
limit adverse variations in earnings and capital by managing risk exposures within our moderate risk
appetite. Our risk management approach includes minimizing undue concentrations of exposure, limiting
potential losses from stress events and the prudent management of liquidity.
The Bank’s acclaimed risk management process has continued to achieve desired results as evidenced by
improved risk ratios and independent risk ratings. In line with the Group’s core value of excellence, the
Group’s risk management is continuously evolving and improving, given that there can be no assurance
that all market developments, in particular those of extreme nature, can be fully anticipated at all times.
Hence, executive management has remained closely involved with important risk management initiatives,
which have focused particularly on preserving appropriate levels of liquidity and capital, as well as
managing the risk portfolios.
Risk management is fundamental to the Group's decision-making and management process. It is
embedded in the role of all employees via the organizational culture, thus enhancing the quality of
strategic, capital allocation and day-to-day business decisions.
Access Bank considers risk management philosophy and culture as the set of shared beliefs, values,
attitudes and practices that characterize how the Bank considers risk in everything it does, from strategy
development and implementation to its day-to-day activities. In this regard, the Bank’s risk management
philosophy is that a moderate and guarded risk attitude ensures sustainable growth in shareholder value
and reputation.
The Bank believes that enterprise risk management provides the superior capabilities to identify and assess
the full spectrum of risks and to enable staff at all levels to better understand and manage risks. This will
ensure that:
Risk acceptance is done in a responsible manner;
The executive and the Board of the Bank have adequate risk management support;
Uncertain outcomes are better anticipated;
Accountability is strengthened; and
Stewardship is enhanced.
The Bank identifies the following attributes as guiding principles for its risk culture.
a) Management and staff:
Consider all forms of risk in decision-making;

Access Bank Plc Consolidated financial statements For the year ended 31 December 2016 RISK MANAGEMENT FRAMEWORK
98
Create and evaluate business-unit and Bank-wide risk profile to consider what is best for
their individual business units/department and what is best for the Bank as a whole;
Adopt a portfolio view of risk in addition to understanding individual risk elements;
Retain ownership and accountability for risk and risk management at the business unit or
other point of influence level;
Accept that enterprise risk management is mandatory, not optional;
Strive to achieve best practices in enterprise risk management;
Document and report all significant risks and enterprise-risk management deficiencies;
Adopt a holistic and integrated approach to risk management and bring all risks together
under one or a limited number of oversight functions;
Empower risk officers to perform their duties professionally and independently without
undue interference;
Ensure a clearly defined risk management governance structure;
Ensure clear segregation of duties between market facing business units and risk
management/control functions;
Strive to maintain a conservative balance between risk and profit considerations; and
Continue to demonstrate appropriate standards of behaviour in development of strategy
and pursuit of objectives.
b) Risk officers’ partners with other stakeholders within and outside the Bank and are guided in the
exercise of their powers by a deep sense of responsibility, professionalism and respect for other parties.
c) The bank also partners with its customers to improve their attitudes to risk management and encourage
them to build corporate governance culture into their business management
d) Risk management is governed by well-defined policies, which are clearly communicated across the
Bank.
e) Equal attention is paid to both quantifiable and non-quantifiable risks.
f) The Bank avoids products and businesses it does not understand.

Access Bank Plc Consolidated financial statements For the year ended 31 December 2016 RISK MANAGEMENT FRAMEWORK
99
Risk management process
Group risk oversight approach
Our risk governance framework, of which our risk appetite framework is a significant element, ensures the
appropriate oversight of and accountability for the effective management of risk. Our oversight starts with
the strategy setting and business planning process. These plans help us articulate our appetite for risk,
which is then set as risk appetite limits for each business unit to work within.
The Bank’s risk management function provides a central oversight of risk management across the Bank to
ensure that the full spectrum of risks facing the Bank are properly identified, measured, monitored and
controlled in order to minimize adverse outcomes.
The function is complemented by the financial control and strategy group in the management of strategic
and reputational risks.
The Chief Risk Officer coordinates the process of monitoring and reporting risks across the Bank. Internal
audit has the responsibility of auditing the risk management and control function to ensure that all units
Group Oversight Systems and Tools
Group Strategy and Business Planning
(Risk Appetite Limits and Policy Setting)
Risk and
Control Assess
ments
Risk Identifica
tion
Management
actions
Monit
oring
Risk report
ing
Risk Adjusted
Performance
Management
Capital Allocat
ion
(Risk Appetite Limits and Policy Setting)

Access Bank Plc Consolidated financial statements For the year ended 31 December 2016 RISK MANAGEMENT FRAMEWORK
100
charged with risk management perform their roles effectively on a continuous basis. Audit also tests the
adequacy of internal control and makes appropriate recommendations where there are weaknesses.
Strategy and Business Planning
Risk management is embedded in our business strategy and planning cycle. Testament to this is the
inclusion of risk management as one of our strategic priorities. By setting the business and risk strategy,
we are able to determine appropriate capital allocation and target setting for the Group and each of our
businesses.
All business units are required to consider the risk implications of their annual plans. These plans include
analysis of the impact of objectives on risk exposure. Throughout the year, we monitored business
performance regularly focusing both on financial performance and risk exposure. The aim is to continue
the process of integrating risk management into the planning and management process and to facilitate
informed decisions.
Through ongoing review, the links between risk appetite, risk management and strategic planning are
embedded in the business so that key decisions are made in the context of the risk appetite for each
business unit.
Risk Appetite
Risk appetite is an articulation and allocation of the risk capacity or quantum of risk Access Bank Group
is willing to accept in pursuit of its strategy, duly set and approved by the executive committee and the
Board, and integrated into our strategy, business, risk and capital plans. Risk appetite reflects the Group’s
capacity to sustain potential losses arising from a range of potential outcomes under different stress
scenarios.
The Bank defines its risk appetite in terms of both volatility of earnings and the maintenance of minimum
regulatory capital requirements under stress scenarios. Our risk appetite can be expressed in terms of how
much variability of return the Bank is prepared to accept in order to achieve a desired level of result. It is
determined by considering the relationship between risk and return. We measure and express risk appetite
qualitatively and in terms of quantitative risk metrics. The quantitative metrics include earnings at risk (or
earnings volatility), Liquidity and economic capital adequacy. In addition, a large variety of risk limits,
triggers, ratios, mandates, targets and guidelines are in place for all the financial risks (e.g. credit, market
and asset and liability management risks).
The Bank’s risk profile is assessed through a ‘bottom-up’ analytical approach covering all of the Group’s
major businesses and products. The risk appetite is approved by the Board and forms the basis for
establishing the risk parameters within which the businesses must operate, including policies,
concentration limits and business mix.
In 2015, the risk appetite metrics were tracked against approved triggers and exceptions were reported to
management for prompt corrective actions. Key issues were also escalated to the Enterprise Risk
Management committee and the Board Risk Management Committee.

Access Bank Plc Consolidated financial statements For the year ended 31 December 2016 RISK MANAGEMENT FRAMEWORK
101
Risk management objectives
The broad risk management objectives of the Bank are:
o To identify and manage existing and new risks in a planned and coordinated manner with
minimum disruption and cost;
o To protect against unforeseen losses and ensure stability of earnings;
o To maximize earnings potential and opportunities;
o To maximize share price and stakeholder protection;
o To enhance credit ratings and depositor, analyst, investor and regulator perception; and
o To develop a risk culture that encourages all staff to identify risks and associated
opportunities and to respond to them with cost effective actions.
Scope of risks
The scope of risks that are directly managed by the Bank is as follows:
Credit risk
Operational risk
Market and liquidity risk
Legal and compliance risk
Strategic risk
Reputational risk
Capital risk
These risks and the framework for their management are detailed in the enterprise risk management
framework.
Responsibilities and functions
The responsibilities of the Risk Management Division, the Financial Control and Strategy Group, and other
key stakeholders with respect to risk management are highlighted below:
Risk Management Division
a) Champion the implementation of the ERM Framework across the Bank and subsidiaries. Periodically
receive risk reports from management highlighting key risk areas, control failures and remedial action
steps taken by management.
b) Develop risk policies, principles, process and reporting standards that define the Bank’s risk strategy
and appetite in line with the Bank’s overall business objectives.
c) Ensure that controls, skills and systems are in place to enable compliance with the Bank’s policies and
standards.

Access Bank Plc Consolidated financial statements For the year ended 31 December 2016 RISK MANAGEMENT FRAMEWORK
102
d) Facilitate the identification, measurement, assessment, monitoring and control of the level of risks in
the Bank.
e) Embed risk culture in the Bank to ensure that everyone in the bank takes into consideration Access Bank
risk appetite in whatever they do.
f) Collect, process, verify, monitor and distribute risk information across the Bank and other material risk
issues to senior management, the Board and regulators.
g) Monitor compliance with bank-wide risk policies and limits.
h) Empower Business unit risk champion to identify, monitor and report on the effectiveness of risk
mitigation plans in reducing risk incidence as related to day to day activities in the unit.
i) Ensure that laws, regulations and supervisory requirements are complied with including consequence
management.
j) Champion the implementation of Basel II and III.
k) Promote risk awareness and provide education on risk.
l) Provide assurance on compliance with internal and external policies with respect to risk management.
Financial Control and Strategy
a) Prepare and monitor the implementation of the Bank’s strategic plan
b) Conduct strategic and operational review of the Bank’s activities
c) Conduct regular scanning of the Bank’s operating environment
d) Coordinate and monitor the Bank’s rating exercises by external rating agencies
e) Prepare business intelligence reports for the Bank’s management
f) Prepare periodic management reports on subsidiaries and associates
g) Perform competitive analysis in comparison with industry peers
h) Conduct strategic/operational review of branches
Risk Management Governance Framework
The framework details Access Bank’s risk universe and governance structure comprising three distinct
layers:
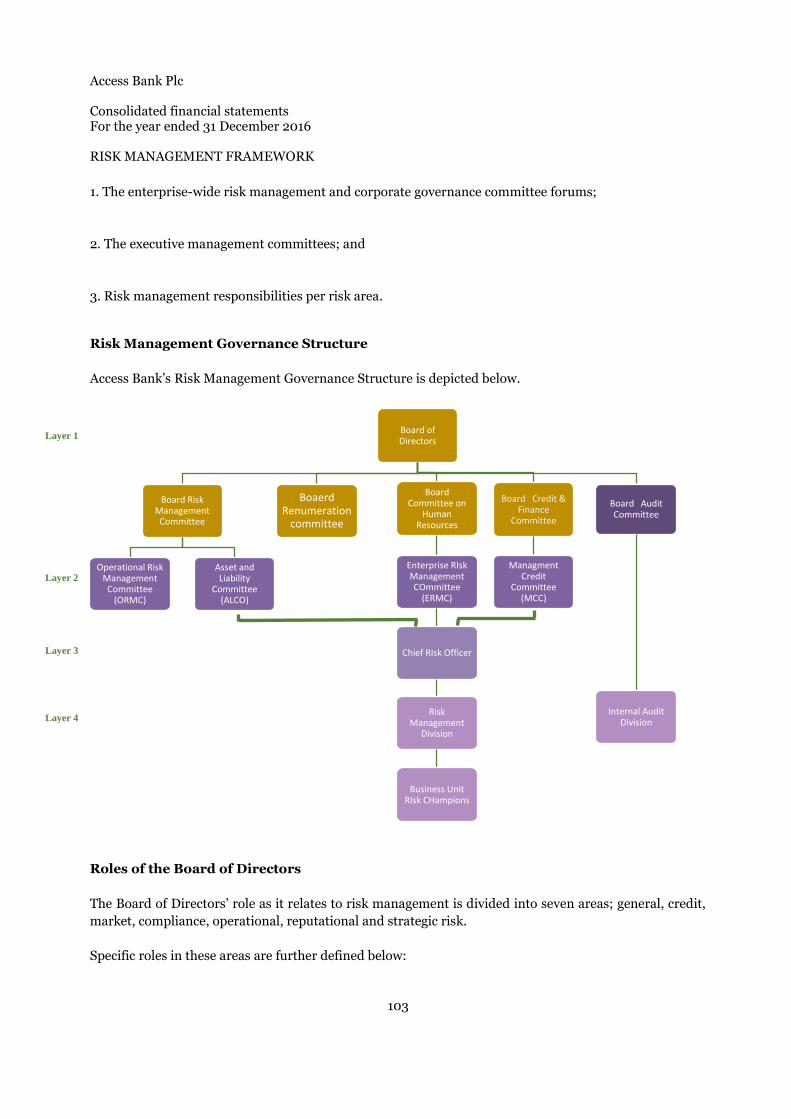
Access Bank Plc Consolidated financial statements For the year ended 31 December 2016 RISK MANAGEMENT FRAMEWORK
103
1. The enterprise-wide risk management and corporate governance committee forums;
2. The executive management committees; and
3. Risk management responsibilities per risk area.
Risk Management Governance Structure
Access Bank’s Risk Management Governance Structure is depicted below.
Roles of the Board of Directors
The Board of Directors’ role as it relates to risk management is divided into seven areas; general, credit,
market, compliance, operational, reputational and strategic risk.
Specific roles in these areas are further defined below:
Board of Directors
Board Risk Management
Committee
Operational Risk Management
Committee (ORMC)
Asset and Liability
Committee (ALCO)
Board Committee on
Human Resources
Enterprise RIsk Management COmmittee
(ERMC)
Chief RIsk Officer
Risk Management
Division
Business Unit RIsk CHampions
Board Credit & Finance
Committee
Managment Credit
Committee (MCC)
Board Audit Committee
Internal Audit Division
Boaerd Renumeration
committee
Layer 1
Layer 2
Layer 3
Layer 4

Access Bank Plc Consolidated financial statements For the year ended 31 December 2016 RISK MANAGEMENT FRAMEWORK
104
General
a) Develop a formal enterprise-risk management framework;
b) Review and approve the establishment of a risk management function that would independently
identify, measure, monitor and control risks inherent in all risk-taking units of the Bank;
c) Ratify the appointment of qualified officers to manage the risk management function;
d) Approve and periodically review the Bank’s risk strategy and policies;
e) Approve the Bank’s risk appetite and monitor the Bank’s risk profile against this appetite;
f) Ensure that the management of the Bank has an effective ongoing process to identify risk, measure
its potential impact and proactively manage these risks;
g) Ensure that the Bank maintains a sound system of risk management and internal control with
respect to:
Efficiency and effectiveness of operations
Safeguarding of the Banks assets (including information)
Compliance with applicable laws, regulations and supervisory requirements
Reliability of reporting
Behaving responsibly towards all stakeholders
h) Ensure that a systematic, documented assessment of the processes and outcomes surrounding key
risks is undertaken at least annually;
i) Ensure that management maintains an appropriate system of internal control and review its
effectiveness;
j) Ensure risk strategy reflects the Bank’s tolerance for risk;
k) Review and approve changes/amendments to the risk management framework;
l) Review and approve risk management procedures and control for new products and activities; and
m) Periodically receive risk reports from management highlighting key risk areas, control failures and
remedial action steps taken by management.
Credit Risk
a) Approve the Bank’s overall risk tolerance in relation to credit risk based on the recommendation
of the Chief Risk Officer;

Access Bank Plc Consolidated financial statements For the year ended 31 December 2016 RISK MANAGEMENT FRAMEWORK
105
b) Ensure that the Bank’s overall credit risk exposure is maintained at prudent levels and consistent
with the available capital through quarterly review of various types of credit exposure;
c) Ensure that top management as well as individuals responsible for credit risk management
possess the requisite expertise and knowledge to accomplish the risk management function;
d) Ensure that the Bank implements a sound methodology that facilitates the identification,
measurement, monitoring and control of credit risk;
e) To put in place effective internal policies, systems and controls to identify, measure monitor, and
control credit risk concentrations.
f) Ensure that detailed policies and procedures for credit risk exposure creation, management and
recovery are in place; and
g) Appoint credit officers and delegate approval authorities to individuals and committees.
Market risk
a) Define the Bank’s overall risk appetite in relation to market risk;
b) Ensure that the Bank’s overall market risk exposure is maintained at levels consistent with the
available capital;
c) Ensure that top management as well as individuals responsible for market risk management
possess sound expertise and knowledge to accomplish the risk management function;
d) Approve the Bank’s strategic direction and tolerance level for liquidity risk;
e) Ensure that the Bank’s senior management has the ability and required authority to manage
liquidity risk;
f) Approve the Bank’s liquidity risk management framework; and
g) Ensure that liquidity risk is identified, measured, monitored and controlled.
Compliance risk
a) Approve the Bank’s code of conduct and ethics;
b) Monitor the Bank’s compliance with laws and regulations, its code of conduct and ethics and
corporate governance practices;

Access Bank Plc Consolidated financial statements For the year ended 31 December 2016 RISK MANAGEMENT FRAMEWORK
106
c) Ensure new and changed legal and regulatory requirements are identified, monitored and
reflected in Bank processes;
d) Approve the compliance structure, mechanisms and processes established by management to
ensure compliance with current laws, regulations and supervisory requirements; and
e) Ensure the Bank has a compliance culture that contributes to the overall objective of risk
management
Operational risk
a) Oversee the overall governance of the Bank’s operational risk management process;
b) Set the Bank’s operational risk strategy and direction in line with the Bank’s corporate strategy;
c) Approve the Bank’s operational risk management framework;
d) Periodically review the framework to ensure its relevance and effectiveness;
e) Ensure that senior management is performing their risk management responsibilities; and
f) Ensure that the Bank’s operational risk management framework is subject to effective and
comprehensive internal audit by operationally independent, appropriately trained and competent staff.
Reputational risk
a) Set an appropriate tone and guidelines regarding the development and implementation of effective
reputation risk management practices, including an explicit statement of a zero tolerance policy for all
unethical behaviour;
b) Approve the Bank’s framework for the identification, measurement, control and management of
reputational risk;
c) Monitor the Bank’s compliance with its reputational risk management policies and recommend
sanctions for material breaches of internal policies;
d) Review all exception reports by external parties such as regulators and auditors; ensure that
appropriate sanctions are applied to erring officers; demand from management appropriate explanations
for all exceptional items; ensure that management puts in place effective and remedial actions and reports
on progress to the Board on an on-going basis;
e) Ensure that Board members do not compromise their fit and proper status with regulators. They
shall ensure that only Board members who do not tarnish the Bank’s image and reputation remain as
members; and
f) Ensure that only fit and proper persons are appointed to senior management positions in the
Bank.
Access Bank Plc Consolidated financial statements For the year ended 31 December 2016 RISK MANAGEMENT FRAMEWORK
107
Strategic Risk
a) Oversee the strategic risk management process.
b) Ensure that the bank has in place an appropriate strategic risk management framework
which suits its own circumstances and needs;
c) Ensure that the strategic goals and objectives are set in line with its corporate mission and
values, culture, business direction and risk tolerance;
d) Approve the strategic plan (including strategies contained therein) and any subsequent
changes, and review the plan (at least annually) to ensure its appropriateness;
e) Ensure the organization’s structure, culture, infrastructure, financial means, managerial
resources and capabilities, as well as systems and controls are appropriate and adequate
to support the implementation of its strategies.
f) Review high-level reports periodically submitted to the Board on the overall strategic risk
profile, and ensure that any material risks and strategic implications identified from those
reports are properly addressed; and
g) Ensure that senior management is competent in implementing strategic decisions
approved by the Board, and supervising such performance on a continuing basis
The Board and management committees
The Board of director is the highest approval authority for credit risk policies and credit facilities in Access
Bank. It carries out its oversight function through its standing committees each of which has a charter that
clearly defines its purpose, composition, structure, frequency of meetings, duties, tenure, and reporting
lines to the Board.
In line with best practice, the Chairman of the Board does not seat on any of the Committees. The Board
has four standing committees namely: the Board Risk Management Committee, the Board Audit
Committee, the Board Human Resources Committee and the Board Credit & Finance Committee.
The management committees which exists in the Bank includes: The Executive Committee (EXCO),
Enterprise Risk Management Committee (ERMC), Management Credit Committee (MCC), Group Asset &
Liability Committee (Group ALCO), and Operational Risk Management Committee (ORMC).
Without prejudice to the roles of these committees, the full Board retains ultimate responsibility for risk
management.
Specific roles of the Board and management committees
The Board’s risk management oversight roles and responsibilities are delegated to the following
committees:

Access Bank Plc Consolidated financial statements For the year ended 31 December 2016 RISK MANAGEMENT FRAMEWORK
108
Credit Risk Management
Credit risk arises from the failure of an obligor of the Bank to repay principal or interest at the stipulated
time or failure otherwise to perform as agreed. This risk is compounded if the assigned collateral only
partly covers the claims made to the borrower, or if its valuation is exposed to frequent changes due to
changing market conditions (i.e. market risk).
The Bank’s Risk Management philosophy is that moderate and guarded risk attitude will ensure
sustainable growth in shareholder value and reputation. Extension of credit in Access Bank is guided by
its Credit Risk and Portfolio Management Plan, which sets out specific rules for risk origination and
management of the loan portfolio. The Plan also sets out the roles and responsibilities of different
individuals and committees involved in the credit process.
We recognise the fact that our main asset is our loan portfolio. Therefore, we actively safeguard and strive
to continually improve the health of our loan portfolio. We scrutinize all applications and weed out
potential problem loans during the loan application phase, as well as constantly monitor existing loan
portfolio.
The goal of the Bank is to apply sophisticated but realistic credit models and systems to monitor and
manage credit risk. Ultimately these credit models and systems are the foundation for the application of
internal rating-based approach to calculation of capital requirements. The development, implementation
and application of these models are guided by the Bank’s Basel II strategy.
The pricing of each credit granted reflects the level of risks inherent in the credit. Subject to competitive
forces, Access Bank implements a consistent pricing model for loans to its different target markets. The
client’s interest is guarded at all times, and collateral quality is never the sole reason for a positive credit
decision.
Provisions for credit losses meet IFRS and prudential guidelines set forth by the Central Bank of the
countries where we operate, both for loans for which specific provisions exist as well as for the portfolio of
performing loans. Access Bank’s credit process requires rigorous proactive and periodic review of the
quality of the loan portfolio. This helps us to identify and remediate credit issues proactively.
The Criticized Assets Committee performs a quarterly review of loans with emerging signs of weakness;
the Management Credit Committee and the Board Credit Committee also perform reviews of the quality
of our loan portfolio on a quarterly basis. These are in addition to daily reviews performed by the various
Head of Risk within the Credit Risk Management Groups.
Principal Credit Policies
The following are the principal credit policies of the Bank:
Credit Risk Management Policy: The core objective is to enable maximization of returns on a risk
adjusted basis from banking book credit risk exposures that are brought under the ambit of Credit Risk
Management Policy by putting in place robust credit risk management systems consisting of risk

Access Bank Plc Consolidated financial statements For the year ended 31 December 2016 RISK MANAGEMENT FRAMEWORK
109
identification, risk measurement, setting of exposure & risk limits, risk monitoring & control and reporting
of credit risk in the banking book.
Credit Risk Mitigant Management Policy: The objective is to aid in effective credit portfolio
management through mitigation of credit risks by using credit risk mitigation techniques.
Credit Risk Rating Policy: The objective of this policy is to ensure reliable and consistent Obligor Risk
Ratings (ORRs) and Facility Risk Ratings (FRRs) throughout Access Bank and to provide guidelines for
risk rating for retail and non-retail exposures in the banking book covering credit and investment books
of the Bank.
Country and Cross Border Risk Management Policy: The objective of this policy is to establish a
consistent framework for the identification, measurement and management of country risk across Access
Bank.
Internal Capital Adequacy Assessment Process (ICAAP) Policy: The objectives of the policy are
identification of material risks, measurement of material risks, monitoring & control of material risks and
reporting of material risks.
Enterprise-wide Risk Management Policy: The core objective is to provide reasonable degree of
assurance to the Board of Directors that the risks threatening the Bank’s achievement of its vision are
identified, measured, monitored and controlled through an effective integrated risk management system
covering credit, market, operational, interest rate, liquidity and other material risks.
Responsibilities of Business Units and Independent Credit Risk Management
In Access Bank, Business units and independent credit risk management have a joint responsibility for the
overall accuracy of risk ratings assigned to obligors and facilities. Business Relationship Managers will be
responsible for deriving the ORR and FRR using approved methodologies as set out in this policy, however
independent credit risk management will validate such ratings.
Notwithstanding who derives the risk rating, Credit Risk Management is responsible for reviewing and
ensuring the correctness of the ORR and FRR assigned to a borrower and facilities. This review includes
ensuring the ongoing consistency of the business’ Risk Rating Process with Access Bank Risk Rating Policy;
ongoing appropriate application of the Risk Rating Process and tools; review of judgmental and qualitative
inputs into the Risk Rating Process; ensuring the timeliness and thoroughness of risk rating reviews; and
ensuring that the documentation of the Risk Rating Process is complete and current.
Credit Risk Management has the final authority if there is a question about a specific rating.
Credit Process
The Bank’s credit process starts with portfolio planning and target market identification. Within
identified target markets, credits are initiated by relationship managers. The proposed credits are

Access Bank Plc Consolidated financial statements For the year ended 31 December 2016 RISK MANAGEMENT FRAMEWORK
110
subjected to review and approvals by applicable credit approval authorities. Further to appropriate
approvals, loans are disbursed to beneficiaries.
On-going management of loans is undertaken by both relationship management teams and our Credit Risk
Management Group. The process is applied at the Head Office and in the subsidiaries.
If a preliminary analysis of a loan request by the account manager indicates that it merits further scrutiny,
it is then analyzed in greater detail by the account manager, with further detailed review by Credit Risk
Management. The concurrence of Credit Risk Management must be obtained for any credit extension. If
the loan application passes the detailed analysis it is then submitted to the appropriate approval authority
for the size and risk rating of facilities
The standard credit evaluation process is based both on quantitative figures from the Financial Statements
and on an array of qualitative factors. Factual information on the borrower is collected as well as pertinent
macroeconomic data, such as an outlook for the relevant sector, etc. These subjective factors are assessed
by the analyst and all individuals involved in the credit approval process, relying not only on quantitative
factors but also on extensive knowledge of the company in question and its management.
Credit Risk Measurement
Risk Rating Methodology
The credit rating of the counterparty plays a fundamental role in final credit decisions as well as in the
terms offered for successful loan applications. Access Bank employs a robust credit rating system based
on international best practices (including Basel II recommendations) in the determination of the Obligor
and Facility risks and thus allows the bank to maintain its asset quality at a desired level.
In Access Bank, the objective of the Risk Rating Policy is to ensure reliable and consistent Obligor Risk
Ratings (‘ORRs’) and Facility Risk Ratings (‘FRRs’) throughout the Bank and to provide guidelines for risk
rating for retail and non – retail exposures in the bank.
The Risk rating policy incorporates credit risk rating models which estimate risk of obligor default and
facility risks (covering both recovery as well as exposure risk). These models are currently based on expert
judgment for Retail and Non-Retail Exposures. Our goal is to adopt the Internal Rating Based (“IRB”)
approach. The data required to facilitate the IRB approach are being gathered.
All Access Bank businesses that extend credit are subject to the Risk Rating Policy.
Credit Risk Rating Models in Access Bank Plc
The following are the credit risk rating models deployed by Access Bank.
For Retail Exposures:
Obligor Risk Rating (ORR) Models have been developed for:
1. Personal Loans
2. Credit Cards

Access Bank Plc Consolidated financial statements For the year ended 31 December 2016 RISK MANAGEMENT FRAMEWORK
111
3. Auto Loans
4. Mortgage Loans
Facility Risk Rating (FRR) Models have been developed for:
1. Loss Given Default (LGD)
2. Exposure at Default (EAD)
For Non – Retail Exposures:
Obligor Risk Rating (ORR) Models have been developed for:
1. Sovereign (Approach to rating Sovereign Exposures using External ratings)
2. Bank and NBFIs
3. Corporate
- Manufacturing Sector
- Trading Sector
- Services Sector
- Real Estate Sector
4. Small and Medium Enterprises (SME) Without Financials
Facility Risk Rating (FRR) Models have been developed for
1. Loss Given Default (LGD)
2. Exposure at Default (EAD)
Risk Rating Process
In Access Bank, all businesses must have a documented and approved Risk Rating Process for deriving
risk ratings for all obligors and facilities (including those covered under Credit Programs). The Risk Rating
Process is the end-to-end process for deriving ORRs and FRRs and includes models, guidelines, support
adjustments, collateral adjustments, process controls, as well as any other defined processes that a
business undertakes in order to arrive at ORRs and FRRs. Risk rating process of each business must be in
compliance with the Bank’s Risk rating Policy and deviations must be explicitly approved.
Establishing the Risk Rating Process is the joint responsibility of the Business Manager and the Credit
Risk Manager associated with each business. The process must be documented and must be approved by
the Management Credit Committee.
The Risk Rating Process for each business must be reviewed and approved every three years, unless more
frequent review is specified as a condition of the approvals. Interim material changes to the Risk Rating
Process, as determined by the Credit Risk Manager for the business, must be re-approved.
Risk Rating Scale and external rating equivalent
Access Bank operates a 12-grade numeric risk rating scale. The risk rating scale runs from 1 to 8. Rating 1
represents the best obligors and facilities and rating 8 represents the worst obligors and facilities. The
risk rating scale incorporates sub-grades and full grades reflective of realistic credit migration patterns.

Access Bank Plc Consolidated financial statements For the year ended 31 December 2016 RISK MANAGEMENT FRAMEWORK
112
The risk rating scale and the external rating equivalent is detailed below:
Access Bank Risk Rating External Long term equivalent Grade
1 AAA Investment Grade
2+ AA
2 A
2- BBB
3+ BB+ Standard Grade
3 BB
3- BB-
4 B Non-Investment Grade
Credit Risk Control & Mitigation policy
Authority Limits on Credit
The highest credit approval authority is the Board of Directors, supported by the Board Credit Committee
and further by the Management Credit Committee. Individuals are also assigned credit approval
authorities in line with the Bank’s criteria for such delegation set out in its Credit Risk and Portfolio
Managament Plan. The principle of central management of risk and decision authority is maintained by
the Bank. The maximum amount of credit that may be approved at each subsidiary is limited, with
amounts above such limit being approved at the Head Office.
Potential credit losses from any given account, customer or portfolio are mitigated using a range of tools
such as collateral, credit insurance, credit derivatives and other guarantees. The reliance that can be placed
on these mitigants is carefully assessed in light of issues such as legal certainty and enforceability, market
valuation correlation and counterparty risk of the guarantor.
Where appropriate, credit derivatives are used to reduce credit risks in the portfolio. Due to their potential
impact on income volatility, such derivatives are used in a controlled manner with reference to their
expected volatility.
Collateral is held to mitigate credit risk exposures and risk mitigation policies determine the eligibility of
collateral types.
This structure gives Access Bank the possibility to incorporate much needed local expertise, but at the
same time manage risk on a global level. Local Credit Committees of the Bank’s subsidiaries are thus able
to grant credits, but the sum total of the exposure of the applicant and financially related counterparties is
limited, most commonly by the subsidiary’s capital. All applications that would lead to exposures
exceeding the set limit are referred to the appropriate approval authority in the Head Office.
The credit approval limits of the principal officers of the Group are shown in the table below

Access Bank Plc Consolidated financial statements For the year ended 31 December 2016 RISK MANAGEMENT FRAMEWORK
113
Authority Approval Limit
Group Managing Director N300,000,000
Group Deputy Managing Director N200,000,000
Group Executive Director N100,000,000
Managing Directors of the Bank’s subsidiaries N65,000,000
In addition, approval and exposure limits based on internal Obligor Risk Ratings have been approved by
the Board for the relevant credit committees as shown in the table below
Credit Rating by S&P
Board of Directors
Board Credit Committee Approval Limit
Management Credit Committee Approval Limit
1 AAA Single Obligor N30 Billion N15 Billion
2+ AA Single Obligor N25 Billion N12.5 Billion
2 A Single Obligor N10 Billion N2 Billion
2- BBB Single Obligor N10 Billion N1 Billion
3+ BB+ Single Obligor N10 Billion N500 Million
3 BB Single Obligor N10 Billion N500 Million
3- BB- Single Obligor Above N200 Million
4 B Single Obligor
5 B- Single Obligor
Collateral Policies
It is the Group’s policy that all credit exposures are adequately collateralised. Credit risk mitigation is an
activity of reducing credit risk in an exposure or transferring it to counterparty, at facility level, by a safety
net of tangible and realizable securities including approved third-party guarantees/ insurance.
In Access Bank, strategies for risk reduction at the transaction level differ from that at the portfolio level.
At transaction level, the most common technique used by the bank is the collateralization of the exposures,
by first priority claims or obtaining a third party guarantee. For all credit risk mitigants that meet the policy
criteria, a clear set of procedures are applied to ensure that the value of the underlying collateral is
appropriately recorded and updated regularly.
Collateral types that are eligible for risk mitigation include: cash; residential, commercial and industrial
property; fixed assets such as motor vehicles, aircraft, plant and machinery; marketable securities;
commodities; bank guarantees; and letters of credit.
Other techniques include buying a credit derivative to offset credit risk at transaction level. At portfolio
level, asset securitisation, credit derivatives etc. are used to mitigate risks in the portfolio.

Access Bank Plc Consolidated financial statements For the year ended 31 December 2016 RISK MANAGEMENT FRAMEWORK
114
However the primary consideration for approving credits is hinged largely on the obligor’s financial
strength and debt-servicing capacity. The guidelines relating to risk mitigant as incorporated in the
guidance note of BCBS on “Principles for the Management of Credit Risk” (September 2000, Paragraph
34) are be taken into consideration while using a credit risk mitigant to control credit risk.
“Bank can utilize transaction structure, collateral and guarantees to help mitigate risks (both identified
and inherent) in individual credits but transactions should be entered into primarily on the strength of the
borrower’s repayment capacity. Collateral cannot be a substitute for a comprehensive assessment of the
borrower or the counterparty, nor it can compensate for the insufficient information. It should be
recognized that any credit enforcement actions (e.g. foreclosure proceedings) can eliminate the profit
margin on the transaction. In addition, Banks need to be mindful that the value of collateral may well be
impaired by the same factors that have led to the diminished recoverability of the credit.” The acceptable
collaterals in the Bank includes:
The range of collaterals acceptable to the Bank includes:
Cash / Deposit (domestic and foreign currency) with bank including certificates of deposit or
comparable instruments issued by the bank.
Certificates of Deposit from other banks.
Commodities.
Debt securities issued by sovereigns and public-sector enterprises.
Debt securities issued by banks and corporations.
Equities - Stocks / Share Certificates of quoted blue chip companies
Mortgage on Landed Property
Asset-backed securities.
Charge on assets (Fixed and/or Floating) - premises/ inventory/ receivables/ merchandise/
plant/ machinery etc.
Negative Pledges
Lien on Asset being financed
Stock Hypothecation
Shipping Documents (for imports)
Bankers Acceptance
Life Assurance Policies

Access Bank Plc Consolidated financial statements For the year ended 31 December 2016 RISK MANAGEMENT FRAMEWORK
115
Master Netting Arrangements Traded Products
Credit risk from traded products is managed within the overall credit risk appetite for corporates and
financial institutions.
The credit risk exposure from traded products is derived from the positive mark-to-market value of the
underlying instruments, and an additional component to cater for potential market movements.
For derivative contracts, we limit our exposure to credit losses in the event of default by entering into
master netting agreements with certain counterparties. As required by IAS 32, exposures are only
presented net in the financial statement if there is a legal right to offset and the assets/liabilities will be
settled simultaneously.
It is the Group’s policy that all credit exposures are adequately collateralised. Credit risk mitigation is an
activity of reducing credit risk in an exposure
Provisioning policy
A loan or loan portfolio is impaired and impairment losses are incurred only if there is objective evidence
of impairment as a result of one or more events that occurred after initial recognition of the asset (a ‘loss
event’) and that loss event (or events) has an impact on the estimated future cash flows of the loan or loan
portfolio that can be reliably estimated.
Market Risk Management
Definition
Access Bank is faced with the risk of decline in its earnings and capital arising from adverse changes in
market variables; such as interest rate and foreign exchange rate. Market Risk is the risk that the value of
on/off-balance sheet positions will be adversely affected by movements in equity prices, interest rates,
currency exchange rates and commodity prices. Access Bank is exposed to market risk through the
positions created in its trading and banking books.
Market risk policy, management and control
Over the years, the Nigerian financial market has witnessed a dramatic expansion in the array of financial
services and products. This tremendous growth in scale and scope has also generated new risks with global
consequences, especially market risk, necessitating an assessment of exposures to the volatility of the
underlying risk drivers.
These developments have prompted a comprehensive and dynamic Market Risk Policy, ALM Policy,
Liquidity Policy, Stress Testing Policy, e.t.c. to ensure that risks faced across business activities and on an

Access Bank Plc Consolidated financial statements For the year ended 31 December 2016 RISK MANAGEMENT FRAMEWORK
116
aggregate basis are within the stipulated risk appetite of the Bank. These policies have been benchmarked
with industry and international best practices, and CBN regulations.
The Board approves the risk appetite for trading and non-trading activities and risk limits are set within
the context of the approved market risk appetite. Limits are set based on the approved risk appetite,
underlying liquidity as well as legal limitations on individual positions imposed by the regulatory
authorities in Nigeria. The specific limits are proposed by the Group Head, market risk management and
the Bank’s Chief Risk Officer and approved by the Bank’s Executive Management, relevant management
committees, and ultimately by the Board.
The Bank runs a state-of-the-art integrated and straight through processing treasury system for enabling
better measuring, monitoring and managing interest rate and foreign exchange risks in the bank.
Liquidity, Exchange Rate, and Interest Rate risks are managed through various metrics viz. Liquidity Gap
Analysis, Dynamic Cash Flow Analysis, Liquidity Ratios, Value at Risk (VaR), Earnings at Risk (EaR) and
Sensitivity Analysis. The primary aim of these processes is risk forecasting and impact mitigation through
management action and portfolio rebalancing.
The risk reporting mechanism in the Bank comprises disclosures and reporting to the various management
committees viz. Enterprise Risk Management Committee, Asset Liability Committee and the Board Risk
Management Committee. The Risk Committees receive daily/weekly risk dashboard and
monthly/quarterly reports which are presented at the committee meetings. Depending on the market
conditions and risk outlook, recommendations are made to the risk management committees in respect of
the market risk profile, risk appetite appraisal; as well as review of limits against actual position.
The Bank regularly conducts stress testing to monitor its vulnerability to unfavorable shocks. It monitors
and controls its risk, using various internal and regulatory risk limits for trading book and banking book
which are set according to a number of criteria including economic scenario, business strategy,
management experience, peer analysis and the Bank’s risk appetite.
In line with the CBN circular on new capital adequacy framework, Access Bank has adopted the
standardised duration approach for market risk and has obtained the board approval for the policy on
Internal Capital Adequacy Assessment Process (ICAAP). This policy defines and sets processes to review
and improve the techniques used for identification, measurement and assessment of all material risks and
resultant capital requirements.
Also, the bank has put in place a detailed plan for the full implementation for the Basel II & III frameworks
and has also put in place a road map for the migration to more advanced capital computation method
which factors in the actual loss experience of the bank.
Non-trading portfolio
The principal objective of market risk management of non-trading portfolios is to optimize net interest
income. Due to the size of the Bank’s holdings in rate-sensitive assets and liabilities, a major area of market
risk exposures in the bank is the interest rate on the banking book. This risk arises from the mismatch

Access Bank Plc Consolidated financial statements For the year ended 31 December 2016 RISK MANAGEMENT FRAMEWORK
117
between the future yield on assets and their funding cost, as a result of interest rate changes. The Bank
uses a variety of tools to track and manage this risk:
Re-pricing gap analysis (which allows the Bank to maintain a positive or negative gap depending upon the
forecast of interest rate position). The size of the gap is then adjusted to either hedge net interest income
against changing interest rates or to speculatively increase net interest income
Liquidity gap analysis
Earnings-at-Risk (EAR) using various interest rate forecasts
Sensitivity Analysis
Interest rate risk
Interest rate risk is the exposure of the Bank’s financial condition to adverse movements in interest rates,
yield curves and credit spreads. The Bank is exposed to interest rate risk through the interest bearing assets
and liabilities in its trading and banking books.
Re-pricing and Liquidity Gap Analysis
Access Bank’s objective for management of interest rate risk in the banking book is to ensure a higher
degree of interest rate mismatch margin stability and lower interest rate risk over an interest rate cycle.
This is achieved by hedging material exposures with the external market.
The Bank’s operations are subject to the risk of interest rate fluctuations to the extent that interest-earning
assets and interest-bearing liabilities mature or re-price at different times or in differing amounts. In the
case of floating rated assets and liabilities, the Bank is also exposed to basis risk, which is the difference in
re-pricing characteristics of the various floating rate indices, such as the savings rate and 90-day NIBOR
and different types of interest.
Non-traded interest rate risk arises in the banking book from the provision of retail and wholesale (non-
traded) banking products and services, as well as from certain structural exposures within the Group
balance sheet, mainly due to re-pricing timing differences between assets, liabilities and equity. These risks
impact both the earnings and the economic value of the Group. Overall non-trading interest rate risk
positions are managed by Treasury, which uses investment securities, advances to banks and deposits from
banks to manage the overall position arising from the Group’s non-trading activities.
Earnings-at-Risk (EAR) Approach
The principal tool used to measure and control market risk exposure within the Group’s trading portfolios
is the open position limits using the Earnings at Risk approach. Specified limits have been set for open
positions limits, which are the expected maximum exposure the Group is to be exposed to. Risk
management activities are aimed at optimizing net interest income, given market interest rate levels
consistent with the Bank’s business strategies.

Access Bank Plc Consolidated financial statements For the year ended 31 December 2016 RISK MANAGEMENT FRAMEWORK
118
Interest-rate risk is monitored centrally with a Gap report. A limits framework is in place to ensure that
retained risk remains within approved appetite. Interest rate risk also arises in each of the Africa subsidiary
treasuries in the course of balance sheet management and facilitating customer activity. The risk is
managed by local treasury functions, subject to modest risk limits and other controls.
Sensitivity Analysis and Stress Testing
Sensitivity analysis and stress testing are risk measurement techniques that help us ensure that the risks
the Bank takes remain within our risk appetite and that our level of capital remains adequate. Sensitivity
analysis involves varying a single factor (e.g. a model input or specific assumption) to assess the impact on
various risk measures.
Stress testing generally involves consideration of the simultaneous movements in a number of risk factors.
It is used to measure the level of potential unexpected losses for Credit, Market (both trading and non-
trading), Operational and Liquidity Risks.
Under potential adverse conditions, stress testing plays an important role in supporting overall capital
management and adequacy assessment processes. Our enterprise-wide stress testing program utilizes
stress scenarios featuring a range of severities based on unlikely but possible adverse market and economic
events. These common stress scenarios are evaluated across the organization, and results are integrated
to develop an enterprise-wide view of the impacts on our financial results and capital requirements. This
program uses macro-economic projections and applies them as stress impacts on the organization viz-a-
viz the various risk types.
Trading portfolio
The measurement/control techniques used to measure and control traded market risk (interest rate and
foreign exchange risk) include daily valuation of positions, limit monitoring, gap analysis, sensitivity
analysis, Value at Risk, tail risk, stress testing, e.t.c.
Measuring Traded
Market Risk
Mark to Market
VaR
Stress Test
Limits
Sensitivity/scenario Analysis

Access Bank Plc Consolidated financial statements For the year ended 31 December 2016 RISK MANAGEMENT FRAMEWORK
119
Limits
Specific limits and triggers (regulatory and in-house) have been set across the various market risk areas to
prevent undue exposure and the market risk management group ensure that these limits and triggers are
adhered to by the bank. The following limits currently exist;
Fixed income and FX Open Position Limits (OPL): The Bank, in keeping with the prudency concept, sets
its policy limit for Open Position at a level lower than the maximum OPL approved by the regulatory
authority. In setting the internal OPL, the following considerations are imperative:
The Regulatory OPL;
The Bank’s tolerance and appetite for FX risk;
The size and depth of the FX market in Nigeria;
The degree of volatility of traded currencies; and
The Bank’s desired positioning in the relevant FX market with requirements for international
business support.
Interbank placement and takings Limit: In line with Banks drive to be a top liquidity provider in the
financial market, stringent controls have been set to ensure that any takings from interbank are preceded
by proper authorization, to reduce the risks that come with huge interbank borrowing.
Management Action Trigger (MAT): This establishes decision points to confirm the Board of Directors’
tolerance for accepting trading risk losses on a cumulative basis. MAT therefore, takes into account actual
cumulative profit/loss as well as potential losses and the loss tolerance is defined as a percentage of Gross
Earnings.
Stop Loss Limit: This limit sets a maximum tolerable unrealized profit/loss to date which will trigger the
closing of a position in order to avoid any further loss based on existing exposures. Positions are liquidated
uniformly when stop loss limits are breached.
Dealer Limits: This limit sets a maximum tolerable unrealized profit/loss to date based on existing
exposures for a specific dealer. Positions are liquidated uniformly when the dealer stop limit is breached
independent of the global stop loss limit.
Value-at-Risk Limit: The normal VaR of the portfolio will be the Naira loss that will be exceeded 1% of the
time over a one day horizon. The time period may be changed depending on the volume of position held
and current market realities. At a maximum of 99% confidence level, and a holding period of 1 day, the
bank maintains a VaR limit of 0.25% of Gross earnings.
These risk limits are set and reviewed at least annually to control Access Bank’s trading activities in line
with the defined risk appetite of the Group. Criteria for setting risk limits include relevant market analysis,
market liquidity and business strategy. Trading risk limits are set at an aggregate, risk category and lower
levels and are expressed in terms of VaR. This is further supported by a comprehensive set of non-VaR
limits, including foreign exchange position limits, stop loss limits and Management Action Triggers.
Appropriate performance triggers are also used as part of the risk management process.
Mark-to-Market (MTM)
The marking-to-market technique establishes historical profit/loss by revaluing money market exposures
to prevailing market prices. When no market prices are available for a specific contract period, mark-to-

Access Bank Plc Consolidated financial statements For the year ended 31 December 2016 RISK MANAGEMENT FRAMEWORK
120
model is used to derive the relevant market prices; it is the Bank’s policy to revalue all exposures
categorized under the securities trading portfolio on a daily basis. As a general guide, marking to market
is performed independently of the trading unit i.e. prices/rates are obtained from external sources.
Value at Risk (VaR)
Risk of losses arising from future potential adverse movements in market rates, prices and volatilities are
measured using a VaR methodology. VaR, in general, is a quantitative measure of market risk that applies
recent historic market conditions to estimate the potential future loss in market value that will not be
exceeded in a set time period at a set statistical confidence level.
VaR provides a consistent measure that can be applied across trading businesses and products over time
and can be set against actual daily trading profit and loss outcome. To assess their predictive power, VaR
models are back tested against actual results.
Access Bank uses an internal VaR model based on the historical simulation method. Two years of historical
price and rate data is applied and updated daily. This internal model is also used for measuring value at
risk over both a one-day and 10-day holding period at a 99% confidence level. This model covers general
market (position) risk across all approved interest rate and foreign exchange products.
There are a number of considerations that should be taken into account when reviewing VaR numbers.
These are as follows:
Historical simulation assumes that the past is a good representation of the future. This may not always be
the case.
The assumed time horizon will not fully capture the market risk of positions that cannot be closed out or
hedged within this time horizon.
VaR does not indicate the potential loss beyond the selected percentile.
Intra-day risk is not captured.
Prudent valuation practices are used in the VaR calculation when there is difficulty obtaining rate/price
information.
To complement VaR, stress testing and other sensitivity measures are used.
Back testing
The VaR model is an important market risk measurement and control tool and consequently the
performance of the model is regularly assessed for continued suitability. The main approach employed is
a technique known as back testing, which counts the number of days when daily trading losses exceed the
corresponding the VaR estimate.
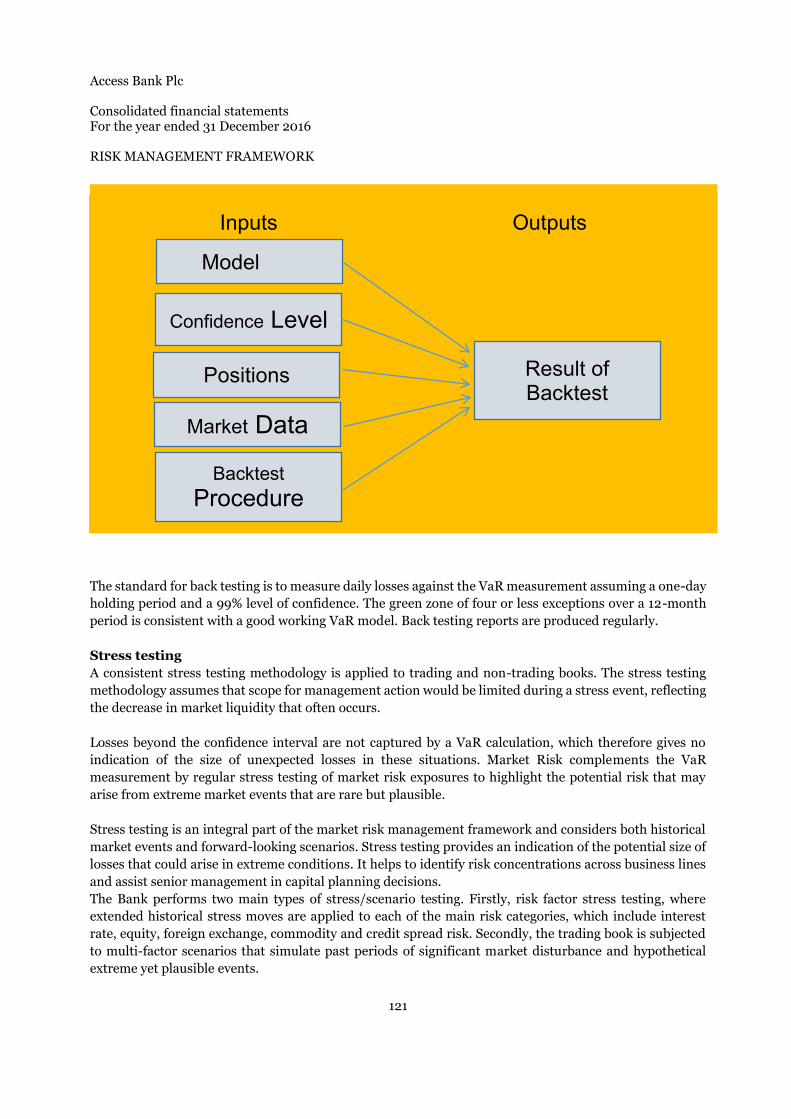
Access Bank Plc Consolidated financial statements For the year ended 31 December 2016 RISK MANAGEMENT FRAMEWORK
121
The standard for back testing is to measure daily losses against the VaR measurement assuming a one-day
holding period and a 99% level of confidence. The green zone of four or less exceptions over a 12-month
period is consistent with a good working VaR model. Back testing reports are produced regularly.
Stress testing
A consistent stress testing methodology is applied to trading and non-trading books. The stress testing
methodology assumes that scope for management action would be limited during a stress event, reflecting
the decrease in market liquidity that often occurs.
Losses beyond the confidence interval are not captured by a VaR calculation, which therefore gives no
indication of the size of unexpected losses in these situations. Market Risk complements the VaR
measurement by regular stress testing of market risk exposures to highlight the potential risk that may
arise from extreme market events that are rare but plausible.
Stress testing is an integral part of the market risk management framework and considers both historical
market events and forward-looking scenarios. Stress testing provides an indication of the potential size of
losses that could arise in extreme conditions. It helps to identify risk concentrations across business lines
and assist senior management in capital planning decisions.
The Bank performs two main types of stress/scenario testing. Firstly, risk factor stress testing, where
extended historical stress moves are applied to each of the main risk categories, which include interest
rate, equity, foreign exchange, commodity and credit spread risk. Secondly, the trading book is subjected
to multi-factor scenarios that simulate past periods of significant market disturbance and hypothetical
extreme yet plausible events.
Inputs Outputs
Model
Result of Backtest
Confidence Level
Positions
Market Data
Backtest Procedure

Access Bank Plc Consolidated financial statements For the year ended 31 December 2016 RISK MANAGEMENT FRAMEWORK
122
Stress scenarios are regularly updated to reflect changes in risk profile and economic events. Regular stress
test scenarios are applied to interest rates, credit spreads, exchange rates, commodity prices and equity
prices. Ad hoc scenarios are also prepared reflecting specific market conditions and for particular
concentrations of risk that arise within the businesses.
Liquidity risk
Liquidity risk arises when the Bank is unable to meet expected or unexpected current or future cash flows
and collateral needs without affecting its daily operations or its financial condition. The Bank is managed
to preserve a high degree of liquidity so that it can meet the requirements of its customers at all times
including periods of financial stress.
The Bank has developed a liquidity management framework based on a statistical model underpinned by
conservative assumptions with regard to cash inflows and the liquidity of liabilities. In addition, liquidity
stress tests assuming extreme withdrawal scenarios are performed. These stress tests specify additional
liquidity requirements to be met by holdings of liquid assets.
The Bank’s liquidity has consistently been materially above the minimum liquidity ratio and the
requirements of its stress tests. Global funding and liquidity risk management activities are centralized
within Corporate Treasury. We believe that a centralized approach to funding and liquidity risk
management enhances our ability to monitor liquidity requirements, maximize access to funding sources,
minimizes borrowing costs and facilitate timely responses to liquidity events. We analyze and monitor our
liquidity risk, maintain excess liquidity and access diverse funding sources including our stable deposit
base.
The Board approves the Bank’s liquidity policy and contingency funding plan, including establishing
liquidity risk tolerance levels. The Group ALCO, in conjunction with the Board and its committees,
monitors our liquidity position and reviews the impact of strategic decisions on our liquidity. Liquidity
positions are measured by calculating the Bank’s net liquidity gap and by comparing selected ratios with
targets as specified in the liquidity risk management manual.
Quantifications
Access Bank has adopted both qualitative and quantitative approaches to measuring liquidity risk.
Specifically, the Bank adopted the following approaches;
a) Funding and Liquidity plan;
b) Gap Analysis; and
c) Ratio Analysis.
The Funding and Liquidity plan defines the Bank’s sources and channels of utilization of funds. The
funding liquidity risk limit is quantified by calculating liquidity ratios and measuring/monitoring the
cumulative gap between our assets and liabilities. The Liquidity Gap Analysis quantifies the daily and
cumulative gap in a business as usual environment. The gap for any given tenor bucket represents the
borrowings from, or placements to, the market required to replace maturing liabilities or assets. The Bank

Access Bank Plc Consolidated financial statements For the year ended 31 December 2016 RISK MANAGEMENT FRAMEWORK
123
monitors the cumulative gap as a + or – 20% of the total risk assets and the gap as a + or – 20% of total
deposit liabilities.
Limit management and monitoring
Active management of liquidity through the framework of limits and control presented above is possible
only with proper monitoring capabilities. The monitoring process focuses on funding portfolios, the
forward balance sheet and general indicators; where relevant information and data are compared against
limits that have been established. The Bank’s Group Treasury is responsible for maintaining sufficient
liquidity by maintaining sufficient high ratio of liquid assets and available funding for near-term liabilities.
The secured liquidity measure is calculated and monitored by risk management. Increased withdrawals of
short-term funds are monitored through measurements of the deposit base in the Bank. Liquidity risk is
reported to the Board of Directors on a quarterly basis.
Contingency funding plan
Access Bank has a contingency funding plan which incorporates early warning indicators to monitor
market conditions. The Bank monitors its liquidity position and funding strategies on an ongoing basis,
but recognizes that unexpected events, economic or market conditions, earnings problems or situations
beyond its control could cause either a short or long-term liquidity crisis. It reviews its contingency funding
plan in the light of evolving market conditions and stress test results.
To monitor liquidity and funding, the Group Treasury prepares a liquidity worksheet that project sources
and uses of funds. The worksheet incorporates the impact of moderate risk and crisis situations. The
worksheet is an integral component of the contingency funding plan. Although it is unlikely that a funding
crisis of any significant degree could materialize, we consider it important to evaluate this risk and
formulate contingency plans should one occur.
The contingency funding plan covers: the available sources of contingent funding to supplement cash flow
shortages; the lead times to obtain such funding; the roles and responsibilities of those involved in the
contingency plans; and the communication and escalation requirements when early warning indicators
signal deteriorating market conditions. Both short term and long-term funding crises are addressed in the
contingency funding plan.

Access Bank Plc
Notes to consolidated financial statements
For the year ended 31 December 2016
5.1.3(a) Group
Credit quality by class
In thousands of Naira
December 2016 December 2015 December 2016 December 2015 December 2016 December 2015 December 2016 December 2015
Carrying amount 60,772,694 52,778,622 1,748,686,478 1,313,052,210 45,203,003 42,733,910 1,480,116,562 972,849,949
Neither past due nor impaired
Grade 1 : - - 140,577,674 164,056,674 44,515,864 42,099,530 697,527,499 471,082,538
Grade 2: - - 620,986,103 527,102,950 - - 254,394,923 232,900,691
Grade 3: 58,049,748 51,287,214 883,334,381 594,623,897 648,871 631,423 525,564,741 268,407,881
Grade 4: 1,630,027 15,970 85,410,961 19,720,718 - - 2,629,399 229,419
Grade 5: - 98,939 3,335,377 1,655,959 - - - -
Gross amount 59,679,775 51,402,123 1,733,644,496 1,307,160,198 45,164,735 42,730,953 1,480,116,562 972,620,529
Impairment (616,914) (465,739) (19,158,011) (15,241,871) (9,006) - - - Carrying amount 59,062,861 50,936,384 1,714,486,485 1,291,918,327 45,155,729 42,730,953 1,480,116,562 972,620,529
Past due but not impaired:
Grade 6: 658,807 182,541 4,099,130 351,679 - -
Grade 7: 852,431 953,436 1,067,363 1,033,145 61,654 12,043
Grade 8: 690,396 1,050,093 5,034,436 7,971,888 - -
Gross amount 2,201,634 2,186,069 10,200,929 9,356,712 61,654 12,043
Impairment (557,599) (475,439) (618,041) (2,025,081) (14,380) (9,086) Carrying amount 1,644,035 1,710,630 9,582,888 7,331,631 47,274 2,957
Past due and impaired:
Grade 6: Impaired 405,200 203,207 5,727,631 4,991,809
Grade 7: Impaired 23,012 18,240 5,845,857 5,091,934
Grade 8: Impaired 193,016 160,784 27,243,913 13,950,562
Gross amount 621,229 382,231 38,817,401 24,034,305
Allowance for impairment (555,430) (250,624) (14,200,296) (10,232,054)
Carrying amount 65,798 131,607 24,617,105 13,802,251
Bank
Credit quality by class
In thousands of Naira
December 2016 December 2015 December 2016 December 2015 December 2016 December 2015 December 2016 December 2015
Carrying amount 34,945,193 34,661,649 1,559,617,152 1,208,553,660 104,006,574 60,414,721 1,281,108,820 910,603,150
Neither past due nor impaired
Grade 1 : - - 138,494,537 163,854,025 103,319,435 59,780,341 697,527,499 458,679,063
Grade 2: - - 612,599,057 527,102,950 - - 254,394,923 220,497,215
Grade 3: 34,386,962 33,175,710 747,567,989 492,957,434 648,871 631,423 326,556,998 231,197,453
Grade 4: - 15,970 53,294,762 19,720,718 - - 2,629,400 229,419
Grade 5: - 98,939 3,335,377 1,655,959 - - - -
Gross amount 34,386,962 33,290,619 1,555,291,722 1,205,291,086 103,968,306 60,411,764 1,281,108,820 910,603,150
Impairment (578,908) (386,193) (18,737,558) (14,429,082) (9,006) - - - Carrying amount 33,808,054 32,904,426 1,536,554,164 1,190,862,004 103,959,300 60,411,764 1,281,108,820 910,603,150
Past due but not Impaired:
Grade 6: 137,463 182,541 727,602 351,679 - -
Grade 7: 833,271 953,436 757,098 1,033,145 61,654 12,043
Grade 8: 627,308 1,050,093 529,504 7,971,888 - -
Gross amount 1,598,042 2,186,070 2,014,204 9,356,712 61,654 12,043
Impairment (460,904) (475,439) (413,828) (2,025,081) (14,380) (9,086) Carrying amount 1,137,139 1,710,631 1,600,376 7,331,631 47,274 2,957
Past due and Impaired:
Grade 6: Impaired 405,200 154,959 5,684,031 4,927,701
Grade 7: Impaired - - 3,582,551 4,559,254
Grade 8: Impaired - 142,257 21,875,146 10,212,735
Gross amount 405,200 297,216 31,141,728 19,699,690
Allowance for impairment (405,200) (250,624) (9,679,116) (9,339,664) Carrying amount - 46,592 21,462,612 10,360,026
5.1.3
(b) Aging analysis of credit quality
31 December 2016Loans to
individuals
Loans to
Corporates and Banks Other assets
Loans to individuals
Loans to
Corporates and Banks Other assets
Past due & not impaired
Past due up to 30days 658,807 4,099,130 33,760 137,463 727,602 33,760
Past due up 30 - 60 days 852,431 1,067,363 3,504 833,271 757,098 3,504
Past due up 60 - 90 days 690,396 5,034,436 34,830 627,308 529,504 34,830
Total 2,201,634 10,200,929 72,094 1,598,042 2,014,204 72,094
Past due & impaired
Past due up to 91 - 180days 405,200 5,727,631 170,490 405,200 5,684,031 170,490
Past due up 180 - 360 days 23,012 5,845,857 2,151,168 - 3,582,551 2,151,168
Above 360days 193,016 27,243,913 646,200 - 21,875,146 646,200 Total 621,228 38,817,401 2,967,858 405,200 31,141,728 2,967,858
31 December 2015
Past due & not impaired
Past due up to 30days 182,541 351,679 2,994 182,542 351,680 2,994
Past due up 30 - 60 days 953,436 1,045,188 2,652 953,436 1,045,188 2,652
Past due up 60 - 90 days 1,050,093 7,971,845 5,538,743 1,050,092 7,959,845 5,538,743 Total 2,186,070 9,368,712 5,544,389 2,186,070 9,356,713 5,544,389
Past due & impaired
Past due up to 91 - 180days 203,207 4,991,809 39,108 154,959 4,927,701 39,108
Past due up 180 - 360 days 18,240 5,091,934 224,890 - 4,559,254 224,890
Above 360days 160,784 13,950,562 2,396,579 142,257 10,212,735 2,396,579 Total 382,231 24,034,305 2,660,577 297,216 19,699,690 2,660,577
Loans and advances Loans and advances Loans and advances Off balance sheet
to Individuals Corporates to banks
Group Bank
Loans and advances Loans and advances Loans and advances Off balance sheet
to Individuals Corporates to banks
124

Access Bank Plc
Notes to consolidated financial statements
For the year ended 31 December 2016
5.1.3 Credit quality
(c) Credit quality by risk rating class
Group
In thousands of Naira
December 2016 December 2015 December 2016 December 2015 December 2016 December 2015
External Rating Equivalent Grade Risk Rating
AAA Investment 1 - - 140,577,676 164,056,674 44,515,863 42,099,530
AA Investment 2+ - - 172,873,234 126,296,312 - -
A Investment 2 - - 195,719,545 161,182,597 - 631,423
BBB Investment 2- - - 252,393,325 239,624,041 - -
BB+ Standard 3+ 698,134 1,168,452 257,581,303 104,007,186 - -
BB Standard 3 56,772,887 49,450,682 532,076,799 429,130,854 648,871 -
BB- Standard 3- 577,003 668,080 93,676,279 61,485,857 - -
B Non-Investment 4 1,630,027 15,970 85,410,961 19,720,718 - -
B- Non-Investment 5 1,724 98,939 3,335,377 1,655,959 - -
CCC Non-Investment 6 1,064,007 385,748 9,826,761 5,343,488 - -
C Non-Investment 7 875,443 971,675 6,913,220 6,125,079 61,654 12,043
D Non-Investment 8 883,412 1,210,877 32,278,349 21,922,451 - -
Gross amount 62,502,637 53,970,424 1,782,662,828 1,340,551,215 45,226,388 42,742,996
Collective Impairment (1,174,513) (941,178) (19,776,052) (17,266,952) (23,386) (9,086)
Specific Impairment (555,430) (250,624) (14,200,296) (10,232,054) - -
Carrying amount 60,772,693 52,778,622 1,748,686,480 1,313,052,209 45,203,002 42,733,910
External Rating Equivalent Grade Risk Rating December 2016 December 2015 December 2016 December 2015
AAA-A Investment 1 499,960,107 304,214,019 130,383,150 74,568,887
A Investment 2 28,635,979 25,178,482 3,668,990 1,523,619
AA Investment 2+ 20,574,538 18,599,432 1,354,388 1,812,514
BBB Investment 2- 160,447,229 - 20,467,138 -
Gross amount 709,617,853 347,991,933 155,873,665 77,905,020
Collective Impairment - - - -
Specific Impairment - - - -
Carrying amount 709,617,853 347,991,933 155,873,665 77,905,020
Credit quality by risk rating class
Bank
In thousands of Naira
December 2016 December 2015 December 2016 December 2015 December 2016 December 2015
External Rating Equivalent Grade Risk Rating
AAA Investment 1 - - 138,494,537 163,854,025 103,319,435 59,780,341
AA Investment 2+ - - 171,528,084 126,296,312 - -
A Investment 2 - - 190,643,315 161,182,597 - -
BBB Investment 2- - - 250,427,658 239,624,041 - -
BB+ Standard 3+ 698,134 1,168,452 236,768,708 104,007,186 - -
BB Standard 3 33,111,826 31,339,177 428,534,577 327,464,392 648,871 631,423
BB- Standard 3- 577,003 668,080 82,264,705 61,485,857 - -
B Non-Investment 4 - 15,970 53,294,762 19,720,718 - -
B- Non-Investment 5 - 98,939 3,335,377 1,655,959 - -
CCC Non-Investment 6 542,663 337,501 6,411,633 5,279,380 - -
C Non-Investment 7 833,271 953,436 4,339,649 5,592,399 61,654 12,043
D Non-Investment 8 627,308 1,192,350 22,404,651 18,184,623 - -
Gross amount 36,390,205 35,773,905 1,588,447,654 1,234,347,487 104,029,960 60,423,807
Collective Impairment (1,039,812) (861,632) (19,151,386) (16,871,228) (23,386) (9,086)
Specific Impairment (405,200) (250,624) (9,679,116) (8,922,599) - -
Carrying amount 34,945,193 34,661,649 1,559,617,153 1,208,553,660 104,006,574 60,414,721
External Rating Equivalent Grade Risk Rating December 2016 December 2015 December 2016 December 2015
AAA-A Investment 1 499,960,107 296,865,582 130,383,150 74,516,216
A Investment 2 28,635,979 25,178,482 3,668,990 1,523,619
AA Investment 2+ 9,728,383 18,599,431 1,253,384 1,812,514
BBB Investment 2- 160,447,229 - 20,467,138 -
Gross amount 698,771,698 340,643,495 155,772,662 77,852,349
Collective Impairment - - - -
Specific Impairment - - - -
Carrying amount 698,771,698 340,643,495 155,772,662 77,852,349
Loans and advances
The external rating equivalent refers to the equivalent ratings for loans and advances by credit rating agencies.
Gross Nominal Fair Value
Derivative
Financial Instruments
Loans and advances Loans and advances Loans and advances
to Individuals Corporates to banks
to Individuals Corporates to banks
The external rating equivalent refers to the equivalent ratings for loans and advances by credit rating agencies. These instruments are neither past due nor impaired
Gross Nominal Fair Value
Derivative
Financial Instruments
Loans and advances Loans and advances
125

Access Bank Plc
Notes to consolidated financial statements
For the year ended 31 December 2016
5.1.3 The table below summarises the risk rating for other financial assest:
(d)
Group
In thousands of Naira
31 December 2016 Total Grade 1-3 Grade 4-5 Grade 6 Grade 7 Grade 8
Cash and balances with banks
Cash on hand and balances with banks 115,380,195 115,380,195 - - - -
Restricted deposits with central banks 250,831,529 250,831,529 - - - -
Unrestricted balances with central banks 139,954,922 139,954,922 - - - -
Money market placements 119,826,012 119,826,012
Investment under management 14,871,247 14,871,247 - - - -
Non-pledged trading assets
Treasury bills 34,381,635 34,381,635 - - - -
Bonds 10,188,597 10,180,206 8,391 - - -
Equity 59,348 59,348 - - - -
Derivative financial instruments 156,042,984 156,042,984 - - - -
Pledged assets -
Treasury bills 188,239,520 188,239,520 - - - -
Bonds 126,707,982 126,707,982 - - - -
Investment securities
- Available for sale
Treasury bills 69,346,601 69,346,601 - - - -
Bonds 32,891,849 32,891,849 - - - -
Equity 3,145,697 3,145,697 - - - -
- Held to Maturity
Treasury bills 27,350,114 27,350,114 - - - -
Bonds 41,101,014 41,101,014 - - - -
Other assets 44,763,926 44,763,926 - - - -
1,375,083,172 1,375,074,782 8,391 - - -
126

Access Bank Plc
Notes to consolidated financial statements
For the year ended 31 December 2016
Group
In thousands of Naira
31 December 2015
Total Grade 1-3 Grade 4-5 Grade 6 Grade 7 Grade 8
Cash and balances with banks
Cash on hand and balances with banks 85,299,149 85,299,149 - - - -
Restricted deposits with central banks 249,954,817 249,954,817 - - - -
Unrestricted balances with central banks 90,721,388 90,721,388 - - - -
Money market placements 52,433,982 52,433,982 - - - -
Investment under management 10,403,608 10,403,608 - - - -
Non-pledged trading assets
Treasury bills 50,209,443 50,209,443 - - - -
Bonds 2,025,000 2,025,000 - - - -
Equity 63,979 63,979 - - - -
Derivative financial instruments 77,905,020 77,905,020 - - - -
Pledged assets
Treasury bills 106,934,817 106,934,817 - - - -
Bonds 96,780,580 96,780,580 - - - -
Investment securities
- Available for sale
Treasury bills 28,996,006 28,996,006 - - -
Bonds 61,204,214 61,204,214 - - - -
Equity 44,772,710 44,772,710 - - - -
- Held to Maturity
Treasury bills 7,687,281 7,687,281 - - - -
Bonds 43,743,295 43,743,295 - - - -
Other assets 72,160,739 72,160,739 - - - -
1,081,296,028 1,081,296,028 - - - -
The table below summarises the risk rating for other financial assest:
Bank
In thousands of Naira
Total Grade 1-3 Grade 4-5 Grade 6 Grade 7 Grade 8
Cash and balances with banks
Cash on hand and balances with banks 106,594,205 106,594,205 - - - -
Restricted deposits with central banks 336,444,111 336,444,111 - - - -
Unrestricted balances with central banks 33,160,736 33,160,736 - - - -
Money market placements 41,798,197 41,798,197 - - - -
Investment under management 14,871,247 14,871,247 - - - -
Non-pledged trading assets
Treasury bills 34,381,635 34,381,635 - - - -
Bonds 10,188,597 10,180,206 8,391 - - -
Equity 59,348 59,348 - - - -
Derivative financial instruments 155,772,662 155,772,662 - - - -
Pledged assets
Treasury bills 188,239,520 188,239,520 - - - -
Bonds 126,707,982 126,707,982 - - - -
Investment securities
Available for sale -
Treasury bills 40,960,665 40,960,665 - - - -
Bonds 21,456,519 21,456,519 - - - -
Equity - - - - - -
Held to Maturity -
Treasury bills - - - - - -
Bonds 40,363,051 40,363,051 - - - -
Other assets 33,265,072 33,265,072 - - - -
1,184,263,547 1,184,255,156 8,391 - - -
31 December 2016
127

Access Bank Plc
Notes to consolidated financial statements
For the year ended 31 December 2016
Bank
In thousands of Naira
Total Grade 1-3 Grade 4-5 Grade 6 Grade 7 Grade 8
Cash and balances with banks
Cash on hand and balances with banks 57,546,509 57,546,509 - - - -
Restricted deposits with central banks 248,182,477 248,182,477 - - - -
Unrestricted balances with central banks 74,158,434 74,158,434 - - - -
Money market placements 26,111,216 26,111,216 - - - -
Investment under management 10,403,608 10,403,608 - - - -
Non-pledged trading assets
Treasury bills 50,209,443 50,209,443 - - - -
Bonds 2,025,000 2,025,000 - - - -
Equity 63,979 63,979 - - - -
Derivative financial instruments - - - - - -
Pledged assets
Treasury bills 103,684,044 103,684,044 - - - -
Bonds 96,780,580 96,780,580 - - - -
Investment securities
Available for sale -
Treasury bills 10,436,981 10,436,981 - - - -
Bonds 60,696,103 60,696,103 - - - -
Equity 44,755,565 44,755,565 - - - -
Held to Maturity -
Treasury bills - - - - - -
Bonds 40,286,529 40,286,529 - - - -
Other assets 69,509,746 69,509,746 - - - -
894,850,214 894,850,214 - - - -
31 December 2015
128

Access Bank Plc
Notes to consolidated financial statements
For the year ended 31 December 2016
5.1.3 Credit quality
(e ) Credit quality by credit risk rating model
Group
In thousands of Naira
December 2016 December 2015 December 2016 December 2015 December 2016 December 2015
Risk Rating (ORR) Model
Auto Loan 2,511,013 2,175,207 2,003,352 3,406,742 - 9,429
Credit Card 3,475,443 2,608,764 576,553 274,133 13,599 286
Finance Lease 60,912 - 3,946,347 1,821,023 8,455 -
Mortgage Loan 24,375,564 17,954,585 5,929,037 6,208,567 - -
Overdraft 5,639,049 5,261,080 181,242,213 208,224,839 647,541 551,077
Personal Loan 18,754,870 20,393,835 - - - -
Term Loan 6,964,075 4,777,259 1,102,912,471 785,718,903 40,930 82,675
Time Loan 721,711 799,692 486,052,855 334,897,007 44,515,863 42,095,369
Gross amount 62,502,636 53,970,424 1,782,662,828 1,340,551,214 45,226,388 42,738,836
Collective Impairment (1,174,513) (941,178) (19,776,052) (17,266,951) (23,386) (9,086)
Specific Impairment (555,430) (250,624) (14,200,296) (10,232,054) - -
Carrying amount 60,772,693 52,778,622 1,748,686,480 1,313,052,209 45,203,002 42,729,751
Bank
In thousands of Naira
December 2016 December 2015 December 2016 December 2015 December 2016 December 2015
Risk Rating (ORR) Model
Auto Loan 2,426,024 1,976,020 2,003,352 3,378,173 - 9,429
Credit Card 3,431,339 2,579,265 563,357 264,755 13,599 286
Finance Lease 60,912 - 3,946,347 1,821,023 8,455 -
Mortgage Loan 5,053,845 4,383,538 18,437 74,260 - -
Overdraft 5,033,990 5,054,135 135,065,623 188,628,138 647,541 551,077
Personal Loan 17,369,909 18,073,801 - - - -
Term Loan 2,427,653 3,066,500 1,032,873,587 753,319,156 40,930 82,675
Time Loan 586,532 640,645 413,976,952 286,861,982 103,319,435 59,780,341
Gross amount 36,390,205 35,773,905 1,588,447,654 1,234,347,487 104,029,960 60,423,808
Collective Impairment (1,039,812) (861,632) (19,151,386) (16,871,228) (23,386) (9,086)
Specific Impairment (405,200) (250,624) (9,679,116) (8,922,599) - -
Carrying amount 34,945,193 34,661,650 1,559,617,153 1,208,553,660 104,006,574 60,414,722
Loans and advances Loans and advances Loans and advances
Loans and advances Loans and advances Loans and advances
to Individuals Corporates to banks
to Individuals Corporates to banks
129

Access Bank Plc
Notes to consolidated financial statements
For the year ended 31 December 2016
5.1.3 Disclosure of Collateral held against loans and advances to customers by fair value heirarchy
(g)
Group
In thousands of Naira Level 1 Leve1 2 Level 3 Level 1 Leve1 2 Level 3
December 2016 December 2015
Against neither past due and not impaired
Property - - 914,144,760 - - 422,253,462
Equities 57,865,380 15,916,553 - 21,231,049 22,106,323 -
Cash 171,417,199 - - 70,869,009 - -
Pledged goods/receivables - - 141,014,518 - - -
Others - - 846,303,836 - - 360,496,371
Total 229,282,579 15,916,553 1,901,463,114 92,100,058 22,106,323 782,749,833
Against past due but not impaired:
Property - - 4,985,770 - - 15,638,209
Equities - - - 86,000 - -
Cash - - - - - -
Pledged goods/receivables - - - - - -
Others - - 32,241 - - 103,477
Total - - 5,018,011 86,000 - 15,741,686
Against past due and impaired
Property - - 29,237,351 - - 8,202,229
Equities 24,909 - - 170,081 - -
Cash 1,178,130 - - - - -
Pledged goods/receivables - - - - - -
Others - - 19,054,851 - - -
1,203,039 - 48,292,202 170,081 - 8,202,229
Total 230,485,618 15,916,553 1,954,773,327 92,356,139 22,106,323 806,693,748
Bank
In thousands of Naira Level 1 Leve1 2 Level 3 Level 1 Leve1 2 Level 3
December 2016 December 2015
Against neither past due and not impaired
Property - - 777,026,304 - - 366,344,483
Equities 35,795,940 15,916,553 - 5,244,374 22,106,323 -
Cash 153,127,205 - - 65,062,698 - -
Pledged goods/receivables - - 141,014,518 - - -
Others - - 745,839,135 - - 319,328,348
Total 188,923,145 15,916,553 1,663,879,957 70,307,072 22,106,323 685,672,831
Against past due but not impaired:
Property - - 1,272,479 - - 15,398,480
Equities - - - - - -
Cash - - - - - -
Pledged goods/receivables - - - - - -
Others - - 32,241 - - -
Total - - 1,304,720 - - 15,398,480
Against past due and impaired
Property - - 19,975,994 - - 4,319,362
Equities 24,909 - - 65,138 - -
Cash - - - - - -
Pledged goods/receivables - - - - - -
Others - - 18,115,344 - - 5,552,733
24,909 - 38,091,338 65,138 - 9,872,095
Total 188,948,054 15,916,553 1,703,276,015 70,372,210 22,106,323 710,943,406
There are no collaterals held against other financial assets. There were also no repossessed collateral during the year
Collateral held and other credit enhancements, and their financial effect
The general creditworthiness of a customer tends to be the most relevant indicator of credit quality of a loan extended to it. However, collateral provides additional security and
the Group generally requests that corporate borrowers provide it. The Group may take collateral in the form of a first charge over real estate, floating charges over all corporate
assets and other liens and guarantees. The bank does not sell or repledge the collateral in the absence of default by the owner of the collateral. In addition to the Group's focus on
credit worthiness, the group aligns with its credit policy guide to periodically update the validation of colaterals held against all loans to customers. For impaired loans, the Group
obtains appraisals of collateral because the fair value of the collateral is an input to the impairment measurement.
The fair values of collaterals are based upon last annual valuation undertaken by independent valuers on behalf of the bank. The valuation technique adopted for properties are
based on fair values of similar properties in the neigbourhood.
The fair values of non-property collaterals (such as equities, bond, treasury bills, etc.) are detrmined with reference to market quoted prices or market values of similar
instruments.
130

Access Bank Plc
Notes to consolidated financial statements
For the year ended 31 December 2016
5.1.4 Offsetting financial assets and financial liabilities
As at 31 December 2016
In thousands of Naira
The following financial assets are subject to offsetting
Gross amounts of
recognised
financial assets
Gross
amounts of
recognised
financial
liabilities
offset in the
statement
of financial
position
Net amounts
of financial
assets presented
in the statement
of financial
position
Financial assets
Loans and advances to banks 45,954,156 751,154 45,203,002
Total 45,954,156 751,154 45,203,002
As at 31 December 2016
Financial liabilities
Interest bearing borrowing 300,294,861 751,154 299,543,707
Total 300,294,861 751,154 299,543,707
As at 31 December 2015
In thousands of Naira
The following financial assets are subject to offsetting
Gross amounts of
recognised
financial assets
Gross
amounts of
recognised
financial
liabilities
offset in the
statement
of financial
position
Net amounts
of financial
assets presented
in the statement
of financial
position
Financial assets
Loans and advances to banks 43,224,746 490,836 42,733,910
Total 43,224,746 490,836 42,733,910
As at 31 December 2015
Financial liabilities
Interest bearing borrowing 231,957,997 490,836 231,467,161
Total 231,957,997 490,836 231,467,161
(1) Loans and advances to customers – amortised cost; and
(2) Interest bearing borrowings – amortised cost.
An obligation exists between the Bank and Access Finance B.V., for which Access Finance B.V. was expected to lend the Bank the sum of USD 2,462,000 as a
share premium loan. The loan agreement between both parties however permits that the obligation of Access Finance B.V. to grant the loan, be set off against
the obligation of the Bank to repay the loan such that each party's obligation either as a borrower or lender is discharged. In view of this, no loan payable has
been recognized in the Bank's financial statements.
In line the IAS 32 with the group currently has the legally enforceable right to set-off the recognised amount and it also intends to settle the borrowing on a
net basis.
The gross amounts of financial assets and financial liabilities disclosed in the above tables have been measured in the statement of financial position on the
following bases:
131

Access Bank Plc
Notes to consolidated financial statements
For the year ended 31 December 2016
5.1.5 (a) Credit concentration
The Groups’s risk profile is assessed through a ‘bottom-up’ analytical approach covering all of the Group’s major businesses and products. The risk appetite is approved by the Board and forms the basis
for establishing the risk parameters within which the businesses must operate, including policies, concentration limits and business mix.
Group
By Sector
December 2016
In thousands of Naira Corporate Commercial Bank Retail Government Others Total
Cash and balances with banks - - 663,403,259 - - - 663,403,259
Investment under management 10,913,760 - 1,070,385 - 2,887,102 - 14,871,247
Non pledged trading assets
Treasury bills - - - - 34,381,635 - 34,381,635
Bonds - 9,913 8,391 - 10,170,293 - 10,188,597
Derivative financial instruments 28,003,737 - 5,360,808 - 122,678,439 - 156,042,984
Loans and advances to banks - - 45,203,002 - - - 45,203,002
Loans and advances to customers
Auto Loan - - - 4,450,747 - - 4,450,747
Credit Card 27,496 12,500 - 3,939,240 - - 3,979,236
Finance Lease 2,404,390 1,259,848 - 312,384 11,275 - 3,987,897
Mortgage Loan 5,323,073 416,377 - 24,431,400 49,707 - 30,220,557
Overdraft 47,606,024 120,886,294 - 6,758,959 38,428 - 175,289,705
Personal Loan - - - 18,072,072 - - 18,072,072
Term Loan 418,496,135 396,250,334 - 8,006,467 265,966,313 - 1,088,719,249
Time Loan 236,078,483 246,004,748 - 2,380,302 276,175 - 484,739,708
Pledged assets
Treasury bills - - - - 188,239,520 - 188,239,520
Bonds - - - - 126,707,982 - 126,707,982
Investment securities
- Available for sale
Treasury bills - - - - 69,346,601 - 69,346,601
Bonds 377,207 - 5,814,936 - 26,699,706 - 32,891,849
- Held to Maturity -
Treasury bills - - - - 27,350,114 - 27,350,114
Bonds 3,036,929 - 1,032,857 - 37,031,227 - 41,101,013
Other assets 19,111,634 3,898,137 5,066,892 4,063,320 4,930,246 4,725,841 41,796,070
Total 771,378,868 768,738,151 726,960,530 72,414,891 916,764,763 4,725,841 3,260,983,044
Transaction related bonds and guarantees 136,220,145 48,419,939 1,611,634 - - - 186,251,718
Guaranteed facilities 85,363,987 14,068,722 150,000 - - - 99,582,709
140,720,906 17,865,294 69,563,933 2,771,057 30,287,053 - 261,208,243
Future, swap and forward contracts 314,341,917 - 185,130,561 - 433,601,415 - 933,073,893
Total 676,646,955 80,353,955 256,456,128 2,771,057 463,888,468 - 1,480,116,563
The Group monitors concentrations of credit risk by sector and by geographic location. An analysis of concentrations of net credit risk at the reporting date is shown below:
Credit risk exposures relating to other credit commitments
at gross amount are as follows:
Clean line facilities for letters of credit and
other commitments
132

Access Bank Plc
Notes to consolidated financial statements
For the year ended 31 December 2016
Group
By Sector
December 2015
In thousands of Naira Corporate Commercial Bank Retail Government Others Total
Cash and balances with banks - - 442,533,996 - - - 442,533,996
Investment under management 2,385,288 - 4,927,888 - 3,090,432 10,403,608
Non pledged trading assets
Treasury bills - - - - 50,209,443 - 50,209,443
Bonds - - 63,645 - 1,961,355 - 2,025,000
Derivative financial instruments 3,495,428 - 904,524 - 73,505,068 - 77,905,020
Loans and advances to banks - - 42,733,910 - - - 42,733,910
Loans and advances to customers
Auto Loan - - - 4,450,748 - - 4,450,748
Credit Card 27,496 12,500 - 3,939,240 - - 3,979,236
Finance Lease 2,404,390 1,259,848 - 312,384 11,275 - 3,987,897
Mortgage Loan 5,323,073 416,377 - 24,431,400 49,707 - 30,220,557
Overdraft 47,606,024 120,886,294 - 6,758,959 38,428 - 175,289,705
Personal Loan - - - 18,072,072 - - 18,072,072
Term Loan 418,496,135 396,250,334 - 8,006,467 265,966,313 - 1,088,719,249
Time Loan 236,078,483 246,004,748 - 2,380,302 276,175 - 484,739,708
Pledged assets
Treasury bills - - - - 106,934,817 - 106,934,817
Bonds - - - - 96,780,580 - 96,780,580
Investment securities
- Available for sale
Treasury bills - - - - 28,996,006 - 28,996,006
Bonds - - 6,524,859 - 54,679,355 61,204,214
- Held to Maturity
Treasury bills - - - - 7,687,281 - 7,687,281
Bonds 3,580,595 - 1,649,782 - 38,512,918 - 43,743,295
Other assets 15,529,608 798,290 2,116,791 5,340,515 17,564,186 30,811,349 72,160,739
Total 734,926,520 765,628,391 501,455,395 73,692,087 746,263,339 30,811,349 2,852,777,081
Transaction related bonds and guarantees 40,597,349 180,530,181 - - - - 221,127,530
Guaranteed facilities 12,764,903 78,944,392 - 23,484 2,403,148 - 94,135,927
55,947,878 132,878,805 - - - - 188,826,683
Future, swap and forward contracts 45,889,610 - 133,885,199 - 288,985,000 - 468,759,809
Total 155,199,739 392,353,378 133,885,199 23,484 291,388,148 - 972,849,949
Credit risk exposures relating to other credit commitments
at gross amount are as follows:
Clean line facilities for letters of credit and other
commitments
133

Access Bank Plc
Notes to consolidated financial statements
For the year ended 31 December 2016
5.1.5(a)i
By geography
Group
December 2016 Nigeria Rest of Africa Europe Others Total
In thousands of Naira
Cash and balances with banks 415,235,668 47,170,554 200,997,037 - 663,403,259
Investment under management 14,871,247 - - - 14,871,247
Non pledged trading assets
Treasury bills 34,381,635 - - - 34,381,635
Bonds 10,170,293 - 18,304 - 10,188,597
Derivative financial instruments 149,856,253 1,388,281 97,119 4,701,331 156,042,984
Loans and advances to banks 5,156,475 - 40,046,527 - 45,203,002
Loans and advances to customers
Auto Loan 4,366,544 84,204 - - 4,450,748
Credit Card 3,935,784 43,450 - - 3,979,234
Finance Lease 3,987,898 - - - 3,987,898
Mortgage Loan 4,996,952 918,895 24,304,711 - 30,220,558
Overdraft 130,272,256 45,017,450 - - 175,289,706
Personal Loan 16,789,104 1,282,968 - - 18,072,072
Term Loan 1,017,646,255 48,440,037 22,632,958 - 1,088,719,250
Time Loan 412,567,554 28,556,750 43,615,404 - 484,739,708
Pledged assets
Treasury bills 188,239,520 - - - 188,239,520
Bonds 126,707,982 - - - 126,707,982
Investment securities
- Available for sale
Treasury bills 40,960,665 6,092,117 22,293,819 - 69,346,601
Bonds 18,939,219 13,297,546 655,084 - 32,891,849
- Held to Maturity
Treasury bills - 27,350,114 - - 27,350,114
Bonds 37,917,493 737,963 2,445,558 - 41,101,014
Other assets 32,437,346 7,685,644 1,673,078 - 41,796,068
Total 2,669,436,142 228,065,973 358,779,599 4,701,331 3,260,983,047
Transaction related bonds and guarantees 136,163,848 48,420,025 1,667,845 - 186,251,718
Guaranteed facilities 85,513,821 14,068,888 - - 99,582,709
Clean line facilities for letters of credit and other commitments 158,994,793 16,950,311 85,263,139 - 261,208,243
Future, swap and forward contracts 744,259,779 33,663,881 128,787,677 26,362,557 933,073,893
Total 1,124,932,240 113,103,105 215,718,661 26,362,557 1,480,116,563
Credit risk exposures relating to othr credit commitments at
gross amount are as follows:
Concentration by location for loans and advances is measured based on the location of the Group entity holding the asset, which has a high correlation with the location of the
borrower. Concentration by location for investment securities is measured based on the location of the issuer of the security.
134

Access Bank Plc
Notes to consolidated financial statements
For the year ended 31 December 2016
By geography
Group
December 2015 Nigeria Rest of Africa Europe Others Total
In thousands of Naira
Cash and balances with banks 376,441,830 27,540,483 38,551,683 - 442,533,996
Investment under management 10,403,608 - - - 10,403,608
Non pledged trading assets
Treasury bills 50,209,442 - - - 50,209,442
Bonds 2,025,000 - - - 2,025,000
Derivative financial instruments 77,852,349 - 52,671 - 77,905,020
Loans and advances to banks 634,381 - 42,099,529 - 42,733,910
Loans and advances to customers
Auto Loan 5,291,292 227,756 - - 5,519,048
Credit Card 2,812,544 38,876 - - 2,851,420
Finance Lease 1,812,908 - - - 1,812,908
Mortgage Loan 4,359,784 2,378,877 17,326,478 - 24,065,139
Overdraft 179,077,197 19,241,733 - - 198,318,930
Personal Loan 17,863,574 2,320,034 - - 20,183,608
Term Loan 746,115,794 20,515,466 12,574,879 - 779,206,139
Time Loan 285,882,216 35,131,205 12,860,217 - 333,873,639
Pledged assets
Treasury bills 103,684,044 3,250,774 - - 106,934,818
Bonds 96,780,580 - - - 96,780,580
Investment securities
- Available for sale
Treasury bills 10,436,980 18,559,026 - - 28,996,006
Bonds 54,679,355 - 6,524,859 - 61,204,214
- Held to Maturity
Treasury bills - 6,008,800 1,678,481 - 7,687,281
Bonds 39,278,886 1,560,321 2,904,088 - 43,743,295
Other assets 68,256,292 3,600,119 304,328 - 72,160,739
Total 2,133,898,056 140,373,471 134,877,213 - 2,409,148,741
Transaction related bonds and guarantees 210,432,185 10,695,345 - - 221,127,530
Guaranteed facilities 86,113,061 7,132,642 890,224 - 94,135,927
Clean line facilities for letters of credit and other commitments 160,094,292 28,184,541 28,506,759 - 216,785,592
Future, swap and forward contracts 340,959,986 40,557,729 59,283,185 - 440,800,900
Total 797,599,524 86,570,258 88,680,168 - 972,849,949
Credit risk exposures relating to othr credit commitments at
gross amount are as follows:
135

Access Bank Plc
Notes to consolidated financial statements
For the year ended 31 December 2016
Credit risk management
5.1.5 (b) By Sector
Bank
December 2016
In thousands of Naira Corporate Commercial Bank Retail Government Others Total
Cash and balances with banks - - 480,395,147 - - - 480,395,147
Investment under management 10,913,760 - 1,070,385 - 2,887,102 - 14,871,247
Non pledged trading assets
Treasury bills - - - - 34,381,635 - 34,381,635
Bonds - 9,913 8,391 - 10,170,293 - 10,188,597
Derivative financial instruments 28,003,737 - 5,360,808 - 122,408,117 - 155,772,662
Loans and advances to banks - - 104,006,574 - - - 104,006,574
Loans and advances to customers
Auto Loan - - - 4,366,544 - - 4,366,544
Credit Card 26,799 - - 3,895,578 - - 3,922,377
Finance Lease 2,404,390 1,259,848 - 312,384 11,275 - 3,987,898
Mortgage Loan - 18,242 - 4,978,710 - - 4,996,952
Overdraft 19,595,999 104,350,992 - 6,318,069 20,603 - 130,285,663
Personal Loan - - - 16,789,104 - - 16,789,104
Term Loan 371,285,015 375,330,466 - 5,193,606 265,837,168 - 1,017,646,255
Time Loan 176,512,323 235,178,172 - 669,550 207,509 - 412,567,554
Pledged assets
Treasury bills - - - - 188,239,520 - 188,239,520
Bonds - - - - 126,707,982 - 126,707,982
Investment securities
Available for sale
Treasury bills - - - - 40,960,665 - 40,960,665
Bonds 377,207 - 5,814,936 - 15,507,737 - 21,699,880
Held to Maturity
Treasury bills - - - - - - -
Bonds 3,036,929 - 1,032,857 - 36,293,265 - 40,363,051
Other assets 17,580,637 1,895,503 1,426,691 3,706,154 4,430,246 4,225,841 33,265,072
Total 629,736,797 718,043,135 599,115,790 46,229,699 848,063,117 4,225,841 2,845,414,378
Transaction related bonds and guarantees 136,163,848 - - - - - 136,163,848
Guaranteed facilities 85,363,821 - 150,000 - - - 85,513,821
128,707,741 - - - 30,287,053 - 158,994,793
Future, swap and forward contracts 314,341,917 - 152,493,026 - 433,601,415 - 900,436,358
Total 664,577,327 - 152,643,026 - 463,888,468 - 1,281,108,820
Clean line facilities for letters of credit and other
commitments
Credit risk exposures relating to other credit commitments
at gross amount are as follows:
136

Access Bank Plc
Notes to consolidated financial statements
For the year ended 31 December 2016
By Sector
Bank
December 2015
In thousands of Naira Corporate Commercial Bank Retail Government Others Total
Cash and balances with banks - - 376,441,830 - - - 376,441,830
Investment under management 2,385,288 4,927,888 - 3,090,432 10,403,608
Non pledged trading assets
Treasury bills - - - - 50,209,443 - 50,209,443
Bonds 4,568 - 59,077 - 1,961,355 - 2,025,000
Derivative financial instruments 3,485,545 - 861,736 - 73,505,068 - 77,852,349
Loans and advances to banks - - 60,414,721 - - - 60,414,721
Loans and advances to customers
Auto Loan 173,144 1,020,277 - 4,076,949 20,922 - 5,291,293
Credit Card - - - 2,812,544 - - 2,812,544
Finance Lease 983,461 829,447 - - - - 1,812,908
Mortgage Loan - 27,552 - 4,332,232 - - 4,359,784
Overdraft 61,513,770 112,064,079 - 4,381,653 1,302,179 - 179,261,680
Personal Loan - - - 17,863,573 - - 17,863,573
Term Loan 310,192,916 268,549,705 - 3,272,990 163,915,701 - 745,931,312
Time Loan 132,203,718 149,821,320 - 633,471 3,223,707 - 285,882,216
Pledged assets
Treasury bills - - - - 103,684,044 - 103,684,044
Bonds - - - - 96,780,580 - 96,780,580
Investment securities
Available for sale
Treasury bills - - - - 10,436,981 - 10,436,981
Bonds - 6,016,748 - 54,679,355 - 60,696,103
Held to Maturity
Treasury bills - - - - - - -
Bonds 1,684,150 - 1,007,643 - 37,594,736 - 40,286,529
Other assets 22,790,400 6,047,003 2,116,917 11,235,870 27,278,697 40,859 69,509,746
Total 535,416,960 538,359,383 451,846,560 48,609,282 627,683,200 40,859 2,201,956,244
Transaction related bonds and guarantees 29,902,004 188,165,021 - - - - 218,067,025
Guaranteed facilities 4,742,037 84,472,264 - 23,484 2,403,148 - 91,640,933
34,714,834 125,379,457 - - - - 160,094,292
Future, swap and forward contracts 45,889,610 - 105,926,291 - 288,985,000 - 440,800,900
Total 115,248,485 398,016,742 105,926,291 23,484 291,388,148 - 910,603,149
Clean line facilities for letters of credit and other
commitments
Credit risk exposures relating to other credit commitments
at gross amount are as follows:
137

Access Bank Plc
Notes to consolidated financial statements
For the year ended 31 December 2016
5.1.5 (b)i By geography
Bank Nigeria Rest of Africa Europe Others Total
December 2016
In thousands of Naira
Cash and balances with banks 415,235,668 - 65,159,480 - 480,395,147
Investment under management 14,871,247 - - - 14,871,247
Non pledged trading assets
Treasury bills 34,381,635 - - - 34,381,635
Bonds 10,170,293 - 18,304 - 10,188,597
Derivative financial instruments 149,856,253 1,117,959 97,119 4,701,331 155,772,662
Loans and advances to banks 5,156,475 - 98,850,099 - 104,006,574
Loans and advances to customers
Auto Loan 4,366,544 - - - 4,366,544
Credit Card 3,922,377 - - - 3,922,377
Finance Lease 3,987,898 - - - 3,987,898
Mortgage Loan 4,996,952 - - - 4,996,952
Overdraft 130,285,663 - - - 130,285,663
Personal Loan 16,789,104 - - - 16,789,104
Term Loan 1,017,646,255 - - - 1,017,646,255
Time Loan 412,567,554 - - - 412,567,554
Pledged assets
Treasury bills 188,239,520 - - - 188,239,520
Bonds 126,707,982 - - - 126,707,982
Investment securities
Available for sale
Treasury bills 40,960,665 - - - 40,960,665
Bonds 18,939,219 - 2,760,661 - 21,699,880
Held to Maturity
Treasury bills - - - - -
Bonds 37,917,493 - 2,445,558 - 40,363,051
Other assets 32,437,346 808,611 19,115 - 33,265,072
Total 2,669,436,143 1,926,570 169,350,336 4,701,331 2,845,414,379
Transaction related bonds and guarantees 136,163,848 - - - 136,163,848
Guaranteed facilities 85,513,821 - - - 85,513,821
158,994,793 - - - 158,994,793
Future, swap and forward contracts 744,259,779 32,748,881 97,065,142 26,362,557 900,436,358
Total 1,124,932,241 32,748,881 97,065,142 26,362,557 1,281,108,820
Clean line facilities for letters of credit and other
commitments
Credit risk exposures relating to othr credit commitments at
gross amount are as follows:
138

Access Bank Plc
Notes to consolidated financial statements
For the year ended 31 December 2016
By geography
Bank Nigeria Rest of Africa Europe Others Total
December 2015
In thousands of Naira
Cash and balances with banks 405,998,636 - - 405,998,636
Investment under management 10,403,608 - - 10,403,608
Non pledged trading assets -
Treasury bills 50,209,443 - - - 50,209,443
Bonds 1,961,355 - 63,645 - 2,025,000
Derivative financial instruments 76,970,769 - 867,235 14,345 77,852,349
Loans and advances to banks 634,098 - 59,780,624 - 60,414,722
Loans and advances to customers -
Auto Loan 5,291,293 - - - 5,291,293
Credit Card 2,812,544 - - - 2,812,544
Finance Lease 1,812,908 - - - 1,812,908
Mortgage Loan 4,359,784 - - - 4,359,784
Overdraft 179,261,680 - - - 179,261,680
Personal Loan 17,863,573 - - - 17,863,573
Term Loan 745,931,312 - - - 745,931,312
Time Loan 285,882,216 - - - 285,882,216
Pledged assets -
Treasury bills 103,684,044 - - - 103,684,044
Bonds 96,780,580 - - - 96,780,580
Investment securities -
Available for sale -
Treasury bills 10,436,981 - - - 10,436,981
Bonds 54,679,356 - 5,857,725 159,022 60,696,103
Held to Maturity -
Treasury bills - - - -
Bonds 39,278,886 - 1,007,643 - 40,286,529
Other assets 68,076,063 1,409,196 24,487 - 69,509,746
Total 2,162,329,129 1,409,196 67,601,359 173,367 2,231,513,051
Transaction related bonds and guarantees 218,067,025 - - - 218,067,025
Guaranteed facilities 91,640,933 - - - 91,640,933
Clean line facilities for letters of credit and other commitments 160,094,292 - - - 160,094,292
Future, swap and forward contracts 340,959,986 40,557,729 59,283,185 - 440,800,900
Total 810,762,236 40,557,729 59,283,185 - 910,603,150
Credit risk exposures relating to othr credit commitments at
gross amount are as follows:
139

Access Bank Plc
Notes to consolidated financial statements
For the year ended 31 December 2016
5.2.1 A summary of the Group’s interest rate gap position on financial instruments is as follows:
Group
In thousands of Naira Less than 3 4 - 6 months 7 - 12 months 1 - 5 years More than Non-Interest Total
31 December 2016 months 5 years bearing
Non-derivative assets
Cash and balances with banks 118,063,803 1,762,209 - - - 594,063,093 713,889,105
Investment under management 14,871,247 - - - - - 14,871,247
Non pledged trading assets
Treasury bills 7,104,931 8,132,475 19,144,229 - - - 34,381,635
Bonds - - 1,993 10,186,604 - - 10,188,597
Loans and advances to banks 35,976,130 7,477,605 1,523,322 224,438 1,508 - 45,203,002
Loans and advances to customers
Auto Loan 48,036 140,524 285,619 3,722,834 253,735 - 4,450,747
Credit Card 3,857,163 187 16,538 105,348 - - 3,979,235
Finance Lease 196,694 9,501 166,902 3,614,801 - - 3,987,898
Mortgage Loan 24,310,113 759 39,255 1,195,811 4,674,619 - 30,220,557
Overdraft 104,827,946 8,168,255 61,356,628 936,877 - - 175,289,705
Personal Loan 273,440 162,550 1,426,014 15,957,194 252,875 - 18,072,072
Term Loan 30,863,690 14,132,484 16,004,301 454,903,302 572,815,472 - 1,088,719,249
Time Loan 257,669,712 58,309,804 99,697,734 69,062,457 - - 484,739,708
Pledged assets -
Treasury bills 39,049,250 67,819,721 81,370,550 - - - 188,239,521
Bonds - 3,541,654 8,215,582 22,140,686 92,810,059 - 126,707,982
Investment securities
- Available for sale
Treasury bills 24,469,054 10,305,106 34,572,441 - - - 69,346,601
Bonds - 5,537,388 - 8,923,273 18,431,188 - 32,891,849
- Held to Maturity
Treasury bills 8,342,441 8,638,753 10,368,919 - - - 27,350,114
Bonds - 88,654 2,302,702 7,555,286 31,154,372 - 41,101,014
Other assets - - - - - 41,796,068 41,796,068
669,923,650 194,227,629 336,492,729 598,528,911 720,393,828 635,859,161 3,155,425,907
Non-derivative liabilities
Deposits from financial institutions 151,001,693 69,658 16,285,233 - - - 167,356,583
Deposits from customers 1,910,193,499 41,569,864 52,508,124 8,390,090 - 76,535,709 2,089,197,286
Other liabilties - - - - - 111,117,648 111,117,648
Debt securities issued 7,624,982 3,802,546 92,736,609 212,380,366 - - 316,544,502
Interest bearing borrowings - 2,057,477 60,029,752 219,372,282 - 18,084,196 299,543,707
2,068,820,174 47,499,545 221,559,718 440,142,738 - 205,737,553 2,983,759,725
Total interest re-pricing gap (1,398,896,525) 146,728,084 114,933,011 158,386,173 720,393,828 430,121,607 171,666,181
Re-pricing period
140

Access Bank Plc
Notes to consolidated financial statements
For the year ended 31 December 2016
Group
In thousands of Naira Less than 3 4 - 6 months 7 - 12 months 1 - 5 years More than Non-Interest Total
31 December 2015 months 5 years bearing
Non-derivative assets
Cash and balances with banks 52,433,982 - - - - 425,975,354 478,409,336
Investment under management 10,403,608 - - - - - 10,403,608
Non pledged trading assets
Treasury bills 7,378,205 9,653,535 33,177,703 - - - 50,209,443
Bonds - - 42,554 1,182,521 799,925 - 2,025,000
Loans and advances to banks 543,309 - 42,099,529 91,072 - - 42,733,910
Loans and advances to customers
Auto Loan 28,585 63,060 284,135 5,143,268 - - 5,519,048
Credit Card 794,103 273,215 101,128 1,682,974 - - 2,851,420
Finance Lease 55,553 181,241 360,817 1,215,297 - - 1,812,908
Mortgage Loan 2,156 - 1,055,368 800,711 22,206,904 - 24,065,139
Overdraft 136,304,482 14,520,390 47,494,058 - - - 198,318,930
Personal Loan 137,483 137,495 424,720 19,469,367 14,543 - 20,183,608
Term Loan 67,304,865 8,558,580 19,636,782 400,260,208 283,445,704 - 779,206,139
Time Loan 239,163,978 33,573,023 60,276,238 859,764 636 - 333,873,638
Pledged assets
Treasury bills 50,456,135 26,579,358 29,899,324 - - - 106,934,817
Bonds - - 11,591,562 8,155,781 77,033,237 - 96,780,580
Investment securities
- Available for sale -
Treasury bills 14,730,720 4,013,091 8,493,425 1,758,770 - - 28,996,006
Bonds - - 2,013,715 20,246,719 38,943,780 - 61,204,214
- Held to Maturity -
Treasury bills - - - - - - -
Bonds 257,092 2,930,151 7,687,281 24,639,513 6,650,151 - 42,164,188
Other assets - - 9,266,388 - - 72,160,739 81,427,127
579,994,256 100,483,139 273,904,727 485,505,964 429,094,880 498,136,093 2,367,119,060
Non-derivative liabilities
Deposits from financial institutions 70,684,694 2,229,727 - - - - 72,914,421
Deposits from customers 1,524,107,621 70,456,406 66,657,799 22,022,494 - - 1,683,244,320
Other liabilties - - - - - 65,277,321 65,277,321
Debt securities issued - - - 149,853,640 - - 149,853,640
Interest bearing borrowings 17,049 12,457 1,008,489 20,356,658 197,232,476 12,840,032 231,467,161
1,594,809,364 72,698,590 67,666,288 192,232,792 197,232,476 78,117,353 2,202,756,863
Total interest re-pricing gap (1,014,815,108) 27,784,549 206,238,439 293,273,172 231,862,404 420,018,740 164,362,196
Re-pricing period
141

Access Bank Plc
Notes to consolidated financial statements
For the year ended 31 December 2016
5.2.1 A summary of the Bank’s interest rate gap position on non-trading portfolios is as follows:
Bank
In thousands of Naira Less than 3 4 - 6 months 7 - 12 months 1 - 5 years More than Non-Interest Total
31 December 2016 months 5 years bearing
Non-derivative assets
Cash and balances with banks 41,798,197 - - - - 476,199,052 517,997,249
Investment under management 14,871,247 - - - - - 14,871,247
Non- pledged trading assets
Treasury bills 7,104,931 8,132,475 19,144,229 - - - 34,381,635
Bonds - - 1,993 10,186,604 - - 10,188,597
Loans and advances to banks 100,956 - 80,850,522 23,055,096 - - 104,006,574
Loans and advances to customers
Auto Loan 44,538 140,498 278,421 3,649,349 253,737 - 4,366,544
Credit Card 3,787,028 187 16,538 118,623 - - 3,922,377
Finance Lease 196,694 9,501 166,902 3,614,801 - - 3,987,898
Mortgage Loan 4,996 353 38,443 1,156,744 3,796,416 - 4,996,952
Overdraft 102,563,620 8,168,255 19,374,316 179,472 - - 130,285,663
Personal Loan 266,532 159,842 860,207 15,477,175 25,348 - 16,789,105
Term Loan 8,752,512 13,988,889 15,750,168 409,300,808 569,853,878 - 1,017,646,255
Time Loan 240,757,770 50,689,184 52,089,014 69,031,586 - - 412,567,553
Pledged assets
Treasury bills 39,049,250 67,819,721 81,370,550 - - - 188,239,521
Bonds - 3,541,654 8,215,582 22,140,686 92,810,060 - 126,707,982
Investment securities
- Available for sale
Treasury bills 2,154,121 9,021,856 29,784,689 - - - 40,960,665
Bonds - 4,009,824 - 3,650,527 14,039,528 - 21,699,880
- Held to Maturity
Treasury bills - - - - - - -
Bonds - 66,554 2,132,702 7,323,605 30,840,190 - 40,363,051
Other assets - - - - - 33,265,072 33,265,072
461,452,392 165,748,796 310,074,275 568,885,079 711,619,154 509,464,124 2,727,243,819
Non-derivative liabilities
Deposits from financial institutions 85,753,842 39,901 9,328,445 - - - 95,122,188
Deposits from customers 1,657,794,162 36,053,247 45,539,922 7,276,665 - 66,378,876 1,813,042,872
Other liabilities - - - - - 105,287,724 105,287,724
Debt securities 7,624,982 3,802,546 20,144,524 212,380,366 - - 243,952,418
Interest bearing borrowings 2,557,609 58,694,740 9,724,633 285,275,751 - 15,927,053 372,179,785
1,753,730,595 98,590,434 84,737,524 504,932,781 - 187,593,653 2,629,584,986
Total interest re-pricing gap (1,292,278,203) 67,158,362 225,336,751 63,952,298 711,619,154 321,870,471 97,658,833
Re-pricing period
142

Access Bank Plc
Notes to consolidated financial statements
For the year ended 31 December 2016
Bank
In thousands of Naira Less than 3 4 - 6 months 7 - 12 months 1 - 5 years More than Non-Interest Total
31 December 2015 months 5 years bearing
Non-derivative assets
Cash and balances with banks 26,111,216 - - - - 379,887,420 405,998,636
Investment under management 10,403,608 - - - - - 10,403,608
Non- pledged trading assets
Treasury bills 7,378,204 9,653,535 33,177,704 - - - 50,209,443
Bonds - - 42,554 1,182,522 799,924 - 2,025,000
Loans and advances to banks - 496,780 59,828,535 89,406 - - 60,414,721
Loans and advances to customers
Auto Loan 28,584 63,061 284,135 4,915,512 - - 5,291,292
Credit Card 794,103 273,215 62,253 1,682,973 - - 2,812,544
Finance Lease 55,553 181,241 360,817 1,215,297 - - 1,812,908
Mortgage Loan 2,156 - 105,537 800,711 3,451,380 - 4,359,784
Overdraft 136,671,678 14,335,907 28,254,095 - - - 179,261,680
Personal Loan 137,483 137,494 424,721 17,149,332 14,543 - 17,863,573
Term Loan 67,120,383 8,558,580 19,636,783 367,169,862 283,445,704 - 745,931,312
Time Loan 239,163,978 33,573,023 12,284,815 859,764 636 - 285,882,216
Pledged assets
Treasury bills 48,794,846 26,291,063 28,598,135 - - - 103,684,044
Bonds - - 11,303,267 7,359,376 78,117,937 - 96,780,580
Investment securities
- Available for sale -
Treasury bills 6,158,089 - 4,278,892 - - - 10,436,981
Bonds - - 1,505,605 20,246,719 38,943,780 - 60,696,104
- Held to Maturity - -
Treasury bills - - - - - - -
Bonds - - 9,126,791 24,574,550 6,585,188 - 40,286,529
Other assets - - - - - 69,509,746 69,509,746
542,819,881 93,563,899 209,274,639 447,246,024 411,359,092 449,397,166 2,153,660,701
Non-derivative liabilities
Deposits from financial institutions 61,114,058 2,229,727 - - - 63,343,785
Deposits from customers 1,454,545,553 42,093,094 31,568,442 6,794 - - 1,528,213,883
Other liabilities - - - - 62,871,485 62,871,485
Debt securities - - - 78,516,655 - - 78,516,655
Interest bearing borrowings - - 1,008,489 96,799,622 192,271,843 12,840,033 302,919,987
1,515,659,611 44,322,821 32,576,931 175,323,071 192,271,843 75,711,518 2,035,865,795
Total interest re-pricing gap (972,839,730) 49,241,078 176,697,708 271,922,953 219,087,249 373,685,648 117,794,907
Re-pricing period
143

Access Bank Plc
Notes to consolidated financial statements
For the year ended 31 December 2016
Market risk management
5.2.2 Value at risk (VAR)
Group VAR by risk type
In thousands of Naira Average High Low Actual
Foreign exchange risk 20,455 201,816 154 12,050
Interest rate risk 564,918 1,492,932 84,051 393,917
Total 585,373 1,694,748 84,205 405,967
Group
Average High Low Actual
Foreign exchange risk 19,346 78,309 151 32,375
Interest rate risk 93,877 414,318 14,199 316,697
Total 113,223 492,627 14,350 349,072
Bank VAR by risk type
In thousands of Naira Average High Low Actual
Foreign exchange risk 19,275 198,717 31 11,309
Interest rate risk 564,918 1,492,932 84,051 393,917
Total 584,193 1,691,649 84,082 405,226
Bank
Average High Low Actual
Foreign exchange risk 10,329 43,344 70 23,132
Interest rate risk 93,877 414,318 14,199 316,697
Total 104,206 457,662 14,269 339,829
The Group trades on bonds, treasury bills and foreign currency. Market risk in trading portfolios is monitored and controlled using tools such as position limits, value
at risk and present value of an assumed basis points change in yields or exchange rates coupled with concentration limits. The major measurement technique used to
measure and control market risk is outlined below.
The Group applies a ‘value at risk’ (VaR) methodology to its trading portfolios at a group level to estimate the market risk of positions held and the maximum losses
expected, based upon a number of assumptions for various changes in market conditions. The Board sets limits on the value of risk that may be accepted for the
Group, which are monitored on a daily basis by Market Risk Unit. Interest rate risk in the non-trading book is measured through the use of interest rate repricing gap
analysis (Note 5.2.1).
VaR is a statistically based estimate of the potential loss on the current portfolio from adverse market movements. It expresses the ‘maximum’ amount the Group
might lose, but only to a certain level of confidence (99%). There is therefore a specified statistical probability (1%) that actual loss could be greater than the VaR
estimate. Value-at-risk estimates the potential maximum decline in the value of a position or portfolio, under normal market conditions, over a one-day holding
period. It also assumes that market moves occurring over this holding period will follow a similar pattern. The Group applies these historical changes in rates, prices,
etc. directly to its current positions - a method known as historical simulation. Actual outcomes are monitored regularly to test the validity of the assumptions and
parameters/ factors used in the VaR calculation.
The Access Bank value-at-risk method incorporates the factor sensitivities of the trading portfolio, the volatilities and correlations of the market risk factors. The
group uses the variance covariance method which derives likely future changes in market value from historical market volatility. Value at risks is estimated on the
basis of exposures outstanding at the close of business and therefore might not factor in the intra-day exposures. However, the bank does not only base its risk
estimates on Value at Risk, it uses Stress tests to provide an indication of the potential size of losses that could arise in extreme conditions by applying a what-if
analysis to further complement it. The results of the stress tests are reviewed by senior management in each business unit and by the Board of Directors.
The trading book is made up of foreign currency, Bonds and Treasury bills instruments. The value at Risk of the trading book is as stated:
December 2016
December 2015
December 2016
December 2015
144

Access Bank Plc
Notes to consolidated financial statements
For the year ended 31 December 2016
The table below sets out information on the exposure to fixed and variable interest instruments.
Exposure to fixed and variable interest rate risk
Group
In thousands of Naira
31 December 2016 Fixed Floating Non-interest bearing Total
ASSETS N'000 N'000 N'000 N'000
Cash and balances with banks 119,826,012 - 594,063,093 713,889,105
Non pledged trading assets 44,570,231 - 59,348 44,629,579
Derivative financial instruments - - 156,042,984 156,042,984
Loans and advances to banks 45,203,002 - - 45,203,002
Loans and advances to customers 4,891,994 1,804,567,178 - 1,809,459,172
Pledged assets 314,947,502 - - 314,947,502
Investment securities:
– Available-for-sale 102,238,450 - 58,424,194 160,662,644
– Held-to-maturity 68,451,128 - - 68,451,128
TOTAL 700,128,319 1,804,567,178 808,589,619 3,313,285,116
LIABILITIES
Deposits from financial institutions 167,356,583 - - 167,356,583
Deposits from customers 925,976,555 1,163,220,731 - 2,089,197,286
Derivative financial instruments - - 30,444,501 30,444,501
Debt securities issued 195,907,812 120,636,690 - 316,544,502
Interest-bearing borrowings 254,868,576 44,675,131 - 299,543,707
TOTAL 1,544,109,526 1,328,532,552 30,444,501 2,903,086,577
31 December 2015 Fixed Floating Non-interest bearing Total
ASSETS N'000 N'000 N'000 N'000
Cash and balances with banks 52,433,982 - 425,975,354 478,409,336
Non pledged trading assets 52,234,443 - 63,979 52,298,422
Derivative financial instruments - - 77,905,020 77,905,020
Loans and advances to banks 42,733,910 - - 42,733,910
Loans and advances to customers 4,556,129 1,361,274,702 - 1,365,830,831
Pledged assets 203,715,397 - - 203,715,397
Investment securities:
– Available-for-sale 90,200,220 - 44,592,330 134,792,550
– Held-to-maturity 51,463,692 - - 51,463,692
TOTAL 497,337,773 1,361,274,702 548,536,683 2,407,149,158
LIABILITIES
Deposits from financial institutions 72,914,421 - - 72,914,421
Deposits from customers 706,327,211 976,917,109 - 1,683,244,320
Derivative financial instruments - - 3,077,927 3,077,927
Debt securities issued - 149,853,640 - 149,853,640
Interest-bearing borrowings 181,214,364 50,252,797 - 231,467,161
TOTAL 960,455,996 1,177,023,546 3,077,927 2,140,557,469
145

Access Bank Plc
Notes to consolidated financial statements
For the year ended 31 December 2016
Bank
31 December 2016 Fixed Floating Non-interest bearing Total
ASSETS N'000 N'000 N'000 N'000
Cash and balances with banks 41,798,197 - 476,199,052 517,997,249
Non pledged trading assets 44,570,231 - 59,348 44,629,579
Derivative financial instruments - - 155,772,662 155,772,662
Loans and advances to banks 104,006,574 - - 104,006,574
Loans and advances to customers 4,374,708 1,590,187,637 - 1,594,562,345
Pledged assets 314,947,502 - - 314,947,502
Investment securities:
– Available-for-sale 62,660,545 - 58,177,045 120,837,590
– Held-to-maturity 40,363,051 - - 40,363,051
TOTAL 612,720,808 1,590,187,637 690,208,107 2,893,116,553
LIABILITIES
Deposits from financial institutions 95,122,188 - - 95,122,188
Deposits from customers 799,495,575 1,013,547,297 - 1,813,042,872
Derivative financial instruments - - 30,275,181 30,275,181
Debt securities issued 123,315,728 120,636,690 - 243,952,418
Interest-bearing borrowings 327,504,654 44,675,131 - 372,179,785
TOTAL 1,345,438,145 1,178,859,118 30,275,181 2,554,572,444
31 December 2015 Fixed Floating Non-interest bearing Total
ASSETS N'000 N'000 N'000 N'000
Cash and balances with banks 26,111,216 - 379,887,420 405,998,636
Non pledged trading assets 52,234,443 - 63,979 52,298,422
Derivative financial instruments - - 77,852,349 77,852,349
Loans and advances to banks - 60,414,721 - 60,414,721
Loans and advances to customers 4,231,571 1,238,983,738 - 1,243,215,309
Pledged assets 200,464,624 - - 200,464,624
Investment securities:
– Available-for-sale 71,133,084 - 44,575,185 115,708,269
– Held-to-maturity 40,286,529 - - 40,286,529
TOTAL 394,461,467 1,299,398,459 502,378,933 2,196,238,859
LIABILITIES
Deposits from financial institutions 63,343,785 - - 63,343,785
Deposits from customers 632,818,563 895,395,320 - 1,528,213,883
Derivative financial instruments - - 2,416,378 2,416,378
Debt securities issued - 78,516,655 - 78,516,655
Interest-bearing borrowings 181,214,364 121,705,623 - 302,919,987
TOTAL 877,376,712 1,095,617,598 2,416,378 1,975,410,688
Interest rate risk
Cash flow interest rate risk is the risk that the future cash flows of a financial instrument will fluctuate because of changes in market interest rates. Fair value interest
rate risk is the risk that the value of a financial instrument will fluctuate because of changes in market interest rates. The Group takes on exposure to the effects of
fluctuations in the prevailing levels of market interest rates on both its fair value and cash flow risks. Interest margins may increase as a result of such changes but
may reduce losses in the event that unexpected movements arise. The Board sets limits on the level of mismatch of interest rate repricing (note 5.2.1) and value at
risk (note 5.2.2) that may be undertaken, which is monitored daily by Group Treasury.
Derivative financial instruments include elements of interest rate differential between the applicable underlying currencies. Further details on the fair value of
derivatives have been discussed in Note3.9(J) of the financial statement.
146

Access Bank Plc
Notes to consolidated financial statements
For the year ended 31 December 2016
Cash flow and fair value interest rate risk
Group
Impact on net interest income of +/-1oo basis points changes in rates over a one year period (N'000)
Cashflow interest rate risk
Time Band
100 basis points decline in
rates
100 basis points
increase in rates
Less than 3 months (71,335) 71,335
6 months (1,868,207) 1,868,207
12 months (1,967,752) 1,967,752
(3,907,294) 3,907,294
Impact on net interest income of +/-1oo basis points changes in rates over a one year period (N'000)
Cashflow interest rate risk
Time Band
100 basis points decline in
rates
100 basis points
increase in rates
Less than 3 months 436,387 (436,387)
6 months (18,941) 18,941
12 months (231,879) 231,879
185,567 (185,567)
Bank
Impact on net interest income of +/-1oo basis points changes in rates over a one year period (N'000)
Cashflow interest rate risk
Time Band
100 basis points decline in
rates
100 basis points
increase in rates
Less than 3 months (67,938) 67,938
6 months (1,612,292) 1,612,292
12 months (1,805,538) 1,805,538
(3,485,768) 3,485,768
(i) Retained earnings arising from increase or decrease in net interest income and the fair value changes reported in profit or loss.
(ii) Fair value reserves arising from increases or decreases in fair value of available-for-sale financial instruments reported directly in other comprehensive
income.
Interest sensitivity analysis - 31 December 2016
Interest sensitivity analysis - 31 December 2015
Interest sensitivity analysis - 31 December 2016
The group’s interest rate risk arises from risk assets, long-term borrowings, deposits from banks and customers. Borrowings issued at variable rates expose the group
to cash flow interest rate risk. Other financial liabilities issued at fixed rates expose the group to fair value interest rate risk.
The management of interest rate risk against interest rate gap limits is supplemented with monitoring the sensitivity of the Group’s financial assets and liabilities to
various scenarios.
Interest rate movement have both cash flow and fair value effect depending on whether interest rate is fixed or floating. The impact resulting from adverse or
favourable movement flows from either retained earnings or OCI and ultimately ends in equity in the following manner:
147

Access Bank Plc
Notes to consolidated financial statements
For the year ended 31 December 2016
Impact on net interest income of +/-1oo basis points changes in rates over a one year period (N'000)
Cashflow interest rate risk
Time Band
100 basis points decline in
rates
100 basis points
increase in rates
Less than 3 months 441,514 (441,514)
6 months (51,912) 51,912
12 months (262,821) 262,821
126,781 (126,781)
Price sensitivity analysis on bonds and treasury bills
Group
Carrying Value
Impact of 50 basis points
increase in yields
Impact of 100 basis
points increase in
yields
Impact on Statement of Comprehensive
Investment under management T-Bills
Held for trading Bonds 10,188,597 (165,377) (327,492)
Held for trading T-bills 34,381,635 (103,935) (207,868)
Pledged assets: Bonds - - -
Pledged assets: T-bills 104,560,978 (318,783) (637,563)
149,131,210 (588,095) (1,172,923)
Impact on Other Comprehensive Income
Available for sale investments 96,046,306 (859,399) (1,742,610)
TOTAL 245,177,516 (1,447,494) (2,915,533)
Carrying Value
Impact of 50 basis points
increase in yields
Impact of 100 basis
points increase in
yields
Impact on Statement of Comprehensive
Investment under management T-Bills
Held for trading Bonds 1,717,106 (15,142) (29,252)
Held for trading T-bills 52,320,043 (85,915) (182,492)
Pledged assets: Bonds - - -
Pledged assets: T-bills 42,578,948 (69,920) (148,516)
96,616,097 (170,977) (360,260)
Impact on Other Comprehensive Income
Available for sale investments 119,034,346 (858,275) (1,774,728)
TOTAL 215,650,443 (1,029,252) (2,134,988)
Interest sensitivity analysis - 31 December 2015
The table above sets out the impact on net interest income of a 100 basis points parallel fall or rise in all yields. A parallel increase in yields by 100 basis points would
lead to an increase in net interest income while a parallel fall in yields by 100 basis points would lead to a decline in net interest income. The interest rate sensitivities
are based on simplified scenarios and assumptions, including that all positions will be retained and rolled over upon maturity. The figures represent the effect of
movements in net interest income based on the 100 basis point shift in interest rate and subject to the current interest rate exposures. However, the effect has not
taken into account the possible risk management measures undertaken by the Bank to mitigate interest rate risk. In practice, the Assets and Liability Committee,
ALCO seeks proactively to change the interest rate risk profile to minimize losses and optimise net revenues. The projections also assume that interest rates on
various maturities will move within similar ranges, and therefore do not reflect any potential effect on net interest income in the event that some interest rates may
change and others remain unchanged.
The table below shows the impact of likely movement in yields on the value of bonds and treasury bills. This relates to the positions held for trade and available for
sale. Since an increase in yields would lead to decline in market values of bonds and treasury bills, the analysis was carried out to show the likely impact of 50 and
100 basis points increase in market yields. The impact of held for trading investments is on the income statement while the impact of available for sale instruments is
on the statement of other comprehensive income.
31 December 2016
31 December 2015
148

Access Bank Plc
Notes to consolidated financial statements
For the year ended 31 December 2016
Carrying Value
Impact of 50 basis points
increase in yields
Impact of 100 basis
points increase in
yields
Impact on Statement of Comprehensive Income
Held for trading Bonds 10,170,293 (165,377) (327,492)
Held for trading T.bills 34,381,635 (103,935) (207,868)
Pledged assets: Bonds - - -
Pledged assets: T-bills 104,560,978 (318,783) (637,563)
149,112,906 (588,095) (1,172,923)
Impact on Other Comprehensive Income
Available for sale investments 111,555,830 (859,399) (1,742,610)
TOTAL 260,668,736 (1,447,494) (2,915,533)
Carrying Value
Impact of 50 basis points
increase in yields
Impact of 100 basis
points increase in
yields
Impact on Statement of Comprehensive Income
Held for trading Bonds 1,717,106 (15,142) (29,252)
Held for trading T.bills 52,320,043 (85,915) (182,492)
Pledged assets: Bonds - - -
Pledged assets: T-bills 42,578,948 (69,920) (148,516)
96,616,097 (170,977) (360,260)
Impact on Other Comprehensive Income
Available for sale investments 119,034,346 (858,275) (1,774,728)
TOTAL 215,650,443 (1,029,252) (2,134,988)
Foreign currency sensitivity analysis
Group
Impact on statement of
comprehensive income
Impact on statement
of comprehensive
income
In thousands of naira 31 December 2016 31 December 2015
Naira weakens by 15% 1,242,057 (12,178,312)
Naira weakens by 30% 2,484,113 (24,356,625)
31 December 2016
31 December 2015
Bank
The Group's principal foreign currency exposure is to US Dollars, as it constituted 75% of the Group's foreign currency exposure as at 31 December 2016. The table
below illustrates the hypothetical sensitivity of the Group and Bank's reported profit to a 30% and 15% increase in the US Dollar/Naira exchange rates at the year end
dates, assuming all other variables remain unchanged. The sensitivity rate of 30% and 15% represents the directors' assessment of a reasonable possible change
based on historic volatility.
The analysis assumes that exchange rate fluctuations on currency derivatives that form part of an effective cash flow hedge affect the fair value reserve in equity and
the fair value of the hedging derivatives. For foreign exchange derivatives which are not designated hedges, movements in exchange rates impact the income
statement.
149

Access Bank Plc
Notes to consolidated financial statements
For the year ended 31 December 2016
Bank
Impact on statement of
comprehensive income
Impact on statement
of comprehensive
income
In thousands of naira 31 December 2016 31 December 2015
Naira weakens by 15% 3,599,105 (13,038,569)
Naira weakens by 30% 7,198,209 (26,077,138)
Sensitivity analysis of derivative valuation
Impact on statement of
comprehensive income
Impact on statement
of comprehensive
income
In thousands of naira 31-Dec-16 31-Dec-15
Naira weakens by 10% 16,751,618 (17,628,934)
Naira weakens by 20% 33,503,236 (35,257,868)
Price sensitivity analysis on equity
For the equities, a sensitivity of the key valuation inputs is contained in note 4 of this financial statements.
The year end exchange rates applied in the above analysis are US Dollar 305 (2015:199.30). The strengthening and weakening of Naira may not produce symmetrical
results depending on the proportion and nature of foreign exchange derivatives which do not qualify for hedge accounting
Group carries out a sensitivity analysis to determine the effects that market variables may have on the fair value of the Group’s derivative financial instruments and
results of operations. Below is a sensitivity analysis of the derivatives to changes in spot rates. In doing this, all other variables have been held constant while varying
the spot rate at 10% and 20%.
The table below contains the summary of the impact of Naira depreciation against US Dollars on statement of comprehensive income.
150

Access Bank Plc
Notes to consolidated financial statements
For the year ended 31 December 2016
5.2.3 The table below summarises the Group’s financial instruments at carrying amount, categorised by currency:
Financial instruments by currency
Group
In thousands of Naira
31 December 2016 Total Naira US GBP Euro Others
Cash and balances with banks 713,889,105 449,810,262 107,945,620 108,816,821 15,018,080 32,298,322
Investment under management 14,871,247 14,871,247 - - - -
Non-pledged trading assets
Treasury bills 34,381,635 34,381,635 - - - -
Bonds 10,188,597 10,170,293 18,304 - - -
Equity 59,348 59,348 - - - -
Derivative financial instruments 156,042,984 155,807,597 - 117,937 - 117,449
Loans and advances to banks 45,203,002 5,120,324 36,849,371 100,828 3,054,125 78,354
Loans and advances to customers
Auto Loan 4,450,747 4,366,543 - - - 84,204
Credit Card 3,979,235 461,865 3,489,838 356 - 27,176
Finance Lease 3,987,898 3,847,155 140,741 - - -
Mortgage Loan 30,220,557 4,945,265 51,687 - 24,304,711 918,895
Overdraft 175,289,705 115,975,909 19,408,321 112 1,914 39,903,450
Personal Loan 18,072,072 16,068,950 770,696 - - 1,232,426
Term Loan 1,088,719,249 662,246,205 414,637,752 - 1,923,592 9,911,700
Time Loan 484,739,709 110,638,349 342,042,618 - 5,017,432 27,041,309
Pledged assets -
Treasury bills 188,239,520 188,239,520 - - - -
Bonds 126,707,982 126,707,982 - - - -
Investment securities
- Available for sale
Treasury bills 69,346,601 40,960,665 22,293,819 - - 6,092,117
Bonds 32,648,488 18,939,219 3,319,215 - - 10,390,054
Equity 58,667,555 58,420,406 - 220,510 - 26,639
- Held to Maturity
Treasury bills 27,350,114 - - - - 27,350,114
Bonds 41,101,014 37,917,493 3,031,795 - - 151,726
Other assets 41,796,068 25,620,309 9,312,046 693,416 3,157 6,167,140
3,369,952,432 2,085,576,541 963,311,822 109,949,979 49,323,011 161,791,075
Deposits from financial institutions 167,356,583 23,799 135,858,174 12,101,600 10,666,112 8,706,898
Deposits from customers 2,089,197,286 1,496,193,858 395,957,684 93,758,760 11,414,977 91,872,007
Derivative financial instruments 30,444,501 30,275,182 5,494 121,239 1,650 40,936
111,117,648 37,357,834 65,587,013 1,282,116 909,666 5,981,019
Debt securities issued 316,544,502 31,572,052 284,972,450 - - -
299,543,707 226,099,848 72,650,629 13,923 122,277 657,030
3,014,204,227 1,821,522,573 955,031,444 107,277,638 23,114,682 107,257,890
Off balance sheet exposuress
Transaction related bonds and guarantees 186,251,718 86,188,508 54,791,787 454,287 873,301 43,943,835
Guaranteed facilities 99,582,709 29,384,264 8,065,763 2,771,057 48,063,793 11,297,831
261,208,243 231,580 205,935,077 2,322,543 12,145,795 40,573,249
Future, swap and forward contracts 933,073,893 - 901,351,358 31,722,536 - -
1,480,116,563 115,804,352 1,170,143,986 37,270,422 61,082,889 95,814,915
*Included in Others are balances the group has in other currencies which includes South africa Rand,Japanese Yen, Ghanian Cedis, Dirham, Australian dollars, Canadian dollars, Swiss franc, Chinese Yuan etc.
Other liabilities
Interest bearing borrowings
Clean line facilities for letters of credit and other commitments
151

Access Bank Plc
Notes to consolidated financial statements
For the year ended 31 December 2016
Financial instruments by currency
Group
In thousands of Naira
31 December 2015 Total Naira US GBP Euro Others
Cash and balances with banks 478,409,336 390,808,342 32,769,177 37,047,633 12,223,493 5,560,691
Investment under management 10,403,608 10,403,608 - - - -
Non-pledged trading assets
Treasury bills 50,209,443 50,209,443 - - -
Bonds 2,025,000 1,961,355 63,645 - - -
Equity 63,979 63,979 - - -
Derivative financial instruments 77,905,020 77,852,348 3,717 44,048 4,907 -
Loans and advances to banks 42,733,910 634,381 42,099,529 - - -
Loans and advances to customers
Auto Loan 5,519,049 5,291,292 - - - 227,757
Credit Card 2,851,420 474,112 2,367,652 279 - 9,377
Finance Lease 1,812,908 1,274,915 537,993 - - -
Mortgage Loan 24,065,139 4,323,674 36,110 17,326,478 - 2,378,877
Overdraft 198,318,930 150,214,723 29,043,587 813 2,557 19,057,250
Personal Loan 20,183,608 17,420,469 443,105 - - 2,320,034
Term Loan 779,206,138 417,826,517 354,381,107 1,470,780 - 5,527,734
Time Loan 333,873,639 131,874,807 178,602,799 122,143 2,915,589 20,358,301
Pledged assets - - - - - -
Treasury bills 106,934,817 103,684,044 - - - 3,250,773
Bonds 96,780,580 96,780,580 - - - -
Investment securities - - - - - -
- Available for sale
Treasury bills 28,996,006 10,436,981 - - 18,559,025
Bonds 61,204,214 54,679,355 6,524,859 - - -
Equity 44,592,330 44,575,185 - - - 17,145
- Held to Maturity
Treasury bills 7,687,281 - - - - 7,687,281
Bonds 43,743,295 39,278,886 1,649,782 - - 2,814,627
Other assets 72,160,741 68,885,884 1,429,786 782,577 - 1,062,494
2,489,680,392 1,678,954,881 649,952,848 56,794,751 15,146,546 88,831,366
Deposits from financial institutions 72,914,421 3,835,704 49,320,402 13,902,757 3,334,043 2,521,515
Deposits from customers 1,683,244,320 1,076,584,753 469,856,575 50,513,055 11,177,254 75,112,683
Derivative financial instruments 3,077,927 - 2,420,095 54,905 4,907 598,020
65,277,321 47,301,189 9,958,993 1,237,536 1,167,151 5,612,452
Debt securities issued 149,853,640 - 149,853,640 - - -
231,467,161 181,664,842 49,731,893 - - 70,426
2,205,834,790 1,309,386,488 731,141,598 65,708,253 15,683,355 83,915,096
Off balance sheet exposuress
Transaction related bonds and guarantees 221,127,530 146,219,742 53,624,913 4,198,409 1,086,120 15,998,346
Guaranteed facilities 94,135,927 44,908,152 11,049,934 - 38,144,012 33,829
188,826,683 28,024,778 150,301,288 7,970,810 2,390,551 139,256
Future, swap and forward contracts 468,759,809 - 468,759,809 - - -
972,849,949 219,152,672 683,735,943 12,169,219 41,620,683 16,171,431
Other liabilities
Interest bearing borrowings
Clean line facilities for letters of credit and other commitments
152

Access Bank Plc
Notes to consolidated financial statements
For the year ended 31 December 2016
5.2.3 The table below summaries the Bank’s financial instruments at carrying amount, categorised by currency:
Financial instruments by currency
Bank
In thousands of Naira
Total Naira US GBP Euro Others
Cash and balances with banks 517,997,249 449,810,263 60,800,367 1,049,275 6,137,468 199,876
Investment under management 14,871,247 14,871,247 - - - -
Non-pledged trading assets
Treasury bills 34,381,635 34,381,635 - - - -
Bonds 10,188,597 10,170,293 18,304 - - -
Equity 59,348 59,348 - - - -
Derivative financial instruments 155,772,662 155,772,662 - - - -
Loans and advances to banks 104,006,574 5,120,323 98,886,251 - - -
Loans and advances to customers
Auto Loan 4,366,544 4,366,544 - - - -
Credit Card 3,922,377 461,866 3,460,156 356 - -
Finance Lease 3,987,897 3,847,155 140,741 - - -
Mortgage Loan 4,996,952 4,945,265 51,687 - - -
Overdraft 130,285,663 115,989,317 14,296,347 - - -
Personal Loan 16,789,104 16,068,950 720,154 - - -
Term Loan 1,017,646,255 662,246,205 355,400,050 - - -
Time Loan 412,567,554 110,638,348 297,462,741 - 4,214,043 252,422
Pledged assets
Treasury bills 188,239,520 188,239,520 - - - -
Bonds 126,707,982 126,707,982 - - - -
Investment securities -
Available for sale -
Treasury bills 40,960,665 40,960,665 - - - -
Bonds 21,456,519 18,939,219 2,517,300 - - -
Equity 58,420,406 58,420,406 - - - -
Held to Maturity
Treasury bills - - - - - -
Bonds 40,363,051 37,917,493 2,445,558 - - -
Other assets 33,265,072 25,620,310 7,640,386 3,506 870 -
2,941,252,872 2,085,555,016 843,840,041 1,053,137 10,352,381 452,298
Deposits from financial institutions 95,122,188 23,800 88,867,543 13,942 6,137,942 78,961
Deposits from customers 1,813,042,872 1,496,193,859 308,016,702 5,443,703 3,388,353 255
Derivative financial instruments 30,275,181 30,275,181 - - - -
Other liabilities 105,287,723 39,811,425 64,501,462 76,042 815,402 83,392
Debt securities issued 243,952,418 31,572,052 212,380,366 - - -
372,179,785 226,099,849 146,079,936 - - -
2,659,860,166 1,823,976,166 819,846,009 5,533,687 10,341,697 162,608
Off balance sheet exposuress
Transaction related bonds and guarantees 136,163,848 86,188,508 48,890,645 454,287 630,408 -
Guaranteed facilities 85,513,821 29,384,265 8,065,763 - 48,063,793 -
158,994,793 231,581 149,868,358 1,893,686 5,828,248 1,172,921
Future, swap and forward contracts 900,436,358 - 900,436,358 - - -
1,281,108,820 115,804,354 1,107,261,124 2,347,973 54,522,449 1,172,921
31 December 2016
Interest bearing borrowings
Clean line facilities for letters of credit and other commitments
153

Access Bank Plc
Notes to consolidated financial statements
For the year ended 31 December 2016
Financial instruments by currency
Bank
In thousands of Naira
Total Naira US GBP Euro Others
Cash and balances with banks 405,998,636 390,808,342 10,895,411 926,274 3,287,055 81,554
Investment under management 10,403,608 10,403,608 - - - -
Non-pledged trading assets
Treasury bills 50,209,443 50,209,443 - - - -
Bonds 2,025,000 1,961,355 63,645 - - -
Equity 63,979 63,979 - - - -
Derivative financial instruments 77,852,349 77,852,349 - - - -
Loans and advances to banks 60,414,721 - 48,589,493 6,208,168 5,617,060 -
Loans and advances to customers - - - - - -
Auto Loan 5,291,292 5,291,292 - - - -
Credit Card 2,812,544 474,112 2,338,153 279 - -
Finance Lease 1,812,908 1,274,915 537,993 - - -
Mortgage Loan 4,359,784 4,323,674 36,110 - - -
Overdraft 179,261,680 150,214,723 29,043,587 813 2,557 -
Personal Loan 17,863,573 17,420,469 443,104 - - -
Term Loan 745,931,312 417,826,517 328,104,795 - - -
Time Loan 285,882,216 131,874,807 151,819,340 122,143 1,870,046 195,880
Pledged assets
Treasury bills 103,684,044 103,684,044 - - - -
Bonds 96,780,580 96,780,580 - - - -
Investment securities - - - - - -
Available for sale - - - - - -
Treasury bills 10,436,981 10,436,981 - - - -
Bonds 60,696,103 54,679,355 6,016,748 - - -
Equity 44,575,185 44,575,185 - - - -
Held to Maturity
Treasury bills - - - - - -
Bonds 40,286,529 39,278,886 1,007,643 - - -
Other assets 69,509,746 68,885,884 623,862 - - -
2,276,152,215 1,678,320,500 579,519,884 7,257,677 10,776,718 277,434
Deposits from financial institutions 63,343,785 3,835,704 56,497,608 122,988 2,806,460 81,025
Deposits from customers 1,528,213,883 1,076,584,753 443,902,655 4,549,723 3,176,591 161
Derivative financial instruments 2,416,378 - 2,416,378 - - -
Other liabilities 62,871,485 51,705,684 9,955,814 26,394 1,167,151 16,442
Debt securities issued 78,516,655 - 78,516,655 - - -
302,919,987 181,664,842 121,255,145 - - -
2,038,282,172 1,313,790,983 712,544,255 4,699,105 7,150,202 97,628
Off balance sheet exposuress
Transaction related bonds and guarantees 218,067,025 164,267,159 52,358,822 354,924 1,086,120 -
Guaranteed facilities 91,640,933 42,446,987 11,049,934 - 38,144,012 - 160,094,292 78,087 157,178,621 483,607 2,214,721 139,256
Future, swap and forward contracts 440,800,900 - 440,800,900 - - -
910,603,150 206,792,233 661,388,277 838,531 41,444,853 139,256
Clean line facilities for letters of credit and other commitments
31 December 2015
Interest bearing borrowings
154
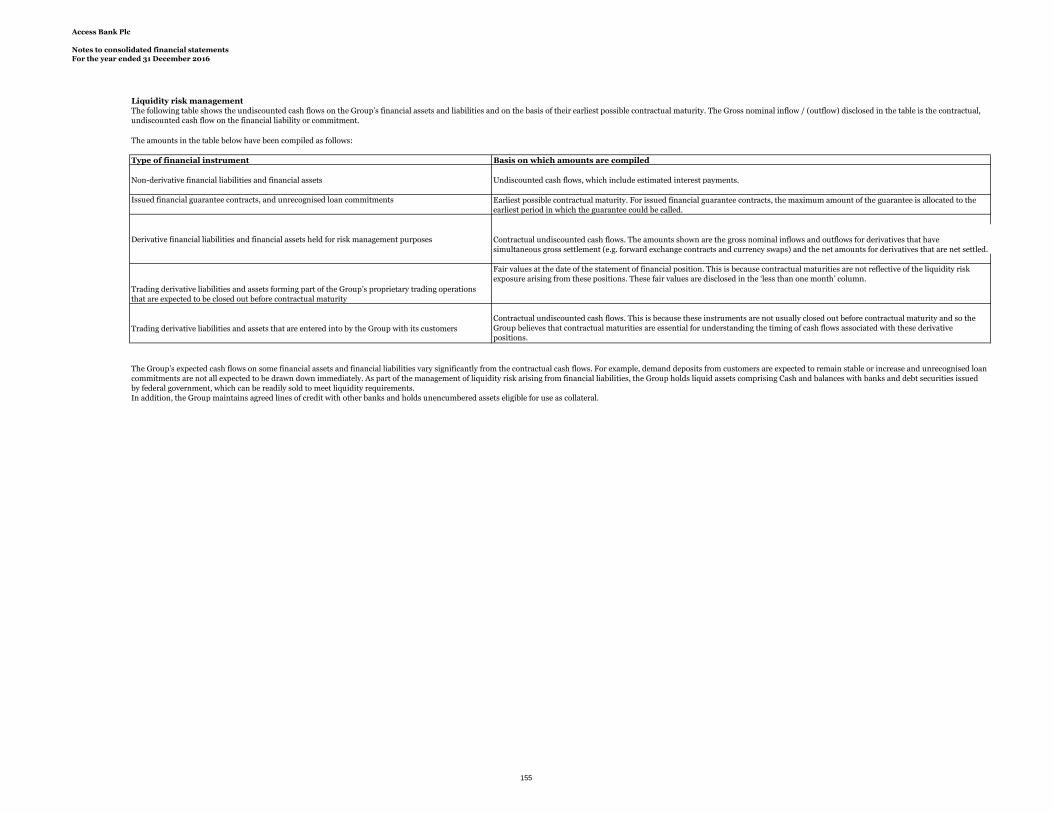
Access Bank Plc
Notes to consolidated financial statements
For the year ended 31 December 2016
Liquidity risk management
The amounts in the table below have been compiled as follows:
Type of financial instrument Basis on which amounts are compiled
Non-derivative financial liabilities and financial assets
Trading derivative liabilities and assets forming part of the Group’s proprietary trading operations
that are expected to be closed out before contractual maturity
Fair values at the date of the statement of financial position. This is because contractual maturities are not reflective of the liquidity risk
exposure arising from these positions. These fair values are disclosed in the ‘less than one month’ column.
Trading derivative liabilities and assets that are entered into by the Group with its customers
Contractual undiscounted cash flows. This is because these instruments are not usually closed out before contractual maturity and so the
Group believes that contractual maturities are essential for understanding the timing of cash flows associated with these derivative
positions.
The Group’s expected cash flows on some financial assets and financial liabilities vary significantly from the contractual cash flows. For example, demand deposits from customers are expected to remain stable or increase and unrecognised loan
commitments are not all expected to be drawn down immediately. As part of the management of liquidity risk arising from financial liabilities, the Group holds liquid assets comprising Cash and balances with banks and debt securities issued
by federal government, which can be readily sold to meet liquidity requirements.
In addition, the Group maintains agreed lines of credit with other banks and holds unencumbered assets eligible for use as collateral.
The following table shows the undiscounted cash flows on the Group’s financial assets and liabilities and on the basis of their earliest possible contractual maturity. The Gross nominal inflow / (outflow) disclosed in the table is the contractual,
undiscounted cash flow on the financial liability or commitment.
Undiscounted cash flows, which include estimated interest payments.
Issued financial guarantee contracts, and unrecognised loan commitments Earliest possible contractual maturity. For issued financial guarantee contracts, the maximum amount of the guarantee is allocated to the
earliest period in which the guarantee could be called.
Derivative financial liabilities and financial assets held for risk management purposes Contractual undiscounted cash flows. The amounts shown are the gross nominal inflows and outflows for derivatives that have
simultaneous gross settlement (e.g. forward exchange contracts and currency swaps) and the net amounts for derivatives that are net settled.
155

Access Bank Plc
Notes to consolidated financial statements
For the year ended 31 December 2016
5.3.1 Residual contractual maturities of financial assets and liabilities
Group Carrying Gross nominal Less than 6 months 12 months 5 years More than
31 December 2016 amount inflow/(outflow) 3 months 5 years
In thousands of Naira
Cash and balances with banks 713,889,105 715,345,365 353,988,075 7,247,123 53,642,143 - 300,468,024
Investment under management 14,871,247 13,041,247 10,411,554 2,629,693 - - -
Non-pledged trading assets
Treasury bills 34,381,635 34,029,176 9,040,335 4,866,243 20,122,598 - -
Bonds 10,188,597 16,619,894 631,976 91,576 718,002 6,761,748 8,416,592
Derivative financial instruments 156,042,984 156,042,984 27,079,269 33,598,441 38,327,725 57,037,549 -
Loans and advances to banks 45,203,002 45,463,319 33,905,765 4,685,904 6,871,650 - -
Loans and advances to customers
Auto Loan 4,450,747 4,514,364 352,266 325,139 743,859 3,093,100 -
Credit Card 3,979,235 4,051,996 3,916,648 187 16,538 118,623 -
Finance Lease 3,987,897 4,007,259 709,657 370,719 725,035 2,201,848 -
Mortgage Loan 30,220,557 30,304,601 24,297,892 143,547 37,176 2,717,493 3,108,493
Overdraft 175,289,705 186,881,261 115,424,409 8,168,255 62,334,086 954,511 -
Personal Loan 18,072,072 18,754,870 3,212,043 1,692,016 4,106,747 9,486,725 257,338
Term Loan 1,088,719,249 1,109,876,546 92,812,191 37,992,342 70,123,875 620,946,018 288,002,120
Time Loan 484,739,708 486,774,565 321,897,757 36,295,722 63,668,031 64,913,055 -
Pledged assets
Treasury bills 188,239,520 209,782,953 40,001,539 74,184,000 95,597,414 - -
Bonds 126,707,982 210,020,282 1,841,690 7,536,150 12,442,115 53,256,317 134,944,010
Investment securities
Available for sale
Treasury bills 69,346,601 69,633,449 24,517,339 9,716,110 35,400,000 - -
Bonds 32,891,849 39,382,977 477,858 5,278,846 1,616,705 14,058,682 17,950,886
Held to Maturity
Treasury bills 27,350,114 28,180,997 16,686,645 4,378,220 7,116,132 - -
Bonds 41,101,013 98,737,383 6,191,560 3,272,392 4,798,727 26,230,505 58,244,199
Other assets 41,796,068 44,763,927 16,103,065 8,352,445 2,674,098 17,634,319 -
3,311,468,889 3,526,209,417 1,103,499,533 250,825,072 481,082,654 879,410,493 811,391,662
Deposits from financial institutions 167,356,583 164,074,987 88,509,852 28,368,657 47,196,478 - -
Deposits from customers 2,089,197,286 2,131,487,288 1,770,249,157 169,609,396 131,265,649 60,363,086 -
Derivative financial instruments 30,444,501 30,444,581 6,319,085 9,071,764 15,053,732 - -
Other liabilities 111,117,648 111,134,476 34,280,188 64,128,143 12,124,191 601,954 -
Debt securities issued 316,544,502 414,465,451 11,105,760 14,661,659 388,698,032 - -
Interest bearing borrowings 299,543,707 349,046,526 5,715,379 11,935,782 16,675,458 95,242,608 219,477,299
3,014,204,226 3,200,653,309 1,916,179,421 297,775,401 611,013,540 156,207,648 219,477,299
Gap (asset - liabilities) 297,264,664 325,556,107 (812,679,888) (46,950,328) (129,930,886) 723,202,845 591,914,365
Cumulative liquidity gap (812,679,888) (859,630,217) (989,561,103) (266,358,257) 325,556,108
Off-balance sheet
Transaction related bonds and guarantees 186,251,718 186,251,718 58,396,012 20,312,880 13,591,530 93,951,296 -
Guaranteed facilities 99,582,709 99,582,709 12,734,834 3,939,865 12,160,759 68,912,931 1,834,320
Clean line facilities for letters of credit and other commitments 261,208,243 261,208,243 191,336,041 32,234,010 33,458,810 4,179,382 -
Future, swap and forward contracts 933,073,893 933,073,893 277,615,235 195,494,789 347,913,388 112,050,481 -
1,480,116,563 1,480,116,563 540,082,122 251,981,544 407,124,487 279,094,090 1,834,320
156

Access Bank Plc
Notes to consolidated financial statements
For the year ended 31 December 2016
Group Carrying Gross nominal Less than 6 months 12 months 5 years More than
31 December 2015 amount inflow/(outflow) 3 months 5 years
In thousands of Naira
Cash and balances with banks 478,409,336 478,409,336 228,454,519 - - - 249,954,817
Investment under management 10,403,608 10,494,011 10,494,011 - - - -
Non-pledged trading assets
Treasury bills 50,209,443 51,656,952 7,422,310 9,865,726 34,368,916 - -
Bonds 2,025,000 3,164,736 124,584 5,988 163,571 1,909,285 961,309
Derivative financial instruments 77,905,020 77,905,020 5,371,017 3,516,433 2,244,002 66,773,568 -
Loans and advances to banks 42,733,910 43,338,836 552,395 - 42,695,369 91,072 -
Loans and advances to customers
Auto Loan 5,519,049 5,581,949 28,909 63,776 287,331 5,201,934 -
Credit Card 2,851,420 2,882,896 803,177 276,313 101,834 1,701,572 -
Finance Lease 1,812,908 1,821,023 56,182 182,080 362,516 1,220,244 -
Mortgage Loan 24,065,139 24,163,152 2,180 - 106,732 856,528 23,197,712
Overdraft 198,503,413 213,485,919 147,864,068 16,685,613 48,936,238 - -
Personal Loan 20,183,608 20,393,835 139,043 139,052 429,543 19,671,488 14,708
Term Loan 779,021,657 790,496,163 67,248,846 9,265,310 19,751,013 408,178,583 286,052,411
Time Loan 333,873,638 335,494,050 240,187,156 34,055,604 60,381,145 869,501 643
Pledged assets
Treasury bills 106,934,817 110,634,759 49,586,114 27,376,779 33,671,866 - -
Bonds 96,780,580 135,824,699 704,048 3,838,702 15,332,749 - 115,949,201
Investment securities
Available for sale
Treasury bills 28,996,006 29,103,866 15,298,622 3,309,940 10,495,304 - -
Bonds 61,204,214 120,505,529 3,081,071 449,198 3,530,269 45,556,113 67,888,878
Held to Maturity
Treasury bills 7,687,281 8,001,573 1,574,323 2,140,074 4,287,176 - -
Bonds 43,743,295 55,267,935 1,017,818 2,288,727 2,272,677 39,389,385 10,299,328
Other assets 72,160,739 71,674,061 29,775,314 39,379,530 2,519,217 - - 2,445,024,080 2,590,300,300 809,785,707 152,838,845 281,937,468 591,419,273 754,319,007
Deposits from financial institutions 72,914,421 69,670,704 67,440,977 2,229,727 - - -
Deposits from customers 1,683,244,320 1,684,671,964 1,550,285,998 77,632,305 56,725,519 28,141 -
Derivative financial instruments 3,077,927 3,077,927 2,450,044 627,883 - - -
Other liabilities 65,277,321 65,277,322 65,277,322 - - - -
Debt securities issued 149,853,640 200,147,025 2,528,619 3,687,050 6,215,669 104,308,638 83,407,050
Interest bearing borrowings 231,467,161 241,925,345 2,317,162 3,802,268 6,743,263 55,560,644 173,502,008
2,205,834,790 2,264,770,287 1,690,300,122 87,979,233 69,684,451 159,897,423 256,909,058
Gap (asset - liabilities) 239,189,290 325,530,013 (880,514,415) 64,859,611 212,253,017 431,521,850 497,409,948
Cumulative liquidity gap (880,514,415) (815,654,804) (603,401,787) (171,879,937) 325,530,010
Off-balance sheet
Transaction related bonds and guarantees 221,127,530 221,127,530 109,959,885 13,220,643 49,030,767 28,395,636 20,520,600
Guaranteed facilities 94,135,927 94,135,927 10,271,557 6,217,096 9,469,462 16,627,248 51,550,564
Clean line facilities for letters of credit and other commitments 216,785,592 216,785,591 162,666,543 41,958,728 8,323,794 3,836,525 -
Future, swap and forward contracts 440,800,900 440,800,900 211,365,494 69,995,407 19,930,000 139,510,000 -
972,849,949 972,849,949 494,263,479 131,391,875 86,754,023 188,369,409 72,071,164
157

Access Bank Plc
Notes to consolidated financial statements
For the year ended 31 December 2016
5.3.1 Residual contractual maturities of financial assets and liabilities
Bank Carrying Gross nominal Less than 6 months 12 months 5 years More than
31 December 2016 amount inflow/outflow 3 months 5 years
In thousands of Naira
Cash and balances with banks 517,997,249 519,266,390 160,192,964 7,247,123 53,642,143 - 298,184,159
Investment under management 14,871,247 13,041,247 10,411,554 2,629,693 - - -
Non-pledged trading assets
Treasury bills 34,381,635 34,029,176 9,040,335 4,866,243 20,122,598 - -
Bonds 10,188,597 16,619,893 631,976 91,576 718,002 6,761,748 8,416,592
Derivative financial instruments 155,772,662 155,772,662 26,810,280 33,597,108 38,327,725 57,037,549 -
Loans and advances to banks 104,006,574 106,370,619 17,606,339 35,495,655 53,268,624 - -
Loans and advances to customers
Auto Loan 4,366,544 4,429,376 349,123 325,117 737,390 3,017,746 -
Credit Card 3,922,377 4,008,296 3,872,947 187 16,538 118,623 -
Finance Lease 3,987,898 4,007,259 709,657 370,719 725,035 2,201,848 -
Mortgage Loan 4,996,952 5,072,282 71,128 143,142 36,366 2,588,525 2,233,121
Overdraft 130,285,663 140,086,013 112,363,969 8,168,255 19,374,316 179,472 -
Personal Loan 16,789,104 17,369,909 3,204,315 1,688,986 3,515,034 8,958,819 2,756
Term Loan 1,017,646,255 1,035,301,240 69,817,914 37,847,445 69,867,436 572,754,782 285,013,663
Time Loan 412,567,554 414,563,484 305,093,210 28,655,049 15,934,022 64,881,203 -
Pledged assets
Treasury bills 188,239,520 209,782,953 40,001,539 74,184,000 95,597,414 - -
Bonds 126,707,982 210,020,281 1,841,690 7,536,150 12,442,115 53,256,317 134,944,010
Investment securities
Available for sale
Treasury bills 40,960,665 47,318,516 2,202,406 9,716,110 35,400,000 - -
Bonds 21,699,880 38,217,811 477,858 5,278,846 1,616,705 13,114,026 17,730,376
Held to Maturity
Treasury bills - - - - - - -
Bonds 40,363,051 88,365,459 2,217,396 288,326 3,453,755 24,516,142 57,889,841
Other assets 33,265,072 36,232,930 16,057,855 - 2,666,435 17,508,640 -
2,883,016,480 3,099,875,797 782,974,457 258,129,729 427,461,654 826,895,439 804,414,518
Deposits from financial institutions 95,122,188 93,373,197 88,509,852 4,824,256 39,089 - -
Deposits from customers 1,813,042,872 1,842,927,520 1,630,445,930 122,969,705 77,445,500 12,066,385 -
Derivative financial instruments 30,275,181 30,275,181 6,150,451 9,070,998 15,053,732 - -
Other liabilities 105,287,724 105,287,724 29,202,451 64,128,143 11,957,131 - -
Debt securities issued 243,952,418 336,873,750 8,452,867 14,661,659 313,759,224 - -
Interest bearing borrowings 372,179,785 426,638,227 8,368,272 11,935,782 91,614,266 95,242,608 219,477,299
2,659,860,168 2,835,375,599 1,771,129,823 227,590,543 509,868,942 107,308,993 219,477,299
Gap (asset - liabilities) 223,156,312 264,500,198 (988,155,366) 30,539,186 (82,407,288) 719,586,446 584,937,220
Cumulative liquidity gap (988,155,366) (957,616,181) (1,040,023,469) (320,437,022) 264,500,197
Off balance-sheet
Transaction related bonds and guarantees 136,163,848 136,163,848 11,965,448 19,613,726 12,336,612 92,248,061 -
Guaranteed facilities 85,513,821 85,513,821 5,276,228 2,913,364 6,576,977 68,912,931 1,834,320
Clean line facilities for letters of credit and other commitments 158,994,793 158,994,793 81,207,362 32,234,010 41,374,039 4,179,382 -
Future, swap and forward contracts 900,436,358 900,436,358 277,615,235 195,494,789 315,275,853 112,050,481 -
1,281,108,820 1,281,108,820 376,064,274 250,255,889 375,563,481 277,390,855 1,834,320
158

Access Bank Plc
Notes to consolidated financial statements
For the year ended 31 December 2016
Bank Carrying Gross nominal Less than 6 months 12 months 5 years More than
31 December 2015 amount inflow/outflow 3 months 5 years
In thousands of Naira
Cash and balances with banks 405,998,636 401,816,737 153,634,261 - - - 248,182,476
Investment under management 10,403,608 10,494,011 10,494,011 - - - -
Non-pledged trading assets
Treasury bills 50,209,443 51,656,952 7,422,310 9,865,726 34,368,916 - -
Bonds 2,025,000 3,164,736 124,584 5,988 163,571 1,909,285 961,309
Derivative financial instruments 77,852,349 77,852,349 5,318,346 3,516,433 2,244,002 66,773,568 -
Loans and advances to banks 60,414,721 60,604,713 10,074,577 10,506,757 40,023,378 - -
Loans and advances to customers
Auto Loan 5,291,292 5,354,193 28,909 63,776 287,331 4,974,178 -
Credit Card 2,812,544 2,844,021 803,177 276,313 62,959 1,701,572 -
Finance Lease 1,812,908 1,821,023 56,182 182,080 362,516 1,220,244 -
Mortgage Loan 4,359,784 4,457,798 2,180 - 106,732 856,528 3,492,357
Overdraft 179,261,680 193,682,273 147,864,068 16,685,613 29,132,592 - -
Personal Loan 17,863,573 18,073,801 139,043 139,052 429,543 17,351,454 14,708
Term Loan 745,931,312 756,385,987 67,248,846 9,265,310 19,751,013 374,068,077 286,052,411
Time Loan 285,882,216 287,502,627 240,187,156 34,055,604 12,389,723 869,501 643
Pledged assets
Treasury bills 103,684,044 107,383,986 49,586,114 27,126,779 30,671,093 - -
Bonds 96,780,580 169,457,311 704,048 3,800,952 15,294,999 33,708,112 115,949,201
Investment securities
Available for sale
Treasury bills 10,436,981 10,544,841 5,981,841 - 4,563,000 - -
Bonds 60,696,103 112,555,700 2,839,003 1,009,124 4,093,208 41,448,736 63,165,630
Held to Maturity
Treasury bills
Bonds 40,286,529 64,794,900 487,704 3,088,205 11,416,425 29,203,910 20,598,656
Other assets 69,509,746 69,509,746 27,610,999 - 21,963,481 19,935,266 -
2,231,513,050 2,409,957,705 730,607,359 119,587,712 227,324,482 594,020,431 738,417,391
Deposits from financial institutions 63,343,785 63,343,785 63,343,785 - - - -
Deposits from customers 1,528,213,883 1,528,213,884 1,404,409,821 67,792,437 55,983,485 28,141 -
Derivative financial instruments 2,416,378 2,416,378 1,842,014 574,364 - - -
Other liabilities 62,871,485 62,871,485 62,871,485 - - - -
Debt securities issued 78,516,655 120,096,325 - 3,687,605 3,687,605 112,721,115 -
Interest bearing borrowings 302,919,987 304,300,172 5,384,041 5,929,762 11,546,789 131,499,405 149,940,175
2,038,282,173 2,081,242,029 1,537,851,146 77,984,168 71,217,879 244,248,661 149,940,175
Gap (asset - liabilities) 193,230,877 328,715,676 (807,243,787) 41,603,544 156,106,603 349,771,770 588,477,216
Cumulative liquidity gap (807,243,787) (765,640,243) (609,533,640) (259,761,870) 328,715,346
Off balance-sheet
Transaction related bonds and guarantees 218,067,025 218,067,025 9,862,204 13,220,643 49,030,767 28,395,636 117,557,776
Guaranteed facilities 91,640,933 91,640,933 21,631,289 6,217,096 9,469,462 16,627,248 37,695,838
Clean line facilities for letters of credit and other commitments 160,094,292 160,094,291 105,975,243 41,958,728 8,323,794 3,836,525 -
Future, swap and forward contracts 440,800,900 440,800,900 211,365,494 69,995,407 19,930,000 139,510,000 -
910,603,150 910,603,150 348,834,229 131,391,875 86,754,023 188,369,409 155,253,614
159

Access Bank Plc
Notes to consolidated financial statements
For the year ended 31 December 2016
5.3.2 Financial instruments below and above 1 year's maturity
Group Within 12 months After 12 months Total Within 12 months After 12 months Total
In thousands of Naira
Cash and balances with banks 413,421,081 300,468,024 713,889,105 228,454,519 249,954,817 478,409,336
Investments under management 13,041,247 1,830,000 14,871,247 10,403,608 - 10,403,608
Non pledged trading assets
Treasury bills 34,381,635 - 34,381,635 50,209,443 - 50,209,443
Bonds 1,993 10,186,604 10,188,597 - 2,025,000 2,025,000
Derivative financial instruments 99,005,435 57,037,549 156,042,984 11,131,452 66,773,568 77,905,020
Loans and advances to banks 44,977,056 225,946 45,203,002 42,733,910 - 42,733,910
Loans and advances to customers
Auto Loan 474,178 3,976,569 4,450,747 375,779 5,143,269 5,519,048
Credit Card 3,873,887 105,348 3,979,235 1,168,446 1,682,974 2,851,420
Finance Lease 373,096 3,614,801 3,987,897 597,611 1,215,297 1,812,908
Mortgage Loan 24,350,127 5,870,430 30,220,556 1,057,524 23,007,615 24,065,139
Overdraft 174,352,829 936,877 175,289,705 198,318,930 - 198,318,930
Personal Loan 1,862,003 16,210,069 18,072,071 699,698 19,483,910 20,183,608
Term Loan 61,000,474 1,027,718,775 1,088,719,248 95,500,227 683,705,912 779,206,138
Time Loan 415,677,251 69,062,457 484,739,709 333,013,239 860,400 333,873,639
Pledged assets
Treasury bills 188,239,520 - 188,239,520 106,934,817 - 106,934,817
Bonds 11,757,237 114,950,745 126,707,982 11,591,562 85,189,018 96,780,580
Investment securities
Available for sale
Treasury bills 69,346,601 - 69,346,601 28,996,006 - 28,996,006
Bonds 4,363,270 28,528,579 32,891,849 2,013,715 59,190,499 61,204,214
Held to Maturity
Treasury bills 27,350,114 - 27,350,114 7,687,281 - 7,687,281
Bonds 2,199,256 38,901,757 41,101,014 9,735,814 34,007,481 43,743,295
Other assets 22,429,091 19,366,977 41,796,068 44,058,783 28,101,956 72,160,739
1,612,477,379 1,698,991,506 3,311,468,888 1,184,682,364 1,260,341,716 2,445,024,080
Deposits from financial institutions 167,356,583 - 167,356,583 72,914,421 - 72,914,421
Deposits from customers 2,080,224,795 8,972,491 2,089,197,286 1,683,216,179 28,141 1,683,244,320
Derivative financial instruments 30,444,501 - 30,444,501 3,077,927 - 3,077,927
Debt securities issued 104,164,136 212,380,366 316,544,502 - 149,853,640 149,853,640
Other liabilities 90,980,725 20,136,923 111,117,648 65,277,321 - 65,277,321
Interest-bearing borrowings 13,369,251 286,174,456 299,543,707 18,238,703 213,228,458 231,467,161
2,548,627,221 747,036,516 3,014,204,227 1,842,724,551 363,110,239 2,205,834,790
Bank Within 12 months After 12 months Total Within 12 months After 12 months Total
In thousands of Naira
Cash and balances with banks 517,997,249 - 517,997,249 157,816,159 248,182,477 405,998,636
Investment under management 14,871,247 - 14,871,247 10,403,608 - 10,403,608
Non pledged trading assets
Treasury bills 34,381,635 - 34,381,635 50,209,443 - 50,209,443
Bonds 1,993 10,186,604 10,188,597 42,554 1,982,446 2,025,000
Derivative financial instruments 98,735,112 57,037,550 155,772,662 11,078,781 66,773,568 77,852,349
Loans and advances to banks 80,951,478 23,055,096 104,006,574 60,414,721 60,414,721
Loans and advances to customers
Auto Loan 463,459 3,903,085 4,366,544 375,779 4,915,513 5,291,292
Credit Card 3,803,753 118,623 3,922,377 1,129,571 1,682,973 2,812,544
Finance Lease 373,097 3,614,801 3,987,898 597,611 1,215,297 1,812,908
Mortgage Loan 43,792 4,953,160 4,996,952 107,693 4,252,091 4,359,784
Overdraft 130,106,191 179,472 130,285,663 179,261,680 - 179,261,680
Personal Loan 1,286,581 15,502,522 16,789,104 699,698 17,163,875 17,863,573
Term Loan 38,491,569 979,154,686 1,017,646,255 95,315,746 650,615,566 745,931,312
Time Loan 343,535,968 69,031,586 412,567,554 285,021,816 860,400 285,882,216
Pledged assets
Treasury bills 188,239,520 - 188,239,520 103,684,044 103,684,044
Bonds 11,757,236 114,950,746 126,707,982 11,303,267 85,477,313 96,780,580
Investment securities
Available for sale
Treasury bills 40,960,665 - 40,960,665 10,436,981 - 10,436,981
Bonds 4,363,270 17,336,610 21,699,880 1,505,604 59,190,499 60,696,103
Held to Maturity
Treasury bills - - - - - -
Bonds 2,199,256 38,163,795 40,363,051 9,126,791 31,159,738 40,286,529
Other assets 18,724,289 14,540,783 33,265,072 40,571,033 28,938,714 69,509,747
1,531,287,361 1,351,729,119 2,883,016,480 1,029,102,584 1,202,410,470 2,231,513,049
Deposits from financial institutions 95,122,188 - 95,122,188 63,343,785 - 63,343,785
Deposits from customers 1,804,070,381 8,972,491 1,813,042,872 1,528,213,883 - 1,528,213,883
Derivative financial instruments 30,275,181 - 30,275,181 2,416,378 - 2,416,378
Debt securities issued 31,572,052 212,380,366 243,952,418 7,375,210 71,141,445 78,516,655
Other liabilities 89,211,697 16,076,027 105,287,724 62,871,485 - 62,871,485
Interest-bearing borrowings 86,005,329 286,174,456 372,179,785 1,008,489 301,911,498 302,919,987
2,136,256,828 523,603,340 2,659,860,168 1,665,229,230 373,052,943 2,038,282,173
December 2016 December 2015
December 2016 December 2015
160

Access Bank Plc
Notes to consolidated financial statements
For the year ended 31 December 2016
6 Capital management
Group Group Bank Bank
December 2016 December 2015 December 2016 December 2015
In thousands of Naira
Tier 1 capital
Ordinary share capital 14,463,986 14,463,986 14,463,986 14,463,986
Share premium 197,974,816 197,974,816 197,974,816 197,974,816
Retained earnings 93,614,030 51,730,369 93,329,188 49,459,102
Other reserves 142,194,720 85,863,421 115,910,630 84,662,091
Non-controlling interests 6,247,028 3,899,966 - -
454,494,580 353,932,558 421,678,620 346,559,995
Add/(Less):
Fair value reserve for available-for-sale (23,240,250) (13,268,889) (23,354,093) (13,291,054) Foreign currency translational reserves (11,992,025) 5,570,719 - -
Other reserves (1,211,978) (554,898) (1,008,118) (527,331)
Total Tier 1 418,050,326 345,679,491 397,316,409 332,741,610
Add/(Less):
50% Investments in subsidiaries - - (29,619,626) (22,719,623) Deferred tax assets (1,264,813) (10,845,612) - (10,180,832)
Regulatory risk reserve (42,932,550) (39,625,042) (35,058,266) (37,826,382)
Intangible assets (6,939,555) (6,440,616) (5,173,784) (4,977,908)
Adjusted Tier 1 366,913,409 288,768,221 327,464,733 257,036,865
Tier 2 capital
Debt securities issued 97,600,000 78,516,655 97,600,000 78,516,655
Fair value reserve for available-for-sale
securities
Foreign currency translational reserves 11,992,025 (5,570,719) - -
Other reserves 1,211,978 554,898 1,008,118 527,331
50% Investments in subsidiaries - - (29,619,626) (22,719,623)
Total Tier 2 134,044,253 86,769,723 92,342,587 69,615,417
Adjusted Tier 2 capital (33% of Tier 1) 122,292,239 86,769,723 92,342,587 69,615,417
Total regulatory capital 489,205,648 375,537,943 419,807,320 326,652,282
Risk-weighted assets 2,355,526,638 1,996,724,469 2,148,490,422 1,887,612,134
Capital ratios
20.77% 18.81% 19.54% 17.31%
15.58% 14.46% 15.24% 13.62%Total tier 1 capital expressed as a percentage of risk-
weighted assets
The Bank’s objectives when managing capital, which is a broader concept than the ‘equity’ on the face of the statement of financial position, are:
i) To comply with the capital requirements set by the Central Bank;
ii) To safeguard the Bank’s ability to continue as a going concern so that it can continue to provide returns for shareholders and benefits for other
stakeholders; and
iii) To maintain a strong capital base to support the development of its business.
The capital adequacy ratio is the quotient of the capital base of the Bank and the Bank's risk weighted asset base. In accordance with Central Bank of Nigeria
regulations, a minimum ratio of 16% (15% + additional 1%) is to be maintained for deposit money banks designated as significant financial institutions.
Following the CBN guideline on regulatory capital computation, the Regulatory Risk Reserve has been excluded from the capital computation. Standardised
approach has been adopted in computing the risk weighted assets for Credit, Operetional, and Market Risk. The following table provides an overview of the
development of the capital ratios and risk-weighted assets (RWA):
Total regulatory capital expressed as a percentage of
total risk-weighted assets
23,240,250 13,268,889 23,354,093 13,291,054
The regulatory capital requirements are strictly observed when managing capital. The Bank’s regulatory capital is managed by its Bank Treasury and
comprises two tiers:
- Tier 1 capital: This includes ordinary share capital, share premium, retained earnings and other reserves excluding regulatory reseres. Intangible assets,
deferred tax assets and investment in subsidiaries were also deducted from Tier I capital for capital adequacy purposes; and
- Tier 2 capital: This includes fair value reserves, foreign currency translation reserves with adjustments for investments in subsidiaries.
161

Access Bank Plc
Notes to consolidated financial statements
For the year ended 31 December 2016
7 Operating segments
•
•
•
•
Sales between segments are carried out at arm’s length. The revenue from external parties reported to the executive committee is measured in a
manner consistent with that in the income statement.
Unallocated Segments represents all other transactions than are outside the normal course of business and can not be directly related to a
specific segment financial information.
Thus, in essence, unallocated segments reconcile segment balances to group balances. Material items comprising total assets and total liabilities
of the unallocated segments have been outlined below;
All of the Segments reported at the end of the year had its,
- Reported revenue, from both external customers and intersegment sales or transfers, 10 per cent or more of the combined revenue, internal
and external, of all operating segments, or
-the absolute measure of its reported profit or loss 10 per cent or more of the greater, in absolute amount, of
(i) the combined reported profit of all operating segments that did not report a loss and
(ii) the combined reported loss of all operating segments that reported a loss, or
-its assets are 10% or more of the combined assets of all operating segments.
Business Banking - The Business banking division is a hybrid of Commercial and Personal Banking Divisions. It focuses on small and
medium scale enterprises providing them with business solutions to support their growing business needs. The division delivers commercial
banking products and services to SME customers with annual turnover of less than 1billion.
The Group has four reportable segments, as described below, which are the Group’s strategic business units. The strategic business units offer
different products and services, and are managed separately based on the Group’s management and internal reporting structure. For each of the
strategic business units, the Executive Management Committee reviews internal management reports on at least a quarterly basis. The Group
presents segment information to its Executive Committee, which is the Group’s Chief Operating Decision Maker, based on International
Financial Reporting Standards.
Basing on the market segment and extent of customer turnover, the group reformed the arrangement of segments from previous years into four
operational segments as described below;
Corporate and Investment Banking - The division provides bespoke comprehensive banking products and a full range of services to
multinationals, large domestic corporates and other institutional clients. The division focuses on customers in key industry sector with
minimum annual turnover of N20Billion. It also provides innovative finance solutions to meet the short, medium and long-term financing
needs for the Bank’s clients as well as relationship banking services to the Bank's financial institutions customers.
Commercial banking - The commercial banking division has presence in all major cities in the country. It provides commercial banking
products and services to the non-institutional clients, medium and small corporate segments of the Nigerian market whose annual turnover
is above N1bn. The division also provides financial services to public sector, commercial institutions and oriental corporates.
Personal banking – The personal banking division is the retail arm of the bank which provides financial products and services to
individuals (personal and inclusive segments) and private banking segment. The private banking segment focuses on offering bespoke
services to High Net worth Individuals (HNI) and Ultra High Net worth Individuals (UHNI) by handling their wealth portfolio needs both
locally and abroad. The division provides financial solutions across various channels (ATM, Mobile banking, etc) and platforms.
162

Access Bank Plc
Notes to consolidated financial statements
For the year ended 31 December 2016
Material total assets and liabilities Group Group
December December
In thousands of Naira 2016 2015
Other Assets 63,255,054 83,014,503
Deferred tax (net) 1,264,813 10,845,612
Assets Held for Sale 140,727 179,843
Goodwill 681,007 681,007
65,341,601 94,720,965
Other liabilities 113,571,240 69,355,947
Debt Securities issued 316,544,502 149,853,640
Interest-bearing loans and borrowings 299,543,707 231,467,161
Deferred tax 3,699,050 266,644
Retirement Benefit Obligation 3,075,453 5,567,800
Total liabilities 736,433,952 456,511,192
Material revenue and expenses
Group Group
December December
2016 2015
Interest expense
Interest expense on Eurobond (18,369,256) (12,474,603)
163

Access Bank Plc
Notes to consolidated financial statements
For the year ended 31 December 2016
7a Operating segments (continued)
31 December 2016
Corporate &
Investment Commercial Business Personal Unallocated Total continuing Total
In thousands of Naira Banking Banking Banking Banking Segments operations
Revenue:
Derived from external customers 141,391,638 145,070,057 29,336,906 65,522,183 - 381,320,783 381,320,783
Derived from other business segments (897) (2,251) 1,063 2,084 - 0.00 0.00
Total Revenue 141,390,741 145,067,806 29,337,969 65,524,267 - 381,320,783 381,320,783
Interest Income 75,569,180 116,850,109 22,723,799 32,143,548 - 247,286,635 247,286,635
Interest expenses (34,582,829) (38,394,292) (7,051,917) (9,740,581) (18,369,256) (108,138,875) (108,138,875)
Impairment Losses (9,374,089) (10,448,863) (1,238,648) (891,219) - (21,952,819) (21,952,819)
Profit/(Loss) on ordinary activities before taxation 49,260,836 47,314,951 424,158 11,708,767 (18,369,256) 90,339,456 90,339,456
Share of profit from associate - - - - - - -
Income tax expense - - - - - (18,900,109) (18,900,109)
Profit after tax 71,439,347 71,439,347
Other segment information:
Depreciation and amortisation (607,070) (2,279,376) (4,066,223) (4,341,123) - (11,293,791) (11,293,791)
Assets and liabilities:
Loans and Advances to customers 702,318,575 1,028,136,471 66,283,947 57,923,181 - 1,854,662,174 1,854,662,174
Goodwill - - - - 681,007 681,007 681,007
Tangible segment assets 1,303,757,470 1,886,823,131 121,643,467 106,299,895 - 3,418,523,962 3,418,523,962
Unallocated segment assets - - - - 65,341,601 65,341,601 65,341,601
Total assets 1,303,757,470 1,886,823,131 121,643,467 106,299,895 65,341,601 3,483,865,563 3,483,865,563
Deposits from customers 480,494,494 970,978,683 243,016,286 394,707,823 - 2,089,197,286 2,089,197,286
Segment liabilities 358,575,114 1,407,188,270 254,397,381 284,733,397 - 2,304,894,163 2,304,894,163
Unallocated segment liabilities - - - - 724,476,821 724,476,821 724,476,821
Total liabilities 358,575,114 1,407,188,270 254,397,381 284,733,397 724,476,821 3,029,370,984 3,029,370,984
Net assets 945,182,356 479,634,861 (132,753,914) (178,433,503) (659,135,220) 454,494,580 454,494,580
164

Access Bank Plc
Notes to consolidated financial statements
For the year ended 31 December 2016
31 December 2015
Operating segments (continued)
Corporate &
Investment Commercial Business Personal Unallocated Total continuing Total
In thousands of Naira Banking Banking Banking Banking Segments operations
Revenue:
Derived from external customers 142,760,590 119,234,984 28,183,640 47,225,016 - 337,404,230 337,404,230
Derived from other business segments (32,954) 18,809 5,723 8,422 - - -
Total Revenue 142,727,636 119,253,793 28,189,363 47,233,438 - 337,404,230 337,404,230
Interest Income 72,223,695 86,725,818 19,618,182 29,235,074 - 207,802,768 207,802,768
Interest expenses (34,397,761) (36,412,832) (7,314,258) (11,821,664) (12,474,603) (102,421,118) (102,421,118)
Impairment Losses (9,218,707) (2,558,182) (442,433) (2,005,393) - (14,224,715) (14,224,715)
-
Profit/(Loss) on ordinary activities before taxation 60,012,005 31,758,802 (5,097,804) 839,717 (12,474,603) 75,038,117 75,038,117
Share of profit from associate -
Income tax expense (9,169,344) (9,169,344)
Profit after tax 65,868,773 65,868,773
Other segment information:
Depreciation and amortisation (549,825) (2,036,605) (3,633,139) (3,878,760) - (10,098,330) (10,098,330)
Assets and liabilities:
Loans and Advances to customers 552,849,791 716,514,393 47,951,257 48,515,390 - 1,365,830,831 1,365,830,831
Goodwill 681,007 681,007 681,007
Tangible segment assets 1,010,348,609 1,310,332,904 87,691,344 88,723,007 - 2,497,095,864 2,497,095,864
Unallocated segment assets - - - - 94,234,287 94,234,287 94,234,287
Total assets 1,010,348,609 1,310,332,904 87,691,344 88,723,007 94,234,287 2,591,330,151 2,591,330,151
Deposits from customers 457,760,677 678,870,157 202,449,439 344,164,047 - 1,683,244,320 1,683,244,320
Segment liabilities 480,542,909 712,656,760 212,525,120 361,292,703 - 1,767,017,492 1,767,017,492
Unallocated segment liabilities - - - - 456,511,195 456,511,195 456,511,195
Total liabilities 480,542,909 712,656,760 212,525,120 361,292,703 456,511,195 2,223,528,687 2,223,528,687
Net assets 529,805,700 597,676,144 (124,833,776) (272,569,696) (362,276,908) 367,801,464 367,801,464
165

Access Bank Plc
Notes to consolidated financial statements
For the year ended 31 December 2016
7b Geographical segments
The Group operates in three geographic regions, being:
• Nigeria
• Rest of Africa
• Europe
Total
31 December 2016 Rest of Continuing Discontinued
In thousands of Naira Nigeria Africa Europe Operations Operations Total
Derived from external customers 331,000,972 42,385,383 7,934,428 381,320,783 - 381,320,783
Derived from other segments - - - - - -
Total Revenue 331,000,972 42,385,383 7,934,428 381,320,783 - 381,320,783
Interest Income 210,794,456 10,563,845 25,928,334 247,286,635 - 247,286,635
Impairment Losses (17,641,128) (4,311,692) - (21,952,819) - (21,952,819)
Interest expense (94,777,050) (9,086,318) (4,275,507) (108,138,875) - (108,138,875)
Fee and commission expenses 45,992,484 5,372,046 3,499,274 54,863,803 - 54,863,803
Operating Income 236,223,922 33,299,065 3,658,921 273,181,908 - 273,181,908
Profit/(loss) before income tax 80,579,577 5,257,274 4,502,605 90,339,456 - 90,339,456
Assets and liabilities:
Loans and Advances to customers 1,698,568,920 92,329,154 63,764,101 1,854,662,174 - 1,854,662,174
Non current assets
Goodwill - 681,007 - 681,007 - 681,007
Total assets 3,094,960,515 163,680,065 225,224,983 3,483,865,563 - 3,483,865,563
Deposit from customers 1,813,042,872 204,070,854 72,083,559 2,089,197,286 - 2,089,197,286
Total liabilities 2,673,281,895 155,654,753 200,434,335 3,029,370,984 - 3,029,370,984
Net assets 421,678,620 8,025,311 24,790,648 454,494,580 - 454,494,580
166

Access Bank Plc
Notes to consolidated financial statements
For the year ended 31 December 2016
Total
Rest of continuing Discontinued
31 December 2015 Nigeria Africa Europe operations operations Total
Derived from external customers 302,061,975 28,852,495 6,489,760 337,404,230 - 337,404,230
Derived from other segments - - - - - -
Total Revenue 302,061,975 28,852,495 6,489,760 337,404,230 - 337,404,230
Interest Income 184,047,834 21,084,615 2,670,320 207,802,769 - 207,802,769
Impairment Losses (13,287,613) (937,101) - (14,224,714) - (14,224,714)
Interest expense (94,001,878) (5,626,676) (2,792,564) (102,421,118) - (102,421,118)
Fee and commission expenses - - (151,118) (151,118) - (151,118)
Operating Income 208,060,097 23,225,819 3,697,196 234,983,112 - 234,983,112
Profit/(loss) before income tax 65,169,612 7,279,608 2,588,897 75,038,117 - 75,038,117
Assets and liabilities:
Loans and Advances to customers 1,243,215,309 79,853,950 42,761,573 1,365,830,832 - 1,365,830,832
Non current assets 70,878,291 8,570,473 321,779 79,770,543 - 79,770,543
Goodwill - 681,007 - - -
Total assets 2,408,096,499 110,273,966 72,959,686 2,591,330,151 - 2,591,330,151
Deposit from customers 1,528,213,883 129,457,229 25,573,208 1,683,244,320 - 1,683,244,320
Total liabilities 2,047,932,763 104,726,423 70,869,501 2,223,528,687 - 2,223,528,687
Net assets 360,163,736 5,547,543 2,090,185 367,801,464 - 367,801,464
No revenue from transaction with a single external customer or a group of connected economic entities or counterparty amounted to 10% or more of the group's total revenue in year ended 31 December 2016
and for the year ended 31 December 2015. Information on revenue from external customers for each product and service had not been disclosed as the information is not readily available to the chief operating
decision maker and the cost to develop is considered excessive.
167

Access Bank Plc
Notes to consolidated financial statements
For the year ended 31 December 2016
8 Interest income
Group Group Bank Bank
In thousands of Naira December 2016 December 2015 December 2016 December 2015
Interest income
Cash and balances with banks 1,929,092 3,694,903 1,328,371 2,502,485
Loans and advances to banks 1,587,816 864,610 149,624 340,830
Loans and advances to customers 198,886,057 158,888,873 172,571,696 142,481,073
Investment securities
-Available for sale 16,769,084 14,686,495 15,366,667 13,608,530
-Held for trading 7,896,097 13,005,140 7,876,048 13,005,140
-Held to maturity 20,218,489 16,662,747 13,502,050 12,109,776
247,286,635 207,802,768 210,794,456 184,047,834
Interest expense
Deposit from financial institutions 7,434,354 8,884,392 6,822,272 6,939,364
Deposit from customers 77,187,483 79,630,442 60,921,911 71,578,103
Debt securities issued 18,369,256 12,474,603 13,569,723 7,321,901
Interest bearing borrowings and other borrowed funds 5,147,782 1,393,690 13,463,144 8,162,510
Securities dealing - 37,991 - -
108,138,875 102,421,118 94,777,050 94,001,878
Net interest income 139,147,760 105,381,650 116,017,406 90,045,956
9 Net impairment charge on financial assets
Group Group Bank Bank
In thousands of Naira December 2016 December 2015 December 2016 December 2015
Impairment charge on available for sale - (180,380) -
(21,952,819) (14,224,715) (17,641,127) (13,287,613)
10 Fee and commission income
Group Group Bank Bank
In thousands of Naira December 2016 December 2015 December 2016 December 2015
Credit related fees and commissions 17,921,606 15,032,494 12,487,249 12,829,413
Account maintenance charge and handling commission 2,615,538 3,202,396 2,203,851 2,752,784
Commission on bills and letters of credit 2,930,468 3,449,461 2,632,733 1,229,321
Commissions on collections 105,197 571,766 71,022 94,391
Commission on other financial services 3,324,878 2,652,955 1,664,160 1,253,290
Commission on virtual products 4,102,877 2,375,326 3,005,484 1,791,939
Commission on foreign currency denominated transactions 2,819,128 1,908,923 2,569,588 1,831,604
Channels and other E-business income 21,296,440 3,935,825 21,102,094 3,804,380
Retail account charges 324,368 334,741 256,303 305,162
55,440,500 33,463,887 45,992,484 25,892,284
17,151,635 19,431,462 15,507,373
11 Net gains on investment securities
a Net gains on financial instruments designated as held for trading
Group Group Bank Bank
In thousands of Naira December 2016 December 2015 December 2016 December 2015
Fixed income securities 3,257,368 1,626,520 3,219,242 1,561,951
Derivative instruments 50,105,544 52,310,262 50,061,509 52,336,417
53,362,912 53,936,782 53,280,751 53,898,368
Interest income for the year ended 31 December 2016 includes interest accrued on impaired financial assets of Group: N2.24Bn (31 December 2015: N2.59Bn)
and Bank: N1.74Bn (31 December 2015: N2.57Bn).
Additional collective impairment charges on loans and advances to
banks(note 22)
(17,874,149)
(2,745) (14,300) (2,745) (14,300)
Additional specific impairment charges on loans and advances to
customers (see note 23) (3,643,214)
(2,458,338) (2,742,435)
The increase in interest income is attributable to the increase in value of loans and advances to customers, the impact of currency devaluation and repricing.
Credit related fees and commissions are fees charged to corporate customers other than fees included in determining the effective interest rates relating to loans
and advances carried at amortized cost.
Channels and other E-business income include income from electronic channels, card products and related services.
The increase in channels and other E-business income is a result of increase in volume of e-channel and card transactions.
(2,833,064)
Additional collective impairment charges on loans and advances to
customers (note 23) (7,193,834)
(13,846,554)
(7,066,882)
Additional impairment allowance on financial assets in other assets
(see note 26) (1,321,935) (1,321,935) (3,204,542) (3,204,542)
(180,380)
168

Access Bank Plc
Notes to consolidated financial statements
For the year ended 31 December 2016
b Net gains on financial instruments held as available for sale
Group Group Bank Bank
In thousands of Naira December 2016 December 2015 December 2016 December 2015
Fixed income securities 1,688,166 8,801,232 1,688,166 8,801,232
1,688,166 8,801,232 1,688,166 8,801,232
Total 55,051,078 62,738,014 54,968,917 62,699,600
12 Net foreign exchange income/(loss)
Group Group Bank Bank
In thousands of Naira December 2016 December 2015 December 2016 December 2015
Foreign exchange trading income (net) 8,844,295 36,890,498 5,232,111 33,711,384
(5,246,704) (10,388,816) (5,326,545) (10,506,119)
3,597,591 26,501,682 (94,434) 23,205,265
13 Other operating income
Group Group Bank Bank
In thousands of Naira December 2016 December 2015 December 2016 December 2015
Dividends on available for sale equity securities 860,339 3,734,392 860,339 4,190,824
Gain on disposal of property and equipment 167,340 151,937 143,985 138,975
Rental income 43,839 90,719 36,509 90,719
Bad debt recovered 808,458 1,343,966 631,191 635,355
Cash management charges 265,683 322,248 265,683 322,248
Income from agency and brokerage 191,507 89,093 180,308 89,083
Income from asset management - 271,124 - -
Income from other investments 1,258,607 680,008 1,012,251 680,008
Income from disposal of available for sale securities 16,206,410 - 16,206,410 -
Income from other finacial services 142,795 214,392 2,873 69,780
19,944,978 6,897,879 19,339,549 6,216,992
14 Personnel expenses
Group Group Bank Bank
December 2016 December 2015 December 2016 December 2015
In thousands of Naira
Wages and salaries 47,950,743 39,187,244 38,824,275 33,636,094
1,196,995 784,305 1,196,995 784,305
Contributions to defined contribution plans (a) 1,586,730 1,811,510 1,247,540 742,746
Restricted Share Performance Plan (b) 1,061,070 563,893 884,777 536,326
51,795,538 42,346,952 42,153,587 35,699,471
(a)
(b)
Net gains on financial instruments classified as held for trading includes the gains and losses arising both on the purchase and sale of trading instruments and
from changes in fair value.
The increase in the defined contribution plan is due to:
(i) increase in the rate of the bank’s contribution from 7.5% to 10% towards the end of financial year ended 31 December 2015. (see note 3.19(a))
(ii) general raise in employees’ emoluments during the year.
Increase in liability for long term incentive plan
(see note 37 (a) (i))
Included in income from agency and brokerage is an amount of N79.746m representing the referral commission earned from bancassurance products.
The income from sale of other investments represents a gain of N16.2bn on the divestment of the Bank's 17.65 percent equity stake in
StanbicIBTC Pension Managers. This divestment was done in compliance with the Central Bank of Nigeria (CBN) directive.
Gain on financial instrument relates to fair value increase arising from derivative instruments to which the bank is a party in the normal course of businessand are
held at fair value. Derivative financial instruments consist of forward, swap and future contracts.
Unrealised foreign exchange loss on revaluation
Under the Restricted Share Performance Plan (RSPP), shares of the Bank are awarded to employees based on their performance at no cost to them. Under the
terms of the plan, the shares vest over a 3 year period from the date of award. The scheme applies to only employees of the Bank that meet the stipulated
performance criteria irrespective of where they work within the Group. The RSPP is an equity-settled scheme, where the Bank recognizes an expense and a
corresponding increase in equity. Initial estimates of the number of equity settled instruments that are expected to vest are adjusted to current estimates and
ultimately to the actual number of equity settled instruments that vest unless differences are due to market conditions.
169

Access Bank Plc
Notes to consolidated financial statements
For the year ended 31 December 2016
(i)
(ii) The number and weighted-average exercise prices of shares has been detailed in table below;
Group
Description of sharesNumber of
Shares
Weighted Share
Price per Share -
Naira
Number of
Shares
Weighted Share
Price per Share -
Naira
(i) Shares allocated to staff at start of the year; 209,554,491 7.56 77,782,273 10.51
(ii) Shares allocated during the year 349,775,330 5.19 186,657,709 6.90
(iii) Forfeited during the year; (14,057,608) 5.20 (28,404,021) 9.02
(iv) Exercised during the year; (41,392,368) 9.76 (26,481,470) 11.50
(v) Shares allocated to staff at end of the year; 503,879,845 5.01 209,554,491 7.56
Shares under the scheme at the end of the year 552,268,754 5.21 219,631,895 7.33
Naira ('000) Price per Share -
Naira
Naira ('000) Price per Share -
Naira
Share based expense recognised during the year 1,061,070 5.01 563,893 7.56
Outstanding allocated shares to staff at the end of the year have the following maturity dates
Vesting period Expiry date Shares
Outstanding allocated shares for the 2015 - 2017 vesting period 2015 - 2017 31 Dec 2017 179,213,137
Outstanding allocated shares for the 2016 - 2018 vesting period 2016 - 2018 31 Dec 2018 324,666,708
503,879,845
Bank
Description of sharesNumber of
Shares
Weighted Share
Price per Share -
Naira
Number of
Shares
Weighted Share
Price per Share -
Naira
(i) Shares allocated to staff at start of the year; 202,485,483 7.56 77,782,273 10.51
(ii) Shares allocated during the year 323,721,330 5.19 168,331,092 6.90
(iii) Forfeited during the year; (14,057,608) 5.20 (17,146,412) 9.02
(iv) Exercised during the year; (41,392,368) 9.76 (26,481,470) 11.50
(v) Shares allocated to staff at end of the year; 470,756,837 5.76 202,485,483 7.56
(vi) Shares under the scheme at the end of the period 519,145,746 5.93 219,631,895 7.30
Naira ('000) Price per Share -
Naira
Naira ('000) Price per Share -
Naira
Share based expense recognised during the year 884,777 5.76 536,326 7.56
Outstanding allocated shares to staff at the end of the year have the following maturity dates
Vesting period Expiry date Shares
Outstanding allocated shares for the 2015 - 2017 vesting period 2015 - 2017 31 Dec 2017 172,144,129
Outstanding allocated shares for the 2016 - 2018 vesting period 2016 - 2018 31 Dec 2018 298,612,708
470,756,837
Group Group Bank Bank
December 2016 December 2015 December 2016 December 2015
Years Years Years Years
Weighted average contractual life of remaining shares 1.64 1.80 1.63 1.78
By the resolution of the Board and Shareholders, the Bank sets aside an amount not exceeding twenty (20) per cent of the aggregate emoluments of the Bank's
employees in each financial year to purchase shares of the Bank from the floor of the Nigerian Stock Exchange for the purpose of the plan. The Bank has also
established a Structured Entity (SE) to hold shares of the Bank purchased. Upon vesting, the SE transfers the shares to the employee whose interest has vested.
The SE is consolidated in the Group's financial statements.
The shares allocated to staff has a contractual vesting period of three (3) years commencing from the year of purchase/allocation to the staff. The group has no
legal or constructive obligation to repurchase or settle on a cash basis.
December 2015December 2016
December 2016 December 2015
The weighted average remaining contractual life of the outstanding allocated shares is :
170

Access Bank Plc
Notes to consolidated financial statements
For the year ended 31 December 2016
ii. The average number of persons other than directors, in employment at the Group level during the year comprise:
Group Group Bank Bank
December 2016 December 2015 December 2016 December 2015
Number Number Number Number
Managerial 307 313 242 257
Other staff 3,797 3,563 2,723 2,540
4,104 3,876 2,965 2,797
iii.
Group Group Bank Bank
December 2016 December 2015 December 2016 December 2015
Number Number Number Number
Below N900,000 306 182 - -
N900,001 - N1,990,000 408 78 9 9
N1,990,001 - N2,990,000 158 164 - -
N2,990,001 - N3,910,000 71 1,098 - 771
N3,910,001 - N4,740,000 1,040 22 1,028 -
N4,740,001 - N5,740,000 21 733 - 666
N5,740,001 - N6,760,000 660 603 648 485
N6,760,001 - N7,489,000 31 35 - -
N7,489,001 - N8,760,000 481 333 446 317
N8,760,001 - N9,190,000 311 7 306 -
N9,190,001 - N11,360,000 29 194 1 174
N11,360,001 - N14,950,000 296 140 276 118
N14,950,001 - N17,950,000 10 132 - 122
N17,950,001 - N21,940,000 177 63 167 55
N21,940,001 - N26,250,000 43 2 38 -
N26,250,001 - N30,260,000 3 45 - 42
N30,261,001 - N45,329,000 44 34 37 32
Above N45,329,000 15 11 9 6
4,104 3,876 2,965 2,797
15 Other operating expenses
Group Group Bank Bank
In thousands of Naira December 2016 December 2015 December 2016 December 2015
Premises and equipment costs 8,170,973 7,824,339 6,627,493 6,968,940
Professional fees 2,119,700 3,379,829 1,558,808 1,988,530
Insurance 1,093,148 1,532,297 893,562 786,912
Business travel expenses 6,980,197 5,493,383 6,442,064 5,280,043
12,059,720 9,909,779 12,059,720 9,909,779
Deposit insurance premium 6,002,813 5,315,812 6,002,813 5,315,812
Auditor's remuneration 460,182 378,789 350,000 300,000
Administrative expenses 16,513,674 11,636,026 15,347,843 11,011,901
Board expenses 526,108 378,690 386,684 368,473
Communication expenses 2,523,023 3,635,731 1,698,749 3,521,714
Consultancy and IT expenses 13,983,760 12,873,441 12,246,639 9,056,513
Outsourcing costs 7,626,411 8,016,460 6,750,086 7,997,658
Advertisements and marketing expenses 4,211,075 6,524,647 3,771,607 6,493,271
Recruitment and training 1,639,273 1,861,726 1,342,458 1,822,435
Events, charities and sponsorship 2,618,909 3,693,924 2,447,297 3,685,736
Periodicals and subscriptions 1,007,974 645,417 869,154 638,090
Security expenses 3,104,455 3,574,685 2,691,644 3,548,163
Cash processing and management cost 1,671,083 1,224,895 1,548,319 1,224,895
Stationeries, postage and printing 1,576,253 1,486,600 1,205,990 1,486,600
Office provisions and entertainment 475,289 337,893 297,801 337,893
Net litigations claims (see note 34(i) 49,496 909,660 49,496 909,660
94,413,516 91,384,023 84,588,227 83,403,018
43,457,077 29,057,570
50,956,439 91,384,023 84,588,227 54,345,448
(a)
Employees, other than directors, earning more than N900,000 per annum, whose duties were wholly or mainly discharged in Nigeria, received remuneration
(excluding pension contributions and certain benefits) in the following ranges:
Asset Management Corporation of Nigeria (AMCON) surcharge (see
note (a) below)
This represents the Group’s contribution to AMCON’s sinking fund for the year ended 31 December 2016. Effective 1 January 2011, the banks in Nigeria were
required to contribute 0.3% of total assets as at the preceding year end to AMCON's sinking fund in line with existing guidelines. This was increased to 0.5% in
2013. The contribution to AMCON is a levy on all deposit money banks in Nigeria. It is non-refundable and does not represent any ownership interest nor does it
confer any rights or obligations (save to pay the levy) on the contributor.
171

Access Bank Plc
Notes to consolidated financial statements
For the year ended 31 December 2016
16 Income tax expense
Group Group Bank Bank
December 2016 December 2015 December 2016 December 2015
In thousands of Naira
Current tax expense
Corporate income tax 6,096,035 7,841,533 3,571,312 5,207,035
IT tax 805,796 643,078 805,796 643,078
Education tax - - - -
Capital gains tax 3,808 511 3,808 511
Prior year’s under provision - - - -
6,905,639 8,485,122 4,380,916 5,850,624
Deferred tax expense
Origination of temporary differences 11,994,470 684,222 12,172,525 402,545
Income tax expense 18,900,109 9,169,344 16,553,441 6,253,169
The movement in the current income tax liability �is as follows:
Group Group Bank Bank
December 2016 December 2015 December 2016 December 2015
Balance at the beginning of the year 7,780,824 8,180,969 6,442,311 7,113,226
Tax paid (8,007,140) (6,259,617) (5,222,302) (4,125,701)
Income tax charge 6,905,639 8,485,122 4,380,916 5,850,624
Witholding tax utilisation (596,764) (2,395,838) (596,763) (2,395,838)
Reclassifications - (83,009) - -
Translation adjustments (143,897) (129,492) - -
Income tax receivable - (17,311) - -
Balance at the end of the year 5,938,662 7,780,824 5,004,160 6,442,311
Income tax liability is to be settled within one year
Group Group Group Group
In thousands of Naira December 2016 December 2016 December 2015 December 2015
Profit before income tax 90,339,456 75,038,117
Income tax using the domestic tax rate 30% 27,101,837 30% 22,511,435
Effect of tax rates in foreign jurisdictions 0% (399,963) 0% -
Information technology tax 1% 805,796 1% 643,078
Capital allowance utilised for the year 0% - 0% -
Non-deductible expenses 20% 18,083,506 39% 29,584,951
Tax exempt income -36% (32,335,829) -66% (49,475,519)
Tax losses unutilised 0% - 1% 697,854
Capital gain tax 0% 3,808 0% 510
Impact of dividend as tax base 6% 5,640,954 7% 5,207,035
Effective tax rate 21% 18,900,109 12% 9,169,344
Bank Bank Bank Bank
December 2016 December 2016 December 2015 December 2015
In thousands of Naira
Profit before income tax - 80,579,576 - 65,177,914 Income tax using the domestic tax rate 30% 24,173,873 30% 19,553,374 Effect of tax rates in foreign jurisdictions 0% - 0% - Information technology tax 1% 805,796 1% 643,078
Non-deductible expenses 23% 18,188,958 43% 28,315,770
Tax exempt income -40% (32,259,947) -73% (47,466,598)
Education tax levy 0% - 0% -
Capital gain tax 0% 3,808 0% 510
Over provided in prior years 0% - 0% -
Impact of dividend as tax base 7% 5,640,953 8% 5,207,035
Effective tax rate 21% 16,553,441 10% 6,253,169
172

Access Bank Plc
Notes to consolidated financial statements
For the year ended 31 December 2016
17 Earnings per share
(a) Basic from continuing operations
Group Group Bank Bank
In thousands of Naira December 2016 December 2015 December 2016 December 2015
Profit for the year from continuing operations 71,117,025 65,332,540 64,026,135 58,924,745
Weighted average number of ordinary shares in issue 28,927,972 24,897,936 28,927,972 24,897,936
Weighted average number of treasury Shares 461,618 240,850 -
28,466,354 24,657,086 28,927,972 24,897,936
In kobo per share
Basic earnings per share from continuing operations 250 265 221 237
Potential Diluted EPSGroup Group Bank Bank
In thousands of Naira December 2016 December 2015 December 2016 December 2015
Profit for the year from continuing operations 71,117,025 65,332,540 64,026,135 58,924,745
Weighted average number of ordinary shares in issue 28,927,972 24,897,936 28,927,972 24,897,936
In kobo per share
Diluted earnings per share from continuing operations 246 262 221 237
18 Cash and balances with banks
Group Group Bank Bank
In thousands of Naira December 2016 December 2015 December 2016 December 2015
Cash on hand and balances with banks (see note (i)) 115,380,195 85,299,149 106,594,205 57,546,509
Restricted deposits with central banks (see note (ii)) 250,831,529 249,954,817 248,547,664 248,182,477
Unrestricted balances with central banks 139,954,922 90,721,388 33,160,736 74,158,434
Money market placements 119,826,012 52,433,982 41,798,197 26,111,216
Other deposits with central banks (see note (iii)) 87,896,447 - 87,896,447 -
713,889,105 478,409,336 517,997,249 405,998,636
(i)
(ii)
(ii)
Basic earnings per share is calculated by dividing the profit attributable to equity holders of the company by the weighted average number of ordinary shares in issue
during the year excluding ordinary shares purchased by the company and held as treasury shares.
Included in cash on hand and balances with banks is an amount of N46.956Bn (31 Dec 2015: N6.567Bn) representing the Naira value of foreign
currencies held on behalf of customers to cover letter of credit transactions. The corresponding liability is included in customer's deposit for foreign
trade reported under other liabilities (see Note 34). This has been excluded for cash flow purposes.
Restricted deposits with central banks comprise the cash reserve requirements of the Central Bank of Nigeria and other central banks of jurisdictions
that the group operates in. These balances are not available for day to day operations of the group.
Other deposits with central banks comprise a special intervention fund with the Central Bank of Nigeria of N49.6Bn introduced in January 2016 as a
reduction in the cash reserve ratio with a view of channeling the reduction to financing the real sector. The special intervention fund is restricted and
not available for day to use by the Bank. The balance of N38.26Bn represents the nominal value held for outstanding forward contracts entered on
behalf of customers with Central Bank of Nigeria.
Diluted earnings per share is calculated by considering the impact of the treasury shares in weighted average number of ordinary shares outstanding
173

Access Bank Plc
Notes to consolidated financial statements
For the year ended 31 December 2016
19 Investment under management
Group Group Bank Bank
In thousands of Naira December 2016 December 2015 December 2016 December 2015
Relating to unclaimed dividends:
Call Deposits and Cash - 918 - 918
Placements 1,070,385 4,926,562 1,070,385 4,926,562
Commercial Paper 6,454,067 304,378 6,454,067 304,378
Nigerian Treasury Bills 2,887,102 3,090,432 2,887,102 3,090,432
Mutual Funds 2,629,693 2,081,318 2,629,693 2,081,318
Eurobonds 1,830,000 - 1,830,000 -
14,871,247 10,403,608 14,871,247 10,403,608
20 Non pledged trading assets
Group Group Bank Bank
In thousands of Naira December 2016 December 2015 December 2016 December 2015
Government bonds 10,170,293 1,961,355 10,170,293 1,961,355
Eurobonds 18,304 63,645 18,304 63,645
Treasury bills 34,381,635 50,209,443 34,381,635 50,209,443
Equity securities 59,348 63,979 59,348 63,979
44,629,579 52,298,422 44,629,579 52,298,422
The Bank entrusted the sum transferred to it by the Registrars in respect of unclaimed dividends with select Asset Managers who will ensure
safekeeping and manage the funds for the benefit of the Bank. The investments by the Asset Managers are as listed above (the corresponding liability
which is due to the Registrar is reported in Other liabilities. See note 34).
174

Access Bank Plc
Notes to consolidated financial statements
For the year ended 31 December 2016
21 Derivative financial instruments
In thousands of Naira
Group
Foreign exchange derivatives
Total derivative assets 709,617,853 156,042,984 347,991,933 77,905,020
390,410,492 65,280,723 - -
319,207,362 90,762,261 347,991,933 77,905,020
223,456,040 (30,444,501) 120,767,876 (3,077,927)
41,349,705 (10,668,411) - -
182,106,335 (19,776,089) 120,767,876 (3,077,927)
Bank
Foreign exchange derivatives
698,771,698 155,772,662 340,643,495 77,852,349
319,207,362 65,280,723 - -
379,564,336 90,491,939 340,643,495 77,852,349
201,664,660 (30,275,181) 100,157,405 (2,416,378)
41,349,705 (10,668,411) - -
160,314,955 (19,606,770) 100,157,405 (2,416,378)
22 Loans and advances to banks
Group Group Bank Bank
December 2016 December 2015 December 2016 December 2015
In thousands of Naira
Loans and advances to banks 45,226,388 42,742,996 104,029,960 60,423,807
Less collective allowances for impairment (23,386) (9,086) (23,386) (9,086)
45,203,002 42,733,910 104,006,574 60,414,721
Collective allowances for impairment on loans and advances to banks
Group Group Bank Bank
December 2016 December 2015 December 2016 December 2015
In thousands of Naira
Balance beginning of year 9,086 6,341 9,086 6,341
- Charge for the year 14,300 2,745 14,300 2,745
Balance end of year 23,386 9,086 23,386 9,086
8,197.0
23 Loans and advances to customers
a Group
Specific Collective Total
December 2016 Gross impairment impairment impairment Carrying
In thousands of Naira amount allowance allowance allowance amount
Loans to individuals
Retail Exposures
Auto Loan (note 23c) 2,511,013 - (42,628) (42,628) 2,468,384
Credit Card 3,475,443 (4,367) (58,216) (62,583) 3,412,860
Finance Lease (note 23c) 60,912 - (1,053) (1,053) 59,859
Mortgage Loan 24,375,564 - (79,867) (79,867) 24,295,697
Overdraft 5,639,049 (264,216) (538,680) (802,896) 4,836,153
Personal Loan 18,754,870 (286,847) (395,950) (682,798) 18,072,072
Term Loan 6,964,075 - (46,451) (46,451) 6,917,624
Time Loan 721,711 - (11,667) (11,667) 710,044
Loans to corporate entities and other organizations
Non-Retail Exposures
Auto Loan (note 23c) 2,003,352 - (20,988) (20,988) 1,982,363
Credit Card 576,553 - (10,178) (10,178) 566,375
Finance Lease (note 23c) 3,946,347 - (18,308) (18,308) 3,928,038
Mortgage Loan 5,929,037 - (4,176) (4,176) 5,924,860
Overdraft 181,242,213 (8,677,151) (2,111,510) (10,788,661) 170,453,552
Term Loan 1,102,912,471 (5,523,054) (15,587,792) (21,110,846) 1,081,801,625
Time Loan 486,052,855 (92) (2,023,099) (2,023,191) 484,029,663
1,845,165,464 (14,755,727) (20,950,565) (35,706,291) 1,809,459,172
Non-deliverable Future contracts
Forward and Swap contract
Total derivative assets
Forward and Swap contract
Total derivative liabilities
Fair Value
Assets/
(Liabilities)
December 2016 December 2015
Notional
amount
Fair Value
Assets/
(Liabilities)
Notional
amount
Total derivative liabilities
Non-deliverable Future contracts
Forward and Swap contract
Derivative financial instruments consist of forward,sawap and futrure contracts. These are held for day to day cash management rather than for trading purposes
and are held at fair value. The contracts have intended settlement dates of between 30 days and two years. All derivative contracts are considered to be valued with
reference to data obtained from FMDQ.
Included in Other liabilities are security deposit for Swap and future deals which are deposits (collaterised deposits) by counter parties.
The movement in fair value is as a result of a depreciation of the functional currency of the group (Naira) within the year and an increase in the volume of
transactions.
Forward and Swap contract
Fair Value
Assets/
(Liabilities)
December 2016 December 2015
Non-deliverable Future contracts
Non-deliverable Future contracts
Notional
amount
Fair Value
Assets/
(Liabilities)
Notional
amount
175

Access Bank Plc
Notes to consolidated financial statements
For the year ended 31 December 2016
Group
Specific Collective Total
December 2015 Gross impairment impairment impairment Carrying
In thousands of Naira amount allowance allowance allowance amount
Loans to individuals
Retail Exposures
Auto Loan (note 23c) 2,175,207 - (25,446) (25,446) 2,149,761
Credit Card 2,608,764 - (28,629) (28,629) 2,580,135
Finance Lease (note 23c) - - - - -
Mortgage Loan 17,954,586 - (51,306) (51,306) 17,903,280
Overdraft 5,261,080 (250,624) (543,561) (794,185) 4,466,895
Personal Loan 20,393,836 - (210,228) (210,228) 20,183,608
Term Loan 4,777,259 - (74,834) (74,834) 4,702,425
Time Loan 799,692 - (7,174) (7,174) 792,518
Loans to corporate entities and other organizations
Non-Retail Exposures
Auto Loan (note 23c) 3,406,742 - (37,455) (37,455) 3,369,287
Credit Card 274,133 - (2,848) (2,848) 271,285
Finance Lease (note 23c) 1,821,023 - (8,115) (8,115) 1,812,908
Mortgage Loan 6,208,567 (46,391) (317) (46,708) 6,161,859
Overdraft 208,224,839 (7,574,569) (6,798,235) (14,372,804) 193,852,035
Term Loan 785,921,553 (2,162,757) (9,255,082) (11,417,837) 774,503,714
Time Loan 334,694,358 (448,337) (1,164,900) (1,613,237) 333,081,121
1,394,521,639 (10,482,678) (18,208,130) (28,690,806) 1,365,830,831
Impairment on loans and advances to customers
In thousands of Naira December 2016 December 2015 December 2016 December 2015
Balance beginning of year 10,482,678 7,967,529 18,208,130 11,014,296
Impairment loss for the year:
- Charge for the year 17,874,149 3,643,214 2,742,435 7,193,834
Write-offs (13,601,100) (1,128,065) - -
Balance end of year 14,755,727 10,482,678 20,950,565 18,208,130
23 Loans and advances to customers
b Bank
Specific Collective Total
December 2016 Gross impairment impairment impairment Carrying
In thousands of Naira amount allowance allowance allowance amount
Loans to individuals
Retail Exposures
Auto Loan (note 23c) 2,426,024 - (41,976) (41,976) 2,384,048
Credit Card 3,431,339 (4,367) (57,775) (62,142) 3,369,197
Finance Lease (note 23c) 60,912 - (1,053) (1,053) 59,859
Mortgage Loan 5,053,845 - (75,135) (75,135) 4,978,710
Overdraft 5,033,990 (115,021) (515,982) (631,003) 4,402,987
Personal Loan 17,369,909 (285,812) (294,993) (580,805) 16,789,104
Term Loan 2,427,653 - (42,759) (42,759) 2,384,894
Time Loan 586,532 - (10,139) (10,139) 576,394
Loans to corporate entities and other organizations
Non-Retail Exposures
Auto Loan (note 23c) 2,003,352 - (20,856) (20,856) 1,982,496
Credit Card 563,357 - (10,178) (10,178) 553,179
Finance Lease (note 23c) 3,946,347 - (18,308) (18,308) 3,928,038
Mortgage Loan 18,437 - (195) (195) 18,242
Overdraft 135,065,623 (7,573,737) (1,609,209) (9,182,946) 125,882,676
Term Loan 1,032,873,587 (2,105,378) (15,506,849) (17,612,227) 1,015,261,361
Time Loan 413,976,952 - (1,985,792) (1,985,792) 411,991,160
1,624,837,859 (10,084,316) (20,191,198) (30,275,514) 1,594,562,345
Specific allowances Collective allowances
176

Access Bank Plc
Notes to consolidated financial statements
For the year ended 31 December 2016
Bank
Specific Collective Total
December 2015 Gross impairment impairment impairment Carrying
In thousands of Naira amount allowance allowance allowance amount
Loans to individuals
Retail Exposures
Auto Loan (note 23c) 1,976,020 - (25,446) (25,446) 1,950,574
Credit Card 2,579,265 - (28,629) (28,629) 2,550,636
Finance Lease (note 23c) - - - - -
Mortgage Loan 4,383,538 - (51,306) (51,306) 4,332,232
Overdraft 5,054,135 (250,624) (503,788) (754,412) 4,299,723
Personal Loan 18,073,801 - (210,228) (210,228) 17,863,573
Term Loan 3,066,501 - (35,061) (35,061) 3,031,440
Time Loan 640,645 - (7,174) (7,174) 633,471
Loans to corporate entities and other organizations
Non-Retail Exposures
Auto Loan (note 23c) 3,378,173 - (37,455) (37,455) 3,340,718
Credit Card 264,756 - (2,848) (2,848) 261,908
Finance Lease (note 23c) 1,821,023 - (8,115) (8,115) 1,812,908
Mortgage Loan 74,260 (46,391) (317) (46,708) 27,552
Overdraft 188,628,138 (7,027,040) (6,639,141) (13,666,181) 174,961,957
Term Loan 753,319,155 (1,400,831) (9,018,452) (10,419,283) 742,899,872
Time Loan 286,861,982 (448,337) (1,164,900) (1,613,237) 285,248,745
1,270,121,392 (9,173,223) (17,732,860) (26,906,083) 1,243,215,309
Impairment on loans and advances to customers
In thousands of Naira December 2016 December 2015 December 2016 December 2015
Balance beginning of year 9,173,223 6,340,159 17,732,860 10,665,978
Impairment loss for the year:
- Charge for the year 13,846,554 2,833,064 2,458,338 7,066,882
Write-offs (12,935,461) - - -
Balance end of year 10,084,316 9,173,223 20,191,198 17,732,860
Specific Impairment Collective Impairment
177

Access Bank Plc
Notes to consolidated financial statements
For the year ended 31 December 2016
23(c) Advances under finance leases
Group Group Bank Bank
In thousands of Naira December 2016 December 2015 December 2016 December 2015
Gross investment in finance lease, receivable #VALUE! 9,034,595 #VALUE! 8,728,141
Unearned finance income on finance leases (1,937,583) (1,631,622) (1,890,469) (1,552,925)
Net investment in finance leases #VALUE! 7,402,973 #VALUE! 7,175,216
Gross investment in finance leases, receivable:
Less than one year 2,217,863 4,094,867 2,286,156 3,932,588
Between one and five years 7,976,709 4,939,727 7,782,749 4,795,553
Later than five years 264,635 - 258,199 -
10,459,206 9,034,594 10,327,104 8,728,141
Unearned finance income on finance leases (1,937,583) (1,631,622) (1,890,469) (1,552,925)
Present value of minimum lease payments 8,521,623 7,402,972 8,436,635 7,175,216
- Less than one year 2,018,383 3,230,261 2,091,526 3,108,297
- Between one and five years 6,215,439 4,172,712 6,064,306 4,066,919
- Later than five years 287,801 - 280,803 -
24 Pledged assets
Group Group Bank Bank
In thousands of Naira December 2016 December 2015 December 2016 December 2015
Treasury bills 188,239,520 106,934,817 188,239,520 103,684,044
Government bonds 126,707,982 96,780,580 126,707,982 96,780,580
314,947,502 203,715,397 314,947,502 200,464,624
Bank of Industry (BOI) 39,566,300 29,227,231 39,566,300 29,227,231
(i)
25 Investment securities
Group Group Bank Bank
Available for sale investment securities December 2016 December 2015 December 2016 December 2015
In thousands of Naira
Debt securities
Government bonds 26,699,706 51,205,831 15,507,737 51,205,831
Treasury bills 69,346,601 28,996,006 40,960,665 10,436,981
Eurobonds 2,760,661 6,524,859 2,760,661 6,016,748
Corporate bonds 3,431,482 3,473,524 3,431,482 3,473,524
Equity securities
58,667,555 44,772,710 58,420,406 44,755,565
Unquoted equity securities at cost 3,145,697 3,145,697 3,145,697 3,145,697
164,051,703 138,118,627 124,226,649 119,034,346
(3,389,059) (3,326,077) (3,389,059) (3,326,077)
160,662,644 134,792,550 120,837,590 115,708,269
Specific allowance for impairment on available for sale
investments
Loans and advances to customers at amortised cost include the following finance lease receivables for leases of certain property and equipment where the group is
the lessor:
Present value of minimum lease payments may be analysed as:
Equity securities with readily determinable fair values (i)
The related liability for assets pledged as collateral include:
The assets pledged as collateral include assets pledged to third parties under secured borrowing with the related liability disclosed above. Also included in pledged
assets are assets pledged as collateral or security deposits to clearing house and payment agencies of N17.58bn (31 December 2015: N25.78Bn) for which there is no
related liability. The pledges have been made in the normal course of business of the Bank. In the event of default, the pledgee has the right to realise the pledged
assets.
The fair value of the unquoted equity securities carried at cost cannot be reliably estimated as there are no active market for these financial instruments; they have
therefore been disclosed at cost less impairment. These equity investments have been fully impaired and has a nil balance in the group financial statement.
178

Access Bank Plc
Notes to consolidated financial statements
For the year ended 31 December 2016
(i) Equity securities with readily determinable fair values (carrying amount)
MTN Nigeria 7,451,138 8,317,689 7,451,138 8,317,689
Central securities clearing system limited 1,559,612 1,775,756 1,559,612 1,775,756
Nigeria interbank settlement system plc. 1,175,570 1,027,168 1,175,570 1,027,168
- 1,144,748 - 1,144,748
Unified payment services limited 2,340,346 2,518,309 2,340,346 2,518,309
Africa finance corporation 44,230,177 28,658,942 44,230,177 28,658,942
Juli pharmacy plc - 11,358 - 11,358
E-Tranzact 1,147,387 729,738 1,147,387 729,738
African export-import bank 10,754 2,675 10,754 2,675
130,610 147,746 130,610 137,746
Nigerian mortage refinance company plc. 93,186 200,000 93,186 200,000
Credit reference company 281,626 231,436 281,626 231,436
Others 247,149 7,145 - -
58,667,555 44,772,710 58,420,406 44,755,565
Held to maturity investment securities
In thousands of Naira
Debt securities
Treasury bills 27,350,114 7,687,281 - -
Federal government bonds 31,754,372 31,962,858 31,016,409 31,044,676
State government bonds 5,276,855 6,550,060 5,276,855 6,550,060
Corporate bonds 1,624,228 3,580,595 1,624,228 1,684,150
Eurobonds 2,445,558 1,649,782 2,445,558 1,007,643
68,451,128 51,430,576 40,363,051 40,286,529
Total 229,113,772 186,223,126 161,200,642 155,994,798
Specific allowance for impairment on available for sale investment securities
Group Group Bank Bank
In thousands of Naira December 2016 December 2015 December 2016 December 2015
Balance, beginning of year 3,326,077 3,145,697 3,326,077 3,145,697
Additional allowance - 180,380 - 180,380
Allowance written off (21,358) - (21,358) -
Revaluation difference 84,339 - 84,339 -
Balance, end of year 3,389,059 3,326,077 3,389,059 3,326,077
26 Other assets
Group Group Bank Bank
December 2016 December 2015 December 2016 December 2015
In thousands of Naira
Financial assets
Accounts receivable 23,063,084 37,555,560 13,804,165 34,067,809
Receivable on E-business channels 2,333,865 9,163,800 2,253,689 9,163,800
Receivable from disposal of Non-current asset 19,341,974 22,578,046 19,341,974 22,578,046
Receivable from AMCON - 5,498,909 - 5,498,909
Subscription for investment 25,004 25,001 833,101 861,759
44,763,926 74,821,316 36,232,930 72,170,323
Non-financial assets
Prepayments 20,751,237 10,234,249 16,668,917 8,494,119
Inventory 707,748 619,515 660,491 619,516
21,458,986 10,853,764 17,329,408 9,113,635
Gross other assets 66,222,912 85,675,080 53,562,337 81,283,958
Allowance for impairment on financial assets
Accounts receivable (2,942,857) (2,635,576) (2,942,857) (2,635,576)
Subscription for investment (25,001) (25,001) (25,001) (25,001)
63,255,054 83,014,503 50,594,480 78,623,381
FMDQ OTC Plc
IBTC pension managers limited
179

Access Bank Plc
Notes to consolidated financial statements
For the year ended 31 December 2016
Movement in allowance for impairment on other assets:
Group Group Bank Bank
Accounts subscription for Accounts subscription for
Receivable investments Receivable investments
In thousands of Naira
Balance as at 1 January 2015 22,296,170 25,001 22,296,170 25,001
Impairment loss for the year:
- Additional provision 3,204,542 - 3,204,542 -
Net impairment 3,204,542 - 3,204,542 -
Allowance written off (22,865,136) - (22,865,136) -
Balance as at 31 December 2015/1 January 2016 2,635,576 25,001 2,635,576 25,001
Impairment loss for the year:
- Additional provision 1,321,936 - 1,321,936 -
Net impairment 1,321,936 - 1,321,936 -
Allowance written off (1,016,504) - (1,016,504) -
Translation difference 1,849 - 1,849 -
Balance as at 31 December 2016 2,942,857 25,001 2,942,857 25,001
Inventory consists of blank debit cards, cheque leaves, computer consumables and other stationery held by the Bank.
Receivable from AMCON represents a receivable from the Asset Management Corporation of Nigeria (AMCON) in connection with the acquisition of
Intercontinental bank in line with the Transaction Implementation Agreement (TIA) entered with the bank. The receivable is expected to be settled via consideration
such as Cash and Bonds issued by AMCON.
Increase in prepayments resulted from services that have been paid in advance for the year for which the amortization will be over the relevant period of service.
These include rents and advertisements.
180

Access Bank Plc
Notes to consolidated financial statements
For the year ended 31 December 2016
27(a) Subsidiaries (with continuing operations)
(i) Group entities
Access Bank Gambia Limited Banking Gambia 64% 64%
Access Bank Sierra Leone Limited Banking Sierra Leone 97% 97%
Access Bank Rwanda Limited Banking Rwanda 75% 75%
Access Bank Zambia Banking Zambia 92% 92%
The Access Bank UK Banking United Kingdom 100% 100%
Access Bank R.D. Congo Banking Congo 74% 74%
Access Bank Ghana Banking Ghana 91% 92%
Access Finance B.V. Banking Netherlands 100% 100%
(ii) Structured entities:
Nature of
business
Country of
incorporation December 2016 December 2015
Restricted Share Performance Plan (RSPP)
Financial
services Nigeria 100% 100%
Access Finance B.V. was incorporated in 2011 and commenced operations in 2012. An obligation also exists between the Bank and Access Finance B.V.,
for which Access Finance B.V. lent to the Bank the sum of USD 2,462,000 as a share premium loan. The loan agreement between both parties however
permits that the obligation of Access Finance B.V. to grant the loan, be set off against the obligation of the Bank to repay the loan such that each party's
obligation either as a borrower or lender is discharged. In view of this, no loan payable has been recognized in the Bank's financial statements.
The transaction for which the entity was set up will mature in 2017. Management has not decided on the possibility of the entity existing beyong the
maturity of the obligation.
Ownership interest
Set out below are the group's subsidiaries as at 31 December 2016. Unless otherwise stated, the subsidiaries listed below have share capital consisting
solely of ordinary shares, which are held directly by the group and the proportion of ownership interests held equals to the voting rights held by the
group. The country of incorporation is also their principal place of business.
There are no significant restrictions on the Group’s ability to access or use the assets and settle the liabilities of any member of the Group to the extent
that regulation does not inhibit the group from having access, and in liquidation scenario, this restriction is limited to its level of investment in the
entity .
There are no significant restrictions on the ability of subsidiaries to transfer funds to the Group in the form of cash dividends or repayment of loans
and advances
Ownership interestNature of
business
Country of
incorporationDecember 2016 December 2015
During the period, Access Bank Ghana raised additional capital through a public offer. Consequently, this caused a dilution in the Bank's share of
ownership and an increase in non controlling interest.
181

Access Bank Plc
Notes to consolidated financial statements
For the year ended 31 December 2016
27(b) Investment in subsidiaries
Bank Bank
December 2016 December 2015
In thousands of Naira
Subsidiaries with continuing operations
29,104,081 18,501,269
15,558,107 13,704,428
1,578,825 1,578,825
2,779,650 2,779,650
4,274,925 4,274,925
1,853,756 1,853,756
1,019,951 1,019,951
Investment in RSPP scheme 3,065,865 1,722,350
4,092 4,092
Subsidiaries undergoing liquidation
Flexmore Technologies Limited - 100,000
59,239,252 45,539,246
Specific allowances for impairment on investment in subsidiaries - (100,000)
Balance, end of year 59,239,252 45,439,246
Specific allowances for impairment on investment in subsidiaries
Bank Bank
December 2016 December 2015
In thousands of Naira
Balance, beginning of year 100,000 100,000
Allowance written off (100,000) -
Balance, end of year - 100,000
Access Bank, Gambia
Access Bank, UK (a)
Access Bank, Ghana (a)
Access Bank Rwanda
Access Bank, Congo
Access Bank, Zambia
On 13 April 2016, the Corporate Affairs Commission (CAC) gave approval for the liquidation of Flexmore Technologies Limited with a three
month notice period starting 1 April 2016. At the expiration of the notice period, the Bank liquidated the entity and consequently wrote off the
investment.
Based on the contractual arrangements between the Group and the shareholders in each of the entities, the Group has the power to appoint and
remove the majority of the board of Directors of each entity.
The relevant activities of each of the listed subsidiaries are determined by the Board of Directors of each entity based on simple majority shares.
Therefore, the directors of the Group concluded that the Group has control over each of the above listed entities and were consolidated in the
group financial statements.
Access Bank, Sierra Leone
Access Bank Finance B.V. (b)
(a) During the year, the Bank made additional investments of GBP25m and USD 6.07m in Access Bank UK and Access Bank Ghana respectively.
182

Access Bank Plc
Notes to consolidated financial statements
For the year ended 31 December 2016
281 0 0 28 4
27 (c) Condensed results of consolidated entities report- absolute report- absolute
(i) The condensed financial data of the consolidated entities as at 31 December 2016, are as follows:
308 46 0.2766 0.2104 26.879 4.244 0.0461 221.976
Condensed profit and loss
In thousands of naira
Operating income 8,563,021 18,801,271 2,734,273 2,489,687 1,742,976 930,033 949,130 - 170,898
Operating expenses (4,223,554) (10,518,589) (2,214,927) (2,036,649) (1,429,535) (639,171) (716,827) - (7,757)
Net impairment loss on financial assets - (3,697,655) (648,310) (1,095) (309,215) (106,733) (71,390) - -
Profit before tax 4,339,467 4,585,027 (128,964) 451,943 4,226 184,129 160,913 - 163,141
Income tax expense (867,924) (2,560,584) (15,851) (15,897) (21,186) (19,586) (4,297) - (12,084)
Profit for the year 3,471,543 2,024,443 (144,815) 436,046 (16,960) 164,543 156,616 - 151,057
Assets
Cash and cash equivalents 206,090,386 53,060,292 12,843,280 4,081,910 7,748,129 1,850,740 3,189,614 - 433,441
Pledged assets - - - - - - - - -
Derivative financial instruments - 152,386 - - - - - -
Loans and advances to banks 105,115,705 - - - - - - - 72,641,947
Loans and advances to customers 90,553,072 93,656,210 12,888,097 11,764,620 4,580,996 1,011,580 442,252 - -
Investment securities 23,316,245 30,800,861 1,390,502 - 2,211,138 6,332,347 4,082,549 - -
Other assets 1,668,759 8,262,701 354,956 746,564 2,484,113 197,067 476,667 - 4,319
Investment in associates - - - - - - - - -
Investment in subsidiaries - - - - - - - 3,286,375 -
Property and equipment 98,390 8,039,370 733,065 1,425,053 734,526 845,655 408,520 - -
Intangible assets 320,219 436,493 - 85,669 100,736 102,207 39,440 - -
Deferred tax assets - 1,014,466 - - 432,094 - 168,936 - -
Assets classified as held for sale - - - - - - - - -
427,162,776 195,270,393 28,362,286 18,103,816 18,291,733 10,339,596 8,807,979 3,286,375 73,079,707
Financed by:
Deposits from banks 261,480,316 14,677,731 - 2,171,148 1,245,861 - 787,165 - -
Deposits from customers 119,243,361 146,112,643 22,459,781 10,524,795 12,947,085 6,389,283 5,637,268 - -
Derivative Liability 51,382 - - - - - - - -
Debt securities issued - - - - - - - - 72,592,084
Retirement benefit obligations 841 9,921 - - 95 - - - -
Current tax liabilities 607,272 1,843,534 (126,448) 63,564 - 7,331 - - 60,674
Other liabilities 1,998,068 1,498,809 614,869 834,620 642,039 686,958 477,233 - 41,673
Interest-bearing loans and borrowings - 159,393 1,848,571 - - - - - -
Deferred tax liabilities - 303,345 211,019 - - 82,932 - - -
Liabilities classified as held for sale - - - - - - - - -
Equity 43,781,536 30,665,017 3,354,496 4,509,689 3,456,653 3,173,092 1,906,313 3,286,375 385,276
427,162,776 195,270,393 28,362,286 18,103,816 18,291,733 10,339,596 8,807,979 3,286,375 73,079,707
Net cashflow from investing activities (17,961,436) (7,188,778) (108,505) (490,831) - (2,784,760) - - -
Net cashflow from financing activities 9,579,150 7,080,739 908,018 - - - - - -
Increase in cash and cash equivalents 147,608,099 3,084,064 431,681 (2,272,754) - (757,388) - - 112,381,427
Cash and cash equivalent, beginning of year 45,245,533 30,593,847 7,808,703 4,796,124 9,360,900 1,568,257 1,144,498 - 268,239
Effect of exchange rate fluctuations on cash held - - - - - - - - 39,740,811
Cash and cash equivalent, end of year 192,853,632 33,677,911 8,240,384 2,523,368 9,360,900 810,869 1,144,498 - 152,390,477
Access Bank
Sierra Leone
Access Bank
Investment in
RSPP
Access Bank
B.V.
The Access Bank
UK Access Bank Ghana
Access Bank
Rwanda
Access Bank
(R.D. Congo)
Access Bank
Zambia
Access Bank
Gambia
183

Access Bank Plc
Notes to consolidated financial statements
For the year ended 31 December 2016
27 (d) Condensed results of consolidated entities
(i) The condensed financial data of the consolidated entities as at 31 December 2015, are as follows:
Condensed profit and loss
In thousands of naira
Operating income 5,929,949 14,248,052 1,746,767 1,755,209 1,346,817 1,081,310 724,805 - 438,562
Operating expenses (3,354,724) (7,107,573) (1,561,741) (1,490,186) (1,279,419) (533,547) (635,919) - (16,624)
Net impairment loss on financial assets - (787,888) 24,123 - (24,158) (235,348) (16,540) - -
Profit before tax 2,575,225 6,352,591 209,149 265,023 43,240 312,415 72,346 - 421,938
Taxation (521,483) (2,189,931) (108,885) - (28,989) (17,326) (26,355) (23,206)
Profit for the year 2,053,742 4,162,660 100,264 265,023 14,251 295,089 45,991 - 398,732
Assets
Cash and cash equivalents 45,245,533 34,911,799 7,637,323 5,171,427 4,375,250 1,762,148 2,133,665 - 2,327,751
Derivative financial instruments 63,528 - - - - - - - -
Loans and advances to banks 86,554,437 - - - - - - - 69,584,024
Loans and advances to customers 42,761,574 62,251,287 6,669,073 6,262,020 3,100,601 824,185 746,783 - -
Pledged assets - - - - - 3,250,773 - - -
Investment securities 4,181,497 18,313,343 2,008,702 - 2,042,227 - 3,763,874 - -
Other assets 714,834 3,604,904 239,902 559,934 1,252,686 124,350 262,785 - -
Investment in subsidiaires - - - - - - - 1,722,350 -
Property and equipment 292,135 4,780,307 42,002 916,619 425,257 619,042 354,179 - -
Intangible assets 29,644 276,988 307,609 32,550 44,055 59,861 30,994 - -
Deferred tax assets - 266,434 - - 277,836 120,510 - -
179,843,182 124,405,062 16,904,611 12,942,550 11,517,912 6,640,359 7,412,790 1,722,350 71,911,775
Financed by:
Deposits from banks 103,782,307 13,714,385 - - 583,834 - - - -
Deposits from customers 50,042,098 88,548,465 13,440,311 8,904,983 9,426,433 4,103,594 5,033,441 - -
Derivative Liability 672,406 - - - - - - - -
Debt securities issued - - - - - - - - 71,336,985
Retirement benefit obligations - - - - - - 8,471 - -
Current tax liabilities 482,483 756,851 (5,372) 23,834 28,989 - - - 51,728
Other liabilities 1,837,532 2,701,530 937,044 672,699 (481,930) 438,292 942,628 - (164,701)
Contingent settlement provisions - 55,186 - - - - - - -
Deferred tax liability - 149,719 61,570 - - 55,355 - - -
Equity 23,026,356 18,478,926 2,471,058 3,341,034 1,960,586 2,043,118 1,428,250 1,722,350 687,763
179,843,182 124,405,062 16,904,611 12,942,550 11,517,912 6,640,359 7,412,790 1,722,350 71,911,775
Net cashflow from investing activities 17,935,552 (2,660,525) 761,628 (122,315) (442,024) (119,630) (786,315) - -
Net cashflow from financing activities 4,400,100 (830,053) 583,202 - - - - - 6,914,832
Increase/(Decrease) in cash and cash equivalents 25,849,261 2,343,374 1,318,540 1,284,155 1,565,905 423,797 (486,380) - 74,738
19,396,272 28,250,473 6,490,163 3,511,969 7,794,994 1,144,460 1,630,878 - 76,333
- - - - - - - - 117,168
Cash and cash equivalent, end of year 45,245,533 30,593,847 7,808,703 4,796,124 9,360,899 1,568,257 1,144,498 - 268,239
Effect of exchange rate fluctuations on cash held
Cash and cash equivalent, beginning of year
Access Bank
Sierra Leone
Access Bank
Investment in
RSPP
Access Bank
B.V.
The Access Bank
UK Access Bank Ghana
Access Bank
Rwanda
Access Bank
(R.D. Congo)
Access Bank
Zambia
Access Bank
Gambia
184

Access Bank Plc
Notes to consolidated financial statements
For the year ended 31 December 2016
28 Property and equipment
Group
In thousands of Naira
Cost
Balance at 1 January 2016 57,073,875 17,762,955 29,241,820 9,898,894 7,755,533 121,733,077
Acquisitions 3,981,137 5,474,190 4,978,500 1,785,155 1,823,777 18,042,759
Disposals (122,313) (290,101) (530,187) (558,855) (129,535) (1,630,991)
Transfers 3,586,520 74,632 87,346 - (3,748,497) -
Write-offs (187,281) - (18,575) - (155,144) (361,000)
Reclassifications - - - - (556,893) (556,893)
Translation difference 1,406,355 1,006,846 1,544,451 490,247 502,022 4,949,921
Balance at 31 December 2016 65,738,293 24,028,521 35,303,354 11,615,441 5,491,267 142,176,873
Balance at 1 January 2015 54,681,145 15,712,421 25,564,194 8,366,282 7,016,361 111,340,403
Acquisitions 2,968,814 1,874,068 4,683,327 2,155,869 2,212,955 13,895,033
Disposals (629,392) (672,148) (587,871) (870,818) (404,199) (3,164,428)
Transfers 122,018 711,695 69,259 52,446 (955,418) -
Write offs - - - - (58,394) (58,394)
Translation difference (68,710) 136,919 (487,089) 195,115 (55,772) (279,537)
Balance at 31 December 2015 57,073,875 17,762,955 29,241,820 9,898,894 7,755,533 121,733,077
Depreciation and impairment losses
Balance at 1 January 2016 9,286,024 12,318,555 20,442,415 6,356,156 - 48,403,150
Charge for the year 1,864,239 2,658,469 3,340,041 1,244,137 - 9,106,886
Disposal (10,538) (281,617) (515,657) (428,352) - (1,236,164)
Write-Offs (14,219) - (6,267) - - (20,486)
Translation difference 68,468 351,416 1,376,152 18,399 - 1,814,435
Balance at 31 December 2016 11,193,974 15,046,823 24,636,684 7,190,340 - 58,067,821
Balance at 1 January 2015 7,723,192 10,955,180 17,509,380 5,492,944 - 41,680,695
Charge for the year 1,652,283 1,841,749 3,589,272 1,531,833 - 8,615,138
Disposal (66,157) (671,981) (579,859) (804,134) - (2,122,131)
Translation difference (23,294) 193,607 (76,378) 135,513 - 229,448
Balance at 31 December 2015 9,286,024 12,318,555 20,442,415 6,356,156 - 48,403,150
Carrying amounts:
Balance at 31 December 2016 54,544,319 8,981,698 10,666,670 4,425,101 5,491,267 84,109,052
Balance at 31 December 2015 47,787,851 5,444,400 8,799,405 3,542,738 7,755,533 73,329,927
Total
Land and
buildings
Computer
hardware
Furniture &
fittingsMotor vehicles
Capital Work-
in - progressTotal
Leasehold
improvement and
buildings
Computer
hardware
Furniture &
fittingsMotor vehicles
Capital Work-
in - progress
185

Access Bank Plc
Notes to consolidated financial statements
For the year ended 31 December 2016
28 Property and equipment
Bank
Cost
Balance at 1 January 2016 52,737,675 15,863,065 26,748,469 8,644,919 5,388,964 109,383,092
Acquisitions 3,070,721 5,008,811 4,490,233 1,477,916 655,470 14,703,151
Disposals (118,662) (257,520) (492,138) (428,086) (129,535) (1,425,941)
Transfers 1,956,836 - 29,306 - (1,986,142) -
Reclassifications - - - - (556,893) (556,893)
Write-Offs - - - - (155,143) (155,143)
Balance at 31 December 2016 57,646,570 20,614,356 30,775,870 9,694,749 3,216,721 121,948,266
Balance at 1 January 2015 50,672,751 14,220,988 23,331,037 7,457,145 6,185,630 101,867,551
Acquisitions 2,648,337 1,601,863 3,975,251 1,870,477 496,193 10,592,121
Disposals (629,392) (668,870) (587,831) (735,149) (396,944) (3,018,186)
Transfers 45,979 709,084 30,012 52,446 (837,521) -
Write-Offs - - - - (58,394) (58,394)
Balance at 31 December 2015 52,737,675 15,863,065 26,748,469 8,644,919 5,388,964 109,383,092
Leasehold Capital
improvement Computer Furniture & Motor Work-in Total
Depreciation and impairment losses and buildings hardware fittings vehicles - progress
Balance at 1 January 2016 8,207,291 10,985,168 18,767,401 5,522,848 - 43,482,708
Charge for the year 1,504,195 2,269,674 2,981,425 1,019,297 - 7,774,591
Disposal (10,540) (257,339) (489,240) (376,386) - (1,133,505)
Balance at 31 December 2016 9,700,946 12,997,503 21,259,586 6,165,759 - 50,123,794
(108,122) (2,898) (51,700)
Balance at 1 January 2015 6,782,532 9,982,857 16,071,183 4,870,652 - 37,707,224
Charge for the year 1,476,578 1,671,014 3,276,037 1,338,662 - 7,762,291
Disposal (51,819) (668,703) (579,819) (686,466) - (1,986,807)
Balance at 31 December 2015 8,207,291 10,985,168 18,767,401 5,522,848 - 43,482,708
Carrying amounts:
Balance at 31 December 2016 47,945,624 7,616,853 9,516,284 3,528,990 3,216,721 71,824,472
Balance at 31 December 2015 44,530,384 4,877,897 7,981,068 3,122,071 5,388,964 65,900,384
Total
(a) The amount of contractual commitments for the acquisition of property and equipment as at 31 December 2016 is N365,409,847 (31 Dec 2015: N330,891,261)
(b) Estimates of useful life and residual value, and the method of depreciation, are reviewed at a minimum at each reporting period. Any changes are accounted for prospectively as
a change in estimate.
During the year, the sum of N556m was reclassified from property, plant and equipments to other assets having failed the requirements for assets under this classification.
In thousands of Naira
Land and
buildings
Computer
hardware
Furniture &
fittings
Motor
vehicles
Capital Work-
in - progress
186

Access Bank Plc
Notes to consolidated financial statements
For the year ended 31 December 2016
29 Intangible assets
Group
In thousands of Naira Goodwill WIP Purchased Total
Software
Cost
December 2016
Balance at 1 January 2016 681,007 - 12,060,445 12,741,452
Acquisitions - 286,724 2,250,300 2,537,024
Transfer - - 322,529 322,529
Write off - - (54,460) (54,460)
Translation difference - - 285,996 285,996
Balance at 31 December 2016 681,007 286,724 14,864,810 15,832,541
December 2015
Balance at 1 January 2015 681,007 740,711 9,946,474 11,368,192
Acquisitions - - 2,146,643 2,146,643
Transfer - (740,711) 740,711 -
Write off - - (512,802) (512,802)
Translation difference - - (260,581) (260,581)
Balance at 31 December 2015 681,007 - 12,060,445 12,741,452
Amortization and impairment losses
Balance at 1 January 2016 - - 6,300,836 6,300,836
Amortization for the year - - 2,186,905 2,186,905
Translation difference - - 405,245 405,245
Balance at 31 December 2016 - - 8,892,986 8,892,986
Balance at 1 January 2015 - - 5,775,201 5,775,201
Amortization for the year - - 1,483,193 1,483,193
Write off - - (512,802) (512,802)
Translation difference - - (444,756) (444,756)
Balance at 31 December 2015 - - 6,300,836 6,300,836
Net Book Value
Balance at 31 December 2016 681,007 286,724 5,971,824 6,939,555
Balance at 31 December 2015 681,007 - 5,759,609 6,440,616
187

Access Bank Plc
Notes to consolidated financial statements
For the year ended 31 December 2016
Bank
WIP Purchased Total
In thousands of Naira Software
Cost
December 2016
Balance at 1 January 2016 - 10,348,678 10,348,678
Acquisitions 231,569 1,818,744 2,050,313
Balance at 31 December 2016 231,569 12,167,422 12,398,991
December 2015
Balance at 1 January 2015 740,711 8,255,600 8,996,311
Acquisitions - 1,865,169 1,865,169
Transfers (740,711) 740,711 -
Write off - (512,802) (512,802)
Balance at 31 December 2015 - 10,348,678 10,348,678
Amortization and impairment losses
Balance at 1 January 2016 - 5,370,770 5,370,770
Amortization for the year - 1,854,437 1,854,437
Balance at 31 December 2016 - 7,225,207 7,225,207
Balance at 1 January 2015 - 4,559,497 4,559,497
Amortization for the year - 1,324,075 1,324,075
Write off (512,802) (512,802)
Balance at 31 December 2015 - 5,370,770 5,370,770
Carrying amounts
Balance at 31 December 2016 231,569 4,942,214 5,173,784
Balance at 31 December 2015 - 4,977,908 4,977,908
Amortization method used is straight line.
The work in progress relates to the cost of the CR2 Omnichannel Banking solution aimed at providing a unique experience to customers
at every touch point and empowering the bank to create, manage and deliver personalied product offerings and services to each
customers or customer group across all channels.
There were no capitalised borrowing costs related to the internal development of software during the year under review, 31 December
2016 (2015: nil). Computer software has a definite useful life of not more than five years in line with the Bank's accounting policy, while
Goodwill has an indefinite useful life and is annually assessed for impairment.
188

Access Bank Plc
Notes to consolidated financial statements
For the year ended 31 December 2016
29(b) Intangible assets
(i) Goodwill is attributable to the acquisition of following subsidiaries:
December 2016 December 2015
In thousands of Naira
Access Bank Rwanda 681,007 681,007
681,007 681,007
(ii)
The recoverable amount was determined using a value-in-use computation as N4.9bn
Goodwill is monitored by the Group on an entity by entity basis
The key assumption used in computing the value-in-use for goodwill in during the year are as follows:
Access Bank
Rwanda
Compound annual volume growth (i) 6.62%
Long term growth rate (ii) 4.70%
Discount rate (ii) 19.50%
Revenue Growth 9.60%
(i) Compound annual volume growth rate in the initial four-year period.
(ii) Weighted average growth rate used to extrapolate cash flows beyond the budget year.
(ii) Pre-tax discount rate applied to the cash flow projections.
Cash Flow Forecast
Discount Rate
Long-term term growth rate
Revenue Growth
Sensitivity analysis of key assumptions used
10% 10%
increase decrease
Impact of change in discount rate on value-in-use computation (481,959) 626,557
Impact of change in growth rate on value-in-use computation 85,169 (79,926)
Impact of change in revenue growth on value-in-use computation 490,918 (490,918)
The recoverable amount of Goodwill as at 31 December 2016 is greater than its carrying amount and is thus not impaired.
Goodwill is reviewed annually for impairment, or more frequently when there are indications that impairment may have occurred.
Impairment assessment has been performed for the year, while no losses on goodwill were recognized during the year under review 31
December 2016 (31 December 2015: Nil)
The recoverable amount of Goodwill as at 31 December 2016 was greater than its carrying amount and is thus not impaired.
Revenue growth were projected based on past growth, actual operating income and the company's 4 year strategic plan. The revenue growth
of 9.6% represents the average revenue growth of 4 years. The revenue growth was used to project the cashflow for the business.
Cash flows were projected based on past experience, actual operating results and the 4-year business plan. These cashflows are based on the
expected revenue growth for the entity over this 4-year period.
Pre-tax discount rate of 19.50% was applied in determining the recoverable amounts for the only entity with goodwill (Access Bank Rwanda).
This discount rate was estimated using the risk-free rate and the country risk premium for Rwanda.
The long term growth rate applied was based on the long term growth rate in GDP of Rwanda
The key assumptions described above may change as economic and market conditions change. The Group estimates that reasonably possible
changes in these assumptions are not expected to cause the recoverable amount of the subsidiaries (from which the goodwill arose) to decline
below their carrying amount.
189

Access Bank Plc
Notes to consolidated financial statements
For the year ended 31 December 2016
30 Deferred tax assets and liabilities
(a) Group
Deferred tax assets and liabilities are attributable to the following:
In thousands of NairaAssets Liabilities Net Assets Liabilities Net
Property and equipment, and software 14,329,164 (443,943) 13,885,221 11,259,522 - 11,259,522
Allowances/(Reversal) for loan losses 9,009,821 - 9,009,821 10,791,440 - 10,791,440
Tax loss carry forward 4,549,454 - 4,549,454 9,385,122 - 9,385,122
Exchange gain/(loss) unrealised - (29,234,934) (29,234,934) - (22,630,791) (22,630,791)
Fair value gain on Available for sale investments - - - - (13,349) (13,349)
Employee benefits 11,421 - 11,421 4,452 (111,469) (107,017)
- -
- (655,220) (655,220) 1,894,041 - 1,894,041
Deferred tax assets (net) 27,899,860 (30,334,096) (2,434,236) 33,334,577 (22,755,609) 10,578,968
(b) Bank
Deferred tax assets and liabilities are attributable to the following:
In thousands of Naira
Assets Liabilities Net Assets Liabilities Net
#VALUE!
Property and equipment, and software 13,937,906 - 13,937,906 11,092,769 - 11,092,769
Allowances/(Reversal) for loan losses 8,344,683 - 8,344,683 10,496,790 - 10,496,790
Tax loss carry forward 4,505,812 - 4,505,812 9,328,023 - 9,328,023
Exchange gain/(loss) unrealised - (29,234,934) (29,234,934) - (22,630,791) (22,630,791)
Fair value gain on investment property - - - - - -
- (655,220) (655,220) 1,894,041 -
1,894,041
Net deferred tax assets/(liabilities) 26,788,401 (29,890,154) (3,101,753) 32,811,623 (22,630,791) 10,180,832
There were no unrecognized deferred tax assets or liabilities as at 31 December 2016 (31 December 2015: nil)
Group Group Bank Bank
December December December December
2016 2015 2016 2015
Deferred income tax assets
– Deferred income tax asset to be recovered after more than 12 months 13,559,275 20,176,562 12,850,495 19,824,813
– Deferred income tax asset to be recovered within 12 months 14,340,585 13,158,015 13,937,906 12,986,810
27,899,860 33,334,578 26,788,401 32,811,623
Deferred income tax liabilities
– Deferred income tax liability to be recovered after more than 12 months (30,334,096) (22,630,791) (29,890,154) (22,630,791)
– Deferred income tax liability to be recovered within 12 months - (124,818) - -
(30,334,096) (22,755,609) (29,890,154) (22,630,791)
(c) Movement on the net deferred tax assets / (liabilities) account during the year:
Group Group Bank Bank
December December December December
In thousands of Naira 2016 2015 2016 2015
Balance, beginning of year 10,578,968 10,822,946 10,180,831 10,128,537
Tax charge (11,994,560) (684,222) (12,172,525) (402,545)
Translation adjustments 91,416 (14,595) - -
Items included in OCI (1,110,059) 454,839 (1,110,059) 454,839
Net deferred tax assets/(liabilities) (2,434,236) 10,578,968 (3,101,754) 10,180,831
Out of which
Deferred tax assets 27,899,860 33,334,577 26,788,401 32,811,623
Deferred tax liabilities (30,334,096) (22,755,609) (29,890,154) (22,630,791)
Items included in Other Comprehensive Income
Group Group Bank Bank
In thousands of Naira December December December December
2016 2015 2016 2015
Actuarial gain/loss on retirement benefit obligation
Gross loss on retirement benefit obligation 3,700,198 (1,516,131) 3,700,198 (1,516,131)
Deferred tax @ 30% (1,110,059) 454,839 (1,110,059) 454,839 Net balance loss after tax 2,590,139 (1,061,292) 2,590,139 (1,061,292)
Temporary difference relating to the Group's Investment in subsidiaries as at December 2016 is N28.6billion (Dec 2015: N3.0 billion). As the Group exercises control over the
subsidiaries, it has the power to control the timing of the reversals of the temporary difference arising from its investments in them. The group has determined that the
subsidiaries' profits and reserves will not be distributed in the foreseeable future and that the subsidiaries will not be disposed of. Hence, the deferred tax arising from the
temporary differences above will not be recognised.
December 2016 December 2015
Actuarial loss on retirement benefit
obligation
December 2016 December 2015
Actuarial loss on retirement benefit
obligation
Deferred tax asset are recognised for tax losses carried forward to the extent that the realisation of the related tax benefit through future taxable profits is probable. After
reviews of the medium-term profit forecasts, the Group considers that there will be sufficient profits in the future against which these losses will be offset.
190

Access Bank Plc
Notes to consolidated financial statements
For the year ended 31 December 2016
31 Assets classified as held for sale
Assets held for sale
Group Group Bank Bank
In thousands of Naira December 2016 December 2015 December 2016 December 2015
Balance at 1 January 179,843 23,438,484 179,843 23,438,484
Disposals (39,116) (23,258,641) (39,116) (23,258,641)
Fair value gain on assets held for sale - - - -
Balance at 31 December 140,727 179,843 140,727 179,843
In the course of the year , the Bank disposed some of its landed property at Eric Moore towers in order to comply with the CBN directive on
non - core assets. Plans are in place to dispose of the remaining assets.
32 Deposits from financial institutions
Group Group Bank Bank
December 2016 December 2015 December 2016 December 2015
In thousands of Naira
Money market deposits 85,020,959 35,923,012 26,209,999 1,522,968
Trade related obligations to foreign banks 82,335,624 36,991,409 68,912,189 61,820,817
167,356,583 72,914,421 95,122,188 63,343,785
33 Deposits from customers
Group Group Bank Bank
December 2016 December 2015 December 2016 December 2015
In thousands of Naira
Term deposits 925,976,555 706,327,211 799,495,575 632,818,563
Demand deposits 984,150,905 838,954,263 853,780,226 767,609,081
Saving deposits 179,069,825 137,962,846 159,767,071 127,786,239
2,089,197,286 1,683,244,320 1,813,042,872 1,528,213,883
34 Other liabilities
Group Group Bank Bank
In thousands of Naira December 2016 December 2015 December 2016 December 2015
Financial liabilities
Certified and bank cheques 2,430,832 1,780,404 2,018,166 1,676,220
E-banking payables 3,758,302 8,925,439 3,561,974 8,920,286
Collections account balances 18,677,355 28,271,575 17,692,904 28,249,768
Due to subsidiaries - - 714,192 914,789
Accruals 1,294,775 2,214,382 434,811 747,829
Creditors 5,043,127 1,904,665 3,404,703 1,622,762
Customer deposits for foreign exchange 59,738,350 7,973,447 59,574,436 7,973,447
Agency services 37,984 9,506 36,140 9,506
Unclaimed dividend 11,957,131 10,350,486 11,957,131 10,350,486
Other financial liabilities 8,179,792 3,847,417 5,893,267 2,406,392
111,117,648 65,277,321 105,287,724 62,871,485
Non-financial liabilities
Litigation claims provision ( see (i)below) 613,886 1,220,780 613,886 1,220,780
Other current non-financial liabilities 1,839,705 2,857,846 1,637,331 2,093
Total other liabilities 113,571,240 69,355,947 107,538,941 64,094,358
56,847,216
Increase in customer deposits for foreign exchange is attributable to the change in the Bank's process which requires all customers with
foreign currency obligations to deposit foreign currency to back these transactions due to the prevailing FX environment.
In 2013, Access Bank Plc took over collateral of some customers and these were recorded in the books as Investment properties, as the Bank had no
intention to make use of the property for administrative use. Management initiated a plan to dispose of these assets to willing buyers to comply with
the CBN directive to dispose of its non-core assets and thus has been classified as assets held for sale. Management expects to have completed the
transaction before the end of the next financial year. This amount has been presented in Note 7 as unallocated segment in accordance with IFRS 8.
The Bank’s Asset which is located in Lagos State, include Flats at Salvador and Eric Moore Towers. The Bank's intention is to systematically dispose
of the Flats at Eric Moore towers, Salvador towers within 12months.
191

Access Bank Plc
Notes to consolidated financial statements
For the year ended 31 December 2016
Group Group Bank Bank
(i) Movement in litigation claims provision December 2016 December 2015 December 2016 December 2015
Opening balance 1,220,780 311,120 1,220,780 311,120
Additions 49,496 920,200 49,496 920,200
Payment (656,390) - (656,390) -
Provision no longer required - (10,540) - (10,540)
Closing balance 613,886 1,220,780 613,886 1,220,780
35 Debt securities issued Group Group Bank Bank
December 2016 December 2015 December 2016 December 2015
In thousands of Naira
Debt securities at amortized cost:
Eurobond debt from Access Bank B.V (see (i) below) 72,592,084 71,336,985 - -
Eurobond debt security (see (ii) below) 212,380,366 78,516,655 212,380,366 78,516,655
Commercial Papers 31,572,052 - 31,572,052 -
316,544,502 149,853,640 243,952,418 78,516,655
(i) This refers to USD350,000,000 guaranteed notes issued on 25 July 2012 by Access Finance B.V., Netherlands with a maturity date of 25 July
2017 . In Oct 2016, USD 112,997,000 out of USD 350,000,000 was exchanged at a premium for a new note issued by Access Bank Plc . The
amount of N72.59Bn represents the amortized cost as at 31 December 2016 on the outstanding balance of USD237,003,000
The principal amount is payable at maturity, whilst interest is payable on a semi-annual basis at the interest rate above .
(ii) This refers to US$400,000,000 subordinated notes of 9.25% resettable interest issued on 24 December 2014 with a maturity date of 24
December 2021 and US$300,000,000 notes of 10.5% interest issued on 19 October 2016 with a maturity date of 19 October 2021. These
represent an amortized cost of N212.63bn.
The principal amount on both notes are payable at maturity, whilst interest is payable on a semi-annual basis at their respective interest rates.
192

Access Bank Plc
Notes to consolidated financial statements
For the year ended 31 December 2016
36 Interest bearing borrowings
Group Group Bank Bank
In thousands of Naira December 2016 December 2015 December 2016 December 2015
African Development Bank (see note (a)) 29,026,302 18,920,425 29,026,302 18,920,425
Netherlands Development Finance Company (see note (b)) 1,513,901 1,363,990 1,513,901 1,363,990
French Development Finance Company (see note (c)) 11,580,283 10,212,950 11,580,283 10,212,950
European Investment Bank (see note (d)) 26,979,759 14,237,242 26,979,759 14,237,242
International Finance Corporation (see note (e)) 2,554,646 4,997,286 2,554,646 4,997,286
9,766,871 5,544,920
9,766,871
5,544,920
Bank of Industry-Intervention Fund for SMEs (see note (g)) 4,500,284 7,193,737 4,500,284 7,193,737
Bank of Industry-Power & Airline Intervention Fund (see note (h)) 12,881,897 15,188,861 12,881,897 15,188,861
Access Finance B.V. (see note (i)) - - 74,425,046 71,523,252
6,633,475 6,844,633 6,633,475 6,844,633
Central Bank of Nigeria - Salary Bailout facilities (see note (k)) 66,479,721 56,442,213 66,479,721 56,442,213
Central Bank of Nigeria - Excess Crude Account (see note (l)) 125,837,600 90,000,000 125,837,600 90,000,000
Other loans and borrowings 1,788,969 520,904 - 450,478
299,543,707 231,467,161 372,179,785 302,919,987
(a)
(b)
(c)
(d)
(e)
(f)
(g)
(h)
(i)
(j)
Central Bank of Nigeria under the Commercial Agriculture Credit Scheme
(see note (f))
Special Refinancing & Restructuring Intervention fund (SRRIF) see note
(j)
The amount of N9,766,870,572 represents the outstanding balance in the on-lending facility granted to the Bank by Central Bank of Nigeria in collaboration
with the Federal Government of Nigeria (FGN) in respect of Commercial Agriculture Credit Scheme (CACS) established by both CBN and the FGN for
promoting commercial agricultural enterprises in Nigeria. The facility is for a maximum period of 7 years at a zero percent interest rate to the Bank however, a
management fee of 1% deductible at source is paid by the Bank under the on-lending agreement. The Bank did not provide security for this facility.From this
creditor, the bank has nil undrawn balance as at 31 December 2016.
The amount of N4,500,284,025 represents an outstanding balance on the intervention credit granted to the Bank by the Bank of Industry (BOI), a company
incorporated in Nigeria for the purpose of refinancing or restructuring existing loans to Small and Medium Scale Enterprises (SMEs) and manufacturing
companies. The total has a 15 year tenor. A management fee of 1% deductible at source is paid by the Bank under the on-lending agreement and the Bank is
under obligation to on-lend to customers at an all-in interest rate of 7% per annum. Though the facility is meant for on-lending to borrowers in specified
sectors, the Bank remains the primary obligor to the BOI and therefore assumes the risk of default of customers. From this creditor, the bank has nil undrawn
balance as at 31 December 2016.
The amount of N12,881,897,417 represents the outstanding balance on intervention credit granted to the Bank by the Bank of Industry (BOI), a company
incorporated in Nigeria, to be applied to eligible power and airline projects. The total facility has a maximum tenor of 15 years. A management fee of 1%
deductible at source is paid by the Bank under the on-lending agreement and the Bank is under obligation to on-lend to customers at an all-in interest rate of
7% per annum. Though the facility is meant for on-lending to borrowers within the power and aviation sectors, the Bank remains the primary obligor to the BOI
and therefore assumes the risk of default of customers. From this creditor, the bank has nil undrawn balance as at 31 December 2016.
The amount of N74,425,046,093 (USD237,003,000) represents the outsatnding borrowings of Access Bank Plc from Access Finance BV in respect of the dollar
guaranteed notes issued by Access Finance B.V., Netherlands which is due on 25 July 2017. The notes were issued on 25 July 2012 for a period of 5 years with
the principal amount repayable at the end of the tenor while interest on the Notes is payable semi-annually at 7.34%, in arrears on 25 January and 25 July in
each year.In Oct 2016 , USD 112,997,000 out of USD 350,000,000 was exchanged at a premium for a new note issued by Access Bank Plc .The annual
effective interest rate is 7.65%. From this creditor, the bank has nil undrawn balance as at 31 December 2016.
The amount of N6,633,474,944 represents the outstanding balance on intervention credit granted to the bank by the Bank of Industry (BOI) under the Special
refinancing and Restructuring intervention fund, with a 10 year tenor which is due on the 31 August 2024. The bank has a 36 months moratorium on the facility
after which principal repayment will be charged quarterly. Though the facility is meant for on-lending to borrowers in specified sectors, the Bank remains the
primary obligor to the BOI and therefore assumes the risk of default of customers. From this creditor, the bank has nil undrawn balance as at 31 December
2016.
The amount of N2,554,645,892 (USD 8,375,888) represents the outstanding balance on the on-lending facilities granted to the Bank by the International
Finance Corporation (IFC) in November 2013 (USD 50m) for a period of 5 years. The principal amount is repayable semi-annually from December 2014 while
interest is paid semi annually at 4% above 6months LIBOR. The annual effective interest rate is 4.80%.From this creditor, the bank has nil undrawn balance as
at 31 December 2016.
The amount of N26,979,759,117 (USD 88,458,226) represents the outstanding balance on five on-lending facilities granted to the Bank by the European
Investment Bank (EIB) in May 2013(USD 25m), September 2013 (USD 26.75m) , June 2014 (USD 14.7m) , September 2015 (USD 27.9m) and March 2016
(USD 27.1m) for a period of 6 years each for the first three and period of 8 years each for the last two. The average annual effective interest rates are 3.48%,
2.97% , 3.18%, 2.97% and 2.97% respectively. From this creditor, the bank has nil undrawn balance as at 31 December 2016.
There have been no defaults in any of the borrowings covenants during the year.
The amount of N29,026,301,669 (USD 95,168,202) represents the outstanding balance in the on-lending facility granted to the Bank by ADB (Africa
Development Bank) in two tranches one in June 2016 (USD 10m) for a period of 9 years, another in August 2014 (USD 90m) for a period of 10years and the
other in June 2016 (USD 10m) . The principal amount is repayable semi-annually from February 2010 for the first tranche and February 2017 for the second
and third tranche. Interest is paid semi annually at 3% above 6 months LIBOR. The annual effective interest rate is 4.28% ,2.00% and 2.04% respectively. From
this creditor, the bank has nil undrawn balance as at 31 December 2016.
The amount of N1,513,900,980 (USD 4,963,609) represents the outstanding balance in the on-lending facility granted to the Bank by the Netherlands
Development Finance Company effective from 15 December 2012 and disbursed in February 2013 (USD 10m) for a period of 6.5 years. The principal amount is
repayable semi-annually from December 2015 while interest is paid semi annually at 3% above 6 months LIBOR. The annual effective interest rate is 5.16%.
From this creditor, the bank has nil undrawn balance as at 31 December 2016.
The amount of N11,580,282,545 (USD 37,968,139) represents the outstanding balance in the on-lending facility granted to the Bank by the French
Development Finance Company effective from 15 December 2012 and disbursed in four tranches; February 2013 (USD 6m) , October 2013 (USD 15m) , October
2013 (USD 9m) and November 2014 (USD 30m) for a period of 6.5 years each and 5 years respectively. The principal amount is repayable semi-annually from
December 2014 with the latter repayable from January 2016 while interest is paid semi annually at 3% above 6 months LIBOR. The annual effective interest
rate is 4.36% for the first tranche, 4.04% for the second tranche, 4.06% for the third tranche and 3.57% for the fourth tranche. From this creditor, the bank has
nil undrawn balance as at 31 December 2016.
193

Access Bank Plc
Notes to consolidated financial statements
For the year ended 31 December 2016
(k)
(l)
Movement in interest bearing loans and borrowings:
In thousands of Naira Group Bank
Balance as at 1 January 2015 79,816,309 146,345,767
Additions 162,576,810 162,647,056
Repayments (15,331,150) (15,331,150)
FV gain/loss 4,405,192 9,258,314
Balance as at 31 December 2015/ 1 January 2016 231,467,161 302,919,987
Additions 69,307,930 69,307,930
Repayments (28,626,050) (63,090,135)
FV gain/loss 27,394,666 63,042,003
Balance as at 31 December 2016 299,543,707 372,179,785
The amount of N125,837,600,258 represents the outstanding balance on the excess crude account loans granted to the bank by the Central Bank of Nigeria for
onward disbursements to state governments. The facility has a tenor of 20 years with a 2% interest payable to the CBN. The Bank is under obligation to on-lend
to the states at an all-in interest rate of 9% per annum. From this creditor, the bank has nil undrawn balance as at 31 December 2016.
The amount of N66,479,721,447 represents the outstanding balance on the state salary bailout facilities granted to the bank by the Central Bank of Nigeria for
onward disbursements to state governments for payments of salary of workers of the states. The facility has a tenor of 20 years with a 2% interest payable to
the CBN. The Bank is under obligation to on-lend to the states at an all-in interest rate of 9% per annum. From this creditor, the bank has nil undrawn balance
as at 31 December 2016.
194

Access Bank Plc
Notes to consolidated financial statements
For the year ended 31 December 2016
37 Retirement benefit obligation
Group Group Bank Bank
In thousands of Naira December 2016 December 2015 December 2016 December 2015
Liability for defined contribution obligations 10,856 - - -
3,075,453 5,567,800 3,064,597 5,567,800
(a) Defined benefit obligations
The amounts recognised in the statement of financial position are as follows:
Group Group Bank Bank
In thousands of Naira December 2016 December 2015 December 2016 December 2015
Post employment benefit plan (see note (i) below) 3,064,597 5,567,800 3,064,597 5,567,800
Recognised liability 3,064,597 5,567,800 3,064,597 5,567,800
(i) Post employment benefit plan
Group Group Bank Bank
In thousands of Naira December 2016 December 2015 December 2016 December 2015
Deficit on defined benefit obligations at 1 January 5,567,800 3,267,364 5,567,800 3,267,364
Charge for the year:
-Interest costs 692,268 466,121 692,268 466,121
-Current service cost 504,727 318,184 504,727 318,184
-Past service cost - - - -
-Benefits paid - - - -
Net actuarial gain/(loss) for the year remeasured in OCI:
(577,343) (415,090) (577,343) (415,090)
(3,122,855) 1,931,221 (3,122,855) 1,931,221
Balance, end of year 3,064,597 5,567,800 3,064,597 5,567,800
Expense recognised in income statement:
Current service cost 504,727 318,184 504,727 318,184
Interest on obligation 692,268 466,121 692,268 466,121
Total expense recognised in profit and loss (see Note 14) 1,196,995 784,305 1,196,995 784,305
31 December 2016
In thousands of Naira
Decrease in
assumption by 1%
Liability changes
to
Total
comprehensive
income
Effect of changes in the assumption to the discount rate
Increase in liability by
5.5% 3,232,367 (167,770)
Effect of changes in assumption to the salary growth
Decrease in liability by
5.1% 2,909,189 155,408
Effect of changes in assumption to the mortality rate
Decrease in liability by
0.2% 3,057,012 7,585
The Bank operates a non-contributory, unfunded lump sum defined benefit post employment benefit plan for top executive management of the Bank from
General Manager and above based on the number of years spent in these positions. The scheme is also aimed at rewarding executive directors and other
senior executives for the contributions to achieving the Bank's long-term growth objectives.
There is no funding arrangement with a trustee for the Post employment benefit plan as the Bank pays for all obligations from its current year profit as
such obligations fall due. Depending on their grade, executive staff of the Bank upon retirement are entitled to certain benefits based on their length of
stay on that grade.
Recognised liability for defined benefit obligations (see note
(a) below)5,567,800 5,567,8003,064,597 3,064,597
The weighted average duration of the defined benefit obligation is 10.7years. The information on the maturity profile of the defined benefit plan includes
the maturity analysis and the distribution of the timing of payment. The estimated contribution to the plan for the next annual reporting period is:
N757Mn
The amount recognised in the statement of financial position is as follows:
Remeasurements - Actuarial gains and losses arising from
changes in demographic assumptions
Remeasurements - Actuarial gains and losses arising from
changes in financial assumption
Impact on defined benefit obligation
195

Access Bank Plc
Notes to consolidated financial statements
For the year ended 31 December 2016
Increase in
assumption by 1%
Liability changes
to
Total
comprehensive
income
Effect of changes in the assumption to the discount rate
Increase in liability by
5.0% 2,910,376 154,221
Effect of changes in assumption to the salary growth
Increase in the liability
by 5.5% 3,232,322 (167,725)
Effect of changes in assumption to the mortality rate
Increase in the liability
by 0.3% 3,073,008 (8,411)
31 December 2015
In thousands of Naira
Decrease in
assumption by 1%
Liability changes
to
Total
comprehensive
income
Effect of changes in the assumption to the discount rate
Increase in liability by
7.7% 5,996,911 429,111
Effect of changes in assumption to the salary growth
Decrease in liability by
6.75% 5,194,354 (373,446)
Effect of changes in assumption to the mortality rate
Decrease in liability by
6.75% 5,566,289 (1,511)
Increase in
assumption by 1%
Liability changes
to
Total
comprehensive
income
Effect of changes in the assumption to the discount rate
Increase in the liability
by 6.9% 5,180,880 (386,920)
Effect of changes in assumption to the salary growth
Increase in the liability
by 7.3% 5,975,830 408,030
Effect of changes in assumption to the mortality rate
Increase in the liability
by 0.03% 5,569,471 1,671
Impact on defined benefit obligation
Impact on defined benefit obligation
The above sensitivity analyses are based on a change in an assumption while holding all other assumptions constant. In practice, this is unlikely to occur,
and changes in some of the assumptions may be correlated. When calculating the sensitivity of the defined benefit obligation to significant actuarial
assumptions the same method (present value of the defined benefit obligation calculated with the projected unit credit method at the end of the year) has
been applied as when calculating the pension liability recognised within the statement of financial position. The methods and types of assumptions used
in preparing the sensitivity analysis did not change compared to the previous year.
Impact on defined benefit obligation
196

Access Bank Plc
Notes to consolidated financial statements
For the year ended 31 December 2016
Actuarial assumptions:
Principal actuarial assumptions at the reporting date (expressed as weighted averages):
The most recent valuation was performed by Alexander Forbes as at 31 December 2016.
December 2016 December 2015
Discount rate 16.70% 11.40%
Future salary increases 5.00% 10.00%
Retirement age for both male and female 60 years 60 years
Retirement rate: 50 – 59 (average rate) 3.40% 3.40%
Withdrawal rate: 16 – 29 4.50% 4.50%
Withdrawal rate: 30 – 44 6.00% 6.00%
Withdrawal rate: 45 – 50 5.00% 5.00%
Withdrawal rate: 51 – 55 (average rate) 3.75% 3.50%
38 Capital and reserves
A Share capital
Bank Bank
In thousands of Naira December 2016 December 2015
(a) Authorised:
Ordinary shares:
19,000,000 19,000,000
Preference shares:
2,000,000,000 Preference shares of 50k each 1,000,000 1,000,000
20,000,000 20,000,000
Bank Bank
In thousands of Naira December 2016 December 2015
(b) Issued and fully paid-up :
28,927,971,631 Ordinary shares of 50k each 14,463,986 14,463,986
Ordinary shareholding:
Preference shareholding:
The movement on the issued and fully paid-up share capital account during the year was as follows:
Bank Bank
December 2016 December 2015
In thousands of Naira
Balance, beginning of year 14,463,986 11,441,460
Additions through issuance of rights - 3,022,526
Balance, end of year 14,463,986 14,463,986
(c) The movement on the number of shares in issue during the year was as follows:
Group Group
In thousands of units December 2016 December 2015
Balance, beginning of year 28,927,972 22,882,919
Additions through issuance of rights - 6,045,053
Balance, end of year 28,927,972 28,927,972
Assumptions regarding future mortality before retirement are based on A49/52 ultimate table published by the Institute of Actuaries of United Kingdom. The
rate used to discount post employment benefit obligations has been determined by reference to the yield on Nigerian Government bonds of medium duration.
This converts into an effective yield of 16.70% as at 31 December 2016. For members in active service as at the valuation date, the projected unit credit method
of valuation as required under the IFRS has been adopted.
The holders of ordinary shares are entitled to receive dividends as declared from time to time and are entitled to vote at meetings of the Bank. All ordinary
shares rank pari-passu with the same rights and benefits at meetings of the Bank.
Preference shares do not carry the right to vote. Preference shareholders have priority over ordinary shareholders with regard to the residual assets of the Bank
and participate only to the extent of the face value of the shares plus any accrued dividends. No preference shares were in issue as at the end of the year
38,000,000,000 Ordinary shares of 50k each
(2013: 24,000,000,000 ordinary share of 50k each)
197

Access Bank Plc
Notes to consolidated financial statements
For the year ended 31 December 2016
B Share premium
Share premium is the excess paid by shareholders over the nominal value for their shares.
Group Group
December 2016 December 2015
In thousands of Naira
Balance, beginning of year 197,974,816 161,036,211
Additions through issuance of rights - 36,938,605
Balance, end of year 197,974,816 197,974,816
C Reserves
(i) Other Reserves
Other regulatory reserves
Statutory reserves
SMEEIS Reserves
(ii) Share scheme reserve
(iii) Treasury shares
(iv) Capital reserve
(v) Fair value reserve
(vi) Foreign currency translation reserve
(vii) Regulatory risk reserve
(viii) Retained earnings
This balance appears only in the Group accounts and represents the foreign currency exchange difference arising from translating the results and financial
position of all the group entities (none of which has the currency of a hyper-inflationary economy) that have a functional currency different from the
presentation currency.
The regulatory risk reserves warehouses the difference between the allowance for impairment losses on balance on loans and advances based on Central Bank
of Nigeria prudential guidelines and Central Bank of the foreign subsidiaries regulations, compared with the loss incurred model used in calculating the
impairment under IFRSs.
The Small and Medium Enterprises Equity Investment Scheme (SMEEIS) reserve is maintained to comply with the Central Bank of Nigeria (CBN)/ Banker's
committee's requirement that all licensed deposit money banks in Nigeria set aside a portion of the profit after tax in a fund to be sued to finance equity
investment in qualifying small and medium scale enterprises. Under the terms of the guideline (amended by a CBN letter dated 11 July 2006), the
contributions will be 10% of profit after tax and shall continue after the first 5 years but banks' contribution shall thereafter reduce to 5% of profit after tax
However, this is no longer mandatory. Therefore, no additional appropriation has been done during the year.
The small and medium scale industries equity investment scheme reserves are non-distributable.
Retained earnings are the carried forward recognised income net of expenses plus current year profit attributable to shareholders.
Nigerian banking regulations require the Bank to make an annual appropriation to a statutory reserve. As stipulated by S.16(1) of the Banks and Other
Financial Institution Act of Nigeria, an appropriation of 30% of profit after tax is made if the statutory reserve is less than paid-up share capital and 15% of
profit after tax if the statutory reserve is greater than the paid up share capital.
This represents the shares held by the new RSPP scheme which have not yet been allocated to staff based on the pre-determined vesting conditions.
This balance represents the surplus nominal value of the reconstructed shares of the Bank which was transferred from the share capital account to the capital
reserve account after the share capital reconstruction in October 2006. The Shareholders approved the reconstruction of 13,956,321,723 ordinary shares of 50
kobo each of the Bank in issue to 6,978,160,860 ordinary shares of 50 kobo each by the creation of 1 ordinary shares previously held.
The fair value reserve comprises the net cumulative change in the fair value of available-for-sale investments until the investment is derecognised or impaired.
This represents the total expenses incurred in providing the Bank's shares to its qualifying staff members under the RSPP scheme.
198

Access Bank Plc
Notes to consolidated financial statements
For the year ended 31 December 2016
D Non-controlling interest
This represents the Non-controlling interest's (NCI) portion of the net assets of the Group
Group Group
December 2016 December 2015
In thousands of Naira
Access Bank, Gambia 1,142,313 735,523
Access Bank, Sierra Leone 57,189 42,848
Access Bank Zambia 276,532 156,847
Access Bank, Rwanda 838,624 617,765
Access Bank, Congo 1,172,519 868,669
Access Bank, Ghana 2,759,852 1,478,314
6,247,029 3,899,966
This represents the NCI share of profit/(loss) for the year
Group Group
December 2016 December 2015
In thousands of Naira
Access Bank, Gambia 59,235 106,232
Access Bank, Sierra Leone 4,698 1,876
Access Bank Zambia (980) 1,140
Access Bank, Rwanda (36,204) 25,066
Access Bank, Congo 113,372 68,906
Access Bank, Ghana 182,200 333,013
322,322 536,233
Group Group
December 2016 December 2015
Proportional Interest of NCI in subsidiaries % %
Access Bank, Gambia 36% 36%
Access Bank, Sierra Leone 3% 3%
Access Bank Zambia 8% 8%
Access Bank, Rwanda 25% 25%
Access Bank Congo 26% 26%
Access Bank, Ghana 9% 8%
199

Access Bank Plc
Notes to consolidated financial statements
For the year ended 31 December 2016
E Dividends
Bank Bank
December 2016 December 2015
In thousands of Naira
Interim dividend paid (2016: 25k, 2015: 25k) 7,231,993 7,231,993
Final dividend paid (2015: 30k) - 8,678,392
7,231,993 15,910,385
Number of shares 28,927,972 28,927,972
The Directors proposed a final dividend of 40k for the year ended 31 December 2016
39 Contingencies
Claims and litigation
Contingent liability and commitments
Nature of instruments
Acceptances, bonds, guarantees and other obligations for the account of customers:
a. These comprise:
Group Group Bank Bank
December 2016 December 2015 December 2016 December 2015
In thousands of Naira
Contingent liabilities:
Transaction related bonds and guarantees 186,251,718 221,127,530 136,163,848 218,067,025
Financial guarantees 99,582,709 94,135,927 85,513,821 91,640,933
Commitments:
261,208,243 188,826,683 158,994,793 160,094,292
Future, swap and forward contracts 933,073,893 468,759,809 900,436,358 440,800,900
1,480,116,562 972,849,949 1,281,108,819 910,603,150
The Group is a party to numerous legal actions arising out of its normal business operations. The Directors believe that, based on currently available
information and advice of counsel, none of the outcomes that result from such proceedings will have a material adverse effect on the financial position of
the Group, either individually or in the aggregate. A provision of N614mn has been made for the year ended 31 December 2016
In common with other banks, Group conducts business involving acceptances, performance bonds and indemnities. The majority of these facilities are
offset by corresponding obligations of third parties. Contingent liabilities and commitments comprise acceptances, endorsements, guarantees and letters
of credit.
An acceptance is undertaken by a bank to pay a bill of exchange drawn on a customer. The Group expects most acceptances to be presented, but
reimbursement by the customer is normally immediate. Endorsements are residual liabilities of the Group in respect of bills of exchange, which have
been paid and subsequently rediscounted.
Guarantees and letters of credit are given as security to support the performance of a customer to third parties. As the Group will only be required to
meet these obligations in the event of the customer's default, the cash requirements of these instruments are expected to be considerably below their
nominal amounts.
Other contingent liabilities include transaction related custom and performance bonds and are generally short term commitments to third parties which
are not directly dependent on the customer's credit worthiness. Commitments to lend are agreements to lend to a customer in the future, subject to
certain conditions. Such commitments are either made for a fixed period, or have no specific maturity dates but are cancellable by the lender subject to
notice requirements. Documentary credits commit the Group to make payments to third parties, on production of documents, which are usually
reimbursed immediately by customers.
The table below summarises the fair value amount of contingent liabilities and commitments off-financial position risk:
Clean line facilities for letters of credit, unconfirmed letters
of credit and other commitments
The Bank granted clean line facilities for letters of credit during the year to guarantee the performance of customers to third parties.
Contractual capital commitments undertaken by the Bank during the year amounted to N365.4Mn (31 Dec 2015: N330.9Mn)
200

Access Bank Plc
Notes to consolidated financial statements
For the year ended 31 December 2016
40 Cash and cash equivalent
Cash and cash equivalents include the following for the purposes of the statement of cash flows:
Group Group Bank Bank
December 2016 December 2015 December 2016 December 2015
In thousands of Naira
Cash on hand and balances with banks 68,423,783 80,060,005 59,637,792 52,307,363
Unrestricted balances with central banks 139,954,922 90,721,388 33,160,736 74,158,434
Money market placements 119,826,012 52,433,982 41,798,197 26,111,216
Investment under management 14,871,247 10,403,608 14,871,247 10,403,608
- 425,128 - 425,128
343,075,964 234,044,111 149,467,972 163,405,749
Cash and cash equivalent for the purpose of the preparation of the statement of cash flows excludes cash collaterals held for letters of credit and the
mandatory cash deposit held with the Central Bank of Nigeria.
Treasury bills with original maturity of less than 90days
201

Access Bank Plc
Notes to consolidated financial statements
For the year ended 31 December 2016
41 Contraventions of the Banks and Other Financial Institutions Act of Nigeria and CBN circulars
S/N Regulatory Body Infraction
i) Central Bank of Nigeria
ii) Central Bank of Nigeria
iii) Central Bank of Nigeria
(a)
(b)
('c)
iv) Securities and Exchange
Commission
42 Events after reporting date
43 Related party transactions
Transactions with key management personnel
Parent
(a) Loans and advances to related parties
Year ended 31 December 2016
Directors and
other key
management
personnel (and
close family
members) Subsidiaries Total
In thousands of Naira
Balance, beginning of year 3,473,640 59,780,277 63,253,917
Net movement during the year (2,442,741) 32,234,324 29,791,583
Balance, end of year 1,030,899 92,014,601 93,045,500
Interest income earned 73,810 754,918 828,728
Bad or doubtful debts due from related parties expense - - -
The loans issued to directors and other key management personnel (and close family members) as at 31 December 2016 of N1.03Bn are repayable in various cycles
ranging from monthly to annually over the tenor. The transactions were carried out at arms length and have an average tenor of 3 years. The loans are collateralised
by a combination of lien on shares of quoted companies, fixed and floating debentures, corporate guarantee, negative pledge, domiciliation of proceeds of company's
receivables, legal mortgages and cash.
The loan to subsidiaries relates to a foreign interbank placements of USD302M granted during the year. It is a non-collateralised placement advanced at an average
interest rate of 1.32% and a tenor less than 12 months. This loan has been eliminated on consolidation and does not form part of the reported Group loans and
advances balance.
No impairment losses have been recorded against balances outstanding during the year with key management personnel, and no specific allowance has been made
for impairment losses on balances with key management personnel and their immediate relatives at year end.
The parent company, which is also the ultimate parent company, is Access Bank Plc.
Subsequent to the end of the reporting period, the Board of Directors proposed a final dividend of 40k each payable to shareholders on register of shareholding at
the closure date.
There are no other post balance sheet event that require disclosure in these consolidated financial statements.
Parties are considered to be related if one party has the ability to control the other party or exercise influence over the other party in making financial and
operational decisions, or one other party controls both. The definition includes subsidiaries, associates, joint ventures and the Group’s pension schemes, as well as
key management personnel.
The Group’s key management personnel, and persons connected with them, are also considered to be related parties. The definition of key management includes the
close members of family of key personnel and any entity over which key management exercise control. The key management personnel have been identified as the
executive and non-executive directors of the Group. Close members of family are those family members who may be expected to influence, or be influenced by that
individual in their dealings with Access Bank Plc and its subsidiaries.
The bank granted various credit facilities to its subsidiary companies and key management personnel. Key Management Personnel is defined as members of the
Board of Directors of the bank, including their close members of family and any entity over which they exercise control. Close member of family are those who may
be expected to influence or be influenced by that individual in dealings with the bank.
The rates and terms agreed are comparable to other facilities being held in the bank's portfolio. Details of these are described below:
Sum of N1.475 million penalty to SEC for late submission of annual report
Sum of N24 million in discharge for the penalties on AML/CFT examination.
Sum of N 6 million for 3 violations as noted below:
N2 million penalty with respect to the rendition of reports on PEPS (Politically Exposed Persons),
N2 million penalty for failure to Conduct Enhanced Due Diligence on directors of some customers,
N2 million penalty for usage of general/blanket PEP approval for a particular customer.
Sum of N18 million in respect of risk based supervision examination.
202

Access Bank Plc
Notes to consolidated financial statements
For the year ended 31 December 2016
(b) Deposits from related parties
Directors (and
close family
members and
related entities) Subsidiaries Total
Year ended 31 December 2016
In thousands of Naira
Balance, beginning of year 1,011,482 60,994,350 62,005,832
Net movement during the year 1,026,542 48,631,914 49,658,456
Balance, end of year 2,038,024 109,626,264 111,664,288
Interest expenses on deposits 89,035 2,415,717 2,504,752
(c ) Borrowings from related parties
Subsidiaries Total
In thousands of Naira
Borrowings at 1 January 2016 71,523,252 71,523,252
Net movement during the year 2,901,794 2,901,794
Borrowings at 31 December 2016 74,425,046 74,425,046
Interest expenses on borrowings 6,172,795 6,172,795
(d) Other balances and transactions with related parties
Directors (and
close family
members and
related entities) Subsidiaries Total
In thousands of Naira
Cash and cash equivalent - 38,354,656 38,354,656
Derivative financial instruments - - -
Deposit for Investments - 11,949 11,949
Deposit from financial institutions - 70,132,669 70,132,669
Receivables - 19,626 19,626
Payables - 35,491 35,491
Other Liabilities - 706,852 706,852
Fee and commission expense - 705,127 705,127
Off balance sheet exposures - 52,348,673 52,348,673
(e) Key management personnel compensation for the year comprises:
Directors’ remuneration
December 2016 December 2015
In thousands of Naira
Non-executive Directors
Fees 51,875 58,125
Other emoluments:
Allowances 112,438 125,750
164,313 183,875
Executive directors
Short term employee's benefit 680,435 680,435
Defined contribution plan 14,813 14,813
Share based payment 52,960 25,438
Long term incentive plan - 500,000
748,208 1,220,686
Total compensation to key management personnel 912,521 1,404,561
No impairment losses have been recorded against balances outstanding during the year with key management personnel, and no specific allowance has been made
for impairment losses on balances with key management personnel and their immediate relatives at year end.
The deposits are majorly term deposit with an average interest rate and tenor of approximately 4.37% and 6months for directors and 2.20% and 3 months for
subsidiaries.
The borrowings from subsidiaries represent the borrowings of Access Bank Plc from Access Finance BV in respect of the dollar guaranteed notes issued by Access
Finance B.V, Netherlands which is due on 25 July 2017. The notes were issued on 25 July 2012 for a period of 5 years with the principal amount repayable at the end
of the tenor while interest on the Notes is payable semi-annually at 7.34%, in arrears on 25 January and 25 July in each year. The annual effective interest rate is
7.65%. In October 2016 , USD 112,997,000 out of USD 350,000,000 was exchanged at a premium for a new note issued by Access Bank Plc.
203

Access Bank Plc
Notes to consolidated financial statements
For the year ended 31 December 2016
(f) Directors remuneration:
Remuneration paid to Directors of the Bank (excluding pension contributions and other benefits) was as follows:
December 2016 December 2015
In thousands of LCY
Fees as Directors 51,875 58,125
Other emoluments 207,898 180,138
Executives Directors 264,220 264,220
Allowances 112,438 125,750
The Directors remuneration show above includes
December 2016 December 2015
Chairman 41,993 43,406
Highest paid Director 85,160 85,160
The emoluments of all other directors fell within the following ranges:
December 2016 December 2015
N20,000,001 - N37,000,000 16 16
16 16
204

Access Bank Plc
Notes to consolidated financial statements
For the year ended 31 December 2016
44
1 Combined Industrial Agro Ex-Chairman Mr. Gbenga Oyebode Overdraft 106,250,000 Performing Corporate Guarantee of Assets Management Group Limited.
2 Asset Management Group Limited Ex-Chairman Mr. Gbenga Oyebode Time loan 1,460,189,022 Performing
4 Sic Property And Investment Company Ltd Non-executive director Mr Ortisedere Otubu Term Loan 945,000,000 Performing 1. Legal Mortgage
2. Personal Guarantee
3. Debenture
5 Paul Usoro & Company Non-executive director Mr Paul Usoro Overdraft 180,013,000 Performing Cash collateral
Credit Card 1,679,000 Performing Cash collateral
Balance, end of year 2,693,131,022
Outstanding
Principal
Status Nature of security
1. Pledged properties at Ikoyi Lagos
2. Personal guarantee
3 Domicilliation of Rental Income
Director-related exposures
Access Bank has some exposures that are related to its Directors. The Bank however follows a strict process before granting such credits to its Directors. The requirements for creating and managing this category of risk assets include the following amongst others:
b. Full compliance with the relevant CBN policies on insider-related lending.
c. All affected Directors are precluded from taking part in the approval process of credit request wherein they have interest.
a. Complete adherence to the requirements for granting insider-related exposure as stated in the Bank’s Credit Policy Guidelines, the Insider-related Policy as well as the Bank’s duly approved Standard Operating
Procedure for managing insider-related exposures.
S/N Name of borrower Relationship to reporting
institution
Name of related
Directors
d. The related Director is required to execute a document authorizing the Bank to use their accruable dividends to defray any related-obligor's delinquent exposures.
e. The Directors are required to execute documents for the transfer of their shares to the Bank’s nominated broker to ensure effective control as required by the CBN policy to enhance the bank’s Corporate
Governance structure.
f. Section 89 of the Bank’s Article of Association also reiterated that “a related Director shall vacate office or cease to be a Director, if the Director directly or indirectly enjoys a facility from the Bank
that remains non-performing for a period of more than 12months.”
Below is a schedule showing the details of the Bank’s director-related lending:
The Bank’s gross exposure to all its directors as at 31 December 2016 is N2.69bn. However, the relevant obligors under this category also have credit balances and deposits maintained in their bank accounts which mitigate the risks to the bank.
Facility type
205

Access Bank Plc
Notes to consolidated financial statements
For the year ended 31 December 2016
45 Non-audit services
Service Description Contractual sum
N'000
1 3,000
2 55,000
3 10,000
68,000
In the bank's opinion, the provision of these services to the bank did not impair the independence and objectivity of the external auditor.
During the year, the bank's auditor, PricewaterHouseCoopers, were awarded the following contracts;
Audit opinion on the summary of the Bank's financial statements for the
periods ended 31 December, 2014, 31 December 2015 and 30 June 2016 for
statement of financial positions, statement of comprehensice income and
statement of cash flows.
Tick and tie of the financial statements for the period ended 31 December
2014, 31 December 2015 and 30 June 2016 and subsequent comforting of the
numbers for the Eurobond
Revenue review automation to reduce income leakages and facilitate
recoveries
Opinion on the summary of the
financial statements of the Bank with
relations to the commercial paper
issued by the Bank
Comfort letter on the summary of the
Bank's financial statement with
relations to the Eurobond issued by the
Bank
Automation of Revenue assurance
reviews
206

Access Bank Plc
Notes to consolidated financial statements
For the year ended 31 December 2016
OTHER NATIONAL DISCLOSURES
Value Added Statement
In thousands of Naira
Group Group
December 2016 December 2015
% %
Gross earnings 381,320,783 337,404,230
Interest expense
Foreign (29,874,830) (2,448,292)
Local (59,894,789) (86,104,533)
291,551,164 248,851,405
Net impairment (loss) on financial assets (20,009,422) (10,839,793)
Net impairment loss on other financial assets (1,943,398) (4,284,977)
Bought-in-materials and services
Foreign (3,859,283) (2,044,934)
Local (92,771,676) (90,330,010)
Value added 172,967,385 141,351,691
Distribution of Value Added
To Employees:
Employees costs 51,795,538 30% 42,346,952 30%
To government
Government as taxes 18,900,109 11% 9,169,344 6%
To providers of finance
Interest on borrowings 18,369,256 11% 13,868,292 10%
Dividend to shareholders 15,910,384 9% 15,241,014 11%
Retained in business:
For replacement of property and
equipment and intangible assets
11,293,791 7% 10,098,330 7%
Retained profit (including Statutory and
regulatory risk reserves
56,105,661 33% 50,627,759 36%
172,374,739 100% 141,351,691 100%
207

Access Bank Plc
Notes to consolidated financial statements
For the year ended 31 December 2016
OTHER NATIONAL DISCLOSURES
Value Added Statement
Bank Bank
In thousands of Naira December 2016 December 2015
% %
Gross earnings 331,000,972 302,061,975
Interest expense
Foreign (32,402,507) (2,448,292)
Local (48,892,468) (76,069,175)
249,705,997 223,544,508
Net impairment (loss) on financial assets (16,319,192) (9,902,690)
Net impairment loss on other financial assets (1,321,935) (4,284,977)
Bought-in-materials and services
Foreign (3,859,283) (2,044,934)
Local (82,273,670) (81,863,745)
Value added 145,931,916 125,448,162
Distribution of Value Added
To Employees:
Employees costs 42,153,587 29% 35,699,471 28%
To government
Government as taxes 16,553,441 11% 6,253,168 5%
To providers of finance
Interest on borrowings 13,569,723 9% 15,484,411 12%
Dividend to shareholders 15,910,384 11% 15,241,014 12%
Retained in business:
For replacement of property and
equipment
9,629,029 7% 9,086,366 7%
Retained profit (including Statutory and
regulatory risk reserves
48,115,751 33% 43,683,732 35%
145,931,915 100% 125,448,162 100%
208

Access Bank Plc
Notes to consolidated financial statements
For the year ended 31 December 2016
OTHER NATIONAL DISCLOSURES
Other financial Information
Five-year Financial Summary
December 2016 December 2015 December 2014 December 2013 December 2012
Group
12 months 12 months 12 months 12 months 12 months
In thousands of Naira N’000 N’000 N’000 N’000 N’000
Assets
Cash and balances with banks 713,889,105 478,409,336 405,014,793 439,459,541 405,292,241
Investment under management 14,871,247 10,403,608 - - -
Non pledged trading assets 44,629,579 52,298,422 28,411,644 3,877,969 27,906,803
Pledged assets 314,947,502 203,715,397 87,072,147 63,409,851 60,949,856
Derivative financial instruments 156,042,984 77,905,020 24,866,681 102,123 30,949
Loans and advances to banks 45,203,002 42,733,910 12,435,659 24,579,875 4,564,943
Loans and advances to customers 1,809,459,172 1,365,830,831 1,110,464,442 786,169,703 604,073,399
Trading properties - - - - 2,693,227
Investment securities 229,113,772 186,223,126 270,211,388 353,811,348 447,281,811
Insurance receivables - - - - 627,337
Other assets 63,255,054 83,014,503 56,310,620 52,019,723 67,935,352
Investment properties - - - 23,974,789 14,360,567
Investments in equity accounted investee - - - 3,623,326 2,774,647
Investment in subsidiary - - - - -
Property and equipment 84,109,052 73,329,927 69,659,707 67,243,305 64,634,438
Intangible assets 6,939,555 6,440,616 5,592,991 3,659,072 3,404,945
Deferred tax assets 1,264,813 10,845,612 10,881,984 10,687,635 8,113,973
Assets classified as held for sale 140,727 179,843 23,438,484 2,847,740 30,827,257
Total assets 3,483,865,564 2,591,330,151 2,104,360,539 1,835,466,000 1,745,471,746
Liabilities
Deposits from financial institutions 167,356,583 72,914,421 119,045,423 72,147,956 96,893,015
Deposits from customers 2,089,197,286 1,683,244,320 1,454,419,052 1,331,418,659 1,201,481,996
Derivative financial instruments 30,444,501 3,077,927 1,989,662 32,955 35,515
Claims payable - - - - 118,226
Current tax liabilities 5,938,662 7,780,824 8,180,969 6,899,558 8,937,964
Other liabilities 113,571,240 69,355,947 21,689,079 56,847,216 58,418,260
Deferred tax liabilities 3,699,050 266,644 59,038 37,861 -
Liabilities on investment contracts - - - - 65,591
Liabilities on insurance contracts - - - - 3,351,234
Debt securities issued 316,544,502 149,853,640 138,481,179 55,828,248 54,685,891
Interest-bearing borrowings 299,543,707 231,467,161 79,816,309 64,338,982 48,369,849
Retirement benefit obligations 3,075,453 5,567,800 3,269,100 1,933,021 2,487,589
Contingent settlement provisions - - - - 3,548,250
Liabilities classified as held for sale - - - 1,499,495 25,793,512
Total liabilities 3,029,370,984 2,223,528,684 1,826,949,811 1,590,983,951 1,504,186,892
Equity
Share capital and share premium 212,438,802 212,438,802 172,477,671 172,477,671 176,628,255
Retained earnings 93,614,030 51,730,369 34,139,453 22,232,374 17,856,630
Other components of equity 142,194,720 99,732,330 67,262,761 48,003,894 38,700,374
Non controlling interest 6,247,028 3,899,966 3,530,843 1,768,110 8,099,594
Total equity 454,494,580 367,801,467 277,410,728 244,482,049 241,284,853
Total liabiities and Equity 3,483,865,564 2,591,330,151 2,104,360,539 1,835,466,000 1,745,471,746
Gross earnings 381,320,783 337,404,230 245,383,536 206,891,219 197,081,930
Profit before income tax 90,339,456 75,038,117 52,022,290 44,996,410 46,534,979
Profit from continuing operations - 65,868,773 43,063,479 36,101,830 44,839,636
Discontinued operations - - (87,267) 265,760 (5,511,361)
Profit for the year - 65,868,773 42,976,212 36,367,590 39,328,275
Non controlling interest 322,322 536,233 560,883 195,762 (191,904)
Profit attributable to equity holders (322,322) 65,332,540 42,415,329 36,171,828 39,520,179
Dividend paid 15,910,384 15,910,384 13,729,777 13,729,777 12,588,538
Earning or (loss) per share -Basic 249k 265k 189k 158k 172k - Adjusted 245k 262k 189k 158k 172k
Number of ordinary shares of 50k 28,927,971,631 28,927,971,631 22,882,918,908 22,882,918,908 22,882,918,908
209

Access Bank Plc
Notes to consolidated financial statements
For the year ended 31 December 2016
OTHER NATIONAL DISCLOSURES
Other financial Information
Five-year Financial Summary
December 2016 d December 2015 December 2014 December 2013 December 2012
Bank
12 months 12 months 12 months 12 months 12 months
In thousands of Naira N’000 N’000 N’000 N’000 N’000
Assets
Cash and balances with banks 517,997,249 405,998,636 351,174,879 395,808,747 284,062,159
Investment under management 14,871,247 10,403,608 - - -
Non pledged trading assets 44,629,579 52,298,422 28,411,644 3,877,969 3,769,260
Pledged assets 314,947,502 200,464,624 85,183,353 63,347,823 60,949,856
Derivative financial instruments 155,772,662 77,852,349 24,831,145 72,675 -
Loans and advances to banks 104,006,574 60,414,721 55,776,837 13,048,651 3,054,520
Loans and advances to customers 1,594,562,345 1,243,215,309 1,019,908,848 735,300,741 554,592,199
Trading properties - - - - -
Investment securities 161,200,642 155,994,798 226,137,983 309,071,802 420,346,295
Insurance receivables - - - - -
Other assets 50,594,480 78,623,381 48,246,307 44,326,360 61,431,658
Investment properties - - - 23,974,789 14,072,673
Investments in equity accounted investee - - - 1,521,812 1,980,808
Investment in subsidiary 59,239,252 45,439,246 40,120,572 38,029,992 43,209,688
Property and equipment 71,824,472 65,900,384 64,160,327 63,203,245 58,938,450
Intangible assets 5,173,784 4,977,908 4,436,814 2,661,553 2,339,510
Deferred tax assets - 10,180,832 10,128,537 9,847,853 7,007,387
Assets classified as held for sale 140,727 179,843 23,438,484 - -
Total assets 3,094,960,515 2,411,944,061 1,981,955,730 1,704,094,012 1,515,754,463
Liabilities
Deposits from banks 95,122,188 63,343,785 134,509,662 61,295,352 16,312,516
Deposits from customers 1,813,042,872 1,528,213,883 1,324,800,611 1,217,176,793 1,093,979,220
Derivative financial instruments 30,275,181 2,416,378 1,737,791 - -
Debt securities issued 243,952,418 78,516,655 73,155,391 - -
Claims payable - - - -
Current tax liabilities 5,004,160 6,442,311 7,113,226 6,075,590 7,686,568
Other liabilities 107,538,941 64,094,358 16,870,132 52,092,559 50,246,164
Retirement benefit obligations 3,064,597 5,567,800 3,267,364 - 2,485,093
Liabilities on investment contracts - - - -
Liabilities on insurance contracts - - - - -
Interest-bearing borrowings 372,179,785 302,919,987 146,345,767 120,342,026 103,872,441
Contingent settlement provisions - - - 1,929,695 3,548,250
Deferred tax liabilities 3,101,753 - - - -
Liabilities classified as held for sale - - - -
Total liabilities 2,673,281,895 2,051,515,157 1,707,799,944 1,458,912,015 1,278,130,252
Equity
Share capital and share premium 212,438,802 212,438,802 172,477,671 172,477,671 176,628,255
Retained earnings 93,329,188 49,459,102 36,499,779 23,095,392 18,880,711
Other components of equity 115,910,630 98,531,000 65,178,336 49,608,934 42,115,245
Total equity 421,678,620 360,428,904 274,155,786 245,181,997 237,624,211
Total liabilities and Equity 3,094,960,515 2,411,944,061 1,981,955,730 1,704,094,012 1,515,754,463
Gross earnings 331,000,972 302,061,975 221,610,769 182,888,906 172,719,708
Profit before income tax 80,579,576 65,177,914 46,142,422 31,365,396 36,259,530
Profit for the year 71,439,347 65,868,773 39,941,126 26,211,844 35,815,611
Dividend paid 15,241,014 15,910,384 13,729,777 13,729,777 12,588,538
Earning or (loss) per share -Basic 221k 237k 174k 114k 157k
- Adjusted 221k 237k 174k 114k 157k
Number of ordinary shares of 50k 28,927,971,631 28,927,971,631 22,882,918,908 22,882,918,908 22,882,918,908
210