Embed Size (px)
Citation preview
ACCEPTANCE This dissertation, IMPROVING RETENTION FOR PRINCIPLES OF ACCOUNTING
AND ELEMENTARY STATISTICS STUDENTS: ULTRA-SHORT TUTORIALS DESIGNED TO MOTIVATE EFFORT AND IMPROVE PERFORMANCE, by CAROL SPRINGER SARGENT, was prepared under the direction of the candidate’s Dissertation Advisory Committee. It is accepted by the committee members in partial fulfillment of
the requirements for the degree Doctor of Philosophy in the College of Education, Georgia State University. The Dissertation Advisory Committee and the student’s Department Chair, as
representatives of the faculty, certify that this dissertation has met all standards of excellence and scholarship as determined by the faculty. The Dean of the College of Education concurs.
______________________________ ___________________________ Amy R. Lederberg, Ph.D. A. Faye Borthick, Ph.D. Committee Chair Committee Member
______________________________ ___________________________ Daphne Greenberg, Ph.D. Dennis N. Thompson, Ph.D.
Committee Member Committee Member ______________________________
Date
______________________________ Peggy A. Gallagher, Ph.D. Chair, Department of Educational Psychology and Special Education
______________________________ R. W. Kamphaus, Ph.D.
Dean and Distinguished Research Professor College of Education

AUTHOR’S STATEMENT By presenting this dissertation as a partial fulfillment of the requirements for the
advanced degree from Georgia State University, I agree that the library of Georgia State University shall make it available for inspection and circulation in accordance with its regulations governing materials of this type. I agree that permission to quote, to copy from, or to publish this dissertation may be granted by the professor under whose
direction it was written, by the College of Education’s direction of graduate studies and research, or by me. Such quoting, copying, or publishing must be solely for scholarly purposes and will not involve potential financial gain. It is understood that any copying from or publication of this dissertation which involves potential financial gain will not be
allowed without my written permission.
____________________________________________ Carol Springer Sargent

NOTICE TO BORROWERS
All dissertations deposited in the Georgia State University library must be used in
accordance with the stipulation prescribed by the author in the preceding statement. The author of this dissertation is:
Carol Springer Sargent
1263 Clairmont Place Macon, Georgia 31204
The director of this dissertation is:
Amy R. Lederberg
Department of Educational Psychology and Special Education College of Education
Georgia State University Atlanta, Georgia 30302-3979

VITA
Carol Springer Sargent
ADDRESS: 1263 Clairmont Place Macon, Georgia 31204
EDUCATION: Ph.D. 2009 Georgia State University Educational Psychology M.S. 1982 University of Virginia
Accounting B.S. 1981 University of Virginia Commerce
PROFESSIONAL EXPERIENCE: 1989–Present Instructor, School of Accountancy Georgia State University, Atlanta, GA 1985-1989 Vice President and Corporate Controller
National Linen Service, Atlanta, GA 1992-1995 Accounting Manager Larson-Juhl, Inc., Norcross, GA
PROFESSIONAL SOCIETIES AND ORGANIZATIONS: 1990-Present American Accounting Association PRESENTATIONS AND PUBLICATIONS
Sargent, C. W. & Borthick, A. F. (2009). Just Three Minutes: A Learning Innovation for Struggling Students. American Accounting Association National Meeting, New York, NY (August 3-5).
Springer, C. W., & Borthick, A. F. (2007). Improving performance in accounting:
Evidence for insisting on cognitive conflicts tasks. Issues in Accounting Education, 22(1), 1-19. Springer, C. W., & Borthick, A. F. (2004). Business simulation to stage critical thinking in introductory accounting: Rationale, design and implementation. Issues in Accounting
Education, 19(3), 277-303. Springer, C. W., & Borthick, A. F. (2004). The Locator Business Simulation: Learning Experiences for Critical Thinking in Accounting. Mason, OH: South-Western.
Springer, C. W. (2004). Critical Thinking Curriculum. American Accounting Association National Meeting, Orlando, Florida (August 9-11).
Borthick, A. F. & Springer C. W. (2004). Developing a business simulation. Effective
learning strategies forum, American Accounting Association National Meeting, Orlando, Florida (August 9-11).
Springer, C. W. (2004). Critical Thinking Curriculum. American Educational Research Association National Meeting, San Diego, California (April 12-16).
Springer, C. W. & Borthick A. F. (2003). Cultivating critical thinking in accounting principles while increasing mastery of traditional accounting knowledge: Tradeoff not required. American Accounting Association National Meeting, Honolulu, Hawaii (August 3-6).
Borthick, A. F., Springer C. W. & Barden R. (2003). Learning to develop student capability for critical thinking. Effective learning strategies forum. American Accounting Association National Meeting. Honolulu, Hawaii (August 3-6).
Borthick, A. F., H. L. Dangel, and C. W. Springer. (2003). Pedagogy and assessment that
support critical thinking. Community of Practice, American Association for Higher Education Learning to Change Conference, Washington DC (March 14-17).
Borthick, A. F., H. L. Dangel, and C. W. Springer. (2003). Overcoming barriers to critical thinking. Colloquium on the Scholarship of Teaching and Learning Collaborating for Change. Carnegie Foundation for the Advancement of Teaching and the American Association for Higher Education, Washington DC (March 13-14).
Springer, C. W., and A. F. Borthick. (2003). Critical thinking cases in principles of accounting: Results. Georgia Association of Accounting Educators Annual Meeting, Rome, GA (February 7-8).
Springer, C., and A. F. Borthick. (2002). Safe Night Out: Critical thinking for solving ill-
structured business problems in an introductory accounting course . American Accounting Association National Meeting. San Antonio, Texas (August 15-17).

ABSTRACT
IMPROVING RETENTION FOR PRINCIPLES OF ACCOUNTING AND
ELEMENTARY STATISTICS STUDENTS: ULTRA-SHORT TUTORIALS DESIGNED TO MOTIVATE EFFORT AND IMPROVE PERFORMANCE
by Carol Springer Sargent
This dissertation reports on two supplemental instruction implementations in
courses with high failure rates. In study one, 27 ultra-short on-line tutorials were created
for Principles of Accounting II students (N = 426). In study two, 21 tutorials with a
similar design were created for Elementary Statistics students (N = 1,411). Accounting
students were encouraged by their instructor to use the resource, but statistics students
only saw a brief demonstration by the researcher. Neither course gave students credit for
using the tutorials.
In study one, 71.4% of the accounting students used the tutorials. Students who
used the tutorials had dramatically lower drop rates and better pass rates. Tutorial use was
correlated with exam scores, although the effect was moderate. Tutorial use remained at
high levels two years after implementation without instructors promoting use of the
resource. Course grades were higher for the two-year period after implementation
compared to the two years prior to implementation.
In study two, statistics sections were randomly assigned to intervention (tutorials;
695 students) or control (716 students). There were no significant differences in drop
rates or average grades between intervention and control sections. On average, 46.0% of
the intervention students used the tutorials. Users were less likely to drop and more likely

to pass compared to non-users and control students; these differences were especially
pronounced among low-achieving students. Tutorial use was correlated with slightly
higher exam scores, but only for low achievers. The lack of differences between
intervention and control sections may have been due to the drop off of usage after the
first exam and the small learning effect only accruing to the relatively small number of
low achievers. Partic ipants reported the tutorials as ―important to their course
achievement‖ more often than other course resources. The important features of the
tutorials were convenience (24/7 Internet access), efficiency of learning, and clear
instruction.
These studies suggest that the magnitude of the learning effect of the ultra-short
tutorials depends on the tutorial topics, instructor promotion of the resource, and whether
or not they are implemented in a course in which students feel the need to seek extra
instruction.

IMPROVING RETENTION FOR PRINCIPLES OF ACCOUNTING AND ELEMENTARY STATISTICS STUDENTS: ULTRA-SHORT
TUTORIALS DESIGNED TO MOTIVATE EFFORT
AND IMPROVE PERFORMANCE by
Carol Springer Sargent
A Dissertation
Presented in Partial Fulfillment of Requirements for the Degree of
Doctor of Philosophy in
Educational Psychology in
the Department of Educational Psychology and Special Education in
the College of Education Georgia State University
Atlanta, GA
2009

Copyright by
Carol Springer Sargent 2009

ii
ACKNOWLEDGMENTS
I am indebted to Amy Lederberg and A. Faye Borthick for their endless hours of
mentoring, their patience as I rearranged my personal life in the middle of this degree, and for their generosity at fixing, rather than criticizing, my glaring shortcomings as I evolved from business achiever to aspiring scholar. I am grateful to Dennis Thompson, for teaching me to marvel at the creative ways in which scientists isolate variables, for
sharing stories and wisdom at every turn, and for treating me as a colleague long before I had earned it. I am grateful to Daphne Greenberg who jumped into an already half-baked project, and helped to push it forward. This project would not have been possible without the encouragement and funding from the GSU Provost, Ron Henry, and the backing of
Bill Nelson, who arranged for statistics instructor cooperation on the math project. I appreciate the helpful comments , cooperation, and enthusiasm of countless colleagues in the College of Education, the Math Department, and the Robinson College of Business, as well as participants at annual meetings of the American Accounting Association. I am
especially grateful for the patience and loving support of Dr. Robert A. Sargent, Jr. , who met me after I had given up on this degree, encouraged me to continue, endured many lonely evenings while his fiancé and then new wife pounded the keyboard late into the night, and professionally edited this entire work.

iii
TABLE OF CONTENTS
Page
List of Tables……………………………………………………………………. iv List of Figures…………………………………………………………………… v
Chapter
1 IMPROVING RETENTION FOR PRINCIPLES OF ACCOUNTING STUDENTS: ULTRA-SHORT TUTORIALS DESIGNED TO MOTIVATE EFFORT AND IMPROVE PERFORMANCE……..…
1 Introduction………………………………………………………….... 1
Hypothesis Development……………………………………………… 1 Method: Study 1……………………………………………………… 9 Results: Study 1………………………….…………………………… 13 Method: Study 2……………………………………………………… 18
Results: Study 2……………………………………………….……… 20 Discussion……………………………………….…..………………… 24 Weaknesses and future work………………………………………..… 29 Conclusion..…………………………………………………………… 31
References………………………….…………………………………. 33 Appendixes……………………………………………………………. 42
2 A LOW MAINTENANCE SOLUTION FOR IMPROVING
RETENTION: SHORT TUTORIALS AIMED AT ENGAGING THE BOTTOM OF THE GRADE CURVE IN ELEMENTARY STATISTICS………………………………………………………….
44 Introduction……………………………………………………….….. 44
Methods………………………………………………………………. 55 Results………………………………………………………………… 62 Discussion…………………………………………….……………..… 76 Limitations and Areas for Further Work……………………………… 82
Conclusion..…………………………………………………………… 84 References……………………………………….……………………. 86 Appendixes……………………………………….…………………… 96

iv
LIST OF TABLES Tables Page
1
Participant Attributes Spring 2007…………………………………………
13
2
Tutorial Use and Grades by Achievement Level Spring 2007…………….
14
3 Retention Rates Spring 2007………………………………………………
16
4
Longitudinal Analysis of Change in Exam Scores with Tutorial Use Spring 2007…………………………………………………………….….
18
5
Participant Attributes Before and After Implementation……………….…
21
6
Grade Distribution Six Semesters Before and Six Semesters After Implementation……………………………………………………………
23
7
Course Grade as a Function of Tutorial Availability……………………..
24
8 Participant Attributes……………………………………………………. 56
9
Participation and Student Goals by Achievement Level for Students in Intervention Sections…………………………………………………….
62
10
Longitudinal Analysis of Change in Exam Scores with Tutorial Use…...
69
11
Exam Average as a Function of Tutorial Use………………………..…..
70
12 Self-Efficacy Measures and Survey Data………………………….….… 71
13
Course Resources Reported as Important to Achievement…….…….….
73
14
Low Achievers Only: Course Resources Reported As Important To
Achievement…………………………………………………………..…
75

v
LIST OF FIGURES
Figures Page
1 Digital Tutor Model for Overcoming Impediments to Learning In Principles of Accounting…………………………………………….….
8
2
Number of Tutorial Views in the Sequence of Topics Over the Semester………………………………………………………………...
15
3
Grade Distribution Before and After Tutorial Implementation………....
22
4 Students Receiving D, W, or F Grades Before and After Tutorial Availability………………………………………………………….…..
22
5 Tutorial Use by Topic in Order of Course Syllabus…………………… 63
6 Grade Distribution by Group – All Achievement Levels………………
64
7
Grade Distribution by Group – Low Achievers Only……………….…
65
8
Most Important Features of Tutorials As Reported By Users……….…
74

1
CHAPTER 1
IMPROVING RETENTION FOR PRINCIPLES OF ACCOUNTING STUDENTS: ULTRA-SHORT TUTORIALS DESIGNED TO MOTIVATE EFFORT AND
IMPROVE PERFORMANCE
INTRODUCTION As retention and progress toward completion of undergraduate degrees receive
more attention in higher education, failure rates in principles of accounting courses, the
gate-keeper courses for business majors, are coming under scrutiny. Typical explanations
for poor performance in the principles courses include the demands of family, work, and
extracurricular activities, intimidating classroom environments, low aptitude, and low
motivation (Wooten, 1996). This study analyzes the impact of a learning innovation,
ultra-short videos called ―Digital Tutors,‖ designed to target the latter three factors and
thus improve student effort and retention. In addition, unlike typical instructional
innovations, these materials, once created, require little continuing faculty effort.
HYPOTHESIS DEVELOPMENT
Lack of Confidence With Intimidating Subject Matter
Many students are intimidated by math-related subjects because they believe math
is complex and hard to learn (Ashcraft & Krause, 2007; Eccles & Midgley, 1990;
Gottfried, Marcoulides, Gottfried, Oliver, & Guerin, 2007; Hembree, 1990; Miller &
Mercer, 1997; Multon, Brown, & Lent, 1991). This difficulty translates into poor marks,
which lowers self-confidence in math-related tasks (math self-efficacy) (Pajares &

2
Miller, 1994), creates math anxiety (Hembree, 1990), and results in the not-so-good
students avoiding math tasks (Boekaerts, 1997; Hackett, 1985; Meece, Wigfield, &
Eccles, 1990). In college, approximately 22 percent of freshman take remedial math
courses and about half of all college algebra students fail (Thiel, Peterman, & Brown,
2008). Students who fear failure in math-related courses bring this crisis of confidence to
their introductory accounting course.
The accounting literature acknowledges the influence of confidence as a driver of
effort (Gracia & Jenkins, 2002; Stone, 1994; Stone, Arunachalam, & Chandler, 1996) ,
and estimates that about 25 percent of accounting students feel unsure or not confident in
their ability to succeed (Byrn & Flood, 2005). With college students, beliefs about math
ability account for more variance in math scores than any other motivational or
background variable because low beliefs about ability suppress adaptive academic
activity (Gist, Schwoerer, & Rosen, 1989; Pajares & Miller, 1994; Siegel, Galassi, &
Ware, 1985). Students who think they cannot do math do not try hard, avoid tasks, and
hesitate to ask for help (Kim, Baylor, & Group, 2006; Middleton & Midgley, 2002;
Zimmerman & Martinez-Pons, 1990).
Increasing subject matter mastery dominates other interventions in reducing math
anxiety (Benson, 1989; Hembree, 1990; Meece, et al., 1990). Principles instructors,
however, must cover a prescribed set of topics for entire classes, sometimes in large
lecture formats. They necessarily move on to the next topic, even if some students have
not yet mastered the current topic. As a course routine, building in a process for
remediation, re-teaching topics, and tailoring instruction to individual students should
help less confident and less able students (Yates, 2005).

3
Fortunately, digital media provide convenient platforms to provide remediation,
individualization, and re-teaching. Modern textbooks often include a range of
supplemental learning aids. So far these resources have not reduced the failure rates of
students in principles classes.
Low Aptitude
Accounting is complex, potentially taxing short-term memory for novices or low
ability students who have not yet linked ideas systematically together, or who know a
large body of facts (Smith, diSessa, & Roschelle, 1993; Sweller & Chandler, 1994).
Weak math students cannot hold as much numerical information in working memory as
stronger math students (Siegler, 2003). The cognitive literature suggests helping these
students learn incrementally by breaking down complex ideas into smaller parts, and later
integrating the learned parts into a cohesive interrelated model (Ayres, 2006; Mayer,
Mathias, & Wetzell, 2002; Smith, et al. , 1993; Sweller & Chandler, 1994).
One study in introductory accounting supported the breakdown-integrate strategy.
The students learned the accounting cycle better by first learning the model ―assets =
revenues,‖ before moving to the full six-element accounting equation (Edmonds &
Alford, 1989). Another study relying on this theory broke down two topics (earnings per
share and asset dispositions) into smaller tasks, and found that this approach was
associated with improved learning (Byrd & Byrd, 1987). Another way to make
complicated material more understandable is to walk students through example problems
before asking them to work problems on their own (Ayres, 2006; Sweller & Chandler,
1994); this has been effective in accounting studies (Halabi, Tuovinen, & Farley, 2005;
Kachelmeier, Jones, & Keller, 1992).

4
Students with limited knowledge are particularly vulnerable to flawed ideas and
partial understandings (Smith, et al. , 1993). Accounting has a conceptual aspect and a
procedural aspect. Weak learners can understand the process, but not the concept, or
understand the concept, but not the process. Lapses in either lead to systematic errors that
can be detected, diagnosed, and corrected (Siegler, 2003). Several studies have shown
that targeting misconceptions works better than providing more instruction (Huang, Liu,
& Shiu, 2008; Korner, 2005; Muller, Bewer, Sharma, & Reimann, 2007).
Prior success with incremental approaches suggests that course designers might
assist weaker students by using a ―knowledge in pieces‖ approach, so they can succeed
with smaller bits and build up a base of knowledge to be used for more complex
assignments. Given the need to cover the full set of course topics on schedule, weak
students could benefit from supplemental instruction that enables mastery learning of
small pieces, and offers guidance on misconceptions to help them build up to the same
level of knowledge as their classmates.
Inadequate Motivation
Empirical work confirms what most accounting instructors already know from
experience—motivation carries more predictive value than ability for students in
introductory business classes (Kruck & Lending, 2003), and principles of accounting
students can overcome low aptitude by increasing their effort (Wooten, 1996).
Motivating effort may be one of the key issues in the required principles of
accounting courses, especially for non-majors whose level of interest may be low. It is an
even greater problem for weak or less confident students, who may need extra support to
achieve, but do not want the stigma attached to remedial work, and are therefore hesitant
5
to ask for help (Fayowski & MacMillan, 2008; Karabenick & Knapp, 1988, 1991; Moore
& LeDee, 2006). Techniques for motivating introductory accounting students include
offering novel ways to learn and giving immediate feedback (De Lange, Suwardy, &
Mavondo, 2003; Greer, 2001; Marriott & Lau, 2008) , although one study claimed that
without significant course credit, students will not complete extra work voluntarily
(Elikai & Baker, 1988). To be successful, extra instruction should require little additional
effort from students, be distinctly different from traditional course activities (Bueschel,
2008), and be open to all achievement levels to avoid any stigma associated with use.
To attenuate poor motivation, learning activities can be made readily accessible
through digital media that respond to students’ expectations for anytime, anywhere
learning activities with immediate impact. This approach is consistent with Gee’s (2003)
principles for maximizing learning in interactive video settings:
1. The learner must be enticed to try, even if he or she already has good grounds to
be afraid to try.
2. The learner must be enticed to put in lots of effort even if he or she begins with
little motivation to do so.
3. The learner must achieve some meaningful success when he or she has expended
this effort (Gee, 2003, 61-62).
Supplemental Instruction
Extra instruction, in all its various forms, has improved mastery to some degree
for all students, although effect sizes vary depending on the match of the resource to the
learner’s needs (Congo & Schoeps, 1993; Simpson, Hynd, Nist, & Burrell, 1997).
Unfortunately for introductory accounting students, the effect sizes from supplemental

6
instruction have been low (Etter, Burmeister, & Elder, 2000; Jones & Fields, 2001; Potter
& Johnston, 2006) or not significant (McInnes, Pyper, Van Der Meer, & Wilson, 1995).
On the brighter side, studies in the accounting literature find increased learning with
virtual learning tools (Daroca & Nourayi, 1994; Jones & Fields, 2001; Lane & Porch,
2002; Parker & Cunningham, 1998; Potter & Johnston, 2006). Most accounting students
openly embrace virtual learning (E. Martin, Evans, & Foster, 1995; Wells, de Lange, &
Fieger, 2008), and the more accounting students used on-line supplements, the better
their learning outcomes were (Dowling, Godfrey, & Byles, 2003; Jones & Fields, 2001;
Turner, Lesseig, & Fulmer, 2006).
While the literature describes a vast array of supplemental instruction available to
assist weak or tentative students, voluntary participation has been very low (R. A. Blanc,
L. E. DeBuhr, & D. C. Martin, 1983; Simpson, et al. , 1997; Topping, 1996), and those
self-selecting into the extra instruction were more motivated students than those that did
not (Etter, et al., 2000; Simpson, et al., 1997). In an analysis of 132 introductory
accounting classes from 21 four-year colleges, the average participation rate for
supplemental instruction was 26.79 percent (Etter, et al. , 2000). At one university where
supplemental instruction was added to the first accounting course, 18 percent of the
students tried it, but only 28 out of 1,359 students attended more than half of the sessions,
making it hard to justify the implementation effort (Jones & Fields, 2001). For it to work
to support intimidated, low aptitude, or poorly motivated students, supplemental
instruction will need to elicit higher participation rates.

7
Hypotheses for Prompting Effort to Improve Retention
Supplemental instruction that improves mastery may be an antidote to lack of
confidence, i.e., when one learns something in a subject, that subject becomes less
intimidating to the learner (Benson, 1989; Hembree, 1990; Meece, et al., 1990). Low
aptitude might be overcome by breaking down complex ideas into smaller units (Ayres,
2006; Mayer, et al., 2002; Smith, et al., 1993; Sweller & Chandler, 1994), explaining
worked examples, and pointing out common misunderstandings to students (Huang, et
al., 2008; Korner, 2005; Muller, et al., 2007). To address low motivation, learners can be
offered readily accessible activities that give learning results quickly with minimal effort
(Gee, 2003). We propose testing the effects of supplemental instruction designed to
ameliorate lack of confidence, low aptitude, and inadequate motivation by offering
students a set of three-minute video Digital Tutors affording access to concise direct
instruction on essential concepts, worked examples, and coaching on misconceptions.
The hypotheses we propose are:
H1: Participation rates of Digital Tutors by low achievers will be significant, even without course credit.
H2: Students using Digital Tutors will be less likely to drop the course and more likely to pass the course than non-users.
H3: Students using Digital Tutors will improve their exam grades more than
non-users.
The problems, remedies, and hypotheses concerning student effort and retention are
modeled in Figure 1.
The hypotheses are tested in two studies spanning different time periods with
different levels of data detail. Study 1 is based on Digital Tutorial use by students in two
large sections (320 seat auditorium) of Principles of Accounting II in Spring 2007,

8
Lack of confidence
with the
intimidating
subject matter of
accounting
Inadequate
motivation for
learning
accounting
Low aptitude for
learning
accounting
Impediment to Learning Digital Tutor Remedy
Provide short, accessible
learning activities, e.g.,
digitally in three-minute
segments
Break down complex ideas
into smaller increments and
point out misconceptions
H1: Significant use of
Digital tutors by low
achievers even
without course credit
H2: Digital Tutor use
associated with lower
withdrawal and
higher pass rates
H3: Digital Tutor use
associated with
higher exam grades
FIGURE 1
Digital Tutor Model for Overcoming Impediments to Learning in Principles of Accounting
Effort Performance
Outcomes
Enable mastery learning

9
analyzed at the student level. In study 2, the tutorials created and implemented in Spring
2007 were used in every section of the course for the two years after the implementation
term (six consecutive terms including the implementation term). To assess the long-term
effects of tutorial use, student performance in the two years before and in the two years
after implementation are compared, analyzed at the term level.
METHOD: STUDY 1
Participants
Participants were students enrolled in two large lecture classes of Principles of
Accounting II in spring 2007 (n = 426) taught by the author at a large urban public
university with a diverse study body.
Design of the Learning Experience: Digital Tutors
The attention-getting promise of the tutorials for appealing to students with low
motivation was the claim that ―you will improve in just three minutes.” Easy access (i.e.,
available anywhere on the internet, 24/7) minimized the effort needed to test this
promise. The intent of the tutorial design was to prompt poorly motivated students to
investigate this claim.
While accounting topics typically build on each other, tutorial topics were as
discrete as possible so that students could start at any point in the semester. When this
was not possible, a tutorial would direct the learner to view a prior tutorial and then
return to the current one. As an additional motivational aspect, the tutors were kept to
three central concepts per chapter (27 skills in total, Appendix A) to avoid overwhelming
the learner with the volume of material to be learned.

10
The second major aspect of the design was to create tutors that would meet the
cognitive needs of weak or intimidated learners so that their first engagement with the
innovation would ―achieve some meaningful success‖ (Gee 2003, 62). Cognitive load
theory suggests that instruction for inexperienced learners should not only simplify
complex ideas, but also avoid seductive details and busy screens (Sweller & Chandler,
1994). Therefore, each three-minute video pertained to one foundational idea with a
simple voice-over PowerPoint look and feel, and no animation and minimal artwork. To
provide practice, feedback, and reinforcement immediately after the three-minute
instruction, two or three worked problems were offered, starting with an easy one, and
then one or two harder ones. For the benefit of math anxious students (Hembree, 1990),
the voice was warm, relaxed, and unhurried, and the tone conveyed confidence that this
was doable in short order with a few new learning experiences.
Twenty-seven ultra-short videos were created for the course, three for each of
nine chapters covered on the departmental syllabus. The two principles of accounting
courses used an integrated text, which organizes topics by financing, operating, and
investing activities (Ainsworth, Deines, Plumlee, & Larson, 2003). Consequently, the
Principles of Accounting II course has managerial and financial accounting topics and
includes some cumulative materials from the first introductory course (e.g., journal
entries and financia l statements).
Tutorial topics for each chapter were chosen based on their importance to
understanding later topics (e.g., present value of money is critical to learning net present
value and bond valuation), or because they were difficult for weak learners (e.g.,
annuities, disposing of assets, and indirect operating cash flow presentation), or prone to

11
misconceptions (e.g., salvage value use in depreciation, present versus future value, bond
payments versus bond expense, and cash versus accrual accounting). Appendix A
contains a list of tutorial topics by chapter.
The video for each tutorial was created from 15-20 slides, starting with explaining
the main concept concisely, using lay terms rather than technical jargon to convey the
terminology (an obstacle for weak learners), moving to how the main idea can be used to
solve accounting problems, revealing the strategy or process steps needed, and finally
inviting learners to try to solve a problem. Interspersed throughout each tutorial were
informal comments highlighting typical misconceptions or errors. The instruction
deliberately avoided repeating the associated lecture, giving students who might not
understand the lecture a fresh explanation of the concepts, and hopefully discouraging
them from skipping lectures.
Procedure
The Digital Tutors were loaded into the course management software, WebCT,
which recorded the date, time, and duration of each use by student. Students had no
knowledge of the tracking and received no course credit for tutorial use. Due to obstacles
in creating the first tutorials, the first nine tutorials were loaded the week before the first
exam, but the rest of the tutorials were loaded approximately the same week as the lecture
that introduced the topic. The week before the first exam (when the first nine tutorials
were loaded), the instructor demonstrated how to find the tutorials and encouraged
students to use them as a review for the exam. After the first exam, the instructor
routinely mentioned which tutorial pertained to that week’s topic.

12
At the end of the course, the instructor distributed a survey asking students if they
tried various course resources, including the tutorials, and asking for qualitative feedback
about which resources were most useful in helping them learn. After submitting all
grades to the registrar, the instructor requested an activity report from the technology
group on campus showing student viewing of Digital Tutors.
Measures
Digital Tutor Use. Reviewing tutorial activity showed that some students only viewed
one or two files within 10-20 seconds of each other, indicating that they previewed the
tutorials, but decided not to use them after the preview. Therefore, a ―user‖ was defined
as a student who viewed three or more tutorials. The length of time a file was left open on
the computer was not captured by the software so the study defined ―use‖ as ―the number
of file launches‖ (number of uses).
Math Aptitude. Math aptitude was measured with Math SAT score. Math SAT scores
were available for students entering the university as first-term freshmen (n = 317,
74.4%) but not for students transferring from other institutions (n = 109, 25.6%).
Achievement. Cumulative grade point average (GPA) measured academic achievement.
The GPA cutoffs to separate the participants into low, middle, and high achievers were
selected as an amount above and below the mean, which placed approximately 25 percent
of the participants in the low group and 25 percent in the high group. The cutoffs used
were low = GPA of 2.5 or less (28.9% of the students) and high = GPA above 3.2 (24.6%
of the students). The correlation between GPA and Math SAT was low enough to permit
including both variables in the same model (Pearson correlation = 0.287).

13
Exams. Students took three departmental exams, one at week five, another at week 10,
and a cumulative final exam at the end of the 15-week term. Exams contained only
multiple-choice questions from departmental exams used in prior terms. Approximately
25 percent of the questions were changed either slightly (e.g., dollar amounts and
company name) so repeating students would not have exams identical to those in prior
terms, or replaced due to minor changes in course content.
RESULTS: STUDY 1
The data met the assumptions of normality except for two outliers for cumulative
GPA (one was 7.9 standard deviations lower than the mean and the other was a GPA of
0.0), and both were retained as valid data.1
TABLE 1
Participant Attributes Spring 2007: Mean (Std. Dev.)
Attribute Non-Usersa Users
Number of participants 122 304
Percent female 40.2% 46.7%
Age 22.59 (3.19) 23.21 (5.25)
SAT verbal b 530.31 (71.96) 517.84 (70.02) SAT math b (p < 0.05) 554.02(75.71) 533.58 (69.91)
Cumulative GPA (p < 0.001) 2.61 (0.71) 2.87 (0.56)
Accounting GPA (p < 0.05) 2.14 (1.02) 2.40 (0.92)
Credit hour load (p < 0.001) 10.37 (5.38) 12.30 (3.55)
Exam 1 score 73.95 (14.47) 75.22 (13.68) Exam 2 score 74.74 (16.10) 76.22 (14.87)
Final exam score 71.51 (13.24) 73.16 (14.34) a Opened tutorials two or fewer times during term.
b Excludes transfer students, for which SAT scores are not required (n = 109, 23 non-users and 86 users).
Attributes of tutorial users compared to non-users are summarized in Table 1.
Compared to students not using the tutorials, students who used the tutorials had lower
Math SAT scores (F = 5.4, p < 0.02), higher cumulative GPA (F = 17.4, p < 0.001),
higher accounting GPAs (F = 6.07 p < 0.01), and higher credit hour loads (F = 18.7. p <
1 Excluding the outliers did not change the results of any analysis.

14
0.001). The pattern of lower aptitude but higher grades signals a higher level of
motivation, indicating that users and non-users likely differed on this aspect.
H1: Participation
Tutorial use and grades are summarized in Table 2 by achievement level.
Participation was high among all three groups, 61.0 percent for low achievers, 74.7
percent for middle achievers, and 77.1 percent for high achievers. Excluding students that
dropped the course, participation was 68.7 percent for low achievers, 80.1 percent for
middle achievers and 80.2 percent for high achievers. Examining the average number of
views per user further supports the hypothesis that the tutorials stimulated effort. Even
though there were only 27 tutorials, the mean number of views averaged over 31 for all
achievement levels (Table 2).
TABLE 2
Tutorial Use and Grades by Achievement Level Spring 2007: Mean (Std. Dev.)
Cumulative GPAs by Achievement Level
Low: < 2.5 Middle: High: > 3.2
Number of participants 123 198 105
Participants using tutorials a 75 148 81
Percent using tutorials 61.0% 74.7% 77.1%
Average number of views for users a 31.30 (29.9) 32.02 (27.1) 31.05 (22.3)
Exam 1 score 65.6 (13.9) 74.7 (11.2) 84.9 (10.9)
Exam 2 score 66.1 (16.4) 75.8 (12.4) 85.7 (11.3) Final exam score 61.4 (15.0) 72.2 (12.0) 83.5 (9.6)
Percent passing course 48.7% 82.3% 92.4% a Users opened tutorials four or more times during term.
Tutorial use by topic showed high use for the first chapter of the term (Figure 2)
due to a flurry of ―previewers‖--students who opened up one or two tutorials, but viewed
less than 20 seconds of the presentation. Views by student do not distinguish between
those that viewed the full set and those that might have repeated certain topics
strategically. Views by topics in order of presentation over the term (Figure 2) indicate

15
that after the initial flurry of previewers, use over the terms was generally consistent with
spikes for certain topics.
FIGURE 2
Number of Tutorial Views in the Sequence of Topics Over the Term
H2: Retention
A 2test of withdrawal rates between users (10.83 percent) and non-users (35.25
percent) showed that users were significantly less likely to withdraw from the course
(2[1, n = 426] = 35.34, p < 0.001). The 2
test of pass rates (grade of C- or better, Table
3) between users (81.9 percent) and non-users (59.2 percent) showed that users were
significantly more likely to pass the course (2[1, n = 426] = 26.12, p < 0.001).
Repeating these tests on only the high-risk students revealed that significantly
more low-achieving non-users dropped the course (45.8 percent) than low-achieving
users (24.0 percent) (2[1, n = 123] = 6.56, p < 0.01). Significantly more low-achieving
0
200
400
600
800
1000
1200
1400
1600
1800
2000

16
users passed the course (56.0 percent) than low-achieving non-users (37.5 percent; (2[1,
n = 123] = 4.01, p < 0.05).
TABLE 3
Retention Rates Spring 2007: Mean (Std. Dev.)
Attribute Non-Usersa Users
Number of participants 122 304 Number of withdrawals 43 33
Percent of students withdrawing 35.25% 10.85%
Number of participants passing (Grade A, B or C) 71 249
Percent of participants passing (Grade A, B or C) 59.2% 81.9% a Opened tutorials two or fewer times during term.
Tutorial use was significantly associated with passing (t = 3.68, p < 0.001) in a
regression analysis with passing (yes/no) as the outcome variable, GPA as a control for
motivation and achievement, Math SAT as a control for aptitude, and tutorial use as the
predictor. Dropping Math SAT from the model to include transfer students gave similar
results (t = 3.85, p < 0.001).
H3: Exam Grades
With hierarchical linear modeling (HLM), exam score growth over the term was
analyzed longitudinally as a function of tutorial use (Hox, 2002; Raudenbush & Bryk,
2002; Singer & Willett, 2003). HLM is a multi-level regression analysis that analyzes
two aspects of the data: the intercept or starting point, in this case exam one, and the
slope, the change in exam scores over the term. The intercept reveals initial differences
between students, while the slope shows changes over time within each student, and
between students. The slopes can be divided into several components to model different
influences on growth. In this study, the final models included a time component to model
growth from non-tutorial influences and an intervention component to model growth
from tutorial views.
17
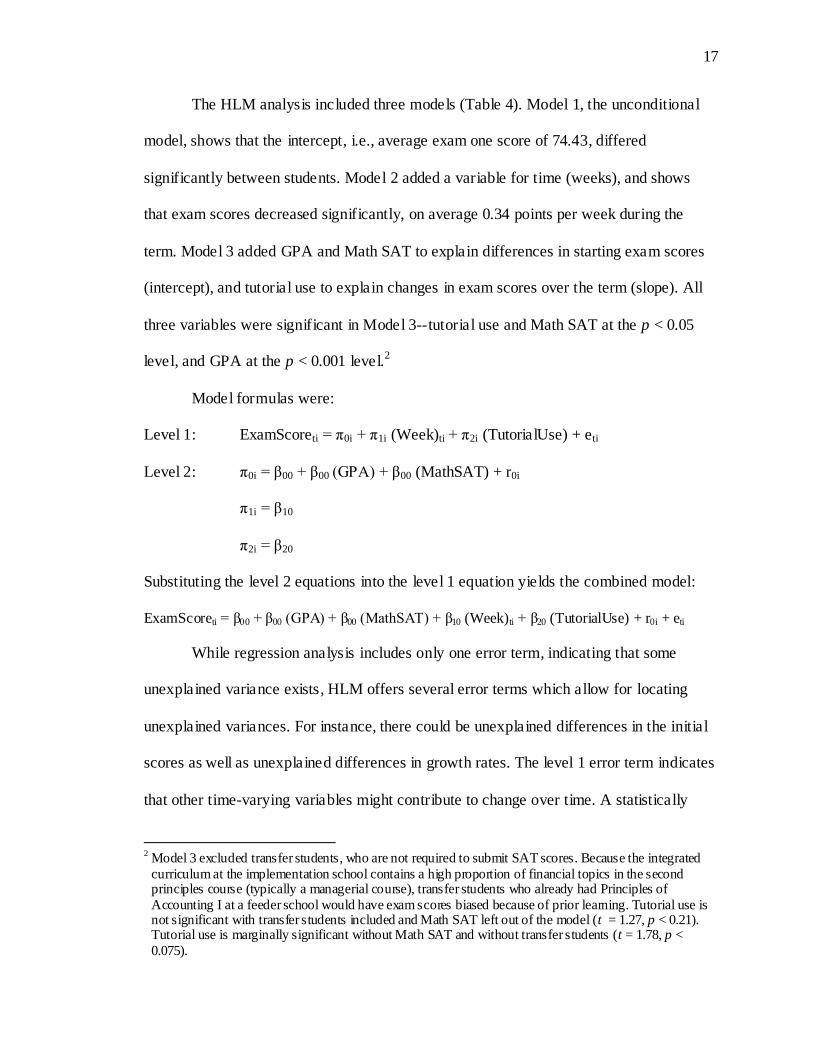
The HLM analysis included three models (Table 4). Model 1, the unconditional
model, shows that the intercept, i.e., average exam one score of 74.43, differed
significantly between students. Model 2 added a variable for time (weeks), and shows
that exam scores decreased significantly, on average 0.34 points per week during the
term. Model 3 added GPA and Math SAT to explain differences in starting exam scores
(intercept), and tutorial use to explain changes in exam scores over the term (slope). All
three variables were significant in Model 3--tutorial use and Math SAT at the p < 0.05
level, and GPA at the p < 0.001 level.2
Model formulas were:
Level 1: ExamScoreti = π0i + π1i (Week)ti + π2i (TutorialUse) + eti
Level 2: π0i = β00 + β00 (GPA) + β00 (MathSAT) + r0i
π1i = β10
π2i = β20
Substituting the level 2 equations into the level 1 equation yields the combined model:
ExamScoreti = β00 + β00 (GPA) + β00 (MathSAT) + β10 (Week)ti + β20 (TutorialUse) + r0i + eti
While regression analysis includes only one error term, indicating that some
unexplained variance exists, HLM offers several error terms which allow for locating
unexplained variances. For instance, there could be unexplained differences in the initial
scores as well as unexplained differences in growth rates. The level 1 error term indicates
that other time-varying variables might contribute to change over time. A statistically
2 Model 3 excluded transfer students, who are not required to submit SAT scores. Because the integrated
curriculum at the implementation school contains a high proportion of financial topics in the second principles course (typically a managerial course), transfer students who already had Principles of
Accounting I at a feeder school would have exam scores biased because of prior learning. Tutorial use is not significant with transfer students included and Math SAT left out of the model (t = 1.27, p < 0.21). Tutorial use is marginally significant without Math SAT and without transfer students (t = 1.78, p <
0.075).

18
significant level 2 error term indicates unexplained differences between participants. All
models in this study showed statistically significant unexplained level 2 error terms
(Table 4), indicating that other predictors (such as time on task, level of outside demands,
interest in the topic and so forth) could improve the model even further.
TABLE 4
Longitudinal Analysis of Change in Exam Scores with Tutorial Use Spring 2007
Model 1: Intercept only
Model 2: + week
Model 3: + week,
tutorial use, GPA, & Math SAT
Fixed Effects: coeff. SE coeff. SE coeff. SE
Intercept 74.430*** 0.665 77.758*** 0.997 76.203*** 1.170 Week -0.336*** 0.071 -0.251** 0.097
Tutorial use 0.096* 0.049
GPA 12.526*** 1.198
Math SAT 0.022* 0.009
Variance:
Level 1
Within person 96.284 91.755 96.796
Level 2
In initial status 98.438*** 103.530*** 39.931*** Deviance 6742 6727 4356 a Includes transfer students, for which Math SAT scores were not available. * p < 0.05
** p < 0.01 *** p < 0.001
Tutorial use, even though statistically significant, has low to moderate practical
significance: each tutorial use improved test scores on average 0.096 points (Table 4,
Model 3). Students viewed the tutorials on average 30 or more times (Table 2), and thus
could expect an average 2.88 exam point advantage over non-users. In the plus/minus
grading environment, this may move tutorial users to the next grade level.
METHOD: STUDY 2
Given the benefits found in Study 1, the tutorials were made available to all
sections of Principles of Accounting II in subsequent terms. In study 2, we analyze
whether tutorials were associated with continuing benefits without the involvement of the

19
designer, weekly promotion during lectures, and experimental effects of students
knowing they were trying a new resource. We investigated these questions in study 2,
which compared grades in the six terms before and the six terms after implementation for
all instructors.
Participants
Participants were all students enrolled in Principles of Accounting II from Spring
2005 through Fall 2008 (six terms prior to implementation and six terms after the
implementation, n = 5,787) at a large urban public university with a diverse study body.
Procedure
Data for six terms (two spring, two summer, and two fall terms) before and six
terms after implementation were considered a matched set. Spring terms included more
of the traditional full-time sophomores who took Principles of Accounting I in the fall
term, and continued to the second course in the spring term. Fall terms included more of
the part-time students who took the course when it fit their schedule, rather than in the
traditional pattern. Summer students typically included a greater proportion of transient
students from other schools who wanted to complete the prerequisite course while home
for the summer, and students who did not pass during the spring and fall terms.
Instructor practices also vary by term. Summer terms included more non-
traditional instructors and graduate students, and are all taught in small sections without
the requirement to use departmental exams. Approximately three-fourths of the students
in fall and spring terms completed the course in a large lecture format with full-time
faculty. Adjunct faculty members are more likely to teach small evening sections in all
terms. In any one term, there are about 10 different instructors.

20
The campus technology group loaded the Digital Tutors into the WebCT template
for the course so that students in every section could see the resource listed on the
homepage. Instructors were unaware of the tutorial contents or learning effects.
Measures
Tutorial Use. Because Study 2 is a retrospective study, detailed use by student was not
available in the terms after the implementation term. Total views for the last term in
Study 2 were available, which indicated overall use level.
Course Grade. The implementation school used a plus/minus grading system with
―pluses‖ adding 0.3 points, and ―minuses‖ removing 0.3 points. Thus, an A- = 3.7, a B+ =
3.3, and so forth.
Math Aptitude and Achievement. As in Study 1, achievement was measured by
cumulative GPA and math aptitude was measured with Math SAT. Correlation between
these two variables was low enough to permit use in the same model (Pearson correlation
= 0.246).
RESULTS: STUDY 2
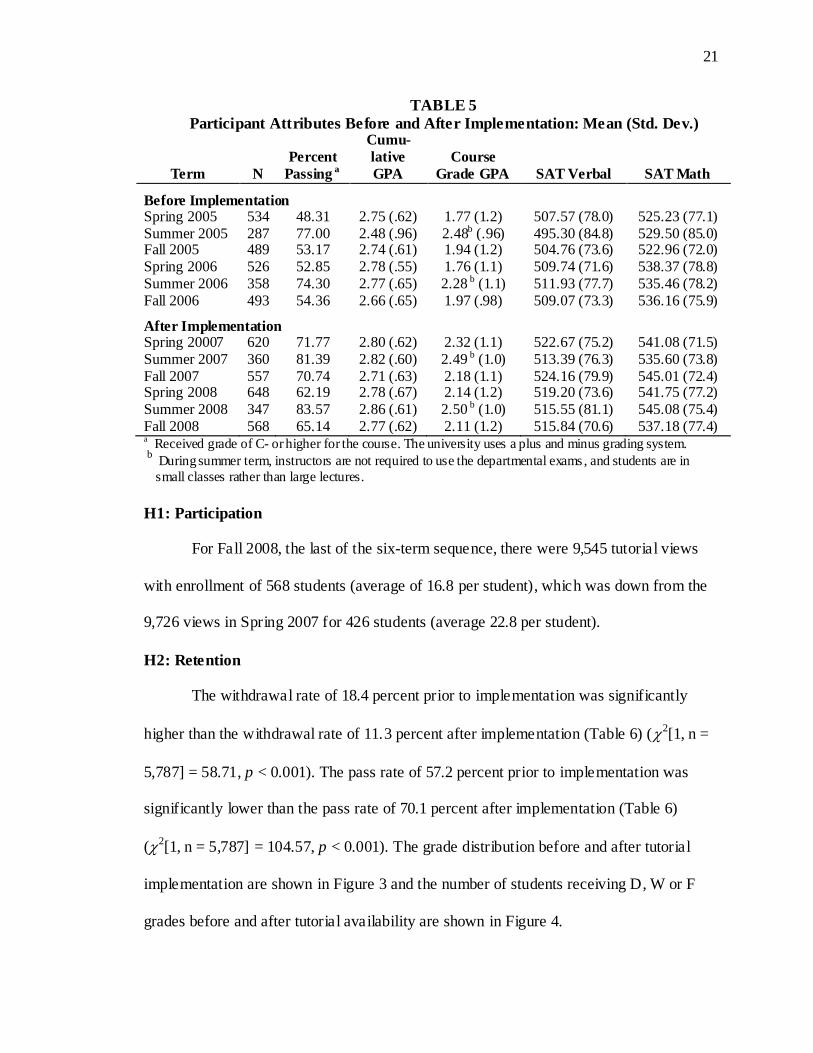
The data met the assumptions of normality with no outliers noted. The
enrollments by term, average SAT scores, average cumulative GPAs, and course grades
in Table 5 show that math aptitude as measured by Math SAT was gradually increasing
over the 12-term period; this was consistent with the gradual improvement in admission
requirements at this university, as well as with a state-wide emphasis on improving high
school math preparation (F = 13.307, p = 0.01). Differences in cumulative GPA and SAT
Verbal score over the 12 terms were not significant (GPA: F = 0.224, p = 0.65; SAT
Verbal: F = 1.935, p = 0.21).
21
TABLE 5
Participant Attributes Before and After Implementation: Mean (Std. Dev.)
Term
N
Percent
Passing a
Cumu-
lative
GPA
Course
Grade GPA
SAT Verbal
SAT Math
Before Implementation Spring 2005 534 48.31 2.75 (.62) 1.77 (1.2) 507.57 (78.0) 525.23 (77.1)
Summer 2005 287 77.00 2.48 (.96) 2.48b (.96) 495.30 (84.8) 529.50 (85.0) Fall 2005 489 53.17 2.74 (.61) 1.94 (1.2) 504.76 (73.6) 522.96 (72.0)
Spring 2006 526 52.85 2.78 (.55) 1.76 (1.1) 509.74 (71.6) 538.37 (78.8)
Summer 2006 358 74.30 2.77 (.65) 2.28 b (1.1) 511.93 (77.7) 535.46 (78.2)
Fall 2006 493 54.36 2.66 (.65) 1.97 (.98) 509.07 (73.3) 536.16 (75.9)
After Implementation Spring 20007 620 71.77 2.80 (.62) 2.32 (1.1) 522.67 (75.2) 541.08 (71.5)
Summer 2007 360 81.39 2.82 (.60) 2.49 b (1.0) 513.39 (76.3) 535.60 (73.8)
Fall 2007 557 70.74 2.71 (.63) 2.18 (1.1) 524.16 (79.9) 545.01 (72.4) Spring 2008 648 62.19 2.78 (.67) 2.14 (1.2) 519.20 (73.6) 541.75 (77.2)
Summer 2008 347 83.57 2.86 (.61) 2.50 b (1.0) 515.55 (81.1) 545.08 (75.4)
Fall 2008 568 65.14 2.77 (.62) 2.11 (1.2) 515.84 (70.6) 537.18 (77.4) a Received grade of C- or higher for the course. The university uses a plus and minus grading system.
b
During summer term, instructors are not required to use the departmental exams , and students are in
small classes rather than large lectures.
H1: Participation
For Fall 2008, the last of the six-term sequence, there were 9,545 tutorial views
with enrollment of 568 students (average of 16.8 per student), which was down from the
9,726 views in Spring 2007 for 426 students (average 22.8 per student).
H2: Retention
The withdrawal rate of 18.4 percent prior to implementation was significantly
higher than the withdrawal rate of 11.3 percent after implementation (Table 6) (2[1, n =
5,787] = 58.71, p < 0.001). The pass rate of 57.2 percent prior to implementation was
significantly lower than the pass rate of 70.1 percent after implementation (Table 6)
(2[1, n = 5,787] = 104.57, p < 0.001). The grade distribution before and after tutorial
implementation are shown in Figure 3 and the number of students receiving D, W or F
grades before and after tutorial availability are shown in Figure 4.

22
FIGURE 3
Grade Distribution Before and After Tutorial Implementation
FIGURE 4
Students Receiving D, W, or F Grades Before and After Tutorial Availability
0%
5%
10%
15%
20%
25%
30%
35%
A B C D F W
percent before implementation percent after implementation
0%
10%
20%
30%
40%
50%
60%
2005 2006 2007 2008
Spring Term Summer Term Fall Term
|--- Pre-Tutorial Terms---| |--- Post-Tutorial Terms---|

23
Tutorial availability was significantly associated with passing (t = 8.53, p < 0.001)
in a regression with pass (yes/no) as the outcome variable, GPA as a variable to control
for motivation, Math SAT to control for aptitude, and tutorial availability as the predictor.
Excluding Math SAT scores in order to include transfer students in the analysis gave
similar results (t = 10.39, p < 0.001).
TABLE 6
Grade Distribution Six Terms Before and Six Terms After Implementation Before Implementation After Implementation
# % # % A 192 7.1 267 8.6
A- a 140 4.5
B+ 11 0.4 170 5.5
B 515 19.2 413 13.3
B- a 238 7.7
C+ 16 0.6 251 8.1 C 757 28.2 449 14.5
C- 46 1.7 246 7.9
D 373 13.9 298 9.6
F 282 10.5 278 9.0
W 495 18.4 350 11.3
Total 2687 100.0 3100 100.0
Pass Rate (C- or better) 57.20% 79.81% a A- and B- grades were not assigned prior to Spring 2007.
Repeating these tests on only the high-risk students (GPA below 2.5), revealed
that significantly more low-achieving pre-implementation students dropped the course
(27.1 percent) than low-achieving post-implementation students (16.3 percent) (2[1, n =
1,871] = 31.81, p < 0.001). Significantly more low-achieving post-implementation
students passed the course (43.8 percent) than low-achieving pre-implementation students
(30.0%) (2[1, n = 1,871] = 38.24, p < 0.001). Tutorial use was significantly associated
with passing (t = 5.60, p < 0.001) in a regression on the low achievers with pass (yes/no)
as the outcome variable, GPA to control for motivation and achievement, Math SAT to

24
control for aptitude, and tutorial availability as the predictor. Leaving Math SAT out to
include transfer students gave similar results (t = 6.77, p < 0.001).
H3: Exam Grades
Tutorial availability was significant in explaining variance in course grades in a
regression with course grades as the dependent variable, tutorial availability as the
independent variable, GPA as a control for motivation and achievement, and Math SAT
as a control for aptitude (Table 7, Panel A). Leaving Math SAT out to include transfer
students gave similar results (Table 7, Panel B). The low correlation between Math SAT
and GPA allowed both covariates to be included in the analysis (Pearson correlation =
0.246).
TABLE 7
Course Grade as a Function of Tutorial Availability
Panel A: Cumulative GPA and Math SAT as covariates (entering freshmen only) Variable SE β t Sig.
Constant -1.754 0.118 -14.873 0.000
Tutorial availability .277 0.029 0.124 9.399 0.000
Cumulative GPA 1.242 0.028 0.609 45.004 0.000
Math SAT .000 0.000 0.027 1.985 0.047
Model R2 = .401
Panel B: Cumulative GPA as covariate (entering freshmen and transfer students) Variable SE β t Sig.
Constant -1.427 0.060 -23.850 0.000
Tutorial availability 0.257 0.025 0.112 10.380 0.000 Cumulative GPA 1.219 0.020 0.644 59.956 0.000
Model R2 = .430
DISCUSSION
Participation Rates
The tutorials elicited remarkable participation rates during Spring 2007, the initial
implementation. In Spring 2007, 71.4 percent of Principles of Accounting II students

25
used the tutorials three or more times, which is comparable to mandatory supplemental
instruction of 70 percent (Jones & Fields, 2001), and higher than the average of 27
percent for voluntary participation in supplemental instruction with Principles of
Accounting (Etter, et al., 2000). While some studies suggests that stronger students self
select into voluntary supplemental instruction (Moore, 2008; Moore & LeDee, 2006;
Simpson, et al. , 1997; Xu, Hartman, & Guillermo, 2001) , 61.0 percent of low achievers in
this study used the tutorials. Furthermore, the low achievers, who viewed the tutorials on
average 31.30 times, were just as active as higher achievers, who averaged 31.05 tutorial
views. The use on par with high achievers confirms that low achievers are willing to exert
effort with novel resources (De Lange, et al., 2003; Greer, 2001; Marriott & Lau, 2008).
A relatively small effort, three minutes of instruction, may have triggered students
to recognize that a series of small actions can accumulate to success (Gee, 2003; Maurer,
2004); a message that may have improved weaker students studying habits enough to get
them up to passing. Or, the discrete nature of working this tutorial in private as many
times as needed may have preserved self-esteem and made this resource comfortable to
use for all, especially low achievers (Karabenick & Knapp, 1988, 1991). This study
refutes the notion that students will not complete extra work voluntarily (Elikai & Baker,
1988), and supports findings that accounting students embrace virtual learning (E.
Martin, et al., 1995; Wells, et al., 2008).
Total tutorial use by topic (Figure 2) suggests that users were somewhat strategic,
viewing certain topics more than others. It is unclear if consistent users (looking at the
full set) have different outcomes than users who are more strategic (select only certain

26
chapters to view), or whether low achievers use the tutorials differently than high
achievers.
Although total use is down five terms after implementation, the use rates are still
remarkable compared to published rates for other supplemental instruction (Etter, et al. ,
2000). It is even more remarkable that this level of use continued without instructors
encouraging use during each class session.
Retention Rates
Tutorial users, including those at most risk of failing, were more likely to persist
with the course (not drop it), thereby exerting enough effort to pass it. In the
implementation term, users withdrew one-third less often than non-users (Table 3) and
had a pass rate of 81.9 percent versus 59.2 percent for non-users. Low achieving users
were less likely to withdraw and more likely to pass than low achieving non-users.
Over 12 terms (Table 5) with many instructors, student types, and course formats,
terms without tutorials available had higher drop rates and lower pass rates compared to
terms with tutorials. The pattern over 12 terms of higher grades and better pass rates
after implementation suggests that the tutorial availability affords benefits across class
sizes (large lecture in Spring and Fall terms, small classes in Summer term), a wide range
of instructor types (graduate student, adjunct, and full time faculty), student types
(traditional full-time, part-time, repeaters, and transient), and exam content. This result
confirms the increasing body of literature showing that supplemental instruction can
improve retention, especially for students in high risk courses or who are underprepared
or poorly motivated (Congo & Schoeps, 1993; Moore, 2008; Moore & LeDee, 2006;
Ramirez, 1997; Xu, et al. , 2001).

27
The improved grades and pass rates for the six terms after implementation may
have included factors other than the tutorials. The faculty course coordinator changed in
the second year of implementation, and grades and pass rates did worsen slightly
following this change (Figure 4). The departmental exams were intentionally changed in
minor ways each term so repeating students would not have the same exams in the next
term. The only other known change after the tutorial implementation was the addition of
class activities by the large lecture instructors, which impacted about 75 percent of the
spring and fall students.
Exam Scores
Tutorial use was associated with exam scores in only minor ways. The model
(Table 4) indicates that the tutorials were associated with on average an improvement of
0.096 points per view. This finding is consistent with low effect sizes reported for
supplemental instruction in accounting (Etter, et al., 2000; Jones & Fields, 2001; Potter &
Johnston, 2006).
A low learning effect may be attributable to the emphasis on just core concepts.
While affording a solid foundation, the low level of difficulty of the basic ideas in the
tutorials, while enough to dramatically alter pass rates, may not have brought students up
to the high competency required to perform at a levels above passing.
Tutorial quality would affect learning. Students indicated on the end-of-course
survey, as well as by their high level of use, that they believed the tutorials were effective
at teaching the material. On end-of-course surveys, over 95 percent of the students cited
Digital Tutors as more useful in achievement than any other course resource. Further, the

28
high use level (Table 2) suggests that the students found the tutorials helpful enough to
spend time viewing them, even without course credit for the effort.
The low to moderate size exam score increase from using tutorials may be due to
a ceiling effect based on student goals. Students may not have used the tutorials to
maximize their grade, but instead ceased work when they reached their typical grade goal
or did not start using tutorials until after they failed an exam. This satisficing effect
(stopping when the grade was sufficient rather than maximized) has been referred to in
the problem-solving literature as a typical adaptation given limits on time, knowledge,
and resources (Simon, 1956; Starbuck, 1963). According to Simon’s theory, students
would resolve competing goals of varying importance, recognizing that all outcomes
need not be maximized. The student’s personal level of aspiration would constitute a
ceiling effect based on the learner’s grade objective, rather than the maximum possible
score. Because this study used cumulative GPA in the model, the effect of the learning
innovation would disappear if the learner ceased learning once the grade approached the
learner’s historical grade objective. To my knowledge, a satisficing effect for grades has
not been investigated in the literature, although studies have reported that supplemental
instruction seems to help students get a ―C‖ and avoid ―D‖ or ―F,‖ more than it propels
them to earn higher grades (Moore & LeDee, 2006).
Another possible reason for the small learning effect is the pattern of practice in
the tutorials. While blocked practice, where similar problems are presented together,
reduces errors during learning, random practice leads to better retention and transfer
(Carlson & Yaure, 1990). Although the tutorials were intended to make initial learning
faster for weak or tentative students, the learning effect might be stronger if the tutorials

29
included some mixed practice sets and cumulative problems. This would increase the
level of difficulty and help students learn to switch among course topics on a cumulative
final exam.
The tutorial set contained three tutorials per chapter, a total of 27, or
approximately 81 minutes of instruction and about 100 minutes of worked examples. The
length of the entire tutorial set was comparable to about two lectures. If the students froze
the video while they worked the problems (as they were encouraged to do), and then
viewed the worked-out solutions, it likely extended their time on task. It is not clear
whether more tutorials would have yielded stronger learning effects. Given the high use
rates (more than 30 views), students may well have benefitted from more tutorials.
WEAKNESSES AND FUTURE WORK
Future studies could improve on Study 1 by using a randomized experimental
design. The principal investigator served as course instructor in Study 1 had no control
group. Tutorial users were likely more motivated than non-users, resulting in learning
effects potentially being confounded with motivation level. Although prior research
suggests that GPA controls for the self-selection bias (Fayowski & MacMillan, 2008),
users may differ from non-users in ways other than prior achievement.
While the 71 percent participation rate was remarkable, especially without course
credit for tutorial use, students were not asked which aspects of the tutorials were most
appealing or most useful. Teasing out the motivating aspects from the instructionally
effective aspects would inform the design of future tutorials. Another tutorial design
objective was to help math anxious students. A study testing whether students that used
the tutorials became more confident and less anxious may indicate whether tutorial use

30
reduces the intimidation associated with accounting topics, and whether tutorial use
prompts other academically adaptive behaviors.
Another design objective for the tutors was to break down complex ideas into
smaller pieces, making learning easier for lower aptitude students. The tutorials may have
been too easy to affect exam grades appreciably. A future study could improve on this
design by offering tutorials at two different levels of difficultly. This would give novices
a chance to build skill at the easy level, but also develop skills for responding to more
complex exam questions.
Future tutorials may be able to increase the learning effect by changing the
practice pattern. The basic-level tutorials could retain the blocked practice to make initial
learning easy, and a second set of tutorials could afford practice on more advanced
cumulative problems over randomized topics. This would not only respond to the finding
that novices need to transition to more difficult work after initial learning but might also
shed light on the satisficing effect. If students only study to their grade objective
(satisficing effect), perhaps the challenge set would not achieve the level of activity of the
basic set.
Prior work suggests that failing students are caught in a paradox–they need the
structure of lectures and deadlines to stay motivated, yet they resist instructor control
(Gracia & Jenkins, 2002). Future work might reveal whether learner control and
structured content in the tutorials helps meet these contrasting needs.
Many studies of supplemental instruction find that students who participate have
higher re-enrollment rates than non-participants (Congo & Schoeps, 1993). Tracking
participants to future terms to see if momentum gained from practicing self-regulated

31
learning (voluntarily working through a series of learning steps in the tutorials) improves
future habits and academic success would be insightful.
CONCLUSION
This study presents great news for students, instructors, and administrators.
Students, especially the poorly motivated ones, can appreciate that with 24/7 convenience
and relatively modest effort (viewing 30 or so three-minute tutorials and working out
problems at the end of them), they can improve their probability of passing significantly.
Furthermore, for weak students who often do not seek help, the tutorials offer as many
repeated views as needed without stigma and without having to first ask for them (Yates,
2005). This study confirms that student effort in principles of accounting courses can
improve pass rates even with low ability (Wooten, 1996) and that a modest set of on-line
tutorials can contribute to achieving that objective.
Instructors will be encouraged that principles of accounting students are willing to
work harder, even without course credit, and that once tutorials are in place, they do not
add to instructor workload each term. Furthermore, the innovation works across student
type (full-time, part-time, and transient) and student ability (low, middle, and high
achievers), relieving them from having to customize the set.
For administrators, once created, tutorials can be a perennial resource used year
after year to improve retention in large enrollment courses regardless of class format,
instructor types, or student achievement levels, and without adding to the workload of
faculty. Creating the initial set of tutorials requires faculty labor, but compared to other
tutoring options, involving hiring, training, and compensating human tutors, the securing
of meeting space, and the coordination of tutoring sessions, investing in the creation of a

32
set of basic tutorials looks reasonable. This work brings into question the notion that
supplemental instruction that improves student retention needs to be a full-featured
program with term-long schedules, two-way communication, and individualized
scaffolding (Congo & Schoeps, 1993; Fayowski & MacMillan, 2008; D. C. Martin &
Blanc, 2001).
The innovation’s success across many instructors each term and persisting for six
terms without coordinated promotion sends a strong message that these tutorials make a
difference to all stakeholders: those who need to pass and those who wish they would.

33
REFERENCES
Ainsworth, P., D. Deines, D. R. Plumlee, and C. X. Larson. 2003. Introduction to
accounting: An integrated approach. 3rd ed. New York, NY: McGraw-Hill.
Ashcraft, M. H., and J. A. Krause. 2007. Working memory, math performance, and math
anxiety. Psychonomic Bulletin & Review 14 (2): 243-248.
Ayres, P. 2006. Impact of reducing intrinsic cognitive load on learning in a mathematical
domain. Applied Cognitive Psychology 20: 298-298.
Benson, J. 1989. Structural components of statistical test anxiety in adults: An
exploratory model. Journal of Experimental Education 57 (3): 247-261.
Blanc, R. A., L. E. DeBuhr, and D. C. Martin. 1983. Breaking the attrition cycle : The
effects of supplemental instruction on undergraduate performance and attrition.
The Journal of Higher Education 54 (1): 80-90.
Boekaerts, M. 1997. Capacity, inclination, and sensitivity for mathematics. Anxiety,
Stress and Coping 10: 5-33.
Bueschel, A. C. 2008. Listening to students about learning: The Carnegie Foundation for
the Advancement of Teaching.
Byrd, S. D., and D. B. Byrd. 1987. Utilizing task analysis and sequencing in order to
more efficiently teach financial accounting. Issues in Accounting Education 2 (2):
349-360.
34
Byrn, M., and B. Flood. 2005. A study of accounting students' motives, expectations and
preparedness for higher education. Journal of Further and Higher Education 29
(2): 111-124.
Carlson, R. A., and R. G. Yaure. 1990. Practice schedules and the use of component
skills in problem solving. Journal of Experimental Psychology 16 (3): 484-496.
Congo, D. H., and N. Schoeps. 1993. Does Supplemental Instruction Really Work and
What is It Anyway? Studies in Higher Education 18 (2).
Daroca, F. P., and M. M. Nourayi. 1994. Some performance and attitude effects on
students in managerial accounting: Lecture vs. self-study courses. Issues in
Accounting Education 9 (2): 319-329.
De Lange, P., T. Suwardy, and F. Mavondo. 2003. Integrating a virtual learning
environment into an introductory accounting course: determinants of student
motivation. Accounting Education 12 (1): 1-14.
Dowling, C., J. M. Godfrey, and N. Byles. 2003. Do hybrid flexible delivery teaching
methods improve accounting students' learning outcomes? Accounting Education
12 (4): 373-391.
Eccles, J. S., and C. Midgley. 1990. Changes in academic motivation and self-perception
during early adolescence. In From childhood to adolescence, edited by R.
Montemayor, G. R. Adams and T. P. Gullotta. Thousand Oaks, CA: Sage
Publications, Inc.

35
Edmonds, T. P., and R. M. Alford. 1989. Environmental complexity and the level of
information processing by introductory accounting students. Issues in Accounting
Education 4 (2): 345-358.
Elikai, F., and J. Baker. 1988. Empirical evidence on the effectiveness of quizzes as a
motivational technique. Issues in Accounting Education 3 (2): 248-254.
Etter, E. R., S. L. Burmeister, and R. J. Elder. 2000. Improving student performance and
retention via supplemental instruction. Journal of Accounting Education 18: 355-
368.
Fayowski, V., and P. D. MacMillan. 2008. An Evaluation of the Supplemental Instruction
Programme in a First Year Calculus Course. International Journal of
Mathematics Education in Science and Technology 39 (7): 843-855.
Gee, J. P. 2003. What Video Games Have to Teach Us About Learning and Literacy . New
York: Palgrave Macmillan.
Gist, M. E., C. Schwoerer, and B. Rosen. 1989. Effects of alternative training methods on
self-efficacy and performance in computer software training. Journal of Applied
Psychology 74 (6): 884-891.
Gottfried, A. E., G. A. Marcoulides, A. W. Gottfried, P. H. Oliver, and D. W. Guerin.
2007. Multivariate latent change modeling of developmental decline in academic
intrinsic math motivation and achievement: Childhood through adolescence.
International Journal of Behavioral Development 31 (4): 317-327.
Gracia, L., and E. Jenkins. 2002. An exploration of student failure on an undergraduate
accounting programme of study. Accounting Education 11 (1): 93-107.

36
Greer, L. 2001. Does changing the method of assessment of a module improve the
performance of a student? Assessment & Evaluation in Higher Education 26 (2):
127-138.
Hackett, G. 1985. Role of mathematics self-efficacy in the choice of math-related majors
of college woman and men: A path analysis. Journal of Counseling Psychology
32 (1): 47-56.
Halabi, A. K., J. E. Tuovinen, and A. A. Farley. 2005. Empirical evidence on the relative
efficiency of worked examples versus problem-solving exercises in accounting
principles instruction. Issues in Accounting Education 20 (1): 21-32.
Hembree, R. 1990. The nature, effects, and relief of mathematics anxiety. Journal for
Research in Mathematics Education 21 (1): 33-46.
Hox, J. 2002. Multilevel Analysis. Mahwah, New Jersey: Erlbaum.
Huang, T.-H., Y.-C. Liu, and C.-Y. Shiu. 2008. Construction of an online learning system
for decimal numbers through the use of cognitive conflict strategy. Computers &
Education 50: 61-76.
Jones, J. P., and K. T. Fields. 2001. The role of supplemental instruction in the first
accounting course. Issues in Accounting Education 16 (4): 531-547.
Kachelmeier, S. J., J. D. Jones, and J. A. Keller. 1992. Evaluating the effectiveness of a
computer-intensive learning aid for teaching pension accounting. Issues in
Accounting Education 7 (3): 164-178.
Karabenick, S. A., and J. R. Knapp. 1988. Help Seeking and the Need for Academic
Assistance. Journal of Educational Psychology 80 (3): 406-408.

37
———. 1991. Relationship of Academic Help Seeking to the Use of Learning Strategies
and Other Instructional Achievement Behavior in College Students. Journal of
Educational Psychology 83 (2): 221-230.
Kim, Y., A. L. Baylor, and P. Group. 2006. Pedagogical agents as learning companions:
The role of agent competency and type of interaction. Journal of Computer
Assisted Learning 54 (3): 223-243.
Korner, C. 2005. Concepts and misconceptions in comprehension of hierarchical graphs.
Learning and Instruction 15: 281-296.
Kruck, S. E., and D. Lending. 2003. Predicting academic performance in an introductory
college-level IS course. Information Technology, Learning and Performance
Journal 21 (2): 9-15.
Lane, A., and M. Porch. 2002. Computer aided learning (CAL) and its impact on the
performance of non-specialist accounting undergraduates. Accounting Education
11 (3): 217-233.
Marriott, P., and A. Lau. 2008. The use of on-line summative assessment in an
undergraduate financial accounting course. Journal of Accounting Education 26:
73-90.
Martin, D. C., and R. Blanc. 2001. Video-Based Supplemental Instruction. Journal of
Developmental Education 24 (3).
Martin, E., P. Evans, and E. Foster. 1995. The use of videos in the teaching of
accounting. Accounting Education 4 (1): 77-86.
Maurer, R. 2004. One Small Step Can Change Your Life: The Kaisen Way . New York:
Workman Publishing.

38
Mayer, R. E., A. Mathias, and K. Wetzell. 2002. Fostering understanding of multimedia
messages through pre-training: Evidence for a two-stage theory of mental model
construction. Journal of Experimental Psychology: Applied 8 (3): 147-154.
McInnes, W. M., D. Pyper, R. Van Der Meer, and R. A. Wilson. 1995. Computer-aided
learning in accounting: educational and managerial perspectives. Accounting
Education 4 (4): 319-334.
Meece, J. L., A. Wigfield, and J. S. Eccles. 1990. Predictors of math anxiety and its
influence on young adolescents' course enrollment intentions and performance in
mathematics. Journal of Educational Psychology 82 (1): 60-70.
Middleton, M. J., and C. Midgley. 2002. Beyond motivation: Middle school students'
perceptions of press for understanding in math. Contemporary Educational
Psychology 27: 373-391.
Miller, S. P., and C. D. Mercer. 1997. Educational aspects of mathematics disabilities.
Journal of Learning Disabilities 30 (1): 47-56.
Moore, R. 2008. Who's Helped by Help-Sessions in Introductory Science Courses? The
American Biology Teacher 70 (5): 269-273.
Moore, R., and O. LeDee. 2006. Supplemental Instruction and the Performance of
Developmental Education Students in an Introductory Biology Course. Journal of
College Reading and Learning 36 (2): 9-20.
Muller, D. A., J. Bewer, M. D. Sharma, and P. Reimann. 2007. Saying the wrong thing:
Improving learning with multimedia by including misconceptions. Journal of
Computer Assisted Learning 24: 144-155.
39
Multon, K. D., S. D. Brown, and R. W. Lent. 1991. Relation of self-efficacy beliefs to
academic outcomes: A meta-analytic investigation. Journal of Counseling
Psychology 38 (1): 30-38.
Pajares, F., and D. Miller. 1994. Role of Self-Efficacy and Self-Concept Beliefs in
Mathematical Problem Solving: A Path Analysis. Journal of Educational
Psychology 86 (2): 193-203.
Parker, J. E., and B. M. Cunningham. 1998. Using an electronic tutorial to enhance
students' knowledge of advanced tax accounting. Issues in Accounting Education
13 (2): 395-407.
Potter, B. N., and C. G. Johnston. 2006. The effect of interactive on-line learning systems
on student learning outcomes in accounting. Journal of Accounting Education 24:
16-34.
Ramirez, G. M. 1997. Supplemental Instruction: The Longterm Impact. Journal of
Developmental Education 21 (1).
Raudenbush, S. W., and A. S. Bryk. 2002. Hierarchical Linear Models: Applications and
Data Analysis Methods. Thousand Oaks, CA: Sage.
Siegel, R. G., J. P. Galassi, and W. B. Ware. 1985. A comparison of two models for
predicting mathematics performance: Social learning versus math aptitude-
anxiety. Journal of Counseling Psychology 32 (4): 531-538.
Siegler, R. S. 2003. Implications of cognit ive science research for mathematics education.
In A research companion to principles and standards for school mathematics ,
edited by J. Kilpatrick, W. B. Martin and D. E. Schifter. Reston, VA: National
Council of Teachers of Mathematics.

40
Simon, H. A. 1956. Rational choice and the structure of the environment. Psychological
Review 63 (2): 129-138.
Simpson, M. L., C. R. Hynd, s. L. Nist, and K. I. Burrell. 1997. College Academic
Assistance Programs and Practices. Educational Psychology Review 9 (1): 39-87.
Singer, J. D., and J. B. Willett. 2003. Applied Longitudinal Data Analysis. New York:
Oxford University Press.
Smith, J. P. I., A. A. diSessa, and J. Roschelle. 1993. Misconceptions reconceived: A
constructivist analysis of knowledge in transition. The journal of the learning
sciences 3 (2): 115-163.
Starbuck, W. H. 1963. Level of Aspiration. Psychological Review 70 (1): 51-60.
Stone, D. N. 1994. Overconfidence in initial self-efficacy judgments: Effects on decision
processes and performance. Organizational Behavior and Human Decision
Processes 59: 452-474.
Stone, D. N., V. Arunachalam, and J. S. Chandler. 1996. An empirical investigation of
knowledge, skill, self-efficacy and computer anxiety in accounting education.
Issues in Accounting Education 11 (2): 345-376.
Sweller, J., and P. Chandler. 1994. Why some material is difficult to learn. Cognition and
Instruction 12 (3): 185-233.
Thiel, T., S. Peterman, and M. Brown. 2008. Addressing the crisis in college
mathematics: Designing courses for student success. Change July/August 2008:
44-49.
Topping, A. J. 1996. The effectiveness of peer tutoring in further and higher education:
A typology and review of the literature. Higher Education 32: 321-345.

41
Turner, K. G., V. P. Lesseig, and J. G. J. Fulmer. 2006. Mot ivation in the first accounting
course. CPA Journal: 66-69.
Wells, P., P. de Lange, and P. Fieger. 2008. Integrating a virtual learning environment
into a second-year accounting course: determinants of overall student perception.
Accounting & Finance 48: 503-518.
Wooten, T. C. 1996. Factors influencing student learning in introductory accounting
classes: A comparison of traditional and nontraditional students. Issues in
Accounting Education 13 (2): 357-373.
Xu, Y., S. Hartman, and M. Guillermo. 2001. The Effects of Peer Tutoring on
Undergraduate Students' Final Examination Scores in Mathematics. Journal of
College Reading and Learning 32 (1): 22-31.
Yates, G. C. R. 2005. "How obvious": Personal reflections on the database of
educational psychology and effective teaching research. Educational Psychology
25 (6): 681-700.
Zimmerman, B. J., and M. Martinez-Pons. 1990. Student differences in self-regulated
learning: Relating grade, sex and giftedness to self-efficacy and strategy use.
Journal of Educational Psychology 82 (1): 51-59.

42
APPENDIXES
APPENDIX A
Digital Tutor Topics by Chapter (Ainsworth, et al., 2003)3
Time Value of Money
1. How to solve a lump-sum present or future-value problem 2. How to distinguish between lump sum and annuity problems 3. How to solve an annuity prevent or future value problem
Planning for Investing 4. Cost of Capital 5. Rate of return, internal rate of return, and net present value 6. Using net present value to compute the value of a long-term asset
Planning for Equity Financing 7. Partnership accounting 8. Accounting for issuing stock
9. Accounting for cash and stock dividends
Planning for Debt Financing 10. Lump sum notes (interest and principal paid at end)
11. Periodic notes (mortgages or installment notes) 12. Interest only notes
Recording and Communicating Operational Investing Activity
13. Computing asset costs (basket purchases, items excluded from cost) 14. Depreciation methods 15. Asset disposals
Firm Performance: Profitability 16. Operating earnings 17. Extraordinary items 18. Earnings per share
3 A sample Digital Tutor: http://hollywood.gsu.edu/video/acc/acccws/Ch_18_Balance_Sheet/index.html

43
Firm Performance: Financial Position 19. Classified balance sheet basics 20. Using adjunct and contra accounts
21. How to diagnose and solve when you are out of balance
Firm Performance: Cash Flows 22. Classifying by operating, investing and financing
23. Distinguishing between cash and accrual basis items 24. Indirect method of presenting operating cash flows
Firm Performance: A comprehensive Evaluation
25. Profitability ratios 26. Liquidity and solvency ratios 27. Productivity ratios

44
CHAPTER 2
A LOW MAINTENANCE SOLUTION FOR IMPROVING RETENTION: SHORT
TUTORIALS AIMED AT ENGAGING THE BOTTOM OF THE GRADE CURVE IN ELEMENTARY STATISTICS
Introduction Many students find math-related material complex and hard to learn, generally
starting with middle school and continuing through college level (Ashcraft & Krause,
2007; Eccles & Midgley, 1990; Gottfried, et al. , 2007; Hembree, 1990; Miller & Mercer,
1997; Multon, et al., 1991). This difficulty often translates into poor grades which lowers
self-confidence in math-related tasks (Pajares & Miller, 1994), creates math anxiety
(Hembree, 1990) and causes struggling students to avoid math (Boekaerts, 1997; Meece,
et al., 1990). By college, less confident and anxious students shun math-related classes
and majors (Hackett, 1985). When forced by degree requirements to enroll in a math-
related course, students often exhibit the classic avoidance behaviors: they do not attend
class, do not complete the homework, and do not seek help (Kim, et al. , 2006; Middleton
& Midgley, 2002; Zimmerman & Martinez-Pons, 1990). These dysfunctional academic
responses result in poor grades , confirming their self beliefs that they are terrible at math.
While the digital age has made a vast array of supplemental instruction available
to assist low-achieving math students, voluntary participation is low (R. Blanc, L. E.
DeBuhr, & D. C. Martin, 1983; Simpson, et al., 1997). This study examined a low-
maintenance supplemental instructional innovation designed to turn around this self-

45
defeating cycle by motivating effort, increasing course learning, and improving student
confidence in their ability. Unlike most full-featured supplemental instruction, this
innovation, once developed, requires no administration or faculty effort.
Math Self-Efficacy Impacts Math Performance
Student beliefs about their math ability, or math self-efficacy, impact their math
performance in surprisingly strong ways. While motivation, abilities , and strategies are
likely inextricably bound together in predicting math performance, math self-efficacy
wields particular power because students who believe they are not good in math avoid the
learning task, give up more easily, experience more stress under demanding
circumstances, and set fewer academic goals (Bandura, Barbaranelli, Caprara, &
Pastorelli, 1996; Bates & Khasawneh, 2007; Linnenbrink & Pintrich, 2003). When lack
of confidence suppresses academic activity, ability does not get employed as it might in a
more confident student (Wigfield, Eccles, Schiefele, Roeser, & Deavis-Kean, 2006).
The link between math self-efficacy and math achievement shows up in middle
school (Boekaerts, 1997; Frenzel, Pekrun, & Goetz, 2007; Pajares, 1996; Whang &
Hancock, 1994), persists through high school (Beal, Qu, & Lee, 2008; Greene, DeBacker,
Ravindran, & Krows, 1999; Koutsoulis & Campbell, 2001; Pajares & Miller, 1995;
Randhawa, Beamer, & Lundberg, 1993; Steinmayr & Spinath, 2008) and continues in
college (Gist, et al., 1989; Pajares & Miller, 1994; Siegel, et al., 1985). While
confidence in one’s ability naturally rises and falls with success and failure, task
confidence is informed only partially by actual skills and accomplishments (Bandura,
1986; Cooper & Robinson, 1991; Finney & Schraw, 2003; Gutman, 2006; Matsui,
Matsui, & Ohnishi, 1990; Meece, et al., 1990; Pajares, 1996; Pajares & Kranzler, 1995;

46
Pajares & Miller, 1994, 1995; Pintrich & Schunk, 1996). In a recent longitudinal study
of 5,649 seventh graders in Germany, math self-efficacy had a strong impact on math
grades and test scores, even after controlling for interest, prior math grades, and prior
math scores (Marsh, Trautwein, Ludtke, Koller, & Baumert, 2005). In a path analysis of
high school students, math self-efficacy accounted for 35% or more of the variance in
math problem-solving, much higher than cognitive ability and prior math grades (Pajares,
1996).
Math Anxiety Tied to Math Self-Efficacy
Some studies assert that math anxiety is related to math self-efficacy and has a
separate impact on math performance. While general test anxiety depresses performance
in all domains, general test anxiety and math anxiety are different but correlated
constructs (Benson, 1989). In a meta-analysis, math anxiety was related to enjoyment of
math and self-confidence in math ability (math self-efficacy), rather than directly to math
achievement (Hembree, 1990). Other authors suggest that math anxiety is a global
response to a mix of variables such as prior achievement, beliefs about ability, general
test anxiety, and importance of the task rather than a separate unrelated construct
(Benson, 1989; Meece, et al., 1990; Randhawa, Beamer, & Lundberg, 1993)
Improving Competence for Students with Low Math Achievement
Clearly, math self-confidence cannot improve in any stable way until competence
improves (Meece, et al., 1990). Higher achievement consistently accompanies a
reduction in math anxiety (Benson, 1989; Hembree, 1990). While the motivational
literature documents how learning helps improve math self-efficacy and math anxiety, it
offers few instructional choices associated with these shifts.

47
Increasing competence for the entire class is the instructor’s goal, but classroom
studies tracking improvements in confidence or math anxiety are few and not
encouraging. In an introductory astronomy course, adding hand-on exercises to lectures
improved learning but lowered self-efficacy (Hemenway, Straits, Wilke, & Hufnagel,
2002). Of course, the shift in self-efficacy in this instance could reflect a closer
calibration of ability, since the students may have been new to astronomy. In Hembree’s
(1990) meta-analysis on math anxiety studies, whole class treatments designed to
increase confidence or reduce nervousness were not effective. Only individual assistance
with managing emotionality or with completing math tasks reduced math anxiety.
Math teachers who provide instruction for entire classes are held accountable for
covering prescribed curricula, so individual attention may not be feasible, especially
when the classes are large. When instructors decide to ―go on‖ to the next topic, students
who fail to understand earlier ideas are further disadvantaged, because math is a
hierarchical domain with later ideas built on earlier concepts (Miller & Mercer, 1997).
As a course routine, building in a process for remediation, re-teaching, and
individualization should help less confident math students (Yates, 2005). Fortunately,
remedial math students respond to a variety of media used to convey supplemental
instruction. In a study of 164 remedial college algebra students, half taking the course
fully on-line and half attending a traditional classroom, class setting was not a significant
variable in the model (Spence & Usher, 2007). So, instructional tutorials designed to
teach basic concepts may help students build a collection of critical facts, procedures, and
concepts, and may help them feel more competent.

48
Mathematical knowledge is a complex system of related elements, potentially
taxing short-term memory for novices who have not yet systematically linked ideas
together, or know a large body of facts (Smith, et al., 1993; Sweller & Chandler, 1994).
Grain size of concepts in math and science has typically been too few and too large,
especially for those with less experience in the concepts being taught. Learning math
incrementally, i.e., breaking down complex ideas into smaller parts, maximizes mastery
(Ayres, 2006; Smith, et al., 1993). That is, students may better build expertise one
nugget at a time and later assemble the parts into a cohesive interrelated model (Ayres,
2006; Mayer, et al., 2002; Sweller & Chandler, 1994). Weak math students cannot hold
as much numerical information in working memory as stronger math students (Siegler,
2003). So, course designers may help beginners, weaker, or less confident students by
using a ―knowledge in pieces‖ approach, so they can succeed with smaller bits and build
up a base of knowledge to be used for more complex assignments. Smaller pieces would
give uneasy students a lighter processing load, more opportunities to feel competent, and
potentially more chances to calibrate their ability realistically.
Math understanding has procedural and conceptual aspects. Students might
understand the process, but not the concept, or the concept, but not the process. Lapses in
either lead to systematic errors that can be detected, diagnosed, and corrected (Siegler,
2003). Novices are particularly vulnerable to flawed ideas and partial understandings
(Smith, et al., 1993). Work targeting misconceptions is promising. University students
interpreting graphs did better with ―more instruction‖ versus ―less,‖ but the biggest
performance gains came from information about possible misconceptions (Korner, 2005).
College students with low prior knowledge gained more from explicit instruction of

49
misconceptions than from additional lectures (Muller, et al. , 2007). In a study of middle
school math students, computer instruction on misconceptions led to significant
improvement in initial learning, and the students retained the learning better four weeks
later (Huang, et al. , 2008).
Refinement and organization of previously introduced ideas can be better than
adding a new layer of information to unstable existing knowledge, especially for novices.
Coaching students on actual or typical misconceptions, however, is not the norm. A
study of 90 teachers working with low ability math students showed that only half of
them could identify misconceptions, even fewer could identify the most common errors
and only about 30% of them changed instruction to address the errors (Smith, et al. ,
1993). The majority of the teachers chose to re-teach basic facts, even after learning
about misconceptions. Cognitive scientists have suggested having students explain why
some answers are wrong in addition to why answers are right, in order to flush out
misconceptions more thoroughly (Siegler, 2003).
Low math achievers need special guidance to reduce anxiety and improve math
performance, thereby increasing successful trials (Matsui, et al. , 1990). However, the
weaker students are less likely to ask for the needed help (Zimmerman & Martinez-Pons,
1990) and are more likely to have adopted performance-avoidance behaviors (Hsieh,
Sullican, & Guerra, 2007). Proactive help can offset low prior knowledge and give
confidence to low self-efficacy learners, who might not otherwise request assistance. In a
college computer literacy class, students receiving coaching at the onset of a new topic
outperformed those that received guidance only when they requested it (Kim, et al.,

50
2006). Thus, providing supplemental assistance without waiting for requests may help
low-achieving students.
Supplemental Instruction
Decades of work consistently shows that extra instruction, in all its various forms,
works to some degree, with effect sizes varying depending on the match of the resource
to the learner (Congo & Schoeps, 1993; Simpson, et al., 1997). Help with study
strategies, special lectures, peer discussions, study sessions or tutoring all increase time
on task and thereby enhance learning compared to students who do not receive the extra
assistance (Simpson, et al. , 1997). While quality instruction has traditionally been labor
intensive, computer access has made it possible to build a vast array of ready-built on-
line resources to supplement classrooms. A review of 254 studies shows that computer
instruction helps (Kulik & Kulik, 1991).
The issue with supplemental instruction is not whether it works, but how to get
students to use it (Simpson, et al., 1997). Students that self-select into extra instruction
are more motivated (R. Blanc, et al., 1983). Low achievers may not only be poorly
motivated, but may also shun the stigma attached to remedial work, adding to the
problem of getting them to self-select into extra instruction (Karabenick & Knapp, 1988;
Moore & LeDee, 2006). While disengaged and underperforming students often do not
volunteer for supplemental instruction, what does seem promising is that low-achieving
students whose typical mode is passive, once exposed to useful teaching innovations, are
often quick to adopt them, learn, and feel more confident as a result (Bueschel, 2008). So
the main hurdle with supplemental instruction is to get the passive, weak, or unsure
students to engage—to sample the supplemental resources and be successful using them.

51
The purpose of this study was to test supplemental instruction designed to solve
the biggest hurdle—passivity—and then to deliver quality instruction targeted at the
needs of lower achieving students.
Design of Innovative Supplemental Instruction
This study assessed supplemental instruction consisting of a set of on-line
tutorials called ―Digital Tutors.‖ The key design features of the tutorials came from
suggestions in both the motivational and cognitive literatures. For instance, motivational
literature predicts that traditional supplemental instruction such as extra lectures, online
course textbook supplements, learning communities, peer tutoring, and extra practice
opportunities will not interest discouraged and poorly motivated students, as these all
require considerable extra effort (Linnenbrink & Pintrich, 2002; Simpson, et al. , 1997).
To attract the tentative or passive math students, the instruction should require a small
effort, but also be distinctly different from traditional course supplements (Bueschel,
2008). The unique attention-getting promise that was designed to attract less confident
and less able students was the ultra-short length of the Digital Tutors: just three minutes.
In addition, easy access (available anywhere there is an Internet connection, 24/7)
minimized the effort needed to participate.
The second major aspect of the design was to create instruction that would meet
the cognitive needs of weak learners, so that their first engagement with the innovation
would be successful. Cognitive load theory suggests that instruction for inexperienced
learners should break down complex concepts and processes into small pieces to avoid
overloading short-term memory, and that the instruction should avoid seductive details
and busy screens (Sweller & Chandler, 1994). Therefore, each three-minute segment

52
emphasized one foundational idea using basic voice-over PowerPoint with no animation
and minimal artwork. The instruction coached learners on the use of strategies that have
been shown to help students achieve success and improve their confidence for future
tasks (Linnenbrink & Pintrich, 2003). Where possible, the instruction included tips on
how to avoid common misconceptions and errors (Korner, 2005; Muller, et al. , 2007).
To provide practice, feedback, and reinforcement immediately after the three-minute
instruction, the student could view two or three worked-out problems, an easy one and
then one or two harder ones. At the end of the practice, the learner was told ―you now
know __(concept/skill)__‖ and was encouraged to try another one or to go to the next
logical topic.
In keeping with the motivational literature, the content of the tutorials focused on
core ideas, skills, or processes immediately recognized by the student as something
appearing on major exams (i.e., high-task value), and conveyed a sense of control
(Pintrich & Schunk, 1996) by permitting them to watch, listen, or both, and start and stop
anytime. To keeping with the literature on math-anxious students, the voice in the
tutorials was warm, relaxed, and unhurried, and the tone conveyed confidence that this
was do-able in short order with the use of a few strategies (Hembree, 1990).
While math topics typically build on each other, the instruction kept each topic as
discrete as possible so the students could start anywhere in the course without needing to
―start over.‖ This was done in order to motivate participation as needed at any point in
the semester. When this was not possible, the instruction indicated that the video built on
an earlier one, and the learner needed to run through a prior tutorial first. As an

53
additional motivational aspect, the supplemental instruction included 15 critical skills for
the entire course in order to avoid overwhelming students with the volume of material.
First Study
The first tutorial implementation in a Principles of Accounting II class (Spring
2007) was motivated by an extremely low course pass rate, ranging from 45-55% over
several years. Tutorial participation during the first semester of use averaged 71.4%, and
pass rates improved 20%, but the study found only a small improvement in exam scores
for tutorial users, about three exam points (Sargent, 2009).
The small effect on exam scores in this study raised a number of questions. Did
the basic tutorials only provide enough extra instruction to enable students to pass?
Would additional tutorials with more challenging content lead to a larger learning effect?
Did students use the tutorials to pass or reach only a modest grade goal, and then quit the
extra instruction, making more advanced tutorials of little interest? In order to increase
exam scores and test whether students were working only until their grade goal was met
(satisficing effect), rather than using all resources possible to maximize their course
grade, a more advanced set of tutorials was created for the current study.
The high participation rates in the first implementation raised questions about
what features of the tutorials appealed most to students, especially the low achievers.
Although the previous tutorials were designed to improve student confidence in math-
related tasks, the prior study did not track changes in confidence. Thus, this study was
designed to collect beginning and ending confidence measures and to survey users about
tutorial features.

54
Since the accounting study was a campus project to increase pass rates, it lacked
an experimental design. This study replicated the first implementation with random
assignment and a control group.
The Current Investigation
This paper reports an implementation of ―Digital Tutors‖ created for freshman
elementary statistics, a course where there was already a vast array of extra instructional
resources available to students. Students in the course had access to the Math Assistance
Center (i.e., the Math Lab) on Monday-Thursdays, 9:00 a.m. – 7:00 p.m., which offered
one-on-one tutoring and computer stations loaded with practice software. Students could
also use on-line publisher resources such as quizzes, on-line lectures, on-line diagnostic
study managers, slides, outlines, and extra practice problems with worked-out solutions.
Further, twice a week during the lunch hour (when no classes are in session) the course
coordinator provided homework help sessions open to students in any section. However,
in spite of the impressive array of extra help, the course failure rate still averaged 20-
30%.
The current study loaded tutorials onto WebCT, the campus learning management
system, for randomly selected sections of elementary statistics (intervention sections), but
not for others (control sections). This created three groups: (a) control students w ithout
access to tutorials; (b) users, students enrolled in the intervention sections who chose to
view the tutorials; and (c) non-users, students enrolled in intervention sections with
access to the tutorials, but chose not to use them.
This study analyzed a series of questions. First, would the high risk students (low
achievers) use the tutorials?
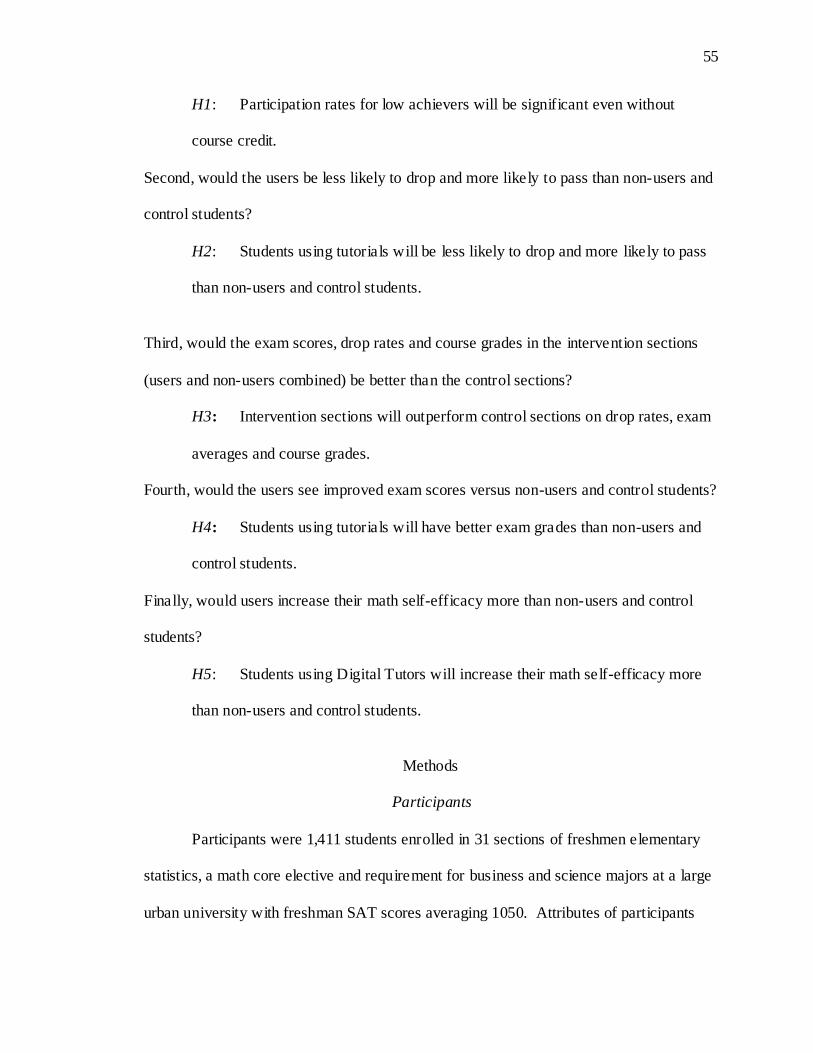
55
H1: Participation rates for low achievers will be significant even without
course credit.
Second, would the users be less likely to drop and more likely to pass than non-users and
control students?
H2: Students using tutorials will be less likely to drop and more likely to pass
than non-users and control students.
Third, would the exam scores, drop rates and course grades in the intervention sections
(users and non-users combined) be better than the control sections?
H3: Intervention sections will outperform control sections on drop rates, exam
averages and course grades.
Fourth, would the users see improved exam scores versus non-users and control students?
H4: Students using tutorials will have better exam grades than non-users and
control students.
Finally, would users increase their math self-efficacy more than non-users and control
students?
H5: Students using Digital Tutors will increase their math self-efficacy more
than non-users and control students.
Methods
Participants
Participants were 1,411 students enrolled in 31 sections of freshmen elementary
statistics, a math core elective and requirement for business and science majors at a large
urban university with freshman SAT scores averaging 1050. Attributes of participants

56
are summarized by users, non-users, and control students in Table 8. Users had
significantly more college level credit hours than nonusers and control students (F = 3.79,
p = .03), but the three groups did not significantly differ on any other of the attributes
reported in Table 8.
Table 8 Participant Attributes: Mean (SD)
Attribute
Usersa
Non-Users
Intervention
Control
Number of participants
320
375
695
716
Percent female
58.4%
59.7%
59.1%
58.4%
SAT verbal b
517.46 (70.40)
521.77 (77.03)
518.98 (74.30)
521.09 (74.84)
SAT math b
525.17 (73.09)
527.30 (72.73)
526.41 (72.81)
527.06 (76.00)
Cumulative GPA c
2.93 (0.65)
2.85 (0.81)
2.88 (0.74)
2.83 (0.78)
College credit hours (p < .05)
69.40 (35.12)
62.11 (35.64)
65.47 (35.56)
65.74 (34.33)
a Opened two or more tutorials during term.
b Excludes transfer students, for which SAT scores are not required (n = 430, 54 non-users, 138 users and 238 control).
c Includes 11 transferred students who withdrew from all their classes leaving no GPA so their transfer GPA was used.
Procedure
The 31 sections of elementary statistics offered in Spring 2009 were randomly
assigned to intervention and control sections by first stratifying sections into groups
taught by the same instructor and then randomly assigning control and intervention by
instructor. Instructors teaching only one section were randomly assigned to either control
or intervention. After random assignment, the 21 instructors were notified about which
of their sections, if any, would have tutorials loaded. Six full-time faculty, six vis iting

57
instructors, and three graduate teaching assistants taught intervention sections. Four full-
time faculty, seven visiting instructors, and five graduate teaching assistants taught
control sections.
The departmental course coordinator distributed a common syllabus, exam
requirements, course materials, teaching notes, learning objectives and minimum chapter
coverage requirements to all instructors. Per departmental policy, instructors had to give
a minimum of three exams and a cumulative final, although they could add additional
exams and quizzes. Only one instructor gave a fourth exam, but most instructors added a
series of small quizzes between exams. The department required every instructor to
include one of the two departmental provided problems on the final exam.
During the first week of the semester, the author visited all intervention and
control sections of elementary statistics, asking students to complete a survey of their
math self-concept (a general impression of their confidence for math related tasks) and
statistical self-efficacy (the confidence to complete a specific statistical course task) and
introduced either the tutorials or the Math Lab. She told students in the intervention
sections that they could try a new learning tool, ―Digital Tutors,‖ and launched a tutorial
to demonstrate how to use them. She asked students in the control sections to try the
Math Lab, explaining the lab’s hours and services offered, and giving them directions to
find the lab.
A set of 21 tutorial files were loaded into each intervention section’s learning
management sytem (WebCT)--15 basic level tutorials (see Appendix B for a list of
topics), and six advanced level tutorials. Students could open but not download the files,
thereby permitting the capture of each view by student. The participants had no

58
knowledge of this tracking, and received no credit for using the tutorials or completing
the practice problems offered after the instruction. The software captured the number of
file launches but not length of time the file was open, so ―tutorial use‖ was measured in
number of launches or ―views.‖
During the last week of the semester, the author again visited all sections and
asked students to complete an end-of-semester measure of math self-concept and
statistical self-efficacy and a survey on course resources used. At the end of the course,
the technology team on campus summarized WebCT activity showing the number of
views (launches) for each tutorial by student. At the end of the semester, all but one
instructor of a control section submitted the course grades. The missing section exam
scores were only partially recovered from a damaged file, so the hypothesis on exam
grades was tested with only 30 sections of data.
Measures
Math Self-Concept
Math self-efficacy and math self-concept differ in their level of specificity. Math
self-efficacy is the confidence for a particular task, that can vary considerably as tasks
change, and was measured as statistical self-efficacy in this study. Math self-concept is
the student’s general impression of his/her ability in math, a more general measure
across a wide variety of math-related tasks, and was measured in this study using a five-
item survey from a study linking math self-concept to academic achievement that showed
good reliability (s>.8) (Marsh, et al., 2005). This survey asked students to rate
themselves on a four-point Likert scale from strongly agree to strongly disagree on
statements such as ―I’m just not good at math‖ and ―math topics are hard to understand.‖

59
In the current sample, beginning and ending math self-concept were significantly
correlated, Pearson correlation = .723, p = < .001.
Statistical Self-Efficacy
Confidence for the specific course-related tasks in this study, statistical self-
efficacy, was measured using 12 of 14 items on a survey from a prior study of elementary
college statistics (Finney & Schraw, 2003). The factor analysis for the 14 item survey
showed that the items in the prior study loaded primarily on one factor explaining
73.71% of the total variance, with no other factor having an eigenvalue of less than one.
The two items that were removed were not learning goals of the course in this
experiment. These items asked students to rate themselves on a six-point Likert scale on
their ―confidence to learn‖ (beginning of course) or ―confidence to complete‖ (end of
course) specific tasks such as explaining what standard deviation means, identify a
skewed population distribution and selecting the correct statistical procedure to be used to
test a research question. In this study’s sample, beginn ing and ending statistical self-
efficacy were significantly correlated, Pearson correlation = .367, p = < .001.
Grade Goal
One of the questions from the author’s first study pertained to whether student
goals created a low ceiling effect on exam grades. In order to examine how a grade goal
impacts exam scores or tutorial use, students were asked via a survey if they ―worked
only until they achieved a sufficient grade goal and then moved to other priorities,‖ ―were
just trying to pass,‖ or they ―worked to get the maximum possible grade.‖ Students
checking ―yes‖ to ―sufficient grade‖ or ―just passing‖ were coded as ―satisficers‖;
students checking ―maximum possible‖ were coded as ―maximizers.‖

60
Tutorial Use
This work defines a ―user‖ as a student who viewed two or more tutorials. A
review of tutorial launches showed that 82 students previewed the tutorials, viewing only
one. Previewers were not included as users. The length of time the file was open was not
captured, so the study defined ―use‖ as ―the number of file launches‖ (i.e., number of
views) rather than minutes viewed.
Math Aptitude
Math aptitude was measured with Math SAT scores, which were available for
students entering the university as first-term freshmen (N = 981, 69.5%), but not for
students transferring from other institutions, N = 430, 30.5%.
Achievement
Cumulative grade point average (GPA) measured academic achievement. The
GPA cutoffs for separating students into low and high achiever groups were selected as
an amount above and below the mean GPA, which grouped approximately 25% of the
participants in the low group and 25% in the high group. The cutoff used for the low
GPAs was 2.4 or less (25.3% of the students) and a high GPA was 3.4 or higher (26.3%
of the students). The correlation between GPA and Math SAT was low enough to permit
including both variables in the same model, Pearson correlation = .174.
Exams
Students took either three or four exams during the semester, along with a
cumulative final. All instructors wrote their own exams, but the department specified
that all exams include at least 50% worked-out problems. All but one instructor indicated
that they took some or all of their exam questions from the textbook publisher’s test bank.

61
Tutorial Contents
The author selected the tutorial topics based on interviews of seasoned statistics
faculty, the supervisor of the math lab on campus, and a review of the course syllabus. In
the interviews, she probed the content experts for central topics that impacted cumulative
understanding, common misconceptions, traditionally difficult areas, and helpful
strategies. All interviewees mentioned eight of the 15 final topics, suggesting that there
was general agreement on central topics and areas of difficulty. She selected the
remaining topics based on a review of several popular elementary statistics textbooks,
course learning goals published by the math department, and advice from the elementary
statistics course coordinator. Appendix A shows five of the tutorial topics, along with a
sample problem worked out in the slides. Appendix B lists all the tutorial topics.
The six advanced tutorials contained brief reviews of the major concepts and an
assortment of challenge problems. The script helped the students identify the topic in
each problem, discussed the appropriate strategy to solve it, and then worked through the
steps towards a solution. The first three advanced tutorials included the typical chapters
before each of the three exams (Note: There were slight variations by instructor in the
chapters mapping to each exam.) Then the last three advanced tutorials included an
assortment of all course topics intended to prepare students for the cumulative final exam.
The author created the slides and supporting scripts, but had no particular
expertise in statistics (except a few courses during doctoral work). She occasionally
consulted a few elementary statistics textbooks provided by major publishing houses,
though not necessarily the required course text, to get a variety of problem types and
explanations. The slides were not a repetition or summary of class lectures since she did
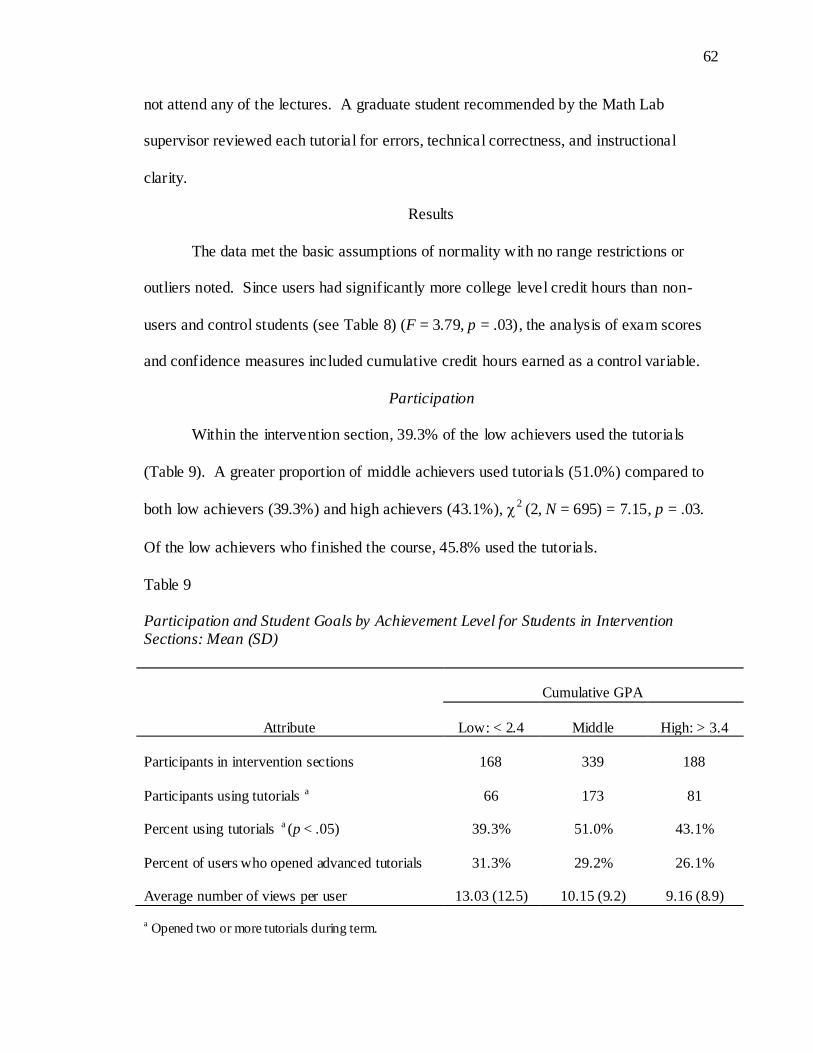
62
not attend any of the lectures. A graduate student recommended by the Math Lab
supervisor reviewed each tutorial for errors, technical correctness, and instructional
clarity.
Results
The data met the basic assumptions of normality with no range restrictions or
outliers noted. Since users had significantly more college level credit hours than non-
users and control students (see Table 8) (F = 3.79, p = .03), the analysis of exam scores
and confidence measures included cumulative credit hours earned as a control variable.
Participation
Within the intervention section, 39.3% of the low achievers used the tutorials
(Table 9). A greater proportion of middle achievers used tutorials (51.0%) compared to
both low achievers (39.3%) and high achievers (43.1%), 2
(2, N = 695) = 7.15, p = .03.
Of the low achievers who finished the course, 45.8% used the tutorials.
Table 9 Participation and Student Goals by Achievement Level for Students in Intervention Sections: Mean (SD)
Cumulative GPA
Attribute
Low: < 2.4
Middle
High: > 3.4
Participants in intervention sections
168
339
188
Participants using tutorials a
66
173
81
Percent using tutorials a (p < .05)
39.3%
51.0%
43.1%
Percent of users who opened advanced tutorials
31.3%
29.2%
26.1%
Average number of views per user
13.03 (12.5)
10.15 (9.2)
9.16 (8.9)
a Opened two or more tutorials during term.

63
The average user viewed 10.49 tutorials, about half of the tutorial set if each view
was of a different file. Use of tutorials by topic in semester sequence (Figure 5) shows an
initial surge of interest, and then strategic use by topic rather than consistent use across
the full semester. Students viewed advanced files less often than basic topics, with the
typical user viewing 2.49 advanced tutorials. The average number of advanced views did
not differ among achievement levels, F = 1.06, p = .37.
Figure 5. Number of tutorial views by topic in order of course syllabus
Impact of Tutorial Use on Drop Rate and Pass Rate
Figure 6 shows the grade distribution for users, non-users, and control students.
The drop rate for users (9.1%) was significantly lower than both non-users (18.4%) and
control students (16.2%), 2(2, N = 1,411) = 12.91, p = .002. The pass rate of users
0
50
100
150
200
250
300
350
400
450
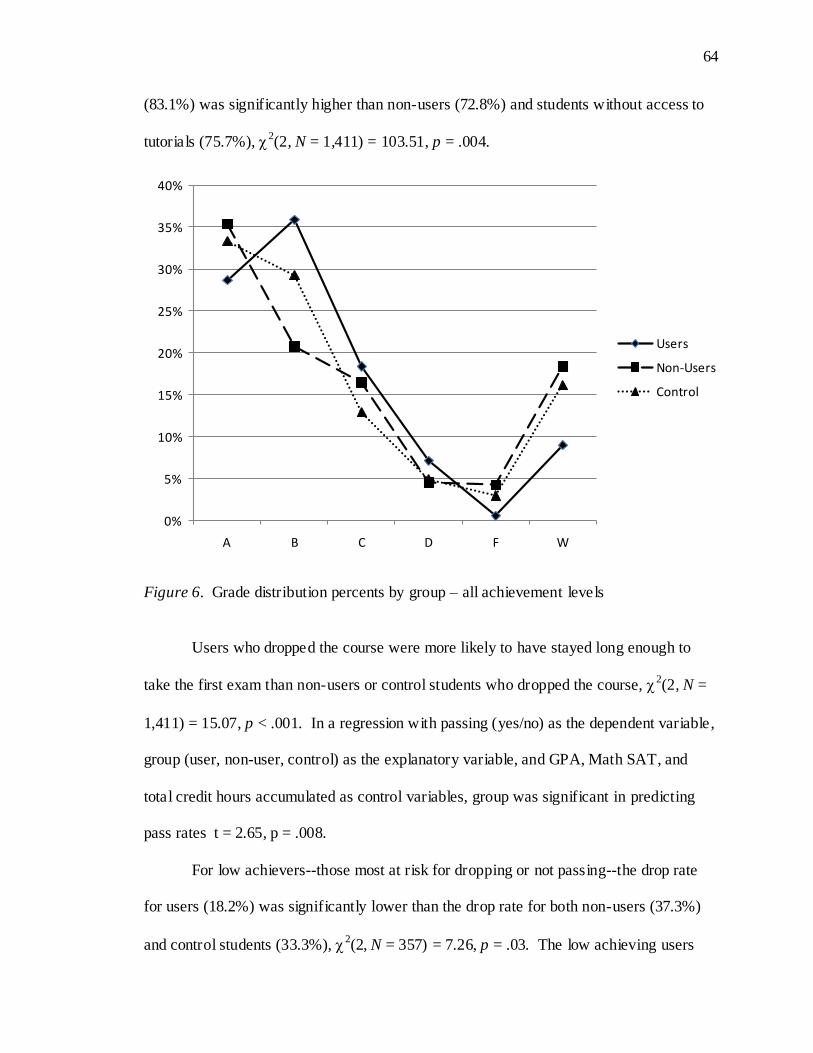
64
(83.1%) was significantly higher than non-users (72.8%) and students without access to
tutorials (75.7%), 2(2, N = 1,411) = 103.51, p = .004.
Figure 6. Grade distribution percents by group – all achievement levels
Users who dropped the course were more likely to have stayed long enough to
take the first exam than non-users or control students who dropped the course, 2(2, N =
1,411) = 15.07, p < .001. In a regression with passing (yes/no) as the dependent variable,
group (user, non-user, control) as the explanatory variable, and GPA, Math SAT, and
total credit hours accumulated as control variables, group was significant in predicting
pass rates t = 2.65, p = .008.
For low achievers--those most at risk for dropping or not passing--the drop rate
for users (18.2%) was significantly lower than the drop rate for both non-users (37.3%)
and control students (33.3%), 2(2, N = 357) = 7.26, p = .03. The low achieving users
0%
5%
10%
15%
20%
25%
30%
35%
40%
A B C D F W
Users
Non-Users
Control

65
had a significantly higher pass rate (63.7%) compared to both non-users (36.3%) and
control students (44.4%), 2(2, N = 357) = 12.33, p = .002. Low achieving users who
dropped the course were more likely to take the first exam than low-achieving non-users
or control students who dropped the course, 2(2, N = 357) = 9.75, p = .008. The grade
distribution for low achieving users, non-users, and control students (Figure 7) shows that
fewer users dropped or failed compared to the other groups and users received more ―C‖
grades than both the non-users and control students.
Figure 7. Grade distribution percents by group – low achievers only
Intervention versus Control Sections
The drop rate between intervention (14.1%) and control sections (16.2%) was not
significantly different, 2(1, N = 1,411) = 1.21, p = .271. A regression with exam average
for students completing the course as the outcome variable, section (intervention or
0%
5%
10%
15%
20%
25%
30%
35%
40%
A B C D F W
Users
Non-Users
Control

66
control) as the predictor, and Math SAT, GPA, and credit hours accumulated as control
variables shows that exam scores were slightly lower (B = -0.008 per tutorial view) for
intervention sections, t = -2.74, p = .006. There is no practical effect of an exam score
grade being less than one point lower. The grades assigned to students who completed
the course were not significantly different between intervention and control students,
2(10, N = 1,196) = 11.18, p = .344.
Impact of Tutorial Use on Exam Scores
Because control section instructor did not report exam grades due to a corrupt
computer file, the analyses omits the 47 students in that section. The letter grades
assigned in the omitted section did not differ significantly from the other sections (2[10,
N = 1,336] = 13.19, p = .21) so there is no reason to believe this omission introduces bias.
Using hierarchical linear modeling (HLM), exam score growth over the semester
was analyzed longitudinally as a function of tutorial use and instructor (Hox, 2002;
Raudenbush & Bryk, 2002; Singer & Willett, 2003). Like traditional regression, HLM
analyzes two aspects of the data, the intercept or starting point, in this case exam one, and
the slope, the change in exam scores over the semester. HLM, however, permits nesting
of exam scores and tutorial use within students and students within sections, something
traditional regression does not permit.
The intercept revealed initial differences between students’ exam scores, and the
slopes showed changes in exam scores over time within each student and between
students. The slopes can be divided into several components to model different influences
on growth. The hypothesized model included an instructor component (to model different
starting points due to different exams by instructor and growth unique to each student’s
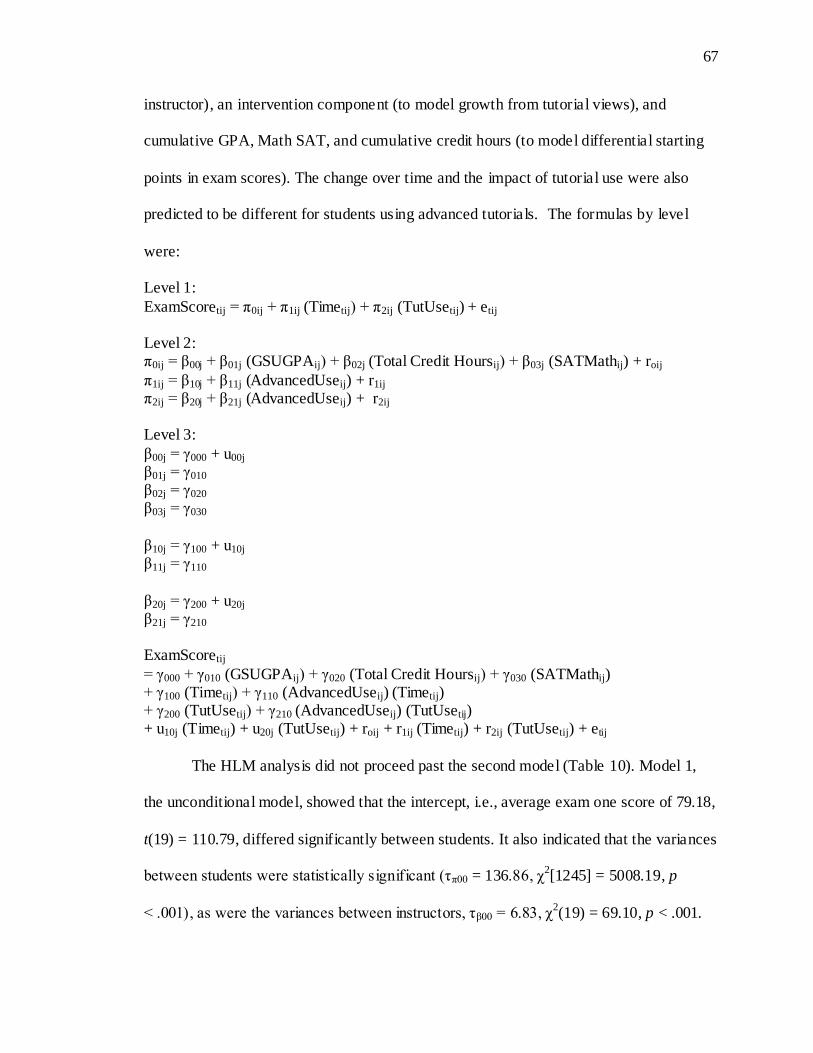
67
instructor), an intervention component (to model growth from tutorial views), and
cumulative GPA, Math SAT, and cumulative credit hours (to model differential starting
points in exam scores). The change over time and the impact of tutorial use were also
predicted to be different for students using advanced tutorials. The formulas by level
were:
Level 1:
ExamScoretij = π0ij + π1ij (Timetij) + π2ij (TutUsetij) + etij Level 2: π0ij = β00j + β01j (GSUGPAij) + β02j (Total Credit Hoursij) + β03j (SATMathij) + roij
π1ij = β10j + β11j (AdvancedUseij) + r1ij π2ij = β20j + β21j (AdvancedUseij) + r2ij Level 3:
β00j = γ000 + u00j β01j = γ010 β02j = γ020 β03j = γ030
β10j = γ100 + u10j β11j = γ110
β20j = γ200 + u20j β21j = γ210 ExamScoretij
= γ000 + γ010 (GSUGPAij) + γ020 (Total Credit Hoursij) + γ030 (SATMathij) + γ100 (Timetij) + γ110 (AdvancedUseij) (Timetij) + γ200 (TutUsetij) + γ210 (AdvancedUseij) (TutUsetij) + u10j (Timetij) + u20j (TutUsetij) + roij + r1ij (Timetij) + r2ij (TutUsetij) + etij
The HLM analysis did not proceed past the second model (Table 10). Model 1,
the unconditional model, showed that the intercept, i.e., average exam one score of 79.18,
t(19) = 110.79, differed significantly between students. It also indicated that the variances
between students were statistically significant (τπ00 = 136.86, χ2[1245] = 5008.19, p
< .001), as were the variances between instructors, τβ00 = 6.83, χ2(19) = 69.10, p < .001.

68
Model 2 added a variable for time (weeks). This shifted the predicted intercept
upward and indicated that exam scores decreased on average 0.18 points per week during
the semester, although time was not significant in the model. The between student
variance of the slope was not statistically significant, τπ11 = 0.02, χ2(1197) = 5008.19, p
= .05. Since the decrease in exam scores did not differ between students, no student-level
predictors could explain the differential impact of time on the exam scores. However, the
between instructor variance of the slope was statistically significant (τβ11 = 0.16, χ2[19] =
183.55, p < .001), indicating that some sections had growth in scores, but not others,
likely reflecting unique testing patterns of instructors.
The lack of a significant slope coefficient, however, makes further analysis with
the hypothesized model meaningless. The variances in Model 2 indicate that there are
additional predictors that can explain the differences in the initial status. These predictors
were student-level predictors (τπ00 = 113.56 χ2[1197] = 1926.85, p < .001), as well as
instructor-level predictors, τβ00 = 30.81, χ2(19) = 183.54, p < .001. Differences in starting
points were not a focus of this study, so the model was not expanded to investigate this
aspect. 4
Much of the tutorial use occurred before the first exam (Figure 5), removing much
of the tutorial impact from the growth component of the HLM model, which uses the first
score as the starting point. A regression run with average exam scores as the dependent
variable, tutorial use as the predictor, and credit hours, cumulative GPA, and Math SAT
as control variables (Table 11, Panel A), showed tutorial use was insignificant in
4 A third model was run with cumulative GPA to explain different starting points and GPA was significant
(p < .001) although the slope was still insignificant. This means that no additional predictors added to the slope of the model would improve the model. Further analysis for explaining the intercept was not a goal
of this study.

69
Table 10 Longitudinal Analysis of Change in Exam Scores with Tutorial Use
Model 1: Intercept
Model 2: + week
Fixed Effects:
Coeff.
SE
Coeff.
SE
Intercept
79.18***
0.714
81.15***
1.369
Week
-0.18
0.099 Tutorial use
a
GPAa
Math SAT
a
Total credit hours a
Variance:
Level 1 Within person
# 143.46
136.75
Level 2
Between persons in initial status
136.86***
103.56***
Between persons in growth
0.02
Level 3
Between instructors in initial status
6.83***
30.81***
Between instructors in growth
0.16***
*** p < .001
# There is no significance test in HLM for the within person variance.
a Because the slope for week was insignificant, adding variables to explain the slope would not improve the model

70
Table 11 Exam Average as a Function of Tutorial Use
Panel A: Low, middle and high achievers
Variable
SE
β
t
p
Constant
23.133
3.762
6.150
.000
Tutorial views
0.103
0.073
0.038
1.411
.159
Total credit hours
0.044
0.016
0.075
2.775
.006
Cumulative GPA
13.611
0.682
0.551
19.961
.000
Math SAT
0.023
0.006
0.098
3.547
.000
Model R
2 = .340
Panel B: Only low achievers
Variable
SE
β
t
p
Constant
20.393
10.198
2.000
.047
Tutorial views
0.379
0.158
0.161
2.407
.017
Total credit hours
0.039
0.047
0.059
0.835
.405
Cumulative GPA
12.051
3.090
0.270
3.901
.000
Math SAT
0.033
0.016
0.138
2.026
.044
Model R
2 = .141
explaining exam scores. Running this same regression for only low achievers showed
tutorial use was significant as a predictor of average exam scores (Table 11, Panel B).
The practical significance of this finding for low achievers was low to moderate; the of
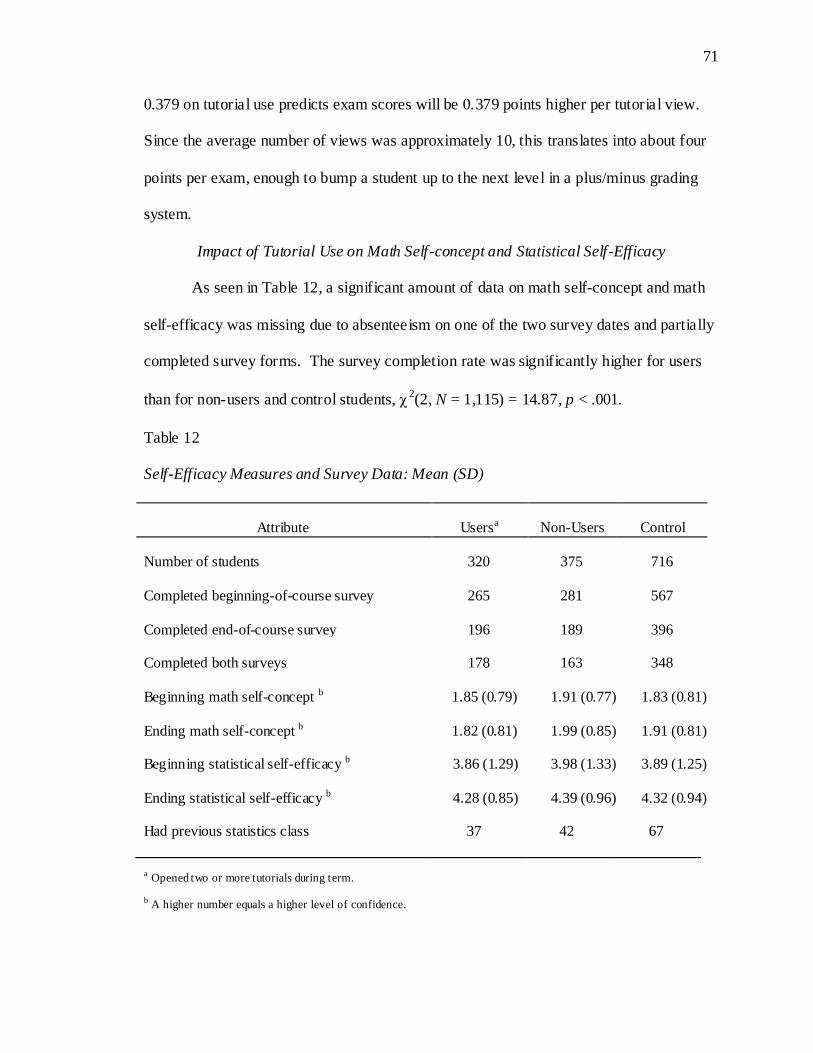
71
0.379 on tutorial use predicts exam scores will be 0.379 points higher per tutorial view.
Since the average number of views was approximately 10, this translates into about four
points per exam, enough to bump a student up to the next level in a plus/minus grading
system.
Impact of Tutorial Use on Math Self-concept and Statistical Self-Efficacy
As seen in Table 12, a significant amount of data on math self-concept and math
self-efficacy was missing due to absenteeism on one of the two survey dates and partially
completed survey forms. The survey completion rate was significantly higher for users
than for non-users and control students, 2(2, N = 1,115) = 14.87, p < .001.
Table 12 Self-Efficacy Measures and Survey Data: Mean (SD)
Attribute
Usersa
Non-Users
Control
Number of students
320
375
716
Completed beginning-of-course survey
265
281
567
Completed end-of-course survey
196
189
396
Completed both surveys
178
163
348
Beginning math self-concept b
1.85 (0.79)
1.91 (0.77)
1.83 (0.81)
Ending math self-concept b
1.82 (0.81)
1.99 (0.85)
1.91 (0.81)
Beginning statistical self-efficacy b
3.86 (1.29)
3.98 (1.33)
3.89 (1.25)
Ending statistical self-efficacy b
4.28 (0.85)
4.39 (0.96)
4.32 (0.94)
Had previous statistics class
37
42
67
a Opened two or more tutorials during term.
b A higher number equals a higher level of confidence.

72
As summarized in Table 12, beginning and ending math self-concept did not
differ among users, non-users,, and control students, F = 0.97, p = .38 and F = 2.08, p
= .13. Beginning and ending statistical self-efficacy did not differ among users, non-
users, and control students, F = 0.63, p = .54 and F = 0.90, p = .41. There was a
significant correlation between beginning confidence in statistical self-efficacy and
having a prior course in statistics , Pearson correlation = .157, p = < .01.
A regression with ending math self-concept as the dependent variable , tutorial use
and beginning math self-concept as explanatory variables , and cumulative GPA, Math
SAT, and credit hours as control variables, found that math self-concept decreased with
tutorial use, t = -2.368, p = .018. The same regression with ending statistical self-efficacy
as the dependent variable , and beginning statistical self-efficacy replacing math self-
efficacy in the model, found tutorial use was not significant in predicting ending
statistical self-efficacy.
Survey Results
As noted in Table 12, a significant number of students were absent during survey
dates both at the beginning and end of the semester. The missing data gave a very rough
measure of how attendance and class attendance habits likely influence drop and pass
rates. There was a significant difference among users, non-users, and control students in
the number of students attending on both survey dates, 2(2, N = 1,115) = 14.87, p
= .001. However, the uneven attendance is concentrated in the middle and high
achievers. The attendance rates on survey dates were even across all the low achievers,
2(2, N = 315) = 5.56, p = .06.

73
Of the students completing end-of-the-course surveys, 297 (37.9%) were
―satisficers‖ based on their self report that they ―worked only until they achieved a
sufficient grade goal‖ or ―worked to just pass.‖ For the low achievers, 63.0% reported
themselves as ―satisficers,‖ a much higher rate than the middle (43.4%) or high achievers
(24.6%), 2(4, N = 385) = 33.67, p < .001. The percentage of satisficers among users
(39.0%), non-users (39.5%), and control students (36.6%) did not differ significantly,
2(2, N = 781) = 0.586, p = .746. The correlation between those who used advanced
tutorials and those self reporting as maximizers (working towards the best grade possible)
was not significant, Pearson correlation = .007, p = .836.
Table 13 Course Resources Reported As Important to Achievement: Count (Percent)
Attribute
Usersa
Non-Users
Control
Completed end-of-course survey
196
189
396
Lecture
89 (45.5%)
127 (67.2%)
274 (69.2%)
Course notes provided by instructor
42 (21.4%)
48 (25.4%)
118 (29.8%)
Digital Tutors
111 (56.6%)
Math Assistance Center (Math Lab)
10 (5.1%)
22 (11.6%)
28 (7.1%)
Office Hours
16 (8.2%)
17 (9.0%)
50 (12.6%)
Course textbook
95 (48.5%)
98 (51.9%)
205 (51.8%)
Course website resources
14 (7.1%)
10 (5.3%)
18 (4.5%)
a Opened two or more tutorials during term.
Student survey responses indicating what resources were important to their
achievement are shown in Table 13 and the percent of students reporting each tutorial

74
feature as important are shown in Figure 8. Users were less likely to rate their lecture as
important compared to non-users or control students (2[4, N = 781] = 32.48, p < .001)
and non-users were more likely to use the Math Lab, 2(4, N = 781) = 6.02, p = .049.
Users rated tutorials as ―important to their achievement‖ more often than any other
resources. Low achieving users were even more likely than their middle and high
achieving counterparts to cite tutorials as important to their achievement when compared
to other resources (Table 14).
Figure 8. Percent reporting feature as important to their course achievement.
0%
5%
10%
15%
20%
25%
30%
35%
40%

75
Table 14 Low Achievers Only: Course Resources Reported As Important to Achievement: Count
(Percent)
Attribute
Usersa
Non-Users
Control
Completed end-of-course survey
31
23
70
Lecture
14 (45.2%)
14 (60.1%)
46 (65.7%)
Course notes provided by instructor
0
0
0
Digital Tutors
19 (61.3%)
Math Assistance Center (Math Lab)
3 (9.7%)
3 (13.0%)
6 (8.6%)
Office Hours
4 (12.9%)
3 (13.0%)
12 (26.1%)
Course textbook
15 (48.4%)
14 (60.9%)
33 (47.1%)
Course website resources
1 (3.2%)
1 (4.3%)
3 (4.3%)
a Opened two or more tutorials during term.
Only 90 (22.7%) of the 396 control students and 32 (8.3%) of the 385 intervention
students who completed the end-of-the-course survey reported using the Math Lab. Of
the students completing the end-of-the-course survey, 111 (56.6%) reported using Digital
Tutors. Of those who reported visiting the Math Lab, 49.2% reported it was important to
their course achievement. Of those who reported using the tutorials, 56.5% indicated that
they were important to their achievement. Among the low achieving students present
during the end-of-the-course survey, 17 reported attending the Math Lab and 12 (70.6%)
reported it as important to their achievement. Among the low achieving students present
during the end-of-the-course survey, 24 reported using the tutorials and 21 (87.5%)
reported them as important to their achievement. Total Math Lab visits in Spring 2009

76
were 702 (data on number of visits per student were not available), down from an average
of 887 in the four prior spring terms, even though course enrollment was up 8%.
Discussion
Drop rates and grades did not differ between intervention sections and control
sections, and average exam scores were slightly (0.008 points per view) lower for
intervention sections (users and non-users) compared to control sections, a difference
which is too small to have any practical significance. If tutorial use led to a clear learning
advantage, the users in the intervention sections should have increased the average exam
scores enough to outperform the control sections. While tutorial use was correlated with
higher exam scores for low achievers, the average four-point advantage was too small
and the low achievers too few to pull up the overall average of intervention students
when compared to control sections. There are several potential reasons for the weak
results.
The non-detectable difference between drop rates and grades for intervention and
control sections could be due to the low level of awareness of the resource. A large
portion of the intervention sections (42.5%) did not view a single tutor ial file. In the
prior study, only 18.3% of the students did not view any tutorials. Attendance during the
demonstration of the tutorials was only 79% of the enrolled intervention students. Unlike
the prior study where the instructor regularly demonstrated how each tutorial connected
to course materials, only two of the statistics instructors opened a tutorial (both
previewed a single topic), so they had little or no knowledge of how the tutorials
connected with class lectures and exams.

77
The intervention classes may not have outperformed the control sections because
students used too little extra instruction. Users on average opened 10.49 tutorials,
equivalent to about 30 minutes of extra lecture. In the prior study, where there was a low
learning effect for all users, not just low achievers, the average user viewed 31.58 files.
The low average number of views may also have been a function of the smaller set of
tutorials. The prior study contained 27 basic topics, while this study contained 15 basic
topics. The extra instruction was important to students according to the survey responses
but it may have been just too little to boost overall exam scores with the exception of a
small group of failing students.
Another possible reason for the low usage was the relatively high first exam
grades. Participation was higher at the start of the semester and then dropped
significantly after the first exam, following the fourth chapter. The drop off could have
resulted from students reaching their grade goals early in the semester, which diminished
students’ motivation to learn more (Hsieh, et al. , 2007). The average exam grades in this
study were a full letter grade higher than in the prior study. It is unlikely that the drop off
was due to low usefulness, because tutorials were cited on student surveys as ―important
to course achievement‖ more often than any other course resource.
The low use of tutorials may have resulted from topics that were too easy and
from advanced tutorials that were not appealing. Several of the basic tutorials were only
visited a few times, perhaps indicating that students did not need help with those topics.
Use of the advanced files, a series of challenge problems on the topics in the basic
tutorials, was very low. It is not clear whether students would have preferred, and
therefore used, additional lectures on different topics rather than harder problems on the

78
existing set of topics. The low use of advanced tutorials may have been caused by lack of
interest in working challenge problems versus the listen-to-lecture style of the basic
tutorials.
Participation rates were likely just too low to obtain a measurable effect for the
intervention students. The participation rate in the prior study (71%) was much higher
than this study (46%). The higher participation rate in the prior implementation could
have been due to instructor encouragement of tutorial use but also student maturity. In
the current study, users had earned more college credit hours than both non-users and
control students, indicating that experienced students may be more likely to use
supplemental resources. Because elementary statistics is a pre-requisite course for
sophomore courses, the accounting students in the prior study were more experienced
than the current sample. Lower participation in this study versus the prior one may also
have been a function of the topics available. A seasoned faculty member created the
accounting tutorials, but the statistics tutorials were created by a designer with no
experience teaching the course. The selection of topics in the prior study likely
benefitted from the author’s career wisdom in accounting.
Data showing no difference between intervention and control, while at the same
time showing users outperforming both non-users and control students, illustrates a
common methodological flaw. Studies comparing participants to non-participants and
claiming the comparison demonstrates the effectiveness of a program on retention and
other academic outcomes (Congo & Schoeps, 1993; D. C. Martin & Blanc, 2001) , or
studies comparing participants to control students and making similar claims
(Commander & Stratton, 1996; Peled & Kim, 1996; Topping, 1996) , are not sophisticated

79
enough to make those claims (McCarthy & Smuts, 1997). Participation in supplemental
instruction may be a function of level of academic persistence (Robbins, Allen, Casillias,
& Peterson, 2006) or other tendencies that lead to positive course results. These
tendencies, such as propensity to attend class, ability to recognize the potential value of
extra instruction, interest in the topic, self-regulated habits, motivation to succeed, and so
forth, make participants looks stronger than non-participants and control students, but not
as a function of the resource provided to participants (McCarthy & Smuts, 1997). The
current study illustrates the classic error that McCarthy and Smuts described.
While the drop rates and exam averages for intervention students were on par
with control sections, the study did reveal that this resource could be important for low
achievers. Even though at-risk students do not self-select into supplemental instruction at
high rates when the commitment required is high (R. Blanc, et al., 1983; Karabenick &
Knapp, 1988; Kenney & Kallison, 1994), forty-five percent of low achievers who
finished the course used the tutorials, suggesting that low achievers may be amenable to
convenient extra instruction. Low-achieving users were more willing to try course exams
before dropping than their non-user and control counterparts. Low achievers reported
tutorials as important to their achievement more often than their higher-achieving
classmates. Therefore, if the participation levels and number of views can be increased
for low achievers, course retention may improve.
One question this study addressed was whether students who were trying to
maximize their grade would use advanced tutorials. Use of the advanced tutorials was
much lower than that of the basic set. Oddly enough, use of the advanced tutorials was
even across achievement levels, even though more of the low achievers reported that they

80
studied only enough to reach a grade goal, including just pass, and then moved to other
priorities (satisficers). The lack of correlation between those reporting themselves as a
maximizer (working for the best grade possible), and those using advanced tutorials,
confirms the literature that reported goal attitudes and actual goal-oriented behavior differ
(White, 2002), but also hints that advanced tutorials were not an attractive resource for
maximizers.
The survey data at the start of the term showed that students slightly disagreed
that they were good at typical math tasks (math self-concept) and were slightly
unconfident in their statistics ability (statistics self-efficacy). Higher achievers started
and ended with more confidence, in both general math self-concept and topic specific
statistical self-efficacy, which confirms the literature that confidence is related to
competence (Gist, et al. , 1989; Hsieh, et al. , 2007; Meece, et al., 1990; Pajares & Miller,
1994; Siegel, et al. , 1985). Tutorial use was associated with a practically insignificant
decrease in math self-concept, but was not associated with a change in task specific
statistical confidence. The literature suggests that low and middle achievers often need
help with calibrating their true math ability, and the tutorials may have improved the
calibration of comprehension in small ways (Pajares, 1996). The increase in topic
specific confidence for users was on par with their classmates (and therefore had no
tutorial effect). Given the average exam grade was 77.4%, most students who completed
the course likely felt more confident at the end of the semester in course specific tasks,
regardless of what resources they used.
Students who used the tutorials ranked them higher than other course resources on
the course survey. This confirms prior work showing that college students prefer video

81
over text-based resources (Choi & Johnson, 2007) as well as research indicating that
modern students prefer to interact with computer resources versus face-to-face options
(McGuire, 2006). Student enthusiasm for the resource may reflect a benefit to student
well-being rather than higher exam scores (Fries, Schmid, Dietz, & Hofer, 2005). That
is, perhaps users spend less time studying than their counterparts in the control group,
who achieved at the same level.
Users ranked the 24/7 availability of the tutorials most often on a survey of
important features confirming that convenience is important to participants (McGuire,
2006). Users also reported that clarity (―clear,‖ ―better instruction than the book‖), and
efficiency (―quick way to learn‖) were important. The themes of convenience and
efficiency confirm that students value resources that reduce the time investment needed
to achieve their grade goals (Fries, et al., 2005). The surprise in this ranking of important
features was the relatively low rank of ―short length‖ (fifth out of 10 qualities). Isolating
just the low achievers, short length was seventh out of 10 features, lower even than
middle and high achievers, with only 9 of the 121 (7.4%) who completed the end-of-the-
course survey indicating that short length was important to them.
Only 18 (< 1%) of users reported that the tutorials were motivating. Students
may have already had a reasonable level of motivation by the time they logged on to
view. However, from the student’s persepctive , the tutorials’ primary value was
developing the needed subject mastery quickly and conveniently, not giving them
compelling reasons to move to another tutorial or work harder on course materials.
The competing tutoring resource for the control students was the Math Lab,
staffed with graduate students 10 hours a day, Monday – Thursday. The reported Math

82
Lab participation rates for those who completed an end-of-the-semester survey were on
par with typical undergraduate supplemental instruction, but still well below the tutorial
participation rates. The total visits to the Math Lab during Spring 2009 were 79% of
prior spring term levels, even though course enrollment was growing, a sign that on-line
tutorials diverted students away from the Math Lab, and further confirmation that
students prefer to interact with computers (McGuire, 2006).
Limitations and Areas for Further Work
One flaw in this work was that the surveys were duplicated exactly as found in the
prior studies, and that resulted in the math self-concept scale being coded with one as
most confident, and the statistical self-efficacy scale with six as the most confident. This
was an administrative detail overlooked during des ign. Since students filled out the
surveys on consecutive pages, some students may have assumed the scales were identical.
Manual review of surveys indicated that two or three students in each section were
extremely confident and extremely unconfident between the two instruments, suggesting
that they may not have noticed the reverse coding.
While this work asked students if they had a prior course in statistics, it did not
conduct a pre-test of statistics knowledge. In addition, the measures of learning differed
across all 21 instructors. Using a pre-test and departmental-wide exams (to use as post-
tests) would have strengthened the study.
This work defined use as number of files opened. After the short lesson, the
tutorials asked students to freeze the frame and attempt the problems before reviewing
the answers. Students who worked the sample problems before viewing the solution

83
spent much more time working the tutorials than those who just viewed the short lesson.
Time spent viewing tutorials might be a better measure in future studies.
Participation was down considerably from the prior accounting study. It is not
clear if participation rates were lower due to better exam scores (less need for extra help),
differences in instructor coaching, fewer tutorials topics available , or all of these. Lack
of information from instructors concerning how the tutorials connected with course topics
or how they might help students prepare for exams may have diminished student
awareness of, or interest in, the resource. Future work might include more topics and
some sections where instructors alerted students about the resource. Other studies might
track participation in more difficult courses (with lower grades) where the need for extra
instruction is higher.
Although short length was considered an important design feature of the tutorials,
even low-achieving students did not cite length as an important feature. Future work
might investigate how participation and learning changes with longer tutorials.
The literature suggests that mastery goals lead to better achievement than
performance goals (Shim, Ryan, & Anderson, 2008). Separating users with differential
goals may reveal if achievement is an interaction of tutorial use with academic goals.
In an attempt to please the researcher, students may have reported using resources
they never used. Eleven students reported using the tutorials on the survey when in fact
they had not opened a file. There was no way to verify if students reporting visiting the
Math Lab actually made those visits. Future work in which the tutorial author is not the
principal investigator may reduce this effect.

84
Studies of supplemental instruction find that students who participate have higher
re-enrollment and graduation rates than non-participants (R. Blanc, et al., 1983; Congo &
Schoeps, 1993). In addition, students who set their own goals improve their goal-setting
ability (Hannafin, 2001). Future work might track users and non-users to see if the
experience of self-regulated learning in a freshman course (self-guided completion of a
set of tutorials that were not required) could demonstrate for students how many little
steps accumulate to success.
Conclusion
Because the tutorial implementation did not improve the performance of
intervention sections compared to control sections, it failed to replicate the prior study.
While users outperformed non-users within the intervention sections and the average
students in control sections, this could have been due to academic habits of those self-
selecting to use tutorials, rather than the tutorial content. The drop rates and exam scores
in the intervention sections did not outperform control sections, likely because
participation and use levels were just too low. Although tutorial use was associated with
higher average exam scores for low achievers, the learning effect from tutorial use was
small, and impacted too few of the participants to help intervention sections outperform
the control sections.
Given that the users only viewed 10 tutorials on average, about 30 minutes of
extra instruction, the lack of effect is no surprise. What is not clear is whether a larger
inventory of tutorials, instructor encouragement, or lower exam grades would have
increased participation and use levels.

85
In spite of the weak result, the study did reveal that low achievers will use extra
resources. Remarkably, low achievers used the tutorials as frequently as the higher
achievers, even without course credit for the effort. At-risk students rated tutorials higher
in importance than any other course resources and higher than their classmates, likely
reflecting the low achievers’ heavier reliance on the convenient tutorials.
This work confirmed the most important feature of the tutorials to users:
convenience (24/7 Internet access). After convenience, the most important feature of the
tutorials was the clear, concise instruction. Short length was not as attractive as was
thought during initial design, and users may have spent more time on topics if the
tutorials were longer.
A relatively modest resource, 21 ultra-short tutorials, was not enough to improve
course outcomes. From the student’s point of view, however, the tutorials were
important to their achievement, perhaps by permitting them to meet their learning goals
quicker (Fries, et al., 2005), rather than boosting their achievement above the ir
counterparts in other sections. In courses with a larger set of tutorials, where instructors
can encourage more participation, and where exam scores are lower so the need is
greater, an on-line tutorial set designed for the at-risk population may be a great low
maintenance investment in the battle to improve campus retention.

86
References Ashcraft, M. H., & Krause, J. A. (2007). Working memory, math performance, and math
anxiety. Psychonomic Bulletin & Review, 14(2), 243-248.
Ayres, P. (2006). Impact of reducing intrinsic cognitive load on learning in a
mathematical domain. Applied Cognitive Psychology, 20, 298-298.
Bandura, A. (1986). Social foundations of thought and action: A social cognitive theory.
Englewood Cliffs, NJ: Prentice Hall.
Bandura, A., Barbaranelli, C., Caprara, G. V., & Pastorelli, C. (1996). Multifaceted
impact of self-efficacy beliefs on academic functioning. Child Development, 67,
1206-1222.
Bates, R., & Khasawneh, S. (2007). Self-efficacy and college students' perceptions and
use of online learning systems. Computers in human behavior, 23, 15-191.
Beal, C. R., Qu, L., & Lee, H. (2008). Mathematics motivation and achievement as
predictors of high school students' guessing and help-seeking with instructional
software. Journal of Computer Assisted Learning, 24 , 507-514.
Benson, J. (1989). Structural components of statistical test anxiety in adults: An
exploratory model. Journal of Experimental Education, 57(3), 247-261.
Blanc, R., DeBuhr, L. E., & Martin, D. C. (1983). Breaking the attrition cycle: The
effects of supplemental instruction on undergraduate performance and attrition.
Journal of Higher Education, 54(1), 80-90.

87
Boekaerts, M. (1997). Capacity, inclination, and sensitivity for mathematics. Anxiety,
Stress and Coping, 10, 5-33.
Bueschel, A. C. (2008). Listening to students about learning: The Carnegie Foundation
for the Advancement of Teaching.
Choi, H. J., & Johnson, S. D. (2007). The effect of problem-based video instruction on
learning satisfaction, comprehension and retention in college courses. British
Journal of Educational Technology, 38(5), 885-895.
Commander, N. E., & Stratton, C. B. (1996). A learning assistance model for expanding
academic support. Journal of Developmental Education, 20(2).
Congo, D. H., & Schoeps, N. (1993). Does supplemental instruction really work and what
is it anyway? Studies in Higher Education, 18(2).
Cooper, S. E., & Robinson, D. A. (1991). The relationship of mathematics self-efficacy
beliefs to mathematics anxiety and performance. Measurement and evaluation in
counseling and development, 24(1), 4-11.
Eccles, J. S., & Midgley, C. (1990). Changes in academic motivation and self-perception
during early adolescence. In R. Montemayor, G. R. Adams & T. P. Gullotta
(Eds.), From childhood to adolescence (pp. 134-155). Thousand Oaks, CA: Sage
Publications, Inc.
Finney, S. J., & Schraw, G. (2003). Self-efficacy beliefs in college statistics course.
Contemporary Educational Psychology, 28 , 161-186.

88
Frenzel, A. C., Pekrun, R., & Goetz, T. (2007). Girls and mathematics - A "hopeless"
issue: A control-value approach to gender differences in emotions towards
mathematics. European Journal of Psychology of Education, XXII(4), 497-514.
Fries, S., Schmid, S., Dietz, F., & Hofer, M. (2005). Conflicting values and their impact
on learning. European Journal of Psychology of Education, XX(3), 259-273.
Gist, M. E., Schwoerer, C., & Rosen, B. (1989). Effects of alternative training methods
on self-efficacy and performance in computer software training. Journal of
Applied Psychology, 74(6), 884-891.
Gottfried, A. E., Marcoulides, G. A., Gottfried, A. W., Oliver, P. H., & Guerin, D. W.
(2007). Multivariate latent change modeling of developmental decline in
academic intrinsic math motivation and achievement: Childhood through
adolescence. International Journal of Behavioral Development, 31(4), 317-327.
Greene, B. A., DeBacker, T. K., Ravindran, B., & Krows, A. J. (1999). Goals, values and
beliefs as predictors of achievement and effort in high school mathematics
classes. Sex Roles, 40(5/6), 421-458.
Gutman, L. M. (2006). How student and parent goal orientations and classroom goal
structures influence the math achievement of African Americans during the high
school transition. Contemporary Educational Psychology, 31 , 44-63.
Hackett, G. (1985). Role of mathematics self-efficacy in the choice of math-related
majors of college woman and men: A path analysis. Journal of Counseling
Psychology, 32(1), 47-56.

89
Hannafin, M. J. (2001). Effects of teacher and student goal setting and evaluations on
mathematics achievement and student attitudes. Journal of Educational Research,
74(5), 321-326.
Hembree, R. (1990). The nature, effects, and relief of mathematics anxiety. Journal for
Research in Mathematics Education, 21(1), 33-46.
Hemenway, M. K., Straits, W. J., Wilke, R. R., & Hufnagel, B. (2002). Educational
research in an introductory astronomy course. Innovative Higher Education,
26(4), 271-280.
Hox, J. (2002). Multilevel Analysis. Mahwah, New Jersey: Erlbaum.
Hsieh, P.-H., Sullican, J. R., & Guerra, N. S. (2007). A closer look at college students:
self-efficacy and goal orientation. Journal of Advanced Academics, 18, 454-476.
Huang, T.-H., Liu, Y.-C., & Shiu, C.-Y. (2008). Construction of an online learning
system for decimal numbers through the use of cognitive conflict strategy.
Computers & Education, 50, 61-76.
Karabenick, S. A., & Knapp, J. R. (1988). Help Seeking and the Need for Academic
Assistance. Journal of Educational Psychology, 80(3), 406-408.
Kenney, P. A., & Kallison, J. M. J. (1994). Research studies on the effectiveness of
supplemental instruction in mathematics. New Directions for Teaching &
Learning, 60, 75-82.
Kim, Y., Baylor, A. L., & Group, P. (2006). Pedagogical agents as learning companions:
The role of agent competency and type of interaction. Journal of Computer
Assisted Learning, 54(3), 223-243.

90
Korner, C. (2005). Concepts and misconceptions in comprehension of hierarchical
graphs. Learning and Instruction, 15, 281-296.
Koutsoulis, M. K., & Campbell, J. R. (2001). Family processes affect students'
motivation, science and math achievement in Cypriot high schools. Structural
Equation Modeling, 8(1), 108-127.
Kulik, C.-L. C., & Kulik, J. A. (1991). Effectiveness of computer-based instruction: An
updated analysis. Computers in human behavior, 7, 75-94.
Linnenbrink, E. A., & Pintrich, P. R. (2002). Motivation as an enabler for academic
success. School Psychology Review, 31(3), 313-327.
Linnenbrink, E. A., & Pintrich, P. R. (2003). The role of self-efficacy beliefs in student
engagement and learning in the classroom. Reading & Writing Quarterly, 19,
119-137.
Marsh, H. W., Trautwein, U., Ludtke, O., Koller, O., & Baumert, J. (2005). Academic
self-concept, interest, grades, and standardized test scores: Reciprocal effects
models of causal ordering. Child Development, 76(2), 397-416.
Martin, D. C., & Blanc, R. (2001). Video-Based Supplemental Instruction. Journal of
Developmental Education, 24(3).
Matsui, T., Matsui, K., & Ohnishi, R. (1990). Mechanism underlying math self-efficacy
learning and college students. Journal of Vocational Behavior, 37, 225-238.
Mayer, R. E., Mathias, A., & Wetzell, K. (2002). Fostering understanding of multimedia
messages through pre-training: Evidence for a two-stage theory of mental model
construction. Journal of Experimental Psychology: Applied, 8(3), 147-154.

91
McCarthy, A., & Smuts, B. (1997). Assessing the effectiveness of supplemental
instruction: A critique and a case study. Studies in Higher Education, 22(2).
McGuire, S. Y. (2006). The impact of supplemental instruction on teaching students
"how" to learn. New Directions for teaching and learning (Vol. 106): John Wiley
and Sons, Inc.
Meece, J. L., Wigfield, A., & Eccles, J. S. (1990). Predictors of math anxiety and its
influence on young adolescents' course enrollment intentions and performance in
mathematics. Journal of Educational Psychology, 82(1), 60-70.
Middleton, M. J., & Midgley, C. (2002). Beyond motivation: Middle school students'
perceptions of press for understanding in math. Contemporary Educational
Psychology, 27, 373-391.
Miller, S. P., & Mercer, C. D. (1997). Educational aspects of mathematics disabilities.
Journal of Learning Disabilities, 30(1), 47-56.
Moore, R., & LeDee, O. (2006). Supplemental instruction and the performance of
developmental education students in an introductory biology course. Journal of
College Reading and Learning, 36(2), 9-20.
Muller, D. A., Bewer, J., Sharma, M. D., & Reimann, P. (2007). Saying the wrong thing:
Improving learning with multimedia by including misconceptions. Journal of
Computer Assisted Learning, 24, 144-155.
Multon, K. D., Brown, S. D., & Lent, R. W. (1991). Relation of self-efficacy beliefs to
academic outcomes: A meta-analytic investigation. Journal of Counseling
Psychology, 38(1), 30-38.

92
Pajares, F. (1996). Self-efficacy beliefs and mathematical problem-solving of gifted
students. Contemporary Educational Psychology, 21 , 325-344.
Pajares, F., & Kranzler, J. (1995). Self-efficacy beliefs and general mental ability in
mathematical problem-solving. Contemporary Educational Psychology, 20 , 426-
443.
Pajares, F., & Miller, D. M. (1994). Role of Self-Efficacy and Self-Concept Beliefs in
Mathematical Problem Solving: A Path Analysis. Journal of Educational
Psychology, 86(2), 193-203.
Pajares, F., & Miller, D. M. (1995). Mathematics self-efficacy and mathematics
performance: The need for specificity of assessment. Journal of Counseling
Psychology, 42(2), 190-198.
Peled, O. N., & Kim, A. C. (1996). Evaluation of supplemental instruction at the college
level. Unpublished manuscript.
Pintrich, P. R., & Schunk, D. H. (1996). Motivation in education: Theory, research and
applications. Englewood Cliffs, NJ: Prentice Hall Merrill.
Randhawa, B. S., Beamer, J. E., & Lundberg, I. (1993). Role of mathematics self-efficacy
in the structural model of mathematics achievement. Journal of Educational
Psychology, 83(1), 41-48.
Raudenbush, S. W., & Bryk, A. S. (2002). Hierarchical Linear Models: Applications and
Data Analysis Methods. Thousand Oaks, CA: Sage.
Robbins, S. B., Allen, J., Casillias, A., & Peterson, C. H. (2006). Unraveling the
differential effects of motivational and skills, social and self-management

93
measures from traditional predictors of college outcomes. Journal of Educational
Psychology, 98(3), 598-616.
Sargent, C. S. (2009). Improving retention for principles of accounting students: Ultra-
short digital tutorials designed to motivate effort and improve performance.
Georgia State University.
Shim, S. S., Ryan, A. M., & Anderson, C. J. (2008). Achievement goals and achievement
during early adolescence: Examining time-varying predictor and outcome
variables in growth-curve analysis. Journal of Educational Psychology, 100(3),
655-671.
Siegel, R. G., Galassi, J. P., & Ware, W. B. (1985). A comparison of two models for
predicting mathematics performance: Social learning versus math aptitude-
anxiety. Journal of Counseling Psychology, 32(4), 531-538.
Siegler, R. S. (2003). Implications of cognitive science research for mathematics
education. In J. Kilpatrick, W. B. Martin & D. E. Schifter (Eds.), A Research
Companion to Principles and Standards for School Mathematics (pp. 219-233).
Reston, VA: National Council of Teachers of Mathematics.
Simpson, M. L., Hynd, C. R., Nist, s. L., & Burrell, K. I. (1997). College academic
assistance programs and practices. Educational Psychology Review, 9(1), 39-87.
Singer, J. D., & Willett, J. B. (2003). Applied Longitudinal Data Analysis. New York:
Oxford University Press.
Smith, J. P. I., diSessa, A. A., & Roschelle, J. (1993). Misconceptions reconceived: A
constructivist analysis of knowledge in transition. The Journal of the Learning
Sciences, 3(2), 115-163.

94
Spence, D. J., & Usher, E. L. (2007). Engagement with mathematics courseware in
traditional and online remedial learning environments: Relationship to self-
efficacy and achievement. Journal of Educational Computer Research, 37(3),
267-288.
Steinmayr, R., & Spinath, B. (2008). Sex differences in school achievement: What are
the roles of personality and achievement motivation? European Journal of
Personality, 22, 185-209.
Sweller, J., & Chandler, P. (1994). Why some material is difficult to learn. Cognition and
Instruction, 12(3), 185-233.
Topping, A. J. (1996). The effectiveness of peer tutoring in further and higher education:
A typology and review of the literature. Higher Education, 32, 321-345.
Whang, P. A., & Hancock, G. R. (1994). Motivation and mathematics achievement:
Comparisons between Asian-American and non-Asian students. Contemporary
Educational Psychology, 19, 302-322.
White, F. (2002). A cognitive-behavioural measure of student goal setting in a tertiary
educational context. Educational Psychology, 22(3), 285-304.
Wigfield, A., Eccles, J. S., Schiefele, U., Roeser, R. W., & Deavis-Kean, P. (2006).
Development of achievement motivation. In N. Eisenberg, W. Damon & R. M.
Lerner (Eds.), Handbook of Child Psychology (pp. 933-1002). Hoboken, NJ: John
Wiley & Sons, Inc.
Yates, G. C. R. (2005). "How obvious": Personal reflections on the database of
educational psychology and effective teaching research. Educational Psychology
25(6), 681-700.

95
Zimmerman, B. J., & Martinez-Pons, M. (1990). Student differences in self-regulated
learning: Relating grade, sex and giftedness to self-efficacy and strategy use.
Journal of Educational Psychology, 82(1), 51-59.

96
APPENDIXES
APPENDIX A
Tutorial Sample Worked Out Problems
Topic Example of problem worked in the tutorial
Basic probability rules
North Carolina State University posts the grades for their courses online. Students in the management 302
course in Spring 2005 semester received 45% A’s, 30% B’s, 20% C’s and the rest D’s. If you selected a student at random from this course, what is the probability they got a B or better?
Using a random number table to select a sample
Every year Fortune Magazine lists America’s Largest
Corporations (The Fortune 500). You need to select five large firms for a marketing project and have decided to pick those five randomly from the ―Fortune 500‖. Use the random number table to select the firms
to study. Use line 111 from the table.
Using standard normal
distribution (z-scores) to estimate probabilities
A milling machine needs to shave metal to narrow
specifications. A well maintained machine should have a cut width of 0.875 inches and no more than a standard deviation of 0.012 inch. If your machine is well maintained, what is the probability of a cut between
0.82 and 0.89 inches?
Constructing confidence intervals with known population variance
128 customers sampled had an average grocery checkout total of $65. The standard deviation for grocery check outs for all customers is $12. Give a 98% confidence interval for the mean level check out
totals for all customers.
Distinguishing between observational and
experimental designs
Studies found that different brands of gasoline do not
change miles per gallon (MPG) results. A study gathered a sample of Honda Civics all getting 30 MPG and collected data on the gasoline brand preferred by the owner (driver), the typical proportion of
city/highway driving, and history of speeding tickets. Is this an observational or experimental study?

97
APPENDIX B
Tutorial Topics
1. Describing distributions 2. Basics of normal distributions (including using 68-95-99.7 rule) 3. Computing and using z-scores
4. Regression analysis and correlation 5. Using a random number table 6. Observational vs. experimental studies (response and explanatory variables) 7. Selecting simple random samples
8. Attributes of good experimental design 9. Rules of probability 10. Central Limit Theorem 11. Confidence intervals with known population variance – z score
12. Hypothesis testing – setting up the null, one and two-tailed tests 13. Hypothesis testing – z scores 14. Hypothesis testing – t tests 15. Confidence intervals with unknown population variance – t tests